Article

Analysing Causes of Carbon Density Dynamics in Subtropical Forests

1
State Key Laboratory of Resources and Environmental Information System, Institute of Geographic Sciences and Natural Resources Research, Chinese Academy of Sciences, Beijing 100101, China
2
College of Resources and Environment, University of Chinese Academy of Sciences, Beijing 101499, China
3
College of Forestry, Beijing Forestry University, Beijing 100083, China
4
Beijing Municipal Engineering Research Institute, Beijing 100037, China
5
State Key Laboratory of Remote Sensing and Digital Earth, Aerospace Information Research Institute, Chinese Academy of Sciences, Beijing 100101, China
6
Qilu Aerospace Information Institute, Jinan 250101, China
*
Author to whom correspondence should be addressed.
Forests 2025, 16(9), 1496; https://doi.org/10.3390/f16091496
Submission received: 30 July 2025 / Revised: 17 September 2025 / Accepted: 19 September 2025 / Published: 21 September 2025
(This article belongs to the Special Issue Forest Inventory: The Monitoring of Biomass and Carbon Stocks)

Abstract

Understanding how biotic and environmental drivers jointly shape forest carbon dynamics over time is essential for climate-adapted management of subtropical forests. We investigated the long-term interactions between biotic factors, environmental factors, and forest carbon dynamics in the subtropical forests of Jiangxi Province, China, over the period 1989–2019. The High Accuracy Surface Modelling (HASM) multi-source data fusion method integrates ground observation points with area-wide data from remote sensing and existing datasets to simulate the spatial distribution of forest carbon density across the entire study area. In Zixi, forest carbon density increased most rapidly between 1989 and 2009, after which the rate slowed as forest stands matured. Structural Equation Modelling (SEM) disentangled direct and indirect effects of drivers, and identified species richness and community-weighted functional traits as key positive drivers of aboveground carbon density. The influence of environmental factors reversed over the study period. Under ongoing global warming, the combined effects of altitude, temperature, and precipitation shifted from suppressing to reinforcing carbon accumulation in later years, increasingly operating through pathways mediated by functional traits. These findings enhance our understanding of carbon dynamics in subtropical forests and underline the importance of preserving species richness, especially in subtropical mountain forest. This study provides valuable insights for adaptive forest management and climate change mitigation strategies, aiming to improve ecosystem resilience and sustain carbon sequestration efforts in the face of ongoing global warming.

1. Introduction

Forests are significant reservoirs of carbon and play a major role in global climatic regulation, stability in ecosystems, and preservation of biodiversity [1,2,3]. The capacity of forest carbon stocks to mitigate climate change has long been recognized, as these stocks mediate atmospheric CO2 concentrations and buffer against global warming [3,4,5]. However, forest carbon storage across different landscapes is shaped by intricate interactions between biotic factors (e.g., species diversity, functional traits) and environmental drivers (e.g., climate, topography), as well as anthropogenic disturbances [3,5,6,7]. Despite substantial progress in understanding these drivers, the long-term, multi-scale interactions of these controls in highly biologically complex landscapes—such as subtropical forests—remain insufficiently explored, creating critical knowledge gaps for accurate carbon cycle modelling and climate change mitigation.
Species diversity-ecosystem functioning has been the pillar of research in ecology since the 1970s [8,9]. Empirical evidence supports that greater diversity in the number of species enhances the productivity and stability of ecosystems through processes such as efficiency in resource use and complementarity of niches [10,11]. Recent studies have shown that tree species richness is positively associated with biomass production and carbon storage in soils in forest ecosystems [12,13,14]. For instance, Song et al. (2025) used data from 967 global sites and found that tree species richness significantly enhances forest ecosystem photosynthesis, thereby increasing carbon fixation capacity [15]. In addition, functional diversity—often quantified via Community-Weighted Mean (CWM) traits—provides critical insights into carbon dynamics. Specifically, functional traits like wood density and specific leaf area directly regulate resource acquisition, allocation, and litter decomposition, all of which modulate carbon storage potential [16,17,18]. Functional diversity is most closely related to forest biomass and carbon stocks by shaping resource use and allocation patterns [14]. However, there is still argument regarding the diversity-productivity association with differing findings based on the scope of study, forest type, and environment type [18,19]. For example, some studies report saturating or even negative diversity effects in high-productivity tropical forests [20], while others find persistent positive effects in temperate systems [21]. This poses the need for region-specific long-term studies to combine ecological data with new modelling methods.
Aside from species diversity and functional diversity, the environmental factors of the forest—climatic conditions and topography—further modulate forest carbon storage. Topography in particular influences carbon storage indirectly via influencing the associated microclimatic conditions and species composition [22]. For example, Bhardwaj et al. (2021) found in their study of forests in the northwestern Himalayas that ecosystem carbon density, vegetation biomass (especially above-ground biomass), and nutrient content were higher on north-facing slopes compared to south-facing slopes [23]. They attributed this to the cooler, moister microclimate and better water and nutrient retention conditions on the north slopes [23]. Similarly, Cheng et al. (2023) observed that variations in altitude, slope aspect, and topography in the forests of the Hengduan Mountains in China influenced the structure and composition of woody vegetation, which in turn affected aboveground biomass [24]. Climatic factors such as temperature and precipitation influence biomass partition and carbon dynamics directly by the evidence of studies carried out in Asian and beyond in the case of subtropical forests [7,25]. Additionally, Chen et al. (2020) further explained in their article the synergistic effects of precipitation and topography on vegetation growth, noting that the correlation between vegetation growth and precipitation was highest at elevations between 1000 and 2000 m [26]. However, this correlation significantly decreased above 2000 m [26]. This also indicates that, in the context of this study, environmental factors such as topography and climate should not be treated as isolated drivers of carbon storage; instead, their synergistic effects merit primary consideration when evaluating forest carbon dynamics.
Despite recent advances, gaps persist in the literature. Most studies have focused primarily on temperate or tropical forests [27,28], leaving subtropical forests—characterized by unique species richness, complex landscapes, and high ecological heterogeneity—underexplored. For example, Madrigal-González et al. (2020) analysed tree richness-abundance relationships across 23 global forest biomes and found that climate can reverse these relationships, with diversity effects dominating in productive environments and abundance effects in limiting conditions [28]. However, their study emphasized temperate and boreal systems [28]. Similarly, Dyola et al. (2022) identified species richness as a key driver of forest biomass in the tropical Congo Basin, but excluded subtropical systems from their analysis [29]. In subtropical forests, such as those in southeastern China, where carbon accumulation is influenced by stand structure (e.g., tree density, age) and climatic seasonality, the relationship between species diversity and carbon storage has rarely been quantified [26]. Although research on subtropical forests in China has generally focused on large-scale studies spanning the entire country, the ecologically significant subtropical forests of Jiangxi Province, characterized by its mountainous terrain, high vegetation cover, and rich species diversity [30], remain underexplored despite their importance. Furthermore, many studies isolate single factors or use simplified multi-factor models, limiting their ability to capture the cascading, indirect effects of biotic and environmental interactions [31,32]. For instance, Fang et al. (2007) provided gross estimates of forest carbon sinks but did not include detailed micro-scale ecological factor analyses [33]. Song et al. (2011) assessed the carbon sequestration capacity of bamboo forests without exploring mechanisms across various forest types [34]. These gaps highlight the need for long-term research that integrates both biotic and environmental factors, enabling a more comprehensive understanding of their dynamic impacts on forest carbon storage.
By addressing these gaps, the current study applies Structural Equation Modelling (SEM) to examine the complex multiscale interactions influencing carbon density of the forests in the biodiverse and mountainous subtropical forests of Jiangxi Province. SEM is a powerful tool for ecological research, as it quantifies both direct and indirect effects of multiple drivers while accounting for collinearity—an advantage over traditional regression approaches [35,36]. The present research thus captures both direct and indirect effects of biotic and environmental factors. SEM has already demonstrated its efficacy in ecological contexts, for instance in wetland ecosystems [36] and in global assessments of forest biodiversity and productivity [19]. More recently, it has been increasingly applied to explore causal pathways linking species diversity, climatic variability, and forest carbon processes across biomes. For example, SEM has been used to examine how multitrophic diversity mediates tree productivity in subtropical forests of China [37], how stand characteristics and precipitation fluctuations drive vegetation carbon accumulation in southeastern China [38], and how climate alters the richness–abundance relationship across global forests [28]. Despite these advances, applications focusing specifically on long-term dynamics of subtropical forest systems remain scarce. Unlike most previous studies, which emphasise broad spatial or short temporal scales, our work provides a unique long-term, fine-scale perspective by analysing 40 years of forest dynamics in Zixi County, Jiangxi—an area with minimal human disturbance and exceptional species richness.
In light of these gaps, this study adopts an innovative and comprehensive integrative framework to investigate forest carbon dynamics, addressing three core research questions: (1) How do species diversity (taxonomic and functional) and species richness independently and interactively affect aboveground carbon density? (2) What are the direct and indirect effects of topographic variables (altitude and slope) and climatic conditions (Mean Annual Temperature (MAT) and Mean Annual Precipitation (MAP)) on carbon density? (3) How do the effects of species diversity and richness on carbon density evolve over time? By focusing on the subtropical forests of Jiangxi—a region characterized by rich species diversity, complex topography, and minimal human disturbance—this study addresses significant gaps in the existing literature and provides actionable insights for forest management and carbon sequestration policies in ecologically similar regions.
The remainder of the paper is structured as follows: Section 2 details the study area, data collection procedures, and methodological approaches, including the use of High Accuracy Surface Modelling (HASM) and Structural Equation Modelling (SEM). Section 3 presents the results of spatial and temporal patterns in forest carbon density and the associated SEM analyses. Section 4 provides a critical discussion of the implications of biotic and environmental drivers, and finally, Section 5 concludes by summarising the main insights and highlighting their significance for subtropical forest conservation and carbon sequestration strategies.

2. Materials and Methods

2.1. Data Acquisition

This study was conducted in Zixi County, Fuzhou, Jiangxi Province, China (27°28′–27°55′ N, 116°46′–117°17′ E, Figure 1). The county encompasses an area of approximately 1521 km2, with a forest coverage rate of 87.06%. The region is characterized by its mountainous terrain, with the Wuyi Mountains extending from the northeast to the southwest. The topography exhibits higher altitudes in the southeast and lower altitudes in the northwest, resulting in a complex landscape where approximately 83.1% of the area is situated at altitudes exceeding 300 m. Zixi County experiences a typical subtropical monsoon climate, characterized by mild temperatures, abundant rainfall, and four seasons. Winters and summers are relatively prolonged, while spring and autumn are shorter in duration. The average annual temperature is approximately 16.9 °C, with a north-to-south temperature variation of about 1 °C attributable to the region’s diverse altitude. Annual precipitation averages 1929.9 mm, with 47% of this rainfall occurring between April and June. The region’s vegetation is notably lush and exhibits high species diversity. The predominant forest types include warm coniferous forest, warm coniferous mixed forest, evergreen broad-leaved forest, and bamboo forest. The main tree species identified in the area are Cunninghamia lanceolata, Pinus massoniana, Quercus spp., Castanopsis fargesii, and Schima superba.
The primary data source for this study consists of plot-based survey data obtained from the second-class forest resource inventory of Zixi County, conducted in the years 1989, 1999, 2009, and 2019. The entire sampling process was executed by personnel from the Forestry Bureau of Zixi County. The spatial distribution of the plots surveyed each year is shown in Figure 2, with the number of plots being 366, 426, 532, and 253, respectively, over these four years. More detailed statistical information about these plots is provided in Table S1 of Supplementary Document S1. Each surveyed sample plot is a square with an area of 800 m 2 ( 28.28   m   ×   28.28   m ). The locations of the plots were determined and marked using three reference trees situated at the southwest corner of each plot. During the data collection process, field investigators completed two primary forms for each plot: the “Environmental Factor Record Sheet” and “Tree Measurement Form”. The “Environmental Factor Record Sheet” records the following information: plot ID, longitude, latitude, plot type, property, land-use type, landform type, altitude, slope aspect, slope position, soil name, soil thickness, forest category, origin, dominant tree species, canopy closure, and age class. It should be noted that, according to the standards of the local Forestry Bureau, the item “forest category” refers to the functional classification of forests in the region, including timber forest, special-purpose forest, economic forest, protection forest, and bamboo forest. The item “origin” includes only two types: natural forest and planted forest. In this dataset, the attributes “forest category” and “age class” are determined based on the information corresponding to the dominant tree species. The “Tree Measurement Form” records specific details for each tree within the plot, including tree identification (ID), species, and Diameter at Breast Height (DBH). The DBH for all standing trees was measured uniformly at 1.3 m above the ground level. In accordance with the long-standing classification standards established by the local Forestry Bureau, different DBH thresholds were applied to trees and moso bamboo. Specifically, standing trees with DBH < 5 cm and moso bamboo with DBH < 8 cm were categorised as undersized and excluded from measurement. This approach reflects the field survey protocols and practical experience developed in the region since the 1970s, and has been consistently followed to ensure data comparability across successive inventory cycles.
Due to the spatial limitations of the sampling point data, which do not cover the entire study area, and the variations in the number and locations of sampling points across different years, we employed a machine learning method that integrates multi-source data—namely the High Accuracy Surface Modelling (HASM) multi-source data fusion method (described in Section 2.4). In using this method, in addition to the sampling point data, remote sensing data and model simulation results are also incorporated as input data to complete the trend surface fitting. All remote sensing data employed in this study were obtained from Google Earth Engine and include datasets from Landsat 5, Landsat 7, and the Shuttle Radar Topography Mission (SRTM). These datasets possess a spatial resolution of 90   m   ×   90   m . The Landsat data were utilized to derive annual maximum vegetation indices, including the Normalized Difference Vegetation Index (NDVI), Green Normalized Difference Vegetation Index (GNDVI), Plant Variety Index (PVI), and Enhanced Vegetation Index (EVI) for the four target years. In particular, the data were obtained from Landsat 5 in the years 1989, 1999, and 2009, and from Landsat 7 in the year 2019. SRTM data were utilized to produce the Digital Elevation Model (DEM), and to determine slope, aspect, and slope position in study area. The climate data we used (MAT and MAP) are derived from the Poyang Lake climate dataset for 1980–2020, generated by our co-author Yang et al. (2024) using meteorological station data [39]. Since the Zixi area is located within the broader Poyang Lake Basin, it is covered by this dataset. The specific methodology and data are described in their paper [39]. The dynamics of annual average temperature and precipitation in Zixi County based on this dataset is detailed in Section S1 of Supplementary Document.

2.2. Species Richness, Diversity Index, and Functional Diversity

Species diversity has two main aspects: richness, or also known as species density, based on the number of existing species, and evenness, or relative abundance and the range of dominance of the existing species [40,41]. A plethora of studies supported that scaling diversity index is capable of representing the evenness and richness aspects of diversity. The method is scientifically sound and may be applied at affordable cost [42,43,44]. Species richness has been considered by many as an ultimate and realistic measure of biodiversity because it accurately captures core aspects of the variability of the environment, in spite of the challenge of ignoring or not identifying and counting all the existing species in one’s area of interest [45]. A common measure of species richness is calculated by the number of existing species in one area that is usually measured by the use of a quadrat. A measure of species richness is calculated as follows:
S R = m A ,
where m represents the number of plant species in the plot and A denotes the area of the plot (ha).
The scaling diversity index is defined as follows [44]:
D = l n i = 1 m ( p i ) 1 2 2 ln e + A ,  
where m represents the number of plant species in the plot; A denotes the area of the plot (ha); p i signifies the proportion of individuals of the i -th species relative to the total number of individuals of all species in the plot; and e is a mathematical constant ( 2.71828 ). For our case, the area for each plot is always 800   m 2 = 0.08   h a , which is the size of all surveyed plot.
Functional traits are increasingly recognised as central to explaining forest ecosystem functioning. They provide insights into species interactions and the processes that regulate ecosystems in novel environments [46]. The CWM that is abundance-weighted mean value of a community is highly useful to measure the structural and functional diversity. This study applied the CWM of the DBH as an indicator of these factors of functional diversity, and these factors can be determined as follows:
C W M = i = 1 m T i × R A i ,
where T i represents the mean DBH of the i -th species and R A i denotes the relative abundance of the i -th species.

2.3. Method to Calculate Carbon Stocks

In this research, the Continuous Biomass Expansion Factor (CBEF) approach was employed in the estimation of the forest biomass in each sample plot. Carbon density was obtained by applying the carbon content coefficient to the biomass using the following equation:
W = B E F · V
B E F = a + b V
where W represents the forest biomass per unit area ( M g / h a ) ; V denotes the forest volume per unit area ( m 3 / h a ); B E F is the biomass expansion factor ( M g / m 3 ); and a ( M g / m 3 ) and b ( M g / h a ) are the parameters defined by tree species, as listed in Table 1, according to work from Fang et al. (2007) [33]. In our study, we used the “Single Tree Volume Table for the Fuhe Forest Area of Jiangxi Province” published by the Jiangxi Provincial Agricultural and Forestry Reclamation Survey and Design Institute in the “Common Forestry Survey Forms” to calculate the volume of each tree using the DBH, thus obtaining the V in the formula. Therefore, the carbon stock density of the forest tree canopy can be obtained as follows:
B C D = a V + b c c  
where B C D represents the forest biomass carbon density ( M g / h a ) and c c represents the carbon content coefficient. Estimations of a , b , and c c are summarized in Table 1.

2.4. Spatial Simulation of Forest Aboveground Carbon Density

To estimate the spatial distribution of forest carbon density within the case-study region for 1989, 1999, 2009, and 2019, the High Accuracy Surface Modelling (HASM) multi-source data-fusion approach [48] was utilized. Given that the sampling points do not spatially encompass the entire study area, remote sensing and topographic data were employed to conduct surface fitting, thereby enhancing the accuracy and reliability of the carbon density estimations. We selected the HASM multi-source data-fusion approach for the simulations for the following reasons: Empirical evidence indicates that extrinsic variables (e.g., satellite observations and outputs of spatial models) and intrinsic variables (e.g., ground-based observations and spatial sampling) constitute two distinct yet complementary sources of information for representing eco-environmental surfaces [49,50]. They provide different facets of the surface information, and neither alone can capture the full spatiotemporal dynamics of eco-environmental systems [49,50,51,52]. For issues pertinent to this study, experiments by Chiesi et al. (2011) show that integrating meteorological station observations, field survey data, flux-tower measurements, and satellite remote-sensing data improves the accuracy and stability of forest ecosystem carbon-stock modelling results [53]. Grounded in systems theory, optimal control theory and surface theory, HASM integrates in situ observations with remote-sensing data, overcoming the limitations of traditional methods in relation to data sparsity, multi-scale modelling and the simulation of non-linear processes [44,54,55]. It yields high-accuracy fitted surfaces of eco-environmental information and has been widely applied in digital elevation model construction, CO2 concentration data fusion, climate-change simulation analyses and forest carbon stock estimation [44,48,54,55,56].
If the surface of ecological environmental factors in a given region can be expressed as z = f ( x , y ) , then the mathematical expression of the main equation in HASM is:
m i n A B · z ( n + 1 ) d ( n ) q ( n ) s . t .         S 1 · z ( n + 1 ) = k 1 k 2 S 2 · z ( n + 1 ) k 3
where x , y is the geographical coordinates and f ( x , y ) is the value of the environmental element z at point x , y . As the finite difference approach was applied in constructing HASM, in this main equation, z ( n + 1 ) denotes the ( n + 1 ) -th iteration of the ecological environmental surface z . Matrices A and B are coefficient matrices, while vectors d ( n ) and q ( n ) represent the corresponding right-hand side terms, determined by the n-th iteration z ( n ) of the ecological environmental surface. Similarly, d ( 0 ) and q ( 0 ) are determined by the initial surface or so-called “driving field” z ( 0 ) . S 1 and k 1 denote the location matrix and observation vector for ground-based equality constraints, respectively, derived from ground-based observational data; S 2 denotes the inequality constraint location matrix; k 2 and k 3 are inequality constraint vectors derived from prior knowledge.
Based on the least squares method, the main equation of HASM can be reformulated as a matrix equation as:
W · z ( n + 1 ) = v ( n )
where W = A T B T λ S T A B λ S , v = A T B T λ S 1 T d ( n ) q ( n ) λ k 1 , coefficient λ is a nonzero real number, and vectors d , q , k are three vectors formed by real numbers. More theoretical details of HASM and the detailed formulations of matrices A , B , S 1 and their corresponding right-hand sides are provided in Supplementary Document Section S2. The key steps of constructing the main equation of HASM and obtaining the final surface result using sample point data and multi-source surface data can also be found in Supplementary Document Section S2 as well.
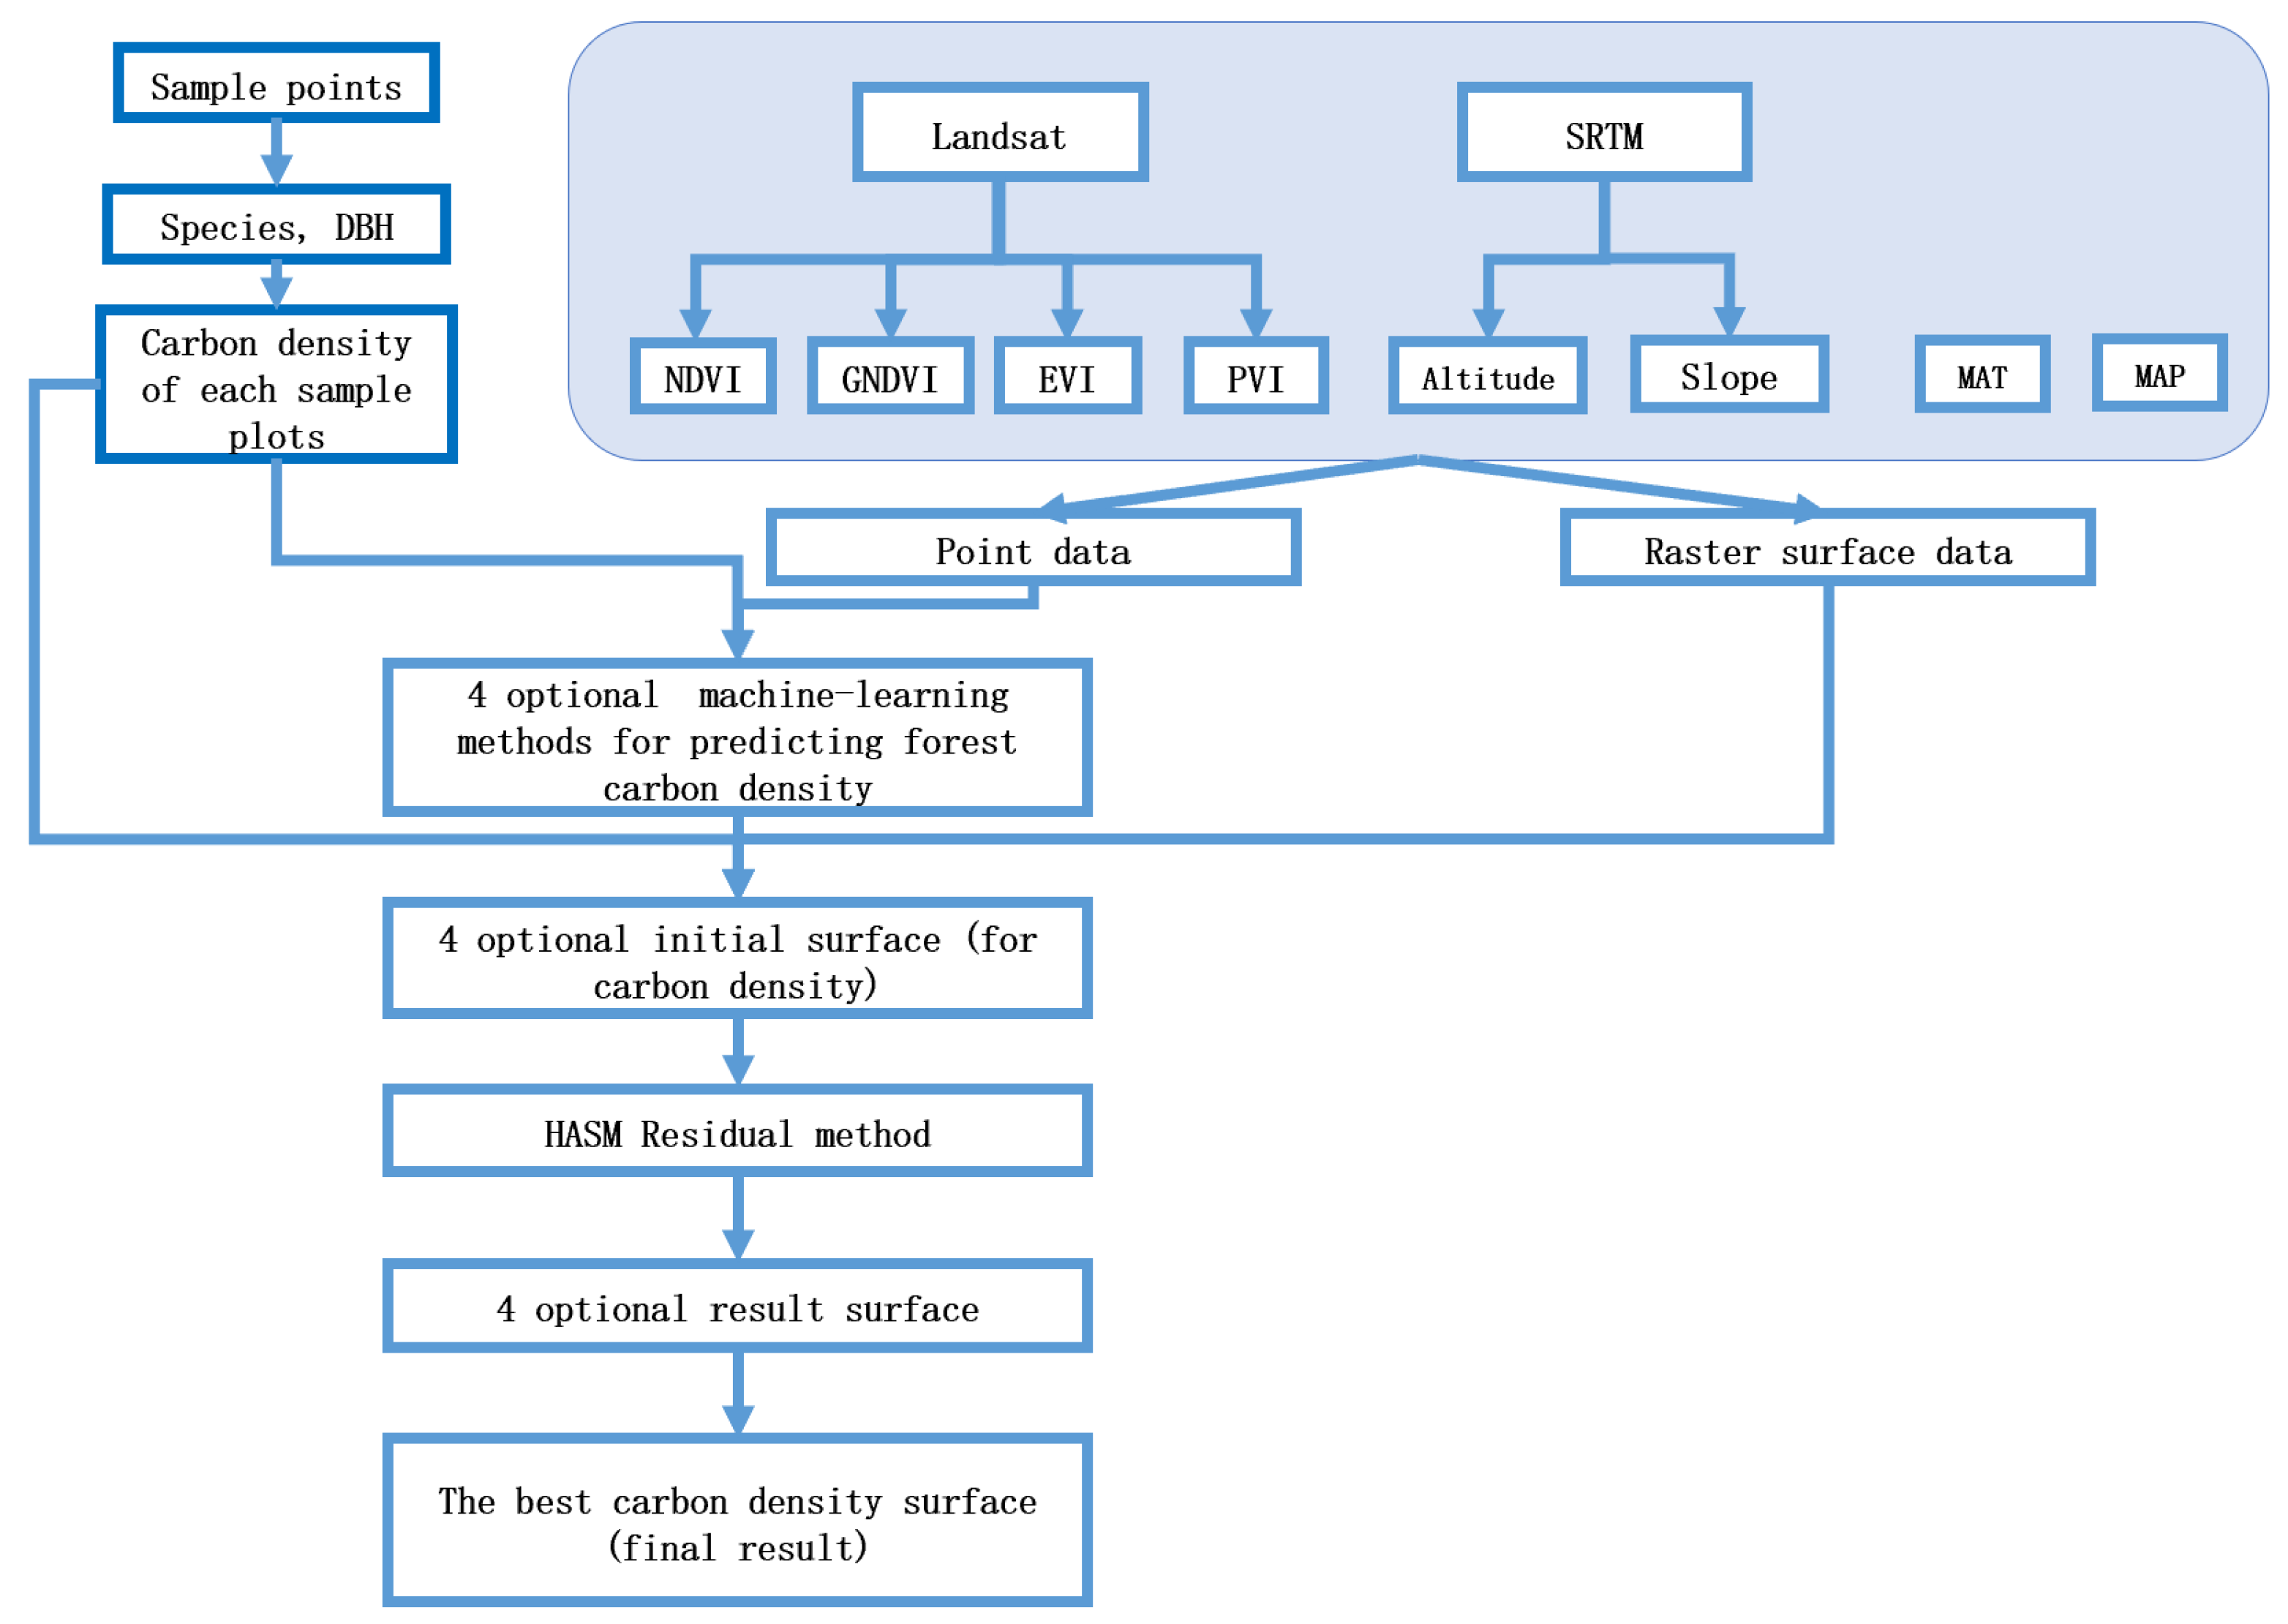
In this study, we already possess plot data derived from in situ observations. To generate the initial surface provided to HASM, we employ four alternative machine-learning methods to derive four candidate initial surfaces from multi-source remote-sensing data, and then select the most accurate surface as the final result based on the error metric R2. The technical workflow is shown in Figure 3, and further details of this workflow are provided below.
Pre-processing of the plot survey data was initially conducted in Section 2.1, involving the extraction of information on tree species, DBH, and other relevant variables. Based on the equations described in Section 2.2, carbon density was calculated for each sample plot. Additionally, vegetation indices—including the NDVI, GNDVI, EVI, and PVI—were derived from Landsat satellite imagery. Topographic variables such as altitude, slope, aspect, and slope position were obtained from SRTM data. The climate data we used (MAT and MAP) are derived from the work performed by our co-author Yang et al. (2024) using meteoro-logical station data [39]. These multi-source datasets collectively served as input features for the spatial estimation of forest carbon density.
For generating the first carbon density trend surface to be incorporated into the HASM model, this research employed four machine learning methods: Lasso regression, ridge regression, Random Forest (RF), and Gradient Boosting (XGBoost) to construct prediction models of carbon density. These methods have varying advantages and drawbacks. Lasso and Ridge regression models reduce feature selection bias and improve model generalization by employing regularization [57,58]. The RF model captures non-linear relationships between complex features by building an ensemble of decision trees [59]. The XGBoost model optimally balances model efficiency and performance in the XGBoost framework [60].
Surface maps representing forest carbon density trends in the study area were created based on the predictions produced by the machine learning models. For enhancing the accuracy in surface fitting, the residual approach of the HASM was used, where residual analysis of the difference between the trend surface predicted and the observed sample data was conducted. HASM allows integrated incorporation of intrinsic and extrinsic information in an organic manner and has been successfully used in ecological and environmental surface modelling in different scales [56]. Therefore, the method enabled model error correction and production of adjusted carbon density trend surfaces from each of the four methods. The principles and major equations of HASM are presented in the Supplementary Document.
To determine the most appropriate surface fitting method, the performance of each method was analysed by comparing the R 2 of the fitted surface and assessing the extent of spatial alignment between the trend surface and actual carbon density distribution in the study region. The model that had the highest R 2 and revealed spatial distribution properties that most closely reflected actual conditions was determined to be the optimal surface fitting method. This selection maximized the use of estimates of carbon stock density which were statistically reliable and captured the actual conditions of the study region accurately. Therefore, the methodology provides valuable data support and scientific basis fuelling the dynamic monitoring and precise management of forest carbon stock in the study region.

2.5. Structural Equation Modelling (SEM)

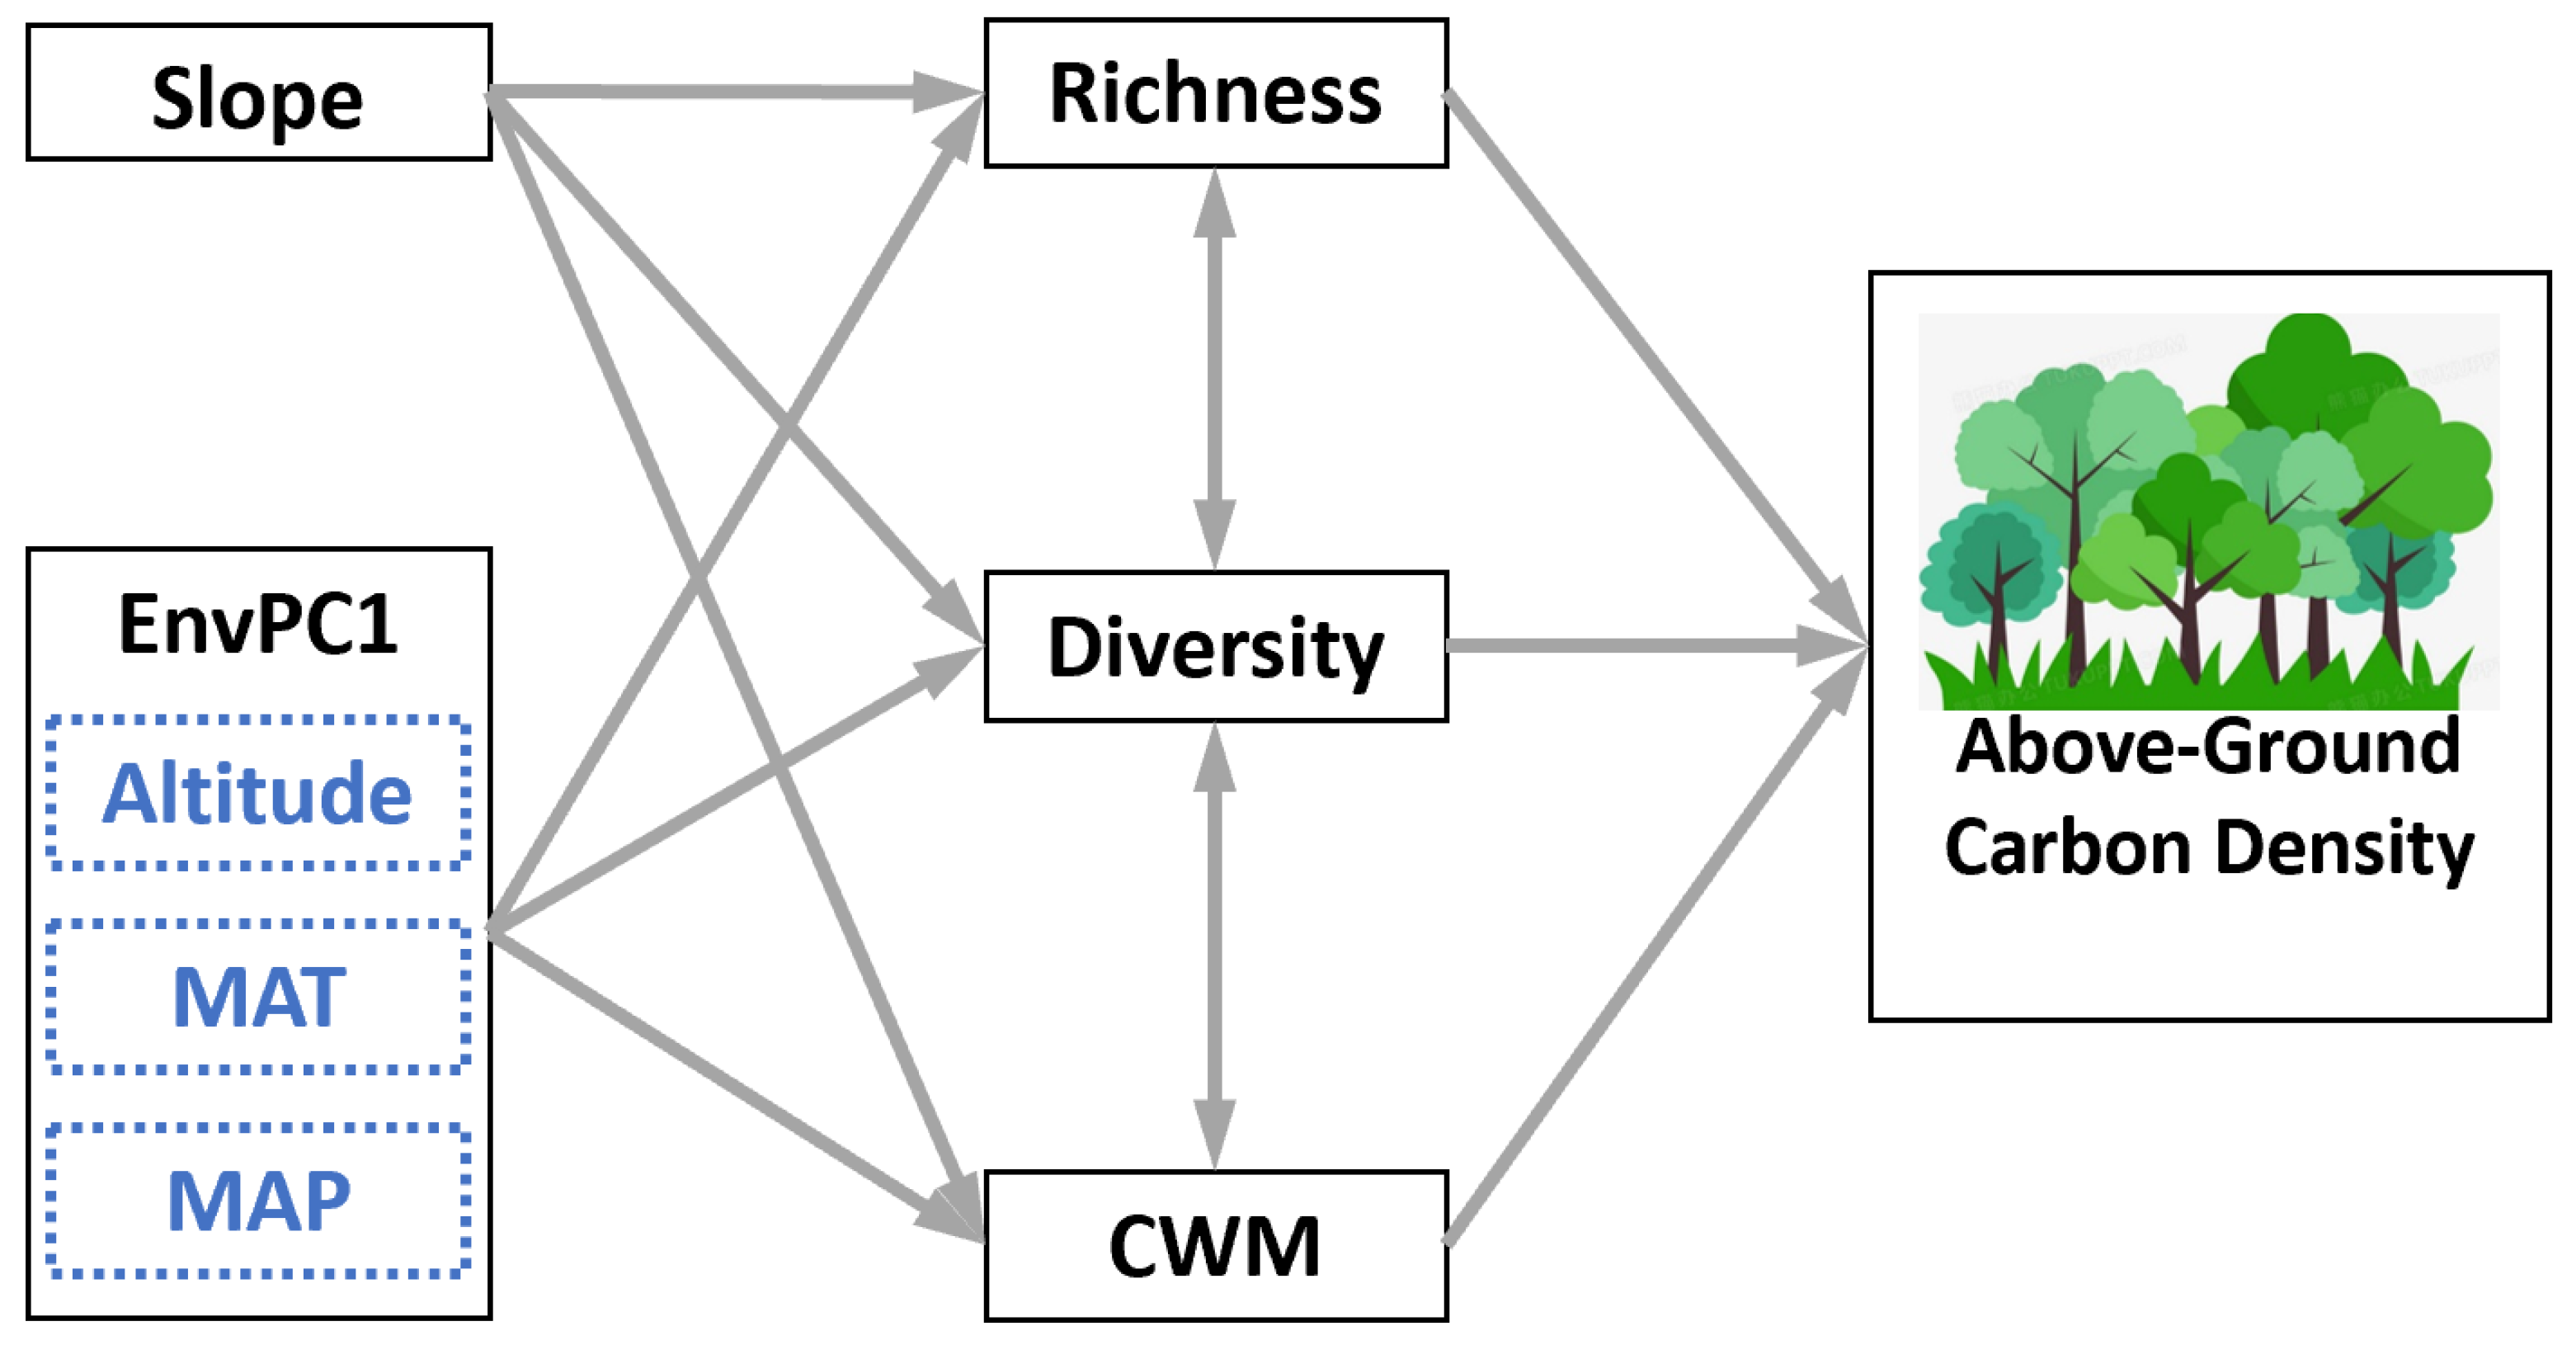
In this study, SEM was utilized to explore the relationships between aboveground biomass carbon density (hereafter referred to as “carbon density” (CD)) and various biotic and environmental factors. The biotic factors considering in this model are species richness ( S R in Equation (1)), species diversity ( D in Equation (2)), and functional diversity ( C W M in Equation (3)). Environmental factors are altitude, slope, MAT, and MAP. The fundamental premise of the model posits that species richness, or biodiversity, has a substantial independent effect on carbon density, even when considering both the direct and indirect effects of environmental factors, as well as the direct effects of other biotic factors. The environmental variables affect species richness, diversity index, and CWM through multiple pathways, which subsequently affect carbon density. To ensure temporal continuity, we selected 118 plots that were measured in all four years as the input data for constructing the SEM. The distribution of these selected plots and further details is provided in Section S1 of the Supplementary Document.
Considering the close interrelationships between altitude and climatic variables, as previously noted in studies such as Chen et al. (2020) [26] and Bhardwaj et al. (2021) [23], we first conducted a preliminary assessment of multicollinearity using variance inflation factors (VIF) before deciding on the final SEM meta-model. Specifically, based on the hypothesised direct and indirect effects of the environmental drivers on CD, we initially simulated a series of models using our dataset. However, these analyses revealed that the VIF values for altitude in relation to both MAT and MAP were excessively high (VIF > 10), indicating problematic collinearity. Following the recommendations of Dormann et al. (2013) [61], we therefore performed a principal component analysis (PCA) on altitude, MAT, and MAP, and extracted the first principal component (EnvPC1). EnvPC1, which we expected a priori to represent the dominant environmental gradient, was subsequently used in the SEM as a composite predictor, replacing the three original variables.
The proposed conceptual meta-model is illustrated in Figure 4. By comparing the optimal SEM path coefficients and effect sizes across four years, the temporal changes in these relationships were analysed, leading to significant conclusions and policy recommendations.
To mitigate the impact of extreme values, the Interquartile Range (IQR) method was employed to eliminate outliers from the sample data prior to the application of SEM. For conformity to normality and homoscedasticity, all the variables were standardized with the aid of Min-Max scaling prior to the statistical analysis. SEM construction and validation were performed using the “lavaan” package in the R (v. 4.4.0), as suggested by Rosseel (2012) [62]. Priority in adding paths was accorded to those showing the largest modification indices that were theoretically consistent with the growth patterns of forest ecosystems. Non-significant paths that bore the greatest p-values were removed first, in contrast. The model’s evaluation relied on the chi-square test supplemented by four fit indices: Goodness of Fit Index (GFI), Comparative Fit Index (CFI), Root Mean Square Error of Approximation (RMSEA), and the Standardized Root Mean Square Residual (SRMR). For the comparison of the model, the Akaike Information Criterion (AIC) and the Bayesian Information Criterion (BIC) were employed, with lower values representing better model fitness [63,64].

3. Results

3.1. Spatial Patterns and Temporal Dynamics of Carbon Density

Figure 5 depicts the CD spatiotemporal patterns in forest regions in the study area in 1989, 1999, 2009, and 2019. These patterns were created employing machine learning algorithms in the first-step field fitting, using the HASM framework and XGBoost. Comparative analyses of four machine learning methodologies, including Lasso, Ridge, and RF, indicated that XGBoost yielded the most reliable initial field, as evidenced by consistently high cross-validation scores ( R 2 ) for the HASM-XGBoost model. The R 2 for the fitted surfaces across the four years was 0.94554 (1989), 0.93756 (1999), 0.92228 (2009), and 0.91960 (2019), demonstrating robust and consistent model performance. This suggests that the estimated carbon density distributions closely align with actual spatial patterns. Over the 40-year period, carbon density exhibited an upward trend (Figure 3), with areas of low carbon density (≤15 M g / h a ) gradually transitioning to higher density areas (>90 M g / h a ), thereby highlighting an overall increase in carbon density across both spatial and temporal dimensions.

3.2. Temporal Trends and Distributional Analysis of Carbon Density

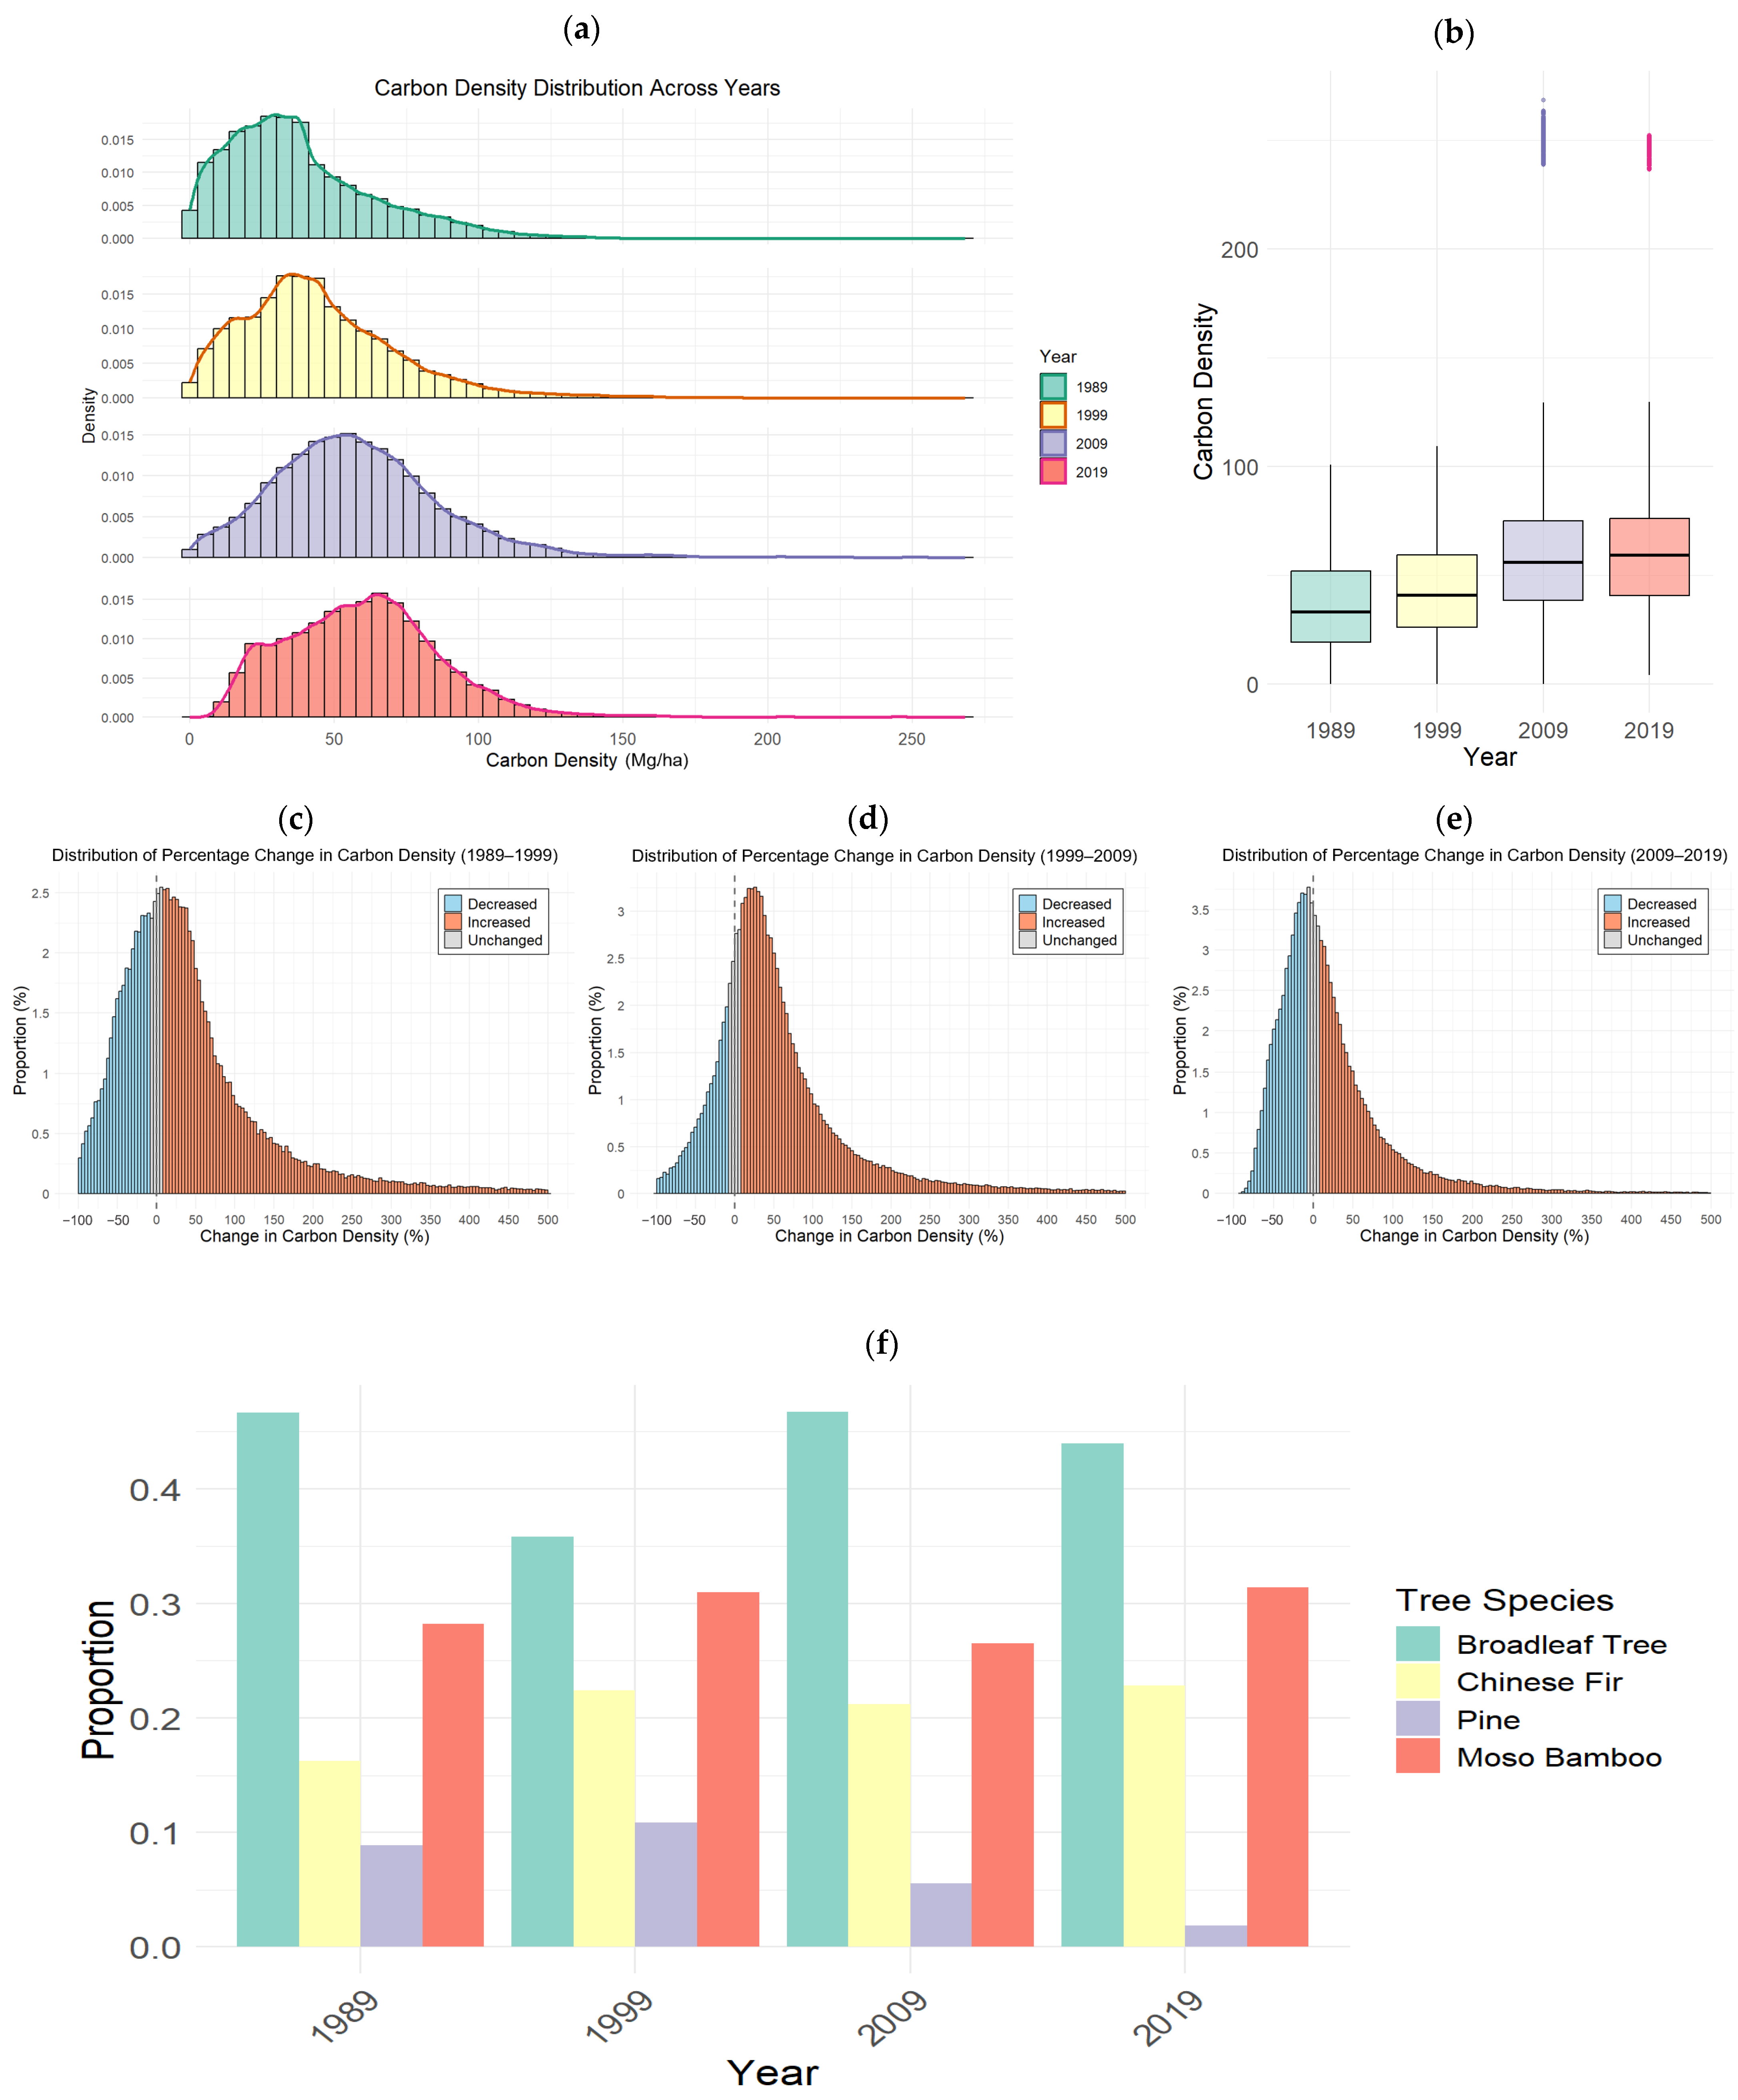
To conduct a more comprehensive analysis of the changes in carbon density within the study area, the simulation results obtained from the HASM data fusion method were utilized to develop Figure 6, building upon the spatial patterns in Figure 5. Figure 6 depicts the temporal dynamics and distributional changes in carbon density throughout the study period.
Figure 6a illustrate the evolution of carbon density distribution over the decades. In both 1989 and 1999, the distributions exhibit a right-skewed pattern, predominantly characterized by lower carbon density values. By 2009, there is a significant shift towards a more normal distribution, with an increased proportion of regions attaining higher carbon density levels. This trend persists into 2019, albeit at a more gradual rate, as the distribution stabilizes, resulting in a reduced number of regions remaining within the lower density ranges. This observation reflects the overarching trend of increasing carbon storage throughout the study area.
Figure 6b depicts the median, IQR, and variability in carbon density by decades. Median carbon density rose from 38.30 M g / h a (1989) to 44.84 M g / h a (1999), 59.32 M g / h a (2009) and 60.63 M g / h a (2019), with the steepest increase in 1999–2009. The IQR widened over time, indicating growing spatial heterogeneity, likely reflecting differences in management and ecological processes.
The percentage change maps of carbon density (Figure 6c–e) further reflect the underlying dynamics. Carbon density increased moderately during 1989–1999, rose sharply during 1999–2009 with a larger proportion of the area exhibiting substantial gains, and changed only slightly during 2009–2019, with most areas showing minimal increases or remaining stable. This deceleration is consistent with forest maturation and potential saturation effects.
Figure 6f illustrates the percentage of major tree types across the course of four years, calculated from Section 2.1 data. The tree types are grouped into the four major types: Broadleaf Trees, Chinese Fir, Pine, and Moso Bamboo. From 1989 to 2019, Broadleaf remained dominant but declined overall (above 40% in three years); Moso bamboo increased, exceeding 30% in 2019; Chinese fir also rose but stayed third; Pine fell sharply to approximately 2% by 2019. These observed dynamics suggest a shift in forest composition, characterized by more variable trends for Pine and Moso Bamboo. Such changes are likely to have implications for species diversity and forest carbon storage. As the proportions of different species evolve, they may affect ecological balance, species interactions, and the overall capacity of the forest to sequester carbon.

3.3. Effect of Environmental and Biotic Factors on Carbon Density over Time

Using 118 selected sampling plots consistently recorded between 1989 and 2019 as input (see Supplementary Document Section S1 for details), the best-fitting SEM results for these four years, derived from the meta-model outlined in Section 2.5, are presented in Figure 7. PCA consistently identified that the first principal component (EnvPC1) explained the majority of variance among altitude, MAT, and MAP across all four years. EnvPC1 accounted for over 97% of the total variance, with high positive loadings for altitude and precipitation and a negative loading for temperature (see Supplementary Document Section S3 for specific values).
The models exhibited excellent fit at all four time points between 1989 and 2019 (see Table 2). The p-values from the chi-square tests were all greater than 0.377, indicating no statistically significant differences. Moreover, the consistently high Comparative Fit Index ( C F I     0.999 ), low Root Mean Square Error of Approximation ( R M S E A     0.013 ), small Standardized Root Mean Square Residual ( S R M R     0.018 ), and high Goodness-of-Fit Index ( G F I   >   0.98 ) confirm that the models had an excellent goodness-of-fit across all years. These results demonstrate the robustness of the models in capturing the complex relationships between environmental factors, biotic factors, and carbon diversity (CD). Replacing the original three variables with EnvPC1 reduced all VIF in the SEM to below the accepted threshold of 5, confirming that multicollinearity was effectively addressed. Collectively, these indicators affirm the robustness and scientific reliability of the models.
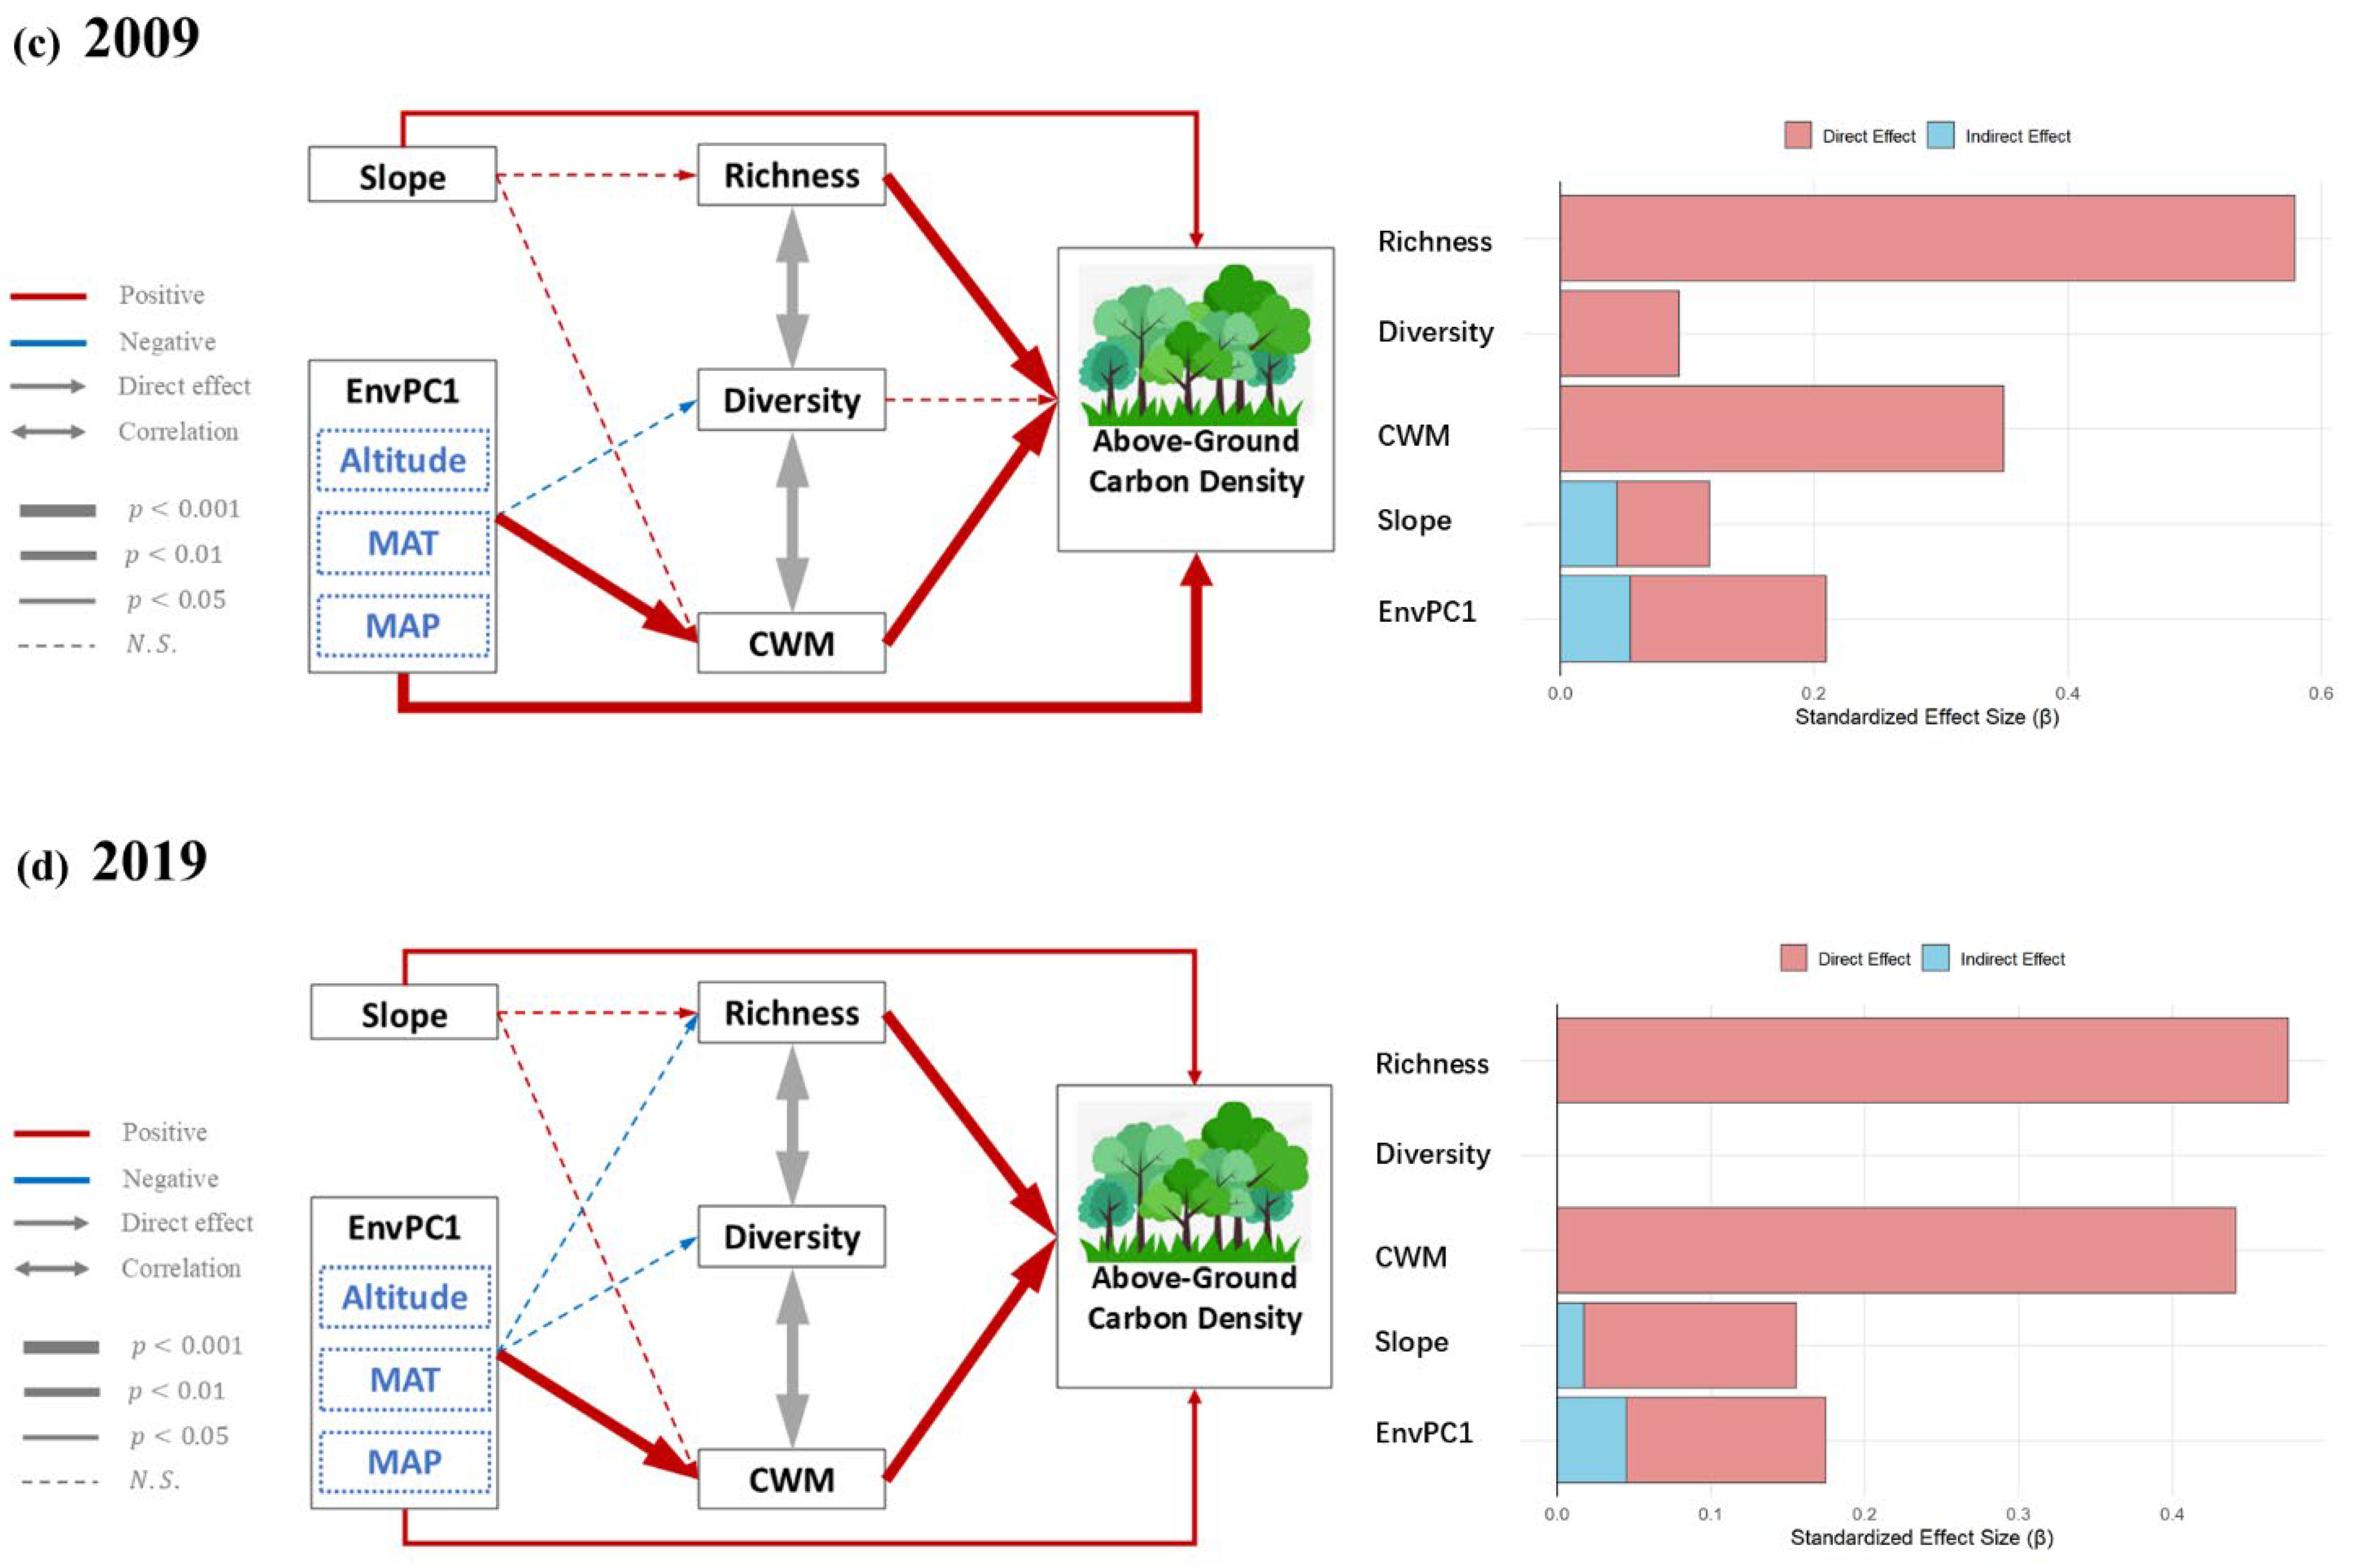
Figure 7a–d comprise two essential components for each year: the right section illustrates the relationships among influencing factors through path diagrams, while the right section summarizes the standardized effect sizes of these factors on carbon density using bar plots. To provide additional clarity on the magnitude and significance of the standardized effects in Figure 7, Table 3 offers a detailed quantitative summary that supports and enhances the interpretation of the structural relationships.
Table 2. Goodness-of-fit indices for best-fitted SEM in 1989, 1999, 2009, and 2019 *.
Modelp-Value
(Chi-Square)
Degrees of FreedomCFIRMSEASRMRGFI
(a)SEM19890.75431.0000.0000.0070.999
(b)SEM19990.53231.0000.0000.0250.997
(c)SEM20090.74121.0000.0000.0080.999
(d)SEM20190.89631.0000.0000.0110.999
* As mentioned in Section 2.5, the model’s evaluation relied on the chi-square test supplemented by four fit indices: Comparative Fit Index (CFI), Root Mean Square Error of Approximation (RMSEA), Standardized Root Mean Square Residual (SRMR), and Goodness of Fit Index (GFI).
Figure 7. Best-fitted SEM results for determinants of forest carbon density (CD) across four decades: (a) 1989; (b) 1999; (c) 2009; (d) 2019. (Note: Each panel presents the best-fitted SEM depicting the relationships among environmental variables (EnvPC1 and slope), diversity indicators (species richness, diversity index, and CWM), and CD. In the (right) section of each panel, path diagrams illustrate hypothesized causal pathways: Solid lines represent statistically significant paths (p < 0.05), and dashed lines denote non-significant paths (p > 0.05). Red lines indicate positive effects; blue lines represent negative effects. Line thickness is proportional to the significance level (thicker = more significant). Standardized path coefficients for each relationship are outlined in Table 3. Bar plots (right) showing standardized direct (red) and indirect (blue) effects of each variable on CD.).
Forests 16 01496 g007aForests 16 01496 g007b
As illustrated in Figure 7 and detailed in Table 3, the positive direct effects of Richness and CWM constituted the core driving forces behind CD throughout the study duration. Although the effect of Richness varied over time, it consistently remained the most potent positive driver. By comparison, the contribution of Diversity declined steadily. Among environmental factors, the direct positive effect of slope was stable yet weak; its indirect positive effect was exclusive to 1989, lost statistical significance after 1999, and ceased to exist thereafter. EnvPC1 is a composite of three environmental factors (altitude, MAP, and MAT), and it showed a significant transition in its direct effect, shifting from negative to positive beginning in 2009. Simultaneously, its indirect effect pathway became less complex: moving from multiple pathways in earlier years to a single pathway facilitated by CWM in later stages. In the latter portion of the study, the positive chain “EnvPC1 → CWM → CD” emerged as the key mechanism through which environmental factors impacted CD.
Table 3. Direct and indirect effects of environmental and biotic factors on forest carbon density in 1989, 1999, 2009, and 2019 *.
FactorEffect1989199920092019
β s t d p-Value β s t d p-Value β s t d p-Value β s t d p-Value
EnvPC1Direct−0.1710.000−0.1560.0000.1540.0000.1300.022
Indirect Richness−0.2850.000−0.2110.000------−0.078N.S.
Indirect Diversity−0.3020.000−0.2070.000−0.008N.S.------
Indirect CWM−0.2620.000−0.1940.0000.1590.0000.1860.000
SlopeDirect0.0790.0490.0860.0110.0730.0350.1380.016
Indirect Richness0.1210.0160.077N.S.0.023N.S.0.037N.S.
Indirect Diversity------0.085N.S.------------
Indirect CWM------------0.089N.S.------
RichnessDirect0.5270.0000.6990.0000.5790.0000.4750.000
DiversityDirect------−0.110N.S.0.093N.S.------
Indirect CWM0.1850.001------------------
CWMDirect0.3450.0000.4170.0000.3500.0000.4410.000
* Only paths that represent the effect of a variable on carbon density (CD) are presented, along with their standardized path coefficients and associated p-values. Cells marked with “---” indicate either the absence of a path in SEM or that the corresponding path contributed no effect to CD. Coefficient values showed in black denote statistically significant relationships (p < 0.05), whereas those in grey indicate non-significant paths. “N.S.” signifies non-significance.
Based on temporal comparisons in Figure 7, the driving mechanisms of CD evolved from an initial state dominated by biotic factors (with environmental factors suppressing CD) to a later state characterized by biotic-environmental synergy. The specific evolutionary patterns are as follows:
In 1989 and 1999, Richness ( β s t d = 0.522 ~ 0.698 ) and CWM ( β s t d = 0.348 ~ 0.421 ) acted as the core drivers of CD, whereas EnvPC1 suppressed CD via both direct negative effects ( β s t d = 0.156 ~ 0.171 ) and multiple indirect negative pathways. This pattern reflects the environmental conditions of the period (e.g., low MAT and high altitude), which constrained vegetation growth; biotic factors, however, alleviated part of this environmental pressure through species complementarity.
In 2009, the direct positive effect of Richness decreased slightly ( β s t d = 0.575 ), while the effect of CWM remained stable ( β s t d = 0.353 ) . Notably, the direct effect of EnvPC1 shifted from negative to positive ( β s t d = 0.154 ) , with its indirect effects retained only as positive pathways mediated by CWM. This transition marked a key shift in the role of environmental gradients—from “suppression” to “synergy”—whereby environmental factors began to co-drive CD enhancement alongside biotic factors.
In 2019, Richness remained the strongest direct positive driver of CD, though its effect was nearly comparable to that of CWM. Both the direct effect of EnvPC1 ( β s t d = 0.130 ) and the effect of CWM ( β s t d = 0.460 ) were further amplified, solidifying the “EnvPC1 → CWM → CD” chain as the key positive pathway. Collectively, these three factors (EnvPC1, Richness, and CWM) established a core driving mechanism defined as “EnvPC1 (environmental optimization) + Richness (resource utilization) + CWM (functional support).” This mechanism rendered the CD driving network more streamlined and efficient.

4. Discussion

This study elucidates the spatiotemporal dynamics of carbon density in forest ecosystems over the past 40 years, highlighting the intricate interactions among ecological, climatic, and topographic factors. Employing the HASM multi-source data fusion method [54,55], we integrated field observational data with macro-level remote sensing observations to yield a comprehensive spatial distribution of carbon density in the Zixi region during the study period. Given that the ecological environment surface is jointly controlled by local and global factors [49,52], the HASM method used in this study ensures the accuracy of the fitted carbon density surface by integrating these two types of information. The resulting carbon density estimates ( R 2   =   0.919 ~ 0.945 across years) are expected to be considered a highly accurate representation of the actual carbon density distribution.
The findings demonstrate a transition from predominantly low- to high-density carbon storage between 1989 and 2009, accompanied by a sustained increase in carbon stocks. This pattern is consistent with global trends of forest carbon accumulation, primarily driven by forest maturation and enhanced species diversity [1,65]. Species richness was especially influential during this interval, as greater resource complementarity promoted higher ecosystem productivity and carbon sequestration rates [11,19]. However, from 2009 to 2019, the growth of carbon density decelerated, mainly due to natural disturbances. A severe outbreak of pine wood nematode (Bursaphelenchus xylophilus) resulted in a marked decline in pine populations, as depicted in Figure 6f. The adverse effects of this pest on forests in central and southern China have been corroborated by Zhou et al. (2024) [66]. Furthermore, the rapid expansion of bamboo (Phyllostachys edulis) disrupted forest structure and composition, contributing to ecological instability. Although bamboo rapidly sequesters carbon in its early growth stages, its long-term proliferation can suppress the growth of other tree species and decrease biodiversity [67,68,69]. Bamboo expansion also alters soil physicochemical properties and microbial community structure, thereby influencing the carbon storage potential of local ecosystems [68], aligning with the observed changes in carbon density and bamboo proportion in Figure 6.
The SEM results provide further insight into the mechanisms underlying changes in forest carbon storage. Species richness and community weighted mean (CWM) consistently emerged as the principal determinants of carbon storage across the study period, underscoring the “species complementarity effect.” Diverse communities, such as those combining broadleaf and conifer species, optimize resource utilization, improve canopy structure, and enhance photosynthetic efficiency [11,12]. The diminishing influence of the diversity index may be attributed to the forest’s transition from an “early recovery” stage to a “mature and stable” phase, during which dominant species (e.g., broadleaf trees) became increasingly prevalent, resulting in diminished species evenness (Figure 6f). Consequently, carbon storage became more strongly associated with the functional traits of dominant species (i.e., CWM) rather than species evenness, in line with the findings of Mori et al. (2018), who reported that functional traits provide a better explanation for variation in carbon storage than diversity indices [14].
With respect to environmental determinants, the interplay between altitude and climate was operationalized as a composite environmental principal component (EnvPC1) derived through PCA. SEM results from the present study revealed a temporal shift in the influence of EnvPC1 on carbon density, transitioning from a negative to a positive association. This transition potentially reflects both ameliorated environmental conditions and adaptive evolutionary responses among local vegetation assemblages. Notably, 83.1% of the Zixi region is situated above 300 m in elevation, and prior to 2000, environmental conditions—characterized by high altitude and low MAT—likely constrained photosynthetic capacity due to suboptimal thermal regimes. Recent research has similarly documented the suppressive effect of low MAT on subtropical forest development [7]. Post-2000, however, progressive global warming mitigated these temperature-related constraints, thereby enhancing the positive impact of solar radiation at higher altitudes [70]. Correspondingly, recent studies have reported that high-altitude forests maintain more stable carbon storage under warming scenarios [23,70]. These climatic patterns are mirrored in the Poyang Lake Basin, where a sustained increase in MAT has been observed over the past two decades [39]. Consequently, between 2009 and 2019, the climatic regime encapsulated by EnvPC1 entered an “optimal growth window,” with high-altitude locales—attributable to low evaporative demand and favourable water retention—emerging as climate refugia for carbon sequestration. Furthermore, the current study observed that, between 1950 and 2018, more than half of the vegetation communities in the southern mountainous regions of China exhibited upward shifts in their altitudinal distribution centres [70]. This ecological phenomenon partially elucidates the observed positive shift in the effect of EnvPC1. In high-altitude settings, upward centroid migration of vegetation has promoted both increased cover and enhanced community stability [70]. Over the four-decade study period, local vegetation progressively adapted to the environmental gradient represented by EnvPC1 via natural selection, thereby strengthening its positive effect on carbon density. To further interrogate this relationship, future research could undertake more granular investigations. For instance, comprehensive measurements of solar radiation metrics—such as sunshine duration and total sunlight hours—would facilitate a more integrative understanding of the interactions between topographic and climatic variables in shaping carbon density and its underlying mechanisms.
Slope, another environmental factor, consistently exhibited direct and indirect positive effects on carbon density, with the direct effect gradually strengthening, while the indirect effect through biotic factors weakened. Research shows that, over time, the influence of topography on species distribution can change in subtropical montane forests [71]. In 1989, slope influenced carbon density indirectly through species richness, as vegetation distribution in the early recovery phase was strongly filtered by topography. However, by 2009, the forest ecosystem had stabilised, and the slope no longer filtered species richness, leading to the disappearance of the indirect effect. The direct positive effect of slope remained stable, primarily because steep slopes experience less soil erosion, and the site conditions continue to slightly promote carbon storage [5].
These findings have important implications for forest management strategies. Adaptive forest management is crucial for balancing ecological restoration with the ability to respond to future stressors. First, targeted pest management is crucial, particularly in pine forests affected by pine wood nematode outbreaks, which are expected to intensify under climate change [72]. Without timely control, this could further accelerate pine mortality. As pine trees are significant contributors to carbon storage, their decline would directly reduce forest biomass accumulation and weaken overall carbon sink function. Second, managing bamboo expansion is vital. While bamboo’s rapid growth contributes to carbon density in the short term [68], its invasive spread can outcompete native tree species, reducing biodiversity [67], which is crucial for long-term ecosystem stability and carbon storage [12]. Thus, in high-diversity areas, promoting mixed planting of broadleaf trees and cedar, along with strict bamboo expansion control, is recommended. Third, protecting high-altitude forests is critical. Based on the significant positive effect of EnvPC1 on carbon density in 2019, high-altitude regions (suggested as “core carbon sink protection zones” above 800 m) are key carbon sinks, with minimal human interference and stable microclimates [23]. Preventing logging and bamboo expansion in these areas would further preserve carbon storage stability. Lastly, attention should be given to forest quality, and an environmental risk early-warning system should be established. In the face of slowing carbon density growth, forest management should prioritise enhancing species diversity and promoting late-successional, high-carbon species to maintain the upward trend in carbon storage.

5. Conclusions

This study underscores the pivotal role of species diversity in regulating forest carbon density, revealing its dynamic, context-dependent effect across temporal and environmental gradients. Diversity indicators—in the form of species richness and CWM—repeatedly supported increased carbon storage via complementarity of resources and greater ecosystem functioning. As forest ecosystems have gradually matured over time, the influence of functional diversity on carbon density has become increasingly prominent. Nonetheless, their relative significance changed over time in response to changing climatic and environmental conditions and thereby reflected the multifaceted role of abiotic and biotic drivers in forested ecosystems. Meanwhile, against the backdrop of global warming, the synergistic effects of altitude, temperature, and precipitation on regulating forest carbon density have gradually become more evident, with the positive role of high-altitude areas in mountain forest carbon storage also becoming progressively apparent.
Based on the findings of this study, policymakers and forest managers are advised to take targeted actions to enhance subtropical forest carbon sequestration and ecosystem resilience. Firstly, the protection of species richness should be prioritized to maintain the resource complementarity capacity of ecosystems. Secondly, subtropical mountainous regions in southern China with natural conditions similar to those of Zixi County should guard against biotic stresses such as pine wood nematode infestations and unregulated Moso bamboo expansion. Thirdly, measures should be taken to protect the stable forest communities established in high-altitude areas from harm caused by human activities. In addition, long-term monitoring of forest ecosystems and regional climate should be strengthened, and adaptive forest-management measures should be formulated in response to changing conditions. Collectively, the endeavours are critical to feed into adaptive management frameworks that safeguard biodiversity and promote long-term stability and sustainability of carbon stocks in the forests during accelerating environmental change.

Supplementary Materials

The following supporting information can be downloaded at: https://www.mdpi.com/article/10.3390/f16091496/s1, ref. [72].

Author Contributions

Conceptualization, T.Y.; methodology, C.W. and Y.W.; software, C.W. and Z.D.; validation, C.W. and Y.Y.; data curation, C.W., Y.Y. and W.S.; writing—original draft preparation, C.W.; writing—review and editing, T.Y., Y.W., N.Z., Y.Y., W.S., X.Z., Z.L., J.P., B.L. and Y.P.; visualization, C.W.; supervision, T.Y.; project administration, T.Y.; funding acquisition, T.Y. All authors have read and agreed to the published version of the manuscript.

Funding

This research was funded by the National Natural Science Foundation of China (42330707), National Key Research & Development Program of China (2024YFD1700904), the Science Fund for Creative Research Groups of the National Natural Science Foundation of China (72221002), the Strategic Priority Research Program of Chinese Academy of Sciences (XDB0740100), and National Key R&D Program of China (2021YFB3901300).

Data Availability Statement

Please contact Tianxiang Yue (yue@lreis.ac.cn) for the data and code used for this study.

Acknowledgments

Many thanks to suggestions given by Yude Pan from USDA Forest Service. We would like to thank the Forestry Bureau of Zixi County for the strong support of data investigation and collection. We would like to thank the Google Earth Engine for all remote sensing data provided on this platform. We are also grateful to the editors and the anonymous reviewers for their valuable comments, which have substantially improved the quality of this paper and helped us further refine the design of the SEM model.

Conflicts of Interest

The authors declare no conflicts of interest.

Abbreviations

The following abbreviations are used in this manuscript:
AICAkaike Information Criterion
BICBayesian Information Criterion
CBEFContinuous Biomass Expansion Factor
CDAboveground biomass carbon density
CFIComparative Fit Index
CWMCommunity-Weighted Mean
DBHDiameter at Breast Height
DEMDigital Elevation Model
EnvPC1Composite environmental principal component 1
EVIEnhanced Vegetation Index
GFIGoodness of Fit Index
GNDVIGreen Normalized Difference Vegetation Index
HASMHigh Accuracy Surface Modelling
IQRInterquartile Range
MAPMean Annual Precipitation
MATMean Annual Temperature
NDVINormalized Difference Vegetation Index
PCAPrincipal Component Analysis
PVIPlant Variety Index
RFRandom Forest
RMSEARoot Mean Square Error of Approximation
SEMStructural Equation Modelling
SRMRStandardized Root Mean Square Residual
SRTMShuttle Radar Topography Mission
VIFVariance Inflation Factors
XGBoostGradient Boosting

References

  1. Pan, Y.; Birdsey, R.A.; Fang, J.; Houghton, R.; Kauppi, P.E.; Kurz, W.A.; Phillips, O.L.; Shvidenko, A.; Lewis, S.L.; Canadell, J.G. A large and persistent carbon sink in the world’s forests. Science 2011, 333, 988–993. [Google Scholar] [CrossRef]
  2. Crockett, E.T.; Atkins, J.W.; Guo, Q.; Sun, G.; Potter, K.M.; Ollinger, S.; Silva, C.A.; Tang, H.; Woodall, C.W.; Holgerson, J. Structural and species diversity explain aboveground carbon storage in forests across the United States: Evidence from GEDI and forest inventory data. Remote Sens. Environ. 2023, 295, 113703. [Google Scholar] [CrossRef]
  3. Chen, K.; Li, T.; Yang, M.; Zhou, X.; Peng, C. The effects of environmental factors and plant diversity on forest carbon sequestration vary between eastern and western regions of China. J. Clean. Prod. 2024, 437, 140371. [Google Scholar] [CrossRef]
  4. Mitchard, E.T. The tropical forest carbon cycle and climate change. Nature 2018, 559, 527–534. [Google Scholar] [CrossRef] [PubMed]
  5. Chen, X.; Taylor, A.R.; Reich, P.B.; Hisano, M.; Chen, H.Y.H.; Chang, S.X. Tree diversity increases decadal forest soil carbon and nitrogen accrual. Nature 2023, 618, 94–101. [Google Scholar] [CrossRef]
  6. Singh, G.; Mishra, D.; Singh, K.; Shukla, S.; Choudhary, G. Geographical settings and tree diversity influenced soil carbon storage in different forest types in Rajasthan, India. Catena 2022, 209, 105856. [Google Scholar] [CrossRef]
  7. Lv, Z.; Duan, A.; Zhang, J. Influence of forest age, tree size, and climate factors on biomass and carbon storage allocation in Chinese fir forests. Ecol. Indic. 2024, 163, 112096. [Google Scholar] [CrossRef]
  8. Loreau, M.; Naeem, S.; Inchausti, P.; Bengtsson, J.; Grime, J.P.; Hector, A.; Hooper, D.U.; Huston, M.A.; Raffaelli, D.; Schmid, B. Biodiversity and ecosystem functioning: Current knowledge and future challenges. Science 2001, 294, 804–808. [Google Scholar] [CrossRef]
  9. Schmid, B. The species richness–productivity controversy. Trends Ecol. Evol. 2002, 17, 113–114. [Google Scholar] [CrossRef]
  10. Chase, J.M.; Leibold, M.A. Spatial scale dictates the productivity–biodiversity relationship. Nature 2002, 416, 427–430. [Google Scholar] [CrossRef]
  11. Tilman, D.; Isbell, F.; Cowles, J.M. Biodiversity and ecosystem functioning. Annu. Rev. Ecol. Evol. Syst. 2014, 45, 471–493. [Google Scholar] [CrossRef]
  12. Gamfeldt, L.; Snäll, T.; Bagchi, R.; Jonsson, M.; Gustafsson, L.; Kjellander, P.; Ruiz-Jaen, M.C.; Fröberg, M.; Stendahl, J.; Philipson, C.D. Higher levels of multiple ecosystem services are found in forests with more tree species. Nat. Commun. 2013, 4, 1340. [Google Scholar] [CrossRef]
  13. Huang, Y.; Chen, Y.; Castro-Izaguirre, N.; Baruffol, M.; Brezzi, M.; Lang, A.; Li, Y.; Härdtle, W.; Von Oheimb, G.; Yang, X. Impacts of species richness on productivity in a large-scale subtropical forest experiment. Science 2018, 362, 80–83. [Google Scholar] [CrossRef]
  14. Mori, A.S. Environmental controls on the causes and functional consequences of tree species diversity. J. Ecol. 2018, 106, 113–125. [Google Scholar] [CrossRef]
  15. Song, J.; Wan, S.; Piao, S.; Xia, J.; Ning, Y.; Zheng, M.; Hui, D.; Ru, J.; Han, J.; Feng, J. Global change and China’s terrestrial carbon sink: A quantitative review of 30 years’ ecosystem manipulative experiments. Ecol. Monogr. 2025, 95, e70005. [Google Scholar] [CrossRef]
  16. Chiang, J.-M.; Spasojevic, M.J.; Muller-Landau, H.C.; Sun, I.-F.; Lin, Y.; Su, S.-H.; Chen, Z.-S.; Chen, C.-T.; Swenson, N.G.; McEwan, R.W. Functional composition drives ecosystem function through multiple mechanisms in a broadleaved subtropical forest. Oecologia 2016, 182, 829–840. [Google Scholar] [CrossRef] [PubMed]
  17. Grime, J. Benefits of plant diversity to ecosystems: Immediate, filter and founder effects. J. Ecol. 1998, 86, 902–910. [Google Scholar] [CrossRef]
  18. Forrester, D.I.; Bauhus, J. A review of processes behind diversity—Productivity relationships in forests. Curr. For. Rep. 2016, 2, 45–61. [Google Scholar] [CrossRef]
  19. Liang, J.; Crowther, T.W.; Picard, N.; Wiser, S.; Zhou, M.; Alberti, G.; Schulze, E.-D.; McGuire, A.D.; Bozzato, F.; Pretzsch, H. Positive biodiversity-productivity relationship predominant in global forests. Science 2016, 354, aaf8957. [Google Scholar] [CrossRef]
  20. Poorter, L.; van der Sande, M.T.; Arets, E.J.M.M.; Ascarrunz, N.; Enquist, B.J.; Finegan, B.; Licona, J.C.; Martínez-Ramos, M.; Mazzei, L.; Meave, J.A.; et al. Biodiversity and climate determine the functioning of Neotropical forests. Glob. Ecol. Biogeogr. 2017, 26, 1423–1434. [Google Scholar] [CrossRef]
  21. Paquette, A.; Messier, C. The effect of biodiversity on tree productivity: From temperate to boreal forests. Glob. Ecol. Biogeogr. 2011, 20, 170–180. [Google Scholar] [CrossRef]
  22. Bruelheide, H.; Dengler, J.; Purschke, O.; Lenoir, J.; Jiménez-Alfaro, B.; Hennekens, S.M.; Botta-Dukát, Z.; Chytrý, M.; Field, R.; Jansen, F. Global trait–environment relationships of plant communities. Nat. Ecol. Evol. 2018, 2, 1906–1917. [Google Scholar] [CrossRef] [PubMed]
  23. Bhardwaj, D.R.; Tahiry, H.; Sharma, P.; Pala, N.A.; Kumar, D.; Kumar, A. Bharti. Influence of Aspect and Elevational Gradient on Vegetation Pattern, Tree Characteristics and Ecosystem Carbon Density in Northwestern Himalayas. Land 2021, 10, 1109. [Google Scholar] [CrossRef]
  24. Cheng, Z.; Aakala, T.; Larjavaara, M. Elevation, aspect, and slope influence woody vegetation structure and composition but not species richness in a human-influenced landscape in northwestern Yunnan, China. Front. For. Glob. Chang. 2023, 6, 1187724. [Google Scholar] [CrossRef]
  25. Kohyama, T.I.; Sheil, D.; Sun, I.-F.; Niiyama, K.; Suzuki, E.; Hiura, T.; Nishimura, N.; Hoshizaki, K.; Wu, S.-H.; Chao, W.-C. Contribution of tree community structure to forest productivity across a thermal gradient in eastern Asia. Nat. Commun. 2023, 14, 1113. [Google Scholar] [CrossRef]
  26. Chen, Z.; Wang, W.; Fu, J. Vegetation response to precipitation anomalies under different climatic and biogeographical conditions in China. Sci. Rep. 2020, 10, 830. [Google Scholar] [CrossRef]
  27. Poorter, L.; van der Sande, M.T.; Thompson, J.; Arets, E.J.M.M.; Alarcón, A.; Álvarez-Sánchez, J.; Ascarrunz, N.; Balvanera, P.; Barajas-Guzmán, G.; Boit, A.; et al. Diversity enhances carbon storage in tropical forests. Glob. Ecol. Biogeogr. 2015, 24, 1314–1328. [Google Scholar] [CrossRef]
  28. Madrigal-González, J.; Calatayud, J.; Ballesteros-Cánovas, J.A.; Escudero, A.; Cayuela, L.; Rueda, M.; Ruiz-Benito, P.; Herrero, A.; Aponte, C.; Sagardia, R. Climate reverses directionality in the richness–abundance relationship across the World’s main forest biomes. Nat. Commun. 2020, 11, 5635. [Google Scholar] [CrossRef]
  29. Dyola, N.; Sigdel, S.R.; Liang, E.; Babst, F.; Camarero, J.J.; Aryal, S.; Chettri, N.; Gao, S.; Lu, X.; Sun, J. Species richness is a strong driver of forest biomass along broad bioclimatic gradients in the Himalayas. Ecosphere 2022, 13, e4107. [Google Scholar] [CrossRef]
  30. Zhang, Q.; Ye, H.; Ding, Y.; Cao, Q.; Zhang, Y.; Huang, K. Carbon storage dynamics of subtropical forests estimated with multi-period forest inventories at a regional scale: The case of Jiangxi forests. J. For. Res. 2020, 31, 1247–1254. [Google Scholar] [CrossRef]
  31. Zhang, Y.; Chen, H.Y.; Reich, P.B. Forest productivity increases with evenness, species richness and trait variation: A global meta-analysis. J. Ecol. 2012, 100, 742–749. [Google Scholar] [CrossRef]
  32. Delgado-Baquerizo, M.; García-Palacios, P.; Bradford, M.A.; Eldridge, D.J.; Berdugo, M.; Sáez-Sandino, T.; Liu, Y.-R.; Alfaro, F.; Abades, S.; Bamigboye, A.R. Biogenic factors explain soil carbon in paired urban and natural ecosystems worldwide. Nat. Clim. Chang. 2023, 13, 450–455. [Google Scholar] [CrossRef]
  33. Fang, J.; Guo, Z.; Piao, S.; Chen, A. Terrestrial vegetation carbon sinks in China, 1981–2000. Sci. China Ser. D Earth Sci. 2007, 50, 1341–1350. [Google Scholar] [CrossRef]
  34. Song, X.; Zhou, G.; Jiang, H.; Yu, S.; Fu, J.; Li, W.; Wang, W.; Ma, Z.; Peng, C. Carbon sequestration by Chinese bamboo forests and their ecological benefits: Assessment of potential, problems, and future challenges. Environ. Rev. 2011, 19, 418–428. [Google Scholar] [CrossRef]
  35. Bollen, K.A. Structural Equations with Latent Variables; John Wiley & Sons: Hoboken, NJ, USA, 2014. [Google Scholar]
  36. Grace, J.B. Structural Equation Modeling and Natural Systems; Cambridge University Press: Cambridge, UK, 2006. [Google Scholar]
  37. Li, Y.; Schmid, B.; Schuldt, A.; Li, S.; Wang, M.-Q.; Fornoff, F.; Staab, M.; Guo, P.-F.; Anttonen, P.; Chesters, D.; et al. Multitrophic arthropod diversity mediates tree diversity effects on primary productivity. Nat. Ecol. Evol. 2023, 7, 832–840. [Google Scholar] [CrossRef] [PubMed]
  38. Ge, Z.P.; Wen, W.S.; Xu, L.; Chen, G.S.; Zhou, G.M.; Ji, B.Y.; Zhou, Y.F.; Zhu, G.L.; Shi, Y.J. Vegetation Carbon Accumulation Driven by Stand Characteristics and Climatic Factors in Subtropical Forests of Southeastern China. J. Sustain. For. 2022, 41, 941–958. [Google Scholar] [CrossRef]
  39. Yang, Y.; Wu, C.; An, T.; Yue, T. Characteristics of Climate Change in Poyang Lake Basin and Its Impact on Net Primary Productivity. Sustainability 2024, 16, 9420. [Google Scholar] [CrossRef]
  40. Odum, E.P. The Strategy of Ecosystem Development: An understanding of ecological succession provides a basis for resolving man’s conflict with nature. Science 1969, 164, 262–270. [Google Scholar] [CrossRef]
  41. Hamilton, A.J. Species diversity or biodiversity? J. Environ. Manag. 2005, 75, 89–92. [Google Scholar] [CrossRef]
  42. Koellner, T.; Hersperger, A.M.; Wohlgemuth, T. Rarefaction method for assessing plant species diversity on a regional scale. Ecography 2004, 27, 532–544. [Google Scholar] [CrossRef]
  43. Yue, T.X.; Ma, S.N.; Wu, S.X.; Zhan, J.Y. Comparative analyses of the scaling diversity index and its applicability. Int. J. Remote Sens. 2007, 28, 1611–1623. [Google Scholar] [CrossRef]
  44. Yue, T.X.; Li, Q.Q. Relationship between species diversity and ecotope diversity. Ann. N. Y. Acad. Sci. 2010, 1195, E40–E51. [Google Scholar] [CrossRef] [PubMed]
  45. Bengtsson, J. Which species? What kind of diversity? Which ecosystem function? Some problems in studies of relations between biodiversity and ecosystem function. Appl. Soil Ecol. 1998, 10, 191–199. [Google Scholar] [CrossRef]
  46. Violle, C.; Enquist, B.J.; McGill, B.J.; Jiang, L.; Albert, C.H.; Hulshof, C.; Jung, V.; Messier, J. The return of the variance: Intraspecific variability in community ecology. Trends Ecol. Evol. 2012, 27, 244–252. [Google Scholar] [CrossRef]
  47. Li, H.; Lei, Y. Estimation and Evaluation of Forest Biomass Carbon Storage in China; China Forestry Publishing House: Beijing, China, 2010. [Google Scholar]
  48. Yue, T.; Wu, C.; Liu, Y.; Du, Z.; Zhao, N.; Jiao, Y.; Xu, Z.; Shi, W. HASM quantum machine learning. Sci. China Earth Sci. 2023, 66, 1937–1945. [Google Scholar] [CrossRef]
  49. Ponsar, S.; Luyten, P.; Dulière, V. Data assimilation with the ensemble Kalman filter in a numerical model of the North Sea. Ocean Dyn. 2016, 66, 955–971. [Google Scholar] [CrossRef]
  50. Yue, T.X.; Wang, Y.F.; Du, Z.P.; Zhao, M.W.; Zhang, L.L.; Zhao, N.; Lu, M.; Larocque, G.R.; Wilson, J.P. Analysing the uncertainty of estimating forest carbon stocks in China. Biogeosciences 2016, 13, 3991–4004. [Google Scholar] [CrossRef]
  51. Brill, K.F.; Uccellini, L.W.; Manobianco, J.; Kocin, P.J.; Homan, J.H. The use of successive dynamic initialization by nudging to simulate cyclogenesis during GALE IOP 1. Meteorol. Atmos. Phys. 1991, 45, 15–40. [Google Scholar] [CrossRef]
  52. Phillips, J.D. Global and local factors in earth surface systems. Ecol. Model. 2002, 149, 257–272. [Google Scholar] [CrossRef]
  53. Chiesi, M.; Fibbi, L.; Genesio, L.; Gioli, B.; Magno, R.; Maselli, F.; Moriondo, M.; Vaccari, F.P. Integration of ground and satellite data to model Mediterranean forest processes. Int. J. Appl. Earth Obs. Geoinf. 2011, 13, 504–515. [Google Scholar] [CrossRef]
  54. Yue, T.; Zhao, N.; Liu, Y.; Wang, Y.; Zhang, B.; Du, Z.; Fan, Z.; Shi, W.; Chen, C.; Zhao, M. A fundamental theorem for eco-environmental surface modelling and its applications. Sci. China Earth Sci. 2020, 63, 1092–1112. [Google Scholar] [CrossRef]
  55. Yue, T.-X.; Du, Z.-P.; Song, D.-J.; Gong, Y. A new method of surface modeling and its application to DEM construction. Geomorphology 2007, 91, 161–172. [Google Scholar] [CrossRef]
  56. Yue, T.-X. Surface Modeling: High Accuracy and High Speed Methods; CRC Press: Boca Raton, FL, USA, 2011. [Google Scholar]
  57. Hoerl, A.E.; Kennard, R.W. Ridge regression: Biased estimation for nonorthogonal problems. Technometrics 1970, 12, 55–67. [Google Scholar] [CrossRef]
  58. Tibshirani, R. Regression shrinkage and selection via the lasso. J. R. Stat. Soc. Ser. B Stat. Methodol. 1996, 58, 267–288. [Google Scholar] [CrossRef]
  59. Breiman, L. Random forests. Mach. Learn. 2001, 45, 5–32. [Google Scholar] [CrossRef]
  60. Chen, T.; Guestrin, C. Xgboost: A scalable tree boosting system. In Proceedings of the 22nd ACM Sigkdd International Conference on Knowledge Discovery and Data Mining, San Francisco, CA, USA, 13–17 August 2016; pp. 785–794. [Google Scholar]
  61. Dormann, C.F.; Elith, J.; Bacher, S.; Buchmann, C.; Carl, G.; Carré, G.; Marquéz, J.R.G.; Gruber, B.; Lafourcade, B.; Leitão, P.J. Collinearity: A review of methods to deal with it and a simulation study evaluating their performance. Ecography 2013, 36, 27–46. [Google Scholar] [CrossRef]
  62. Rosseel, Y. lavaan: An R package for structural equation modeling. J. Stat. Softw. 2012, 48, 1–36. [Google Scholar] [CrossRef]
  63. Akaike, H. A new look at the statistical model identification. IEEE Trans. Autom. Control 1974, 19, 716–723. [Google Scholar] [CrossRef]
  64. Schwarz, G. Estimating the dimension of a model. Ann. Stat. 1978, 6, 461–464. [Google Scholar] [CrossRef]
  65. Crowther, T.W.; Glick, H.B.; Covey, K.R.; Bettigole, C.; Maynard, D.S.; Thomas, S.M.; Smith, J.R.; Hintler, G.; Duguid, M.C.; Amatulli, G. Mapping tree density at a global scale. Nature 2015, 525, 201–205. [Google Scholar] [CrossRef]
  66. Zhou, J.; Du, J.; Bonifácio, L.; Yin, W.; Huang, L.; Ning, J.; Han, D.; Hu, J.; Song, W.; Zhao, L. Vulnerability of Global Pine Forestry’s Carbon Sink to an Invasive Pathogen–Vector System. Glob. Change Biol. 2024, 30, e17614. [Google Scholar] [CrossRef]
  67. Xu, Q.-F.; Jiang, P.-K.; Wu, J.-S.; Zhou, G.-M.; Shen, R.-F.; Fuhrmann, J.J. Bamboo invasion of native broadleaf forest modified soil microbial communities and diversity. Biol. Invasions 2015, 17, 433–444. [Google Scholar] [CrossRef]
  68. Yang, C.; Ni, H.; Zhong, Z.; Zhang, X.; Bian, F. Changes in soil carbon pools and components induced by replacing secondary evergreen broadleaf forest with Moso bamboo plantations in subtropical China. Catena 2019, 180, 309–319. [Google Scholar] [CrossRef]
  69. Shao, S.; He, H.; Liang, C.; Chen, J.; Qin, H.; Wang, S.; Wang, Z.; Li, Y.; Jia, W.; Zheng, X. Moso bamboo expansion into a broadleaved forest alters the dominant soil organic carbon source. Eur. J. Soil Sci. 2023, 74, e13366. [Google Scholar] [CrossRef]
  70. Zu, K.; Wang, Z.; Zhu, X.; Lenoir, J.; Shrestha, N.; Lyu, T.; Luo, A.; Li, Y.; Ji, C.; Peng, S. Upward shift and elevational range contractions of subtropical mountain plants in response to climate change. Sci. Total Environ. 2021, 783, 146896. [Google Scholar] [CrossRef]
  71. Wang, Q.; Punchi-Manage, R.; Lu, Z.; Franklin, S.B.; Wang, Z.; Li, Y.; Chi, X.; Bao, D.; Guo, Y.; Lu, J. Effects of topography on structuring species assemblages in a subtropical forest. J. Plant Ecol. 2017, 10, 440–449. [Google Scholar] [CrossRef]
  72. Rudolph, G.; Schmidt, M.; Schmidt, M. Differential Geometry and Mathematical Physics; Springer: Berlin/Heidelberg, Germany, 2012. [Google Scholar]
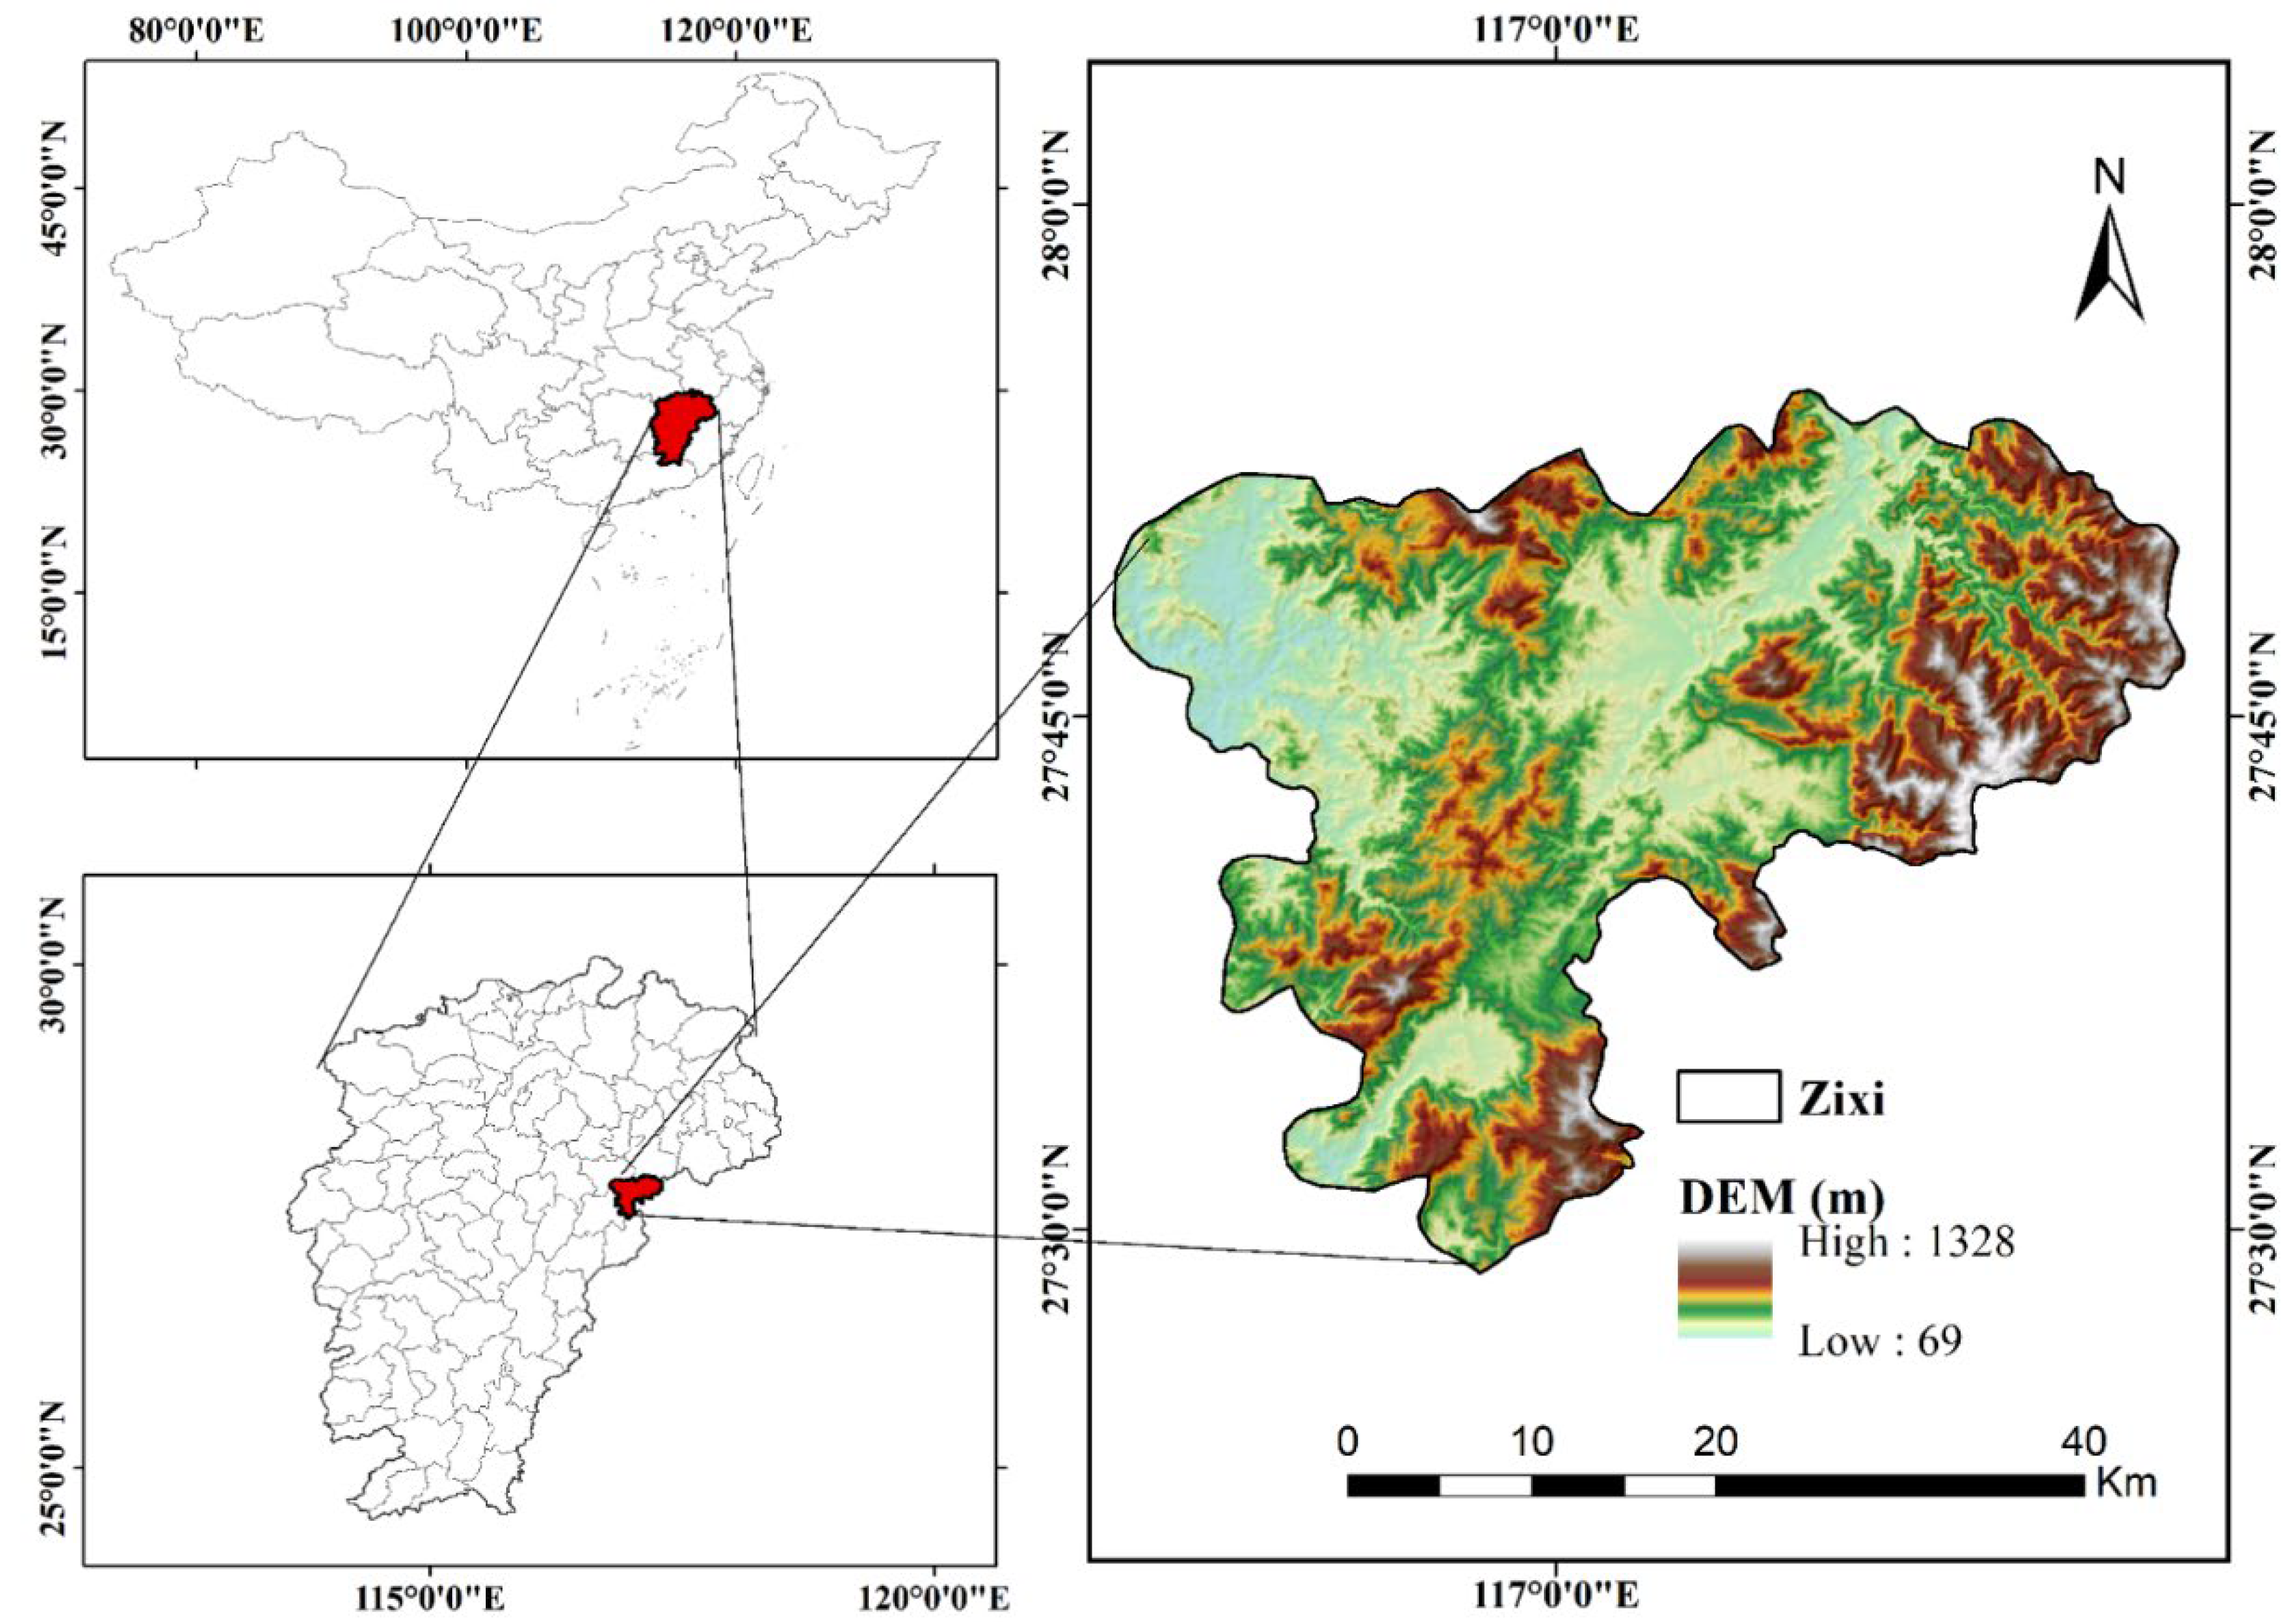
Figure 1. Geographical location of the case-study region.
Forests 16 01496 g001
Figure 2. Distribution of sample plots at decadal intervals from 1989 to 2019. The centre of each dot marks the plot centroid, and the dot colour indicates the forest carbon density of that plot, with darker colours representing higher values. The corresponding value ranges are shown in the legend on the (right). The method used to calculate the carbon density shown here is described in detail in Section 2.3 below.
Forests 16 01496 g002
Figure 3. Technical workflow for constructing the carbon-density surface using the HASM multi-source data-fusion method.
Forests 16 01496 g003
Figure 4. Schematic diagram of the meta-model of SEM jointly constructed from the principal environmental drivers, biotic drivers, and forest carbon stock examined in this study.
Forests 16 01496 g004
Figure 5. Spatial distribution of forest CD in 1989, 1999, 2009, and 2019. Note: Aboveground carbon density was generated using the HASM approach integrated with the XGBoost algorithm (Following method shown in Section 2.4). Each map depicts the estimated CD at high spatial resolution (90 m × 90 m). Colour gradients represent varying carbon density levels, with lighter yellow–green indicating lower densities and darker green to blue shades denoting higher carbon concentrations.
Forests 16 01496 g005
Figure 6. Temporal trends and changes in forest carbon density and species composition (1989–2019): (ae) Temporal changes in CD, derived from the spatial estimates in Figure 5; (a) distribution of carbon density ( M g / h a ) in 1989, 1999, 2009, and 2019; (b) box plot of carbon density from 1989 to 2019, highlighting changes in central tendency and variability; (ce) distribution of percentage changes in carbon density from 1989 to 1999, 1999 to 2009, and 2009 to 2019. (Note: colour coding indicates decreasing (light blue), no change (gray; defined as negligible change), and increasing (orange) carbon density across spatial units); (f) temporal changes in proportion of each tree species.
Forests 16 01496 g006
Table 1. Species-specific coefficients for estimating forest biomass carbon density *.
Forest Type a   ( M g / m 3 ) b   ( M g / h a ) c c
Abies sp.0.551948.8610.4999
Picea sp.0.551948.8610.5208
Tsuga sp.0.349139.8160.5022
Cryptomeria sp.0.349139.8160.5235
Keteleeria sp.0.349139.8160.4997
Larix sp.0.609633.8060.5211
Pinus koraiensis0.572316.4890.5113
Pinus sylvestris var. mongolica1.1122.69510.5223
Pinus tabuliformis0.8699.12120.5207
Pinus armandii0.585618.7440.5225
Pinus massoniana0.503420.5470.4596
Pinus yunnanensis0.503420.5470.5113
Cunninghamia lanceolata0.465219.1410.5201
Cupressus sp.0.88937.39650.5034
Quercus sp.1.14538.54730.5004
Betula sp.1.068710.2370.4914
Broad-leaved mixed forests0.97885.37640.4900
Cinnamomum sp.0.97885.37640.4916
Casuarina sp.0.74413.23770.4980
Populus sp.0.496926.9730.4956
Mixed hardwood forests1.17832.55850.4834
Mixed softwood forests0.625591.0010.4956
Mixed coniferous and broad-leaved forests0.813618.4660.4978
* a ( M g / m 3 ) and b ( M g / h a ) are parameters used in Equations (5) and (6), which are adopted from Fang et al. (2007) [33]. The c c values are used in Equation (6) and adopted from Li and Lei (2010) [47].
Disclaimer/Publisher’s Note: The statements, opinions and data contained in all publications are solely those of the individual author(s) and contributor(s) and not of MDPI and/or the editor(s). MDPI and/or the editor(s) disclaim responsibility for any injury to people or property resulting from any ideas, methods, instructions or products referred to in the content.