Article

Understanding the Spatial Distribution of Urban Forests in China Using Sentinel-2 Images with Google Earth Engine

1
Key Laboratory of Land Surface Pattern and Simulation, Institute of Geographic Sciences and Natural Resources Research, Chinese Academy of Sciences, Beijing 100101, China
2
College of Resource and Environment, University of Chinese Academy of Sciences, Beijing 100049, China
3
International College, University of Chinese Academy of Sciences, Beijing 100049, China
4
Department of Control Science and Engineering, Dalian Jiaotong University, Dalian 116028, China
*
Author to whom correspondence should be addressed.
Forests 2019, 10(9), 729; https://doi.org/10.3390/f10090729
Submission received: 15 July 2019 / Revised: 20 August 2019 / Accepted: 21 August 2019 / Published: 25 August 2019
(This article belongs to the Section Forest Inventory, Modeling and Remote Sensing)

Abstract

:
Urban forests are vitally important for sustainable urban development and the well-being of urban residents. However, there is, as yet, no country-level urban forest spatial dataset of sufficient quality for the scientific management of, and correlative studies on, urban forests in China. At present, China attaches great importance to the construction of urban forests, and it is necessary to map a high-resolution and high-accuracy dataset of urban forests in China. The open-access Sentinel images and the Google Earth Engine platform provide a significant opportunity for the realization of this work. This study used eight bands (B2–B8, B11) and three indices of Sentinel-2 in 2016 to map the urban forests of China using the Random Forest machine learning algorithms at the pixel scale with the support of Google Earth Engine (GEE). The 7317 sample points for training and testing were collected from field visits and very high resolution images from Google Earth. The overall accuracy, producer’s accuracy of urban forest, and user’s accuracy of urban forest assessed by independent validation samples in this study were 92.30%, 92.27%, and 92.18%, respectively. In 2016, the percentage of urban forest cover was 19.2%. Nearly half of the cities had an urban forest cover between 10% and 20%, and the average percentage of large cities whose urban populations were over 5 million was 24.8%. Cities with less than half of the average were mainly distributed in northern and western parts of China, which should be focused on in urban greening planning.

1. Introduction

Between 1980 and 2018, the proportion of China’s urban population increased from 19.4% to 59.6% [1,2], the rapidity of which has led to many urban problems, such as reduced biodiversity within cities [3], deterioration of air quality [4], and the heat island effect [5]. Against this background, urban forests have attracted widespread attention from the government and academic scholars because of their important ecological functions [6], such as in mitigating biodiversity loss [7,8], absorbing air pollutants [9,10], and reducing the urban heat island effect [11,12]. In addition, due to their shading, leisure, and entertainment functions, urban forests are closely related to the well-being of urban residents [6,13,14]. Urban forests are defined as all woodlands, groups of trees, and individual trees located in urban areas, including forests, trees in parks, gardens, commercial areas, and dwelling districts, and street trees, according to the Food and Agriculture Organization (FAO) [15].
It has raised concerns about protecting and increasing the urban forests around the world: The theme of the International Day of Forests in 2018 was “Forests and Sustainable Cities” [6]. In China, the government launched the evaluation of a “National Forest City” in 2004 [16] and put forward the requirements for the percentages of urban forest cover (more than 30% in Northern cities and 40% in Southern cities) [17]; in addition, the China Urban Forest Forum is held every year. However, there is an insufficient understanding of urban forest cover across the country, due to a lack of high-resolution spatial data on urban forests. This has presented difficulties in formulating policies related to urban forests.
Much effort has been made in measuring urban forest cover; for example, field surveys [18], remote sensing [19,20,21,22], and drone shooting [23] have all been used to gain information on urban forest cover. Among them, remote sensing is efficient and useful in mapping forested urban areas for large scale-maps: Canetti et al. [21] used RapidEye and Satellite for observation of Earth (SPOT 5) images to quantify multi-temporal urban forest cover in Araucaria (a city in Brazil), based on the support vector machine algorithms; Chen et al. [24] drew the urban green space in the neighborhoods of five Chinese megacities using Google Earth images with the spatial resolution of 0.26 m; Fan et al. [22] quantified the tree canopy of Cook County in the United States, using multispectral images with the spatial resolution of 1 m from the National Agriculture Imagery Program and Light Detecting and Ranging data. However, these explorations mainly focus on a single city, and there are, at present, no data on Chinese urban forest cover with a high spatial resolution at the national scale. The production of such maps is therefore imperative. It does, however, raise four main problems, which should be considered. The first is to identify the urban areas across China using a uniform definition; at present, there is no unified concept as to what constitutes an urban area [25]. Urban areas can be defined as urban places, urbanized areas, or metropolitan areas. It is very important to select an appropriate standard to extract national urban areas so that different cities can be compared. The second problem relates to the requirement for high resolution images when detecting land cover within urban areas. The third is appropriate image selection, which should ensure optimal national images with minimal cloud cover [26], because cloudy and rainy weather conditions result in difficulties in obtaining acceptable images, especially in southern regions. The fourth is to establish a good enough classifier for urban forest extraction.
To address the first problem, there are two methods: The first, is to extract urban areas using an appropriate threshold of nighttime lighting images [27], and the second, is to extract urban central regions based on points of interest (POIs) [28]. However, urban areas are often overe-stimated, because of the overflow effect of nighttime light, and the urban forest cover in urban residents’ living spaces cannot be detected. As a result, this study used the urban areas, extracted from POIs by Song et al. [28], which possess dense human and socioeconomic activity. For the second one, data from the Sentinel-2A satellite launched on 23 June 2015 can be used; the satellite increased the spatial resolution of freely available remote sensing images to 10 m [29], and permitted the detection of land cover within China’s urban areas. Finally, the Google Earth Engine (GEE, https://earthengine.google.com) was used to confront the third and fourth problems. GEE is a high-performance cloud computing platform with a convenient, fast image selection process and large computing power [30], providing different classifiers. Therefore, the parameters and bands selection of the model can be timely adjusted, according to the calculation results. Several studies have used GEE to produce long-time series or large-scale land cover maps. Using GEE, Huang [31] mapped major land cover dynamics in Beijing in 1985–2015, Liu [26] extracted global urban land for the period 1990–2010, Wang [32] tracked the annual changes of coastal tidal flats in China with Landsat images, and Chen [33] produced a mangrove forest map of China in 2015 with Sentinel-1A images. The emergence of the GEE platform makes it possible to quickly and efficiently map urban forest data across China [34].
The objectives of this study are to: (1) Identify urban forests using Sentinel-2 images and GEE and evaluate its accuracy, and (2) assess the spatial distribution of urban forests across China.

2. Materials and Methods
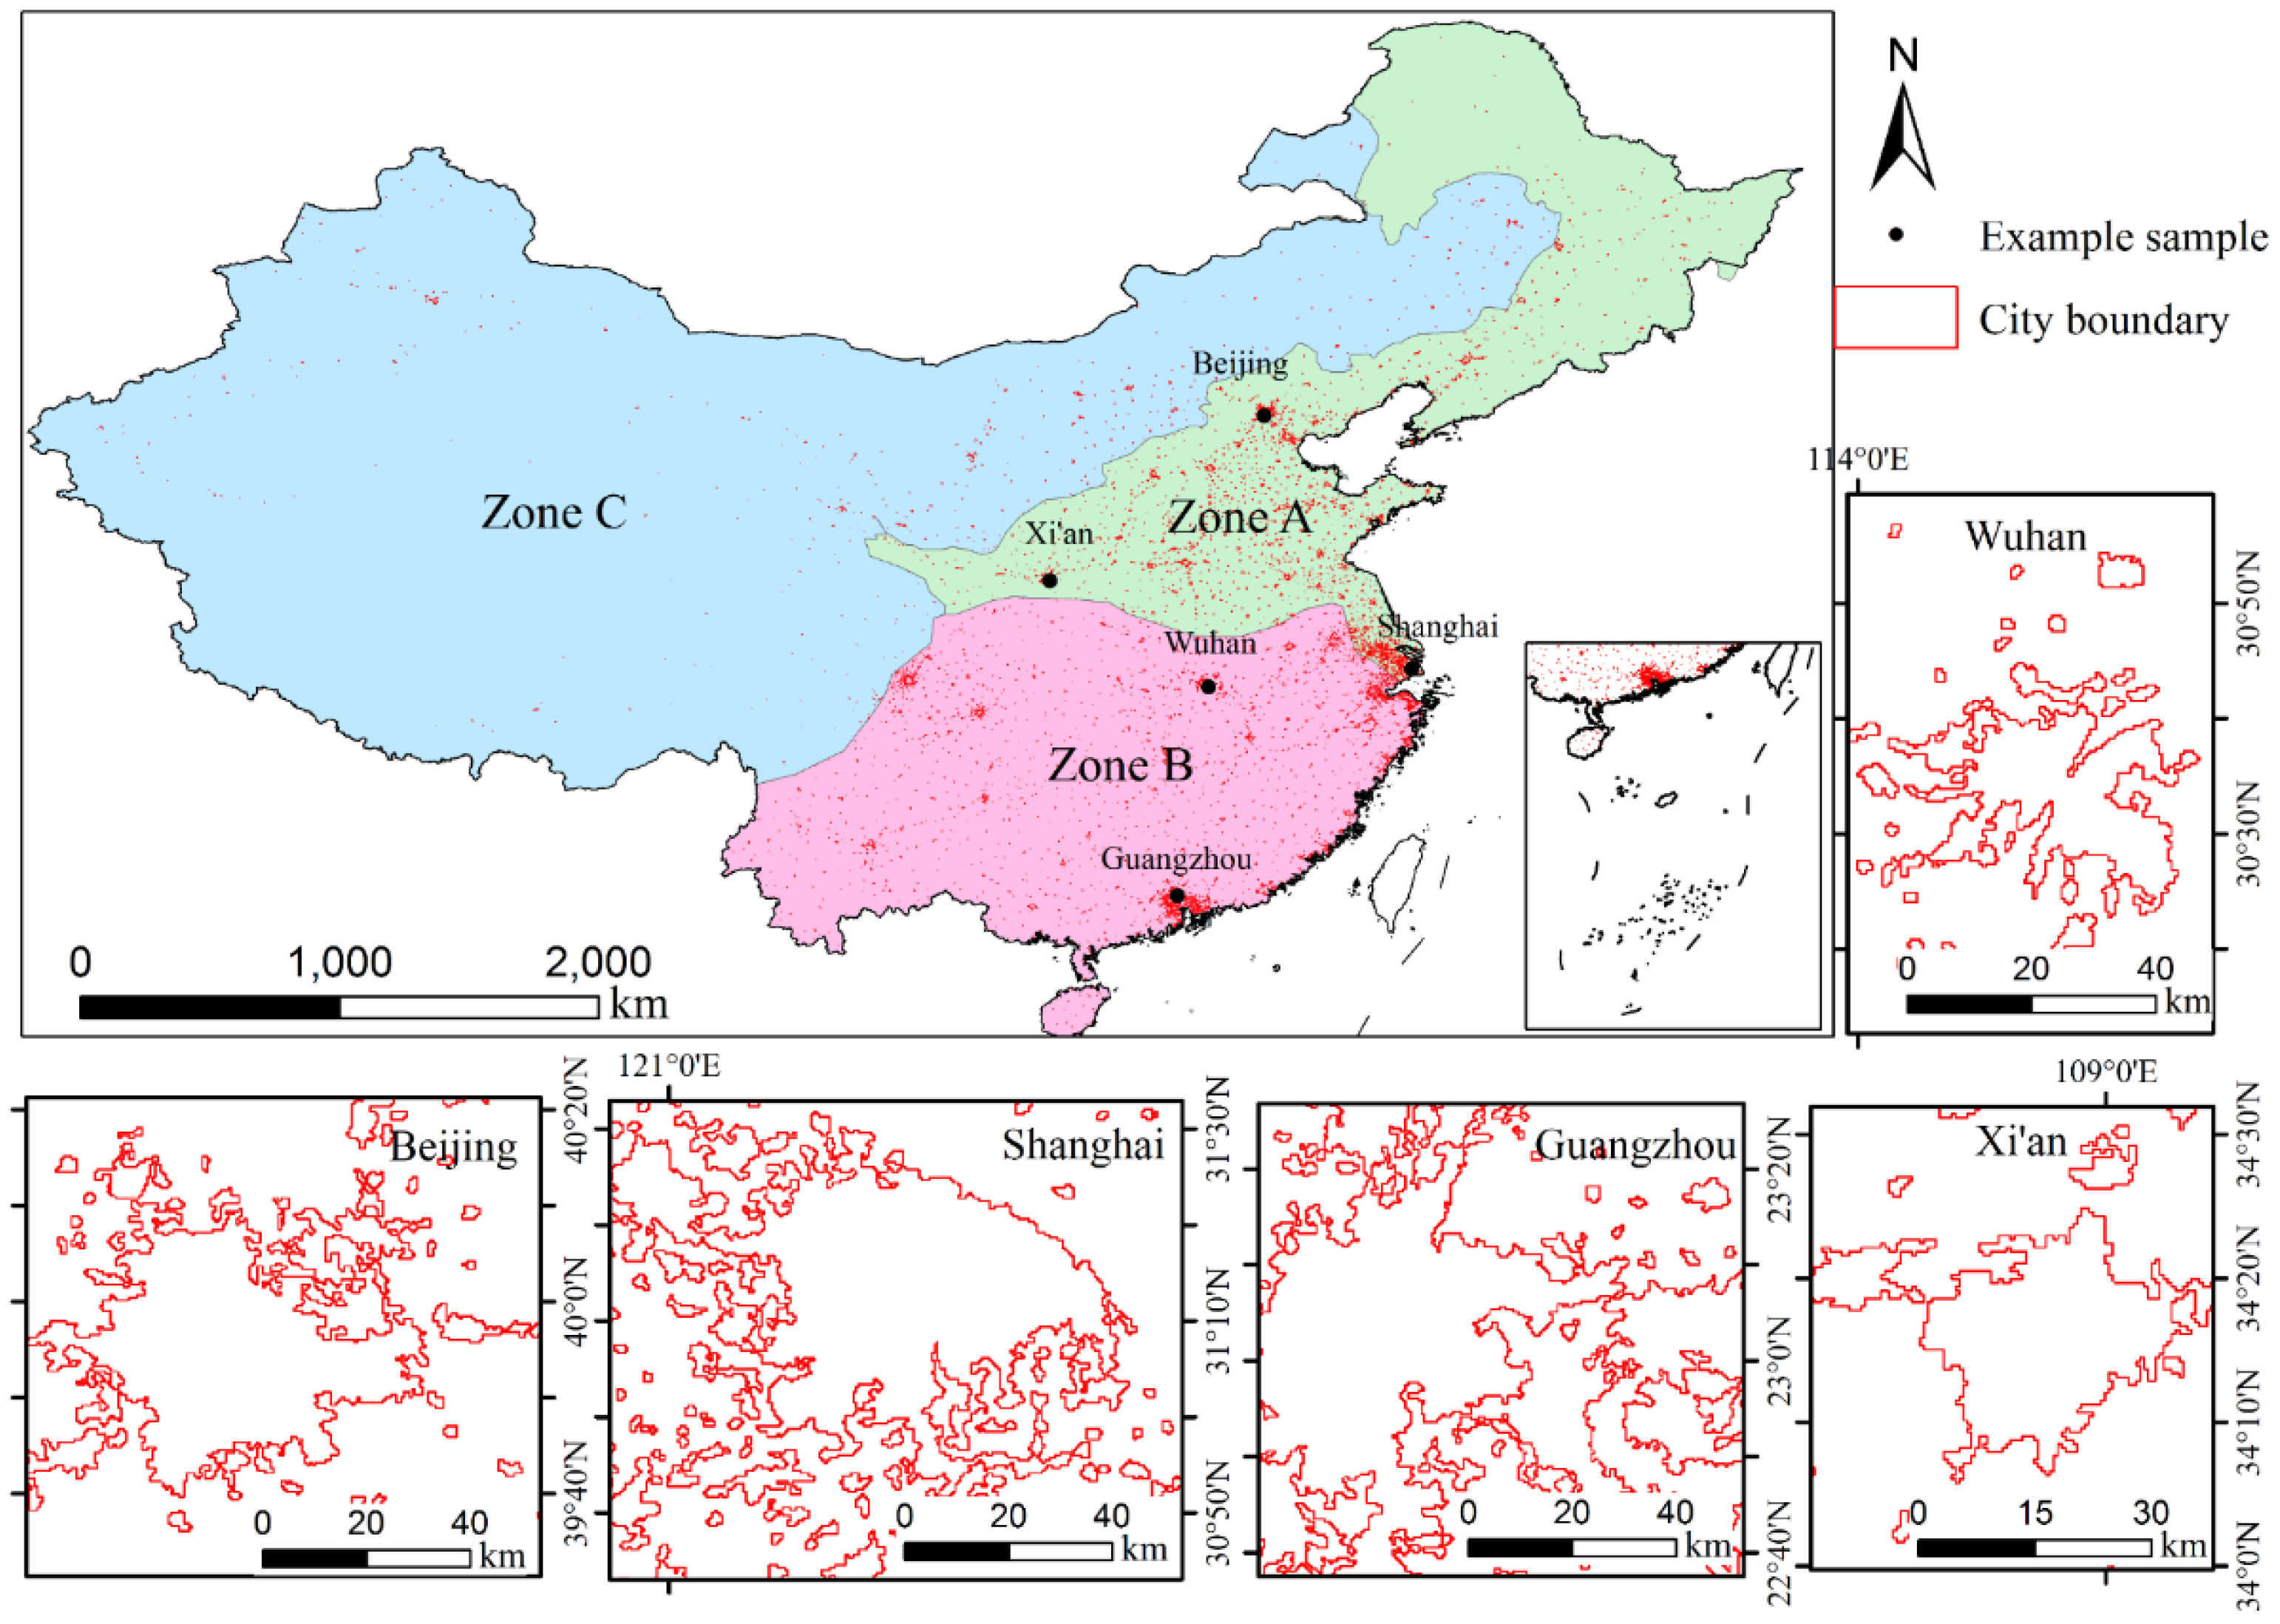
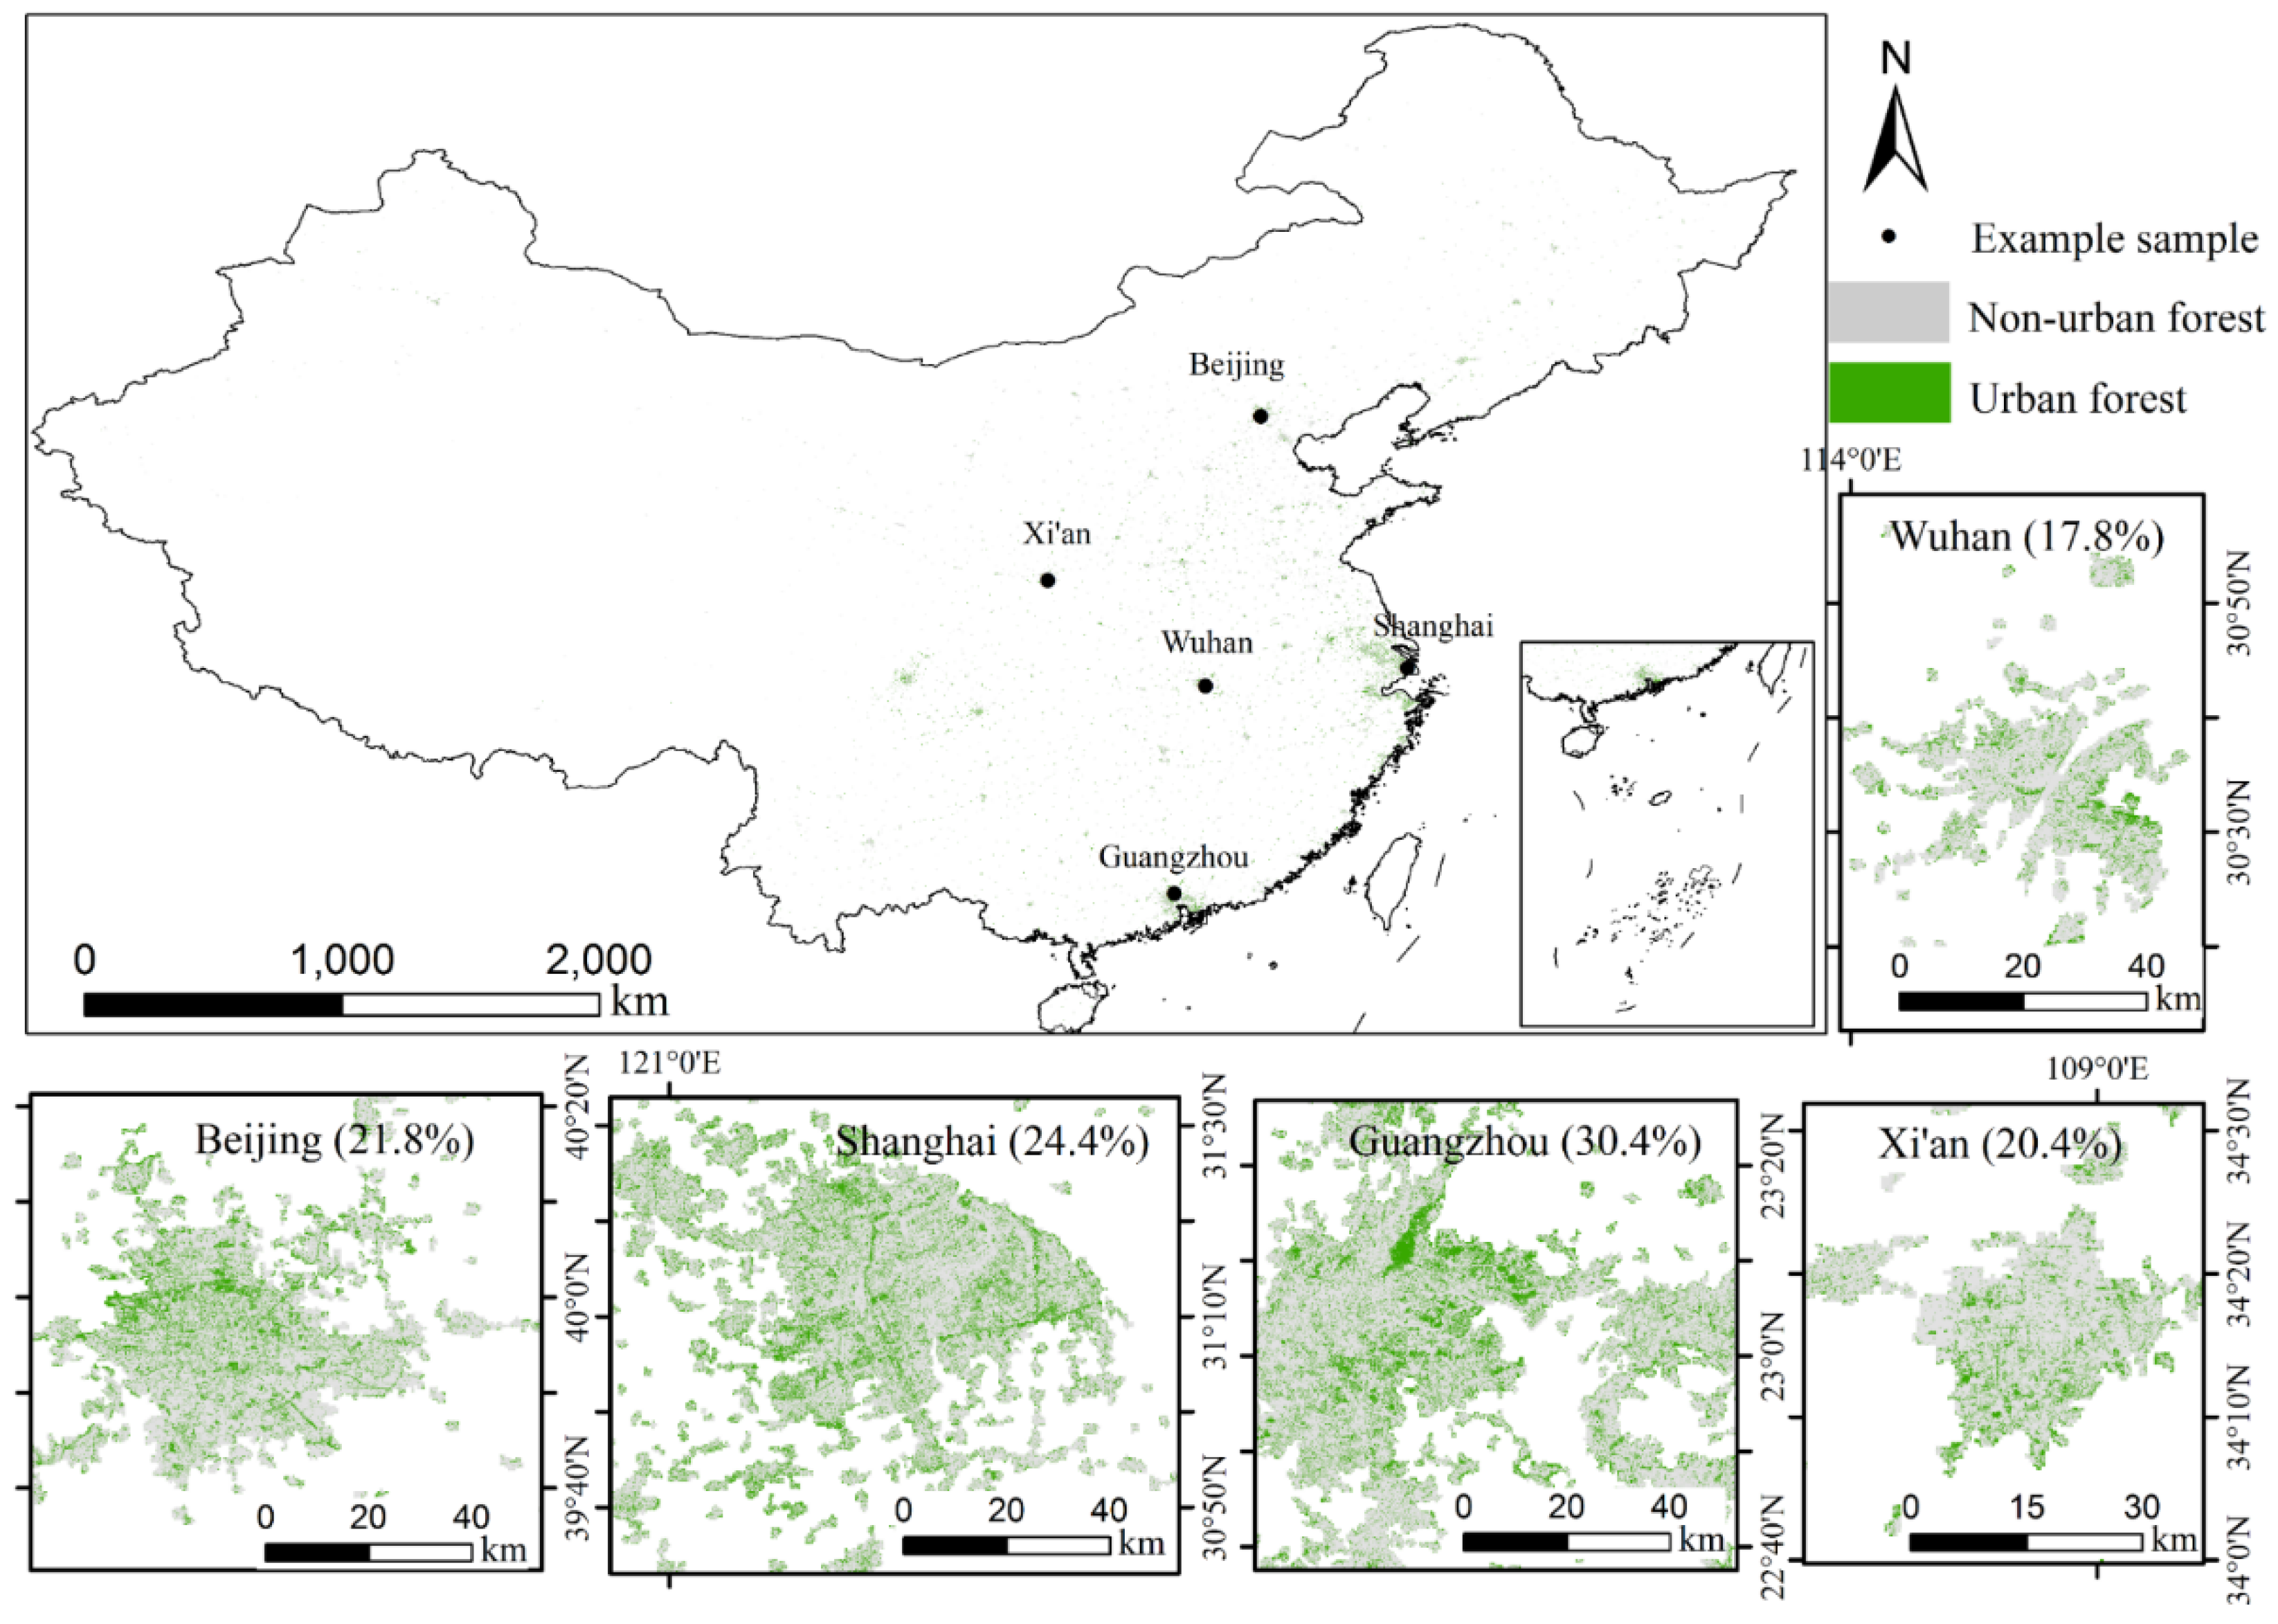
2.1. Study Area

The study was conducted in China’s urban areas (expect Hong Kong, Macau, and Taiwan) in 2016, extracted by Song (Figure 1). According to Song, the urban areas in this study are defined as real, and closely connected urban regions, with dense populations and active human activities [28]. Song used POIs [35], which are accurate locations of urban infrastructure, such as schools, hospitals, hotels, and the industry. He set a POI density of over 50 points/km2 as the threshold of the boundary of the urban area to capture the regions with human and socio-economic activity. Figure 1 shows China’s urban areas mainly distributed in the eastern and southern regions, and the total area in 2016 was 73,200 km2. There were 31 provincial-level regions and 334 prefecture-level divisions in Mainland China in 2016.
In this study, the entire country has been divided into three zones, zones A, B, and C, according to their respective amounts of precipitation (various weather conditions across China affect image selection). Different colors in Figure 1 present the divisions of zones A, B, and C. Zone A is the northern part of China, located between the isohyet of 400 mm and 800 mm; zone B is in the south of the isohyet of 800 mm; and zone C comprises the northwestern part and Qinghai-Tibet Plateau, where the precipitation was below the isohyet of 400 mm in 2016. Their average daily precipitation in growing season (from April to September) were respectively, 2.6 mm, 7.5 mm, and 1.1 mm, and the average daily temperature were 10.4 °C, 19.3 °C, and 10.1 °C [36], respectively. These three zones are different in, not only natural conditions, but also urban development. There were 32,400 km2 of urban area in 2016 in zone A, with 204.7 million in the urban population. Zone B had the largest urban area of 35,900 km2, and an urban population of 243.7 million. Zone Chad had an urban area of 4900 km2 and only an urban population of 28.7 million [37], which were far lower than zone A and B.

2.2. Data

2.2.1. Sentinel-2 Images and Preprocessing

Sentinel-2 is a wide-swath, high resolution, and multi-spectral imaging mission, covering latitude 56° south to 84° north, with a revisit period of 10 days at the equator with one satellite, and five days with two satellites since 2017 and 2–3 days, at mid-latitudes. The Level 1C dataset has been processed with radiometric and geometric corrections, including orthogonal rectification and spatial registration on a global reference system, with sub-pixel accuracy [29], and is available from the Google Earth Engine (GEE) image collection. Evidently, China’s regional climate conditions vary greatly due to its large geographical area. At the time of the growing season of trees in the northern regions, we selected Sentinel-2 Level 1C images, from 1 April 2016 to 31 September 2016 for zones A and C. However, the images from 1 April 2016 to 31 September 2017 were selected for zone B, because it was difficult to meet the quality requirements for the images because of the abundant rainfall and clouds during April and October. An atmospheric correction (quality band (QA60) from Sentinel-2 in GEE) was applied to mask the clouds and to select optimal images with minimal cloud cover.

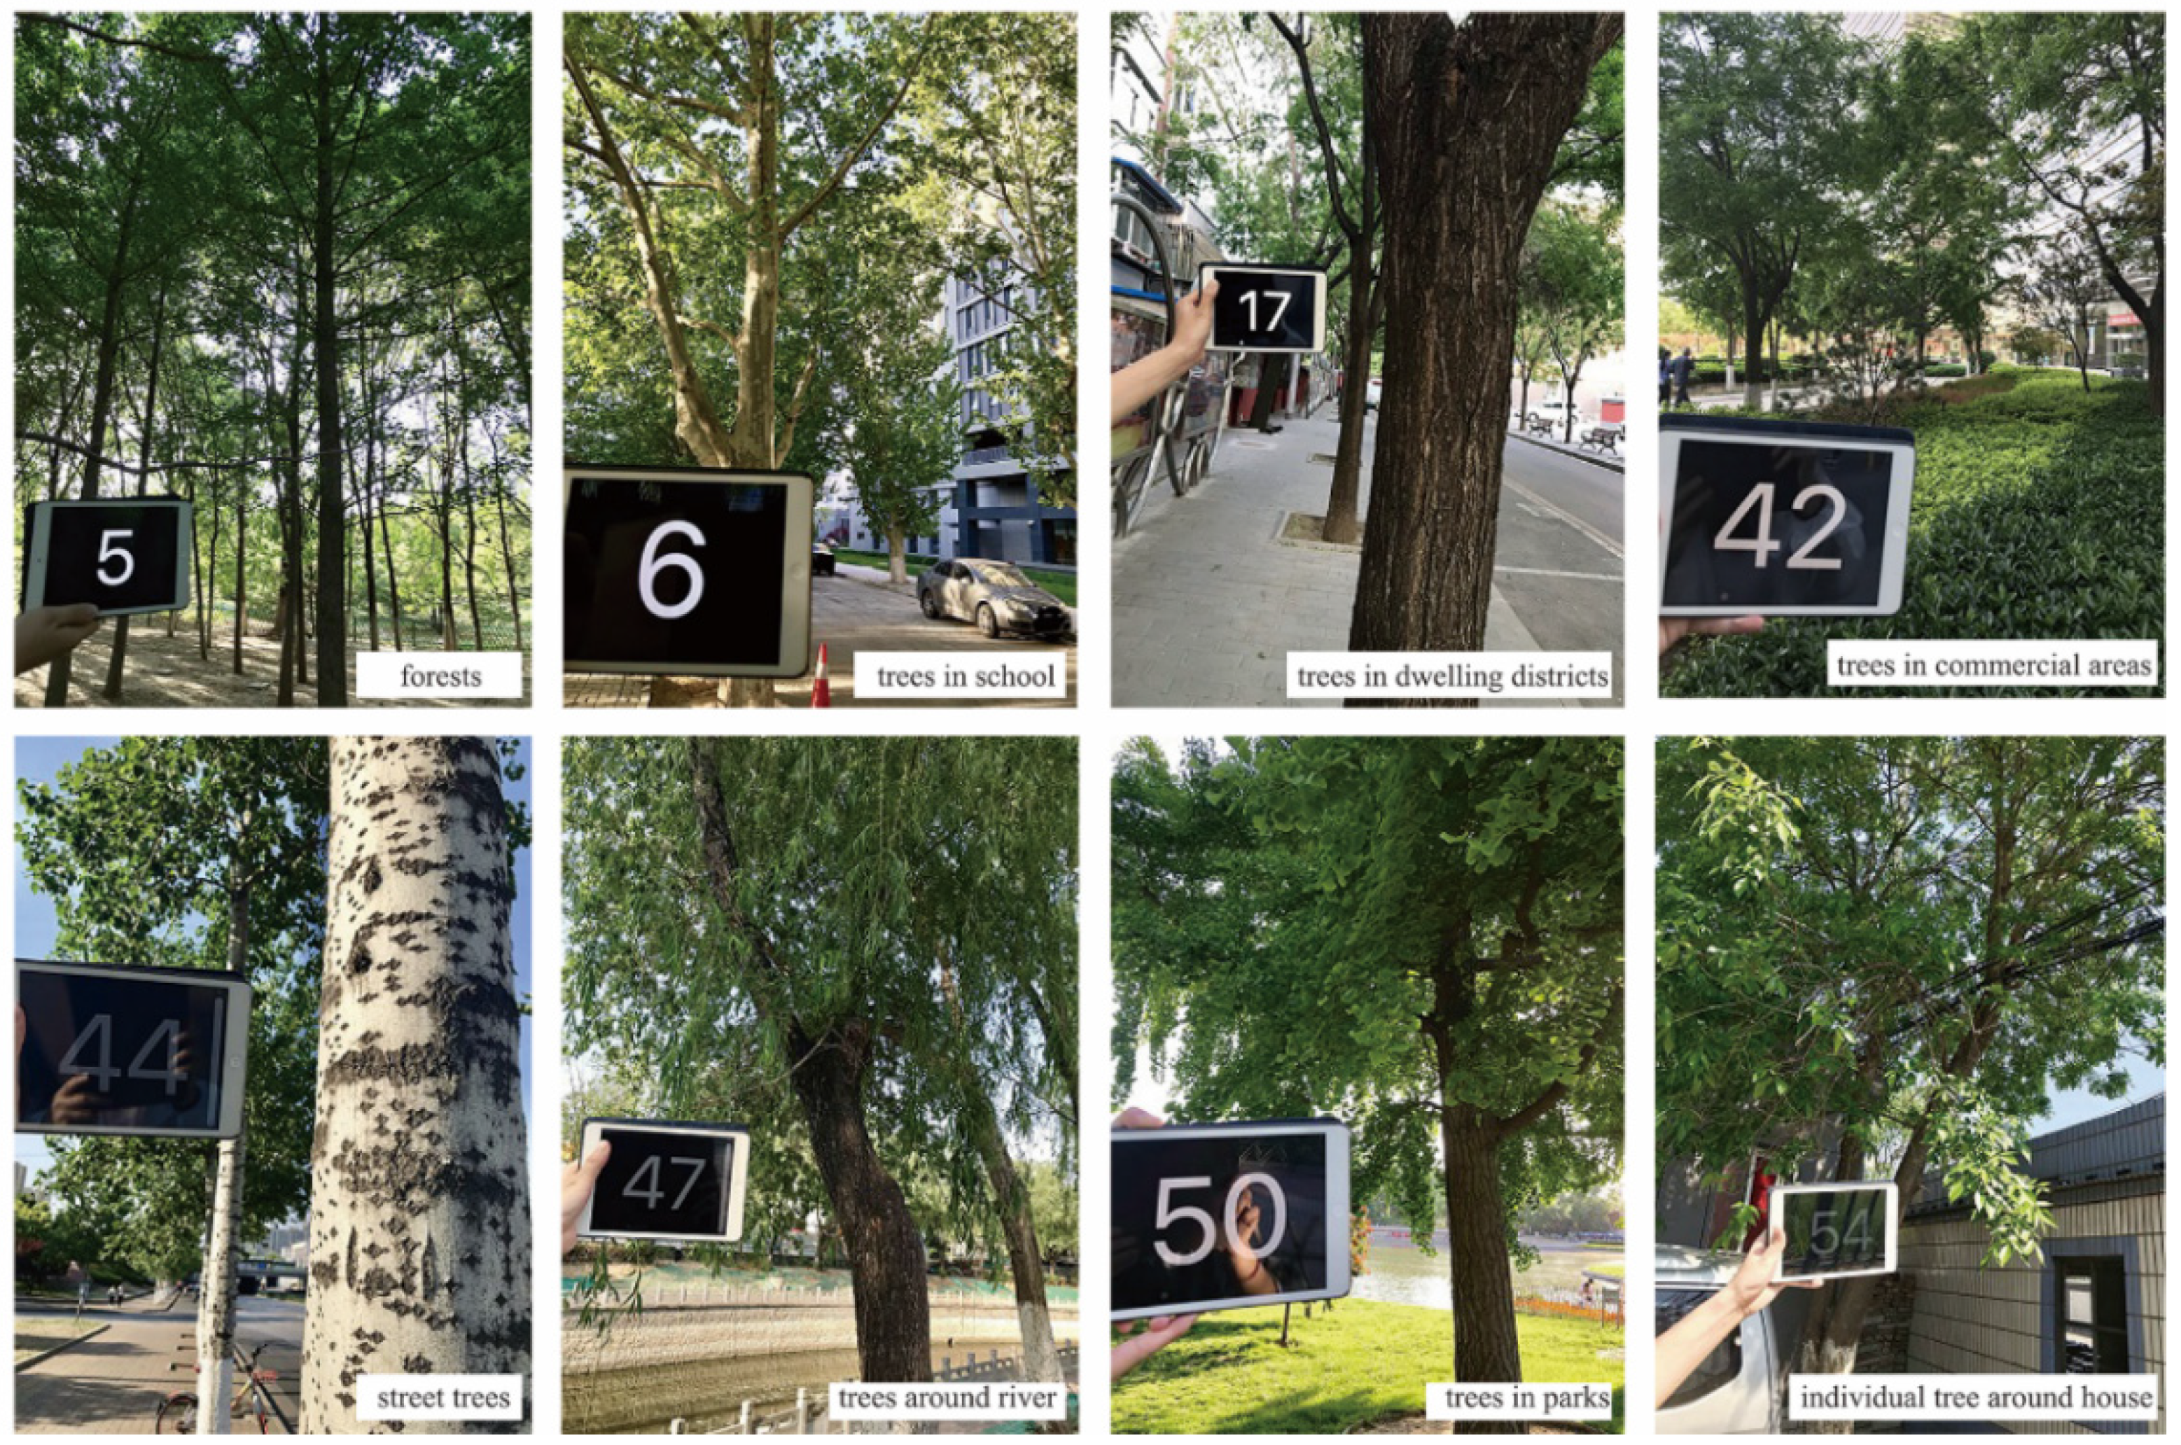
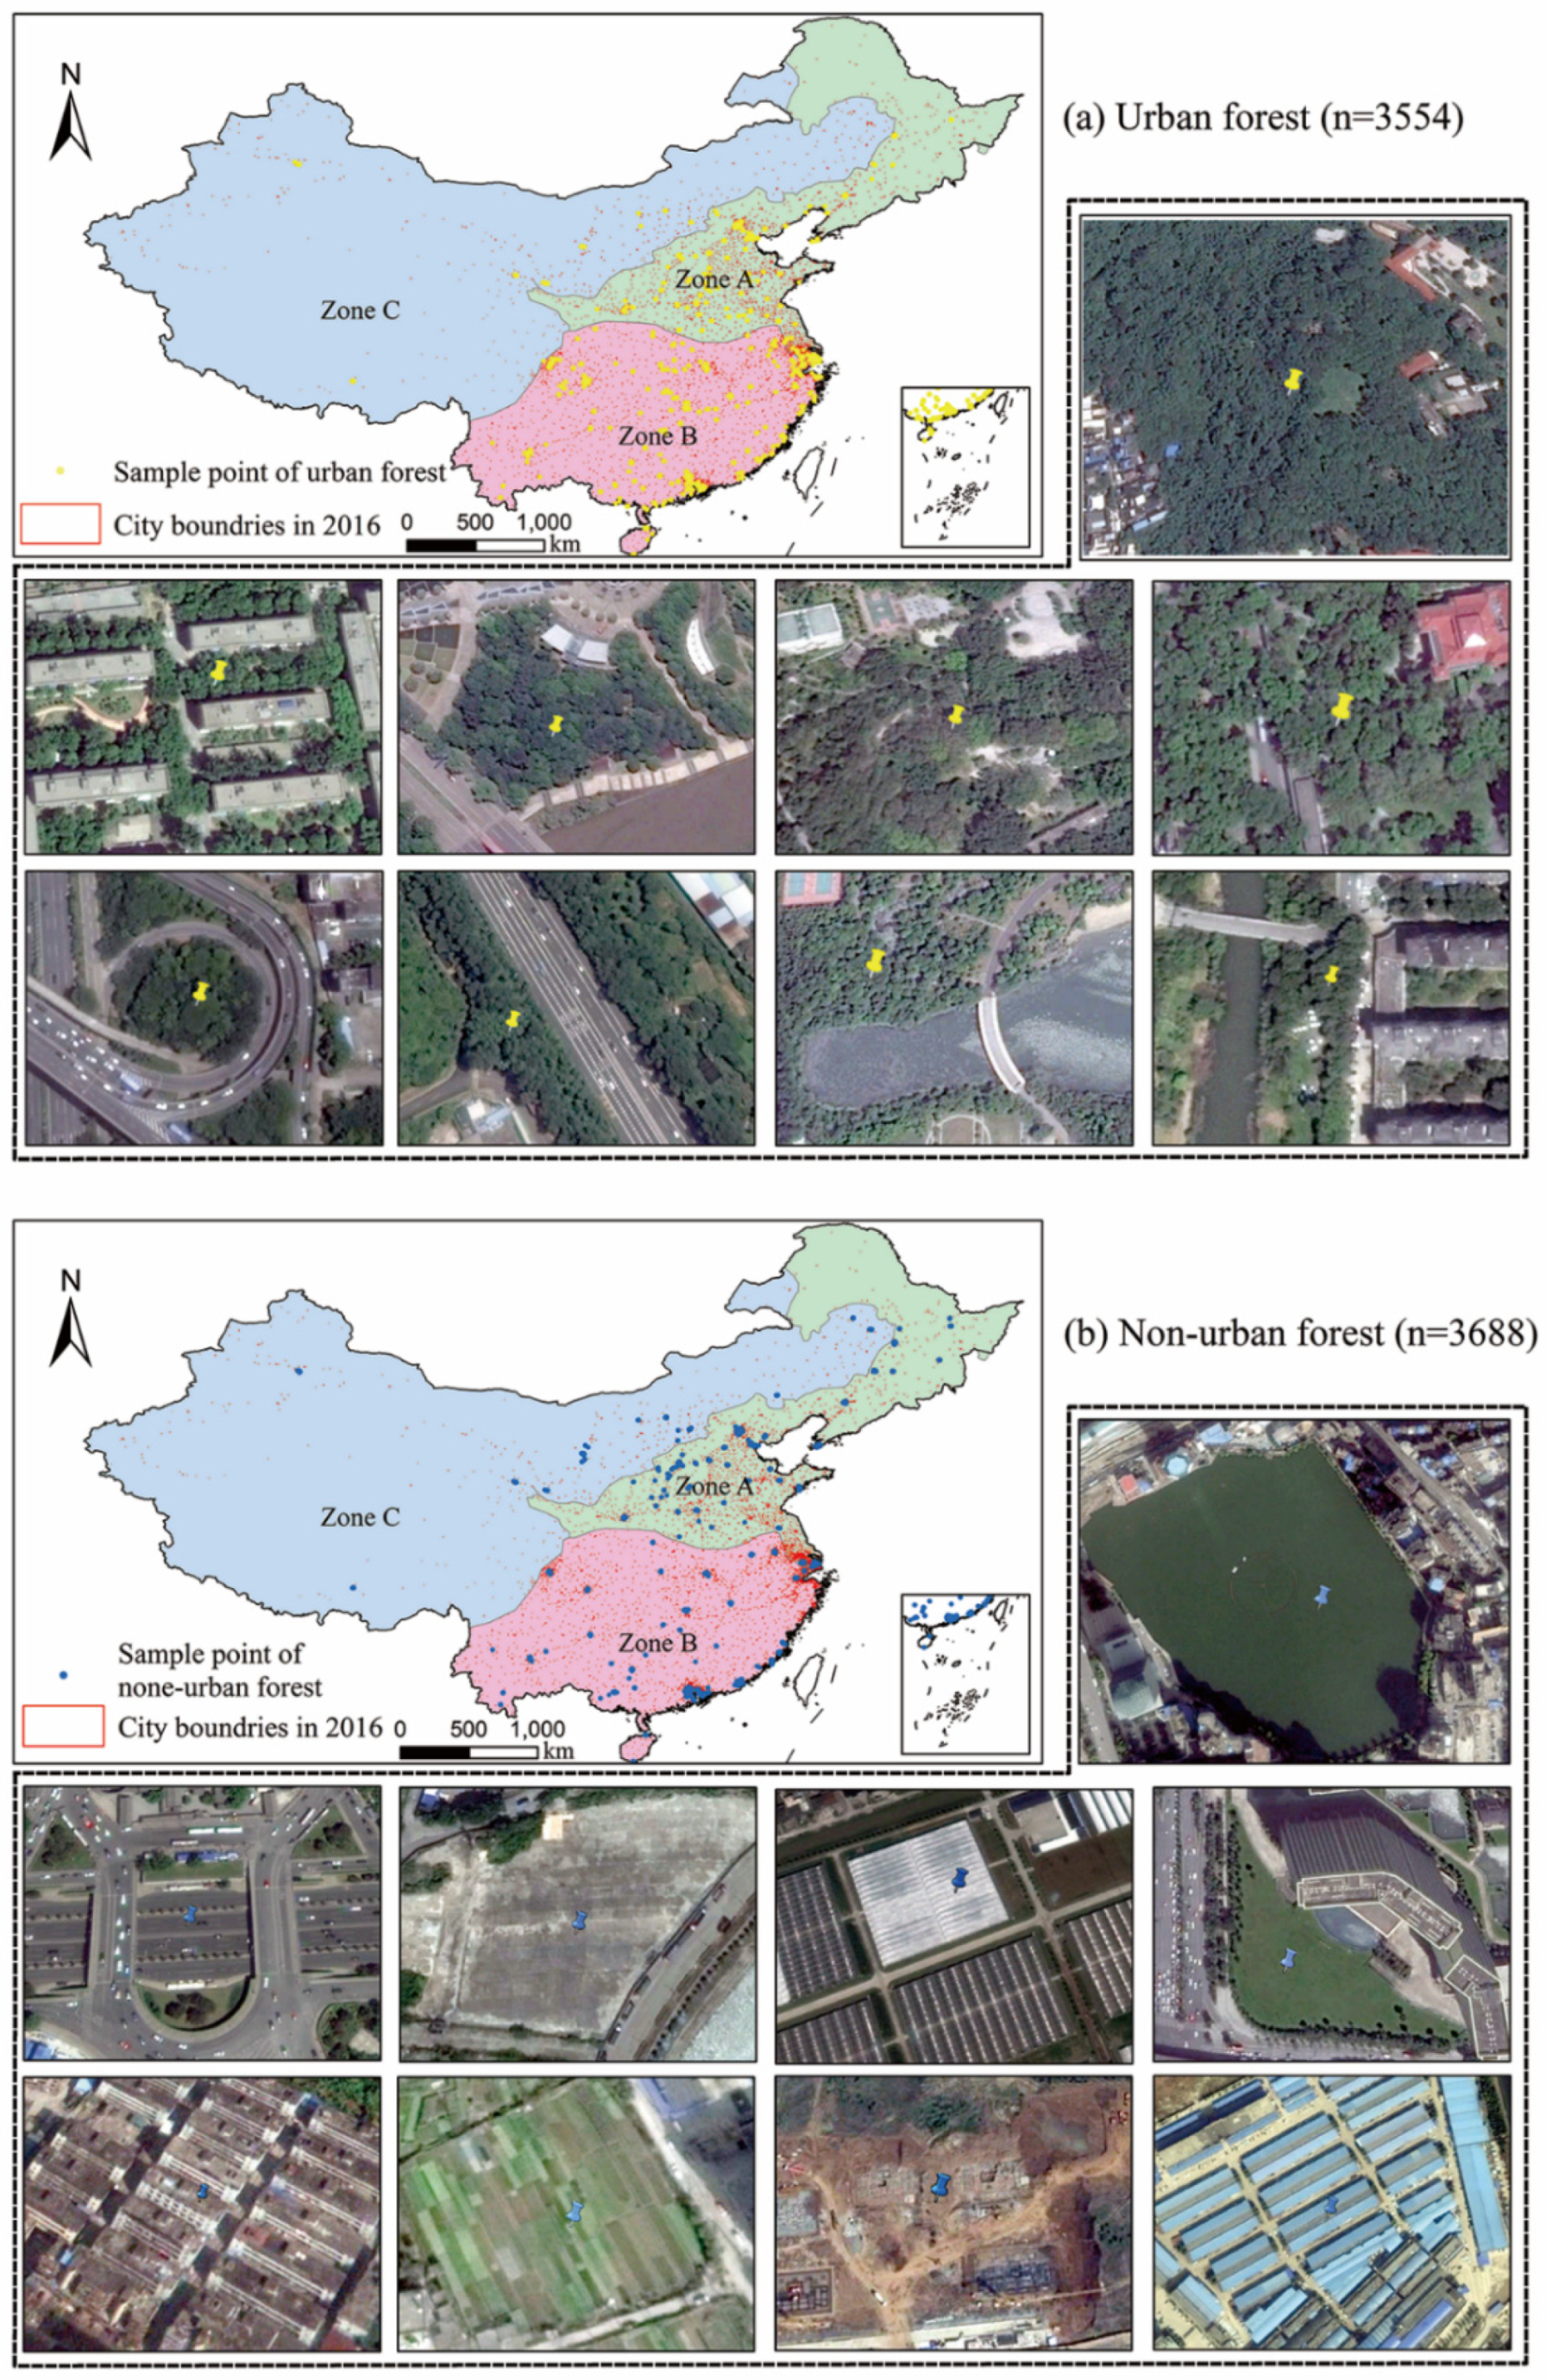
2.2.2. Sample Points for Training and Validation

Training and validation data were collected from two sources: Ground data from field visits and very high-resolution (VHR) images from Google Earth (GE).
A total of 75 ground sample points for urban forests were collected in May, including forests, trees in schools, dwelling districts, commercial areas and parks, trees around rivers, street trees, trees around houses: Sample points, covering all kinds of urban trees, based on the definition of urban forests. The field photos (Figure 2) were taken to show the different kinds of ground samples for urban forests, with the locations (the latitude and longitude) recorded for the validation; all these samples had a distance of at least one kilometer from one another to avoid spatial auto-correlation [34].
A number of sample points (7242) from VHR images were obtained in GE, covering 3554 samples of all kinds of urban forests, as in Figure 3a, and 3688 samples of non-urban forests were obtained, as in Figure 3b (including buildings, roads, water, grassland, bare land, and cropland). These sample points were evenly distributed across all the urban areas of China, the number being able to stabilize the classification accuracy by verification. For some areas, which had no high-quality images in GE, from 1 April to 31 September 2016, we selected the unchanged areas as sample points, based on a comparison of the two years before, and after, 2016 to ensure a robust spatial distribution and quality of sample points.
Then, 70% of the VHR sample points were used to gather knowledge and train the classifier in GEE, and 30% of the VHR sample points and all the ground sample points were used as validation data to test the classification results and provide the overall accuracy (OA), producer’s accuracy (PA), user’s accuracy (UA), and the Kappa coefficient. A Kappa value, that is higher than 0.8, represents strong agreement between the classification result and the reference distribution [38].

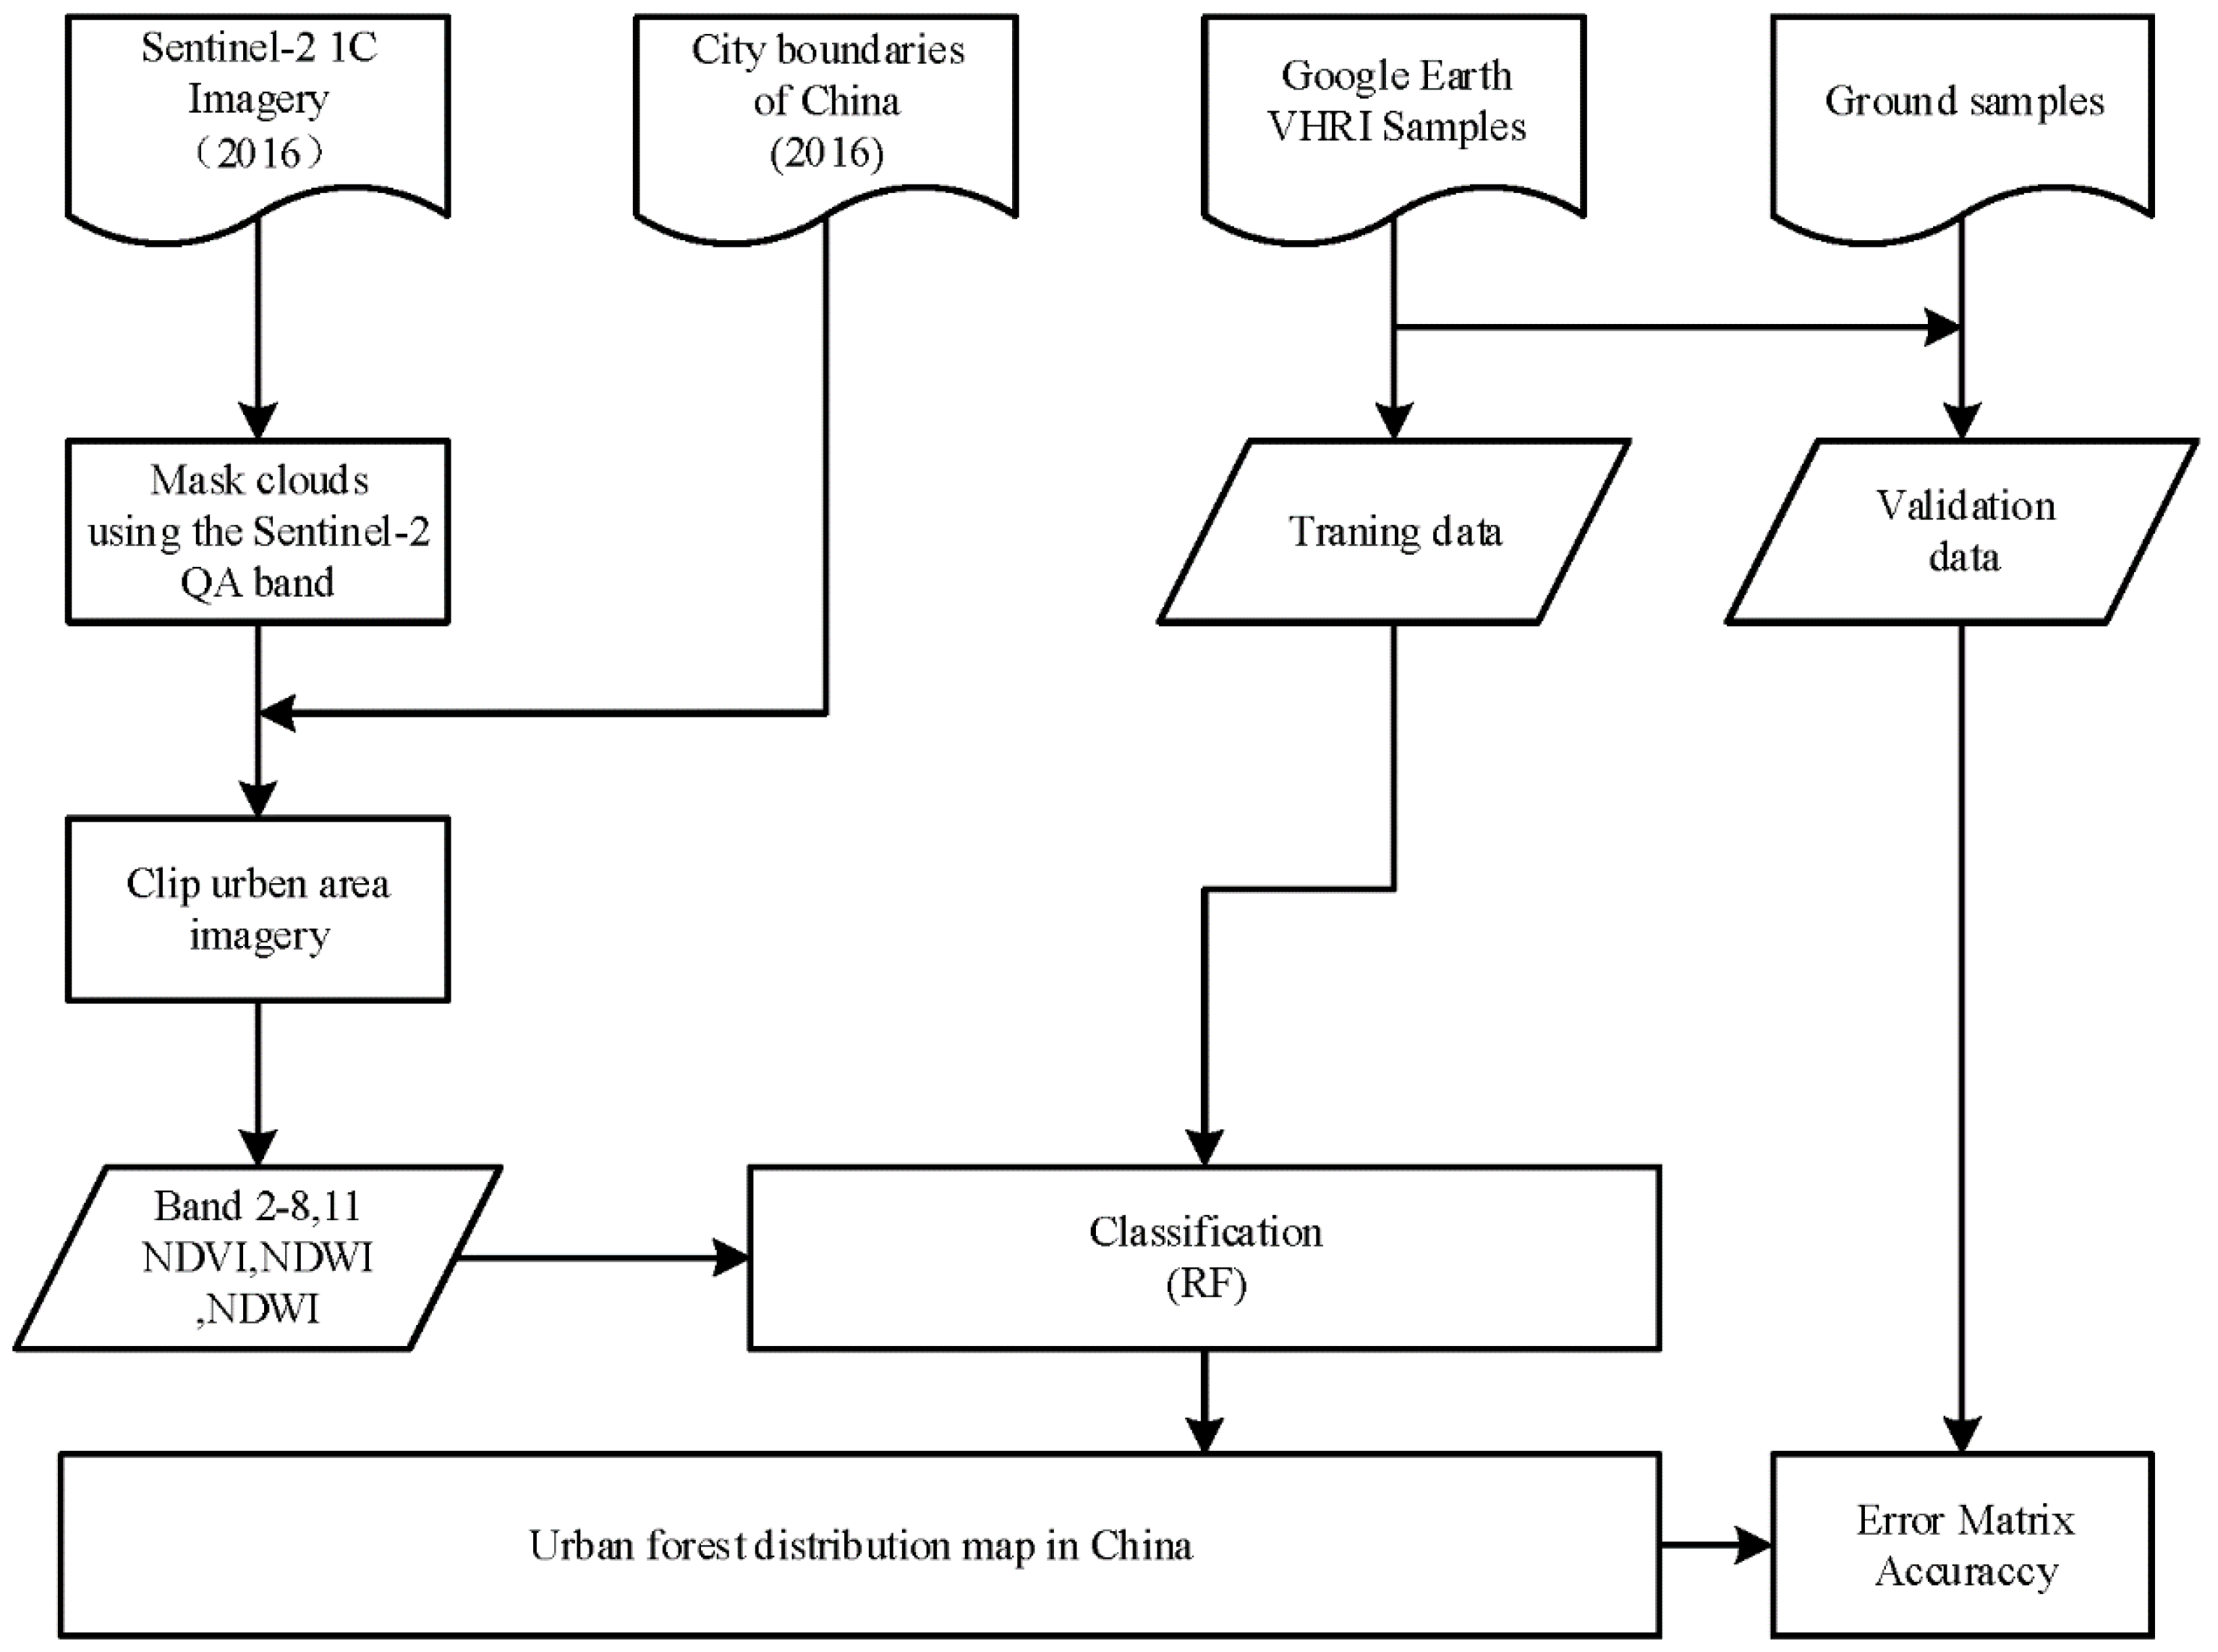
2.3. Urban Forest Mapping Classifier

Based on the bands of Sentinel-2 images, we used the Random Forest (RF) algorithm as a classifier to extract urban forests on the GEE platform, with the indexes of the Normalized Difference Vegetation Index (NDVI), the Normalized Difference Water Index (NDWI), and the Normalized Difference Built-up Index (NDBI) as supplementary information for classification. The process is shown in Figure 4, comprising the following steps:
  • We used the city boundaries of China in 2016 to extract urban area images from Sentinel-2 images, in order to select and train sample points within urban areas for higher accuracy and lower external impact.
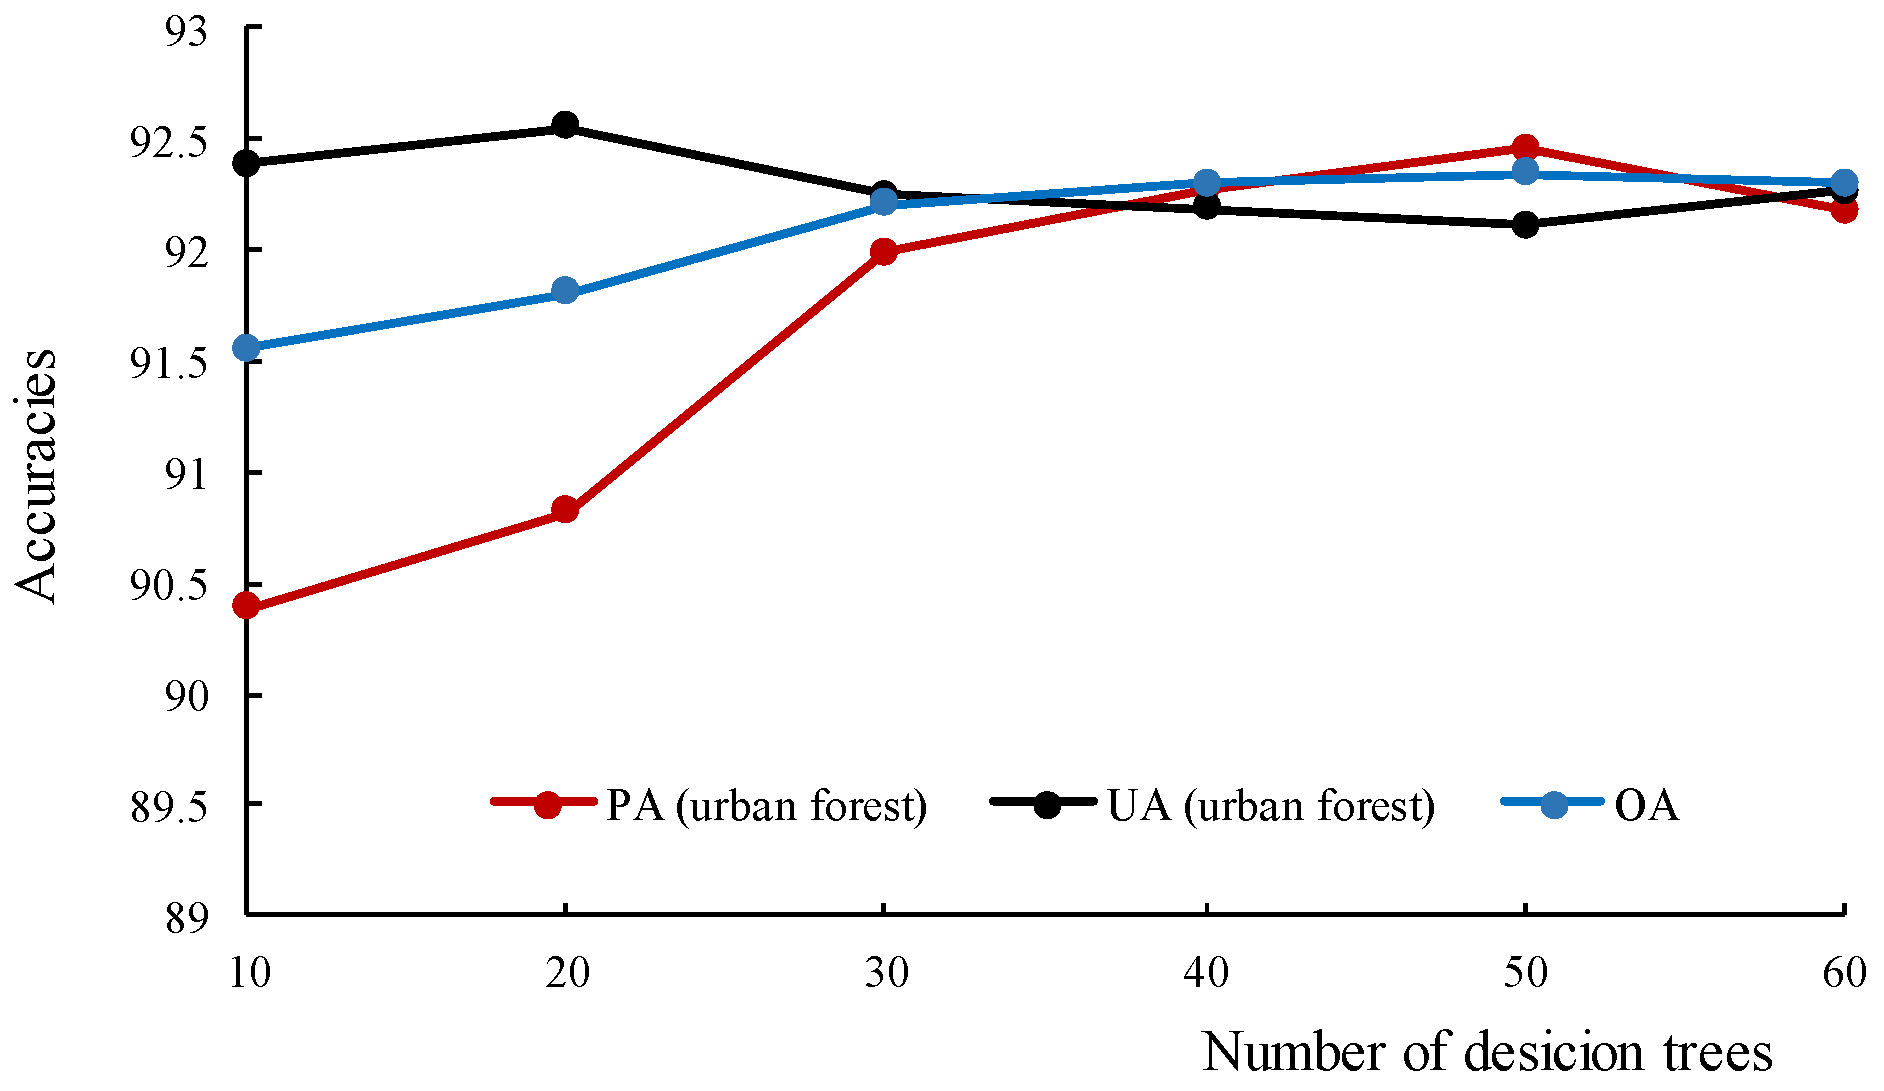
  • We used an RF classifier to gather knowledge based on training data. The RF classifier is conducive to mapping land cover by mitigating the influence of data noise and overfitting [31,39,40]. It is a non-parametric machine learning method, used to construct multiple random decision trees, each of them possessing several nodes to divide the input pixels into different classes until each node represents every class [41,42]. Comparing the RF classifier with other classifiers, such as “maximum likelihood and single decision trees,” the RF can process higher data dimensions and attain a higher accuracy [34]. Furthermore, it has several tuning parameters, which can affect the efficiency and accuracy of the classification. In this study, these parameters were set by trial and error (Table 1), and by considering accuracy and computing efficiency. As seen in Figure 5, the PA for urban forests and OA increased significantly as the number of decision trees added was below 50; the overall trend of UA for urban forests generally decreased. We also considered the computational efficiency, choosing 40 as the optimum number.
  • Suitable bands of Sentinel-2 images were selected to train the RF classifier. In this study, the data input into the RF model included Sentinel bands (B2-B8, B11), NDVI, NDWI, and NDBI [26]. These bands and band combinations achieved the highest accuracy, when compared with other combinations (Table 2). For example, the OA based on these bands (B2-B8, B11) can increase 0.2%, compared with all bands of Sentinel-2 with 10 and 20 m resolution. Among them, NDVI is a vegetation index, that monitors the condition of vegetation [43]; NDWI is sensitive to water bodies [44]; and NDBI can help to extract built-up features [45]. They have been widely used to identify specific classes and as Supplementary Materials for extracting urban forests in this study. The NDVI, NDWI, and NDBI of the Sentinel images were calculated using the Sentinel bands according to the following equations:
    N D V I = N I R b a n d 8 R E D b a n d 4 N I R b a n d 8 + R E D b a n d 4 ,
    N D W I = G r e e n b a n d 3 N I R b a n d 8 G r e e n b a n d 3 + N I R b a n d 8 ,
    N D B I = S W I R b a n d 11 N I R b a n d 8 S W I R b a n d 11 + N I R b a n d 8 ,
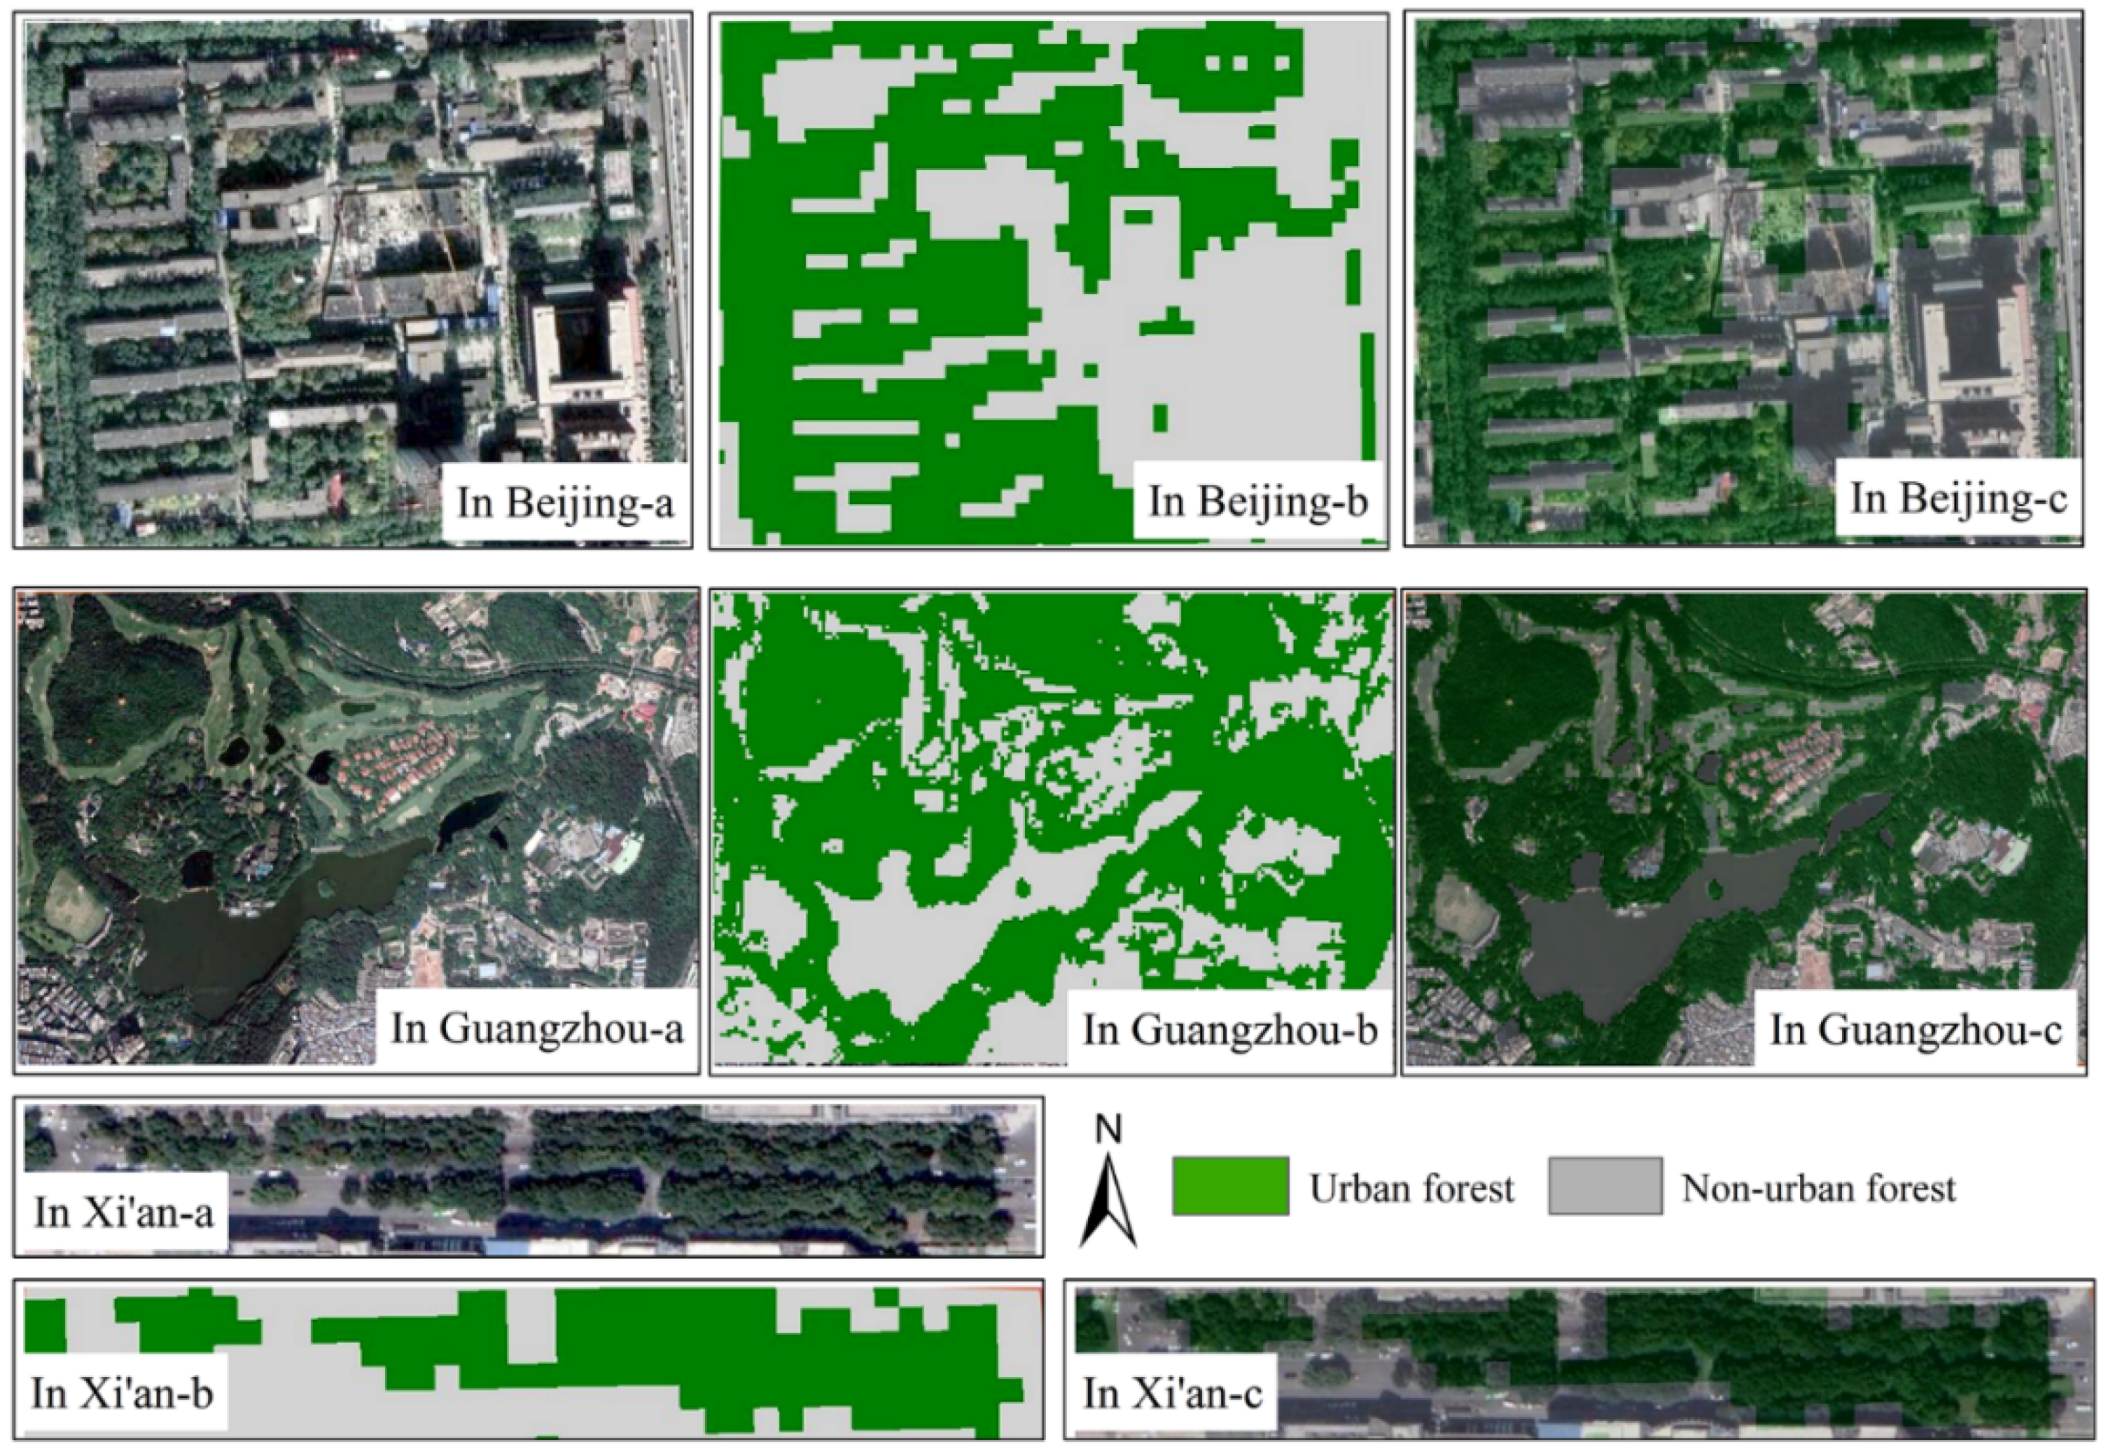
  • The established RF model was trained to map the urban forest distribution in China and assess the classification accuracy. Based on the above steps, we divided the study area into two types: Urban forest and non-urban forest. The validation data were then used to calculate a confusion matrix and access the OA, PA, and UA. Moreover, the classification results could be assessed by visual inspection at the same time. In training and testing, we started with a small number of sample points, and with an increase in the number of sample points, we assessed the accuracy of these two classification. We then visually evaluated the classification results with reference to the VHR images, randomly, until the results became highly accurate [34].

3. Results

3.1. Accuracy Assessment

The classification results showed high accuracy when tested by the validation data (Table 3). For China as a whole, the PA of urban forest was 92.27% (errors with omission = 7.73%), the UA of urban forest was 92.18% (errors with commission = 7.82%), the OA was 92.30%, and the kappa coefficient was 0.85. The accuracy reflected in these figures is evidence that this dataset of urban forests in China is highly reliable. As Figure 6 shows, the visual assessment of the results are also fairly good when compared with the VHR images in GE. The built-up land, water, roads, and grassland can be easily separated from urban forest.
Regarding the three zones in China, zone A has the highest overall accuracy (94.22%), and zone C has the lowest (OA = 87.40%), as shown in Table 4.

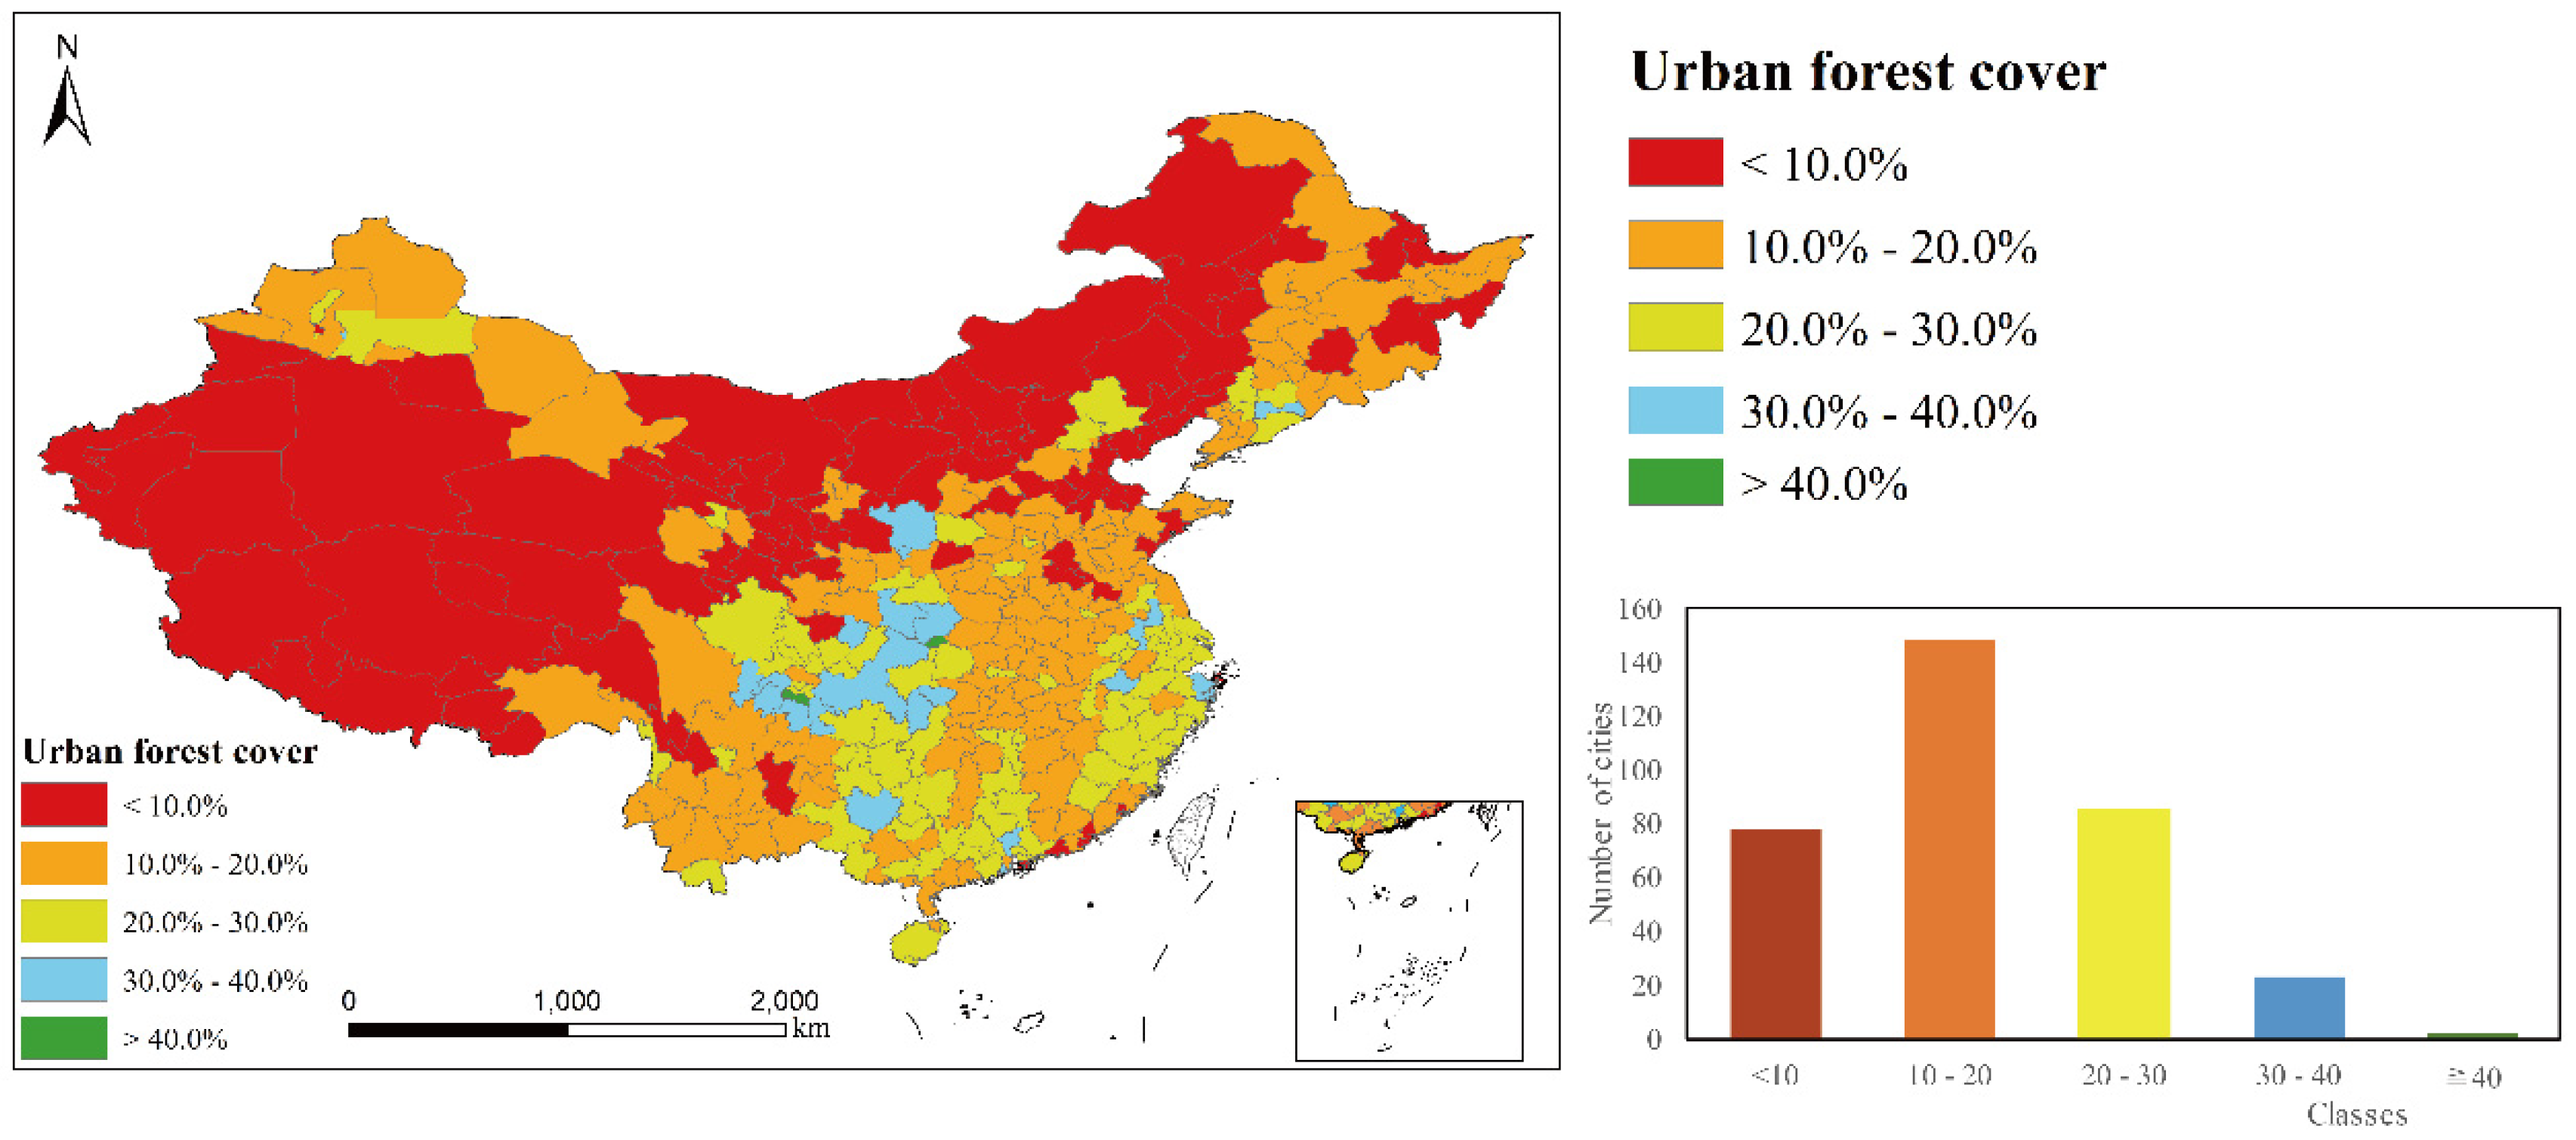
3.2. The Distribution of China’s Urban Forests in 2016

The total urban forest area in China in 2016 was 0.17 million km2, and urban forest cover was 19.2% (Figure 7). For the three zones in China (the spatial division was presented in Figure 1), the urban forest cover in zone A was 16.0%; zone B had the highest urban forest cover at 23.0%; and zone C had the lowest at 8.5%. Zone A and C are both below the national average level. The proportion of cities that have an urban forest cover below 10% is about 60% in Zone C, which is much higher than those in zone A (28.9%) and zone B (4.2%). Almost 85% of cities in zone B have the urban forest cover between 10% and 30%. Furthermore, the per capita urban forest area in zone C in 2016 was 10.3 m2, which was approximately one third of that in zone A (34.9 m2), and about one quarter of that in zone B (39.1 m2).
At the province scale, the top five provinces of urban forest cover were Chongqing, Sichuan, Zhejiang, Jiangsu, and Shanghai, of which the urban forest cover percentages were 33.4%, 28.2%, 26.6%, 25.2%, and 24.4%, respectively; the percentage of Inner Mongolia was the lowest (5.0%, Figure 8).
At the prefecture-level city scale, considering the average China’s urban forest cover (19.2%) and the requirements of urban forest cover for National Forest City (more than 30% in Northern cities and 40% in Southern cities), we used 10.0%, 20.0%, 30.0%, and 40.0% as the class interval to show the spatial distribution of urban forest cover in prefecture-level cities (Figure 9). Nearly half of the cities had urban forest cover between 10.0% and 20.0%; only four northern cities had more than 30.0% of urban forest cover, and only two southern cities had more than 40.0%. The cities with less than half of the average were mainly distributed in the northern and western parts. Furthermore, regarding the large cities, whose urban populations were over 5 million, the average percentage of urban forest cover was 24.8%, from 9.7% (Tianjin) to 33.4% (Chongqing).

4. Discussion

4.1. Reliability of Urban Forest Mapping in GEE

This study demonstrated the feasibility of mapping urban forests in China, using Sentinel-2 images and the GEE platform. Compared with previous urban forest mapping of individual cities, this study attempted to extract the distribution of urban forests at a 10 m resolution at the country scale. The accuracies (PA, UA, and OA) were sufficiently high (above 0.9), due to open access to high-resolution images, the convenient use of the GEE platform, and the use of efficient machine learning algorithms.

4.1.1. Data

Datasets used in many previous studies on urban forests, in individual cities, were of a very high resolution: Satellite for observation of Earth (SPOT) images with 10 m/2.5 m resolution [46], QuickBird images with a 0.61 m resolution [47], SPOT-5 images with 5 m resolution [21], and multispectral images with 1 m resolution [22]. However, these data were not open access, resulting in the high cost of mapping at the country scale. Regarding larger scales, greenspaces in Fuller and Gaston [20] were extracted from free Landsat images with 30 m resolution. However, these proved too coarse for classification within urban areas as the land use types in cities were very fragmented, which may have resulted in omission and commission errors. Consequently, open access to Sentinel-2 images, with a 10 m resolution, contributed significantly to mapping urban forest at the country scale.

4.1.2. GEE Platform

Data which can be directly invoked and powerful cloud computing on the GEE platform both offer the greatest support for this study. In the process of traditional classification at a large scale, the biggest challenge is the amount of time spent in retrieving, selecting, downloading, and pretreating satellite images. For this study, 5482 Sentinel images were used, and considering the bandwidths’ limitations, the preliminary collection and pre-processing of data would have taken at least three months without GEE. However, this work was completed in less than one minute using GEE. We can compare the classification result with the VHR images in GEE, and detect the omission and commission errors. Then, the adjustments to the sample points and algorithms can be quickly made, meaning that the former, necessarily protracted period for exporting and transforming formats for comparison, is no longer required [34].

4.1.3. Efficient Machine Algorithms

GEE provides an RF classifier that assigns pixels to a class. The band selected in this study achieved the highest classification accuracy. Furthermore, along with eight bands (B2–B8, B11), we also added three indices (NDVI, NDWI and NDBI) from Sentinel-2 as the input data, which helped to distinguish between urban forests and non-urban forests, because the vegetation, water, and built-up areas are the key elements within urban areas. As the results showed, the addition of these indices increased the PA of urban forests and OA by 0.85%, and 0.37%, respectively, even though the UA of urban forests decreased by 0.02%.

4.2. Uncertainties and Limitations

Even though the OA of this study has achieved up to 92.30%, there are also some limitations. GEE did not ingest images with atmospheric correction when we executed our classification. Moreover, it was difficult to perform the atmospheric correction in the GEE platform because of difficulties in parameter acquisition [31,40,48]. Therefore, the top-of-atmosphere (TOA) reflectance data, from Sentinel-2, was directly used to extract urban forest cover in this study, which may affect the results to some extent.
The most common mis-classification is between buildings and urban forests. In the majority of Chinese cities, the trees between rows of buildings are very important components of urban forests. However, because of the fragmentation of classes in urban areas, some small trees, which are surrounded by buildings, may be omitted, while some buildings surrounded by lush trees can be mis-judged as urban forests. These errors may gradually decrease with the increase of image resolution in the future. According to our confusion matrix, the proportion of non-urban forest wrongly judged as urban forest is 7.67% and the proportion of urban forest, wrongly detected as non-urban forest, is similarly 7.73%. These almost-equal error rates may mitigate the impact of the above mis-classification on the area calculation.
Similarly, some grasslands in the middle of some large woodlands were often directly classified as whole forests, which over-estimated the area of urban forests. In the future, vegetation height information from lidar, and backscattering characteristics from radar [31], may be integrated to improve classification accuracy and obtain more information about urban forests.
Furthermore, we examined the classification results using the 75 ground data (Figure 2), in order to gain misclassification information, and found that eight of them presented errors, mainly for the ground data of individual tree around house and street, low canopy cover in commercial areas and schools. Forests, trees in parks, cluster trees in schools, and roadside showed low mis-classifications. It should be noted that, even though we used Sentinel-2 images with a 10 m resolution to identify the inner city classes of China as clear as possible, for some small canopy covers and new individual trees, the 10 m resolution is still too coarse to identify them clearly. Therefore, this dataset was to fill the gap in urban forest cover across China, and was more suitable for macro-analysis at the national level. For individual cities, images with higher resolution should be used to obtain more accurate information.
For accuracy at the zone scale, zone 3 has the lowest accuracy, because in this zone, the urban areas were very small (see Figure 1), and urban forest cover accounted for only 3.2% of the country’s total, leading to the collection of only a small number of acceptable sample points.

4.3. Suggestions for Urban Forest Construction in China

A clear understanding of urban forest cover in China is conducive to the scientific management and construction of urban forests. The spatial distribution of urban forest cover in China varies greatly from 0.01% to 40.1%. For cities with high urban forest cover, like Zigong (in Sichuan province), the main tasks at present are to effectively deal with illegal damage caused to, and the occupation of, urban forests, as well as formulate policies for urban greening protection and management, and to prevent the destruction of existing urban forests. Cities with low urban forest cover should attach importance to urban forest construction, to use urban forest cover as an indicator of urban construction in the formulation of urban planning. Figure 6 shows that the spatial differences of urban forests distribution within Beijing are very clear, being concentrated in the north of urban area. Therefore, governments should conduct extensive research before formulating urban greening plans to grasp the number and spatial distribution of urban forests, within a city, in order to increase the number of urban trees in areas with poor cover.
Detecting the influential factors for the spatial differences of urban forest cover is vitally important for effectively increasing urban forests. However, it is a relatively complex problem, according to previous studies [19,20,49,50], which should be further explored in future research.
Until 2018, there were 165 cities, which had been granted “National Forest City” status. This study selected the prefecture-level cities from these cities, and found that their average percentage of urban forest cover was only 19.3%, while that of the cities without this status was only 14.6%. Importantly, these percentages are much lower than the standards of 30% and 40% for the northern, and southern cities, respectively; only four northern cities and two southern cities achieved the standards, highlighting that greater effort is needed to build the ideal forest city.

5. Conclusions

This study presented a map of urban forest distribution in China with 10 m resolution, based on Sentinel-2 images, sampling datasets, an RF model, and the GEE platform. The UA and PA values of urban forests were, respectively, 92.18%, and 92.27%, and the OA value 92.30%. This study also demonstrated that the GEE platform has significant advantages, regarding large-scale data processing.
By analyzing this dataset, total urban forest area in China was estimated at about 0.17 million km2 in 2016, and urban forest cover 19.2%. At the province scale, the highest percentage of urban forest cover was 33.4% (Chongqing), and the lowest was 5.0% (Inner Mongolia). At the prefecture-level city scale, nearly half of the cities had achieved 10.0–20.0%. With respect to the large cities with urban populations over 5 million, the average percentage of urban forest cover was 24.8%, much more than the national average. Furthermore, the average percentage of urban forest cover in the National Forest City was 19.3%, less than the standards of 30% and 40% for the northern, and southern cities respectively, and only four northern cities and two southern cities achieved this standard, indicating that greater effort is needed to build the ideal forest city.
The reliable dataset of this study provides the basis for the identification of forest cities and for urban forest planning in China, and it can also be used to compare the spatial distribution of urban forests in China with the data from other countries.

Supplementary Materials

The following are available online at https://www.mdpi.com/1999-4907/10/9/729/s1. (1) Table of the top 100 prefecture-level cities in China of the highest urban forest cover in 2016; (2) Download link of urban area of China in 2016; (3) Download link of scripts for image pre-processing, classification, and accuracy assessment; (4) Download link of urban forest cover dataset.

Author Contributions

Conceptualization, Q.D. and M.T.; Methodology, Q.D., M.T., Y.G., X.W., and L.X.; Software, Y.G.; Validation, Q.D. and Y.G.; Formal Analysis, Q.D. and M.T.; Investigation, Q.D. and Y.G.; Resources, M.T.; Writing—Original Draft Preparation, Q.D.; Writing—Review and Editing, Q.D., M.T., X.W., and L.X.; Supervision, M.T.

Funding

This research was funded by National Natural Science Foundation of China, grant number 41771116.

Acknowledgments

Many thanks to anonymous reviewers for providing valuable opinion on revising the manuscript.

Conflicts of Interest

The authors declare no conflict of interest.

References

  1. Yang, X.J. China’s Rapid Urbanization. Science 2013, 342, 310. [Google Scholar] [CrossRef] [PubMed]
  2. National-Bureau-of-Statistics-of-China. Statistical Communiqué on the 2018 National Economic and Social Development. Available online: http://www.stats.gov.cn/tjsj/zxfb/201902/t20190228_1651265.html (accessed on 12 May 2019).
  3. Xu, X.; Xie, Y.; Qi, K.; Luo, Z.; Wang, X. Detecting the response of bird communities and biodiversity to habitat loss and fragmentation due to urbanization. Sci. Total Environ. 2018, 624, 1561–1576. [Google Scholar] [CrossRef] [PubMed]
  4. Zhou, C.S.; Chen, J.; Wang, S.J. Examining the effects of socioeconomic development on fine particulate matter (PM2.5) in China’s cities using spatial regression and the geographical detector technique. Sci. Total Environ. 2018, 619, 436–445. [Google Scholar] [CrossRef] [PubMed]
  5. Peng, J.; Ma, J.; Liu, Q.; Liu, Y.; Hu, Y.; Li, Y.; Yue, Y. Spatial-temporal change of land surface temperature across 285 cities in China: An urban-rural contrast perspective. Sci. Total Environ. 2018, 635, 487–497. [Google Scholar] [CrossRef] [PubMed]
  6. Endreny, T.A. Strategically growing the urban forest will improve our world. Nat. Commun. 2018, 9, 1160. [Google Scholar] [CrossRef] [PubMed]
  7. Alvey, A.A. Promoting and preserving biodiversity in the urban forest. Urban For. Urban Green. 2006, 5, 195–201. [Google Scholar] [CrossRef]
  8. Michołap, P.; Sikora, A.; Kelm, M. Variability of bumblebee communities (Apidae, Bombini) in urban green areas. Urban Ecosyst. 2017, 20, 1339–1345. [Google Scholar] [CrossRef]
  9. Nowak, D.J.; Hirabayashi, S.; Doyle, M.; McGovern, M.; Pasher, J. Air pollution removal by urban forests in Canada and its effect on air quality and human health. Urban For. Urban Green. 2018, 29, 40–48. [Google Scholar] [CrossRef]
  10. Yang, J.; McBride, J.; Zhou, J.; Sun, Z. The urban forest in Beijing and its role in air pollution reduction. Urban For. Urban Green. 2005, 3, 65–78. [Google Scholar] [CrossRef]
  11. Armson, D.; Stringer, P.; Ennos, A. The effect of tree shade and grass on surface and globe temperatures in an urban area. Urban For. Urban Green. 2012, 11, 245–255. [Google Scholar] [CrossRef]
  12. Greene, C.S.; Millward, A.A. Getting closure: The role of urban forest canopy density in moderating summer surface temperatures in a large city. Urban Ecosyst. 2017, 20, 141–156. [Google Scholar] [CrossRef]
  13. Annerstedt, M.; Östergren, P.-O.; Björk, J.; Grahn, P.; Skärbäck, E.; Währborg, P. Green qualities in the neighbourhood and mental health—Results from a longitudinal cohort study in Southern Sweden. BMC Public Health 2012, 12, 337. [Google Scholar] [CrossRef] [PubMed]
  14. Nesbitt, L.; Hotte, N.; Barron, S.; Cowan, J.; Sheppard, S.R. The social and economic value of cultural ecosystem services provided by urban forests in North America: A review and suggestions for future research. Urban For. Urban Green. 2017, 25, 103–111. [Google Scholar] [CrossRef]
  15. Salbitano, F.; Borelli, S.; Conigliaro, M.; Chen, Y. Guidelines on Urban and Peri-Urban Forestry; FAO Forestry Paper No. 178; FAO: Rome, Italy, 2016. [Google Scholar]
  16. FAO. COFO Side Event on “Urban Forests for Sustainable Cities”; FAO: Rome, Italy, 2016. [Google Scholar]
  17. Bureau, S.F. Evaluation Indicators for National Forest City. Journey Chin. Urban For. 2007, 5, 7–8. (In Chinese) [Google Scholar]
  18. CTLA. Guide for Plant Appraisal, 9th ed.; Council of Tree and Landscape Appraiser: Champaign, IL, USA, 2000. [Google Scholar]
  19. Nowak, D.J.; Rowntree, R.A.; McPherson, E.; Sisinni, S.M.; Kerkmann, E.R.; Stevens, J.C. Measuring and analyzing urban tree cover. Landsc. Urban Plan. 1996, 36, 49–57. [Google Scholar] [CrossRef] [Green Version]
  20. Fuller, R.A.; Gaston, K.J. The scaling of green space coverage in European cities. Biol. Lett. 2009, 5, 352–355. [Google Scholar] [CrossRef] [Green Version]
  21. Canetti, A.; Garrastazu, M.C.; De Mattos, P.P.; Braz, E.M.; Netto, S.P. Understanding multi-temporal urban forest cover using high resolution images. Urban For. Urban Green. 2018, 29, 106–112. [Google Scholar] [CrossRef]
  22. Fan, C.; Johnston, M.; Darling, L.; Scott, L.; Liao, F.H. Land use and socio-economic determinants of urban forest structure and diversity. Landsc. Urban Plan. 2019, 181, 10–21. [Google Scholar] [CrossRef]
  23. Kulhavy, D.L.; Unger, D.R.; Hung, I.-K.; Zhang, Y. Comparison of AR.Drone Quadricopter Video and the Visual CTLA Method for Urban Tree Hazard Rating. J. For. 2016, 114, 517–523. [Google Scholar] [CrossRef]
  24. Chen, M.; Dai, F.; Yang, B.; Zhu, S. Effects of neighborhood green space on PM2.5 mitigation: Evidence from five megacities in China. Build. Environ. 2019, 156, 33–45. [Google Scholar] [CrossRef]
  25. Zhou, Y.; Shi, Y. Towards establishing the conpect of physical urban area in China. Acta Geogr. Sin. 1995, 50, 289–301. (In Chinese) [Google Scholar]
  26. Liu, X.; Hu, G.; Chen, Y.; Li, X.; Xu, X.; Li, S.; Pei, F.; Wang, S. High-resolution multi-temporal mapping of global urban land using Landsat images based on the Google Earth Engine Platform. Remote Sens. Environ. 2018, 209, 227–239. [Google Scholar] [CrossRef]
  27. Tan, M.H. An Intensity Gradient/Vegetation Fractional Coverage Approach to Mapping Urban Areas From DMSP/OLS Nighttime Light Data. IEEE J. Sel. Top. Appl. Earth Obs. Remote Sens. 2017, 10, 95–103. [Google Scholar] [CrossRef]
  28. Song, Y.; Long, Y.; Wu, P.; Wang, X. Are all cities with similar urban form or not? Redefining cities with ubiquitous points of interest and evaluating them with indicators at city and block levels in China. Int. J. Geogr. Inf. Sci. 2018, 1–30. [Google Scholar] [CrossRef]
  29. ESA. Sentinel-2 User Handbook, ESA Standard Document ed.; European Space Agency: Paris, France, 2015. [Google Scholar]
  30. Gorelick, N.; Hancher, M.; Dixon, M.; Ilyushchenko, S.; Thau, D.; Moore, R. Google Earth Engine: Planetary-scale geospatial analysis for everyone. Remote Sens. Environ. 2017, 202, 18–27. [Google Scholar] [CrossRef]
  31. Huang, H.; Chen, Y.; Clinton, N.; Wang, J.; Wang, X.; Liu, C.; Gong, P.; Yang, J.; Bai, Y.; Zheng, Y.; et al. Mapping major land cover dynamics in Beijing using all Landsat images in Google Earth Engine. Remote Sens. Environ. 2017, 202, 166–176. [Google Scholar] [CrossRef]
  32. Wang, X.; Xiao, X.; Zou, Z.; Chen, B.; Ma, J.; Dong, J.; Doughty, R.B.; Zhong, Q.; Qin, Y.; Dai, S.; et al. Tracking annual changes of coastal tidal flats in China during 1986–2016 through analyses of Landsat images with Google Earth Engine. Remote Sens. Environ. 2018, 110987. [Google Scholar] [CrossRef]
  33. Chen, B.; Xiao, X.; Li, X.; Pan, L.; Doughty, R.; Ma, J.; Dong, J.; Qin, Y.; Zhao, B.; Wu, Z.; et al. A mangrove forest map of China in 2015: Analysis of time series Landsat 7/8 and Sentinel-1A imagery in Google Earth Engine cloud computing platform. ISPRS J. Photogramm. Remote Sens. 2017, 131, 104–120. [Google Scholar] [CrossRef]
  34. Teluguntla, P.; Thenkabail, P.S.; Oliphant, A.; Xiong, J.; Gumma, M.K.; Congalton, R.G.; Yadav, K.; Huete, A. A 30-m landsat-derived cropland extent product of Australia and China using random forest machine learning algorithm on Google Earth Engine cloud computing platform. ISPRS J. Photogramm. Remote Sens. 2018, 144, 325–340. [Google Scholar] [CrossRef]
  35. Jin, X.; Long, Y.; Sun, W.; Lu, Y.; Yang, X.; Tang, J. Evaluating cities’ vitality and identifying ghost cities in China with emerging geographical data. Cities 2017, 63, 98–109. [Google Scholar] [CrossRef]
  36. China Meteorological Data Sharing Service System. Available online: http://data.cma.cn/data/cdcdetail/dataCode/SURF_CLI_CHN_MUL_DAY_V3.0.html (accessed on 24 August 2019).
  37. Ministry of Housing and Urban-Rural Development of the People’s Republic of China. 2016 China Urban Construction Statistical Yearbook. Available online: http://www.mohurd.gov.cn/xytj/tjzljsxytjgb/ (accessed on 6 August 2019).
  38. Congalton, R.G. Accuracy Assessment: A Critical Component of Land Cover Mapping. In Gap Analysis: A Landscape Approach to Biodiversity Planning, Bethesda; Scott, J.M., Tear, T.H., Davis, F., Eds.; American Society for Photogrammetry and Remote Sensing: Bethesda, MD, USA, 1996; pp. 119–131. [Google Scholar]
  39. Amani, M.; Mahdavi, S.; Afshar, M.; Brisco, B.; Huang, W.; Mirzadeh, S.M.J.; White, L.; Banks, S.; Montgomery, J.; Hopkinson, C. Canadian Wetland Inventory using Google Earth Engine: The First Map and Preliminary Results. Remote Sens. 2019, 11, 842. [Google Scholar] [CrossRef]
  40. Tian, F.; Wu, B.; Zeng, H.; Zhang, X.; Xu, J. Efficient Identification of Corn Cultivation Area with Multitemporal Synthetic Aperture Radar and Optical Images in the Google Earth Engine Cloud Platform. Remote Sens. 2019, 11, 629. [Google Scholar] [CrossRef]
  41. Breiman, L. Random Forests. Mach. Learn. 2001, 45, 5–32. [Google Scholar] [CrossRef] [Green Version]
  42. Belgiu, M.; Drăguț, L. Random forest in remote sensing: A review of applications and future directions. ISPRS J. Photogramm. Remote Sens. 2016, 114, 24–31. [Google Scholar] [CrossRef]
  43. Chen, J.M.; Cihlar, J. Retrieving leaf area index of boreal conifer forests using Landsat TM images. Remote Sens. Environ. 1996, 55, 153–162. [Google Scholar] [CrossRef]
  44. McFeeters, S.K. The use of the Normalized Difference Water Index (NDWI) in the delineation of open water features. Int. J. Remote Sens. 1996, 17, 1425–1432. [Google Scholar] [CrossRef]
  45. Zha, Y.; Gao, J.; Ni, S. Use of normalized difference built-up index in automatically mapping urban areas from TM imagery. Int. J. Remote Sens. 2003, 24, 583–594. [Google Scholar] [CrossRef]
  46. Zhao, Q.; Zheng, G.Q.; Huang, Q.H. Urban forest remote sensing investigation based on neural network model technology in the main city of Nanjing. Geogr. Res. 2006, 25, 468–476. (In Chinese) [Google Scholar]
  47. Liu, C.; Li, X. Carbon storage and sequestration by urban forests in Shenyang, China. Urban For. Urban Green. 2012, 11, 121–128. [Google Scholar] [CrossRef]
  48. Sun, Z.; Xu, R.; Du, W.; Wang, L.; Lu, D. High-Resolution Urban Land Mapping in China from Sentinel 1A/2 Imagery Based on Google Earth Engine. Remote Sens. 2019, 11, 752. [Google Scholar] [CrossRef]
  49. Chen, W.Y.; Wang, D.T. Urban forest development in China: Natural endowment or socioeconomic product? Cities 2013, 35, 62–68. [Google Scholar] [CrossRef]
  50. Watkins, S.L.; Gerrish, E. The relationship between urban forests and race: A meta-analysis. J. Environ. Manag. 2018, 209, 152–168. [Google Scholar] [CrossRef] [PubMed] [Green Version]
Figure 1. Boundaries of China’s urban area in 2016, with a partial, enlarged view in Beijing, Shanghai, Guangzhou, Xi’an, and Wuhan and the presentation of three zones.
Forests 10 00729 g001
Figure 2. Ground data for urban forests.
Forests 10 00729 g002
Figure 3. Spatial distribution of sample points for (a) urban forest and (b) non-urban forest collected by Google Earth, along with some typical examples.
Forests 10 00729 g003
Figure 4. Urban forest mapping flow chart.
Forests 10 00729 g004
Figure 5. The variation in producer’s accuracy (PA), user’s accuracy (UA) for urban forests, and overall accuracy (OA) versus the number of decision trees.
Forests 10 00729 g005
Figure 6. The visual assessment of the result from Google Earth (GE). Random examples in Beijing, Guangzhou, and Xi’an. a is a very high-resolution (VHR) image from GE, b is the corresponding classification result in this study, and c is an overlap result of b with 30% transparency and a.
Forests 10 00729 g006
Figure 7. China’s urban forest cover in 2016, with a partial, enlarged view of Beijing, Shanghai, Guangzhou, Xi’an, and Wuhan.
Forests 10 00729 g007
Figure 8. Percentage of urban forest cover in different provinces.
Forests 10 00729 g008
Figure 9. Percentage of urban forest cover at the prefecture-level city scale and the number of cities in different classes.
Forests 10 00729 g009
Table 1. The parameter values of the random forest (RF) classifier.
Parameter NameValue
Number of decision trees40
Number of variables per splitSquare root of the number of variables
Minimum size of a terminal node1
Fraction of input to bag per tree0.5
Out-of-bag modeFalse
Table 2. Overall accuracy for urban forest mapping by RF classifiers using different bands and indices.
BandsIndicesOverall Accuracy
B2-B8, B11NDVI, NDWI, NDBI92.30%
B2-B7NDVI, NDWI, NDBI92.24%
B2-B8, B8A, B11-B12(all bands)NDVI, NDWI, NDBI92.09%
B2-B8, B11NDVI, NDWI92.09%
B2-B8, B11NDVI, NDBI92.09%
B2-B8, B11NDVI92.04%
B2-B8, B11NDWI, NDBI91.99%
B2-B4NDVI, NDWI, NDBI91.99%
B2-B8, B11-91.93%
B2-B8, B8A, B11-B12(all bands)-91.79%
B2-B8, B8ANDVI, NDWI, NDBI91.79%
B2-B8, B11NDWI91.59%
B2-B8, B11NDBI91.54%
B2-B8NDVI, NDWI, NDBI91.54%
Table 3. Accuracy assessment of the 10 m urban forest map for China in 2016.
Urban ForestNon-Urban Forest
PA92.27%92.33%
Omission Error7.73%7.67%
UA92.18%92.41%
Commission Error7.82%7.69%
OA92.30%
Kappa coefficient0.85
Table 4. Accuracies of three zones in China.
Reference Data
Urban ForestNon-Urban ForestProducer’s Accuracy
Zone A
Map dataUrban forest4031895.72%
Non-urban forest3952693.10%
User’s accuracy91.18%96.69%
Overall accuracy94.22%
Zone B
Map dataUrban forest4805390.06%
Non-urban forest3945892.15%
User’s accuracy92.49%89.63%
Overall accuracy91.07%
Zone C
Map dataUrban forest961189.72%
Non-urban forest51575.00%
User’s accuracy95.05%57.70%
Overall accuracy87.40%

