Abstract
Soil fauna is critical for maintaining ecosystem functioning, and its community could be significantly impacted by nitrogen (N) deposition. However, our knowledge of how soil-faunal community composition responds to N addition is still limited. In this study, we simulated N deposition (0, 50, 100, 150, and 300 kg N ha−1 year−1) to explore the effects of N addition on the total and the phytophagous soil fauna along the soil profile (0–10, 10–25, and 25–40 cm) in poplar plantations (Populus deltoids) on the east coast of China. Ammonium nitrate (NH4NO3) was dissolved in water and sprayed evenly under the canopy with a backpack sprayer to simulate N deposition. Our results showed that N addition either significantly increased or decreased the density (D) of both the total and the phytophagous soil fauna (Dtotal and Dp) at low or high N addition rates, respectively, indicating the existence of threshold effects over the range of N addition. However, N addition had no significant impacts on the number of groups (G) and diversity (H) of either the total or the phytophagous soil fauna (Gtotal, Gp and Htotal, Hp). With increasing soil depth, Dtotal, Dp, Gtotal, and Gp largely decreased, showing that the soil fauna have a propensity to aggregate at the soil surface. Htotal and Hp did not significantly vary along the soil profile. Importantly, the threshold effects of N addition on Dtotal and Dp increased from 50 and 100 to 150 kg N ha−1 year−1 along the soil profile. Fine root biomass was the dominant factor mediating variations in Dtotal and Dp. Our results suggested that N addition may drive changes in soil-faunal community composition by altering belowground food resources in poplar plantations.
1. Introduction
Nitrogen (N) deposition, which is predicted to continuously increase, has become a major global concern [1,2,3]. In terrestrial ecosystems, most of the deposited N eventually dissipates into soils [4]. N accumulation in soils could change the community structure of soil fauna and could thereby impact ecosystem functioning [5]. Collectively, the soil fauna is a major consumer and decomposer and is therefore an essential component of the forest ecosystem [6,7]. As the “engineer of the soil ecosystem”, soil fauna plays an important role in dissolving residues and altering biogeochemical cycles [8,9]. However, our understanding of the responses of soil fauna community to increased levels of N input is still limited.
Increasing evidence has demonstrated that N addition that mimics natural N deposition can undoubtedly have profound impacts on soil fauna communities. Despite much research, however, no consensus exists regarding the impacts of N addition in soil fauna communities. For instance, N addition significantly increases the densities of both phytophagous soil fauna and total soil fauna, which could be attributed to enhanced ammonium (NH4+) production and nitrification processes from increased root exudation and organic matter input to the system [10]. In addition, Raub, et al. [11] confirmed the positive effect of N-rich food resources on the abundance of soil fauna. Conversely, a long-term N addition study reports that continuous N addition significantly reduces the density and taxa richness of the soil fauna due to the decreased allocation of carbon (C) to leaf and fine root litter, especially C from the roots associated with changes in rhizodeposition [12,13,14]. Additionally, some studies find no significant effects of N addition on the density of soil fauna due to reduced competitive exclusion of soil fauna and a short observation period [15]. A lack of impacts of N addition on the diversity of soil fauna has also been reported; results from the demands for N are similar among various soil fauna [16,17] or elevated intraguild predation [11]. The different responses of soil fauna communities to N addition—whether positive, negative, or non-significant—may primarily depend on the N addition rate [4]. The impact of N addition on soil fauna communities could change directionally and dramatically at a critical concentration [18,19], suggesting a threshold effect. The study of soil fauna community responses to N addition at a range of rates is therefore of great importance.
N addition could affect the vertical distribution of soil fauna, leading to major variations in the soil fauna community with increasing soil depth [20]. The density of soil fauna, for example, could appreciably increase in the topsoil layer due to N addition while exhibiting no significant changes in deep soil layers [21]. Soil depth is one of the most important factors influencing soil fauna communities due to variations in the soil’s physical and chemical properties along the depth gradient [22,23]. Soil fauna may be more abundant in the subsoil, where they take refuge to avoid the high N concentrations in the upper soil layers under N addition [24]. Moreover, thresholds, if present, could shift from high to low along the soil profile [24]. Although N addition is reported to affect the soil fauna community, field-based studies of the responses of a soil fauna community to soil depth are still lacking, making predictions about soil food web changes with N deposition in plantations difficult.
The soil fauna community’s responses to N addition are mediated by the quantity and quality of the food resources available, such as roots, litter, and fungi [25,26]. Typically, soil fauna density is correlated with root biomass [23], though previous studies in various ecosystems have shown that N addition can have a variety of impacts on fine root biomass, either stimulating the production of fine root biomass [27] or retarding it [28]. Moreover, root chemical traits are key factors in shaping soil fauna communities, and do so via mediating species-specific interactions and affecting the soil fauna at multiple trophic levels [29]. It is well established that plant root-derived nutrition, such as N, may strongly influence a soil fauna community [30]. Litter quantity and quality are two additional factors that have a major influence on the activity and composition of soil fauna [31]. High quantities of litter can stimulate an increase in soil fauna density, mainly due to concomitant increases in the food supply and the habitat space of the ecosystem [11,32]. In addition, the density and community parameters of soil fauna also largely depend on the chemical and physical qualities of the litter [31]. A previous study showed that the density of soil fauna could increase as the litter C:N ratio decreased [33]. Furthermore, some soil fauna prefer feeding on older, more decomposed litter, and this preference strongly depends on the structure of the litter, e.g., tensile strength and palatability [26]. Recent studies, however, have suggested that root-derived food resources can be much more effective in fueling belowground food webs than those that come from leaf litter (e.g., [30,34]). Roots as a food source for soil fauna are considered to be an essential component of the underground food web [35]. The quantity and quality of food resources are likely to change in response to N addition, mediating the effects of N addition on soil fauna communities.
China grows more than 7 million ha of poplar plantations. Biomass production and C fixation by poplars (Populus) thus play important roles in mediating global climate change [36]. Compared to the natural forest ecosystem, changes in the soil fauna community in response to N addition in poplar plantations are less studied, especially for the whole soil fauna community [19]. Over the decades, many studies have evaluated the impact of N addition on particular species of soil fauna [37,38], while few studies have reported whole soil fauna community responses to N addition. Studies focused on one or two soil fauna species are not sufficiently indicative of the changes in whole soil fauna community [39]. It is thus necessary to study the response of the whole soil fauna to N addition in poplar plantations. In this study, we aimed to: (1) explore the effects of N addition and soil depth on the whole soil fauna community, and (2) determine the primary factors controlling the responses of the whole soil fauna community across N treatments and the soil profile in a poplar plantation at the Dongtai Forest Farm, eastern China.
2. Materials and Methods
2.1. The Experimental Site and Design
Our experimental site is located at the Dongtai Forest Farm in Yancheng, Jiangsu Province, eastern China (120°49′ E, 32°52′ N). The farm is close to the Yellow Sea State Forest Park (on the coast of the Yellow Sea) and has a climate classified as Cfa (Humid subtropical climate) according to Köppen [40]. The mean annual temperature (MAT) is 13.7 °C and the mean annual precipitation (MAP) is 1051 mm. The soil of the forest farm is a desalting meadow and sandy soil with a pH value ~8 [41].
Our N addition experiment was established in May 2012. We chose 12-year-old pure poplar plantations (Populus deltoids cv. ‘I-35’) with uniform site conditions and management measures as our plots. We used a randomized block design with a gradient of five levels of N addition (0, 50, 100, 150, and 300 kg N ha−1 year−1) in three replicate blocks (25 × 190 m). Each N treatment subplot was 25 × 30 m with a 10 m buffer zone between any two adjacent subplots. The distance between any two adjacent blocks was at least 500 m. We chose a range of N addition rates because the ambient N deposition rate is about 50 kg N ha−1 year−1 for this area [42] and Liu et al. [18] estimated that the critical loads for N deposition in Jiangsu province could be more than 200 kg N ha−1 year−1. In each month of the growing season (May through October), one-sixth of the yearly amount of NH4NO3 was dissolved in 20 L water and sprayed evenly under the canopy by backpack sprayer to simulate natural N deposition. Each control subplot received 20 L of water.
2.2. Microclimate
Soil temperature (0–15 cm) and moisture (0–20 cm) were measured once or twice a month using a Delta-T WET-2 (UK) from January to December 2016. Litter was collected in each subplot from November to December 2016 with a 2 m × 2 m litter trap constructed of 2 mm mesh nylon cloth. We oven-dried the litter at 65 °C for 48 h and weighed it to calculate litter mass.
2.3. Measurement of C and N in Litter and Soil Samples
Litter samples for measuring C and N content were collected in October 2016, oven-dried, ground, filtered by sieving (0.5 mm), and analyzed with an elemental analyzer (PerkinElmer 2400 II, Waltham, MA, USA). Soil cores of 4 cm in diameter were taken in October 2016 from the 0–15 cm soil layer in each subplot. Soil samples were transferred to our lab, air-dried, ground, and dipped into 0.5 M hydrochloric acid (HCl) to remove carbonates [43,44]. We then measured soil organic C (SOC) and total N (TN) by combustion with an elemental analyzer (Elementar, Vario EL III, Elementar Analysen Systeme GmbH, Elementar Analysensysteme GmbH, Hanau, Germany).
2.4. Estimation of Fine Root Biomass
Soil cores were taken from the top 45 cm of soil in each subplot with polyvinyl chloride (PVC) tubes (with an inside diameter of 4.6 cm) in June 2016 to estimate the fine root biomass [45,46,47]. Soil cores were numbered and then transported to our laboratory at Nanjing Forestry University, where they were frozen at −20 °C before analyzing. The cores were separated into three sections by depth (0–10, 10–25, and 25–40 cm), then carefully washed by wet sieving (0.5 mm) under gently flowing water to remove attached soil and dark-brown/black debris. Collected root samples were separated into coarse (>2 mm in diameter) and fine (≤2 mm in diameter, live and dead) roots, oven-dried at 65 °C for 48 h and weighed to calculate the live and dead fine root biomass.
2.5. Soil Fauna Sampling and Identification
Soil samples were collected from the 0–10, 10–25, and 25–40 cm soil layers using a soil coring with a diameter of 4 cm. Different layers represent organic horizon (O horizon, 0–10 cm), eluvial horizon (A horizon, 10–25 cm), and deposition horizon (B horizon, 25–40 cm), respectively [48,49]. In June 2016, four soil cores were collected from each 25 × 30 m subplot and pooled together as a replicate sample. The soil samples were immediately shipped back to our laboratory. The soil fauna was then collected from each soil sample using Tullgren extractors (Tullgren Funnel Unit, BURKARD, BURKARD SCIENTIFIC Ltd., Uxbridge, UK) [50,51,52,53]. All collected fauna samples were preserved in 75% ethanol and then sorted under a dissecting microscope (Nikon Eclipse E200, Nikon Instech Co., Ltd., Tokyo, Japan). Soil fauna was identified according to Yin [54,55].
2.6. Statistical Analysis
To determine the structure of the soil fauna in our study site, we chose density, the number of groups, and the Shannon-Wiener diversity index to describe the characteristics and composition of the soil fauna of each sample. The soil fauna density (D) was calculated as the following:
where D is the density of soil fauna, N is the total number of individuals, and V is the volume of the soil samples. The number of groups (G) was estimated as the number of groups of the fauna in the same order. The Shannon-Wiener diversity index (H) of each sample was estimated according to Whittaker [56]:
where H is the Shannon-Wiener diversity index of each sample, n is the number of groups of soil fauna, and Pi is the proportion of the number of individuals in the ith order to the total number of individuals, which could be calculated with the following equation:
where Ni is the number of individuals in the ith order.
Two-way ANOVA was used to examine the impact of N addition, soil layers, and their interactions on the fine root biomass (including live, dead, and total fine roots), density, number of groups, and biodiversity of phytophagous and total soil fauna. Repeated-measures ANOVA was performed to test the responses of litter mass, soil temperature, and moisture to N addition. One-way ANOVA was used to examine the responses of the litter C:N ratio, soil TN, and SOC to N addition. Linear regression analyses were performed to examine the relationships between soil fauna and fine root biomass (live, dead, and total), SOC, TN, mean annual soil temperature and between moisture and the soil temperature in June. All statistical analyses were performed using SPSS 22.0 for Windows (SPSS Inc., Chicago, IL, USA).
3. Results
3.1. Microclimate, Litter C and N, Soil Samples, and Fine Root Biomass
Soil temperature and moisture showed remarkable seasonal variations. Soil temperature increased from January to August and then decreased from August to December (Table 1, Figure S1a) and soil moisture was low in summer and high in spring and fall (Table 1, Figure S1b). N addition did not affect the C:N ratio of the litter, SOC, TN, soil temperature or moisture (all p > 0.05, Table 1 and Table 2). While N addition had no significant effect on live, dead, or total fine root biomass (all p > 0.05), root biomass in general decreased with increasing soil depth (all p < 0.01, Table 3, Figure S2).

Table 1.
Results of repeated-measures ANOVA for seasonal responses of litter mass, soil temperature, and moisture to nitrogen (N) addition (0, 50, 100, 150, and 300 kg N ha−1 year−1). Statistical analysis was performed on log-transformed data. p levels are indicated beside the F values by the following: *: <0.05, **: <0.01, ***: <0.001, and no asterisks indicate p > 0.05. df represents degree of freedom.
Table 2.
Results of one-way ANOVA for responses of litter carbon (C): N ratio, soil N (TN), and soil organic C (SOC) to N addition. Statistical analysis was performed on log-transformed data. p levels are indicated beside the F values by the following: *: <0.05, **: <0.01, ***: <0.001, and no asterisks indicate p > 0.05.
Table 3.
Results of two-way ANOVA for responses of the density (D), number of groups (G), Shannon-Wiener diversity index (H) of soil fauna and fine root biomass (live root biomass, dead root biomass, and total root biomass) to nitrogen (N) addition and soil depth (0–10, 10–25, and 25–40 cm). Statistical analysis was performed on log-transformed data. P levels are indicated beside the F values by the following: *: <0.05, **: <0.01, ***: <0.001, and no asterisks indicate p > 0.05.
3.2. Soil Fauna Community as Affected by N Addition
In general, N addition and soil depth both played important roles in altering the density of the soil fauna. With increasing N addition rate, the density of the total soil fauna (Dtotal) significantly increased first, then declined to the levels of the controls (p < 0.01, Table 3, Figure 1a). In the 25–40 cm soil layer, for example, Dtotal increased from N0 to N3 and then declined from N3 to N4 (Figure 1a). In addition, Dtotal significantly decreased with increasing soil depth (p < 0.001, Table 3, Figure 1a). The interaction between N addition and soil depth had a significant impact on Dtotal (p < 0.05, Table 3). Dtotal increased from N0 to N1 and then declined with higher N addition (from N1 to N4) in the topsoil layer (0–10 cm). In the deep soil layers (10–25 and 25–40 cm), however, declines in Dtotal started at N2 and N3, respectively, compared to the topsoil layer. The density of phytophagous soil fauna (Dp) showed similar responses to N addition along the soil profile (Table 3, Figure 1b).
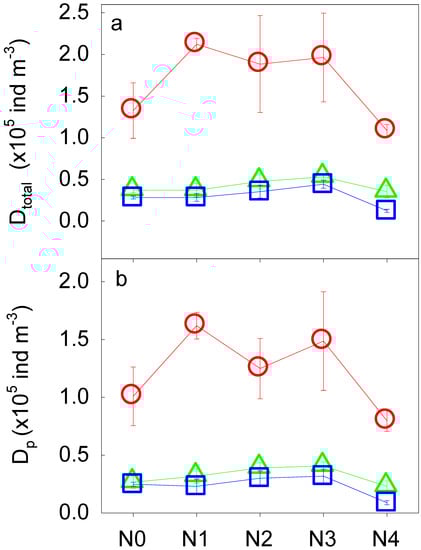
Figure 1.
The density of total soil fauna (Dtotal, a) and phytophagous soil fauna (Dp, b) along the N addition gradient and the soil profile (red for 0–10 cm, green for 10–25 cm, and blue for 25–40 cm). N0, N1, N2, N3, N4 indicate the gradient of N additions (N0: 0 kg N ha−1 year−1; N1: 50 kg N ha−1 year−1; N2: 100 kg N ha−1 year−1; N3: 150 kg N ha−1 year−1; N4: 300 kg N ha−1 year−1).
N addition had no significant impact on either the number of groups of total soil fauna (Gtotal) or the number of groups of phytophagous fauna (Gp) (all p > 0.05, Table 3, Figure 2). With increasing soil depth, in general, we found significant decreases in Gtotal and Gp (all p < 0.05, Table 3, Figure 2). Abrupt decreases in Gtotal and Gp at N2 were observed in the topsoil layer (0–10 cm). We also found interactive effects between N addition and soil layer on Gp (p < 0.05, Table 3, Figure 2b). Along the soil profile, for instance, Gp reached its highest values at N1, N2, and N3. For the Shannon-Wiener diversity index of the soil fauna, neither N addition nor soil depth had significant effects on the diversity of total soil fauna (Htotal) or the diversity of phytophagous soil fauna (Hp) (all p > 0.05, Table 3, Figure 3).
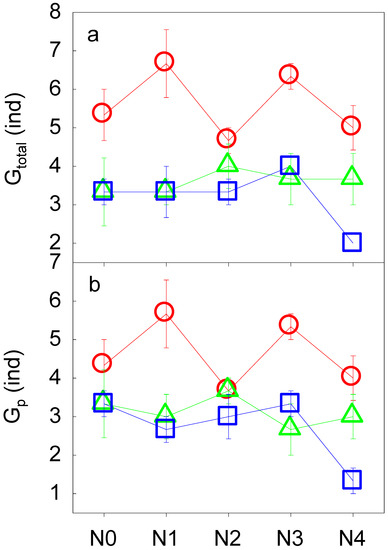
Figure 2.
The number of groups of total soil fauna (Gtotal, a) and phytophagous soil fauna (Gp, b) along the N addition gradient and the soil profile. See Figure 1 for abbreviations.
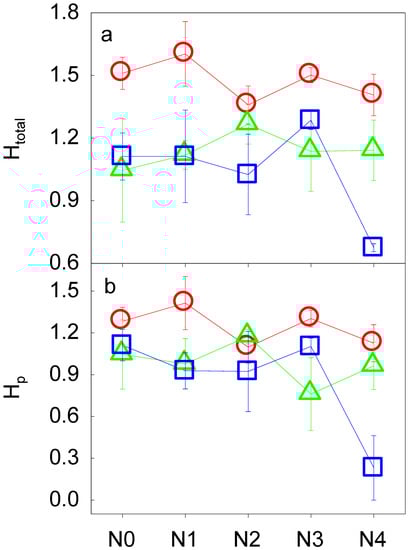
Figure 3.
The Shannon-Wiener diversity index of total soil fauna (Htotal, a) and phytophagous soil fauna (Hp, b) along the N addition gradient and the soil profile. See Figure 1 for abbreviations.
3.3. Fine Root Biomass Regulation of Soil Fauna Density
Variations in soil fauna densities (both Dp and Dtotal) were consistently regulated by fine root biomass (Table 4). We found that variations in Dp and Dtotal across N addition treatments and soil profile were positively correlated with the amount of live, dead, and total fine roots (all p < 0.01, Figure 4 and Figure 5). The positive relationships remained even without the “outliers” — the very small values (both in fine root biomass on the X-axis as well as in the soil fauna density on the Y axis, all p < 0.01, Figures S3 and S4). Multifactor linear regression showed that the dominant factors controlling variations in Dp and Dtotal were the total and the dead fine root biomass across N addition treatments (all p < 0.001, Table 4).
Table 4.
Results of multi-regression analysis of the density of phytophagous soil fauna (Dp) and total soil fauna (Dtotal) with fine root biomass (live, dead, and total), SOC, TN, mean annual soil temperature and moisture, and the soil temperature and moisture in June across N addition treatments. ***: p < 0.001.
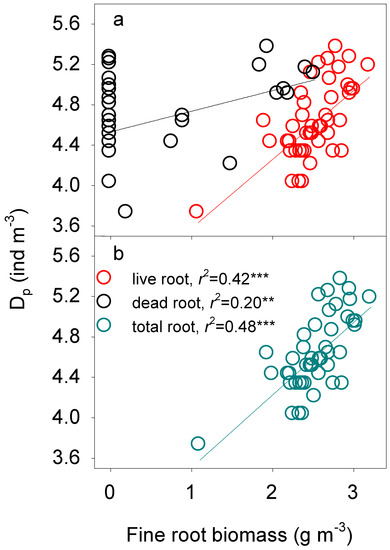
Figure 4.
Log-log regulation of fine root biomass ((a) live and dead root biomass; (b) total root biomass) on the density of phytophagous soil fauna (Dp). **: p < 0.01, ***: p < 0.001.
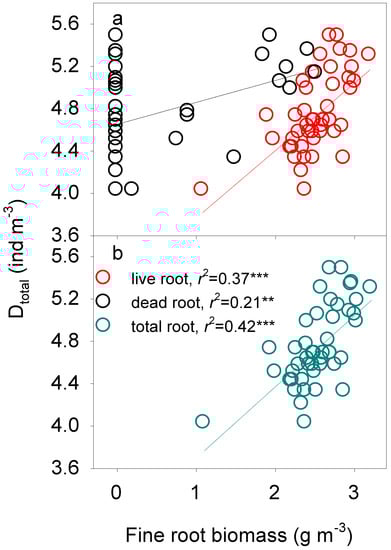
Figure 5.
Log-log regulation of fine root biomass ((a) live and dead root biomass; (b) total root biomass) on the density of total soil fauna (Dtotal). **: p < 0.01, ***: p < 0.001.
4. Discussion
4.1. N-addition Impacts on Soil Fauna Density
Although N addition, up to a certain rate, could have positive impacts on soil fauna, high rates of N input appears to negatively affect the fauna community. The increases in Dtotal at low N addition rates are in line with previous findings, which show that N addition, to a certain extent, can be beneficial to soil fauna (e.g., [57,58,59]). The increases in Dtotal under N addition may have resulted from (1) increases in available N in the soil [60]; (2) increases in the food sources (soil bacteria and fungi) for the soil fauna [5,61]; (3) increases in rhizodeposition-C accessible to soil fauna [14,62]; and (4) more hospitable soil conditions for soil fauna (e.g., decreases in soil pH associated with N addition) [63]. Interestingly, Dtotal dramatically decreased from N3 to N4, exhibiting a negative response to high N addition. Decreases in the density of soil fauna at high levels of N addition may be attributed to at least two reasons. First, excessive acidic substances resulted from N addition may negatively affect soil fauna [64,65]. For instance, soil acidification [66] significantly restricts the number of soil nematodes and could thus decrease Dtotal [67,68]. Second, N may cause soil eutrophication due to the increase in nitrate (NO3−) and NH4+ concentrations in soil, and thereby has a negative influence on soil fauna [19,67]. Similar to the variations observed in Dtotal, Dp increased from N0 to N3 and decreased from N3 to N4. The decline in Dp is consistent with previous studies, which found that N addition that increases NH4+ concentration significantly decreases Dp, as the NH4+ suppresses phytophagous soil fauna [13,67,69]. Additionally, we found that Dp positively responds to low N addition rates, which is similar to the trend observed for Dtotal, probably due to the large proportion (~75% across all treatments) of phytophagous soil fauna to total soil fauna in our study. Since few studies have reported any positive impacts of N addition on Dp, the mechanisms remain to be explored.
A threshold effect of N addition on soil fauna is usually widely found [19,70]. In our study, we detected a threshold in the effects of N addition on soil fauna at approximately 150 kg N ha−1 year−1 for both Dtotal and Dp. N addition within a certain concentration range enables competitive soil fauna to coexist with less competitive soil fauna, leading to an increase in density, while excessive N addition is a threat to the less competitive soil fauna, as it negatively alters the soil’s physical and chemical properties [2]. When an ecosystem reaches N saturation, excessive exogenous N might increase leaching of some basic ions, such as calcium ion (Ca2+), aluminum ion (Al3+), and magnesium ion (Mg2+), from the system [24], consequently destroying the structure and function of the ecosystem, causing soil acidification and nutrient imbalances, breaking intraspecific competition dynamics, and eroding the system’s resistance to external disturbances [71]. Differences in N thresholds among ecosystems probably result from a quantitative variation in the primary available N. N addition may increase the quality and quantity of organic matter in young, developing ecosystems while having a toxic effect on the soil fauna in old ecosystems that reached N saturation from N addition [12]. Thus, the threshold effects of N deposition in different ecosystems and their potential impacts on soil fauna are worthy of further investigation from a community structure perspective.
4.2. N-addition Impacts on the Number of Groups and Diversity of Soil Fauna
N addition has either positive or negative effects on the number of groups and Shannon-Wiener diversity index of soil fauna in various ecosystems (e.g., [58,59,72,73]). However, a non-significant impact of N addition on those variables has been widely reported (e.g., [16,17,19]), supporting our findings in this study. The lack of N addition effects may be explained as follows: (1) N addition did not significantly alter the proportion of soil fauna in each group to the total number. Statistically, we found that the number of soil fauna in each group increased evenly with N addition (Table S1, Figures S5 and S6); (2) litter, as one of the main food sources for soil fauna [26], had no significant response to N addition either in terms of quantity (litter mass) or quality (C:N ratio) (all p > 0.05, Table 1 and Table 2); (3) N addition had no significant influence on soil microclimate (soil temperature and moisture) (all p > 0.05,Table 1). The abrupt decreases in Gtotal and Gp at N2 may have been related to a decrease in food resources, e.g., fine root biomass, at N2. Additionally, the discrepancy in the effects of N addition on the number of groups and the diversity of soil fauna between our study and the previous studies may have resulted from the differences in soils, as our experimental site is located in an alkaline coastal area.
4.3. Increasing N-Addition Thresholds along Soil Profile
N addition did not affect the “surface aggregation” of soil fauna but increased the thresholds with increasing soil depth. The density and the number of groups of soil fauna usually decrease along soil profile [48,74], and this holds true under N addition in our study. Surface soil is more hospitable to soil fauna, as it always has a higher substrate content and air circulation rate [53,75]. Higher N addition thresholds for soil fauna may be attributed to the fact that topsoil could be more sensitive to environmental stress (e.g., N addition) than deeper soil layers [75]. Soil fauna move from the topsoil downwards to the deeper soil layers when high amounts of N are added to escape the depression of high N addition in the topsoil [76].
4.4. Regulation of Fine Root Biomass on Soil Fauna
Responses of soil fauna to N addition at the site level may be influenced by many factors, such as soil temperature and moisture [77], pH value [78], and resource supply [15]. Based on the multifactor regression analyses, we found that fine root biomass was the dominant factor controlling variations in the density of soil fauna for both Dtotal and Dp. Fine roots and their exudates may positively influence soil biota through stimulated hyphal growth with increasing quantities of fine root biomass [79]. A growing body of evidence suggests that soil food webs rely heavily on “root C” because fine roots can be a source of readily available C for both soil microorganisms and phytophagous soil fauna [80]. Likewise, many studies have shown that phytophagous soil fauna are largely controlled by root-derived nutrition [30,81], just as aboveground herbivore populations are strongly linked to net primary production [82].
5. Conclusions
Our study in poplar plantations on the east coast of China suggests that N addition could have substantial effects on soil fauna along the soil profile. Across the N addition treatments, low N addition rates had positive effects on soil fauna densities, likely due to improved physical and chemical soil conditions. With increasing N addition rates, responses of soil fauna community returned to the control level. Soil fauna responded differently to N addition in different soil layers, which may largely relate to changes in the soil substrate content with N addition. Multifactor linear regressions showed that fine root biomass mediated N induced changes in the soil fauna density. The global N deposition rate is projected to continuously increase in the future [3,83], which will undoubtedly affect soil fauna and further the biogeochemical cycles. Therefore, it is imperative to explore impacts of N addition on soil fauna communities to understand the way an ecosystem functions under the global N deposition.
Supplementary Materials
The following are available online at http://www.mdpi.com/1999-4907/10/2/122/s1, Figure S1: Variations in soil temperature (a) and moisture (b) from January to December along the nitrogen (N) addition gradient in 2016. N0, N1, N2, N3, N4 indicate different N additions (N0: 0 kg N ha−1 year−1; N1: 50 kg N ha−1 year−1; N2: 100 kg N ha−1 year−1; N3: 150 kg N ha−1 year−1; N4: 300 kg N ha−1 year−1), Figure S2: The live (a), dead (b), and total (c) fine root biomass along the N addition gradient and the soil profile (red for 0–10 cm, green for 10–25 cm, and blue for 25–40 cm). See Figure S1 for abbreviations, Figure S3: Regulation of fine root biomass (a: live and dead root biomass; b: total root biomass) on the density of phytophagous soil fauna (Dp), without the very small points (circled in the panels). **: p < 0.01, ***: P < 0.001, Figure S4: Regulation of fine root biomass (a: live and dead root biomass; b: total root biomass) on the density of total soil fauna (Dtotal), without the very small points (circled in the panels). **: p < 0.01, ***: p < 0.001, Figure S5: The proportion of each individual soil fauna over total soil fauna along the nitrogen (N) addition gradient and the soil profile. See Figure S1 for abbreviations, Figure S6: The proportions of macrofauna, mesofauna, and microfauna over total soil fauna along the nitrogen (N) addition gradient and the soil profile. See Figure S1 for abbreviations. Table S1: Results of two-way ANOVA for the responses of each individual soil fauna’s proportion over total soil fauna to nitrogen (N) addition (0, 50, 100, 150, and 300 kg N ha−1 year−1) and soil depth (0–10, 10–25, and 25–40 cm). P levels are indicated beside the F values by the following: *: <0.05, **: <0.01, ***: <0.001, and no asterisks indicate p > 0.05.
Author Contributions
Conceptualization, H.R. and X.X.; Data curation, H.B., Q.G. and H.X.; Formal analysis, H.B., Q.G. and X.X.; Funding acquisition, H.R. and X.X.; Investigation, H.B., Q.G. and H.X.; Resources, C.S., H.R. and X.X.; Supervision, H.R. and X.X.; Validation, H.X.; Writing–original draft, H.B. and X.X.; Writing–review & editing, Q.L., X.C., Y.L., H.R. and X.X.
Funding
This study is financially supported by the National Key Research and Development Program of China (2016YFD0600204), the Recruitment Program for Young Professionals, the Jiangsu Specially Appointed Professors Program, the Natural Science Key Fund for Colleges and Universities of Jiangsu Province of China (17KJA180006), the Six Talent Peaks Program of Jiangsu Province (JY-041 & TD-XYDXX-006), the Nanjing Forestry University Science Fund for Distinguished Young Scholars (the “5151” Talent Program), the Jiangsu Collegiate Science and Technology Fund for the Excellent Innovative Research Teams, and the Priority Academic Program Development of Jiangsu Higher Education Institutions (PAPD).
Acknowledgments
We thank many lab members for their help with the field work.
Conflicts of Interest
The authors declare no conflict of interest.
References
- Penuelas, J.; Poulter, B.; Sardans, J.; Ciais, P.; van der Velde, M.; Bopp, L.; Boucher, O.; Godderis, Y.; Hinsinger, P.; Llusia, J.; et al. Human-induced nitrogen-phosphorus imbalances alter natural and managed ecosystems across the globe. Nat. Commun. 2013, 4, 2934. [Google Scholar] [CrossRef] [PubMed]
- Niu, S.; Classen, A.T.; Dukes, J.S.; Kardol, P.; Liu, L.; Luo, Y.; Rustad, L.; Sun, J.; Tang, J.; Templer, P.H. Global patterns and substrate-based mechanisms of the terrestrial nitrogen cycle. Ecol. Lett. 2016, 19, 697–709. [Google Scholar] [CrossRef] [PubMed]
- Schwede, D.B.; Simpson, D.; Tan, J.; Fu, J.S.; Dentener, F.; Du, E.; deVries, W. Spatial variation of modelled total, dry and wet nitrogen deposition to forests at global scale. Environ. Pollut. 2018, 243, 1287–1301. [Google Scholar] [CrossRef]
- Xu, G.-L.; Mo, J.-M.; Zhou, G.-Y.; Fu, S.-L. Preliminary response of soil fauna to simulated N deposition in three typical subtropical forests. Pedosphere 2006, 16, 596–601. [Google Scholar] [CrossRef]
- Sun, F.; Tariq, A.; Chen, H.; He, Q.; Guan, Y.; Pan, K.; Chen, S.; Li, J.; Zhao, C.; Wang, H.; et al. Effect of nitrogen and phosphorus application on agricultural soil food webs. Arch. Agron. Soil Sci. 2017, 63, 1176–1186. [Google Scholar] [CrossRef]
- Xin, W.D.; Yin, X.Q.; Song, B. Contribution of soil fauna to litter decomposition in Songnen sandy lands in northeastern China. J. Arid Environ. 2012, 77, 90–95. [Google Scholar] [CrossRef]
- Oliverio, A.M.; Gan, H.; Wickings, K.; Fierer, N. A DNA metabarcoding approach to characterize soil arthropod communities. Soil. Biol. Biochem. 2018, 125, 37–43. [Google Scholar] [CrossRef]
- Li, X.; Yin, X.; Wang, Z.; Fan, W. Litter mass loss and nutrient release influenced by soil fauna of Betula ermanii forest floor of the Changbai Mountains, China. Appl. Soil Ecol. 2015, 95, 15–22. [Google Scholar] [CrossRef]
- Lu, P.; Dai, N.H.; Sun, X.Y.; Zhang, G.H.; Xu, D.R.; Zhan, Y.H. Composition and structure of soil fauna community in the Dexing Copper Mine tailings pool after revegetation. Turk. J. Zool. 2018, 42, 307–315. [Google Scholar]
- Lin, H.; He, Z.; Hao, J.; Tian, K.; Jia, X.; Kong, X.; Akbar, S.; Bei, Z.; Tian, X. Effect of N addition on home-field advantage of litter decomposition in subtropical forests. For. Ecol. Manag. 2017, 398, 216–225. [Google Scholar] [CrossRef]
- Raub, F.; Scheuermann, L.; Hoefer, H.; Brandl, R. No bottom-up effects of food addition on predators in a tropical forest. Basic Appl. Ecol. 2014, 15, 59–65. [Google Scholar] [CrossRef]
- Gan, H.; Zak, D.R.; Hunter, M.D. Chronic nitrogen deposition alters the structure and function of detrital food webs in a northern hardwood ecosystem. Ecol. Appl. 2013, 23, 1311–1321. [Google Scholar] [CrossRef] [PubMed]
- Eisenhauer, N.; Cesarz, S.; Koller, R.; Worm, K.; Reich, P.B. Global change belowground: Impacts of elevated CO2, nitrogen, and summer drought on soil food webs and biodiversity. Glob. Chang. Biol. 2012, 18, 435–447. [Google Scholar] [CrossRef]
- Preece, C.; Penuelas, J. Rhizodeposition under drought and consequences for soil communities and ecosystem resilience. Plant Soil 2016, 409, 1–17. [Google Scholar] [CrossRef]
- Cole, L.; Buckland, S.M.; Bardgett, R.D. Influence of disturbance and nitrogen addition on plant and soil animal diversity in grassland. Soil Biol. Biochem. 2008, 40, 505–514. [Google Scholar] [CrossRef]
- Jiang, M.; Wang, X.; Liusui, Y.; Sun, X.; Zhao, C.; Liu, H. Diversity and Abundance of Soil Animals as Influenced by Long-Term Fertilization in Grey Desert Soil, China. Sustainability 2015, 7, 10837–10853. [Google Scholar] [CrossRef]
- Zhu, X.; Zhu, B. Diversity and abundance of soil fauna as influenced by long-term fertilization in cropland of purple soil, China. Soil. Tillage Res. 2015, 146, 39–46. [Google Scholar] [CrossRef]
- Liu, X.; Duan, L.; Mo, J.; Du, E.; Shen, J.; Lu, X.; Zhang, Y.; Zhou, X.; He, C.; Zhang, F. Nitrogen deposition and its ecological impact in China: An overview. Environ. Pollut. 2011, 159, 2251–2264. [Google Scholar] [CrossRef]
- Ochoa-Hueso, R.; Rocha, I.; Stevens, C.J.; Manrique, E.; Luciañez, M.J. Simulated nitrogen deposition affects soil fauna from a semiarid Mediterranean ecosystem in central Spain. Biol. Fertil. Soils 2014, 50, 191–196. [Google Scholar] [CrossRef]
- Nkem, J.N.; Bruyn, L.A.L.D.; Hulugalle, N.R.; Grant, C.D. Changes in invertebrate populations over the growing cycle of an N-fertilised and unfertilised wheat crop in rotation with cotton in a grey Vertosol. Appl. Soil Ecol. 2002, 20, 69–74. [Google Scholar] [CrossRef]
- Xu, G.L.; Schleppi, P.; Li, M.H.; Fu, S.L. Negative responses of Collembola in a forest soil (Alptal, Switzerland) under experimentally increased N deposition. Environ. Pollut. 2009, 157, 2030–2036. [Google Scholar] [CrossRef] [PubMed]
- Yin, X.; Song, B.; Dong, W.; Xin, W.; Wang, Y. A review on the eco-geography of soil fauna in China. J. Geogr. Sci. 2010, 20, 333–346. [Google Scholar] [CrossRef]
- Potapov, A.M.; Goncharov, A.A.; Semenina, E.E.; Korotkevich, A.Y.; Tsurikov, S.M.; Rozanova, O.L.; Anichkin, A.E.; Zuev, A.G.; Samoylova, E.S.; Semenyuk, I.I. Arthropods in the subsoil: Abundance and vertical distribution as related to soil organic matter, microbial biomass and plant roots. Eur. J. Soil Biol. 2017, 82, 88–97. [Google Scholar] [CrossRef]
- Xu, G.L.; Mo, J.M.; Fu, S.L.; Gundersen, P.; Zhou, G.Y.; Xue, J.H. Response of soil fauna to simulated nitrogen deposition: A nursery experiment in subtropical China. Acta Sci. Circumstantiae 2007, 19, 603–609. [Google Scholar] [CrossRef]
- Morrien, E. Understanding soil food web dynamics, how close do we get? Soil Biol. Biochem. 2016, 102, 10–13. [Google Scholar] [CrossRef]
- Zieger, S.L.J. Trophic Structure of Soil Animal Food Webs of Deciduous Forests as Analyzed by Stable Isotope Labeling. Ph.D. Thesis, Universität Göttingen, Göttingen, Germany, 2016. [Google Scholar]
- Leppälammi-Kujansuu, J.; Ostonen, I.; Strömgren, M.; Nilsson, L.O.; Kleja, D.B.; Sah, S.P.; Helmisaari, H.-S. Effects of long-term temperature and nutrient manipulation on Norway spruce fine roots and mycelia production. Plant Soil 2013, 366, 287–303. [Google Scholar] [CrossRef]
- Li, W.; Jin, C.; Guan, D.; Wang, Q.; Wang, A.; Yuan, F.; Wu, J. The effects of simulated nitrogen deposition on plant root traits: A meta-analysis. Soil Biol. Biochem. 2015, 82, 112–118. [Google Scholar] [CrossRef]
- Tsunoda, T.; Dam, N.M.V. Root chemical traits and their roles in belowground biotic interactions. Pedobiologia 2017, 65, 58–67. [Google Scholar] [CrossRef]
- Eissfeller, V.; Beyer, F.; Valtanen, K.; Hertel, D.; Maraun, M.; Polle, A.; Scheu, S. Incorporation of plant carbon and microbial nitrogen into the rhizosphere food web of beech and ash. Soil Biol. Biochem. 2013, 62, 76–81. [Google Scholar] [CrossRef]
- Sauvadet, M.; Chauvat, M.; Fanin, N.; Coulibaly, S.; Bertrand, I. Comparing the effects of litter quantity and quality on soil biota structure and functioning: Application to a cultivated soil in Northern France. Appl. Soil Ecol. 2016, 107, 261–271. [Google Scholar] [CrossRef]
- Sayer, E.J.; Sutcliffe, L.M.E.; Ross, R.I.C.; Tanner, E.V.J. Arthropod Abundance and Diversity in a Lowland Tropical Forest Floor in Panama: The Role of Habitat Space vs. Nutrient Concentrations. Biotropica 2010, 42, 194–200. [Google Scholar] [CrossRef]
- Ilieva-Makulec, K.; Olejniczak, I.; Szanser, M. Response of soil micro- and mesofauna to diversity and quality of plant litter. Eur. J. Soil Biol. 2006, 42, S244–S249. [Google Scholar] [CrossRef]
- Gilbert, K.J.; Fahey, T.J.; Maerz, J.C.; Sherman, R.E.; Bohlen, P.; Dombroskie, J.J.; Groffman, P.M.; Yavitt, J.B. Exploring carbon flow through the root channel in a temperate forest soil food web. Soil Biol. Biochem. 2014, 76, 45–52. [Google Scholar] [CrossRef]
- Melaniem, P.; Reinhard, L.; Stefan, S.; Mark, M. Compartmentalization of the soil animal food web as indicated by dual analysis of stable isotope ratios (15N/14N and 13C/12C). Soil Biol. Biochem. 2009, 41, 1221–1226. [Google Scholar]
- Wang, S.; Tan, Y.; Fan, H.; Ruan, H.; Zheng, A. Responses of soil microarthropods to inorganic and organic fertilizers in a poplar plantation in a coastal area of eastern China. Appl. Soil Ecol. 2015, 89, 69–75. [Google Scholar] [CrossRef]
- Liang, W.J.; Lou, Y.L.; Qi, L.; Shuang, Z.; Zhang, X.K.; Wang, J.K.; Coleman, D.; Fu, S.L.; Zou, X.M. Nematode faunal response to long-term application of nitrogen fertilizer and organic manure in Northeast China. Soil Biol. Biochem. 2009, 41, 883–890. [Google Scholar] [CrossRef]
- Zhao, J.; Wang, F.; Li, J.; Zou, B.; Wang, X.; Li, Z.; Fu, S. Effects of experimental nitrogen and/or phosphorus additions on soil nematode communities in a secondary tropical forest. Soil Biol. Biochem. 2014, 75, 1–10. [Google Scholar] [CrossRef]
- Boxman, A.W.; Blanck, K.; Brandrud, T.E.; Emmett, B.A.; Gundersen, P.; Hogervorst, R.F.; Kjonaas, O.J.; Persson, H.; Timmermann, V. Vegetation and soil biota response to experimentally-changed nitrogen inputs in coniferous forest ecosystems of the NITREX project. For. Ecol. Manag. 1998, 101, 65–79. [Google Scholar] [CrossRef]
- WIKIPEDIA. Köppen Climate Classification. 1884. Available online: https://en.wikipedia.org/wiki/Köppen_climate_classification (accessed on 3 January 2019).
- Wang, S.; Chen, H.Y.; Tan, Y.; Fan, H.; Ruan, H. Fertilizer regime impacts on abundance and diversity of soil fauna across a poplar plantation chronosequence in coastal Eastern China. Sci. Rep. 2016, 6, 20816. [Google Scholar] [CrossRef]
- Zhu, J.; Wang, Q.; He, N.; Smith, M.D.; Elser, J.J.; Du, J.; Yuan, G.; Yu, G.; Yu, Q. Imbalanced atmospheric nitrogen and phosphorus depositions in China: Implications for nutrient limitation. J. Geophys. Res. Biogeosci. 2016, 121, 1605–1616. [Google Scholar] [CrossRef]
- Ramnarine, R.; Voroney, R.P.; WagnerRiddle, C.; Dunfield, K.E. Carbonate removal by acid fumigation for measuring the δ13C of soil organic carbon. Can. J. Soil Sci. 2011, 91, 247–250. [Google Scholar] [CrossRef]
- Wotherspoon, A.; Voroney, R.P.; Thevathasan, N.V.; Gordon, A.M. Comparison of Three Methods for Measurement of Soil Organic Carbon. Commun. Soil Sci. Plant Anal. 2015, 46, 362–374. [Google Scholar] [CrossRef]
- Xu, X.; Niu, S.; Sherry, R.A.; Zhou, X.; Zhou, J.; Luo, Y. Interannual variability in responses of belowground net primary productivity (NPP) and NPP partitioning to long-term warming and clipping in a tallgrass prairie. Glob. Chang. Biol. 2012, 18, 1648–1656. [Google Scholar] [CrossRef]
- Derner, J.D.; Briske, D.D. Does a tradeoff exist between morphological and physiological root plasticity? A comparison of grass growth forms. Acta Oecol. 1999, 20, 519–526. [Google Scholar] [CrossRef]
- Gao, Y.Z.; Giese, M.; Lin, S.; Sattelmacher, B.; Zhao, Y.; Brueck, H. Belowground net primary productivity and biomass allocation of a grassland in Inner Mongolia is affected by grazing intensity. Plant Soil 2008, 307, 41–50. [Google Scholar] [CrossRef]
- Yang, B.; Zhang, W.; Xu, H.; Wang, S.; Xu, X.; Fan, H.; Chen, H.Y.H.; Ruan, H. Effects of soil fauna on leaf litter decomposition under different land uses in eastern coast of China. J. For. Res. 2018, 29, 973–982. [Google Scholar] [CrossRef]
- Wang, G.B.; Deng, F.F.; Xu, W.H.; Chen, H.Y.H.; Ruan, H.H. Poplar plantations in coastal China: Towards the identification of the best rotation age for optimal soil carbon sequestration. Soil Use Manag. 2016, 32, 303–310. [Google Scholar] [CrossRef]
- Wallwork, J.A. The Distribution and Diversity of Soil Fauna. Q. Rev. Biol. 1977, 52, 319. [Google Scholar]
- Wu, H.; Lu, M.; Lu, X.; Guan, Q.; He, X. Interactions between earthworms and mesofauna has no significant effect on emissions of CO2 and N2O from soil. Soil Biol. Biochem. 2015, 88, 294–297. [Google Scholar] [CrossRef]
- Bokhorst, S.; Huiskes, A.; Convey, P.; Pmvan, B.; Aerts, R. Climate change effects on soil arthropod communities from the Falkland Islands and the Maritime Antarctic. Soil Biol. Biochem. 2008, 40, 1547–1556. [Google Scholar] [CrossRef]
- Li, Y.; Chen, Y.; Xu, C.; Xu, H.; Zou, X.; Chen, H.Y.H.; Ruan, H. The abundance and community structure of soil arthropods in reclaimed coastal saline soil of managed poplar plantations. Geoderma 2018, 327, 130–137. [Google Scholar] [CrossRef]
- Yin, W. Subtropical Soil Animals in China (in Chinese); Science Press: Beijing, China, 2000. [Google Scholar]
- Yin, W. Chinese subtropical soil animals (in Chinese); Science Press: Beijing, China, 1992. [Google Scholar]
- Whittaker, R.H. Evolution and Measurement of Species Diversity. Taxon 1972, 21, 213–251. [Google Scholar] [CrossRef]
- Sjursen, H.; Michelsen, A.; Jonasson, S. Effects of long-term soil warming and fertilisation on microarthropod abundances in three sub-arctic ecosystems. Appl. Soil Ecol. 2005, 30, 148–161. [Google Scholar] [CrossRef]
- Van, d.W.A.; Rhem, G.; Korevaar, H.; Schouten, A.J.; Gajmjagers, O.A.; Rutgers, M.; Mulder, C. Dissimilar response of plant and soil biota communities to long-term nutrient addition in grasslands. Biol. Fertil. Soils 2009, 45, 663–667. [Google Scholar]
- Cusack, D.F.; Firestone, M.K. Changes in microbial community characteristics and soil organic matter with nitrogen additions in two tropical forests. Ecology 2011, 92, 621–632. [Google Scholar] [CrossRef] [PubMed]
- Wall, D.H.; Bardgett, R.D.; Kelly, E. Biodiversity in the dark. Nat. Geosci. 2010, 3, 297–298. [Google Scholar] [CrossRef]
- Kudrin, A.A.; Tsurikov, S.M.; Tiunov, A.V. Trophic position of microbivorous and predatory soil nematodes in a boreal forest as indicated by stable isotope analysis. Soil Biol. Biochem. 2015, 86, 193–200. [Google Scholar] [CrossRef]
- Li, J.; Wen, Y.C.; Li, X.H.; Li, Y.T.; Yang, X.D.; Lin, Z.; Song, Z.Z.; Cooper, J.M.; Zhao, B.Q. Soil labile organic carbon fractions and soil organic carbon stocks as affected by long-term organic and mineral fertilization regimes in the North China Plain. Soil Tillage Res. 2018, 175, 281–290. [Google Scholar] [CrossRef]
- Fenn, M.E.; Baron, J.S.; Allen, E.B.; Rueth, H.M.; Nydick, K.R.; Geiser, L.; Bowman, W.D.; Sickman, J.O.; Meixner, T.; Johnson, D.W. Ecological Effects of Nitrogen Deposition in the Western United States. Bioscience 2003, 53, 404–420. [Google Scholar] [CrossRef]
- Fu, G.; Shen, Z.X. Response of alpine soils to nitrogen addition on the Tibetan Plateau: A meta-analysis. Appl. Soil Ecol. 2017, 114, 99–104. [Google Scholar] [CrossRef]
- Lu, X.; Mo, J.; Gilliam, F.S.; Zhou, G.; Fang, Y. Effects of experimental nitrogen additions on plant diversity in an old-growth tropical forest. Glob. Chang. Biol. 2010, 16, 2688–2700. [Google Scholar] [CrossRef]
- Xu, C.; Geng, Q.; Guo, L.; Li, Q.; Cheng, X.; Luo, Y.; Ruan, H.; Xu, X. Variation in Soil Carbon Content in Response to Long-Term Nitrogen Addition in Poplar Plantations (Populus Deltoids) on the East Coast of China. in preparation.
- Wei, C.; Zheng, H.; Li, Q.; Lü, X.; Yu, Q.; Zhang, H.; Chen, Q.; He, N.; Kardol, P.; Liang, W. Nitrogen Addition Regulates Soil Nematode Community Composition through Ammonium Suppression. PLoS ONE 2012, 7, e43384. [Google Scholar] [CrossRef] [PubMed]
- Guo, J.H.; Liu, X.J.; Zhang, Y.; Shen, J.L.; Han, W.X.; Zhang, W.F.; Christie, P.; Goulding, K.W.T.; Vitousek, P.M.; Zhang, F.S. Significant Acidification in Major Chinese Croplands. Science 2010, 327, 1008–1010. [Google Scholar] [CrossRef] [PubMed]
- Collange, B.; Navarrete, M.; Peyre, G.; Mateille, T.; Tchamitchian, M. Root-knot nematode (Meloidogyne) management in vegetable crop production: The challenge of an agronomic system analysis. Crop Prot. 2011, 30, 1251–1262. [Google Scholar] [CrossRef]
- Pinho, P.; Theobald, M.R.; Dias, T.; Tang, Y.S.; Cruz, C.; Martinsloução, M.A.; Máguas, C.; Sutton, M.; Branquinho, C. Critical loads of nitrogen deposition and critical levels of atmospheric ammonia for semi-natural Mediterranean evergreen woodlands. Biogeosciences 2012, 9, 1205–1215. [Google Scholar] [CrossRef]
- Yang, J.-Y.; Fan, J. Review of study on mineralization, saturation and cycle of Nitrogen in forest ecosystems. J. For. Res. 2003, 14, 239–243. [Google Scholar]
- Van Diepen, L.T.A.; Lilleskov, E.A.; Pregitzer, K.S.; Miller, R.M. Simulated Nitrogen Deposition Causes a Decline of Intra- and Extraradical Abundance of Arbuscular Mycorrhizal Fungi and Changes in Microbial Community Structure in Northern Hardwood Forests. Ecosystems 2010, 13, 683–695. [Google Scholar] [CrossRef]
- Högberg, M.N.; Briones, M.J.I.; Keel, S.G.; Metcalfe, D.B.; Campbell, C.; Midwood, A.J.; Thornton, B.; Hurry, V.; Linder, S.; Näsholm, T. Quantification of effects of season and nitrogen supply on tree below-ground carbon transfer to ectomycorrhizal fungi and other soil organisms in a boreal pine forest. New Phytol. 2010, 187, 485–493. [Google Scholar] [CrossRef]
- Doblasmiranda, E.; Sánchezpiñero, F.; Gonzálezmegías, A. Vertical distribution of soil macrofauna in an arid ecosystem: Are litter and belowground compartmentalized habitats? Pedobiologia 2009, 52, 361–373. [Google Scholar] [CrossRef]
- Wei, H.; Liu, W.; Zhang, J.; Qin, Z. Effects of simulated acid rain on soil fauna community composition and their ecological niches. Environ. Pollut. 2016, 220, 460–468. [Google Scholar] [CrossRef]
- Rusek, J.; Marshall, V.G. Impacts of Airborne Pollutants on Soil Fauna. Annu. Rev. Ecol. Syst. 2000, 31, 395–423. [Google Scholar] [CrossRef]
- Wang, S.; Ruan, H. Effects of soil mesofauna and microclimate on nitrogen dynamics in leaf litter decomposition along an elevation gradient. Afr. J. Biotechnol. 2011, 10, 6732–6742. [Google Scholar]
- Li, Q.; Bai, H.; Liang, W.; Xia, J.; Wan, S.; Wh, V.D.P. Nitrogen addition and warming independently influence the belowground micro-food web in a temperate steppe. PLoS ONE 2013, 8, e60441. [Google Scholar] [CrossRef] [PubMed]
- Hishi, T.; Fujimaki, R.; McGonigle, T.P.; Takeda, H. Relationships among fine roots, fungal hyphae and soil microarthropods among different soil microhabitats in a temperate coniferous forest of Chamaecyparis obtusa. Eur. J. Soil Biol. 2008, 44, 473–477. [Google Scholar] [CrossRef]
- Bradford, M.A. Re-visioning soil food webs. Soil Biol. Biochem. 2016, 102, 1–3. [Google Scholar] [CrossRef]
- Pollierer, M.M.; Langel, R.; Körner, C.; Maraun, M.; Scheu, S. The underestimated importance of belowground carbon input for forest soil animal food webs. Ecol. Lett. 2007, 10, 729–736. [Google Scholar] [CrossRef] [PubMed]
- Mcnaughton, S.J.; Oesterheld, M.; Frank, D.A.; Williams, K.J. Ecosystem-level patterns of primary productivity and herbivory in terrestrial habitats. Nature 1989, 341, 142–144. [Google Scholar] [CrossRef]
- Du, E.; de Vries, W. Nitrogen-induced new net primary production and carbon sequestration in global forests. Environ. Pollut. 2018, 242, 1476–1487. [Google Scholar] [CrossRef]


© 2019 by the authors. Licensee MDPI, Basel, Switzerland. This article is an open access article distributed under the terms and conditions of the Creative Commons Attribution (CC BY) license (http://creativecommons.org/licenses/by/4.0/).