Article

RCS-HFPN-YOLOV11: A New Small Target Detection Model

Sino-European Institute of Aviation Engineering, Civil Aviation University of China, Tianjin 300300, China
*
Author to whom correspondence should be addressed.
Algorithms 2026, 19(4), 306; https://doi.org/10.3390/a19040306
Submission received: 4 March 2026 / Revised: 9 April 2026 / Accepted: 9 April 2026 / Published: 13 April 2026
(This article belongs to the Special Issue Deep Neural Networks and Optimization Algorithms (2nd Edition))

Abstract

Despite over two decades of advancement in object detection, achieving high accuracy for small target detection in practical applications remains an unresolved challenge. This paper proposes a novel small-object detection model to address this issue. The model incorporates three key innovations: first, the RCSOSA module, which optimizes feature information transmission through dynamic channel interaction and multi-scale feature coordination; second, the HFPN module, a three-branch multi-scale feature fusion network that integrates local and global features by combining CNN and Transformer architectures to enhance semantic details; and third, the NWD-CIoU loss function, which dynamically adjusts the weights of NWD and CIoU losses based on the training phase. Experimental results on the COCO dataset demonstrate that our model improves detection accuracy by 4% over YOLOv11 and achieves state-of-the-art performance among mainstream models while maintaining a real-time inference speed of no less than 60 FPS. Furthermore, validation on the VisDrone dataset confirms the model’s strong generalization capability. The proposed algorithm significantly enhances small target detection accuracy, effectively mitigating a critical limitation in current practical object detection applications.

1. Introduction

Object detection, a cornerstone of computer vision, focuses on the automatic identification and localization of objects in images. This technology has been successfully utilized in a range of domains, such as automated quality control [1], UAV piloting [2], and secure transaction authentication [3]. Progress in this field is vital for the successful real-world deployment of AI applications. The advent of large-scale AI models in recent years has led to significant improvements in both the accuracy and generalization performance of object detectors. Consequently, researchers have begun exploring the integration of object detection with large AI models [4,5] and augmented reality (AR) technologies, forming a multi-level technical synergy. Within this integrated framework, object detection ensures data verification, large AI models facilitate data processing, and AR systems provide an interface for virtual–real fusion and real-time interaction, thereby establishing a closed perception–decision–interaction loop. Thus, advancing research in object detection holds substantial significance.
Considerable research efforts have been devoted to the development of object detection methodologies. The landscape of contemporary object detection is primarily composed of three methodological streams: traditional techniques, methods founded on deep learning, and specialized algorithms designed for detecting small objects. Traditional approaches primarily rely on handcrafted feature extractors and machine learning techniques, with representative methods including HOG [6], HAAR [7], DPM [8], SURF [9], and SIFT [10]. In contrast, deep learning-based object detection algorithms are typically divided into two-stage and one-stage paradigms based on their architectural design. Two-stage detectors first generate a set of candidate object proposals and subsequently classify these proposals using convolutional neural networks (CNNs). Prominent examples in this category include RCNN [11], Fast R-CNN [12], Faster R-CNN [13], and FPN [14]. One-stage detectors, by contrast, bypass the proposal generation step and directly formulate object localization as a regression problem. Well-known one-stage algorithms include the YOLO series [15,16], SSD [17], and RetinaNet [18]. This fundamental architectural distinction leads to inherent performance trade-offs: two-stage methods typically excel in detection accuracy and localization precision, whereas one-stage methods offer superior inference speed.
Small-object detection, a specialized branch within the broader field, faces enduring difficulties. These stem from the low spatial resolution and the paucity of distinctive features characteristic of small objects, both of which hinder reliable identification and localization. Consequently, a diverse array of methodological innovations has emerged in recent years to tackle these problems.
The BRA-YOLOv10 model, presented by Zhang et al. (2025) [19] for drone-based object detection, features a Bi-Level Routing Attention mechanism and a high-resolution small-object detection layer, which enabled it to reach 96.5% mAP@0.5 on drone image datasets. In a similar vein, Zhang et al. (2023) [20] developed Drone-YOLO, which combines multi-scale feature fusion with the RepVGG module, resulting in a 17.4% improvement in mAP@0.5 on the VisDrone2019 dataset. Bai (2025) [21] proposed the SFFEF-YOLO model, which incorporates a fine-grained feature extraction module (FIEM) and an SPD-Conv module, yielding a 9.9% increase in mAP on the VisDrone2019 dataset. Zhang (2025) [22] developed MASNet, which integrates spatial depth convolution (SPDConv) with a global–local spatial attention mechanism (GLSA), achieving an mAP of 52.2% in drone object detection tasks. Li et al. (2025) [23] constructed CSFCANet, employing a channel-spatial fusion cross-attention mechanism to enhance scale sequence fusion and local–global feature modeling, leading to a 7% mAP improvement across multiple datasets, including VisDrone, UAVDT, and PIDrone. Wang et al. (2023) [24] introduced a small target detection component (STC) and a global attention mechanism (GAM) based on improvements to YOLOv8, elevating small-object detection accuracy in drone images to an mAP of 39.3%, which represents a 4.4% increase over the baseline. Finally, Zhao et al. (2023) [25] combined a Transformer encoder, GAM, and coordinate attention mechanism (CA) to develop TGC-YOLOv5, enhancing the average precision (AP) to 0.848 on the SUAV-DATA dataset, with a 2.5% improvement.
In the field of industrial defect detection, Hu et al. (2024) [26] introduced deformable convolution and the WIoU loss function into the YOLOv8 framework for insulator defect detection tasks, achieving a 5.5% improvement in mAP. Xiao (2023) [27] proposed GRA-Net, which integrates the global perception capabilities of both CNNs and Transformers, resulting in a 4–7% increase in mIoU for defect detection tasks. Qu (2023) [28] optimized the YOLOv5 architecture for aero-engine defect detection by incorporating a dual-path attention mechanism and the CARAFE upsampling module, reducing the number of parameters by 11.7% while simultaneously increasing mAP by 10.6%. Jiang (2023) [29] developed the RAR-SSD model, which combines the RFB module with attention mechanisms for PCB defect detection, achieving a 4.85% improvement in the F1 score. Huang et al. (2023) [30] constructed the TBi-YOLOv5 model for crane wire rope defect detection, enhancing multi-scale feature extraction capabilities by introducing the Bottleneck Transformer (BOT) and bidirectional feature pyramid network (BiFPN), resulting in a 4% increase in mAP. Furthermore, Zhang et al. (2025) [31] developed the YOLO-BS model for traffic sign detection, incorporating a small-object detection layer and BiFPN, achieving an mAP@0.5 of 90.1% and 78 FPS on the TT100K dataset, effectively balancing detection accuracy with real-time performance.
In the field of agricultural disease detection, Bai et al. (2024) [32] proposed an enhanced YOLOv7 model by integrating a Swin Transformer prediction head and a GS-ELAN optimization module, achieving an mAP of 92.1% for detecting strawberry seedling flowers and fruits. Lv and Su (2024) [33] further advanced YOLOv5 by incorporating CBAM and Transformer modules for apple leaf disease detection, achieving an mAP@0.5 of 73.4%. Notably, their model demonstrated significant improvement in distinguishing visually similar diseases.
While a multitude of strategies has been developed to improve small-object detection, a common issue among high-performance models like RT-DETR [34] is their reliance on considerable computational resources, resulting in increased inference latency. This creates a clear conflict with the stringent real-time requirements of practical applications.
While a 30 FPS refresh rate proves satisfactory for real-time needs in low-dynamic settings (e.g., video analytics, surveillance, industrial inspection), far more stringent requirements exist for high-dynamic/high-speed applications. These include autonomous driving, real-time industrial monitoring, UAV obstacle avoidance, live video analysis, high-speed tracking, robotic surgery, and VR, where maintaining at least 60 FPS is essential for ensuring operational fluency and response accuracy. Achieving high-accuracy small-object detection under such high-frame-rate (≥60 FPS) constraints thus represents a significant and pressing technical hurdle.
In response to the aforementioned difficulties, we develop a new object detection framework in this work. The core contribution of this work lies not in designing a novel infrastructure from scratch, but rather in the targeted enhancement and novel synthesis of established, high-performance modules, tailored specifically for small-object detection. This approach seeks to strike an improved trade-off between detection accuracy and inference speed. Our primary innovations are threefold:
(1)
RCSOSA Module (Reduced Channel Spatial Object Attention): Designed to augment the model’s spatial attentiveness, this module compresses the channel dimension of feature maps while preserving essential spatial representations. By refining the feature extraction process, RCSOSA markedly elevates accuracy in detecting small objects and concurrently alleviates computational load, rendering it appropriate for applications demanding real-time performance.
(2)
HFPN Module (Hierarchical Feature Pyramid Network): We introduce a three-branch architecture for multi-scale feature fusion, which amalgamates the proficiency of Convolutional Neural Networks (CNNs) in capturing local patterns with the aptitude of Transformers in comprehending global context. This integrated approach facilitates a comprehensive representation encompassing fine-grained local details and high-level semantic information, thereby bolstering the model’s adaptability in identifying objects across different sizes, especially those that are small.
(3)
Fused Loss Function Design: Our approach integrates the Normalized Wasserstein Distance (NWD) loss—noted for its heightened sensitivity to small objects—with a dynamically adjusted weighting scheme throughout the training phase, forming a composite loss function. This formulation promotes alignment in both the statistical distribution and the spatial geometry of predicted bounding boxes. Moreover, the adaptive weighting mechanism improves training stability for multi-scale objects, diminishes the need for extensive hyperparameter search, and contributes to more efficient training and better model generalization.

2. Materials and Methods

2.1. Baseline Model

The YOLOv11 [35] algorithm comprises five different versions: YOLOv11n, YOLOv11s, YOLOv11m, YOLOv11l, and YOLOv11x. Each version exhibits a trade-off among model parameter size, detection accuracy, and inference speed. Specifically, YOLOv11n has the smallest number of parameters and the fastest inference speed; however, correspondingly, it achieves the lowest detection accuracy among the five versions. Conversely, YOLOv11x delivers the highest detection accuracy, while also possessing the largest parameter size and the slowest inference speed.
Given that this study focuses on high real-time small-object detection scenarios with stringent requirements on inference speed, the fastest YOLOv11n model is selected as the baseline for improvements and comparative experiments.
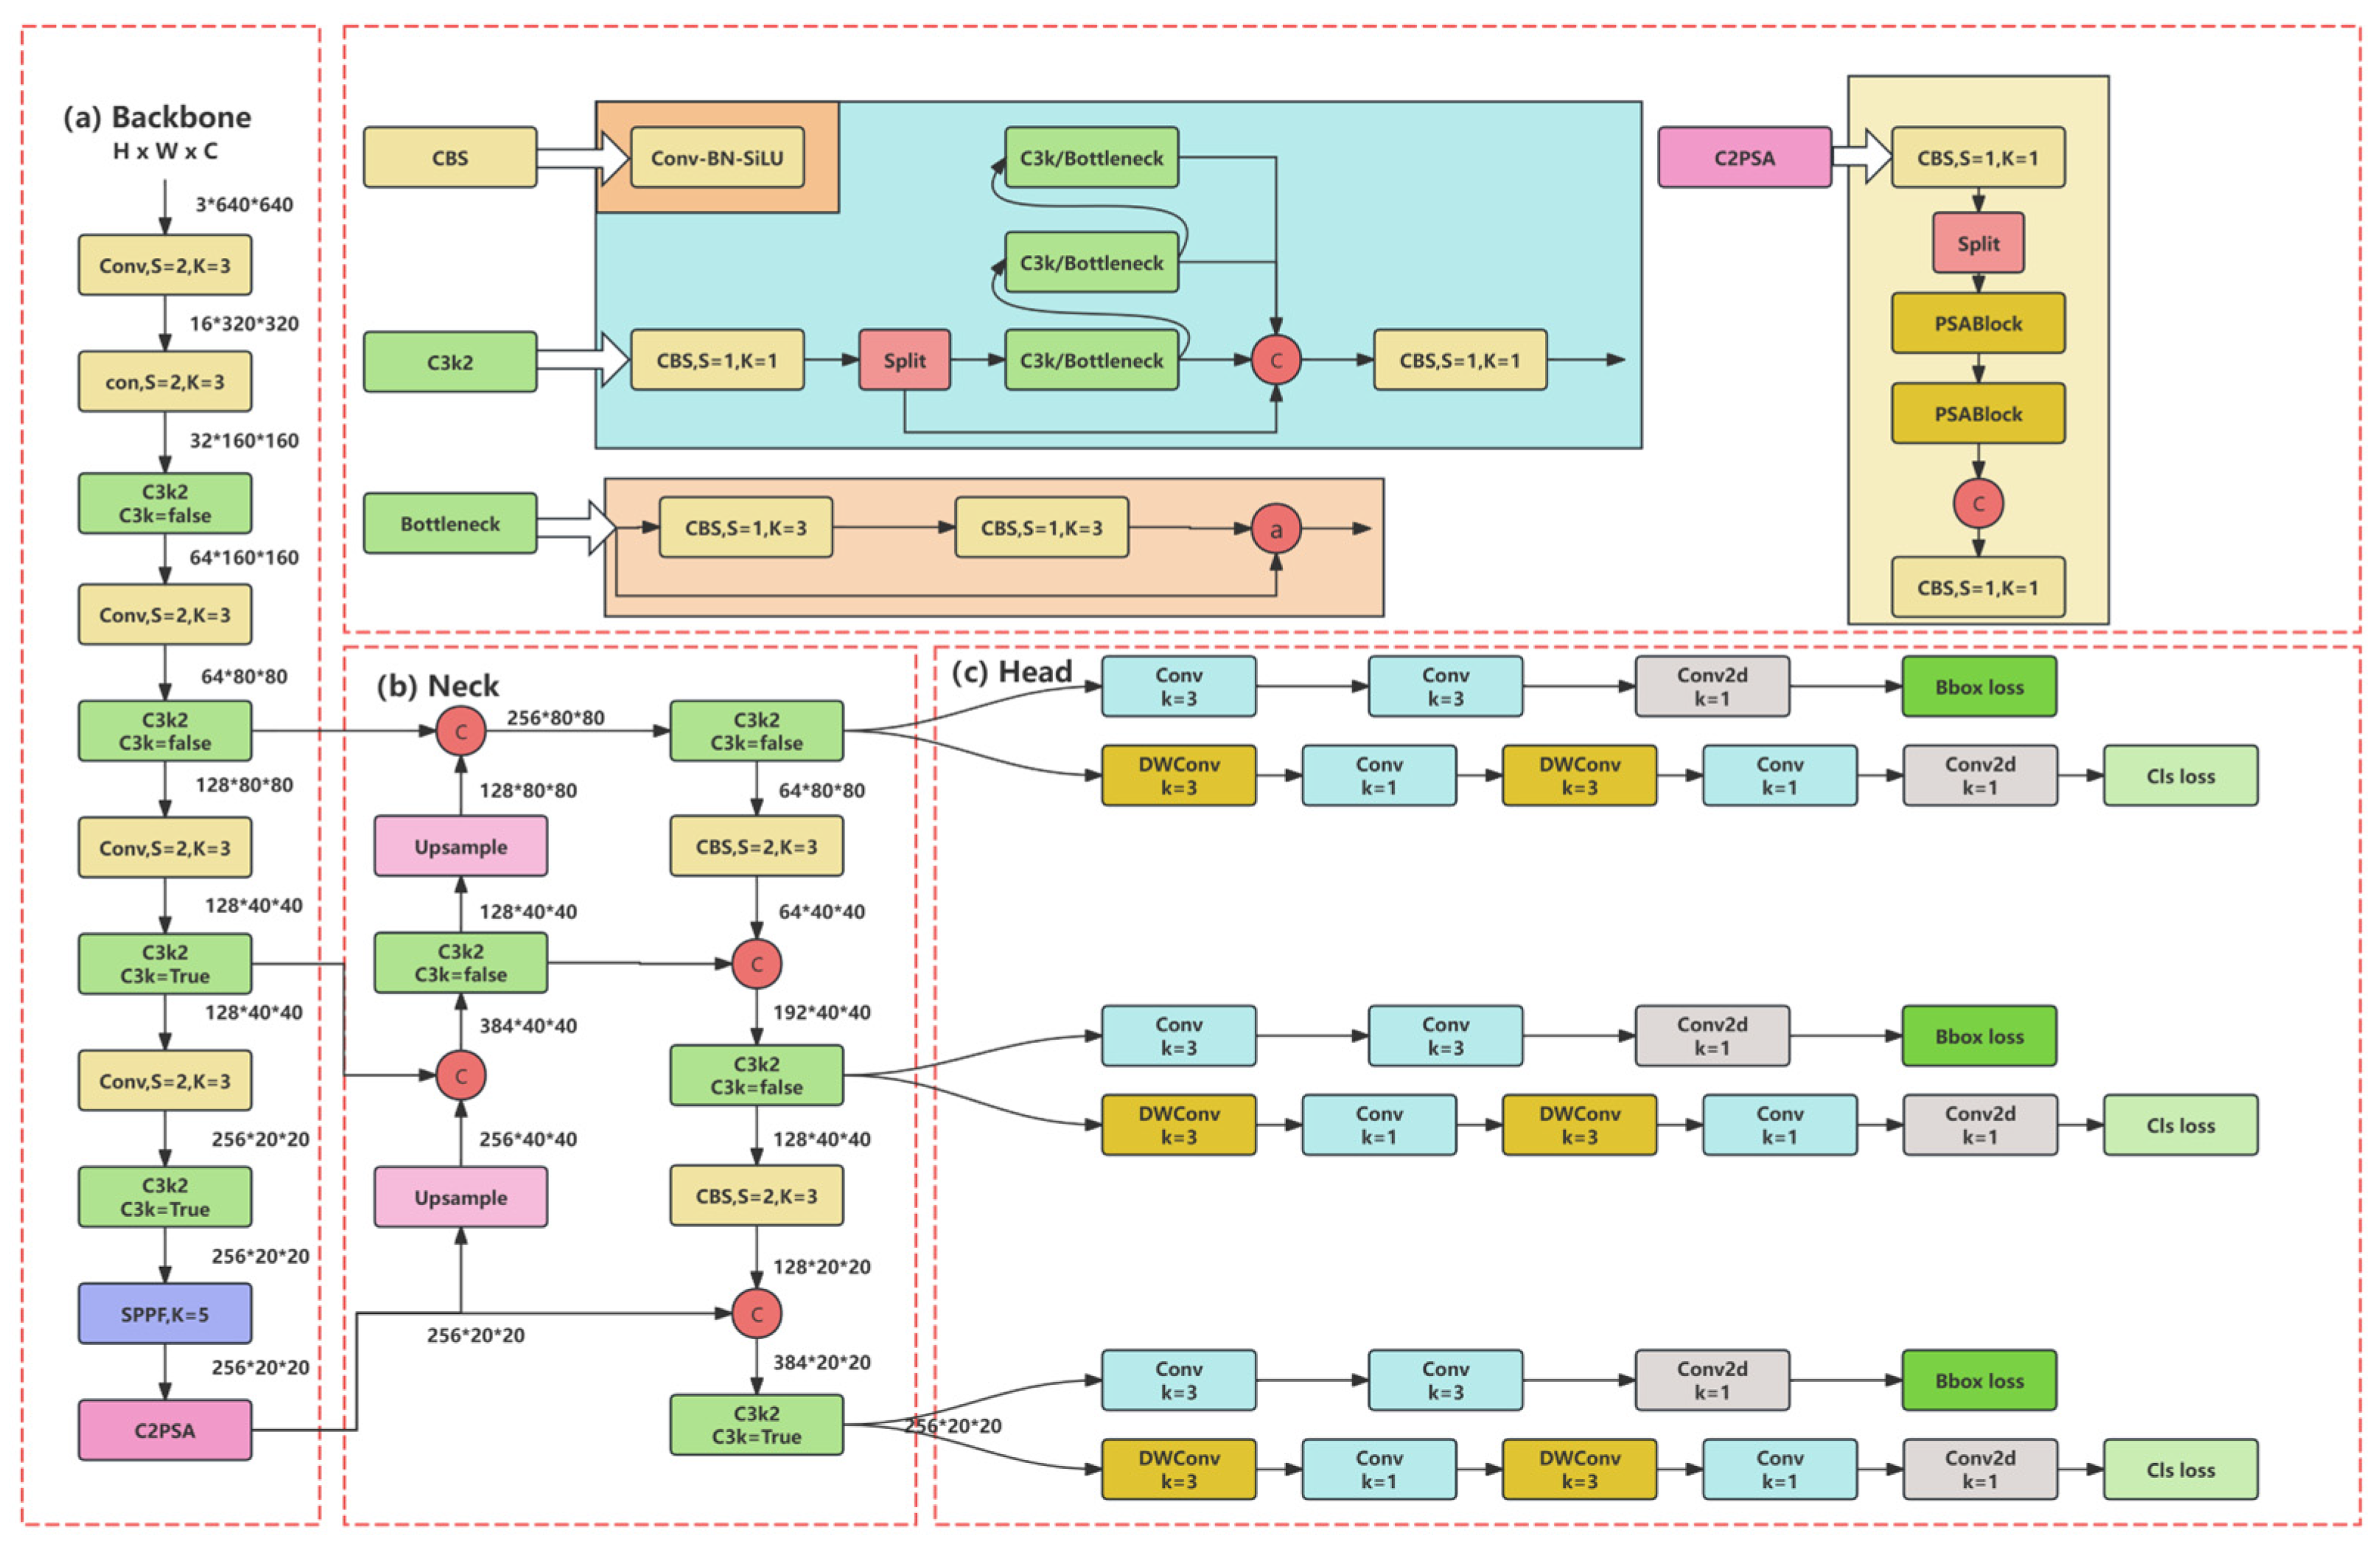
Architecturally, the YOLOv11n framework is composed of a backbone, a neck, and a head. In the pipeline, these modules are responsible for hierarchically extracting features, fusing them across different scales, and finally generating predictions for object categories and their bounding boxes. The overall architecture is depicted in Figure 1.
The primary structure is illustrated in the corresponding figure. The following sections describe the structure and functions of each module in detail.
Serving as the feature extractor, the backbone derives a hierarchy of semantic representations from the input. It comprises several modules, including the CBS module, C3k2 module, SPPF module, and C2PSA module. These modules achieve efficient feature extraction and compression through a combination of convolution, pooling, and attention mechanisms. The CBS module (Conv + BN + SiLU) integrates convolution (Conv2d), batch normalization (Batch Normalization), and the activation function SiLU (also known as Swish; Ramachandran et al., 2017) [36]. The autopad strategy is employed to maintain feature map dimensions, effectively preventing boundary information loss. The bottleneck structure, inspired by ResNet’s residual connections (He et al., 2016) [37], reduces channel dimensions to compress parameters while preserving critical information and improving training stability. The SPPF module (Spatial Pyramid Pooling–Fast) replaces a single large-kernel pooling operation with a cascade of multiple smaller kernels, maintaining receptive field expansion without increasing computational cost, thereby enhancing operational efficiency and feature fusion.
As an enhanced iteration of the standard C3 module, the C3k2 module incorporates deformable convolution kernels alongside channel separation strategies. This combination serves to increase the diversity and adaptive capacity of features. Figure 2 depicts the standard workflow of the C3k2 module. Initially, the input feature map is divided into two pathways. The first pathway is processed by a direct convolution operation, whereas the second pathway is fed into a series of C3k or bottleneck modules for more profound feature extraction. Subsequently, the features from both pathways are concatenated and integrated using a 1 × 1 convolutional layer.
The neck architecture of YOLOv11n integrates the Feature Pyramid Network (FPN) and Path Aggregation Network (PAN) to enhance information flow and fusion across different feature levels. The FPN constructs a feature pyramid through lateral connections, facilitating the extraction of multi-scale semantic information. However, the conventional FPN’s upsampling operations can introduce noise, leading to blurred high-level semantic features. The PAN architecture mitigates this issue by introducing an additional bottom-up pathway. This addition facilitates bidirectional information flow, where low-level spatial details and high-level semantic context are fused. Consequently, the model gains improved perception of objects at various scales, leading to better detection accuracy, with notable gains for small targets.
The detection head of YOLOv11 introduces Depthwise Separable Convolution (DWConv) in the classification branch (cls) to improve detection efficiency and reduce the number of parameters. Depthwise convolution applies a separate convolution kernel to each input channel individually, significantly lowering computational complexity, while pointwise convolution (1 × 1 Conv) integrates features across channels to enhance feature representation. The combination of these two operations in depthwise separable convolution substantially compresses the model size and computational cost while maintaining accuracy. Ultimately, the detection head outputs include the target’s bounding box coordinates and class confidence scores, enabling accurate localization and classification.

2.2. Proposed Model

2.2.1. RCS-HFPN-YOLOV11 Model

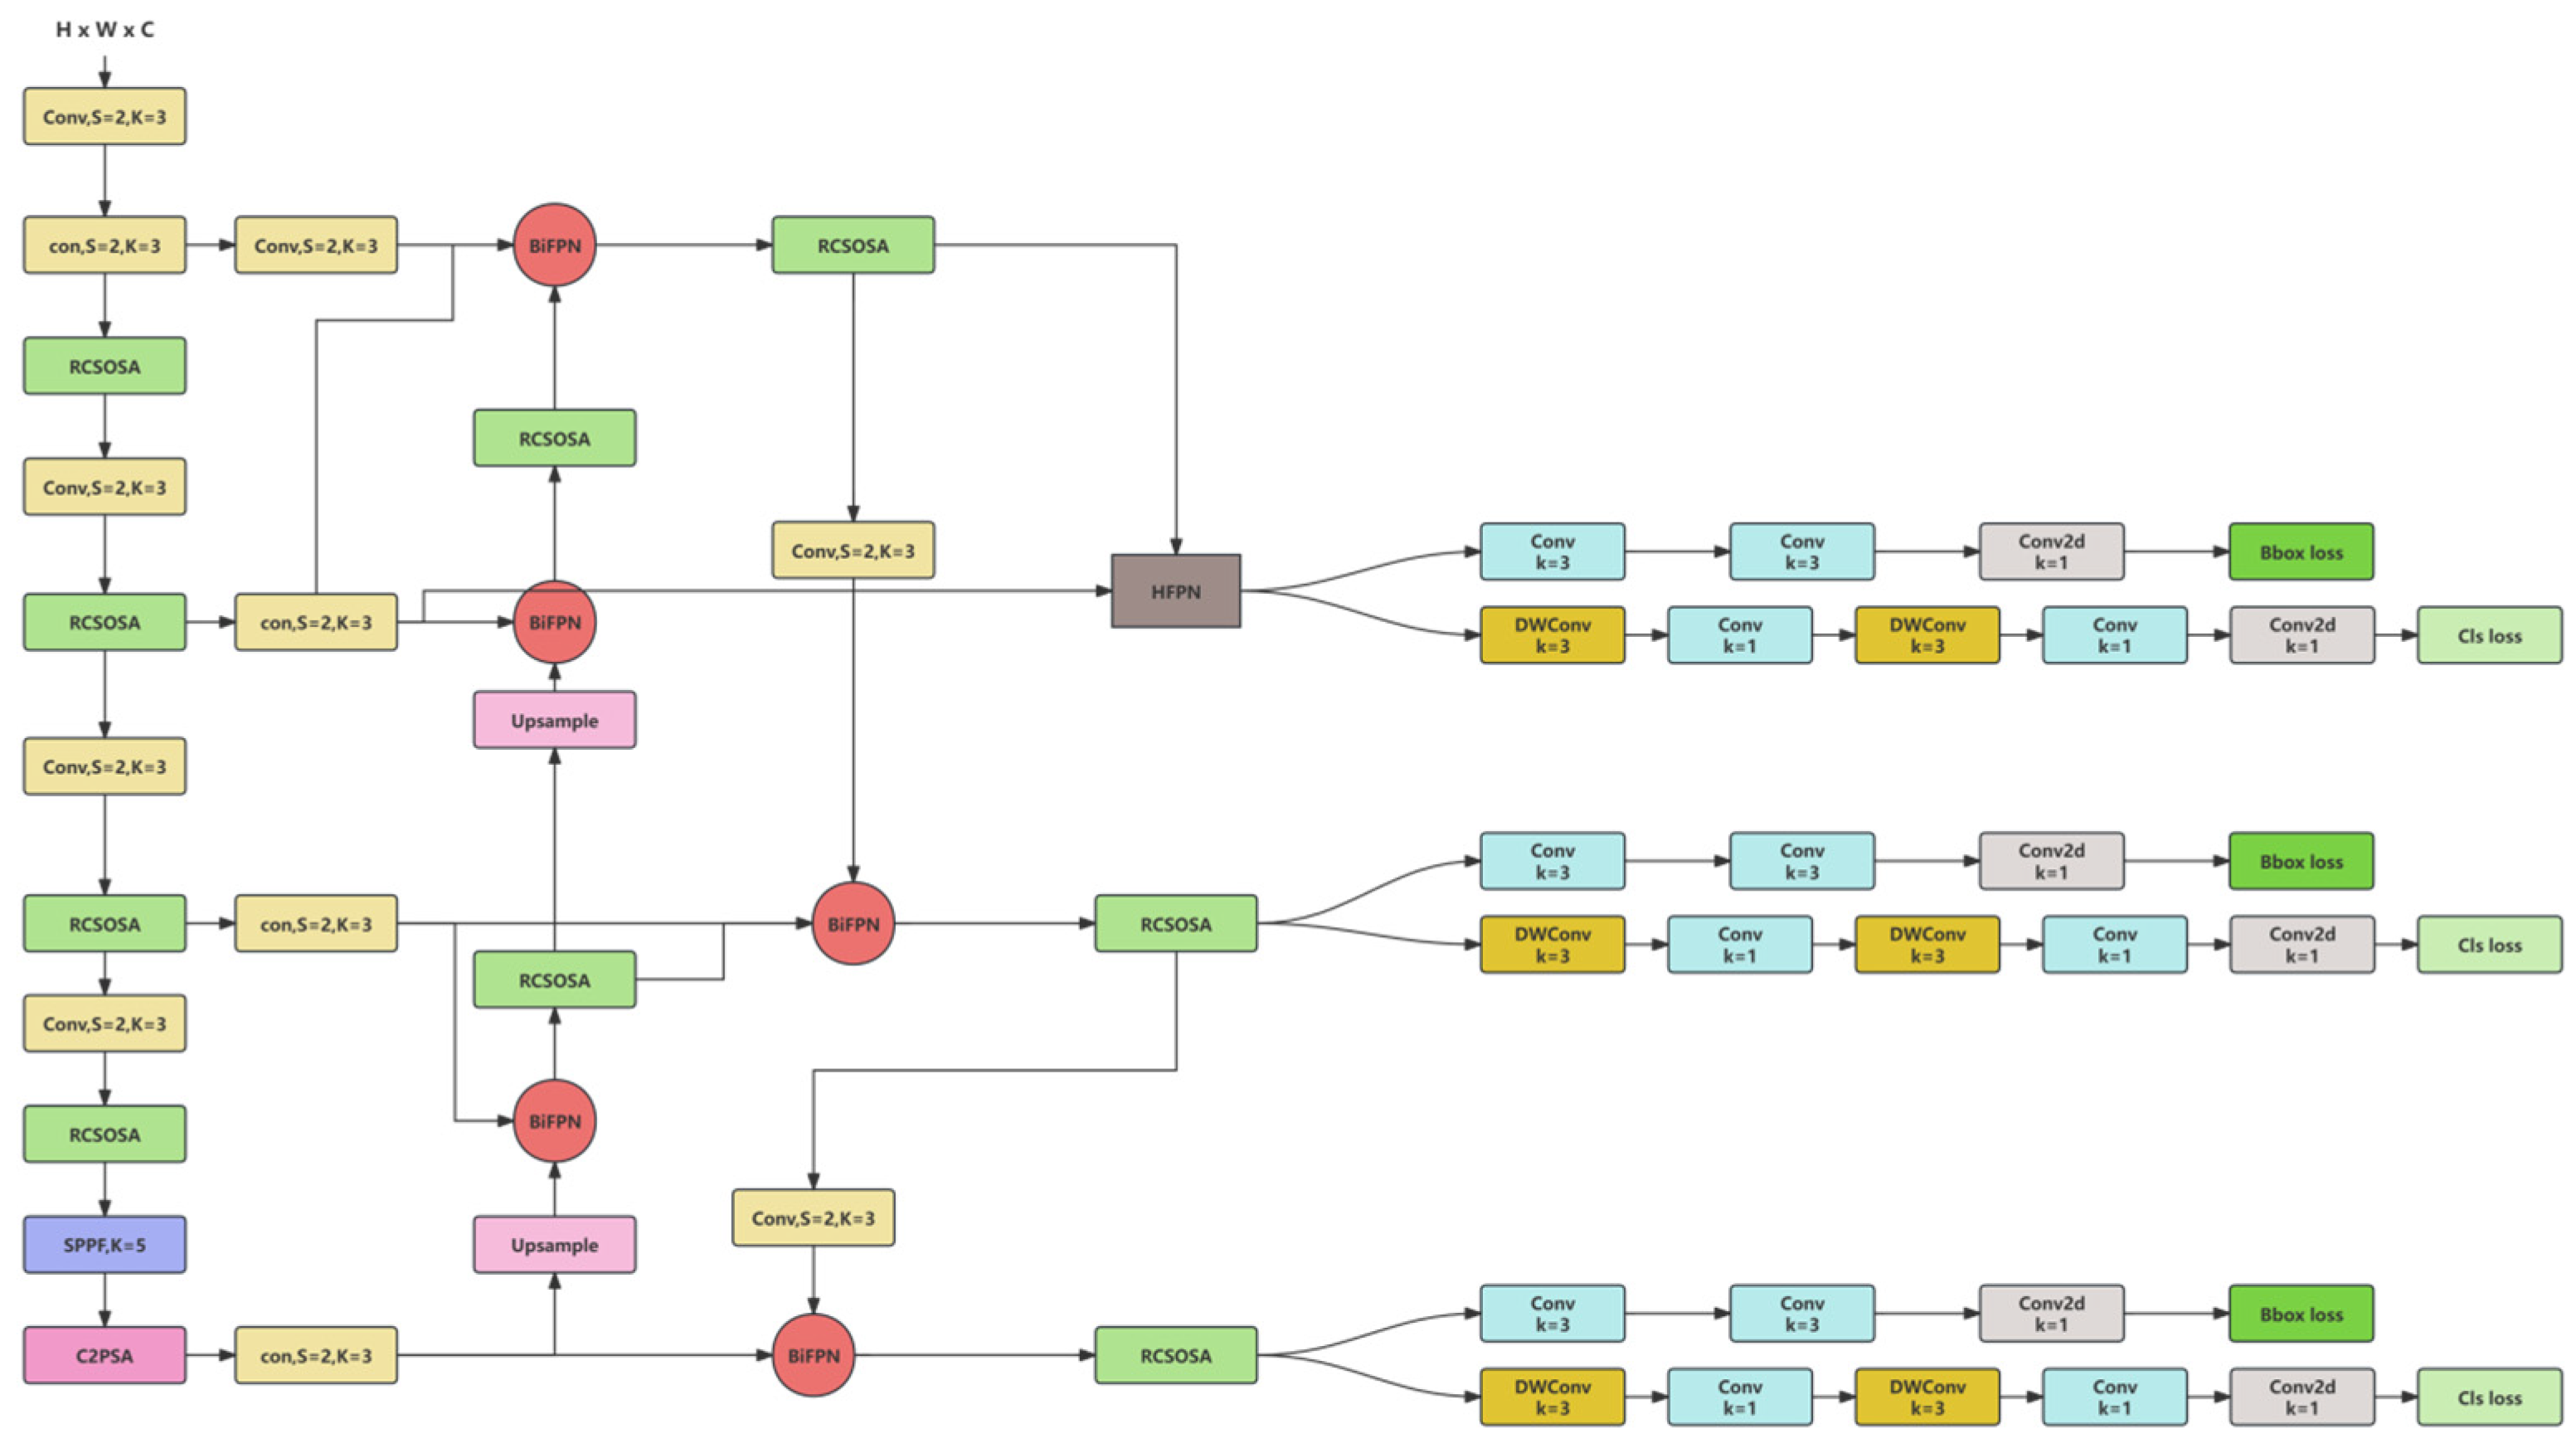
To address the accuracy degradation caused by limited feature information in small-object detection, this study proposes two structural improvements based on YOLOv11. The overall improved architecture is illustrated in Figure 2. First, the original C3k2 module in the YOLOv11 backbone is replaced with the RCSOSA [38] (Reduced Channel Spatial One-Shot Aggregation) module. This module reduces redundant features by compressing channel dimensions while enhancing the model’s sensitivity to spatially critical regions, thereby improving feature extraction and detection accuracy for small objects without sacrificing computational efficiency. Second, a novel feature fusion module named HFPN [39] (Hierarchical Feature Pyramid Network) is constructed. HFPN adopts a three-branch hierarchical multi-scale feature fusion structure that integrates CNNs’ local modeling capability with Transformers’ global representation ability, enabling effective fusion of local features, global features, and intermediate semantic information. The fused features undergo global average pooling and layer normalization before being fed into a linear classifier for final prediction.
Additionally, a new fusion loss function, LNWD-C, is designed by combining the advantages of NWD (Normalized Wasserstein Distance) [40] and CIoU (Complete Intersection over Union) losses. In target localization, NWD effectively captures the distance distribution between small objects, while CIoU focuses on bounding box overlap and center distance. LNWD-C incorporates a dynamic weighting mechanism that adaptively adjusts the balance between NWD and CIoU losses throughout the training process, thereby enhancing localization accuracy and training stability for small-object detection.

2.2.2. RCSOSA Block

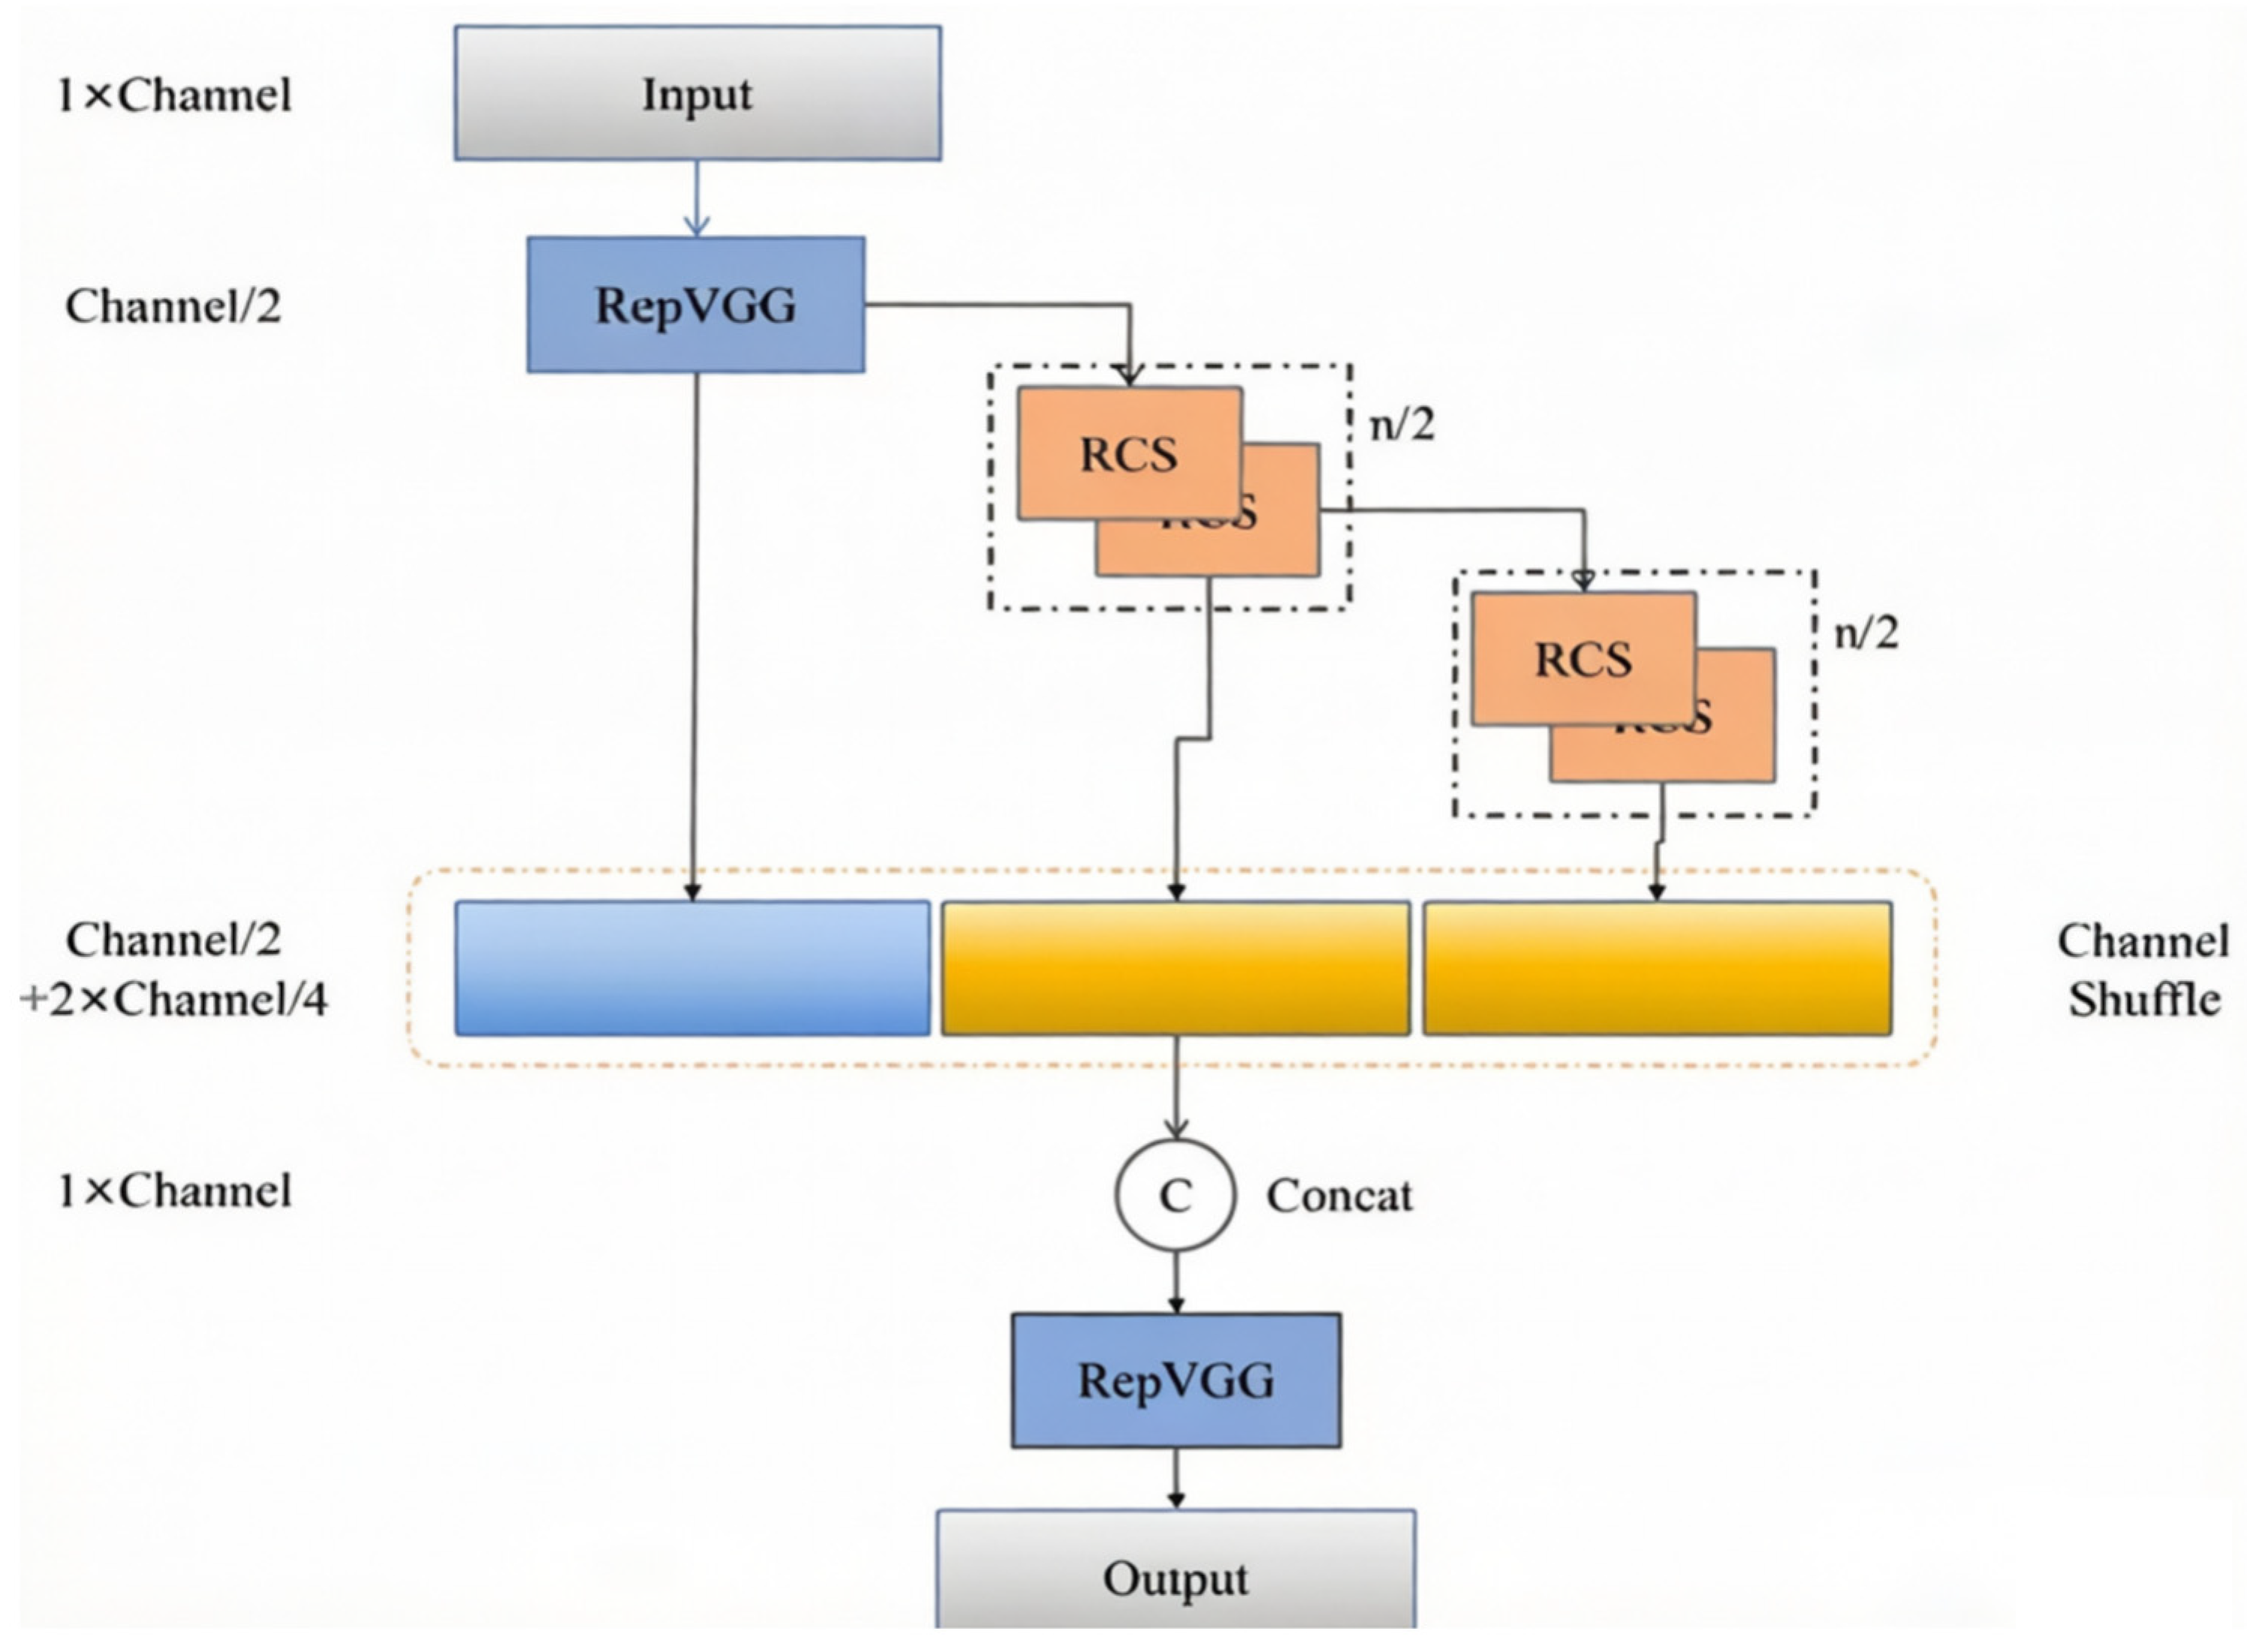
To effectively enhance feature modeling capability in small-object detection, this study replaces the original C3k2 module in YOLOv11 with a newly designed RCSOSA module (Reduced Channel Spatial One-Shot Aggregation). The overall architecture of the RCSOSA module is illustrated in Figure 3. Structurally, the RCSOSA module combines multiple stacked RCS (Reduced Channel Spatial) units to enable comprehensive feature reuse and efficient cross-level information propagation. Building upon the multi-path aggregation advantages of the traditional OSA (One-Shot Aggregation) structure, the basic convolutional units are replaced by RCS modules, and a channel split-and-shuffle mechanism is introduced to strengthen information flow interactions across channels and groups.
To further improve feature fusion, an RepVGG fusion layer is appended at the output end, enhancing computational efficiency and representational diversity during dense connectivity. The RCSOSA module design supports parallel representation of multiple receptive fields and performs one-shot aggregation at the final output to boost overall modeling efficiency. Within the module, the input features are split into two paths: one is forwarded via a direct skip connection, while the other undergoes processing through multiple stacked RCS modules. These paths are then concatenated and fused after channel shuffling. Notably, to maintain network consistency and efficiency, the RCSOSA module ensures that the input channel number matches the minimum output channel number.
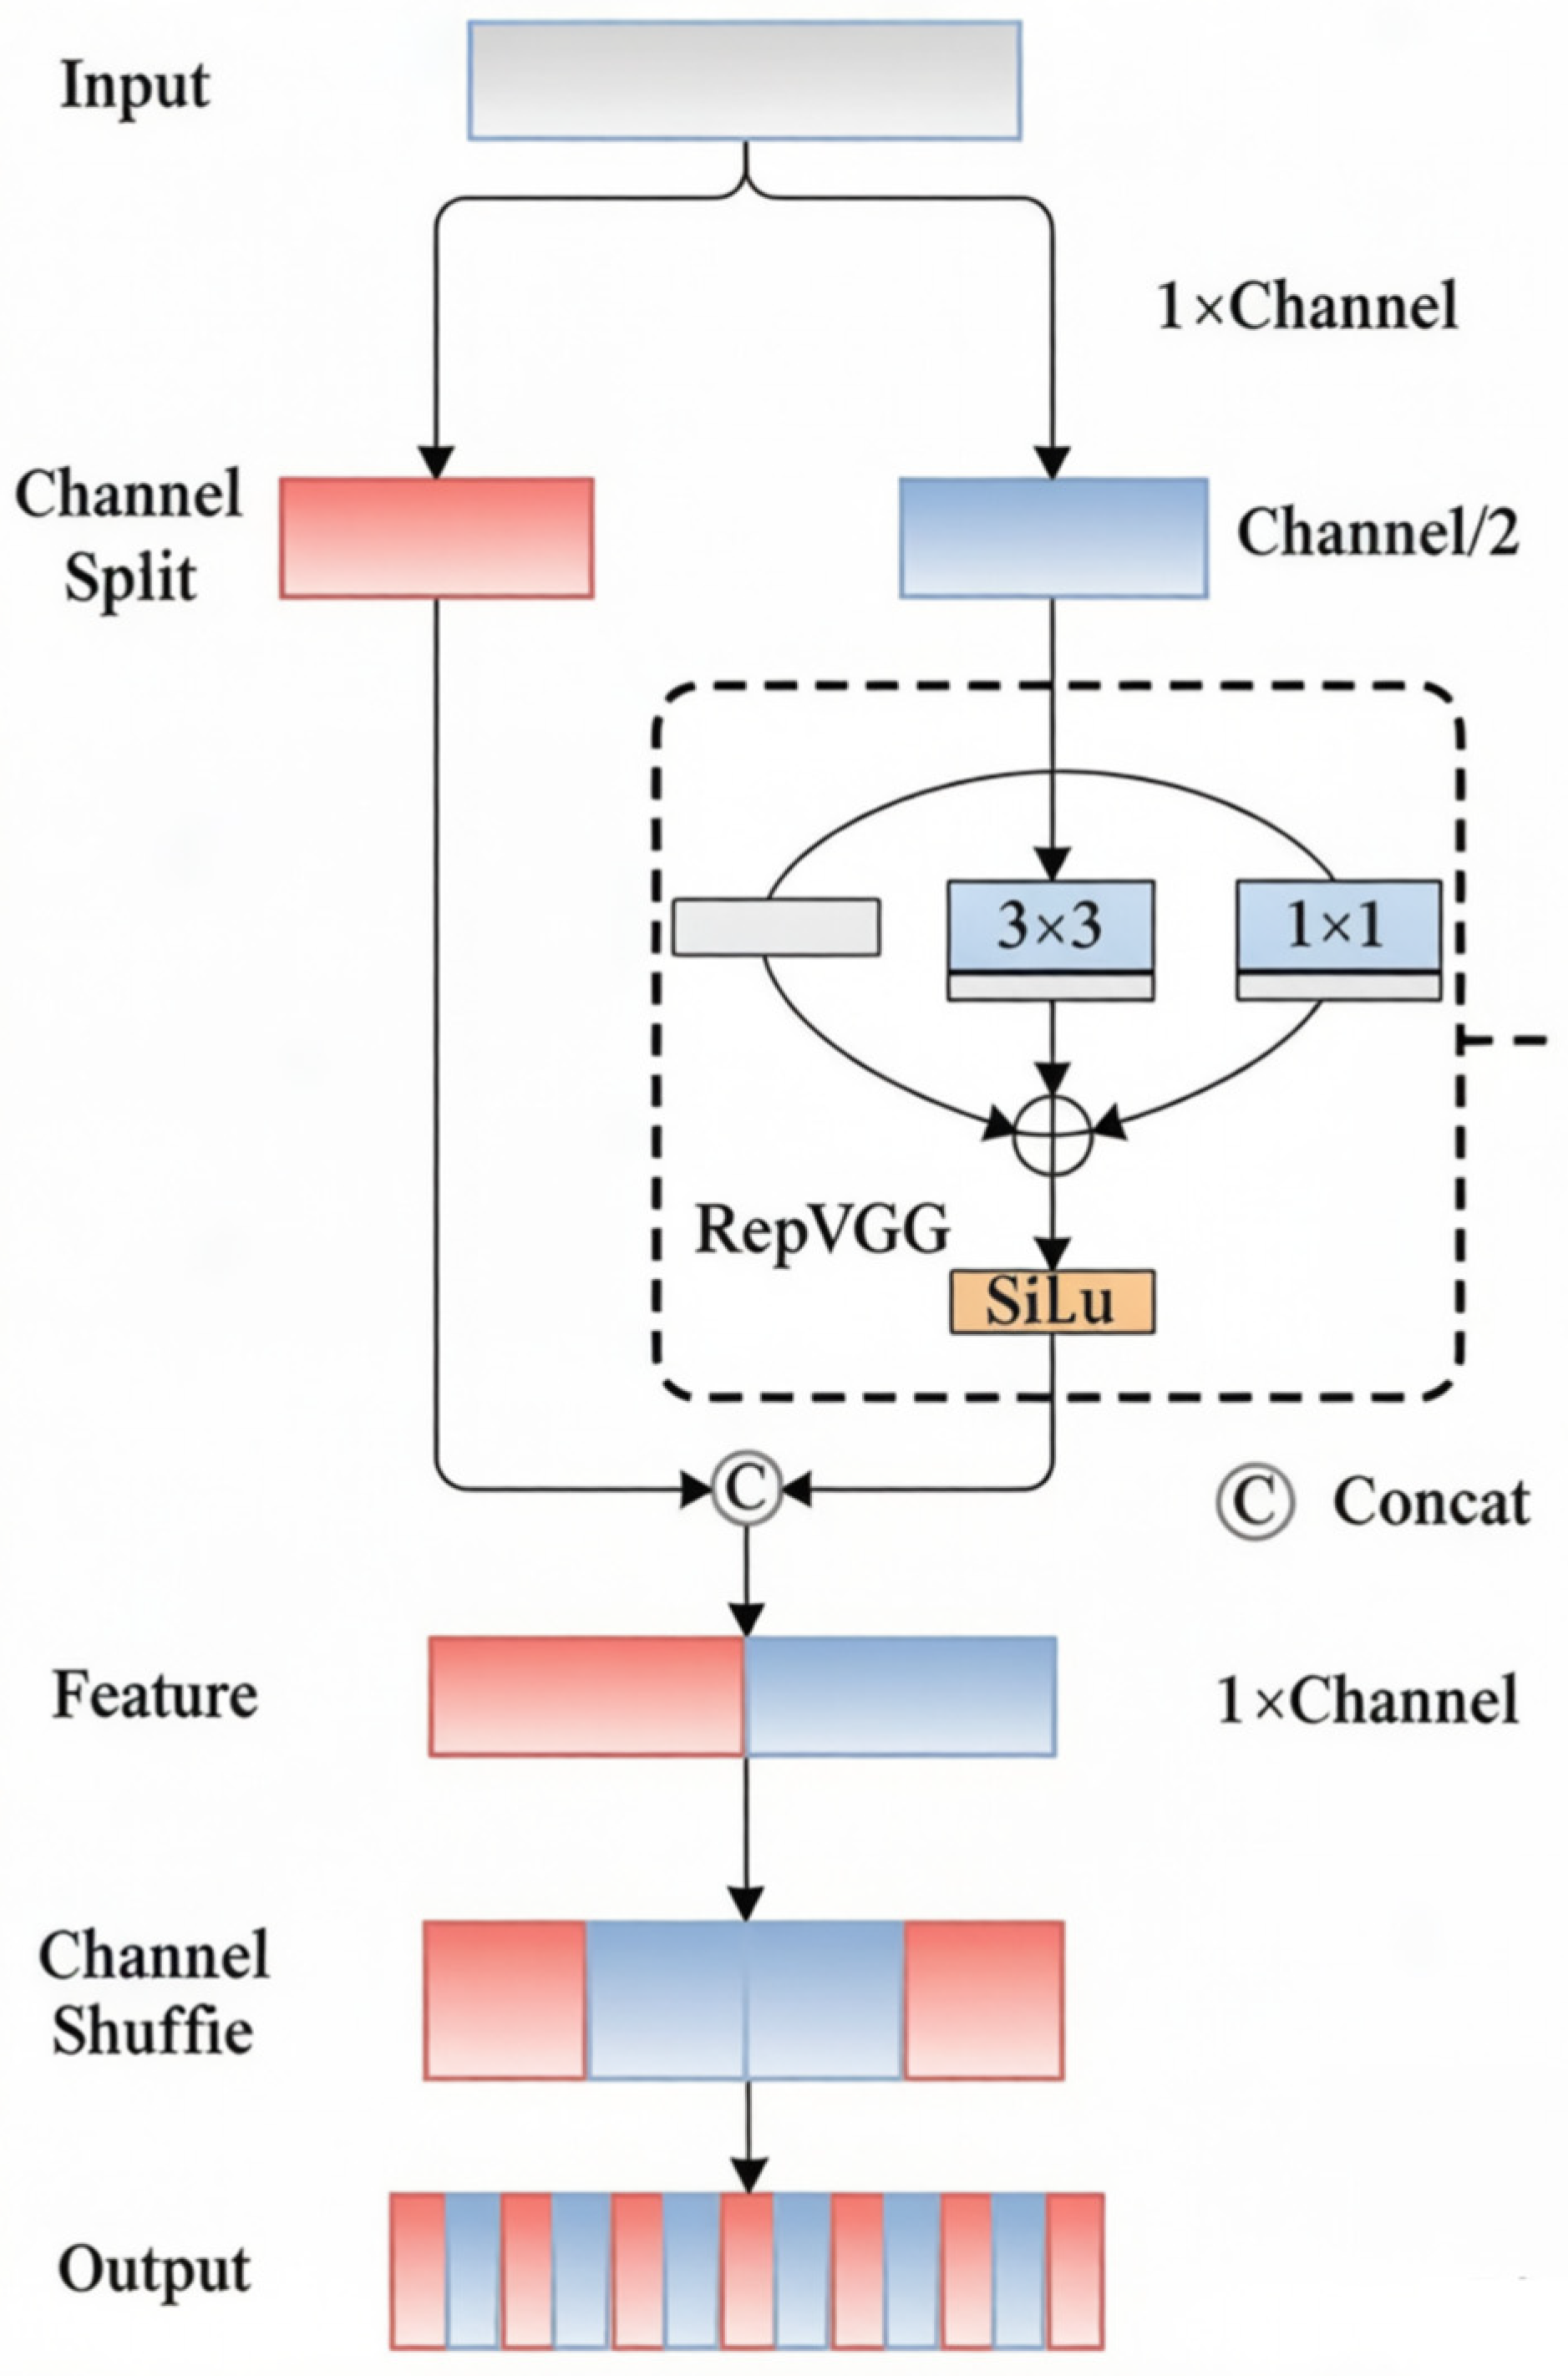
Figure 4 illustrates the key substructures within the RCSOSA module—the RCS module and the RepVGG module. Specifically, upon receiving an input tensor of size C × H × W, the RCS module first performs channel splitting, producing two sub-tensors of equal dimensions. One branch maintains an identity connection, while the other sequentially passes through a 1 × 1 convolution followed by a 3 × 3 convolution, thereby constructing a spatial feature pathway. The overall architecture of the RCS submodule during training is depicted as follows.
The computational form of the RepVGG module would be elaborated in detail in the subsequent sections.
R e p V G G = σ S E B N ( C o n v 3 × 3 ( x ) ) + B N ( C o n v 1 × 1 ( x ) ) + δ i d B N ( x )
where σ is the SiLu activation function, BN is the batch normalization, δid is the identity mapping branch, and SE is the channel attention mechanism.
The input features and other channel tensors of the same dimension C × H × W are stitched and shuffled, and finally the feature map is output. This module uses multi-branch structure to learn rich feature representations, which improves the ability of feature learning.
The OSA (One-Shot Aggregation) module was initially proposed to overcome the computational inefficiencies caused by dense connections in DenseNet. This module introduces a multi-receptive-field structure to represent diversified features and aggregates all intermediate features at the final stage, effectively improving modeling efficiency. The OSA module is extensively used in the network architectures of VoVNet V1 and V2, which build lightweight and high-performance backbone networks for object detection. These networks outperform traditional ResNet, exhibiting significant advantages in terms of inference speed and energy efficiency.
Based on this, this paper introduces a new RCSOSA module, combining the RCS module with OSA, as shown in Figure 4. This module strengthens feature reuse by repeatedly stacking RCS units, enhancing the interaction between channels. Different levels of stacking are employed at various stages of the network to accommodate feature modeling needs at different semantic levels. Additionally, to reduce network fragmentation, the RCSOSA module retains only three feature paths during the feature aggregation stage, effectively alleviating the computational burden and reduces memory usage. This design provides greater deployment flexibility and operational efficiency for lightweight small-object detection tasks.

2.2.3. HFPN Block

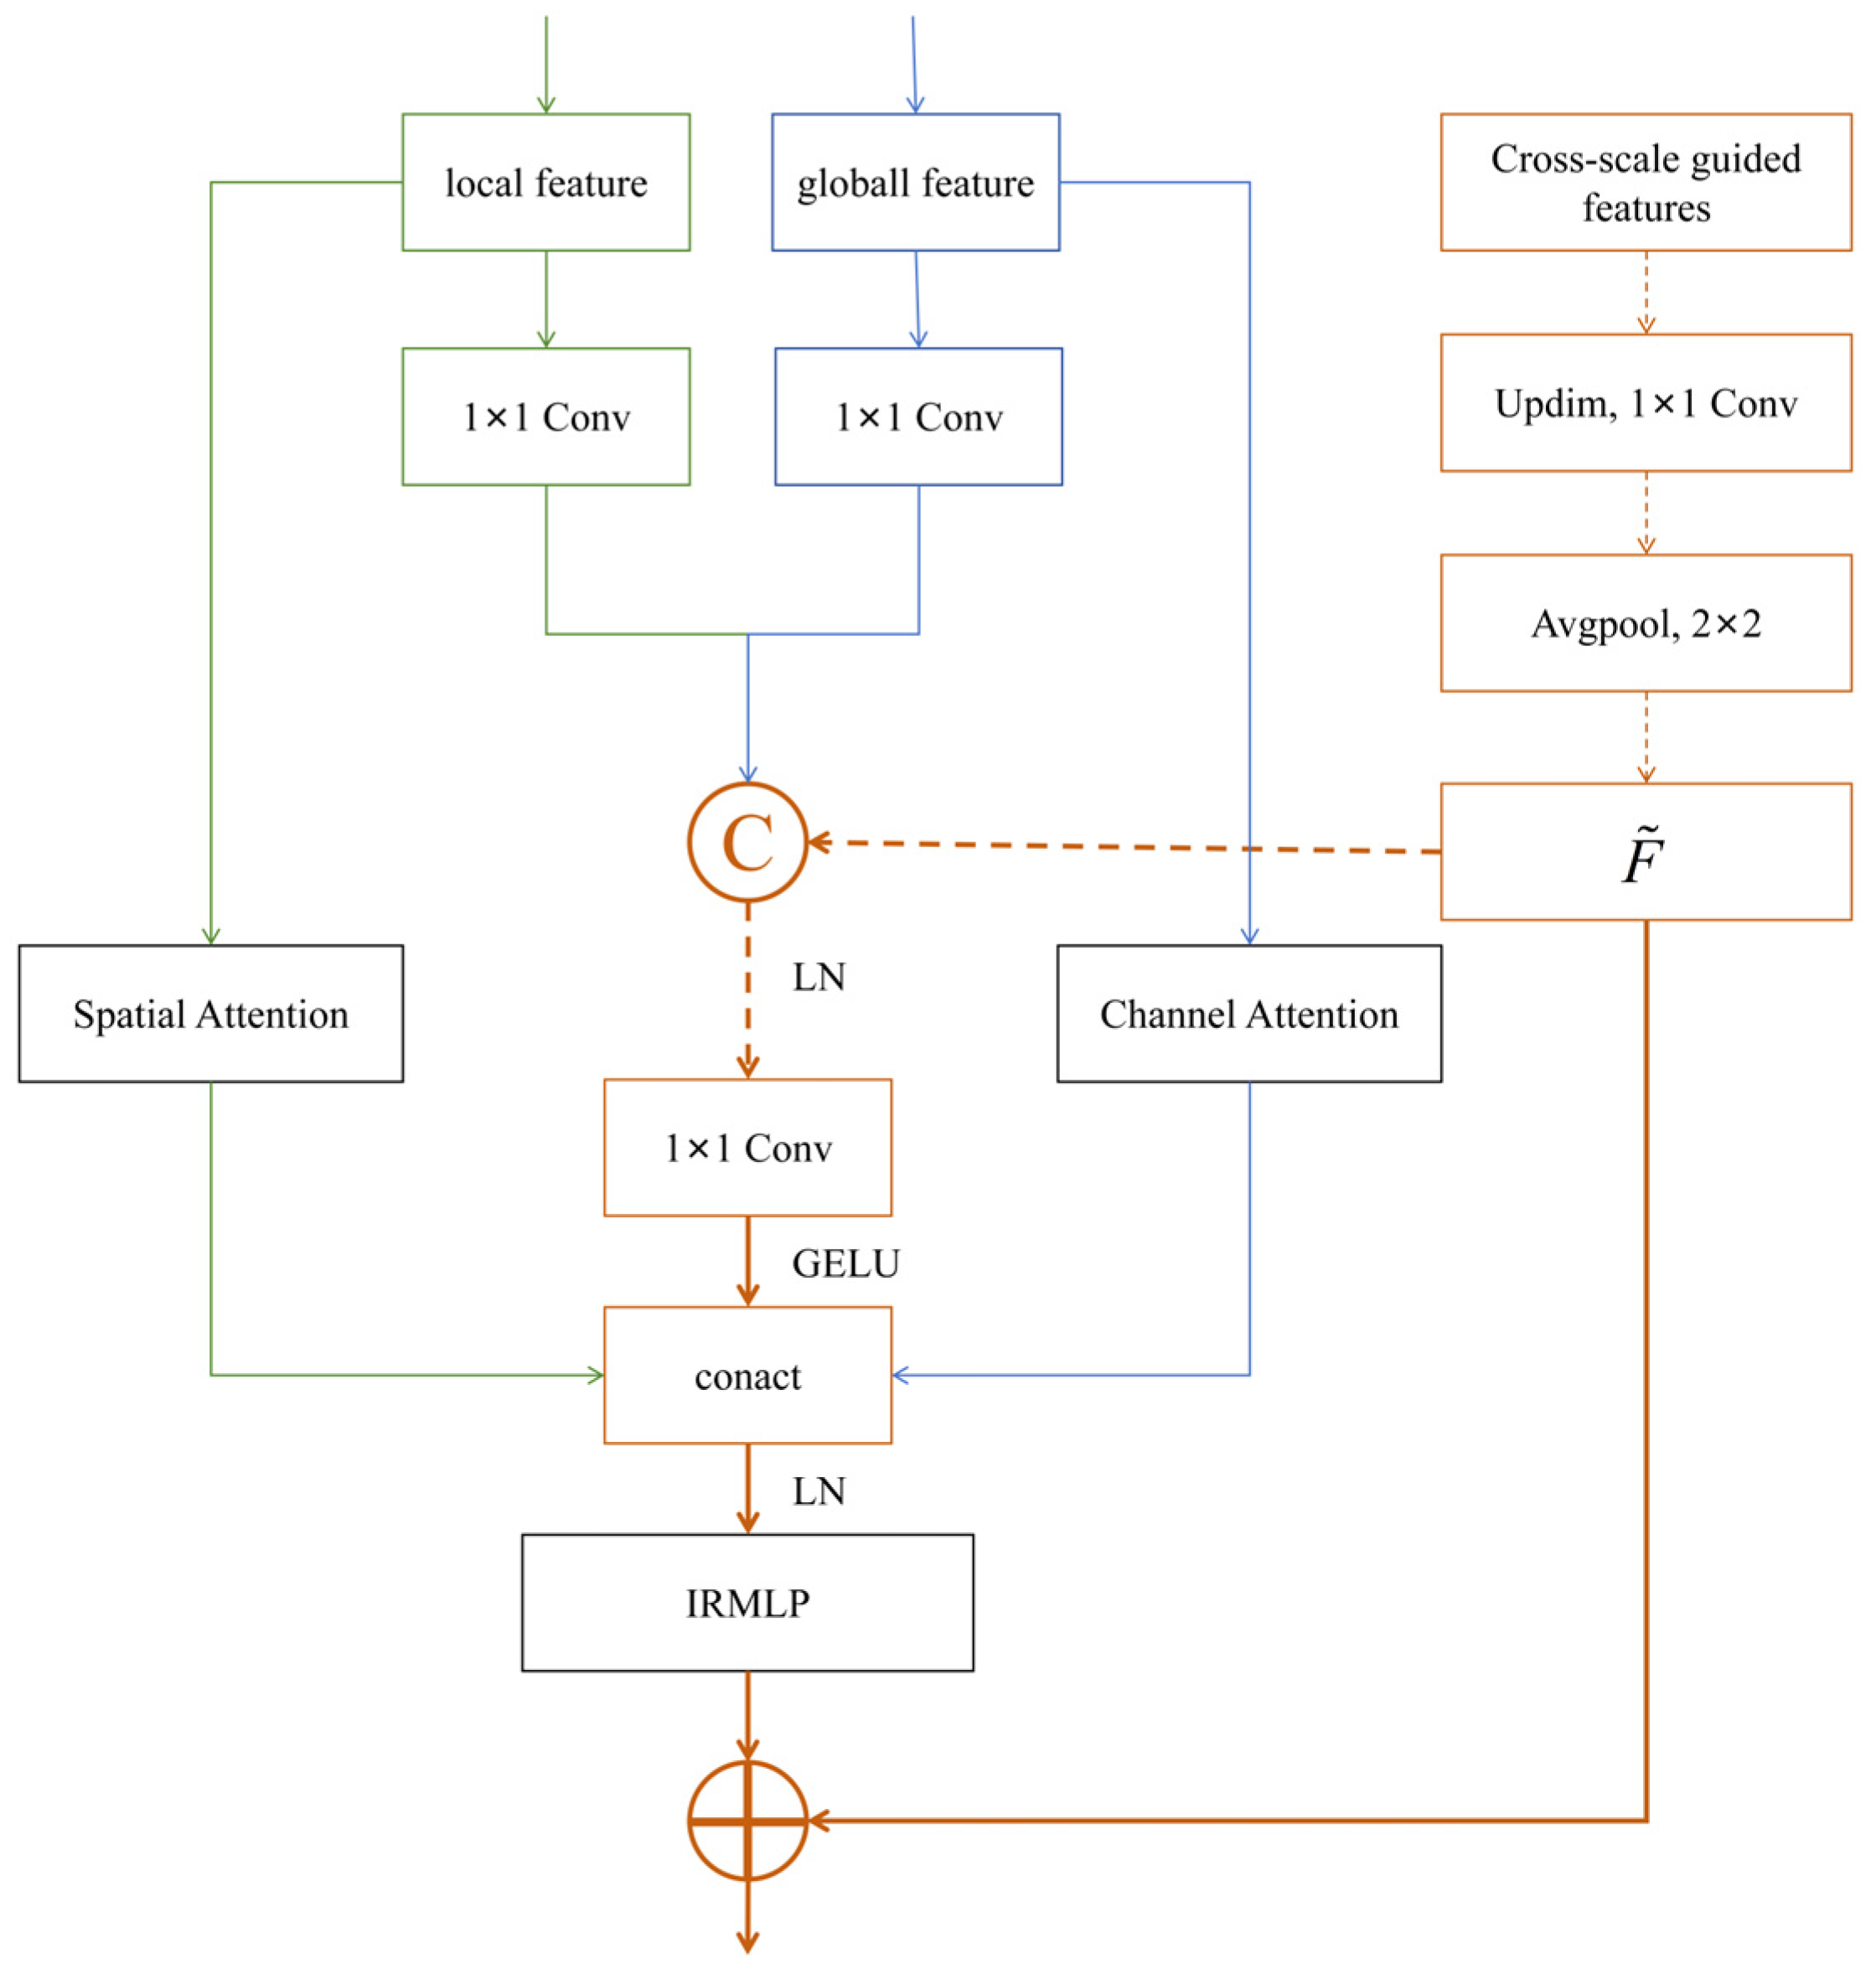
In small-object detection, numerous studies have demonstrated the critical importance of both local and global features for image classification. To effectively capture global and local information from images, a novel module termed HFPN is proposed. The HFPN module adopts a three-branch parallel structure, extracting global and local information from dedicated global and local feature blocks, thereby ensuring that local and global features remain largely independent and do not interfere with each other. The overall architecture of the HFPN module is illustrated in Figure 5, which consists of three main components: a global feature block, a local feature block, and a cross-scale guided feature block. The local branch is designed to extract fine-grained local features, while the global branch focuses on capturing high-level semantic representations. Local features, enhanced via spatial attention, are combined with global features refined through channel attention at each corresponding level. The fused features are then fed into a classifier composed of global average pooling, layer normalization, and a linear layer for final classification.
Let the three input feature maps be denoted as: local feature L from the detection neck at P3, global feature G from the backbone network at P3, and cross-scale guiding feature F from P2, where L R B × C × H × W , G R B × C × H × W and F R B × 2 / C × 2 H × 2 W .
The following sections detail the global feature block, the local feature block, and the HFF block.
First, 1 × 1 convolutional projections are applied to both the local and global features to unify their feature spaces for fusion:
L ˜ = f 1 × 1 ( L ) G ˜ = f 1 × 1 ( G )
For the cross-scale feature F, a “dimension increase + downsampling” operation is employed to align its dimensions.
Specifically, P2 denotes an average pooling operator with a kernel size of 2 and a stride of 2, which aligns the spatial resolution from (2 H, 2 W) to (H, W).
The initially processed features then undergo hierarchical fusion. First, the three types of features are concatenated to form the aligned tri-branch feature, as shown in Equation (3):
U = C o n c a t [ F ˜ , L ˜ , G ˜ ]
To mitigate inter-channel scale variation and stabilize training, Layer Normalization (LN) is subsequently applied along the channel dimension. For the channel vector u R 3 C at any spatial position (b, h, w), the operation is defined as:
L N ( u ) = γ u μ ( u ) σ 2 ( u ) + ε + β
where μ(u) and σ2(u) are the mean and variance computed across channels, and γ , β R 3 C are learnable affine parameters. After LN, a 1 × 1 convolution compresses the channel dimension from 3C back to C, followed by a GELU activation function, yielding the hierarchically fused feature X f :
X f = G E L U ( f 3 C C 1 × 1 ( L N ( U ) ) ) R B × C × H × W
This process performs cross-level feature recalibration across channels, explicitly encoding the informational relationships among the “high-resolution P2 + dual-path P3” features.
Within the HFPN block, the incoming global features are fed into a Channel Attention (CA) mechanism, which leverages interdependencies between channel maps to refine feature representations for specific semantics. The local features are input into a Spatial Attention (SA) mechanism to enhance local details and suppress irrelevant regions.
G = C A ( G ) = σ ( M L P ( A v g P o o l ( G ) ) + M L P ( M a x P o o l ( G ) ) ) L = S A ( L ) = σ ( f 7 × 7 ( C o n c a t [ A v g P o o l ( L ) , M a x P o o l ( L ) ] ) )
Here, σ denotes the sigmoid function. Finally, the outputs from each attention mechanism and the fusion path are aggregated. This combined feature is then processed by an Inverted Residual Multi-Layer Perceptron (IRMLP) block. This design helps, to some extent, prevent issues such as gradient vanishing/explosion and network degradation, thereby effectively capturing both global and local feature information at each hierarchical level.
V = C o n c a t [ G L , X f ] I R M L P ( x ) = f 1 × 1 ( f 1 × 1 ( f 3 × 3 ( L N ( x ) ) + L N ( x ) ) ) Y = I R M L P ( C o n c a t [ V ] ) + F ˜
where Y denotes the final output feature, obtained by summing the output of the IRMLP module and the processed input feature.

2.2.4. Improved Loss Function

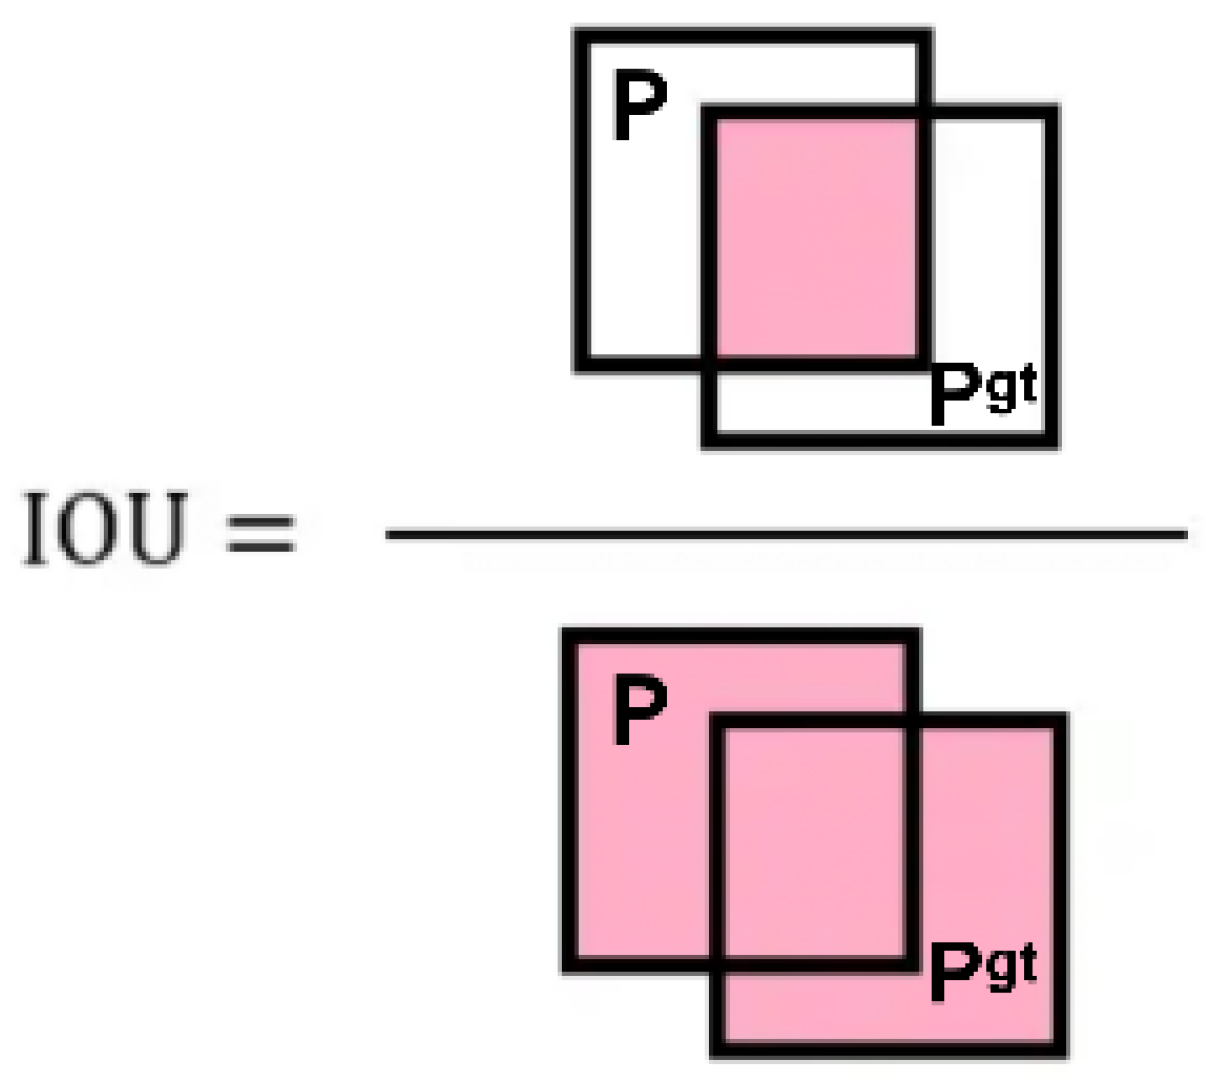
The bounding box regression loss function in Yolov11 is a loss function based on IoU loss. Figure 6 introduces the solution of the loss value of the IoU loss function, as follows:
I o U = P P g t P P g t
P is the real box, and Pgt is the prediction box. The loss function value based on IoU is between [0, 1]. When IoU = 1, the prediction effect is the most ideal. At this time, LIoU = 0, IoU = 0, the prediction effect is the worst, and the loss function tends to infinity.
The CIoU loss function takes into account the aspect ratio, overlap rate, and distance between the target and the anchor frame in the bounding box on the basis of IoU, making the target box regression more stable. The formula is as follows:
L C I o U = 1 I o U + ρ 2 ( b , b g t ) c 2 + α v
In the above formula, b and bgt denote the center coordinates of the predicted bounding box and the ground truth box, respectively. The term ρ corresponds to the Euclidean distance separating these two centers. The variable c signifies the length of the diagonal of the smallest enclosing box that covers both the prediction and the ground truth. Meanwhile, α is a weighting coefficient, and ν quantifies the similarity in aspect ratio, which is defined by the following expression:
ν = 4 π ( a r c t a n w g t h g t a r c t a n w h ) 2
where wgt and hgt represent the width and height of the real bounding box, and w and h represent the width and height of the predicted bounding box.
The CIoU loss function is more sensitive to small targets, which can easily lead to misjudgment or inaccurate positioning of small targets. In addition, in cases of dense target arrangements, the CIoU loss function may not be able to deal with the mutual influence between the targets well, which affects the accuracy of the detection results.
α = ν 1 I o U ( B , B g t ) + ν
The NWD loss function addresses the need for a nuanced pixel weighting scheme by representing a bounding box with a two-dimensional Gaussian distribution. This probabilistic model assigns peak probability density to the center, which decays smoothly as a function of distance from the center to the boundary. For a standard axis-aligned bounding box R = (cx, cy, w, h), where the tuple indicates the center coordinates, width, and height, the ellipse inscribed within this box conforms to the equation:
( x μ x ) 2 σ x 2 + ( y μ y ) 2 σ y 2 = 1
In the formula, μ x , μ y is the center coordinate of the ellipse, σ x , σ y is the half-axis length along the x and y axes. Therefore, μ x = c x , μ y = c y , σ x = w 2 , σ y = h 2 the probability density function of the two-dimensional Gaussian distribution is:
f ( x | μ , Σ ) = e x p 1 2 ( x μ ) T Σ 1 ( X μ ) 2 π Σ 1 / 2
where x, μ and Σ represent the coordinates (x, y), mean vector and covariance matrix of the Gaussian distribution, when:
( x μ ) T Σ 1 ( x μ ) = 1
The ellipse in the formula will be the density profile of the two-dimensional Gaussian distribution, so the horizontal bounding box R = (cx, cy, w, h) can be modeled as a two-dimensional Gaussian distribution:
μ = c x c y , Σ = w 2 4 0 0 h 2 4
Furthermore, the problem of evaluating the similarity between two bounding boxes, A and B, is reformulated as measuring the distance between their corresponding two-dimensional Gaussian distributions. This distribution distance is subsequently computed employing the Wasserstein distance, a metric rooted in optimal transport theory. Consequently, the NWD loss function is formulated as:
L N W D = 1 N W D ( N a , N b )
N W D ( N a , N b ) = e x p w 2 2 ( N a , N b ) C
W 2 2 ( N a , N b ) = c x a , c y a , w a 2 , h a 2 T , c x b , c y b , w b 2 , h b 2 T 2 2
where c is a constant that has a strong correlation with the dataset.
This method uses a two-dimensional Gaussian distribution to model the bounding box and uses the Wasserstein distance to calculate the similarity between the Gaussian distributions, which can better analyze the loss function value of the overlapping part.
In order to integrate the advantages of NWD and CIoU loss functions, a new fusion loss function LNWD-C is established. The fusion loss function is different from others in that it can dynamically adjust the weights of the two loss functions in real time based on the training phase. In the initial stage of training, the number of high-quality prediction boxes is very small, so the prediction boxes often do not overlap with the real boxes. The IoU term of CIoU may be 0, resulting in the disappearance of the gradient. Based on the Wasserstein distance, NWD can provide an effective gradient when there is no overlap, helping the model to quickly locate the general position of the target and accelerate convergence. As the training phase rises, as the prediction box gradually overlaps with the real box, CIoU is more sensitive to size changes, so its fine adjustment ability (center distance, aspect ratio) becomes the key. At this time, the position and shape of the box need to be fine-tuned.
Therefore, based on the cosine annealing strategy, the weight of the loss function is set to a function that changes based on the training phase.
The formula is as follows:
L N W D C = λ ( r a t i o , α ) L N W D + ( 1 λ ( r a t i o , α ) ) L C I o U
λ ( r a t i o , α ) = ( 1 r a t i o ) × 1 + α 2
r a t i o = 0.5 1 c o s π × t e p o c h , t [ 0 , e p o c h ]
where λ is a function of the hyperparameter ratio and the proportion of small targets in the data set α. This design ensures that the weight λ is relatively large in the early stages of training (when the ratio is close to 0), and the model relies more on the NWD loss for initial positioning; as the training progresses (with the ratio increasing), λ decreases linearly, and the model gradually shifts to relying on the CIoU loss for fine-tuning of the bounding boxes.
To verify the effectiveness of the proposed dynamic weighted loss function, we compared it with various fixed weight combination schemes. The experiments were conducted on the same YOLOv11n architecture, with only the fixed mixing weight λ of NWD and CIoU in the loss function changed. The results are shown in Table 1. We can see that any fixed weight setting cannot achieve the performance of our proposed dynamic strategy. The dynamic weight scheme achieved the highest mAP@0.5 (0.441), superior to all fixed weight combinations. Secondly, the fixed weight scheme has obvious performance bottlenecks or trade-offs: when λ is too low (such as 0.3), NWD contributes insufficiently and is insensitive to small targets; when λ is too high (such as 1.0, using only NWD), the model completely relies on distribution matching for localization, resulting in insufficient learning of the geometric relationship of bounding boxes and a significant performance decline (mAP@0.5 dropped to 0.430). This proves that it is difficult and suboptimal to manually set a universal, fixed optimal weight for the loss function.

3. Results

3.1. Experiment Introduction

To comprehensively evaluate the performance and generalization capability of the proposed algorithm, we conduct experiments on three widely used public benchmark datasets: MS COCO, VisDrone2019, and PASCAL VOC 2012. Their key characteristics and roles in our evaluation are summarized below.
MS COCO (Common Objects in Context): This is the primary dataset for training and evaluating our model, as it is one of the most authoritative benchmarks in object detection. The COCO dataset encompasses 80 object categories across diverse real-world scenes. Crucially for our study, it explicitly defines objects with an area less than 32 × 32 pixels as small objects, which constitute approximately 31.62% of all instances in the dataset. This substantial proportion of small targets makes COCO exceptionally suitable for developing and validating small-object detection algorithms. We use the standard train2017set (≈118 K images) for training and the val2017set (≈5 K images) for testing and ablation studies.
VisDrone2019: To assess the model’s robustness in complex, dense small-object scenarios, we employ the VisDrone2019 dataset. Collected from a drone’s perspective, it contains numerous small and densely packed objects (e.g., pedestrians, vehicles) under various lighting and weather conditions, posing significant challenges for detection. We use its training set (6471 images) for fine-tuning (when applicable) and its validation set (548 images) for testing, strictly following the official split to evaluate cross-domain generalization.
PASCAL VOC 2012: We utilize this dataset to supplement the evaluation of the model’s performance on medium-sized objects and to further verify its generalization across different data distributions. We train on the combined trainvalset and report results on the testset.
To ensure the fairness and reproducibility of the comparison, all the models evaluated in this study were trained and tested under the same experimental conditions:
(1)
Hardware and software: All experiments were conducted on an specified identical platform (as shown in Table 2).
(2)
Data Splits and Preprocessing: We rigorously adhered to the official training, validation, and testing splits for the MS COCO, VisDrone, and PASCAL VOC datasets to prevent any data leakage. All input images were resized to a fixed resolution of 640 × 640 pixels and normalized using the identical procedure (i.e., pixel values scaled to [0, 1]).
(3)
Training Hyperparameters: All models, including the baseline and our proposed model, were trained from scratch (without using any pre-trained weights) using the exact same set of hyperparameters. These are comprehensively listed in Table 3, encompassing the optimizer, initial/final learning rates, batch size, number of epochs, momentum, and weight decay.
(4)
Post-processing: During evaluation, the same non-maximum suppression (NMS) parameters were applied across all models, with an IoU threshold of 0.45 and a confidence threshold of 0.25.
(5)
Dataset and evaluation: All models were trained and evaluated on the same partitions of the MS COCO, VisDrone, and PASCAL VOC datasets as described in Section 3.1. The evaluation metrics were calculated using the same script and protocol. This strict setup ensures that the performance differences reported in the following sections are caused by the model architecture itself, rather than differences in training configurations or initialization methods.
To comprehensively evaluate the model’s effectiveness and practicality, this paper selects four types of metrics for performance assessment. The mean Average Precision (mAP) and F1 score are used to measure the precision and accuracy of detection, with higher values indicating better detection performance. The number of parameters (Params) and FLOPs (Floating Point Operations) are used to measure the model’s complexity and inference efficiency, with smaller values indicating a lighter model and higher computational efficiency. Before that, let us first introduce the meanings of the following four evaluation indicators. Among them, TP represents the number of positive samples that are correctly detected, FP represents the number of negative samples that are wrongly identified as positive, and FN represents the number of positive samples that are wrongly recognized as negative.
The specific definitions of the metrics are as follows:
(1) Precision.
P r e c i s i o n = T P F P + T P
Precision refers to the proportion of positive samples in all samples predicted by the model. Among them, high accuracy means the positive prediction of the model, and the proportion of true positive samples is higher.
(2) Recall.
R e c a l l = T P F N + T P
Recall rate refers to the proportion of the number of samples correctly identified as positive by the model among all real positive samples, which is a measure of the ability of the model to identify positive samples. A high recall rate means that the model can more easily find all real positive samples.
(3) F1-score.
F 1 = P r e c i s i o n × R e c a l l × 2 P r e c i s i o n + R e c a l l
The F1 score takes into account the accuracy and recall ability of the model. The value range is 0 to 1, and the closer the F1 value is to 1, the better the performance of the model.
(4) mAP.
mAP takes into account the accuracy and recall of the model, which is an important index to evaluate the performance of the target detection model. The formula of AP is shown in Formula (25). Specifically, firstly, the detection results of the model are sorted according to the confidence level, and then the precision rate and recall rate of each detection result are calculated according to the sorting results. Finally, the PR curve is drawn, and the area under the PR curve is AP. For the multi-classification problem, the average value is calculated after calculating the AP of each classification, and finally mAP is obtained. The calculation formula of mAP is shown in Formula (26).
A P = 0 1 P ( R ) d R
m A P = 1 C l a s s e s i = 1 C l a s s e s A P i
mAP is the most commonly used evaluation index in multi-class object detection tasks, which combines different types of accuracy and recall. The higher the mAP, the better the detection performance of the model. In this paper, the average accuracy means (mAP@0.5–0.95) when the threshold IoU is 0.5 and 0.5: 0.95 is taken as the evaluation index.

3.2. Comparison Experiments

To verify the effectiveness of the proposed model in the task of small-object detection, this paper compares it with the current mainstream object detection algorithms, including YOLOv5, YOLOv8, YOLOv10, YOLOv11, YOLOv12, Faster R-CNN and RT-DETR. Due to the limited computing power, we only conducted experiments on the minimum versions of these models. This excluded the improvement in accuracy caused by the increase in model capacity. To evaluate the statistical reliability and significance of the results, we conducted three repeated experiments on the yolov11 model and our model and report the average values and standard deviations of the performance indicators. All models were evaluated under the same experimental conditions and training strategies, and the experimental results are summarized in Table 4. The small standard deviations observed (e.g., ±0.001 for YOLOv11n and ±0.002 for our model in mAP@0.5) indicate that the training process is stable and the results are reproducible. The performance gain of our model over the baseline (e.g., an improvement of 0.040 in mAP@0.5) is substantially larger than the inherent experimental variability reflected by these standard deviations, which underscores that the improvement is consistent and statistically robust.
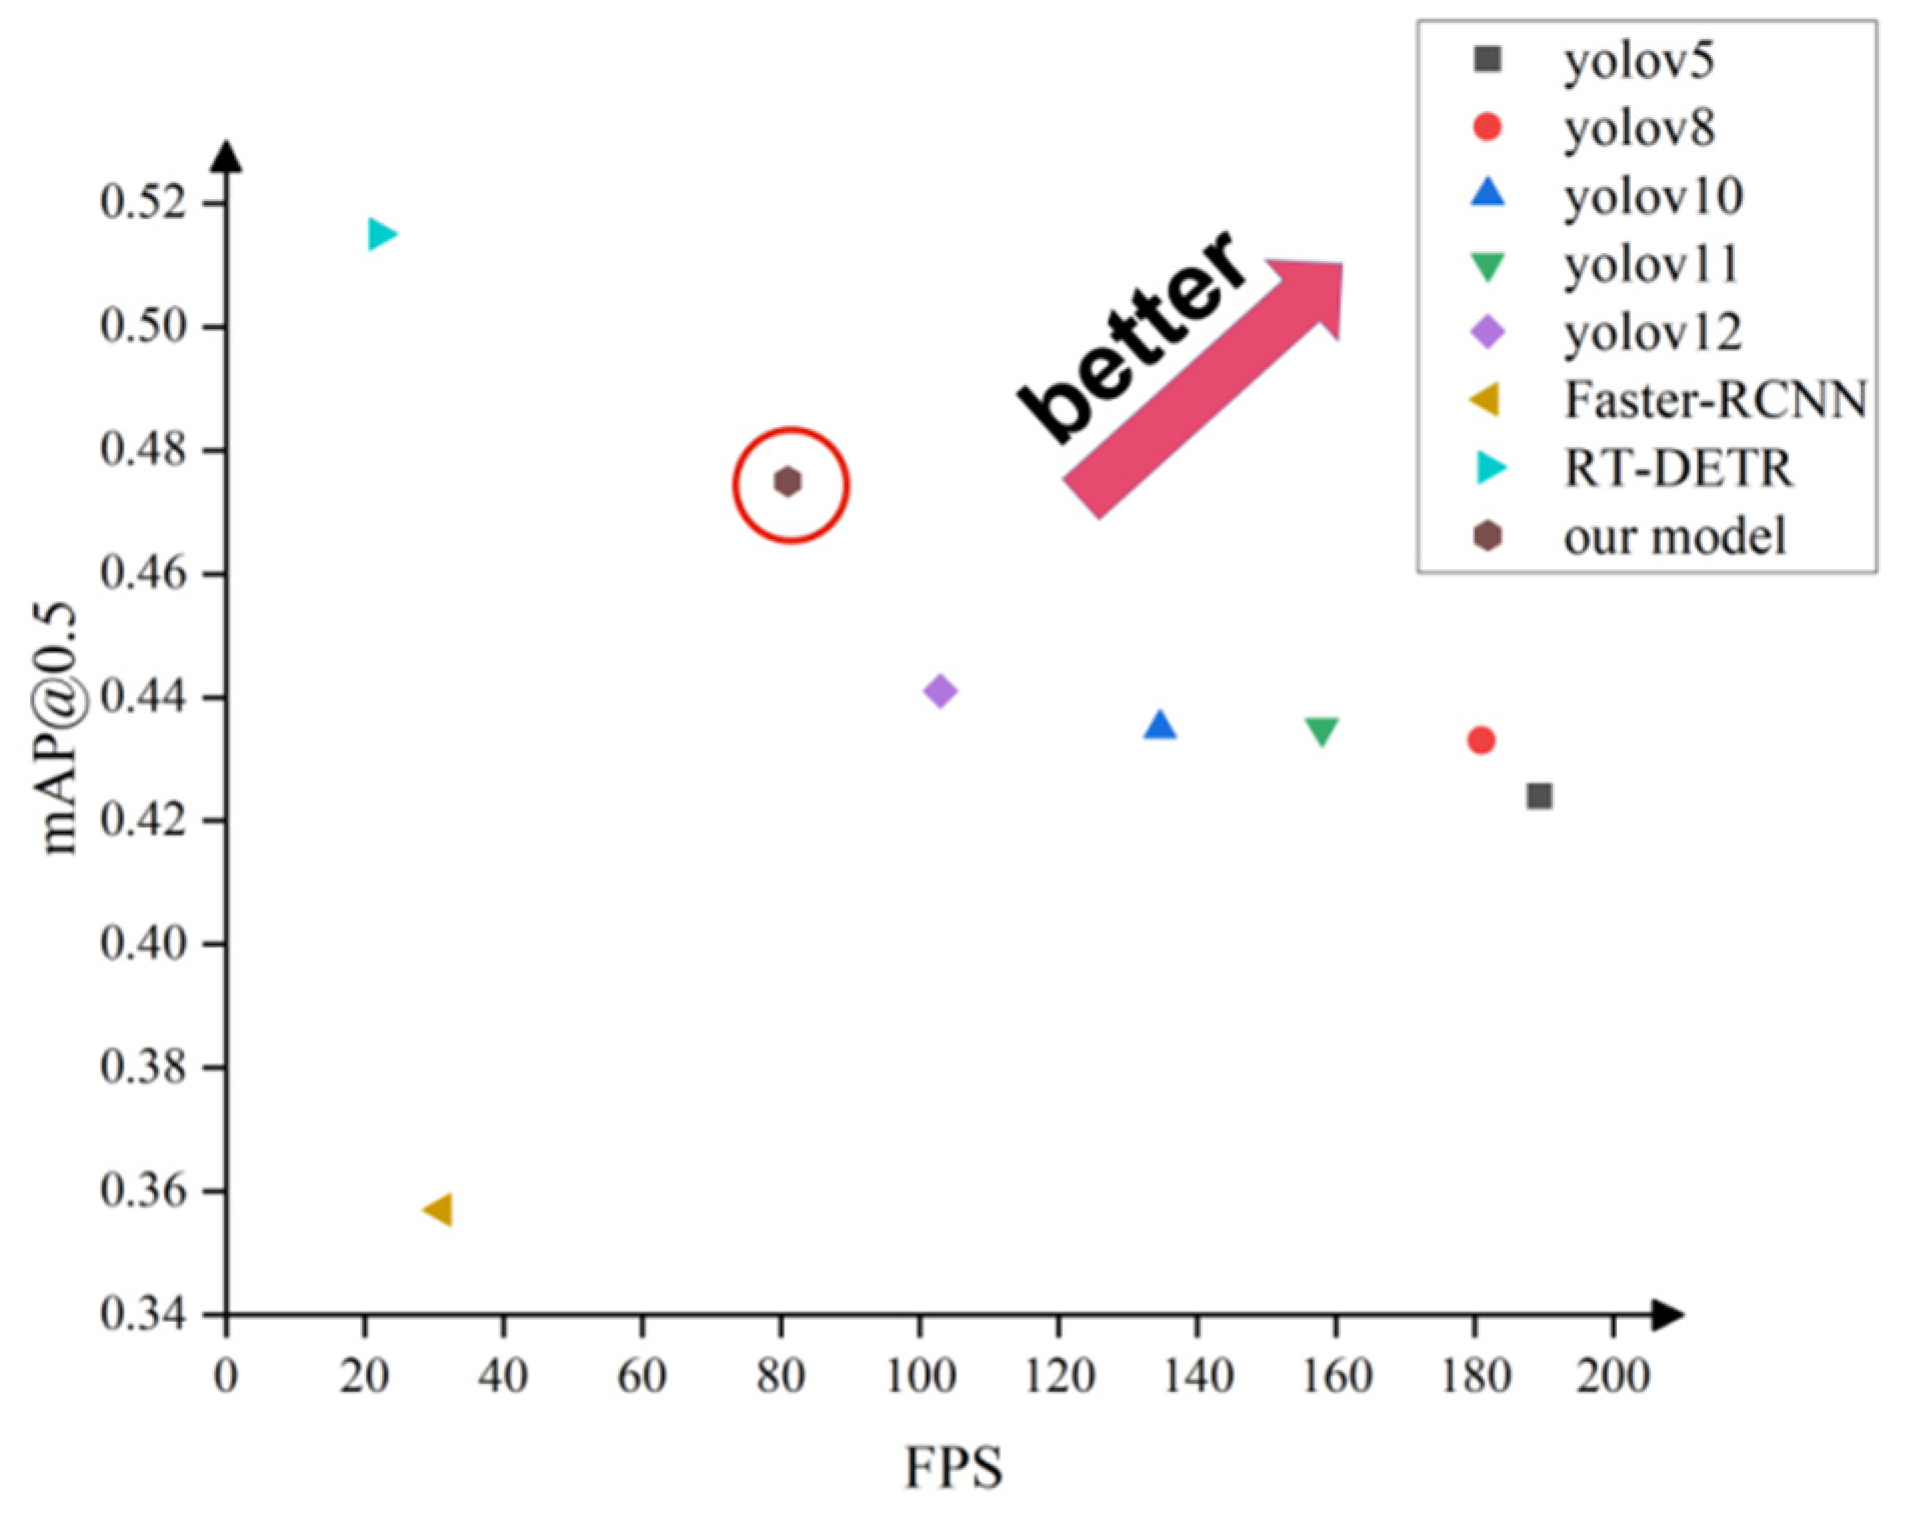
Given that this paper focuses on applications with high real-time requirements, with a specific constraint that the detection speed must reach FPS ≥ 60, the RT-DETR model, despite having higher accuracy, is excluded from the candidate models due to its frame rate of only 22, which is significantly below the real-time detection requirement. As shown in Table 4, the early YOLOv5 model, due to its relatively simple network structure and fewer convolutional layers, has limited detection accuracy, achieving only mAP@0.5 = 0.424. With the iteration of model versions, YOLOv8 to YOLOv12 show improvements in accuracy, with average detection accuracies of 0.433, 0.435, 0.435, and 0.441, respectively. However, the improvements are limited, and model optimization gradually reaches a bottleneck. In contrast, the new model proposed in this paper achieves a detection accuracy of mAP@0.5 = 0.475, which represents an improvement of about 3.4% over the best benchmark model (YOLOv12), marking a significant advancement within the YOLO series. Moreover, the fluctuations in the multiple experimental results are very small, and the mean of our model consistently exceeds that of the baseline models, indicating that the observed performance improvement is stable and reliable.
Similarly, the three average precisions based on the COCO standard are shown in Table 4. Specifically, for small targets (APS), the model has improved from 0.322 of the baseline YOLOv11n to 0.365, an absolute increase of 4.3%. This directly verifies the effectiveness of the RCSOSA, HFPN module, and NWD-CIoU loss function in detecting small targets. At the same time, the model’s detection accuracy for medium targets (APm) and large targets (APl) has also increased by 1.7% and 5.8%, respectively. This indicates that our improvements enhance the overall feature representation and multi-scale fusion capabilities of the model, rather than optimizing small targets at the expense of large targets, effectively avoiding detection deviations.
Although the introduction of new structures (such as RCSOSA and HFPN) increases the number of parameters from 2.62 M to 4.57 M, and FLOPs increase moderately, the overall inference speed is still maintained at FPS = 81, far exceeding the real-time detection standard, demonstrating a good balance between performance and complexity. Compared to the RT-DETR model, although it has slightly higher accuracy (mAP@0.5 = 0.494), its FLOPs are as high as 108.3 G, approximately 10 times that of the YOLO series models, and its FPS is only 22, making it unsuitable for practical low-latency scenarios. In contrast, the model proposed in this paper achieves comparable or even better accuracy while maintaining a lightweight design, showing stronger potential for practical deployment.
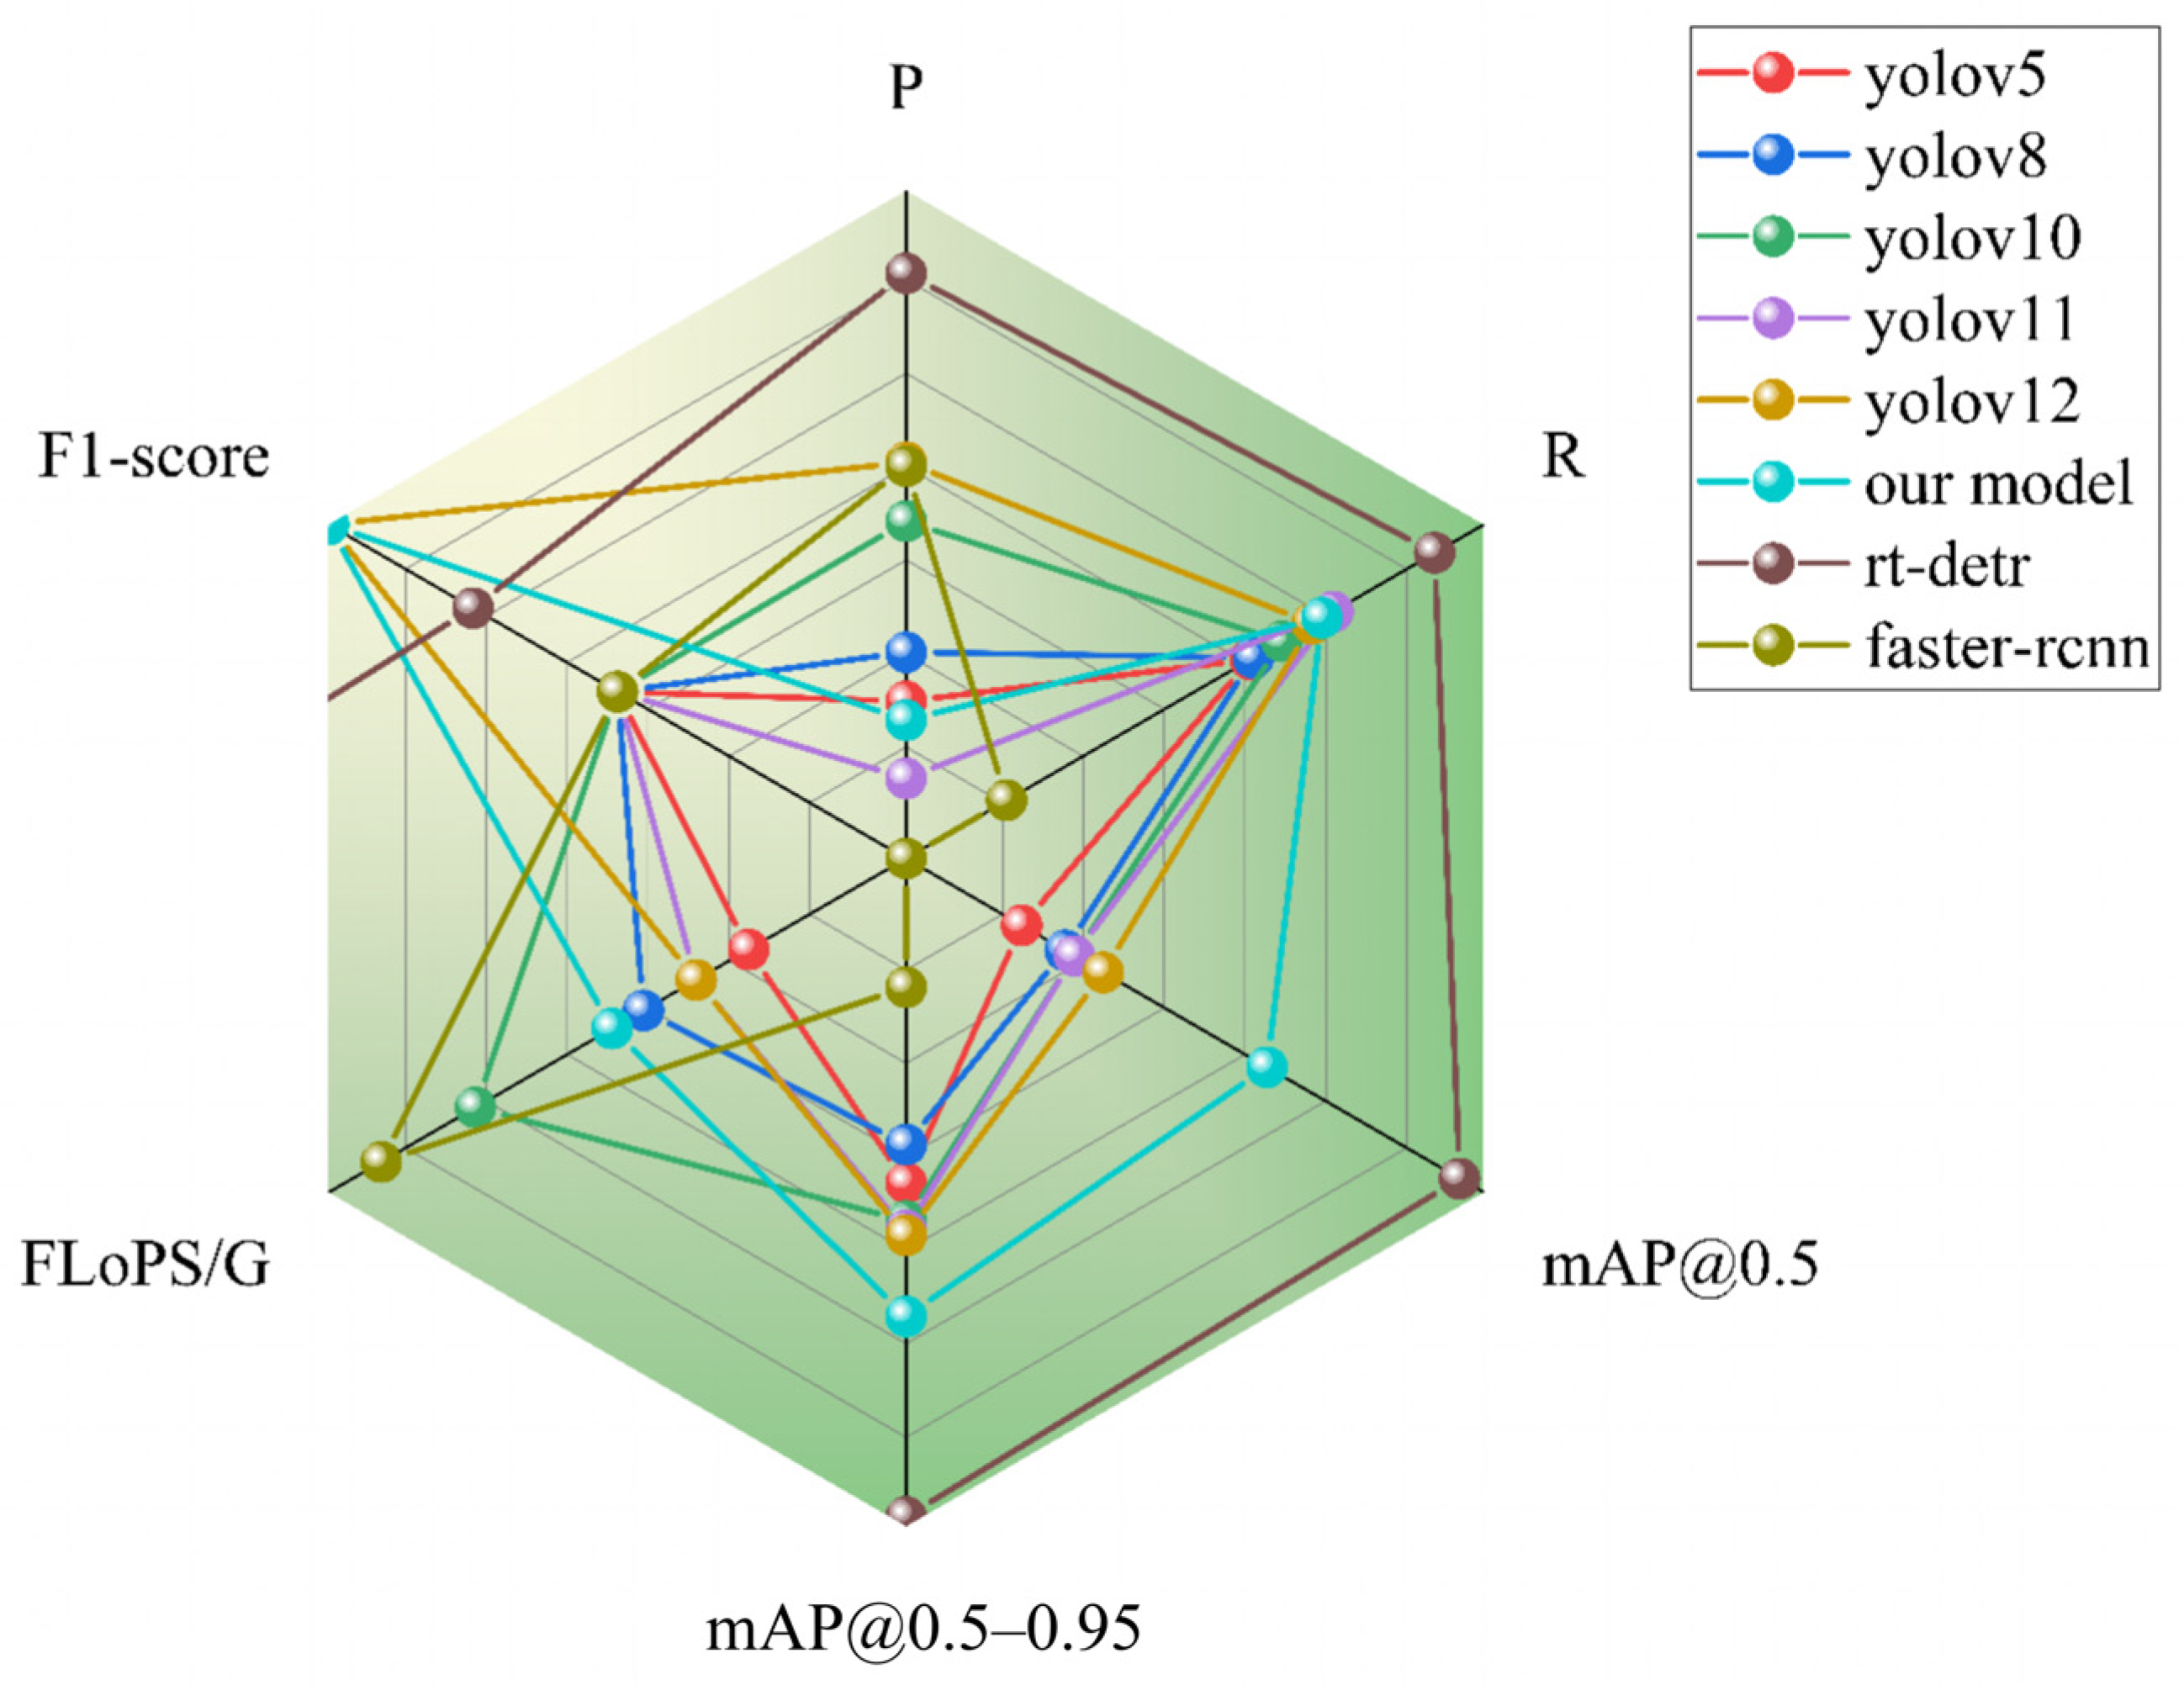
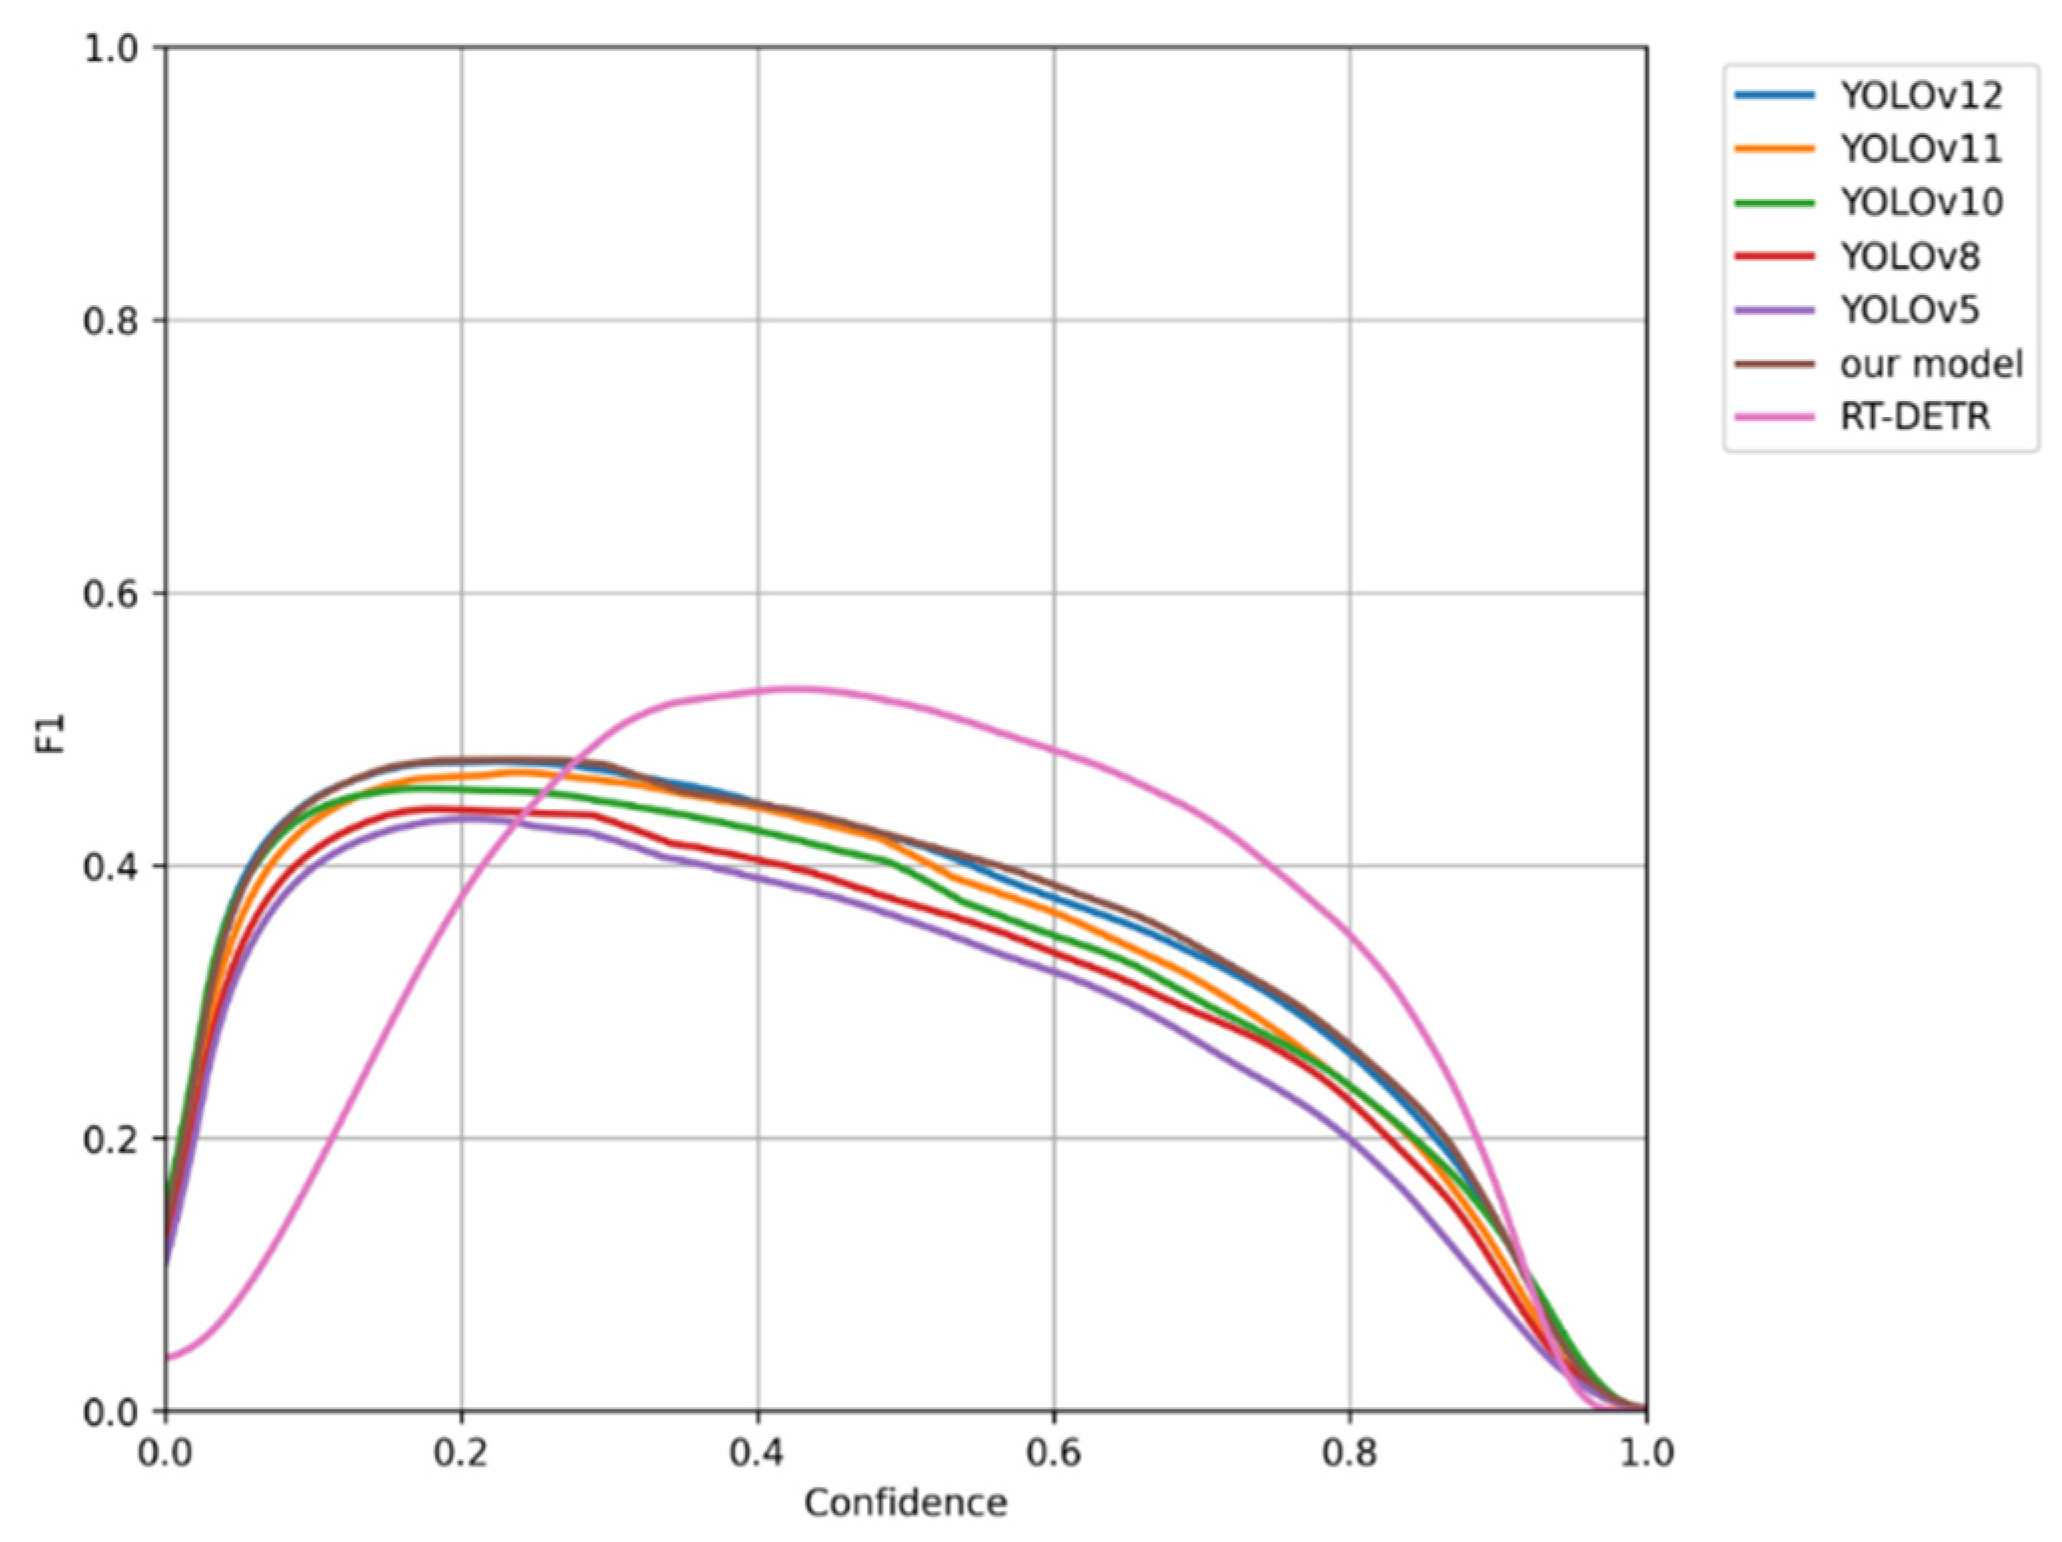
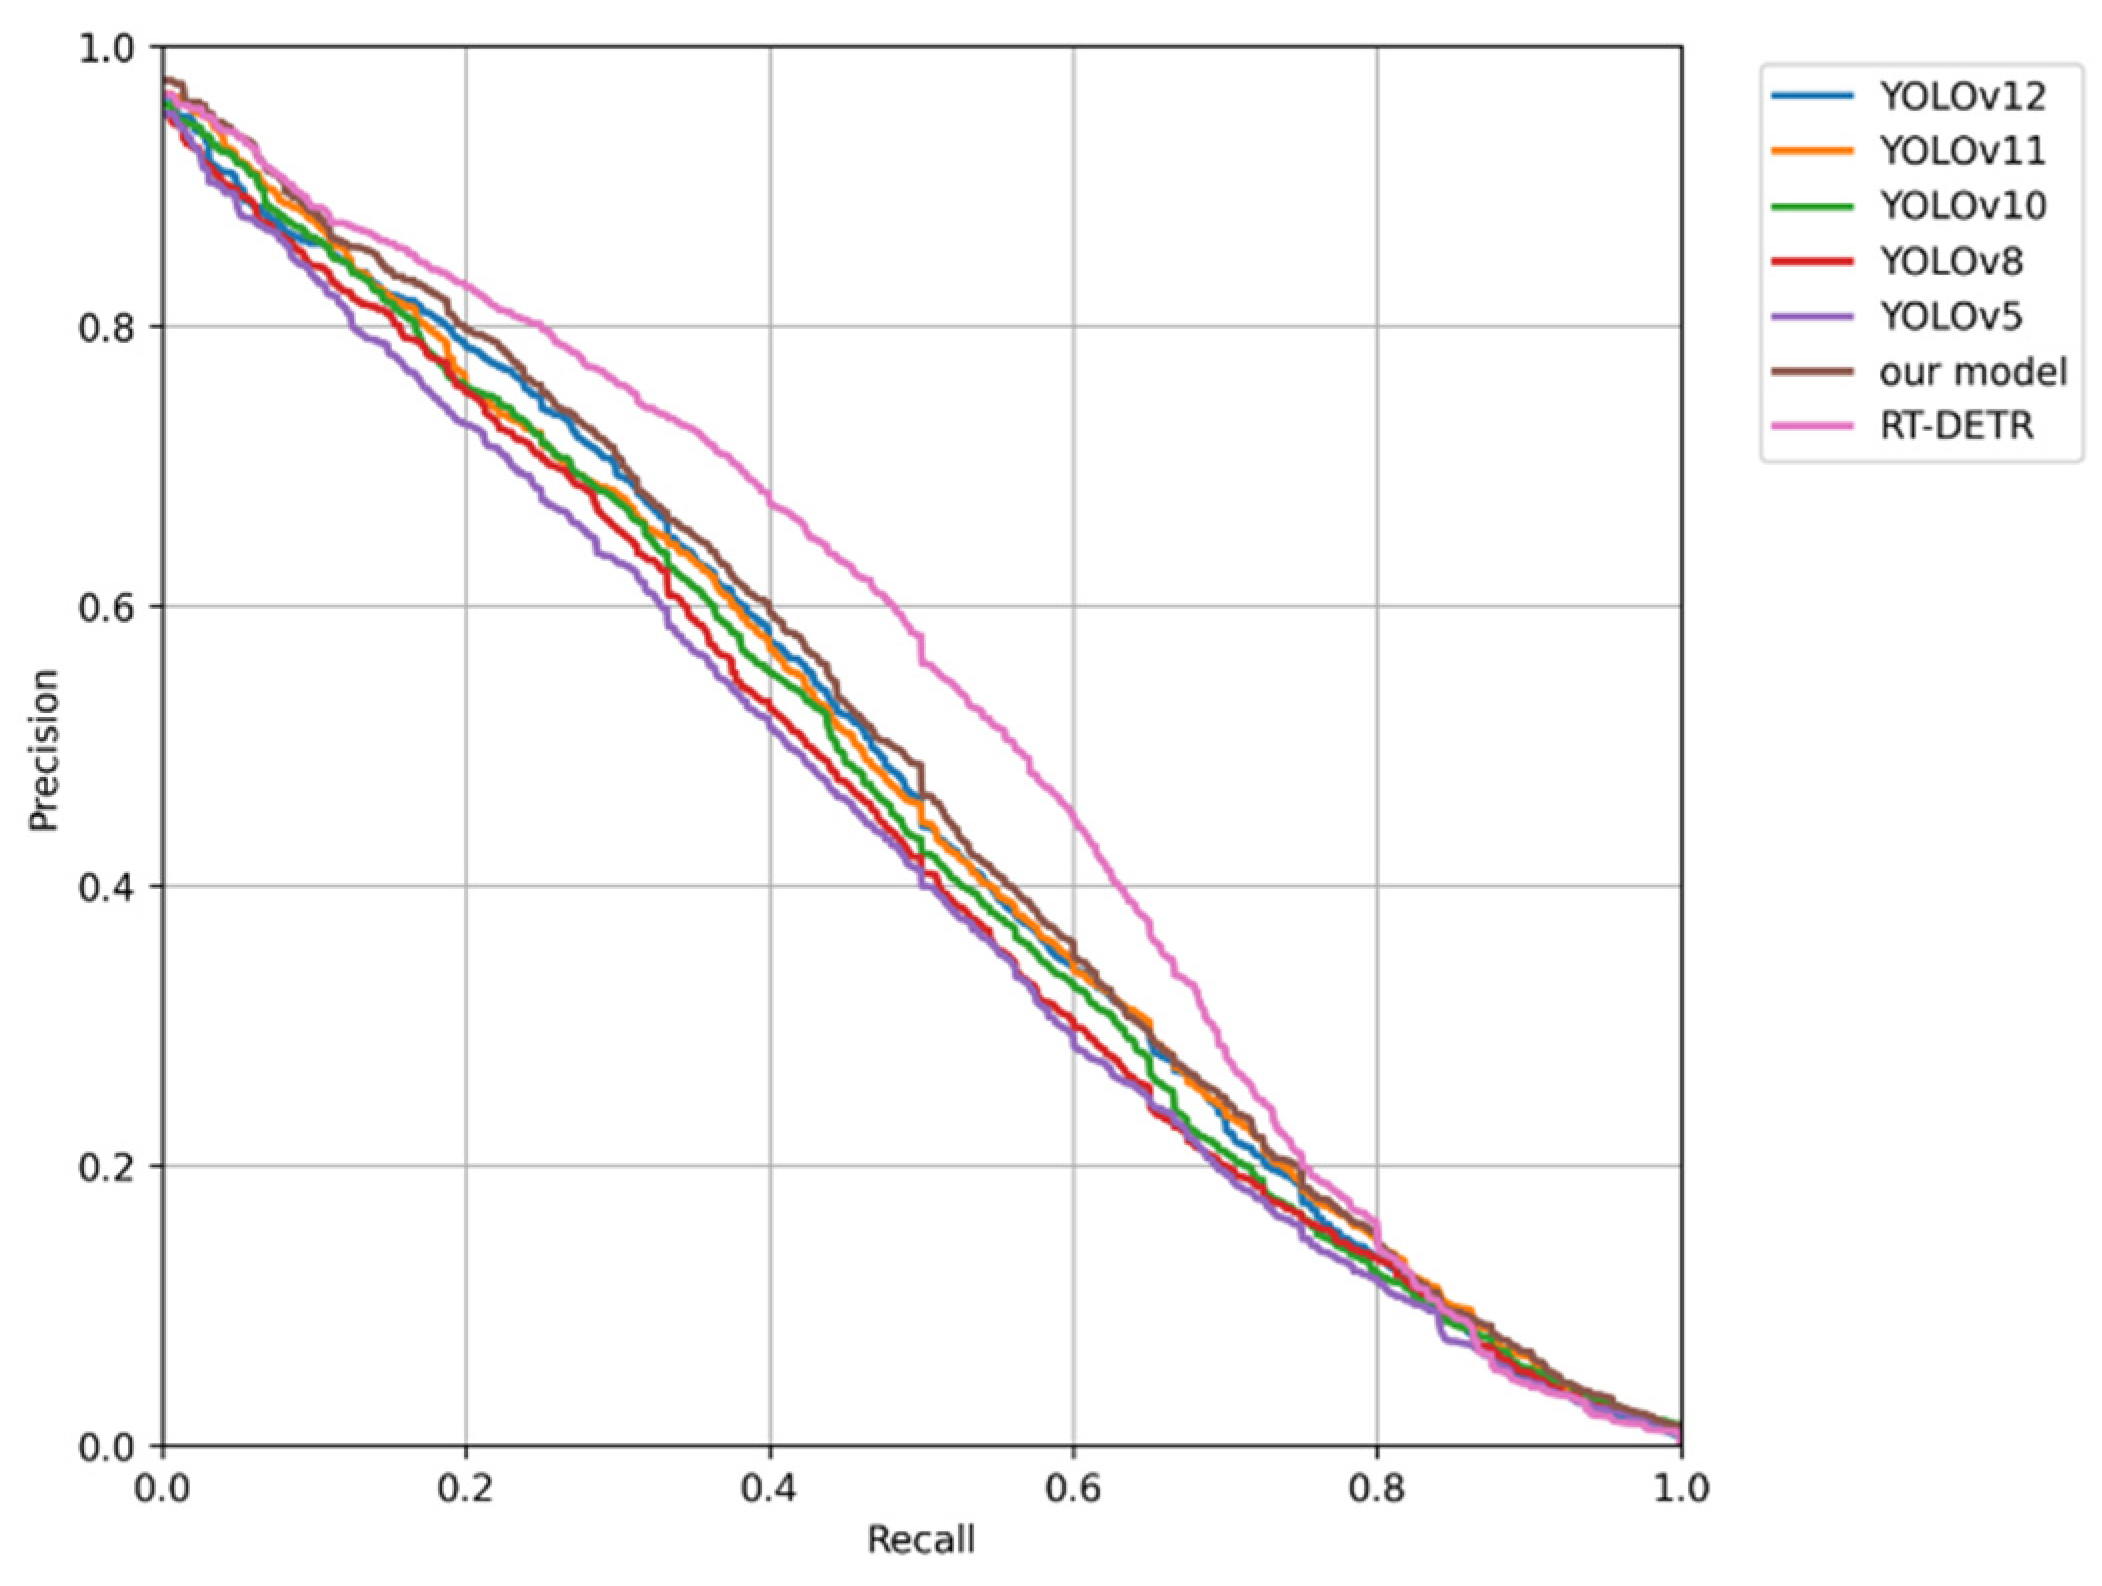
Figure 7 shows a radar chart comparing the new model with various mainstream models across multiple key performance indicators (mAP, FLOPs, number of parameters, FPS, F1 score), clearly illustrating the new model’s comprehensive advantages in multiple dimensions. Figure 8 presents the relationship curve between mAP@0.5 and FPS for each algorithm, with algorithms closer to the top-right corner representing better performance. It can be seen that the proposed model achieves the highest detection accuracy while maintaining a high frame rate, validating its practicality in real-world scenarios. Additionally, Figure 9 and Figure 10 show the F1 score curves and PR curves for each model, respectively. As shown, except for the RT-DETR model, which has a low FPS, the model proposed in this paper performs the best in detection accuracy. A larger area under the PR curve indicates stronger detection performance, and a higher F1 score means the model is more stable and reliable in object recognition and localization. Notably, within a wide confidence threshold range, the proposed model maintains a high F1 score, indicating better robustness to threshold variations.
Based on the above comparison results, the new model proposed in this paper achieves higher detection accuracy for small objects while ensuring real-time performance (FPS > 60), demonstrating good scalability and engineering application value.

3.3. Model Effectiveness Analysis

To further validate the generalization ability of the proposed model across different datasets, this paper conducts experimental evaluations on two representative datasets: PASCAL VOC and VisDrone2019. The detection results of various mainstream object detection models on these two datasets are listed in Table 5 and Table 6.
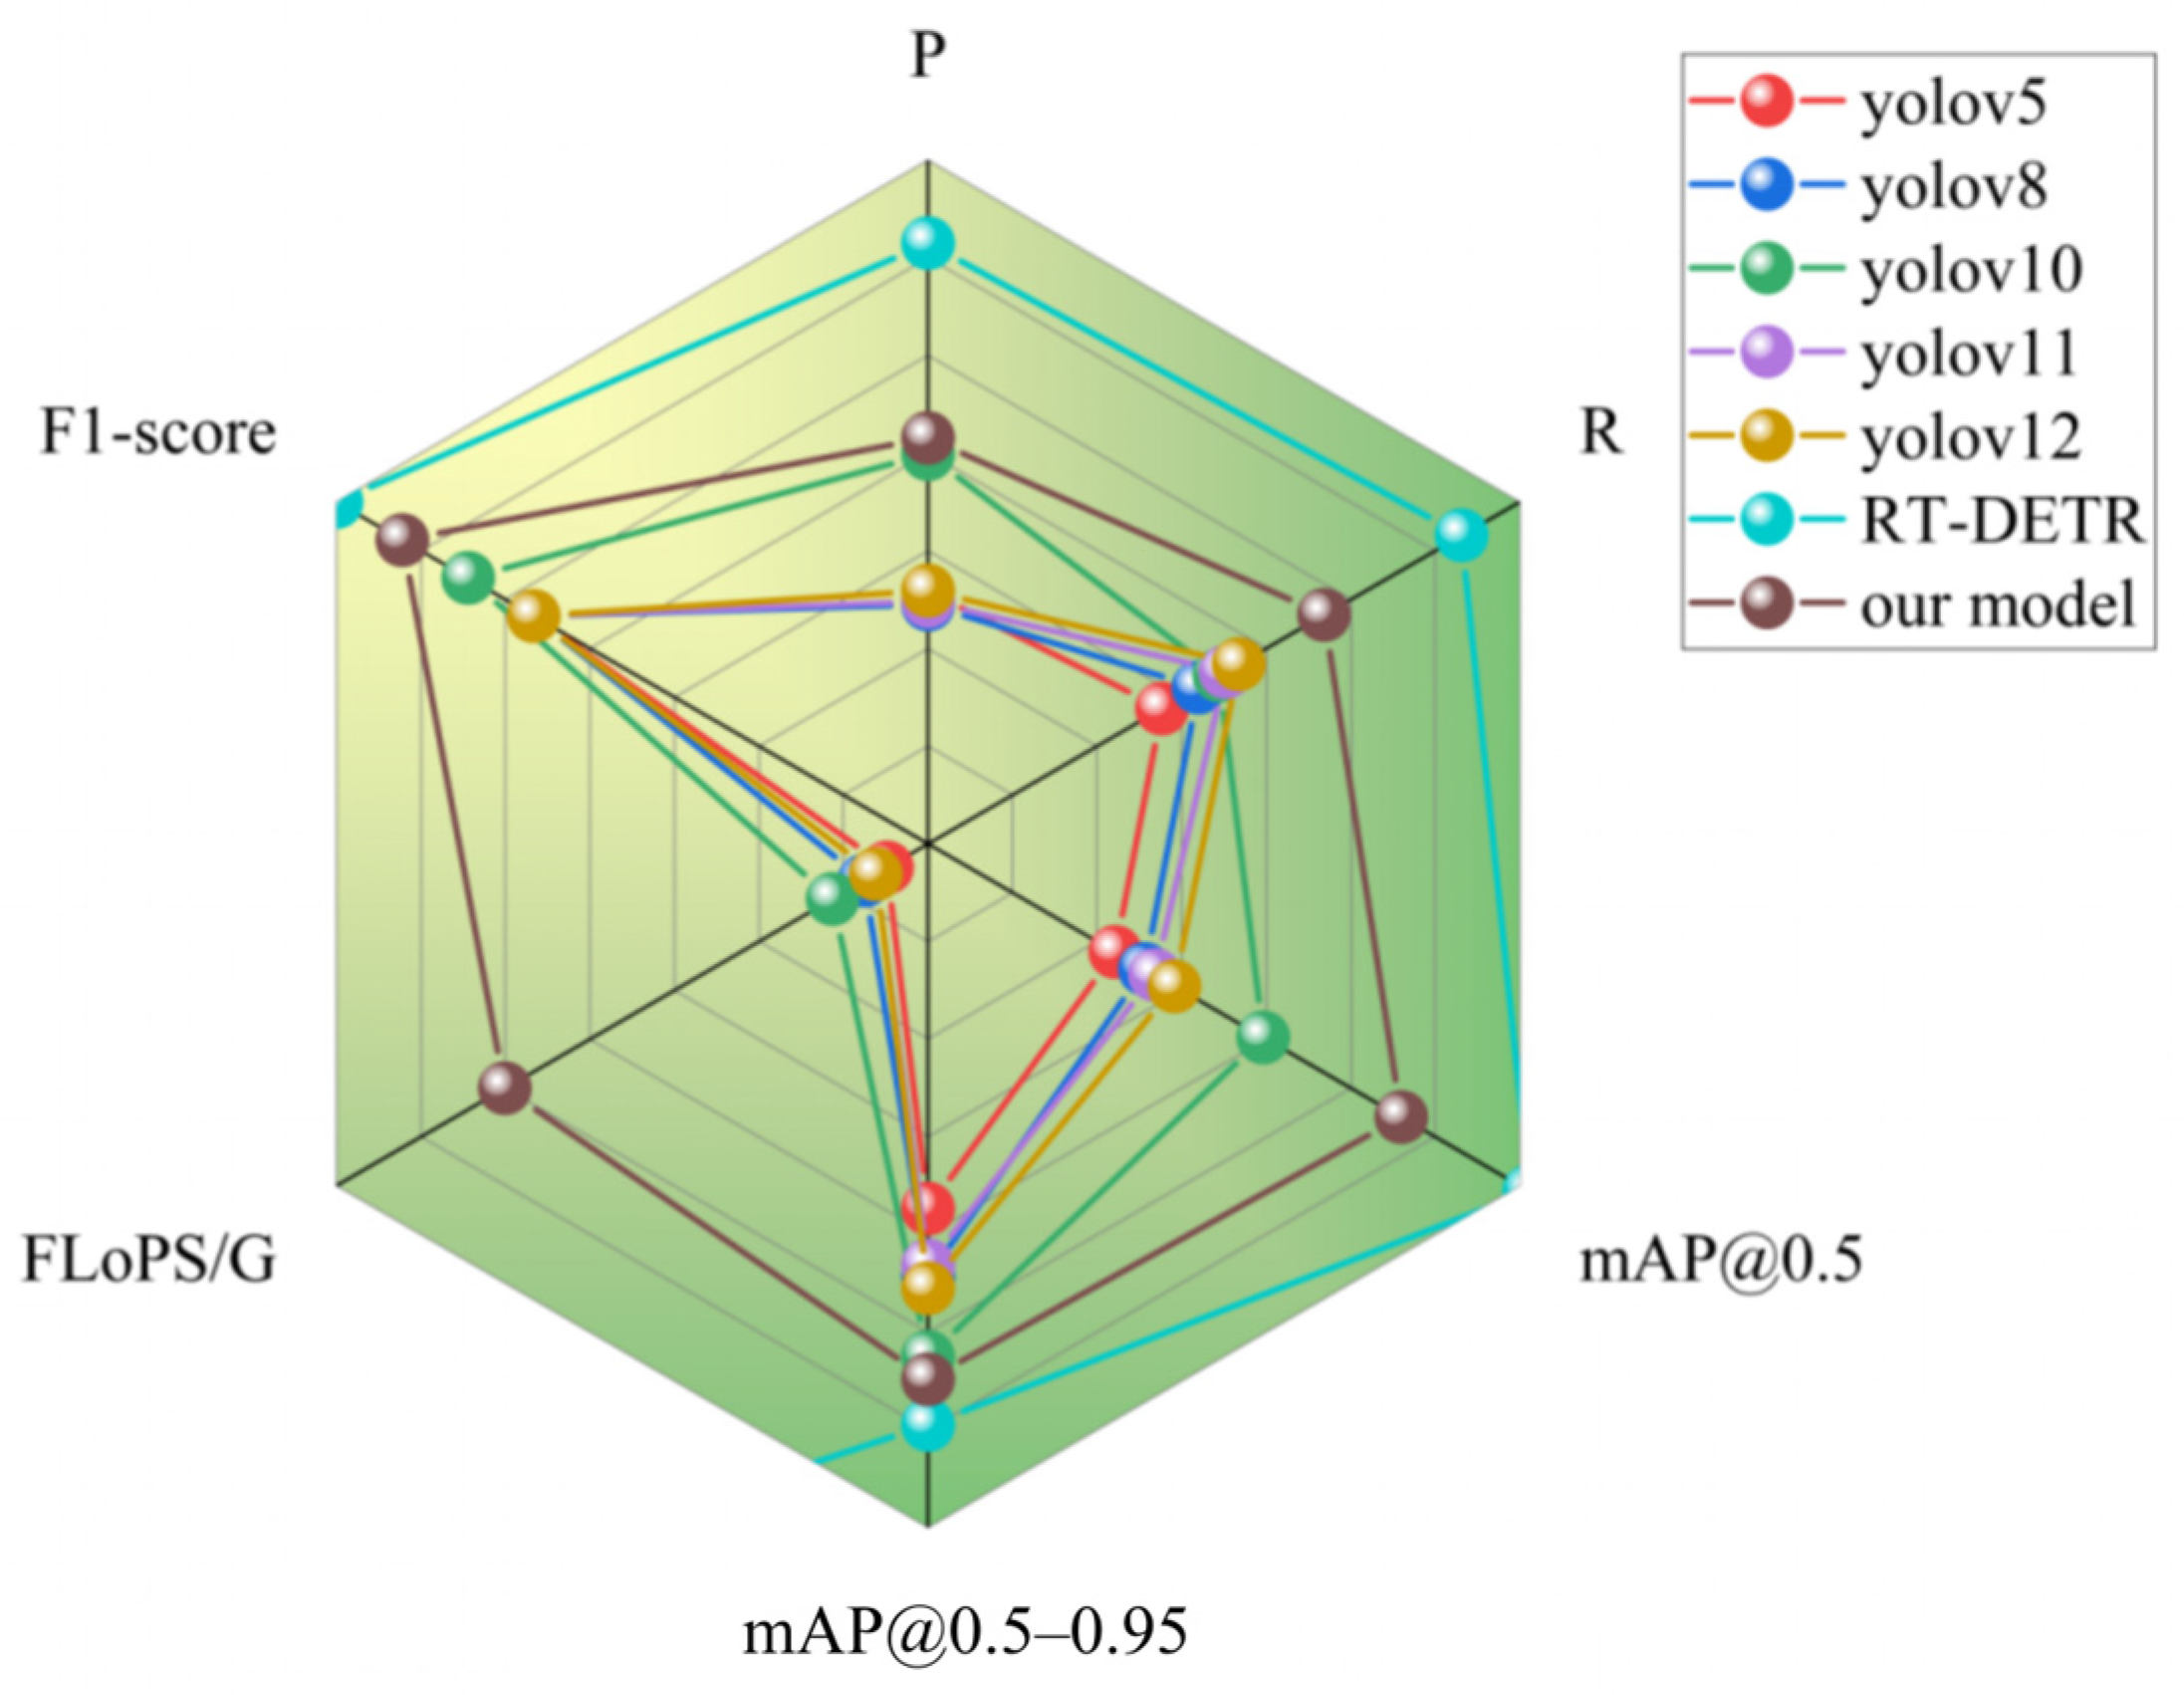
From Table 5 and Figure 11, it can be seen that the proposed model achieves mAP@0.5 = 0.630 and mAP@0.5:0.95 = 0.453 on the PASCAL VOC dataset, representing improvements of 2.7% and 0.8%, respectively, over the best baseline model. Meanwhile, the inference speed reaches FPS = 100.1, maintaining excellent running efficiency while improving accuracy. This demonstrates that the new model outperforms mainstream YOLO series algorithms in terms of overall performance on the PASCAL VOC dataset.
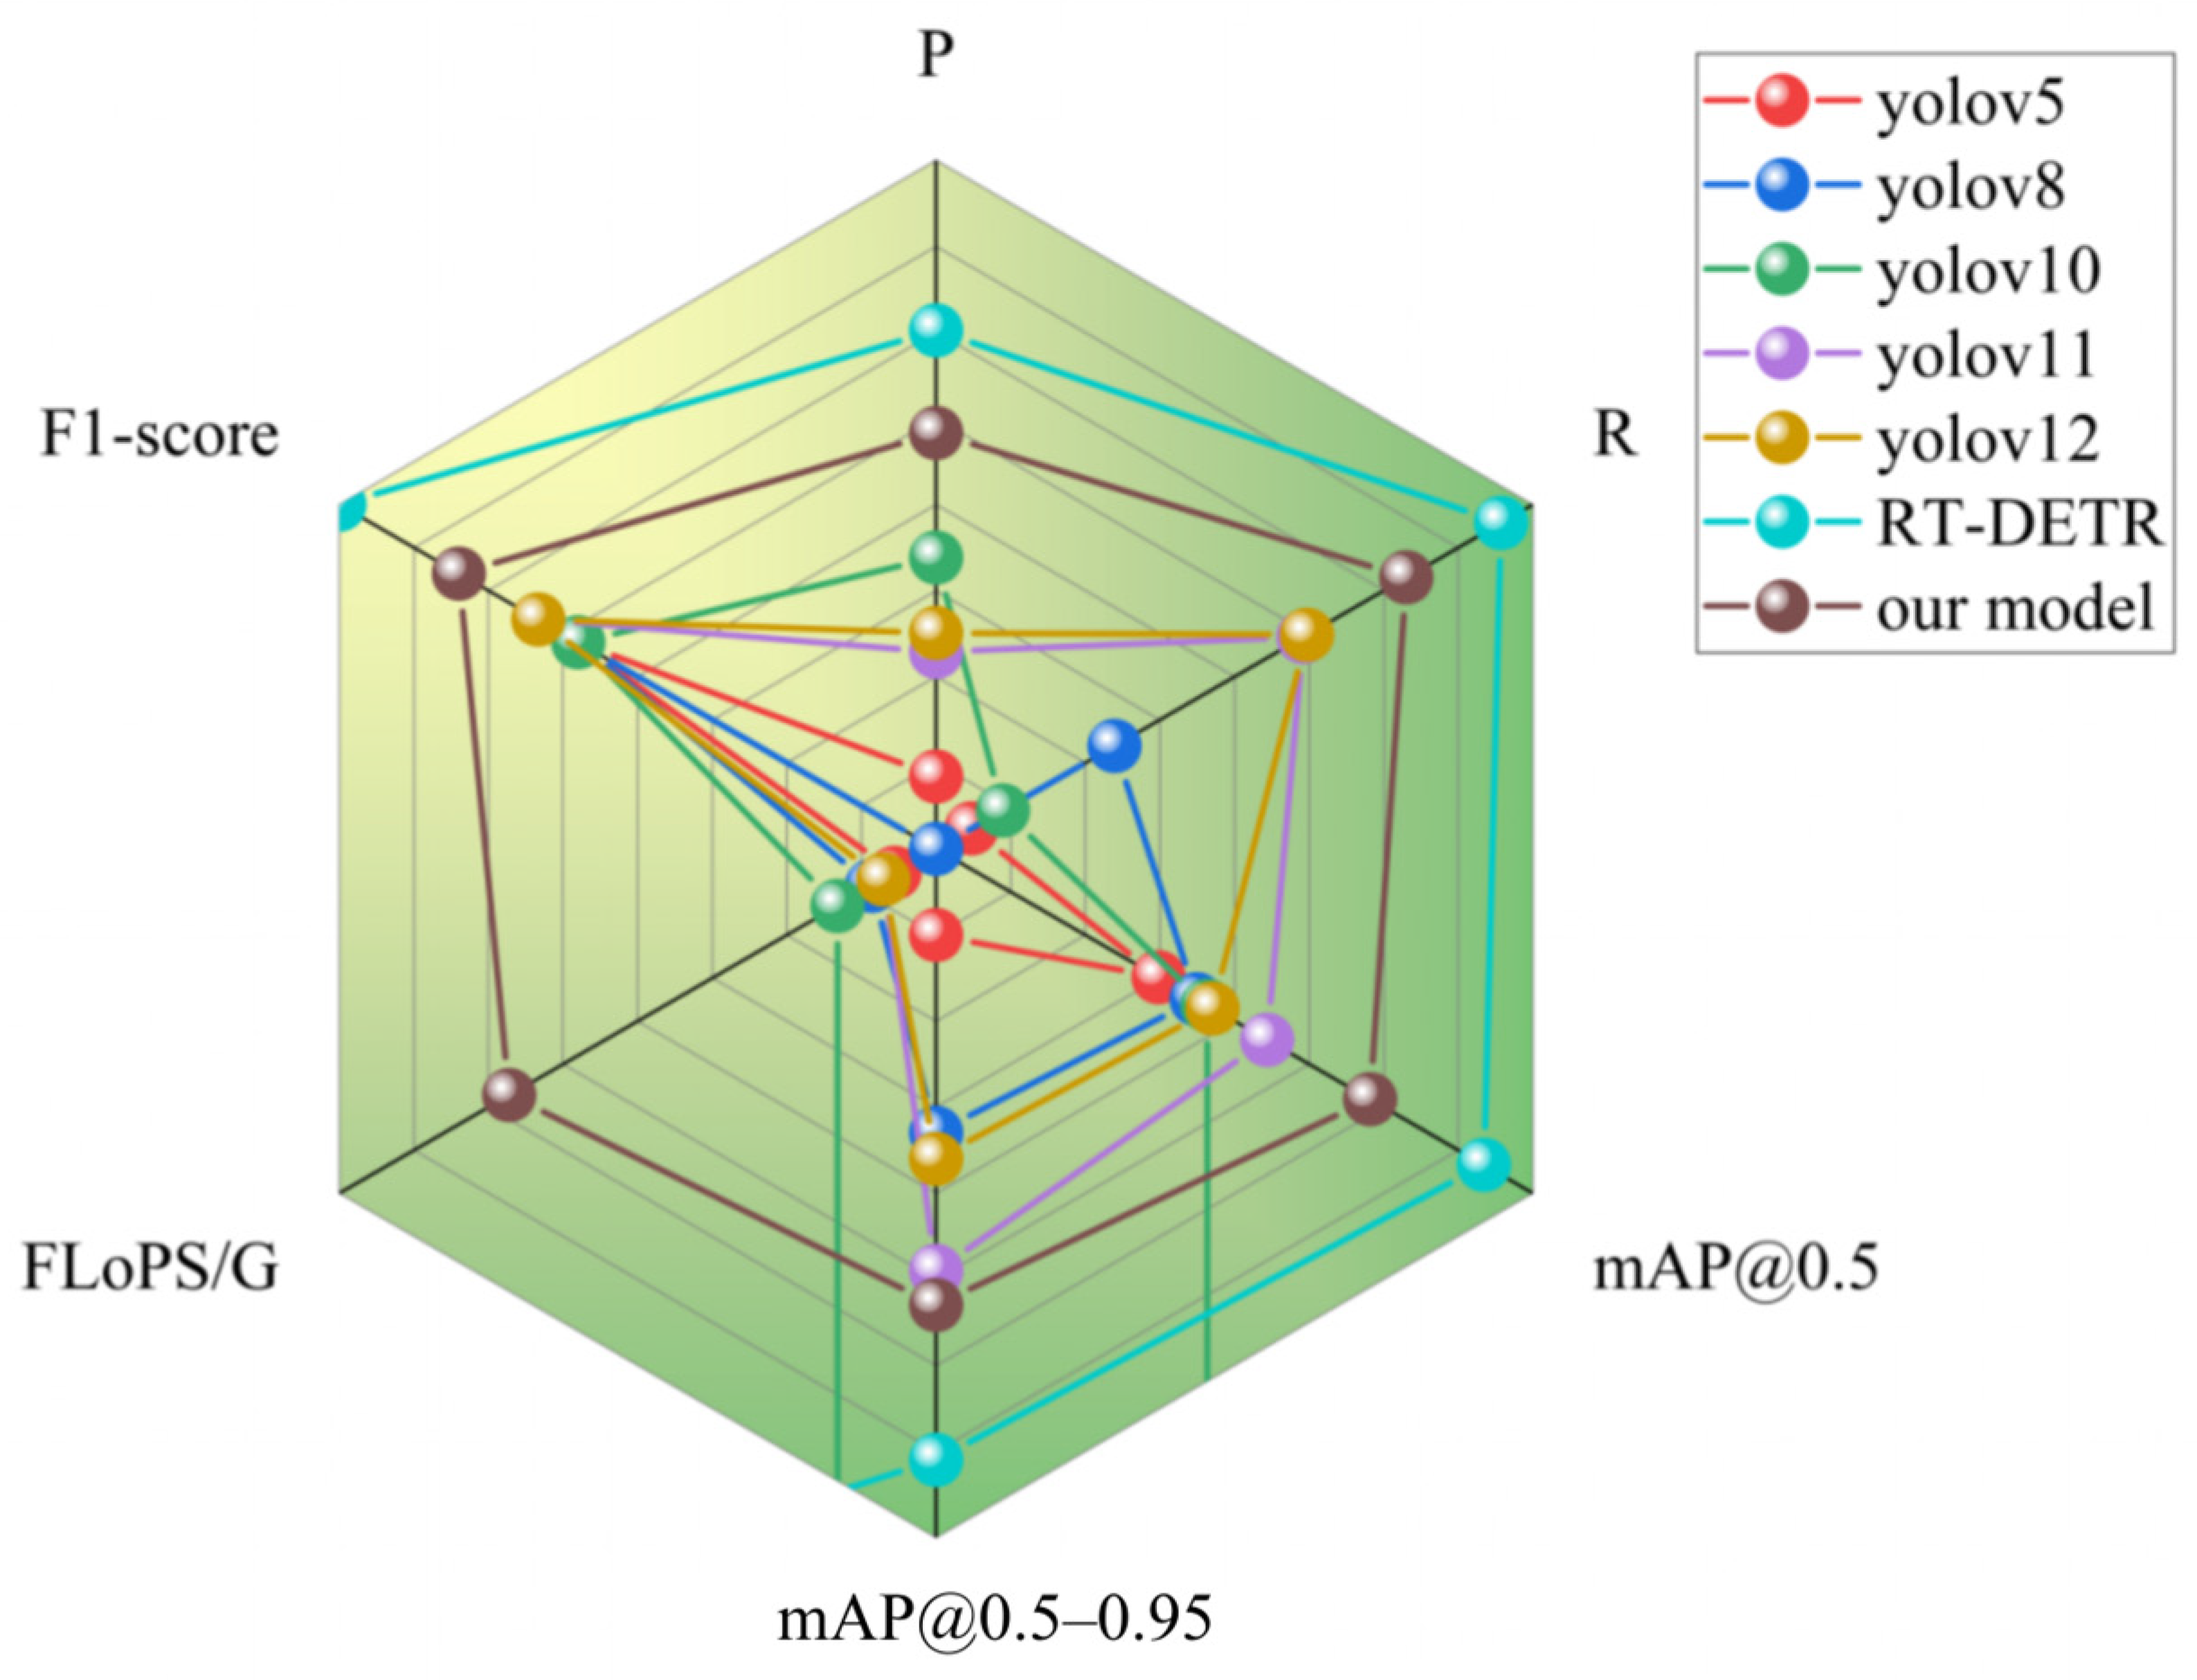
The experimental results on the VisDrone2019 dataset are shown in Table 6 and in Figure 12. This dataset is primarily used to evaluate the performance of dense small-object detection scenes and is more challenging. The results indicate that the proposed model achieves an average detection accuracy of 0.348 on this dataset, which is a 2.9% improvement over the baseline model, further validating its ability to detect small objects in complex scenarios.
In summary, the proposed new model achieves significant improvements in detection accuracy on both the PASCAL VOC and VisDrone datasets, while maintaining real-time inference performance (FPS > 60), fully demonstrating the model’s excellent generalization ability and practicality in cross-scenario and small-object detection tasks.

3.4. Ablation Study

To assess the actual contribution of each module in the overall model, this paper designs an ablation study, gradually introducing the three key components of the proposed model: the RCSOSA module, the HFPN module, and the NWD-CIoU loss function. The experimental results are shown in Table 7, where “✓” indicates that the module has been enabled.
As seen in the table, each module has a positive impact on detection performance. After introducing the RCSOSA module, the model’s mAP@0.5 and mAP@0.5:0.95 improve to 0.451 and 0.312, respectively, showing increases of 1.6% and 1.4% over the baseline model, with the number of parameters increasing to 3.46 M. This indicates that the RCSOSA module contributes the most to the accuracy improvement. When the HFPN module is introduced, mAP@0.5 increases to 0.449, and mAP@0.5:0.95 increases to 0.309, with improvements of 1.4% and 1.1%, and the model parameters grow to 3.03 M, highlighting its significant effect in enhancing feature fusion. After introducing the NWD-CIoU loss function, mAP@0.5 and mAP@0.5:0.95 increase to 0.441 and 0.301, respectively. Although the improvements are relatively small (0.6% and 0.3%), the NWD-CIoU loss function plays a positive role in fine-tuning object localization accuracy, with only a slight increase in parameters, reaching 2.63 M.
Furthermore, the ablation study reveals positive synergistic effects between the proposed modules. The combination of RCSOSA and HFPN yields a greater performance gain (mAP@0.5: 0.469) than the sum of their individual improvements. This suggests that the RCSOSA module’s enhanced feature extraction in the backbone provides more discriminative inputs for the HFPN module’s hierarchical fusion, enabling more effective integration of local and global contexts. Similarly, integrating the NWD-CIoU loss with either RCSOSA or HFPN (Rows 6 and 7) shows complementary benefits, as the dynamic loss provides better gradient guidance for training the enhanced architecture. The full model integrating all three components achieves the best performance, demonstrating that the contributions of the RCSOSA module (primarily for feature enhancement), the HFPN module (for multi-scale fusion), and the NWD-CIoU loss (for optimized regression) are complementary and mutually reinforcing.

3.5. Visual Results Analyses

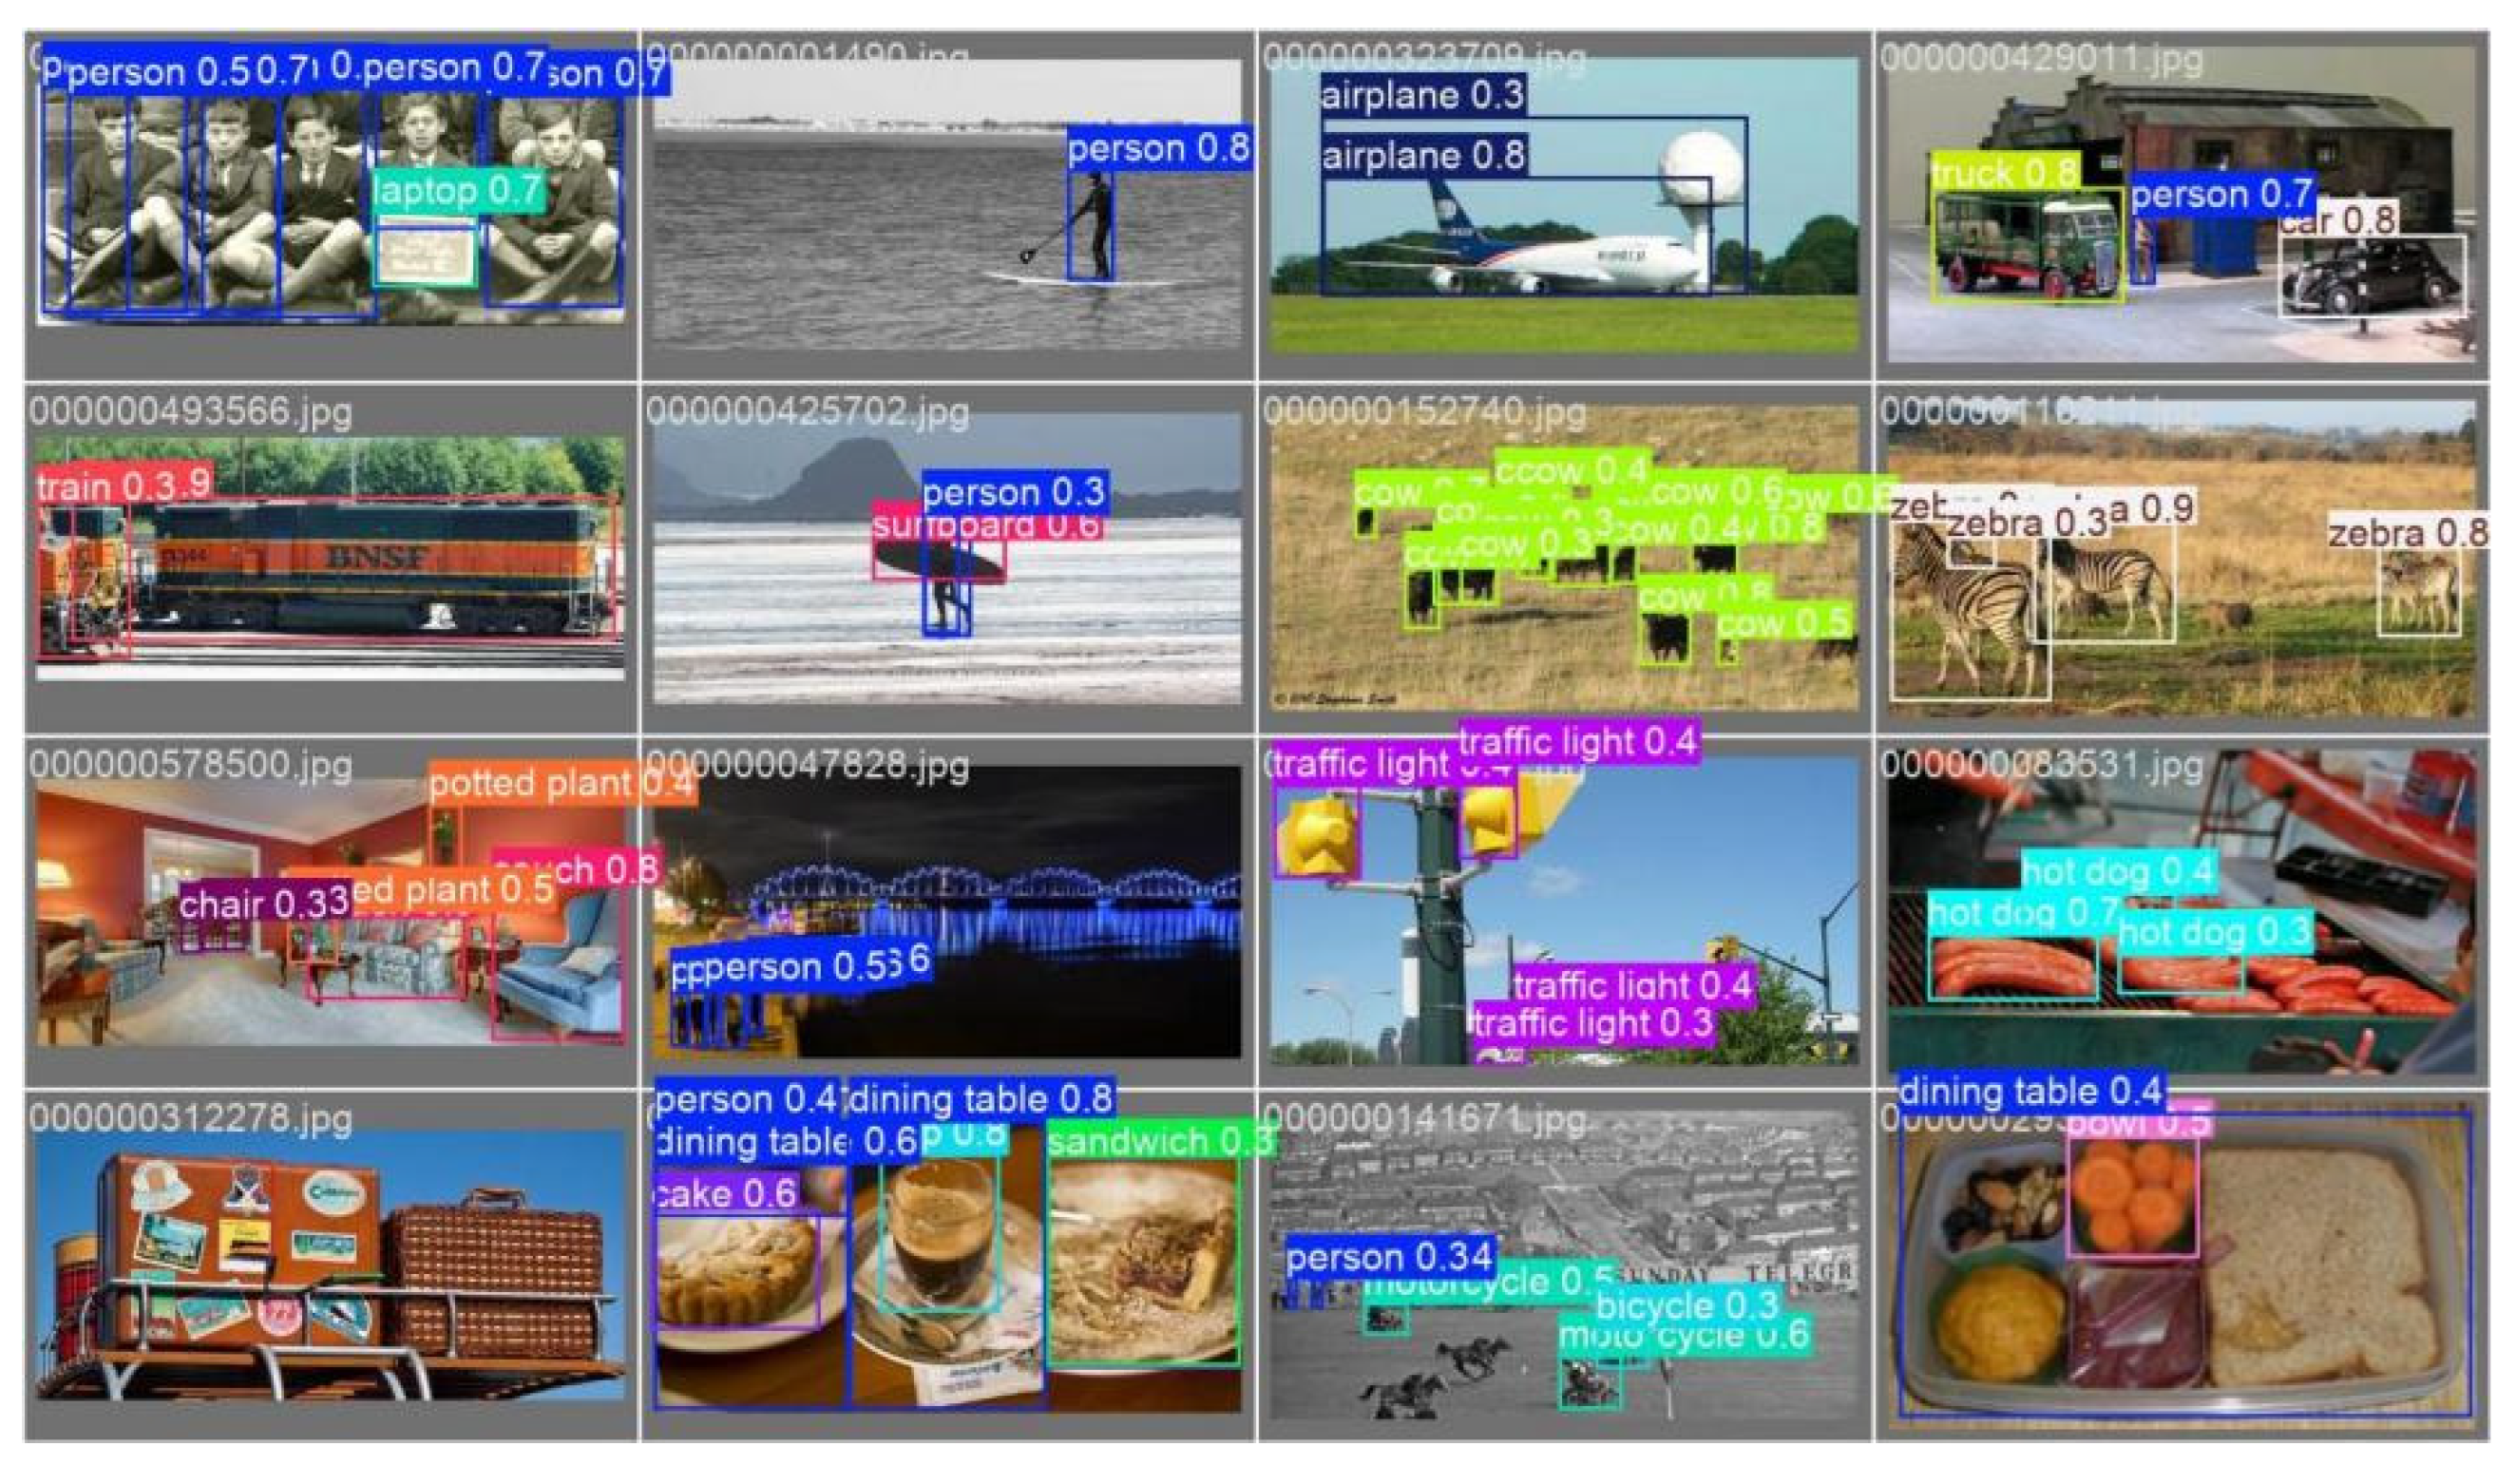
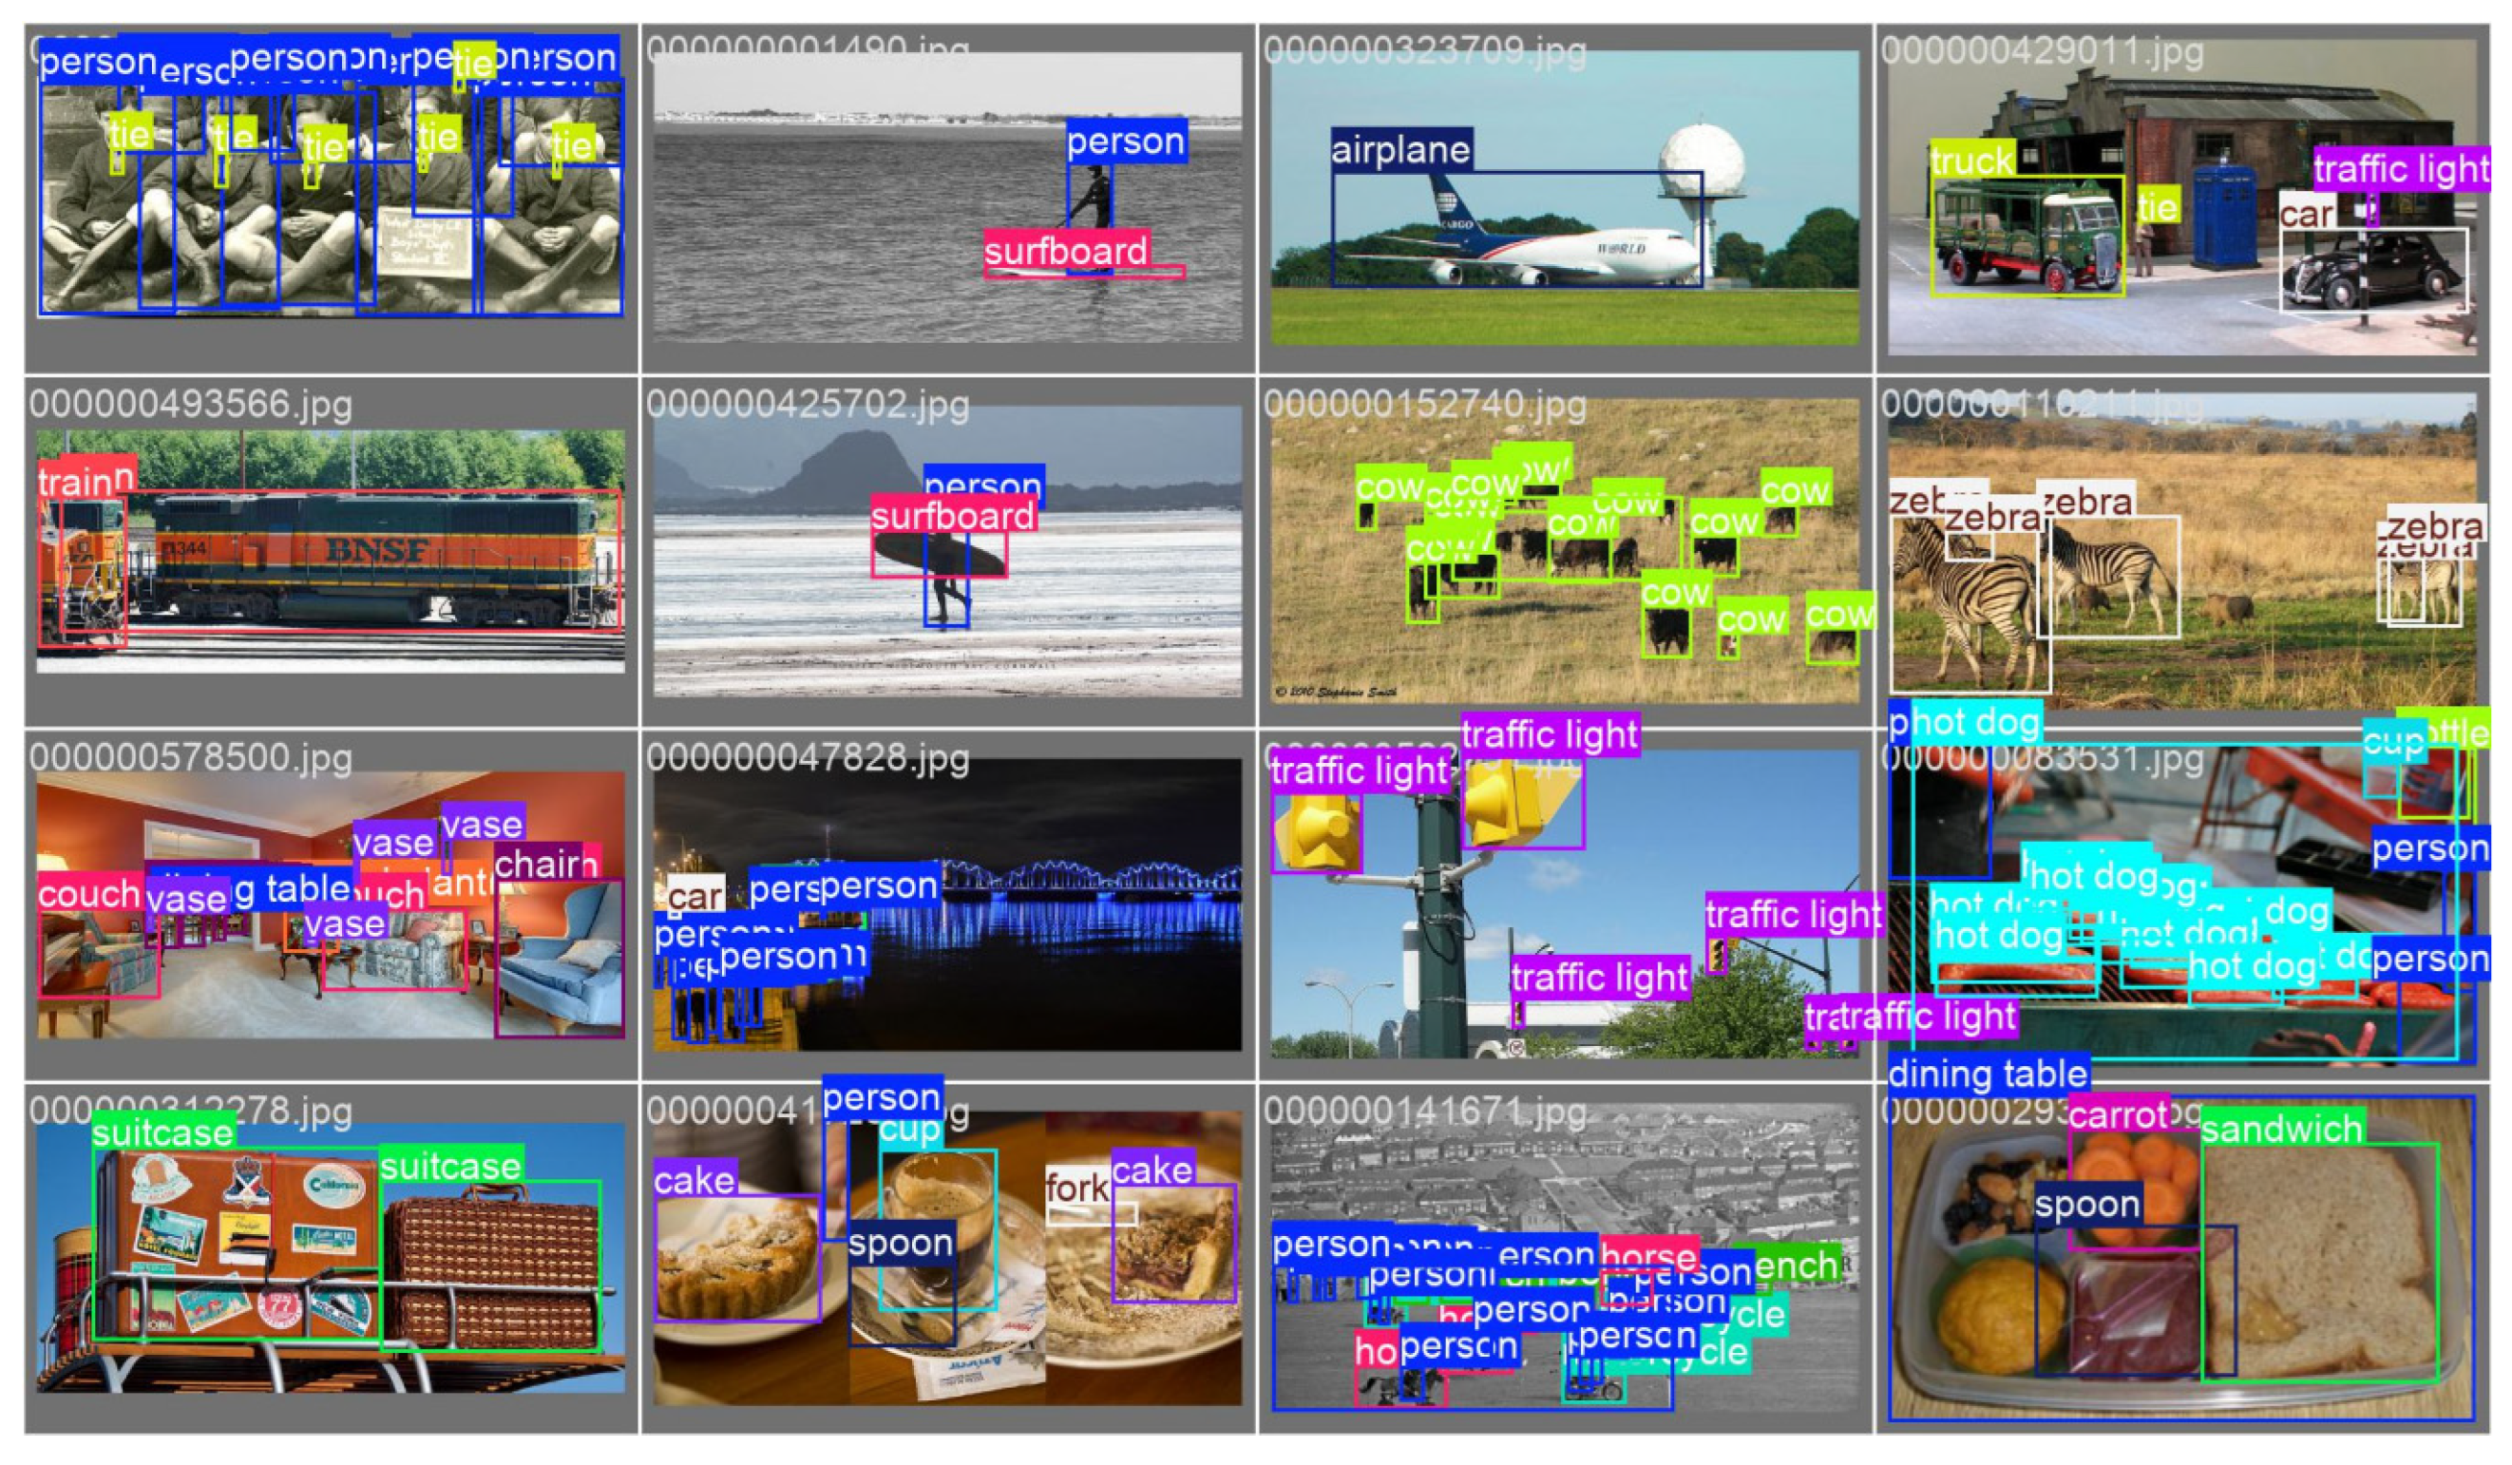
To more intuitively demonstrate the advantages of the proposed model in small-object detection tasks, this paper compares and visualizes the detection results of the new model and the baseline model YOLOv11 on the MS COCO validation set. Representative images selected from numerous samples are shown in Figure 13 and Figure 14. As illustrated in Figure 13, when detecting the “person” class, a typical small object, YOLOv11 exhibits a clear failure to detect, identifying only one target. In contrast, the proposed new model successfully detects nine targets in the same image, significantly improving the recall rate for small-object detection. This result further validates that the new model outperforms the baseline model in detecting small-scale targets, demonstrating stronger feature representation and localization capabilities, making it especially suitable for dense small-object detection tasks in complex scenes.

3.6. Model Deployment on Mobile Devices

To prove the feasibility of deploying the new model on the Android system, we trained the new model based on the MS COCO dataset and then deployed it to the Android side to achieve offline, low-latency image detection and real-time monitoring. This demonstrates that the model can maintain an acceptable operational delay outside of the high-performance simulation environment and is suitable for resource-constrained real-time applications. To meet the lightweight requirements of the mobile end and the need for efficient inference, we adopted NCNN as the end-side inference framework. The new files after training were exported as NCNN models, obtaining the network structure and network weights. The Android side adopted a three-layer architecture of “Kotlin + JNI + NCNN(C++)”. The application layer (Kotlin) is responsible for interface interaction, camera acquisition, image selection, and result visualization; the interface layer (JNI) is responsible for parameter passing and memory object bridging; the inference layer (C++/NCNN) is responsible for model loading, preprocessing, forward inference, post-processing (NMS), and result output.
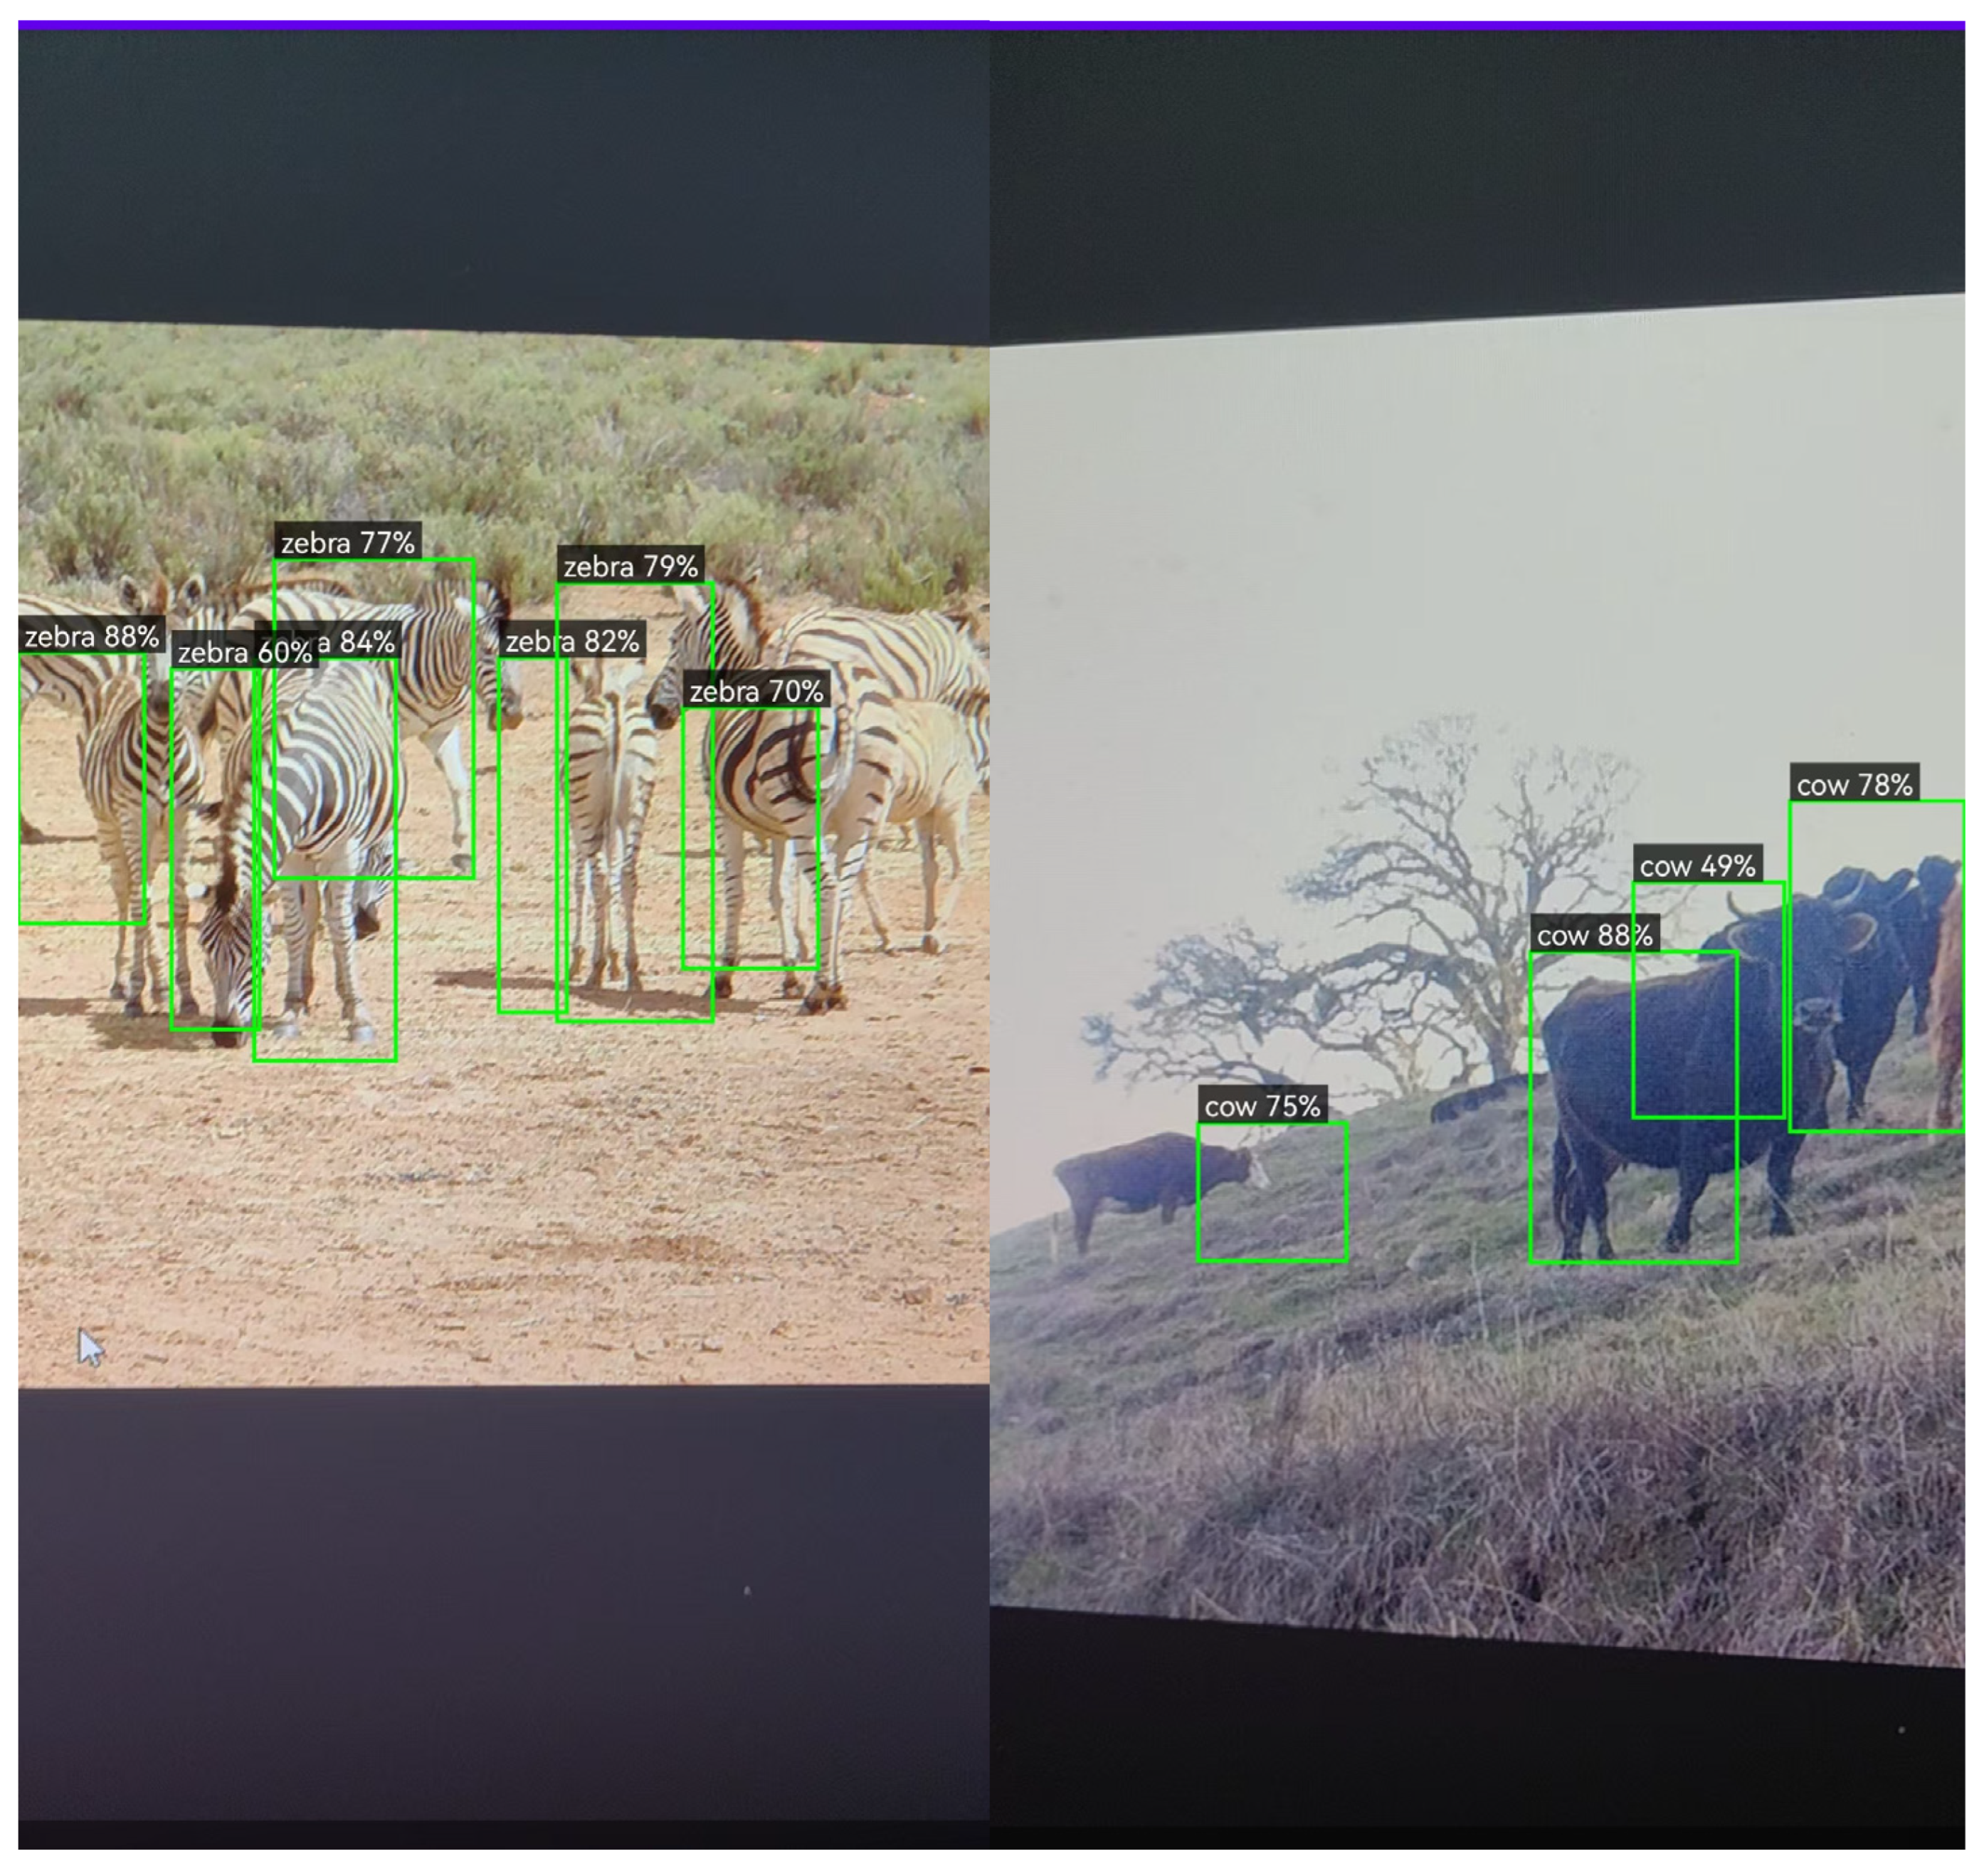
The final application can run stably on Android devices, supporting the dual mode of “image detection + real-time detection”, and can perform end-side recognition and visual output. Figure 15 shows the real-time monitoring effect of the mobile APP. From the figure, it can be seen that this APP can detect the number of bromine ions and the inference time. After testing, the inference time of this APP during real-time monitoring is greater than 60 ms, meeting the real-time requirements, which also proves that our model still has an acceptable operation delay on the mobile end.

4. Discussion

This study evaluates the proposed model through comprehensive experiments on three benchmark datasets: MS COCO, VisDrone2019, and PASCAL VOC 2012, demonstrating improved detection performance. Nevertheless, certain limitations persist in this work. The following sections discuss these shortcomings and outline potential avenues for future research.
(1)
Practical Deployment Gap: Current validation relies predominantly on software simulation, creating a gap to real-world deployment. Future efforts will focus on porting the model to hardware platforms and iterative optimization in practical settings. Techniques such as model quantization, pruning, and compression will be explored to enhance operational efficiency on resource-constrained embedded or edge devices.
(2)
Hyperparameter Optimization Space: Despite achieving high accuracy, the model’s hyperparameters present an opportunity for further tuning. In future work, we plan to employ advanced meta-heuristic optimization algorithms to systematically search for more optimal parameter configurations.
Computational Cost and Generalization: Compared to the baseline, the proposed model entails higher computational demands. To address this, model compression techniques like pruning, quantization, and knowledge distillation could be applied. Additionally, enhancing model generalization and mitigating overfitting through advanced data augmentation and regularization schemes remain important areas for future work.
In conclusion, this work demonstrates the effectiveness of the RCS-HFPN-YOLOv11 framework for small-object detection. The results should be interpreted considering the ongoing challenge of balancing accuracy and speed in this domain, as highlighted in related studies. The findings—notably the gains in mAP, especially for small objects (APS)—validate the working hypotheses behind the RCSOSA, HFPN, and dynamic loss design. The broader implications include a viable architectural strategy for real-time, accurate small-object detection in applications like drone imagery and automated inspection. Future research directions, beyond addressing the aforementioned limitations, could include exploring the integration of larger vision–language models for enhanced contextual understanding and testing the framework on a wider array of specialized small object datasets.


5. Conclusions

In response to the practical needs of small-object detection in industrial inspection, this paper proposes an innovative object detection model. The model introduces the RCSOSA module, which enhances feature expression and transmission efficiency by improving traditional convolutional modules and incorporating dynamic feature interaction capabilities. It also constructs the HFPN module, which fuses local and global information, effectively combining the strengths of CNNs and Transformers to achieve efficient multi-scale feature fusion and significantly improve detection capability. Additionally, the paper presents a dynamic weighted fusion loss function based on CIoU and NWD losses, optimizing localization accuracy and convergence stability during training. Experimental results demonstrate that this model exhibits superior performance in small-object detection tasks, significantly outperforming current mainstream detection methods, and holds promising application prospects and potential for wider adoption.

Author Contributions

Conceptualization, H.Z. and R.L.; methodology, R.L.; software, R.L.; validation, Y.F., Z.Z. and R.L.; formal analysis, H.Z.; investigation, H.Z.; resources, H.Z.; data curation, Y.F.; writing—original draft preparation, R.L.; writing—review and editing, R.L.; visualization, R.L.; supervision, R.L.; project administration, H.Z.; funding acquisition, H.Z. All authors have read and agreed to the published version of the manuscript.

Funding

This research received no external funding.

Data Availability Statement

Data derived from public domain resources. These data were derived from the following resources available in the public domain: MS COCO, available at: https://cocodataset.org/ (accessed on 8 April 2026); VisDrone2019, available at: https://github.com/VisDrone/VisDrone-Dataset (accessed on 8 April 2026); PASCAL VOC, available at: http://host.robots.ox.ac.uk/pascal/VOC/ (accessed on 8 April 2026).

Acknowledgments

The authors sincerely thank the experts who provided valuable insights for the optimization and improvement in the target detection algorithms.

Conflicts of Interest

The authors declare no conflicts of interest.

Abbreviations

The following abbreviations are used in this manuscript:
AIArtificial Intelligence
CIoUComplete Intersection over Union
CNNConvolutional Neural Network
FPSFrames Per Second
mAPMean Average Precision
YOLOYou Only Look Once
NWDNormalized Wasserstein Distance
RCSOSAReduced Channel Spatial One-Shot Aggregation

References

  1. Zhang, Y.; Yin, Y.; Shao, Z. An Enhanced Target Detection Algorithm for Maritime Search and Rescue Based on Aerial Images. Remote Sens. 2023, 15, 4818. [Google Scholar] [CrossRef]
  2. Zhao, R.; Wang, K.; Xiao, Y.; Gao, F.; Gao, Z. Leveraging Monte Carlo Dropout for Uncertainty Quantification in Real-Time Object Detection of Autonomous Vehicles. IEEE Access 2024, 12, 33384–33399. [Google Scholar] [CrossRef]
  3. Li, J.; Song, W.; Gao, Y.; Wang, H.; Yan, Y.; Huang, B.; Zhang, J.; Wang, W. Monocular 3-D Object Detection Based on Depth-Guided Local Convolution for Smart Payment in D2D Systems. IEEE Internet Things J. 2023, 10, 2245–2254. [Google Scholar] [CrossRef]
  4. Iwanowski, M.; Gahbler, M. Multiple Large AI Models’ Consensus for Object Detection—A Survey. Appl. Sci. 2025, 15, 12961. [Google Scholar] [CrossRef]
  5. Sapkota, R.; Karkee, M. Object detection with multimodal large vision-language models: An in-depth review. Inf. Fusion 2026, 126, 103575. [Google Scholar] [CrossRef]
  6. Jing, X.; Su, H.; Jia, C.; Mao, Z.; Shen, L. Fusion detection in distributed MIMO radar under hybrid-order Gaussian model. Signal Process. 2024, 214, 109256. [Google Scholar] [CrossRef]
  7. Wang, S.; Cai, Z.; Yuan, J. Automatic SAR Ship Detection Based on Multifeature Fusion Network in Spatial and Frequency Domains. IEEE Trans. Geosci. Remote Sens. 2023, 61, 4102111. [Google Scholar] [CrossRef]
  8. Huang, Z.A.; Wang, J.W.; Xiao, Q.; Li, B.Y.; Wang, W.H.; Wan, X.; Cheng, Q.; Cui, T.J. A Single Metasurface Can Perform Range-Velocity Detection and Target Imaging Simultaneously at Single Frequency. Adv. Opt. Mater. 2022, 10, 2201382. [Google Scholar] [CrossRef]
  9. Song, L.; Wang, Y.; Yang, Y.; Zhu, X. Vehicle door frame positioning method for binocular vision robots based on improved YOLOv4. Meas. Sci. Technol. 2023, 34, 065005. [Google Scholar] [CrossRef]
  10. Li, Q.; Chen, X.; Wang, B.; Liu, J.; Zhang, G.; Feng, B. Shot Boundary Detection Based on Global Features and the Target Features. Symmetry 2023, 15, 565. [Google Scholar] [CrossRef]
  11. Girshick, R.; Donahue, J.; Darrell, T.; Malik, J. Rich Feature Hierarchies for Accurate Object Detection and Semantic Segmentation. In Proceedings of the IEEE Conference on Computer Vision and Pattern Recognition (CVPR) 2014, Columbus, OH, USA, 23–28 June 2014; pp. 580–587. [Google Scholar]
  12. Girshick, R. Fast R-CNN. In Proceedings of the 2015 IEEE International Conference on Computer Vision (ICCV); IEEE: Piscataway, NJ, USA, 2015; pp. 1440–1448. [Google Scholar]
  13. Ren, S.; He, K.; Girshick, R.; Sun, J. Faster R-CNN: Towards Real-Time Object Detection with Region Proposal Networks. IEEE Trans. Pattern Anal. Mach. Intell. 2017, 39, 1137–1149. [Google Scholar] [CrossRef]
  14. Wei, R.; Feng, Z.; Wu, Z.; Yu, C.; Song, B.; Cao, C. Optical Remote Sensing Image Target Detection Based on Improved Feature Pyramid. IEEE J. Sel. Top. Appl. Earth Obs. Remote Sens. 2023, 16, 7507–7517. [Google Scholar] [CrossRef]
  15. Song, H.; Zhang, X.; Song, J.; Zhao, J. Detection and tracking of safety helmet based on DeepSort and YOLOv5. Multimed. Tools Appl. 2022, 82, 10781–10794. [Google Scholar] [CrossRef]
  16. Varghese, R.; M., S. YOLOv8: A Novel Object Detection Algorithm with Enhanced Performance and Robustness. In Proceedings of the 2024 International Conference on Advances in Data Engineering and Intelligent Computing Systems (ADICS), Chennai, India, 18–19 April 2024; pp. 1–6. [Google Scholar]
  17. Li, W.; Li, Z.; Wang, C.; Zhang, X.; Duan, J. An improved SSD lightweight network with coordinate attention for aircraft target recognition in scene videos. J. Intell. Fuzzy Syst. 2024, 46, 355–368. [Google Scholar] [CrossRef]
  18. Teju, V.; Sowmya, K.V.; Kandula, S.R.; Stan, A.; Stan, O.P. A Hybrid Retina Net Classifier for Thermal Imaging. Appl. Sci. 2023, 13, 8525. [Google Scholar] [CrossRef]
  19. Zhang, Q.; Wang, X.; Shi, H.; Wang, K.; Tian, Y.; Xu, Z.; Zhang, Y.; Jia, G. BRA-YOLOv10: UAV Small Target Detection Based on YOLOv10. Drones 2025, 9, 159. [Google Scholar] [CrossRef]
  20. Zhang, Z. Drone-YOLO: An Efficient Neural Network Method for Target Detection in Drone Images. Drones 2023, 7, 526. [Google Scholar] [CrossRef]
  21. Bai, C.; Zhang, K.; Jin, H.; Qian, P.; Zhai, R.; Lu, K. SFFEF-YOLO: Small object detection network based on fine-grained feature extraction and fusion for unmanned aerial images. Image Vis. Comput. 2025, 156, 105469. [Google Scholar] [CrossRef]
  22. Zhang, Z.; Yang, Y.; Jian, X. MASNet: A novel deep learning approach for enhanced detection of small targets in complex scenarios. Meas. Sci. Technol. 2025, 36, 045402. [Google Scholar] [CrossRef]
  23. Li, J.; Zheng, C.; Chen, P.; Zhang, J.; Wang, B. Small object detection in UAV imagery based on channel-spatial fusion cross attention. Signal Image Video Process. 2025, 19, 302. [Google Scholar] [CrossRef]
  24. Wang, F.; Wang, H.; Qin, Z.; Tang, J. UAV Target Detection Algorithm Based on Improved YOLOv8. IEEE Access 2023, 11, 116534–116544. [Google Scholar] [CrossRef]
  25. Zhao, Y.; Ju, Z.; Sun, T.; Dong, F.; Li, J.; Yang, R.; Fu, Q.; Lian, C.; Shan, P. TGC-YOLOv5: An Enhanced YOLOv5 Drone Detection Model Based on Transformer, GAM & CA Attention Mechanism. Drones 2023, 7, 446. [Google Scholar] [CrossRef]
  26. Hu, D.; Yu, M.; Wu, X.; Hu, J.; Sheng, Y.; Jiang, Y.; Huang, C.; Zheng, Y. DGW-YOLOv8: A small insulator target detection algorithm based on deformable attention backbone and WIoU loss function. IET Image Process. 2023, 18, 1096–1108. [Google Scholar] [CrossRef]
  27. Xiao, M.; Yang, B.; Wang, S.; Mo, F.; He, Y.; Gao, Y. GRA-Net: Global receptive attention network for surface defect detection. Knowl.-Based Syst. 2023, 280, 111066. [Google Scholar] [CrossRef]
  28. Qu, Y.; Wang, C.; Xiao, Y.; Yu, J.; Chen, X.; Kong, Y. Optimization Algorithm for Surface Defect Detection of Aircraft Engine Components Based on YOLOv5. Appl. Sci. 2023, 13, 11344. [Google Scholar] [CrossRef]
  29. Jiang, W.; Li, T.; Zhang, S.; Chen, W.; Yang, J. PCB defects target detection combining multi-scale and attention mechanism. Eng. Appl. Artif. Intell. 2023, 123, 106359. [Google Scholar] [CrossRef]
  30. Huang, Y.; Fan, J.; Hu, Y.; Guo, J.; Zhu, Y. TBi-YOLOv5: A surface defect detection model for crane wire with Bottleneck Transformer and small target detection layer. Proc. Inst. Mech. Eng. Part C J. Mech. Eng. Sci. 2023, 238, 2425–2438. [Google Scholar] [CrossRef]
  31. Zhang, H.; Liang, M.; Wang, Y. YOLO-BS: A traffic sign detection algorithm based on YOLOv8. Sci. Rep. 2025, 15, 7558. [Google Scholar] [CrossRef] [PubMed]
  32. Bai, Y.; Yu, J.; Yang, S.; Ning, J. An improved YOLO algorithm for detecting flowers and fruits on strawberry seedlings. Biosyst. Eng. 2024, 237, 1–12. [Google Scholar] [CrossRef]
  33. Lv, M.; Su, W.-H. YOLOV5-CBAM-C3TR: An optimized model based on transformer module and attention mechanism for apple leaf disease detection. Front. Plant Sci. 2024, 14, 1323301. [Google Scholar] [CrossRef]
  34. Zhao, Y.; Lv, W.; Xu, S.; Wei, J.; Wang, G.; Dang, Q.; Liu, Y.; Chen, J. DETRs Beat YOLOs on Real-time Object Detection. In Proceedings of the IEEE/CVF Conference on Computer Vision and Pattern Recognition (CVPR) 2024, Seattle, WA, USA, 16–22 June 2024; pp. 16965–16974. [Google Scholar]
  35. Khanam, R.; Hussain, M. YOLOv11: An Overview of the Key Architectural Enhancements. arXiv 2024, arXiv:2410.17725. [Google Scholar] [CrossRef]
  36. Ramachandran, P.; Zoph, B.; Le, Q.V. Swish: A Self-Gated Activation Function. arXiv 2017, arXiv:1710.05941. [Google Scholar] [CrossRef]
  37. He, K.; Zhang, X.; Ren, S.; Sun, J. Deep Residual Learning for Image Recognition. arXiv 2015, arXiv:1512.03385. [Google Scholar] [CrossRef]
  38. Kang, M.; Ting, C.-M.; Ting, F.F.; Phan, R.C.W. RCS-YOLO: A Fast and High-Accuracy Object Detector for Brain Tumor Detection. In Medical Image Computing and Computer Assisted Intervention—MICCAI 2023; Lecture Notes in Computer Science; Springer: Cham, Switzerland, 2023; pp. 600–610. [Google Scholar]
  39. Huo, X.; Sun, G.; Tian, S.; Wang, Y.; Yu, L.; Long, J.; Zhang, W.; Li, A. HiFuse: Hierarchical multi-scale feature fusion network for medical image classification. Biomed. Signal Process. Control 2024, 87, 105534. [Google Scholar] [CrossRef]
  40. Wang, J.; Xu, C.; Yang, W.; Yu, L. A Normalized Gaussian Wasserstein Distance for Tiny Object Detection. arXiv 2021, arXiv:2110.13389. [Google Scholar] [CrossRef]
Figure 1. The network architecture of yolov11.
Algorithms 19 00306 g001
Figure 2. The network architecture of RCS-HFPN-YOLOV11.
Algorithms 19 00306 g002
Figure 3. The architecture of the RCS Block.
Algorithms 19 00306 g003
Figure 4. The architecture of the RCSOSA Block.
Algorithms 19 00306 g004
Figure 5. The architecture of the HFPN Block.
Algorithms 19 00306 g005
Figure 6. IoU calculation method.
Algorithms 19 00306 g006
Figure 7. The performance comparison radar chart of each mainstream algorithm on the MS COCO dataset.
Algorithms 19 00306 g007
Figure 8. FPS-mAP@0.5 curve.
Algorithms 19 00306 g008
Figure 9. The mainstream algorithm F1 curve.
Algorithms 19 00306 g009
Figure 10. The mainstream algorithm PR curve.
Algorithms 19 00306 g010
Figure 11. The performance comparison radar chart of each mainstream algorithm on the PASCAL VOC dataset.
Algorithms 19 00306 g011
Figure 12. The performance comparison radar chart of each mainstream algorithm on the visdrone dataset.
Algorithms 19 00306 g012
Figure 13. Baseline model visualization diagram.
Algorithms 19 00306 g013
Figure 14. Our model visualization diagram.
Algorithms 19 00306 g014
Figure 15. Real-time monitoring effect of the mobile app.
Algorithms 19 00306 g015
Table 1. Comparison of average accuracy between the YOLOv11n model with fixed weights and the model with dynamic weighting scheme.
Loss Function Weight (λ)mAP@0.5mAP@0.5–0.95
λ = 00.4350.298
λ = 0.30.4370.302
λ = 0.50.4390.303
λ = 0.70.4390.303
λ = 10.4300.295
Ours0.4410.301
Table 2. The parameters of the hardware and software environment employed in the experiments.
Parameter SettingConfiguration
GPUNVIDIA GeForce RTX 4060Ti
CPUi5-13600kf
Host memory8 GB
Programming languagePython 3.9
Deep learning frameworksPytorch 2.0.1
Table 3. The key training parameters.
Key ParametersSetting
Epochs300
Batch size16
Initial learning rate0.001
Final learning rate0.0001
Momentum0.937
Weight decay0.0005
Table 4. Comparison of detection results of mainstream models and new models on the COCO dataset.
ModelF1mAP@0.5mAP@0.5–0.95APSAPmAPlParmFLOPSFPS
Yolov50.440.4240.2880.3010.4220.5262,215,7606.0 G189.4
Yolov80.440.4330.2940.3150.4380.5332,724,4487.1 G181
Yolov100.440.4350.2960.3130.4390.5512,762,6088.6 G134.7
Yolov11n0.440.435 ± 0.0010.2980.3220.4560.5312,624,0806.6 G158
Faster R-CNN0.360.3570.2470.2510.3190.4533,102,5659.5 G31
RT-DETR0.460.5150.330.4030.5120.63332,976,476108.3 G22
Yolov120.480.4410.2990.3390.4370.5512,590,8246.5 G103
Our model0.470.475 ± 0.0020.3280.3650.4730.5894,570,79618.7 G81
Note:  A P s , A P m , A P l denote average precision for small, medium, and large objects, respectively.
Table 5. Detection results of the proposed model on PASCAL-VOC dataset.
ModelF1mAP@0.5mAP@0.5–0.95ParmFLOPSFPS
Yolov50.590.5910.4112,185,5645.8 G205.4
Yolov80.590.5980.4332,688,2686.8 G200.6
Yolov100.590.6000.4422,702,2168.3 G165.4
Yolov110.600.6110.4492,586,0526.3 G171.9
RT-DETR0.650.6510.47132,976,476103.8 G48
Yolov120.600.6010.4362,560,6286.3 G126
Our model0.620.6380.4574,540,40018.6 G100.1
Table 6. Detection results of the proposed model on VisDrone2019.
ModelF1mAP@0.5mAP@0.5–0.95ParmFLOPSFPS
Yolov50.360.3190.1822,183,6145.8 G167.2
Yolov80.360.3220.1882,686,3186.8 G160.1
Yolov100.370.3340.1952,698,3168.2 G114.5
Yolov110.360.3230.1872,584,1026.3 G132
RT-DETR0.390.3610.20132,976,476108.1 G20
Yolov120.360.3250.1892,560,6286.3 G84
Our model0.380.3480.1973,126,47622.6 G61.7
Table 7. Results of the ablation experiments based on the MS COCO dataset.
ModelParmFLOPS/GFPSmAP@0.5mAP@0.5–0.95
Yolov11nRCSOSAHFPNNWD_CIoU
2,616,2486.61580.4350.298
3,461,34213.5100.60.4510.312
3,026,61610.1120.30.4490.309
2,625,5927.11540.4410.301
4,406,98118.1830.4690.324
3,546,20114.61000.4610.315
3,264,98312.31210.4570.313
4,570,79618.7810.4750.328
Disclaimer/Publisher’s Note: The statements, opinions and data contained in all publications are solely those of the individual author(s) and contributor(s) and not of MDPI and/or the editor(s). MDPI and/or the editor(s) disclaim responsibility for any injury to people or property resulting from any ideas, methods, instructions or products referred to in the content.