Abstract
Accurate fetal R-peak detection from low-SNR fetal electrocardiogram (FECG) signals remains a critical challenge as current NI-FECG methods struggle to extract high SNR FECG signals and conventional algorithms fail when signal quality deteriorates. We proposed a U-Net-based method that enables robust R-peak detection directly from low-SNR FECG signals (0–12 dB), bypassing the need for high-SNR inputs that are clinically difficult to acquire. The method was evaluated on both real (A&D FECG) and synthetic (FECGSYN) databases, comparing against ten state-of-the-art detectors. The proposed method significantly reduces false predictions compared to commonly used detection algorithms, achieving a PPV of 99.81%, an SEN of 100.00%, and an F1-score of 99.91% on the A&D FECG database and a PPV of 99.96%, an SEN of 99.93%, and an F1-score of 99.94% on the FECGSYN database. Further investigation of robustness in low-SNR conditions (0 dB, 5 dB, and 10 dB) achieved 87.38% F1-score at 0 dB SNR on real signals, surpassing the best-performing algorithm implemented in Neurokit by 13.58%. In addition, the algorithm showed ≤2.65% performance variation across tolerance windows (50 reduced to 20 ms), further underscoring its detection accuracy. Overall, this work reduces the reliance on high-SNR FECG signals by reliably extracting R-peaks from suboptimal signals, providing implications for the reliability of fetal heart rate variability analysis in real-world noisy environments.
1. Introduction
Fetal heart rate (FHR) and fetal heart rate variability (FHRV) are crucial indicators derived from fetal heart monitoring (FHM) that help predict potential complications or changes in fetal health, such as intrauterine growth restriction, fetal arrhythmia, and an increased risk of perinatal death [1,2]. Therefore, the ultimate goal of FHM is to accurately obtain FHR and FHRV, which relies on the precise detection of fetal R-peaks. Non-invasive fetal electrocardiography (NI-FECG) is a promising FHM technique that enables continuous and real-time monitoring by capturing fetal electrocardiographic signals from abdominal electrocardiograms (AECGs) [3]. The AECG signals obtained are a mixture of maternal electrocardiogram (MECG), fetal electrocardiogram (FECG), and various artifacts. The typical method for extracting FHR (and subsequently FHRV) from AECG involves estimating and removing the MECG, leaving a noisy FECG signals, to which existing peak detection algorithms (designed for adult) are used to detect the fetal R-peak locations.
Existing peak detection methods face significant limitations when applied to FECG signals due to inherent challenges in morphology, signal overlap, and noise sensitivity. Traditional QRS detection algorithms rely on morphological features such as amplitude, slope, and duration, but these struggle to adapt to fetal signals because of fundamental differences between fetal and adult ECG patterns. Additionally, distortions introduced during FECG extraction further obscure fetal R-peaks, reducing detection reliability. A major complicating factor is the spectral and temporal overlap between maternal and fetal ECG signals, making separation difficult. Since fetal R-peaks (≤60 μV) are much smaller in amplitude than maternal R-peaks (100–150 μV), they are easily masked within the composite signal [4]. Moreover, extracted FECG signals often exhibit a low SNR, exposing a critical weakness in conventional peak detection methods [5]. Techniques like the Pan–Tompkins Algorithm (PTA), which integrate squared signals over a moving window, are prone to misinterpreting high-frequency noise as QRS complexes, leading to false positives. Previous studies [6,7,8] used PTA to detect fetal R-peaks after removing MECG, but the detection accuracy decreased significantly when detecting low signal-to-noise ratio signals. These limitations underscore the need for more robust, fetal-specific detection approaches that account for morphological variability and improve noise resilience.
Agostinelli et al. [9] proposed an adjustment to the traditional PTA to better interpret FECG features. Specifically, their method modified the parameters of the traditional PTA to account for the differences in heart rate, QRS complex amplitude, and QRS duration between fetal and adult ECG signals. The modified algorithm incorporates a bandpass filter with a frequency range of 9–27 Hz, an 80 ms moving window, and an R-peak corrector algorithm, thereby enhancing the detection reliability of noisy FECG signals. However, as a modification of the traditional PTA, it does not leverage advanced signal processing or machine learning techniques. Consequently, its ability to learn complex patterns or dynamically adapt to changes in fetal ECG signals is limited. In contrast, the deep-learning-based method proposed in this research aims to address these limitations by proposing a robust deep-learning-based algorithm to effectively extract and learn meaningful features from noisy data (As another research direction, advanced denoising algorithms can be applied before peak detection. The state-of-art algorithms include a diffusion model [10], forward–backward dynamic mode decomposition (FBDMD) method [11], and retentive network [12]), rendering them more reliable for real-time monitoring applications.
The U-Net architecture was originally developed for 2D image segmentation tasks and has achieved remarkable success across various applications [13,14,15,16]. Unlike sequence modeling approaches (e.g., CNN-LSTMs or Transformers), U-Net’s encoder–decoder structure provides synergistic capabilities critical for fetal ECG analysis. First, the contracting path captures long-range context to distinguish fetal QRS complexes from noise. Second, the incorporation of skip connections mitigates overfitting, facilitating accurate segmentation of small objects even with limited training data [13]. In addition to its success in 2D tasks, this architecture has shown superior noise robustness in analogous 1D applications, achieving a 96.03% F1-score at <6 dB SNR in adult ECG [17] and reducing false-positive predictions by 10% versus E-D CNN without skip connections in Holter ECG signals [18,19]. Critically, U-Net’s inherent design enables effective training with limited annotated samples—a necessity in fetal ECG analysis where large-scale labeled datasets are scarce—while Transformer-based models typically require massive data volumes to achieve comparable performance due to their lack of spatial inductive biases and higher parameter complexity [20,21]. Therefore, the U-Net architecture is uniquely suited to our target of fetal R-peak detection in noise-dominated recordings.
In this work, motivated by these findings, we propose a novel deep-learning-based method that uses the U-Net architecture to accurately detect fetal R-peaks from low SNR FECG signals, thereby addressing the strong demand for extracting high SNR FECG signals and the limitations of PTA-based peak detection methods with FECG signals. The architecture of the proposed fetal R-peak detection method is adapted from the conventional 2D U-Net model to accommodate 1D time-series tasks. The Abdominal and Direct Fetal Electrocardiogram Database (A&D FECGDB) provides the gold standard direct FECG signals, which are treated as the FECG signals extracted by the NIFECG method in this study. In addition, the synthetic fetal ECG signals provided in the Fetal ECG Synthesis Database (FECGSYN) are also used. The robustness of the proposed algorithm is validated using both real recordings and synthetic recordings. The real recordings consist of three datasets with SNRs ranging from 0 to 10 dB, generated by introducing additional noise to the original A&D FECGDB. Additionally, synthetic fetal ECG signals from the Fetal ECG Synthesis Database (FECGSYN) are also utilized. In addition, the relationship between the choice of matching window size and performance deviation is investigated to assess the algorithm’s prediction accuracy. Ten existing peak detection methods are applied and compared with our proposed method to validate its robustness and efficacy.
The remainder of this paper is organized as follows. Section 2 provides a detailed description of the proposed U-Net-based method for fetal R-peak detection. Section 3 outlines the dataset utilized and the evaluation metrics applied and introduces ten existing peak detection methods for comparison. Section 4 offers a comprehensive evaluation of the performance of the proposed method, examining the impact of key thresholds on the performance and the noise robustness of the method. Section 5 compares the proposed method with ten existing peak detection methods and explores the impact of matching window size on the performance. A comprehensive analysis of the robustness and the predicted peak locations accuracy is performed. Finally, Section 6 presents the conclusions.
2. Methods
This section details the proposed U-Net-based fetal R-peak detection method, with the main three stages summarized in Figure 1.
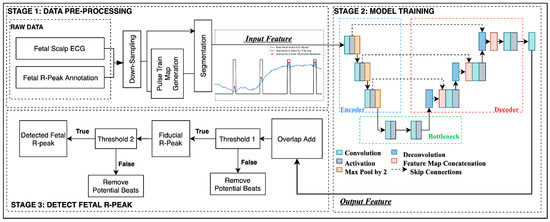
Figure 1.
The proposed three-step UNet-based fetal R-peak detection method.
2.1. Data Pre-Processing
This first stage processes and prepares both training and testing data for subsequent stages. First, the fetal ECG signal is downsampled to 250 Hz to mitigate heightened computational costs without substantial benefits. Lower sampling rates are considered sufficient for most clinical applications and are more practical in terms of data storage and processing requirements. Furthermore, Mohebbian et al. found that the effective field of view of units in CNN-based networks can be significantly increased by reducing the sampling rate [22].
The second step is to generate pulse train maps based on true peak annotations, where each pulse shares a uniform width and is centered on the R-peak position. Figure 2 provides an illustrative example of a raw fetal scalp ECG signal (blue) and the corresponding generated pulse train plot (black). The pulse train uses a label of one for each R-peak region, and zeros for other sample points. Chivers et al. reported that the average range of fetal QRS complex duration is between 54.72 ms (manual measurement) and 58.34 ms (algorithmic measurement). At a sampling frequency of 250 Hz, this range corresponds to 13.68 to 14.50 samples [23]. Therefore, a pulse width of 15 samples was chosen. This approach not only highlights the peak region but also helps to achieve data balance, thereby mitigating potential challenges related to label imbalance.
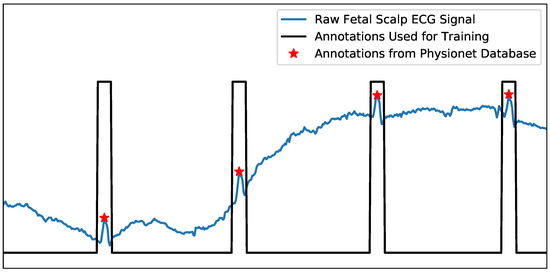
Figure 2.
An example of the raw fetal scalp ECG (direct FECG) signal (blue) and corresponding pulse train map that was generated from annotations for training (black). The red star represents the true R-peak annotation, corresponding to the center of each pulse.
The final step is segmentation, employing a fixed sliding window of 1000 samples (equivalent to four seconds at a frequency of 250 Hz), with a shift of 200 samples. Baseline fetal heart rate typically ranges from 110 to 160 beats per minute (bpm), with an observed decrease with advancing gestational age, resulting in higher heart rate in early pregnancy compared to later stages [24]. Therefore, the selected segment length of 1000 samples used in this study allows for encapsulating approximately 7–10 heartbeats. Furthermore, the chosen shifting length of 200 samples is selected to be short enough to enhance the ergodicity of model training while long enough to reduce training time and ensure ample new information is available in each segment to yield an effective model. The processed segments of fetal ECG data and corresponding pulse train maps were then used in subsequent training and testing stages.
2.2. Model Training
In the training stage, processed segments of fetal ECG data and corresponding pulse train maps from the training data set are used to generate a model for features of the fetal ECG signal. The architecture of the proposed U-Net neural network used is illustrated in Figure 1. The scalp ECG segments are initially fed into the U-Net through the encoding blocks. The output of the 1D-convolutional (1D-CNN) layer is preserved before proceeding through the max-pooling layer. Subsequently, decoding blocks are employed to facilitate the upsampling process via 1D deconvolution (transpose) convolutional layers. The output of the 1D transpose CNN layer is connected through skip connections with the output of the 1D-CNN layer, which was saved during the encoding stage. Finally, the output of the last activation function is directed to the last convolutional layer to generate a predicted pulse train using a sigmoid activation function.
Both the encoder blocks and decoder blocks are composed of three 1D-CNN layers. The bottleneck block consists of two 1D-CNN layers. The filter parameters and kernel size in the convolutional layer in the encoding block were {16, 16, 32} and {9, 9, 6}, respectively. Each convolutional layer is followed by a ReLU activation function. A max-pooling layer with a pool size of 2 is connected after each 1D-CNN layer to achieve dimensionality reduction. In the decoding block, the filter parameters and kernel sizes were {32, 16, 16} and {9, 9, 6} for the 1D-CNN layer and 1D-deconvolutional CNN layer, respectively. The stride of the deconvolution layer is set to 2.
The model values were randomly initialized before training. Training and model parameters, including learning rate, neurons per layer, activation function, batch size, and number of epochs, were evaluated in terms of their effect on model learning and accuracy and selected accordingly. Binary cross entropy was selected as the loss function used by the model. The Adam optimizer was used to minimize the loss between the predicted and the original pulse train map. The learning rate was set to 0.001, with a batch size of 64. Each model was trained for 400 epochs. Five-fold cross-validation was performed using four records as the training set and the remaining record as the test set.
2.3. Fetal R-Peak Detection
In the testing R-peak detection stage, constructed inputs from test signals are applied to the model constructed in the training stage. The output from the model then undergoes additional post-processing steps, aimed at identifying and eliminating false positives, thereby enhancing the accuracy of R-peak detection.
The output map segments are restored to a full length through an overlap-add process, and additional processing steps are executed to finalize the peak screening process. Firstly, a filtering criteria removes potential false-positive predictions where amplitudes of the output pulse train are weak and below the first threshold (). Currently, the threshold is set to a fixed value of 0.3. This means that predicted values below will be converted to 0, and the remaining values will be converted to 1.
The middle value of each pulse is then taken to generate a fiducial R-peak series, corresponding to predicted R-peak locations. Note that where a predicted pulse was found to have a width of one (compared to width of 15 samples associated with typical QRS-complex), that pulse is excluded, and no pulse is predicted in that location.
Finally, a second threshold () is applied to eliminate closely spaced potential beats. As specified in Section 2.1, fetal heart rates are typically within the range of 110–160 bpm [24]. A threshold of 81 sampling points is employed to filter out potential R-peaks that are too close to be deemed physically possible. When two beats are found to be closer than the defined threshold , the beat further from the midpoint of preceding and subsequent beats is selectively removed. The result is an output signal where each pulse corresponds to the location of a predicted R-peak within the original FECG signal.
3. Experimental Setup
3.1. Database for Training and Evaluation
Two public fetal ECG datasets accessed on PhysioNet [25] were employed to develop the pipeline and test existing methods, including the Abdominal Direct Fetal ECG Database (A&D FECGDB) [26] containing real data and the Fetal ECG Synthetic Database (FECGSYN DB) [27] containing synthetic data.
The original databases were further processed to generate extra training and test datasets with different signal-to-noise ratio (SNR) levels for robustness evaluation. Each dataset is processed according to the details described in Section 2.1.
3.1.1. A&D FECGDB
This database has been considered as gold standard and used as a benchmarking tool due to its inclusion of direct fetal ECG [28]. It contains five multi-lead fetal electrocardiogram (FECG) recordings obtained from five women at different gestational ages between 38 and 41 weeks. Each recording contains four differential signals acquired from the maternal abdomen and a reference direct fetal ECG recorded from the fetal head. These recordings were acquired by the Department of Obstetrics of the Medical University of Silesia using the KOMPOREL Fetal ECG Acquisition and Analysis System (ITAM Institute, Zabrze, Poland) and stored in EDF format. Each recording lasts five minutes and has a sampling rate of 1 kHz and a resolution of 16 bits, numbered as r01, r04, r07, r08, and r10. The provided annotation of the fetal R-wave locations was first automatically determined by the online analysis of the KOMPOREL system and then manually verified by a professional cardiologists. It can be accessed via https://www.physionet.org/content/adfecgdb/1.0.0/ [accessed on 28 July 2025].
To evaluate the noise robustness of our method, we generated calibrated datasets with controlled signal-to-noise ratios (SNRs) from the original A&D database (denoted as AD_origin). Since the native SNR of AD_origin is unspecified due to inherent noise contamination, we applied additive white Gaussian noise (AWGN) with SNR of 0 dB, 5 dB, and 10 dB to AD_origin to create three standardized dataset: AD_0, AD_5, and AD_10. Noise was added to the original signal to create the noisy signal , as given by Equation (1). The noise was generated according to a normal distribution with a mean of zero and a standard deviation determined by the desired signal-to-noise ratio (SNR) in decibels, where SNR is calculated as given by Equation (2).
3.1.2. FECGSYN DB
The synthetic NI-FECG signals provided are generated by the open-source FECGSYN toolbox, which synthesizes physiologically plausible fetal and maternal ECG signals by simulating the propagation dynamics of fetal and maternal ECG signals in the maternal abdomen. The simulator adopts a source mixing approach, treating each signal component (fetal ECG, maternal ECG, and noise) as an independent signal source to provide separable waveforms and accurate adult and fetal heartbeat annotations. The database simulates ten different pregnancies, each of which contains seven types of physiological events, including the following:
- Baseline: Abdominal mixture (no noise or events).
- Case 0: Baseline (no events) + noise.
- Case 1: Fetal movement + noise.
- Case 2: MHR/FHR acceleration/decelerations + noise.
- Case 3: Uterine contraction + noise.
- Case 4: Ectopic beats (for both fetus and mother) + noise.
- Case 5: Additional NI-FECG (twin pregnancy) + noise.
Each simulation had a duration of 5 min and was sampled at 250 Hz with a 16-bit resolution (WFDB MIT format) for a total of 34 channels (channels 1–32 are FECG channels, and channels 33–34 are maternal reference ECG channels). By superimposing multiple signal components, a noisy NI-FECG signal can be obtained to support the algorithm verification of this work.
This study extracted two event types: baseline (noise-free abdominal mixture) and Case 0 (baseline + additive noise). From these, four datasets were constructed—each comprising 50 records (10 subjects × 5 records)—with defined noise levels:
- SYN_origin: Pure baseline signals (no noise).
- SYN_6/SYN_9/SYN_12: Case 0 signals at SNR of 6 dB, 9 dB, and 12 dB, respectively.
The full database is publicly accessible at https://physionet.org/content/fecgsyndb/1.0.0/ [accessed on 28 July 2025].
3.2. Evaluation Metrics
In accordance with the ANSI/AAMI guideline [29], sensitivity (SEN), positive predictability value (PPV), and F1-score allow for the assessment of the presence of R-peaks within a tolerance window. Each of these metrics have been used to evaluate the performance of the proposed method.
PPV is a measure of accuracy, which shows the proportion of the algorithm’s predictions that correspond to the true annotations. SEN is a measure of completeness, which shows the proportion of the true annotations that were correctly detected by the algorithm F1-score is the harmonic average of PPV and SEN. In this study, a match window size of 50 milliseconds (ms) (see Figure 3) is applied to determine the true positives (TP), true negatives (TN), and false positives (FP), which is consistent with previous studies in the literature [30,31,32]. Each performance metric is then calculated according to Equations (3)–(5).
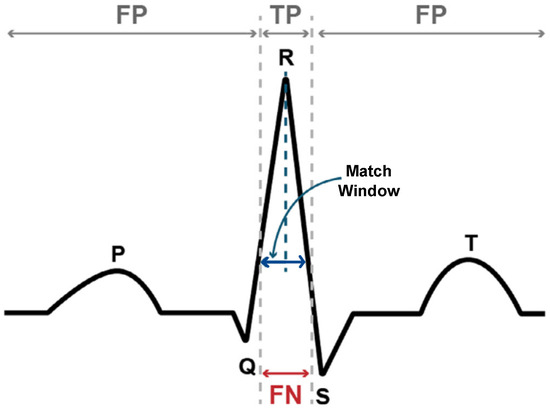
Figure 3.
Important annotations for the ECG waveform. Where the predicted peak is within the match window, it is considered a TP (true positive), while predictions outside this range are considered as FP (false positive). FN (false negative) indicates that the algorithm did not predict a peak within the match window of the true peak.
3.3. Existing Detection Approaches
To compare the performance with the proposed method in this work, 10 open-source pre-existing methods were applied to Datasets A&D FECGDB and FECGSYN DB, as summarized in Table 1. These approaches represented the available open-source methods from Python toolbox: Neurokit [33] and ECGPUWAVE (denoted PTA_E) [25] for R-peak extraction.

Table 1.
Summary of the ten existing detection methods compared in this study.
4. Evaluation Results of Proposed Method
This section states the evaluation results of the proposed method. We first analyzed whether the bias between SEN and PPV could be managed by using the post-processing threshold. Moreover, we evaluated the robustness on both datasets with different SNR conditions.
4.1. Effect of Threshold on Performance
The R-peak detection stage of the proposed method incorporates a tunable threshold, to filter out weak or false-positive predictions. This threshold acts as a critical decision boundary, directly controlling the TP, FP, and FN counts and influencing trade-off between SEN and PPV. To quantify this relationship and determine the optimal threshold value, we evaluated across a range of to in steps of on the eight datasets introduced in Section 3.1.
The results show that a higher threshold discards marginal predictions, thereby reducing the risk of FP but increasing the risk of FN. Lower thresholds retain weak predictions and classify them as R-peaks, resulting in admitting more FPs. Figure 4 clearly shows that PPV is positively correlated with , and SEN is negatively correlated with . The F1-score, as a compromise between PPV and SEN, peaked at = 0.3 across all SNRs, indicating that this threshold optimally balances PPV and SEN. Therefore, this work sets to 0.3 to prioritize clinical reliability by minimizing missed R-peaks (FN reduction), which is critical for applications such as heart rate monitoring and arrhythmia detection.
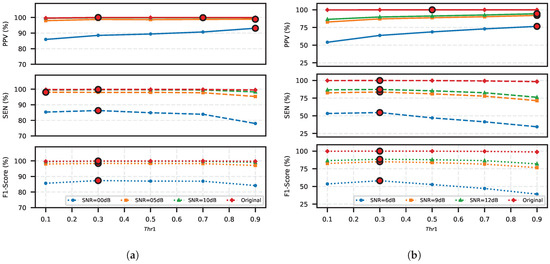
Figure 4.
Impact of post-processing threshold () on FECG detection performance: PPV, SEN, and F1-score optimization: (a) across SNR levels (0–10 dB) in the A&D FECG database and (b) across SNR levels (6–12 dB) in the FECGSYN database. The respective maximum values of the three metrics are highlighted for each case in red circles.
4.2. Robustness
4.2.1. Evaluation on Real Recordings
To evaluate the proposed method, we first performed 5-fold cross-validation on the origin of A&D FECG database and three derived datasets with varying noise levels: SNR 0 dB, 5 dB, and 10 dB. These datasets are denoted as AD_Origin, AD_0, AD_5, and AD_10, respectively. With the post-processing threshold fixed to = 0.3, the average performance metrics are summarized in Table 2. TP, FP, and FN, as well as PPV, SEN, and F1 scores for each test record are listed in Table 3.
Table 2.
PPV, SEN, and F1-score on A&D FECG database with different SNR conditions. Five-fold cross-validation is applied for each dataset.
Table 3.
Experimental results of the proposed U-Net across different SNRs. The results for the 0 dB case are highlighted in bold.
Our method achieves high detection accuracy on real recordings from the origin A&D FECG database, with a PPV of 100.00%, SEN of 99.84%, and an F1-score of 99.92%. The sole exception was record r10, where five FP predictions occurred in regions lacking both fetal ECG activity and expert annotations, likely due to electrode disconnection When subjected to extreme 0 dB noise conditions, the U-Net maintains robust detection capability, surpassing 97% F1-score in three of five test records (r01: 97.89%, r07: 99.68%, and r08: 98.85%). The performance degradation observed in records r04 and r10 under noisy conditions due to their characteristically challenging waveforms: these recordings already contained inherent high-amplitude noise prior to the addition of artificial noise, and the subsequent 0 dB SNR amplification further obscured the true R-peaks beyond typical detection thresholds, as evidenced by the morphological analysis in Figure 5.
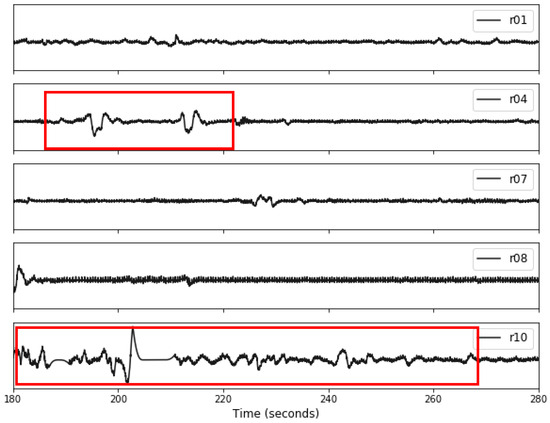
Figure 5.
An example illustrating a 10-s segment for each record in the original A&D FECG database. The red boxes highlight the amplitude fluctuations observed in records r04 and r10, which exhibit distinct differences compared to the other records.
The ability of our method to accurately predict the peak location and the role of the post-processing step on the method performance are demonstrated in Figure 6. The signal condition is significantly worse at 0 dB (left sub-figure) than 10 dB (right sub-figure), which leads to the generation of more weak pulse predictions that are corrupted by noise. The false weak pulses caused by noise are excluded from potential beats by applying , which helps to reduce the generation of FP predictions. However, it may also cause missed heartbeats (causing FNs), which are highlighted in blue boxes.
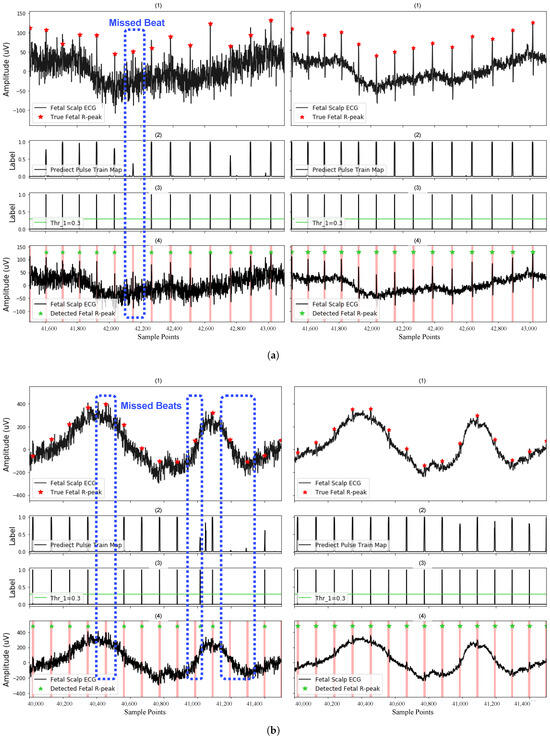
Figure 6.
Detection of the fetal R-peak on (a) recording r01 and (b) recording r04 with SNR of 0 dB (left case) and 10 dB (right case). Here, (1) shows the FECG segments used for testing; (2) shows the predictions of the model, indicating segments of potential fetal R-peak locations; (3) shows the remaining potential R-peak locations after filtering by the fixed threshold in post-processing; and (4) shows the final detected fetal R-peaks, label as green stars. Blue regions highlight missed beats. Red regions highlight TP predictions after post-processing.
4.2.2. Evaluation on Synthetic Recordings
To further evaluate the method’s robustness, we conducted experiments on synthetic data from the FECGSYN database, including the original dataset and three noise-corrupted versions with signal-to-noise ratios (SNRs) of 6 dB, 9 dB, and 12 dB (denoted as SYN_origin, SYN_6, SYN_9, and SYN_12, respectively). For each dataset, we performed 5-fold cross-validation with 40 records from two patients are used for training and 10 records from two additional patients for testing. With the post-processing threshold fixed at = 0.3, the average performance metrics of the U-Net model across different SNR levels are presented in Table 4. The proposed method demonstrates strong detection accuracy on SYN_origin, obtaining 99.96% PPV, 99.93% SEN, and 99.94% F1-score. It also maintains a score of over 85% on the SNR of 9dB and 12 dB conditions. However, performance degrades significantly under high noise conditions (6 dB SNR), with the average F1-score dropping to 58.12% across all 50 test records.
Table 4.
PPV, SEN, and F1-score on FECGSYN database with different SNR conditions. Five-fold cross-validation is applied for each database.
4.3. Runtime
The proposed model contains trainable parameters of 41,889, and the computational efficiency was evaluated on an NVIDIA Titan RTX (24 GB) GPU using FECG segments from the FECGSYN database. The average inference time per 4-s segment (1000 samples at 250 Hz) was 40.39 ± 11.06 ms. For continuous monitoring applications, processing one minute of ECG data required only 605.82 ms, which is equivalent to processing 1.7 min of FECG data processed per second. For future implementations, we will further explore its real-time deployment potential by applying Google’s TensorFlow Lite (TF Lite Micro) [42].
5. Comparative Assessment of Existing R-Peak Detection Methods
5.1. Performance Relative to Robustness
To further assess the performance of the proposed method, we now compare the proposed U-Net with ten existing detection methods in the literature, which are presented in Table 1 in Section 3.3. The evaluation uses the same datasets, including the original A&D FECG (AD_Origin) data and datasets with signal-to-noise ratio (SNR) levels of 0 dB and 10 dB (denoted as AD_0 and AD_10) and FECGSYN (SYN_Origin) data and datasets with SNR levels of 6 dB and 12 dB (SYN_6 and SYN_12). The same evaluation metrics are used: PPV, SEN, and F1-score, and a tolerance range of 50 ms is set. Figure 7a,b illustrate the performance of compared methods on the A&D FECG and FECGSYN databases, respectively. The results demonstrate the efficacy of the proposed method across datasets with varying SNR conditions.
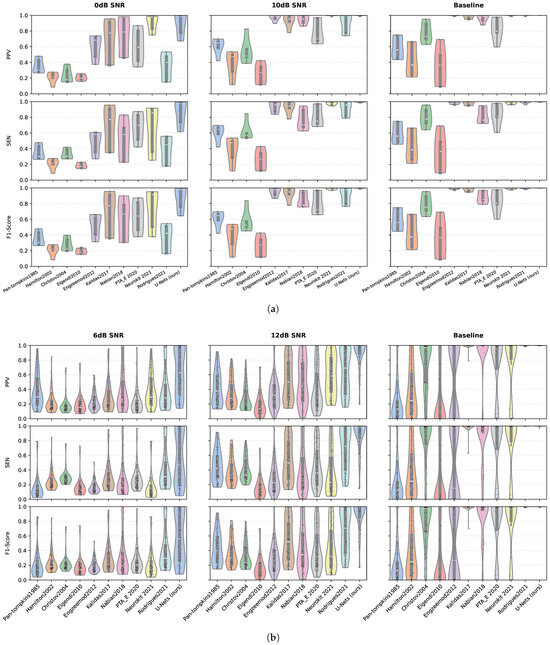
Figure 7.
Violin plots comparing the performance of the proposed U-Net architecture with ten established methods on the (a) A&D FECG and (b) FECGSYN databases. The distributions of PPV, SEN, and F1-scores are shown across different SNR conditions. In all subplots, each black dot represents a individual test result, with median values indicated by a thick white bar and interquartile ranges (IQR) denoted by light-gray boxes. All metrics are scaled uniformly from 0 to 1 to enable direct comparison.
For the A&D FECG database, under baseline conditions, the violin plot distribution of the U-Net(ours) across the three metrics is concentrated, with the median close to 1, indicating the highest overall performance. Neurokit2021, Rodrigues2021, Engzeemod2012, and Kalidas2017 are identified as comparable methods as their median values exceed 0.9, accompanied by narrow interquartile ranges (IQRs), indicating high detection accuracy. As the noise level increases, a general decline in performance is observed across all methods. When the SNR decreases to 0 dB, indicative of a high-noise environment, the distribution of the U-Net remains relatively compact, with the median close to 1, suggesting greater robustness to noise. However, the PPV, SEN, and F1-scores for half of the methods in the comparison experience significant drops, with the median falling below 0.5. Notably, only Neurokit2021 maintains a median exceeding 0.8 across the three metrics, although its performance exhibits considerable fluctuation, as evidenced by a wide IQR, indicating sensitivity to noise.
In the synthetic database, the superior performance of the U-Net and Rodrigues2021 under baseline conditions is evident, characterized by a high median and a narrow IQR. As with the A&D FECG database, the performance of all methods declines with increasing noise levels; however, U-Net consistently maintains the highest performance. Specifically, on the database with an SNR of 6 dB, the median F1-score for U-Net decreases to approximately 0.6, which is notably twice as high as the median scores of the other compared methods, all of which fall below 0.3. This significant difference underscores the robustness of the U-Net in challenging noise conditions compared to existing methods.
Under ideal conditions (10 dB and 12 dB SNR), U-Net’s F1-score approaches the theoretical upper limit of 1.0, with the distribution of prediction results being more concentrated. In contrast, traditional methods exhibit limited performance and significant fluctuations in extreme values, highlighting the advantages of the U-Net in achieving consistent and reliable r-peak detections. In low SNR scenarios (0 dB and 6 dB), U-Net shows a small IQR and a high median on both databases, indicating that it is more robust to both physiological noise (ADFECGDB) and synthetic noise (FECGSYN) than other existing methods.
Additionally, Table 5 provides a rigorous comparative analysis with explicit low-SNR evaluation. While existing methods achieve competitive F1-scores (>93%) on high-quality data, their performance degrades substantially under low-SNR conditions (36.18–73.80%). In contrast, our U-Net maintains robust detection accuracy (87.38–88.44% F1-score) without preprocessing, demonstrating 23.5–51.2% absolute improvement in challenging environments.
Table 5.
Comparative analysis of fetal R-peak detection methodologies with explicit low-SNR evaluation.
5.2. Performance Relative to Match Window Tolerance
This section systematically evaluates the influence of matching window tolerance on FECG peak detection accuracy across multiple methods. We examined three symmetric window widths centered on true R-peak annotations: ±25 ms (50 ms total), ±15 ms (30 ms), and ±10 ms (20 ms), corresponding to progressively stricter localization criteria. Building on Section 5.1, we analyzed the top three methods by F1-score from the A&D FECG (AD_origin) and FECGSYN (SYN_origin) databases. For broader relevance, we included PTA_E2020, a widely adopted approach based on the ECGPUWAVE peak detector, despite its suboptimal ranking.
Figure 8 reveals that PPV, SEN, and F1-score improve with wider windows. Figure 8a shows that Rodrigues2021 and PTA_E2020 exhibit significant performance degradation as windows narrow (e.g., 16.11–16.84% F1-score drop from 50 ms to 20 ms), reflecting inherent localization limitations. In contrast, our U-Net and Neurokit202 maintain stable metrics (±2.65% variation) across all window width. Notably, U-Net achieves superior performance (F1 = 83.79% at 20 ms and 0 dB), demonstrating superior detection accuracy and noise robustness. Figure 8b further highlights the exceptional accuracy of U-Net under tightened window width, reinforcing its efficacy in precise peak detection.
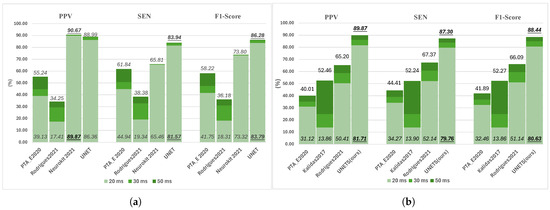
Figure 8.
Impact of matching window tolerance on fetal R-peak detection performance. Evaluation metrics are assessed across (a) the A&D FECGDB database (AD_0) and (b) FECGSYN database (SYN_12) at tolerances of 50 ms, 30 ms, and 20 ms. For each method, scores at 50 ms (top of bar) and 20 ms (bottom of bar) are explicitly labeled, with the highest-performing method highlighted in bold and underlined.
The matching window tolerance in R-peak detection affects the determination of TP. While most methods perform well over a wider tolerance range, U-Net’s consistent accuracy under tight windows makes it uniquely valuable in fetal HRV analysis and other applications that require precise peak localization.
6. Conclusions
This study presents a U-Net-based architecture for robust fetal R-peak detection in low-SNR FECG signals, addressing the critical limitation of conventional algorithms in noisy environments. The proposed method demonstrates high-performance metrics and exhibits excellent robustness by minimizing FP and FN across most recordings. Notably, impressive results are achieved on fetal ECG signals from the original A&D fetal ECG database, with a PPV of 100.00%, an SEN of 99.84%, and an F1-score of 99.92%. Similarly, on the original FECGSYN database, the method achieves a PPV of 99.96%, an SEN of 99.93%, and an F1-score of 99.94%.
The robustness of the U-Net model is further evaluated using real datasets with SNRs of 0 dB, 5 dB, and 10 dB, as well as synthetic datasets with SNRs of 6 dB, 9 dB, and 12 dB. Additionally, the performance of the proposed method is compared with ten existing peak detection methods, revealing that U-Net outperforms all of them even in low SNR scenarios (0 dB and 6 dB). Further analyzing the impact of matching window tolerance, U-Net’s consistent performance under tightened tolerances (20 ms) underscores its detection precision.
The proposed U-Net method effectively solves the problem of inaccurate detection of traditional peak detection algorithms in low SNR fetal electrocardiogram signals. Its strong robustness and high accuracy highlight its potential as a reliable solution for R-peak detection in low SNR fetal electrocardiogram signals.
Author Contributions
Methodology, validation, and original draft preparation, P.Z.; review and editing and supervision, S.S. and B.S. All authors have read and agreed to the published version of the manuscript.
Funding
This research received no external funding.
Data Availability Statement
The research data in this work are sourced from a public database provided by PhysioNet, available at https://physionet.org/about/database [accessed on 28 July 2025].
Acknowledgments
This article is a revised and expanded version of a paper entitled “Using U-Nets for Accurate R-Peak Detection in Fetal ECG Recordings” [45], which was presented at the Computer Science & Information Technology conference (2024).
Conflicts of Interest
The authors declare no conflicts of interest.
References
- Parer, J.T.; King, T.; Flanders, S.; Fox, M.; Kilpatrick, S. Fetal acidemia and electronic fetal heart rate patterns: Is there evidence of an association? J. Matern.-Fetal Neonatal Med. 2006, 19, 289–294. [Google Scholar] [CrossRef]
- Ugwumadu, A. Are we (mis) guided by current guidelines on intrapartum fetal heart rate monitoring? Case for a more physiological approach to interpretation. BJOG Int. J. Obstet. Gynaecol. 2014, 121, 1063–1070. [Google Scholar] [CrossRef]
- Clifford, G.D.; Silva, I.; Behar, J.; Moody, G.B. Non-invasive fetal ECG analysis. Physiol. Meas. 2014, 35, 1521–1536. [Google Scholar] [CrossRef]
- Agostinelli, A.; Grillo, M.; Biagini, A.; Giuliani, C.; Burattini, L.; Fioretti, S.; Di Nardo, F.; Giannubilo, S.R.; Ciavattini, A.; Burattini, L. Noninvasive fetal electrocardiography: An overview of the signal electrophysiological meaning, recording procedures, and processing techniques. Ann. Noninvasive Electrocardiol. 2015, 20, 303–313. [Google Scholar] [CrossRef] [PubMed]
- Fariha, M.; Ikeura, R.; Hayakawa, S.; Tsutsumi, S. Analysis of Pan-Tompkins algorithm performance with noisy ECG signals. J. Phys. Conf. Ser. 2020, 1532, 012022. [Google Scholar] [CrossRef]
- Matonia, A.; Jezewski, J.; Horoba, K.; Gacek, A.; Labaj, P. The maternal ECG suppression algorithm for efficient extraction of the fetal ECG from abdominal signal. In Proceedings of the 2006 International Conference of the IEEE Engineering in Medicine and Biology Society, New York, NY, USA, 30 August–3 September 2006; IEEE: Piscataway, NJ, USA, 2006; pp. 3106–3109. [Google Scholar] [CrossRef]
- Mirza, S.; Bhole, K.; Singh, P. Fetal ECG Extraction and QRS Detection using Independent Component Analysis. In Proceedings of the 2020 16th IEEE International Colloquium on Signal Processing & Its Applications (CSPA), Langkawi, Malaysia, 28–29 February 2020; pp. 157–161. [Google Scholar] [CrossRef]
- Sarafan, S.; Le, T.; Naderi, A.M.; Nguyen, Q.D.; Kuo, B.T.Y.; Ghirmai, T.; Han, H.D.; Lau, M.P.H.; Cao, H. Investigation of Methods to Extract Fetal Electrocardiogram from the Mother’s Abdominal Signal in Practical Scenarios. Technologies 2020, 8, 33. [Google Scholar] [CrossRef]
- Agostinelli, A.; Marcantoni, I.; Moretti, E.; Sbrollini, A.; Fioretti, S.; Di Nardo, F.; Burattini, L. Noninvasive fetal electrocardiography Part I: Pan-tompkins’ algorithm adaptation to fetal R-peak identification. Open Biomed. Eng. J. 2017, 11, 17–24. [Google Scholar] [CrossRef]
- Huang, X.; Li, C.; Liu, A.; Qian, R.; Chen, X. EEGDfus: A Conditional Diffusion Model for Fine-Grained EEG Denoising. IEEE J. Biomed. Health Inform. 2025, 29, 2557–2569. [Google Scholar] [CrossRef]
- Zhang, Y.; Jiang, L. Suppressing White-Noise Interference for Orbital Angular Momentum Waves via the Forward–Backward Dynamic Mode Decomposition. IEEE Trans. Antennas Propag. 2023, 71, 2879–2884. [Google Scholar] [CrossRef]
- Wang, B.; Deng, F.; Jiang, P. EEGDiR: Electroencephalogram denoising network for temporal information storage and global modeling through Retentive Network. Comput. Biol. Med. 2024, 177, 108626. [Google Scholar] [CrossRef]
- Ronneberger, O.; Fischer, P.; Brox, T. U-net: Convolutional networks for biomedical image segmentation. In Medical Image Computing and Computer-Assisted Intervention—MICCAI 2015, Proceedings of the 18th International Conference, Munich, Germany, 5–9 October 2015; Proceedings, Part III 18; Springer: Berlin/Heidelberg, Germany, 2015; pp. 234–241. [Google Scholar] [CrossRef]
- Yahyatabar, M.; Jouvet, P.; Cheriet, F. Dense-Unet: A light model for lung fields segmentation in Chest X-Ray images. In Proceedings of the 2020 42nd Annual International Conference of the IEEE Engineering in Medicine & Biology Society (EMBC), Montreal, QC, Canada, 20–24 July 2020; IEEE: Piscataway, NJ, USA, 2020; pp. 1242–1245. [Google Scholar] [CrossRef]
- Li, X.; Chen, H.; Qi, X.; Dou, Q.; Fu, C.W.; Heng, P.A. H-DenseUNet: Hybrid densely connected UNet for liver and tumor segmentation from CT volumes. IEEE Trans. Med. Imaging 2018, 37, 2663–2674. [Google Scholar] [CrossRef]
- Dolz, J.; Desrosiers, C.; Ben Ayed, I. IVD-Net: Intervertebral disc localization and segmentation in MRI with a multi-modal UNet. In Proceedings of the International Workshop and Challenge on Computational Methods and Clinical Applications for Spine Imaging, Granada, Spain, 16 September 2018; Springer: Berlin/Heidelberg, Germany, 2018; pp. 130–143. [Google Scholar] [CrossRef]
- Vijayarangan, S.; R., V.; Murugesan, B.; S.P., P.; Joseph, J.; Sivaprakasam, M. RPnet: A Deep Learning approach for robust R Peak detection in noisy ECG. In Proceedings of the 2020 42nd Annual International Conference of the IEEE Engineering in Medicine & Biology Society (EMBC), Montreal, QC, Canada, 20–24 July; 2020; pp. 345–348. [Google Scholar] [CrossRef]
- Mai, Y.; Chen, Z.; Yu, B.; Li, Y.; Pang, Z.; Han, Z. Non-Contact Heartbeat Detection Based on Ballistocardiogram Using UNet and Bidirectional Long Short-Term Memory. IEEE J. Biomed. Health Inform. 2022, 26, 3720–3730. [Google Scholar] [CrossRef]
- Zahid, M.U.; Kiranyaz, S.; Ince, T.; Devecioglu, O.C.; Chowdhury, M.E.H.; Khandakar, A.; Tahir, A.; Gabbouj, M. Robust R-Peak Detection in Low-Quality Holter ECGs Using 1D Convolutional Neural Network. IEEE Trans. Biomed. Eng. 2022, 69, 119–128. [Google Scholar] [CrossRef]
- Xu, P.; Zhu, X.; Clifton, D.A. Multimodal learning with transformers: A survey. IEEE Trans. Pattern Anal. Mach. Intell. 2023, 45, 12113–12132. [Google Scholar] [CrossRef]
- Zhang, H.; Qiu, D.; Feng, Y.; Liu, J. Improved U-Net models and its applications in medical image segmentation: A review. Laser Optoelectron. Prog. 2022, 59, 0200005. [Google Scholar] [CrossRef]
- Mohebbian, M.R.; Vedaei, S.S.; Wahid, K.A.; Dinh, A.; Marateb, H.R.; Tavakolian, K. Fetal ECG Extraction From Maternal ECG Using Attention-Based CycleGAN. IEEE J. Biomed. Health Inform. 2022, 26, 515–526. [Google Scholar] [CrossRef] [PubMed]
- Chivers, S.; Vasavan, T.; Nandi, M.; Hayes-Gill, B.; Jayawardane, I.; Simpson, J.; Williamson, C.; Fifer, W.; Lucchini, M. Measurement of the cardiac time intervals of the fetal ECG utilising a computerised algorithm: A retrospective observational study. JRSM Cardiovasc. Dis. 2022, 11, 20480040221096209. [Google Scholar] [CrossRef]
- Sameni, R.; Clifford, G.D. A Review of Fetal ECG Signal Processing; Issues and Promising Directions. Open Pacing Electrophysiol. Ther. J. 2010, 3, 4–20. [Google Scholar] [CrossRef] [PubMed]
- Goldberger, A.L.; Amaral, L.A.; Glass, L.; Hausdorff, J.M.; Ivanov, P.C.; Mark, R.G.; Mietus, J.E.; Moody, G.B.; Peng, C.K.; Stanley, H.E. PhysioBank, PhysioToolkit, and PhysioNet: Components of a new research resource for complex physiologic signals. Circulation 2000, 101, 215–220. [Google Scholar] [CrossRef] [PubMed]
- Jezewski, J.; Matonia, A.; Kupka, T.; Roj, D.; Czabanski, R. Determination of fetal heart rate from abdominal signals: Evaluation of beat-to-beat accuracy in relation to the direct fetal electrocardiogram. Biomed. Tech. Eng. 2012, 57, 383–394. [Google Scholar] [CrossRef]
- Andreotti, F.; Behar, J.; Zaunseder, S.; Oster, J.; Clifford, G.D. An open-source framework for stress-testing non-invasive foetal ECG extraction algorithms. Physiol. Meas. 2016, 37, 627. [Google Scholar] [CrossRef]
- Kotas, M.; Jezewski, J.; Matonia, A.; Kupka, T. Towards noise immune detection of fetal QRS complexes. Comput. Methods Programs Biomed. 2009, 97, 241–256. [Google Scholar] [CrossRef]
- American National Standards Institute (ANSI) and Association for the Advancement of Medical Instrumentation (AAMI). Testing and reporting performance results of cardiac rhythm and ST segment measurement algorithms. In ANSI/AAMI EC38:1998 (Cardiac Monitors, Heart Rate Meters, and Alarms); Association for the Advancement of Medical Instrumentation: Arlington, VA, USA, 1998. [Google Scholar]
- Peters, C.; Vullings, R.; Rooijakkers, M.; Bergmans, J.; Oei, S.; Wijn, P. A continuous wavelet transform-based method for time-frequency analysis of artefact-corrected heart rate variability data. Physiol. Meas. 2011, 32, 1517. [Google Scholar] [CrossRef]
- Behar, J.; Andreotti, F.; Zaunseder, S.; Oster, J.; Clifford, G.D. A practical guide to non-invasive foetal electrocardiogram extraction and analysis. Physiol. Meas. 2016, 37, R1. [Google Scholar] [CrossRef]
- Jagannath, D.; Selvakumar, A.I. Issues and research on foetal electrocardiogram signal elicitation. Biomed. Signal Process. Control 2014, 10, 224–244. [Google Scholar] [CrossRef]
- Makowski, D.; Pham, T.; Lau, Z.J.; Brammer, J.C.; Lespinasse, F.; Pham, H.; Schölzel, C.; Chen, S.A. NeuroKit2: A Python toolbox for neurophysiological signal processing. Behav. Res. Methods 2021, 53, 1689–1696. [Google Scholar] [CrossRef] [PubMed]
- Pan, J.; Tompkins, W.J. A real-time QRS detection algorithm. IEEE Trans. Biomed. Eng. 1985, 3, 230–236. [Google Scholar] [CrossRef] [PubMed]
- Hamilton, P. Open source ECG analysis. In Computers in Cardiology; IEEE: Piscataway, NJ, USA, 2002; pp. 101–104. [Google Scholar] [CrossRef]
- Christov, I.I. Real time electrocardiogram QRS detection using combined adaptive threshold. Biomed. Eng. Online 2004, 3, 1–9. [Google Scholar] [CrossRef]
- Lourenço, A.; Silva, H.; Leite, P.; Lourenço, R.; Fred, A. Real time electrocardiogram segmentation for finger based ECG biometrics. In Proceedings of the International Conference on Bio-inspired Systems and Signal Processing, Algarve, Portugal, 1–4 February 2012; SciTePress: Setúbal, Portugal, 2012; Volume 2, pp. 49–54. [Google Scholar] [CrossRef]
- Kalidas, V.; Tamil, L. Real-time QRS detector using stationary wavelet transform for automated ECG analysis. In Proceedings of the 2017 IEEE 17th International Conference on Bioinformatics and Bioengineering (BIBE), Washington, DC, USA, 23–25 October 2017; IEEE: Piscataway, NJ, USA, 2017; pp. 457–461. [Google Scholar] [CrossRef]
- Nabian, M.; Yin, Y.; Wormwood, J.; Quigley, K.S.; Barrett, L.F.; Ostadabbas, S. An open-source feature extraction tool for the analysis of peripheral physiological data. IEEE J. Transl. Eng. Health Med. 2018, 6, 2800711. [Google Scholar] [CrossRef]
- Elgendi, M.; Jonkman, M.; De Boer, F. Frequency Bands Effects on QRS Detection. Biosignals 2010, 2003, 2002. [Google Scholar] [CrossRef]
- Rodrigues, T.; Samoutphonh, S.; Silva, H.; Fred, A. A low-complexity r-peak detection algorithm with adaptive thresholding for wearable devices. In Proceedings of the 2020 25th International Conference on Pattern Recognition (ICPR), Milan, Italy, 10–15 January 2021; IEEE: Piscataway, NJ, USA, 2021; pp. 1–8. [Google Scholar] [CrossRef]
- David, R.; Duke, J.; Jain, A.; Janapa Reddi, V.; Jeffries, N.; Li, J.; Kreeger, N.; Nappier, I.; Natraj, M.; Wang, T.; et al. Tensorflow lite micro: Embedded machine learning for tinyml systems. Proc. Mach. Learn. Syst. 2021, 3, 800–811. [Google Scholar]
- Lampros, T.; Kalafatakis, K.; Giannakeas, N.; Tsipouras, M.G.; Glavas, E.; Tzallas, A.T. An optimized hybrid methodology for non-invasive fetal electrocardiogram signal extraction and monitoring. Array 2023, 19, 100302. [Google Scholar] [CrossRef]
- Qiao, L.; Hu, S.; Xiao, B.; Bi, X.; Li, W.; Gao, X. A Dual Self-Calibrating Framework for Noninvasive Fetal ECG R-Peak Detection. IEEE Internet Things J. 2023, 10, 16579–16593. [Google Scholar] [CrossRef]
- Zhou, P.; So, S.; Schwerin, B. Using U-Nets for Accurate R-Peak Detection in Fetal ECG Recordings. In Proceedings of the Computer Science & Information Technology Conference Proceedings, Dubai, United Arab Emirates, 28–29 December 2024; Volume 14. [Google Scholar] [CrossRef]
Disclaimer/Publisher’s Note: The statements, opinions and data contained in all publications are solely those of the individual author(s) and contributor(s) and not of MDPI and/or the editor(s). MDPI and/or the editor(s) disclaim responsibility for any injury to people or property resulting from any ideas, methods, instructions or products referred to in the content. |
© 2025 by the authors. Licensee MDPI, Basel, Switzerland. This article is an open access article distributed under the terms and conditions of the Creative Commons Attribution (CC BY) license (https://creativecommons.org/licenses/by/4.0/).