Article

Examining the Neurophysiology of Attentional Habituation to Repeated Presentations of Food and Non-Food Visual Stimuli

by
Aruna Duraisingam
,
Daniele Soria
* and
Ramaswamy Palaniappan
Artificial Intelligence and Data Analytics Research Group, School of Computing, University of Kent, Canterbury CT2 7NZ, UK
*
Author to whom correspondence should be addressed.
Algorithms 2025, 18(8), 525; https://doi.org/10.3390/a18080525
Submission received: 22 May 2025 / Revised: 7 August 2025 / Accepted: 13 August 2025 / Published: 18 August 2025
(This article belongs to the Special Issue Advancements in Signal Processing and Machine Learning for Healthcare)

Abstract

Existing research shows that the human salivary response habituates to repeated presentation of visual, olfactory, or gustatory food cues in adults and children. The aim of this research is to examine the neurophysiological effects of attentional habituation within sessions toward repetition of the same high- and low-calorie food and non-food images. Participants’ event-related potential (ERP) responses were measured as they passively viewed the same food and non-food images repeatedly. The ERP analysis results from trial groups within a session over time indicated that repeated exposure to the same image has a distinct effect on the brain’s attentional responses to food and non-food images. The brain response modulated by motivation and attention decreases over time, and it is significant in the 170–300 ms onset time window for low-calorie images and 180–330 ms onset time window for non-food images in the parietal region of the brain. However, the modulation to high-calorie images remains sustained over time within the session. Furthermore, the ERP results show that high-calorie images have a slower rate of declination than low-calorie images, followed by non-food images. In conclusion, our ERP study showed that a habituation-like mechanism modulates attention to repeated low-calorie and non-food images, whereas high-calorie images have a negligible effect. High-energy foods have a larger reward value, which increases prolonged attention and reduces the process of habituation. This could be one of the reasons why a negligible neural attentional habituation and slow habituation rate to high-calorie diets could have negative health consequences.

1. Introduction

Eating involves repeated exposure to visual, olfactory, and gustatory cues, which can lead to habituation, a process where repeated presentations of a stimulus result in a reduction in neural or behavioural responses [1]. This phenomenon has been observed across physiological and behavioural systems, including reductions in salivation, facial muscle activity, and motivated behaviour, particularly in the context of food [2,3]. Both children and adults have been shown to habituate to repeated food cues, including visual stimuli, and exhibit dishabituation when novel cues are introduced [4,5].
Importantly, while habituation plays a role in the modulation of feeding behaviour, it is only one part of a complex regulatory system that includes hedonic drives, cognitive control, and metabolic needs. Research has shown that individuals with obesity may display slower habituation to food cues, which could contribute to prolonged eating episodes [6,7]. Additionally, greater dietary variety has been associated with increased energy intake and reduced habituation, suggesting that the diversity of food-related stimuli may influence motivational dynamics [8,9]. Understanding these attentional and motivational processes is therefore essential, not as standalone explanations for overeating, but as contributing mechanisms within broader behavioural frameworks.
Event-related potentials (ERPs) provide a temporally precise method for investigating how food-related cues influence attention and motivation. Among ERP components, the P200 (P2), occurring approximately 150–250 ms after stimulus onset, reflects early attentional capture, especially when stimuli are motivationally relevant [10,11,12]. Later components, including the P300 and late positive potential (LPP), emerging in the 300–600 ms range, have been associated with sustained evaluative and affective processing of emotionally salient stimuli. High-calorie food images have been found to elicit enhanced amplitudes across these ERP components relative to low-calorie or non-food stimuli, suggesting heightened attentional and reward-related engagement [13,14]. These neural markers collectively support the utility of ERPs in tracking how repeated visual exposure to food cues modulates attention and motivation over time.
Neural adaptation to repeated stimuli is a well-documented phenomenon, reflected in both behavioural and electrophysiological changes. For example, object and face recognition studies have shown that repeated presentations lead to faster reaction times and improved accuracy [15,16], paralleled by changes in early visual evoked potentials (VEPs) around 150–200 ms post-stimulus [17,18]. These findings suggest that the brain reallocates attentional resources as stimuli become more familiar. In the context of food images, however, this adaptation may be modulated by the caloric and motivational salience of the stimuli, particularly for high-calorie foods, which may continue to elicit strong neural engagement even after repeated exposure.
Previous ERP research supports the idea that energy-dense food cues elicit more robust and persistent neural responses compared to neutral or low-calorie stimuli. For instance, the late positive potential (LPP), often associated with motivational relevance, tends to remain elevated for high-calorie foods [12]. Additionally, the P200 component has been highlighted as a marker of automatic attentional capture by food-related cues, especially in occipito-parietal regions [13], with its amplitude modulated by stimulus familiarity and the individual’s motivational state [14]. These findings underscore the utility of ERP measures in disentangling how attentional and motivational processes evolve during repeated exposure to food stimuli, offering a more nuanced perspective on stimulus-driven engagement beyond simple habituation.
One key insight from food-related habituation research is that eating behaviour can persist even in the absence of energy deficits, suggesting that cognitive and motivational processes contribute alongside metabolic signals. As such, examining habituation to food stimuli with varying energy values provides a window into attentional and motivational mechanisms that may influence eating behaviour [2,3,5]. Traditional measures of food habituation, such as salivary flow, facial muscle activity, and reinforcement paradigms, offer useful evidence but are often impractical in experimental or clinical settings due to their complexity, cost, or invasiveness. This study addresses this gap by using ERPs as a non-invasive, temporally sensitive tool to explore how neural responses to repeated food cues evolve within a controlled session.
While prior research has shown that high-calorie foods elicit stronger neural responses compared to low-calorie and non-food images [19], the present study extends this work by examining how these neural signals change over repeated exposures. The primary aim is to determine whether attention- and motivation-related ERP responses differ between high-calorie, low-calorie, and non-food images during repeated presentation. We hypothesise that food images will evoke stronger neural engagement than non-food stimuli and that high-calorie foods will maintain this engagement over time, reflecting resistance to habituation. A secondary aim is to assess whether habituation rates differ across stimulus categories, particularly whether high-calorie food cues show slower ERP amplitude reductions relative to low-calorie and non-food images. By capturing within-session changes, this study seeks to clarify how caloric value and motivational salience interact with attentional processes during repeated visual exposure.

2. Methodology

2.1. Participants

Twenty-six volunteers (thirteen males and thirteen females) were recruited via university mailing lists and noticeboards, aged 18 to 48 years (mean = 31.38 ± 7.83). Participants’ liking for apple and pizza was assessed using a six-point Likert scale (0 being not at all and five being like extremely), where 0 to 2 was negative and 3 to 5 was positive. Those scoring three or more for both apple and pizza were included in the experiment (apple liking: mean = 5.01 ± 0.74; pizza liking: mean = 5.41 ± 0.79). The six-point Likert scale was used based on Leung’s recommendation for normal distributions [20]. Participants with neurological or eating disorders or those on medications affecting their mental state were excluded.
This initial study investigates habituation to single visual stimuli, focusing on pizza as a high-calorie food, apple as a low-calorie food, and a hammer as a non-food. While not generalisable to the entire population, the selection was based on those who enjoy pizza and apples, aligning with a YouGov survey indicating these as popular foods globally [21]. The BMI of participants ranged from 17.21 to 39.15 kg/m2 (mean = 25.9 ± 5.0), with 14 participants (6 males and 8 females) being overweight or obese. The experiment was voluntary, with no compensation provided. Due to noisy data, two obese participants’ data (one male and one female) were excluded, resulting in twenty-four participants’ data being used for EEG analysis. This study was approved by the University of Kent’s Faculty of Sciences Research Ethics Committee (ethics approval reference: 0471920), and all participants gave written informed consent.

2.2. Experimental Design and Procedure

Participants passively viewed three distinct images presented on a monitor positioned one meter away: a pizza (high-calorie food), an apple (low-calorie food), and a hammer (non-food control). These images were selected from the validated Food-Pics database [22], which provides high-resolution images standardised for visual properties. The food items were chosen based on common perceptions of energy content and participant preference, which was pre-screened to ensure emotional and neural engagement.
Each participant completed nine sessions in a single day, three sessions for each image type (apple, pizza, or hammer). In each session, the same image was shown 30 times, totalling 90 trials per category and 270 trials overall. The sessions were randomised to control for sequence effects. Each image appeared for 4 s, followed by a 2 s inter-stimulus interval, resulting in a consistent 6 s trial duration. EEG data were time-locked to the onset of each image and analysed during the 4 s viewing window, allowing for assessment of within-session habituation. Each session lasted approximately 3 min, with short breaks of 3 to 5 min between sessions to reduce fatigue and maintain attentiveness. The full experimental procedure, including EEG setup and rest periods, was completed in about 90 min. At the start and end of each session, participants completed the Craving Experience Questionnaire (CEQ) [23] to track any shifts in subjective food cravings. While these subjective ratings offered insights into craving, no significant patterns were found across sessions or image types, so CEQ results were not included in the final analysis.
Before starting the experiment, participants gave informed consent and completed a screening questionnaire to determine eligibility. To standardise hunger levels, they were instructed to eat a substantial breakfast and fast for at least three hours prior to the noon testing sessions [24]. Upon arrival, they completed the Dutch Eating Behaviour Questionnaire (DEBQ) [25] to assess emotional, external, and restrained eating styles. While eating style data were collected to support potential within-group analysis, they are not the focus of this paper. Following questionnaire completion, participants were fitted with EEG electrodes. The visual stimuli were presented using the Psychtoolbox (v3.0.16) and participants were offered a brief test trial if requested. EEG signals were recorded continuously during all sessions, enabling within-session analysis of habituation by tracking changes in ERP amplitudes over repeated exposures to each stimulus type. A schematic of the paradigm is provided in Figure 1.

2.3. EEG Data Acquisition and Pre-Processing

Neuroelectric’s StarStim 32 electrode device, following the 10-10 system placement, recorded the data for this study. The EEG data was sampled at a rate of 500 Hz. Reference and ground were established using two electrodes, Common Mode Sense (CMS) and Driven Right Leg (DRL), collected via an ear clip. Data analysis was conducted using Matlab (R2023a) along with its plugins, EEGLAB (v2023.1) and Fieldtrip (v20231220). The EEG data underwent pre-processing, including high-pass filtering at 0.5 Hz (−6 dB cutoff, Hamming windowed sinc FIR filter) and baseline correction was then applied using the −200 ms to 0 ms pre-stimulus interval as the baseline period to ensure the removal of any residual low-frequency drift. Then, low-pass filtering was applied at 30 Hz using the EEGLAB FIR filter. Bad channels were identified and interpolated. Independent component analysis (ICA) decomposed the cleaned data, with artefact rejection performed using IClabel in EEGLAB. Components associated with eye, heart, and line noise and channel noise, with a probabilistic score higher than 75%, were rejected. Then, the data were epoched with a period of −200 ms and a post-stimulus period of 1000 ms for further analysis.
After removing artefacts from the EEG data, ERP responses were extracted for each trial using MATLAB. Each participant completed nine sessions (three per image type: apple, pizza, and hammer), with each session comprising 30 trials of a single repeated image. To assess within-session habituation, trials from each session were grouped into five consecutive trial groups of six trials each, trial group 1 (trials 1–6), trial group 2 (trials 7–12), and so on, based on their temporal order. These trial groups were averaged and used for statistical analysis via cluster-based permutation testing to evaluate changes in ERP amplitudes over time. Figure 2 illustrates this trial grouping schema, which captures the increasing exposure across the session and enables detection of habituation patterns by comparing ERP trends across the five groups. This method ensured systematic tracking of neural adaptation to repeated visual stimuli.

2.4. Statistical Assessment

The main effects and interactions of ERP responses to three images during the first 1000 ms after the cue onset (beginning of visual stimuli presentation) were examined across various time windows and regions of interest (ROIs), including the parietal (P7, P3, Pz, P4, and P8), frontal (Fp1, Fp2, F7, F3, Fz, F4, and F8), central (C3, Cz, and C4), temporal (T7 and T8), and occipital (O1, Oz, and O2) regions. ROI selection was based on previous research identifying these areas as relevant to the visual, attentional, and motivational salience of food cues [26,27]. Each image category (apple, pizza, and hammer) was presented in 30 trials, which were grouped sequentially into five blocks of six trials, as mentioned in the previous section. ERP responses were averaged within each block for each participant, and these block-wise averages were used in the statistical analysis. This ensured that the repeated-measures structure of the data was maintained and that observations remained nested within participants.
To ensure robust statistical inference while accounting for the complexity of EEG data and repeated measures, we used a non-parametric, cluster-based permutation test (CBPT). Although the CBPT does not completely eliminate pseudoreplication, it effectively handles the non-independence typical in EEG by identifying clusters of significant activity across time and electrodes [28]. In our study, each participant’s trials were first grouped into five sequential trial blocks and averaged at the individual level. These subject-level averages were then entered into a within-subject CBPT, preserving the repeated-measures structure and avoiding pseudoreplication [29]. This approach allowed us to assess within-session habituation across different image types without making strong assumptions about data distribution or predefined regions of interest, making it particularly well-suited for capturing ERP habituation dynamics.
The analysis was performed using EEGLAB and FieldTrip, following FieldTrip guidelines [30] and prior research [28,31,32]. The ft_statfun_depsamplesregrT function computed regression-based t-statistics, identifying spatiotemporal clusters whose summed t-values were compared against a null distribution from 1000 Monte Carlo permutations. Clusters exceeding the 2.5th or 97.5th percentile (two-tailed p < 0.05 ) were deemed significant. To identify habituation effects, a linear decrease in ERP amplitude across trial groups (trial group 1 > trial group 2 > trial group 3 > trial group 4 > trial group 5) was modelled. The analysis preserved the nested structure of the data, ensuring the within-subject design was maintained and avoiding the misinterpretation of repeated measures as independent observations.

3. Results

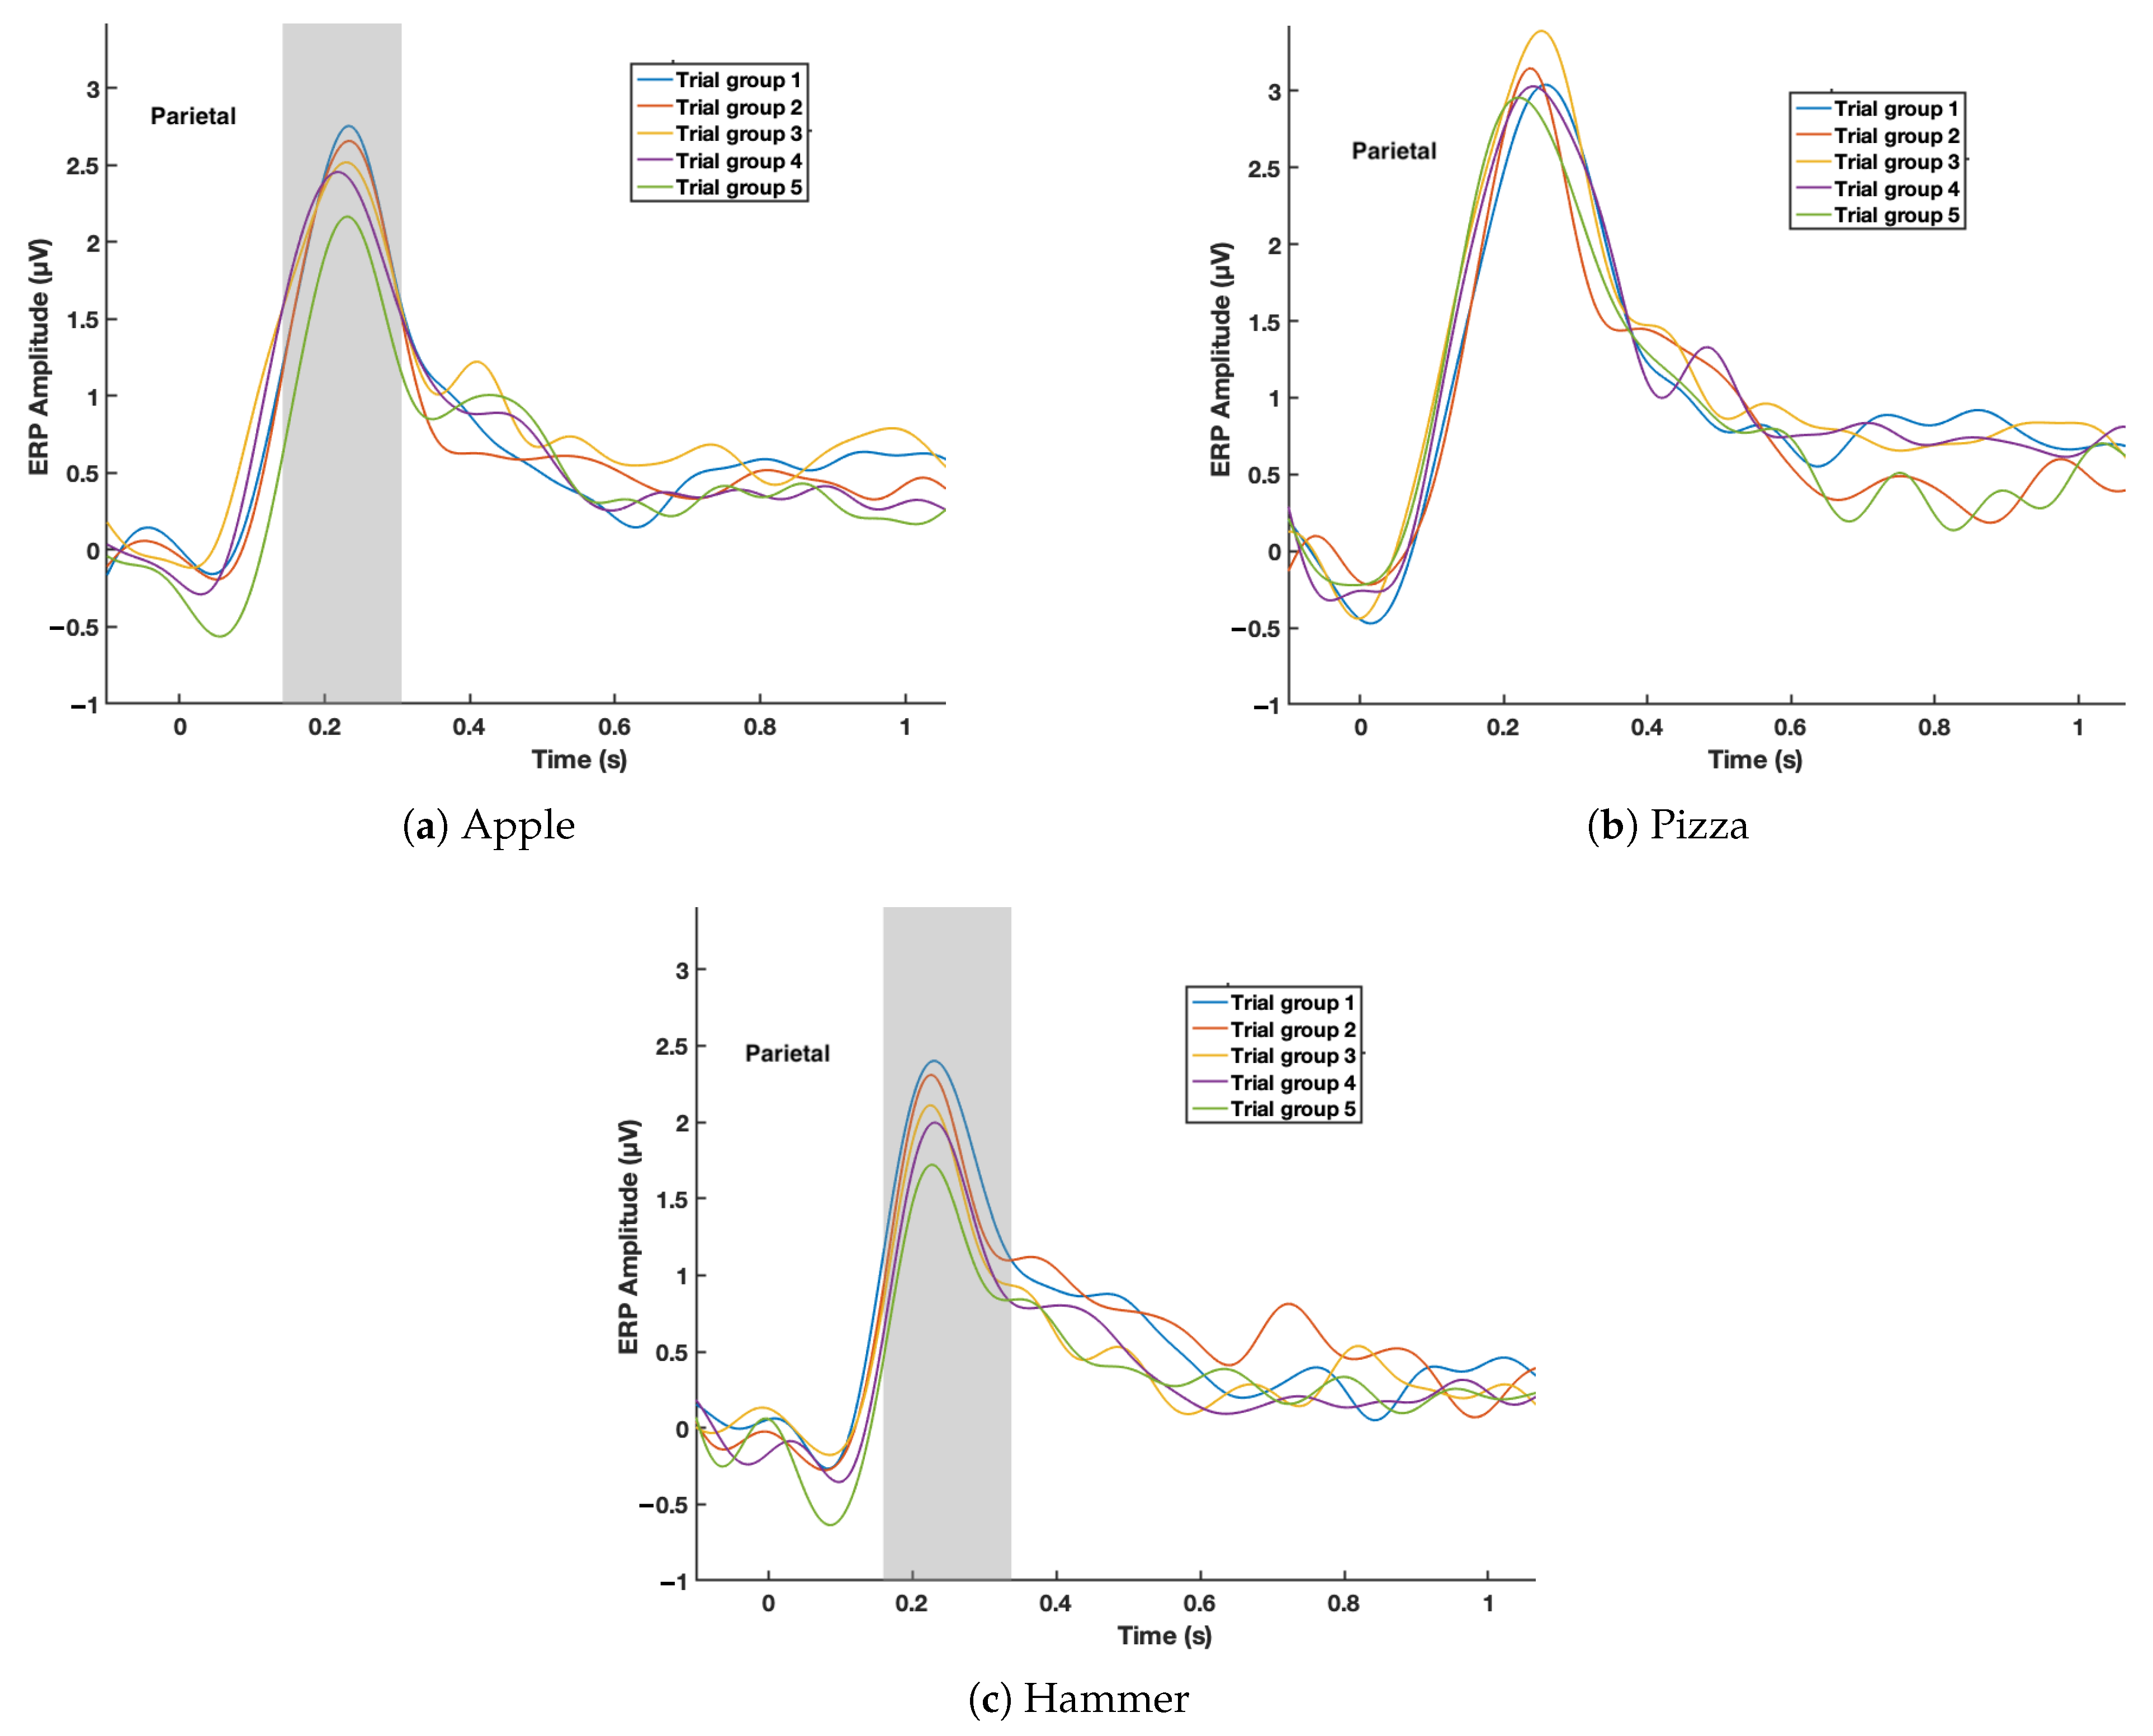
Significant main effects and interactions for ERPs were analysed in different time windows and in the brain’s parietal, frontal, central, and occipital areas. The cluster-based permutation test revealed a significant difference between different groups of trials in apple and hammer visual stimuli, but not in pizza visual stimuli, based on linear regression analysis of habituation effect in different time windows and channel pairs (refer to Figure 3). A comparison of p-values across all ROIs is provided in Table 1. The results show that statistically significant habituation effects were observed only in the parietal region for the apple and hammer conditions. All other regions yielded non-significant values. Given this outcome, the parietal region was selected for focused analysis and visualisation, ensuring that reported findings are statistically robust and relevant.
Figure 3a presents the mean ERP amplitudes and topographical distribution for different trial groups corresponding to the low-calorie image. The results indicate a clear habituation effect, with trial group 1 showing the highest amplitude, followed by a gradual decrease in subsequent trial groups. Linear regression analysis confirmed significant effects around the 170–300 ms time window, with a p-value of 0.016.
In contrast, Figure 3b presents the mean ERP amplitudes and corresponding topographical maps for the high-calorie image. Unlike the low-calorie and non-food stimuli, high-calorie images did not show significant habituation across trial groups, as indicated by a non-significant p-value of 0.213. This suggests that neural engagement with high-calorie stimuli remains sustained over repeated exposures.
Similarly, Figure 3c illustrates the mean ERP amplitudes for each trial group in response to the non-food image. A habituation pattern was observed, where trial group 1 exhibited the highest amplitude, followed by a consistent decline in later trials. Statistically significant main effects were identified around the 180–330 ms time window, with a p-value of 0.011.
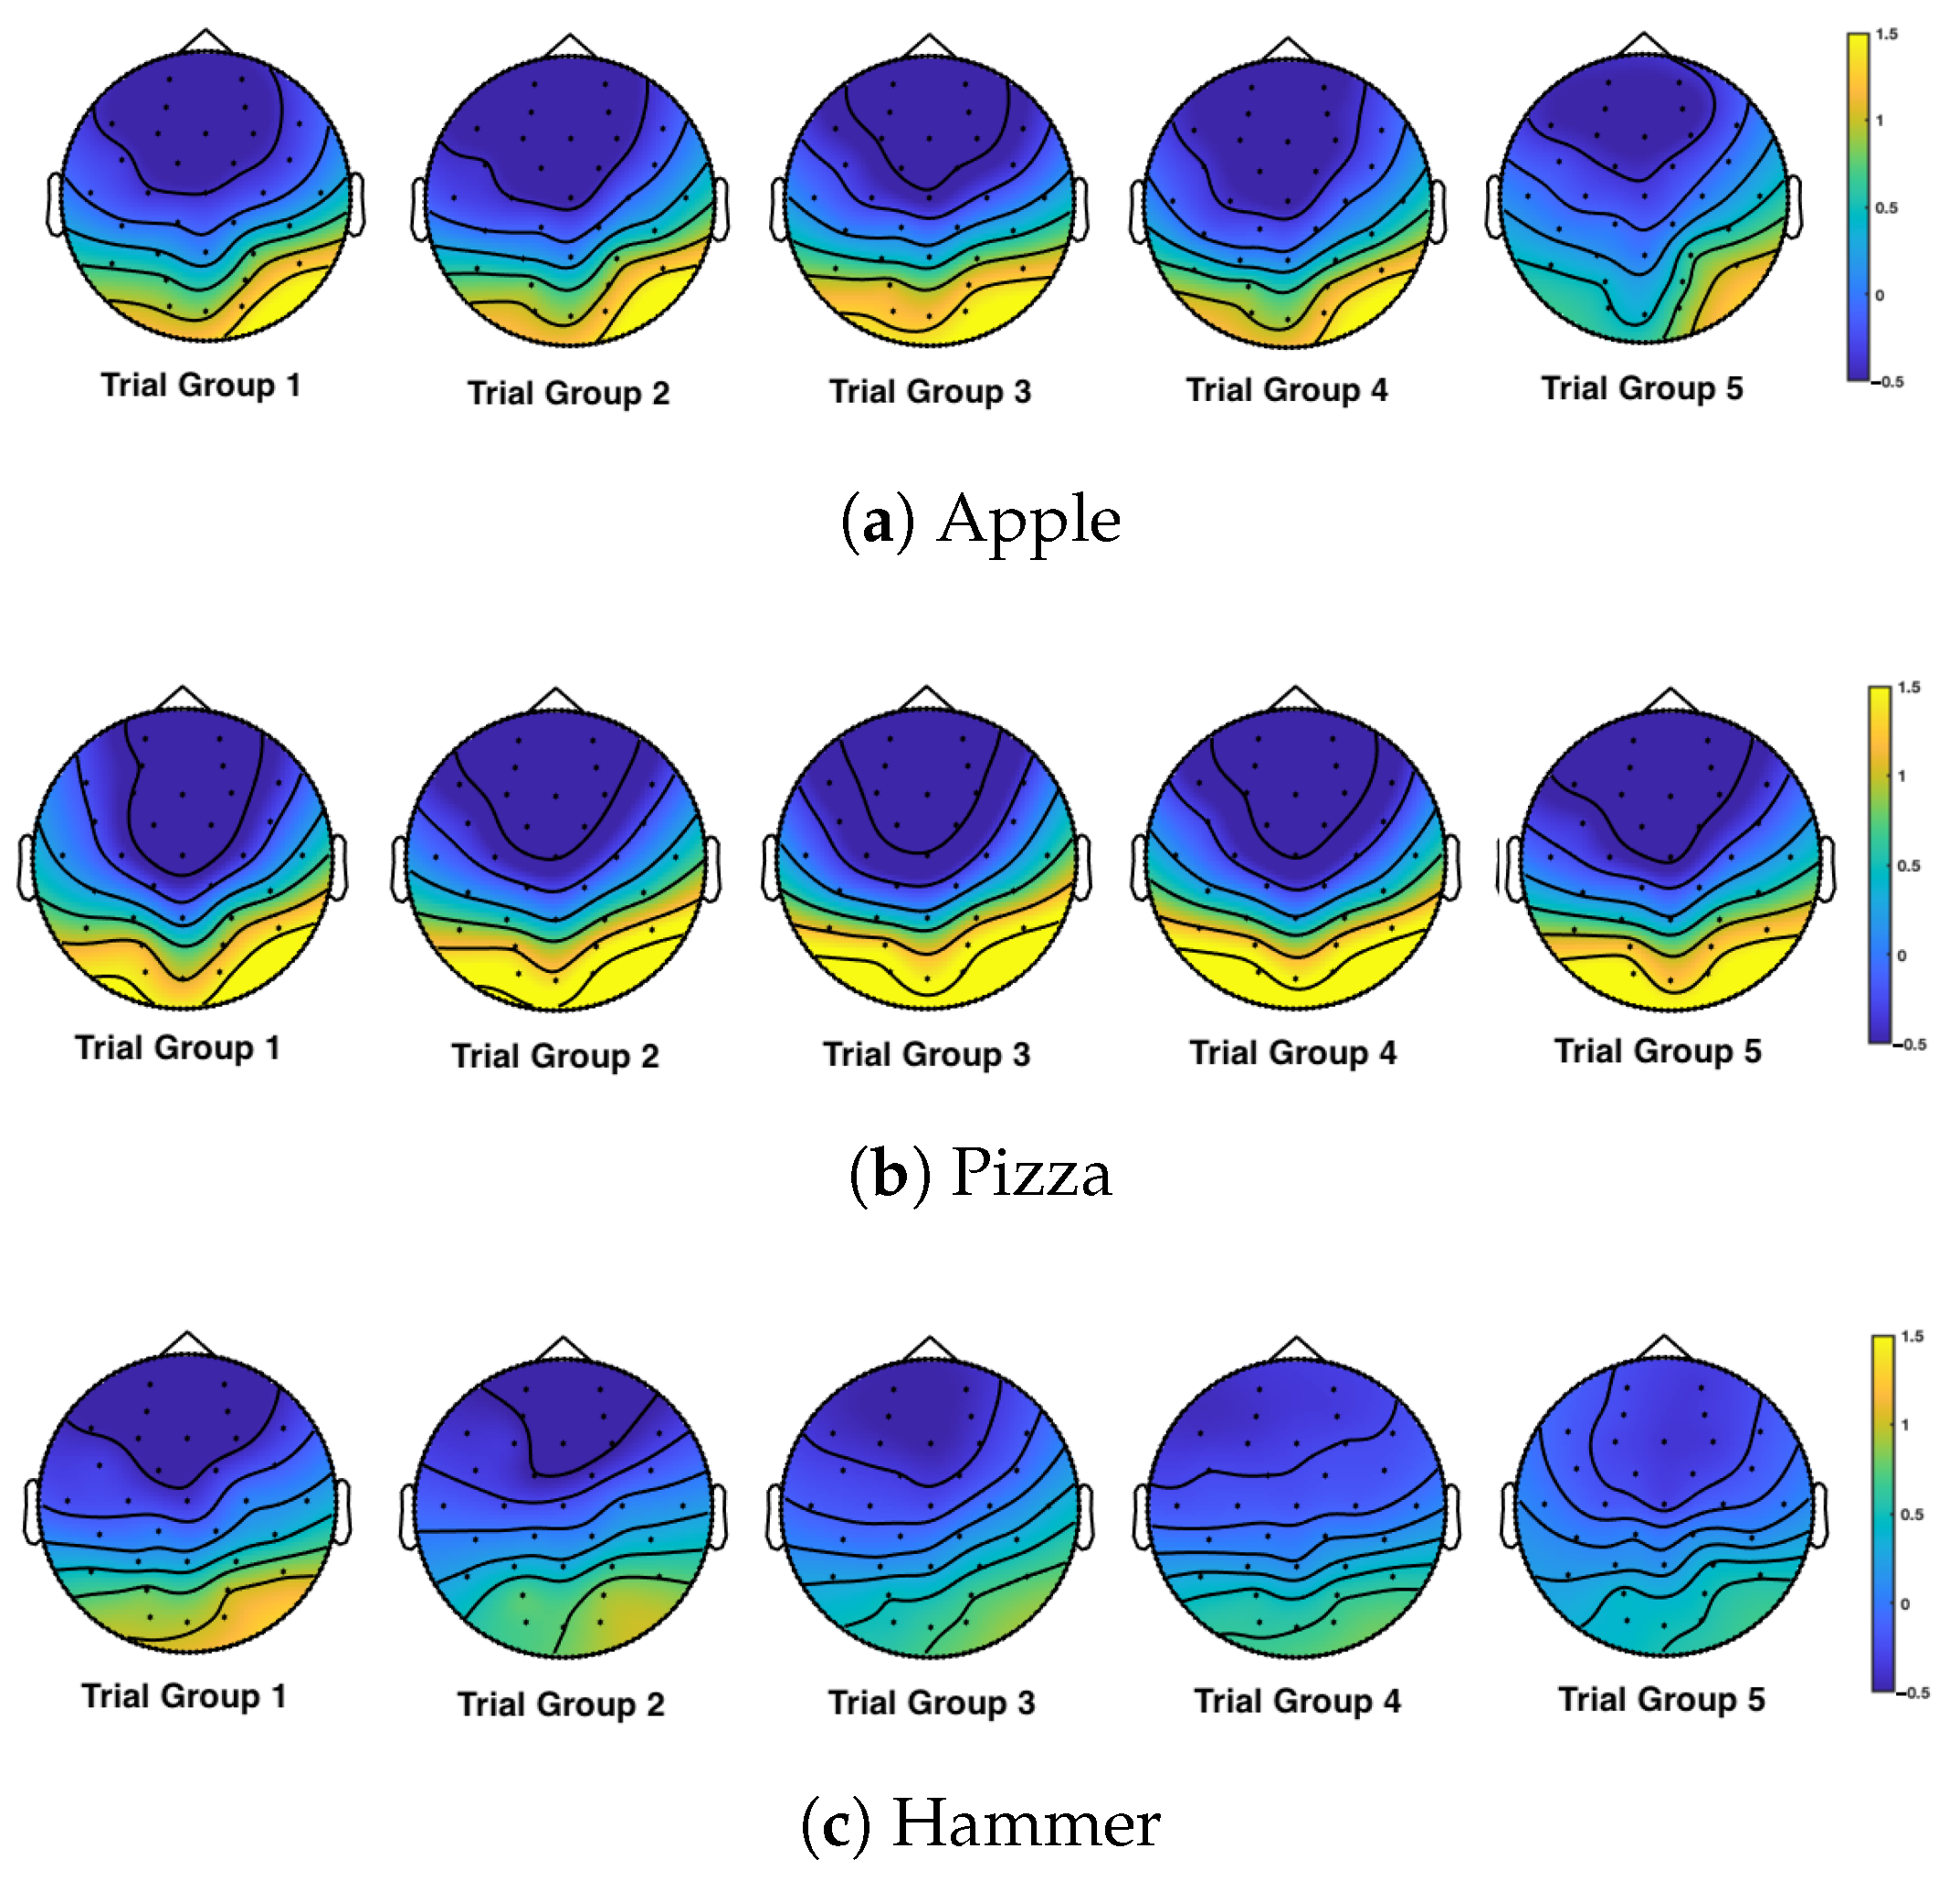
Figure 4 presents the topographical distribution of mean ERP amplitudes across different trial groups for each stimulus category, illustrating changes in scalp activity patterns over time, particularly in the parietal region where significant habituation effects were localised.
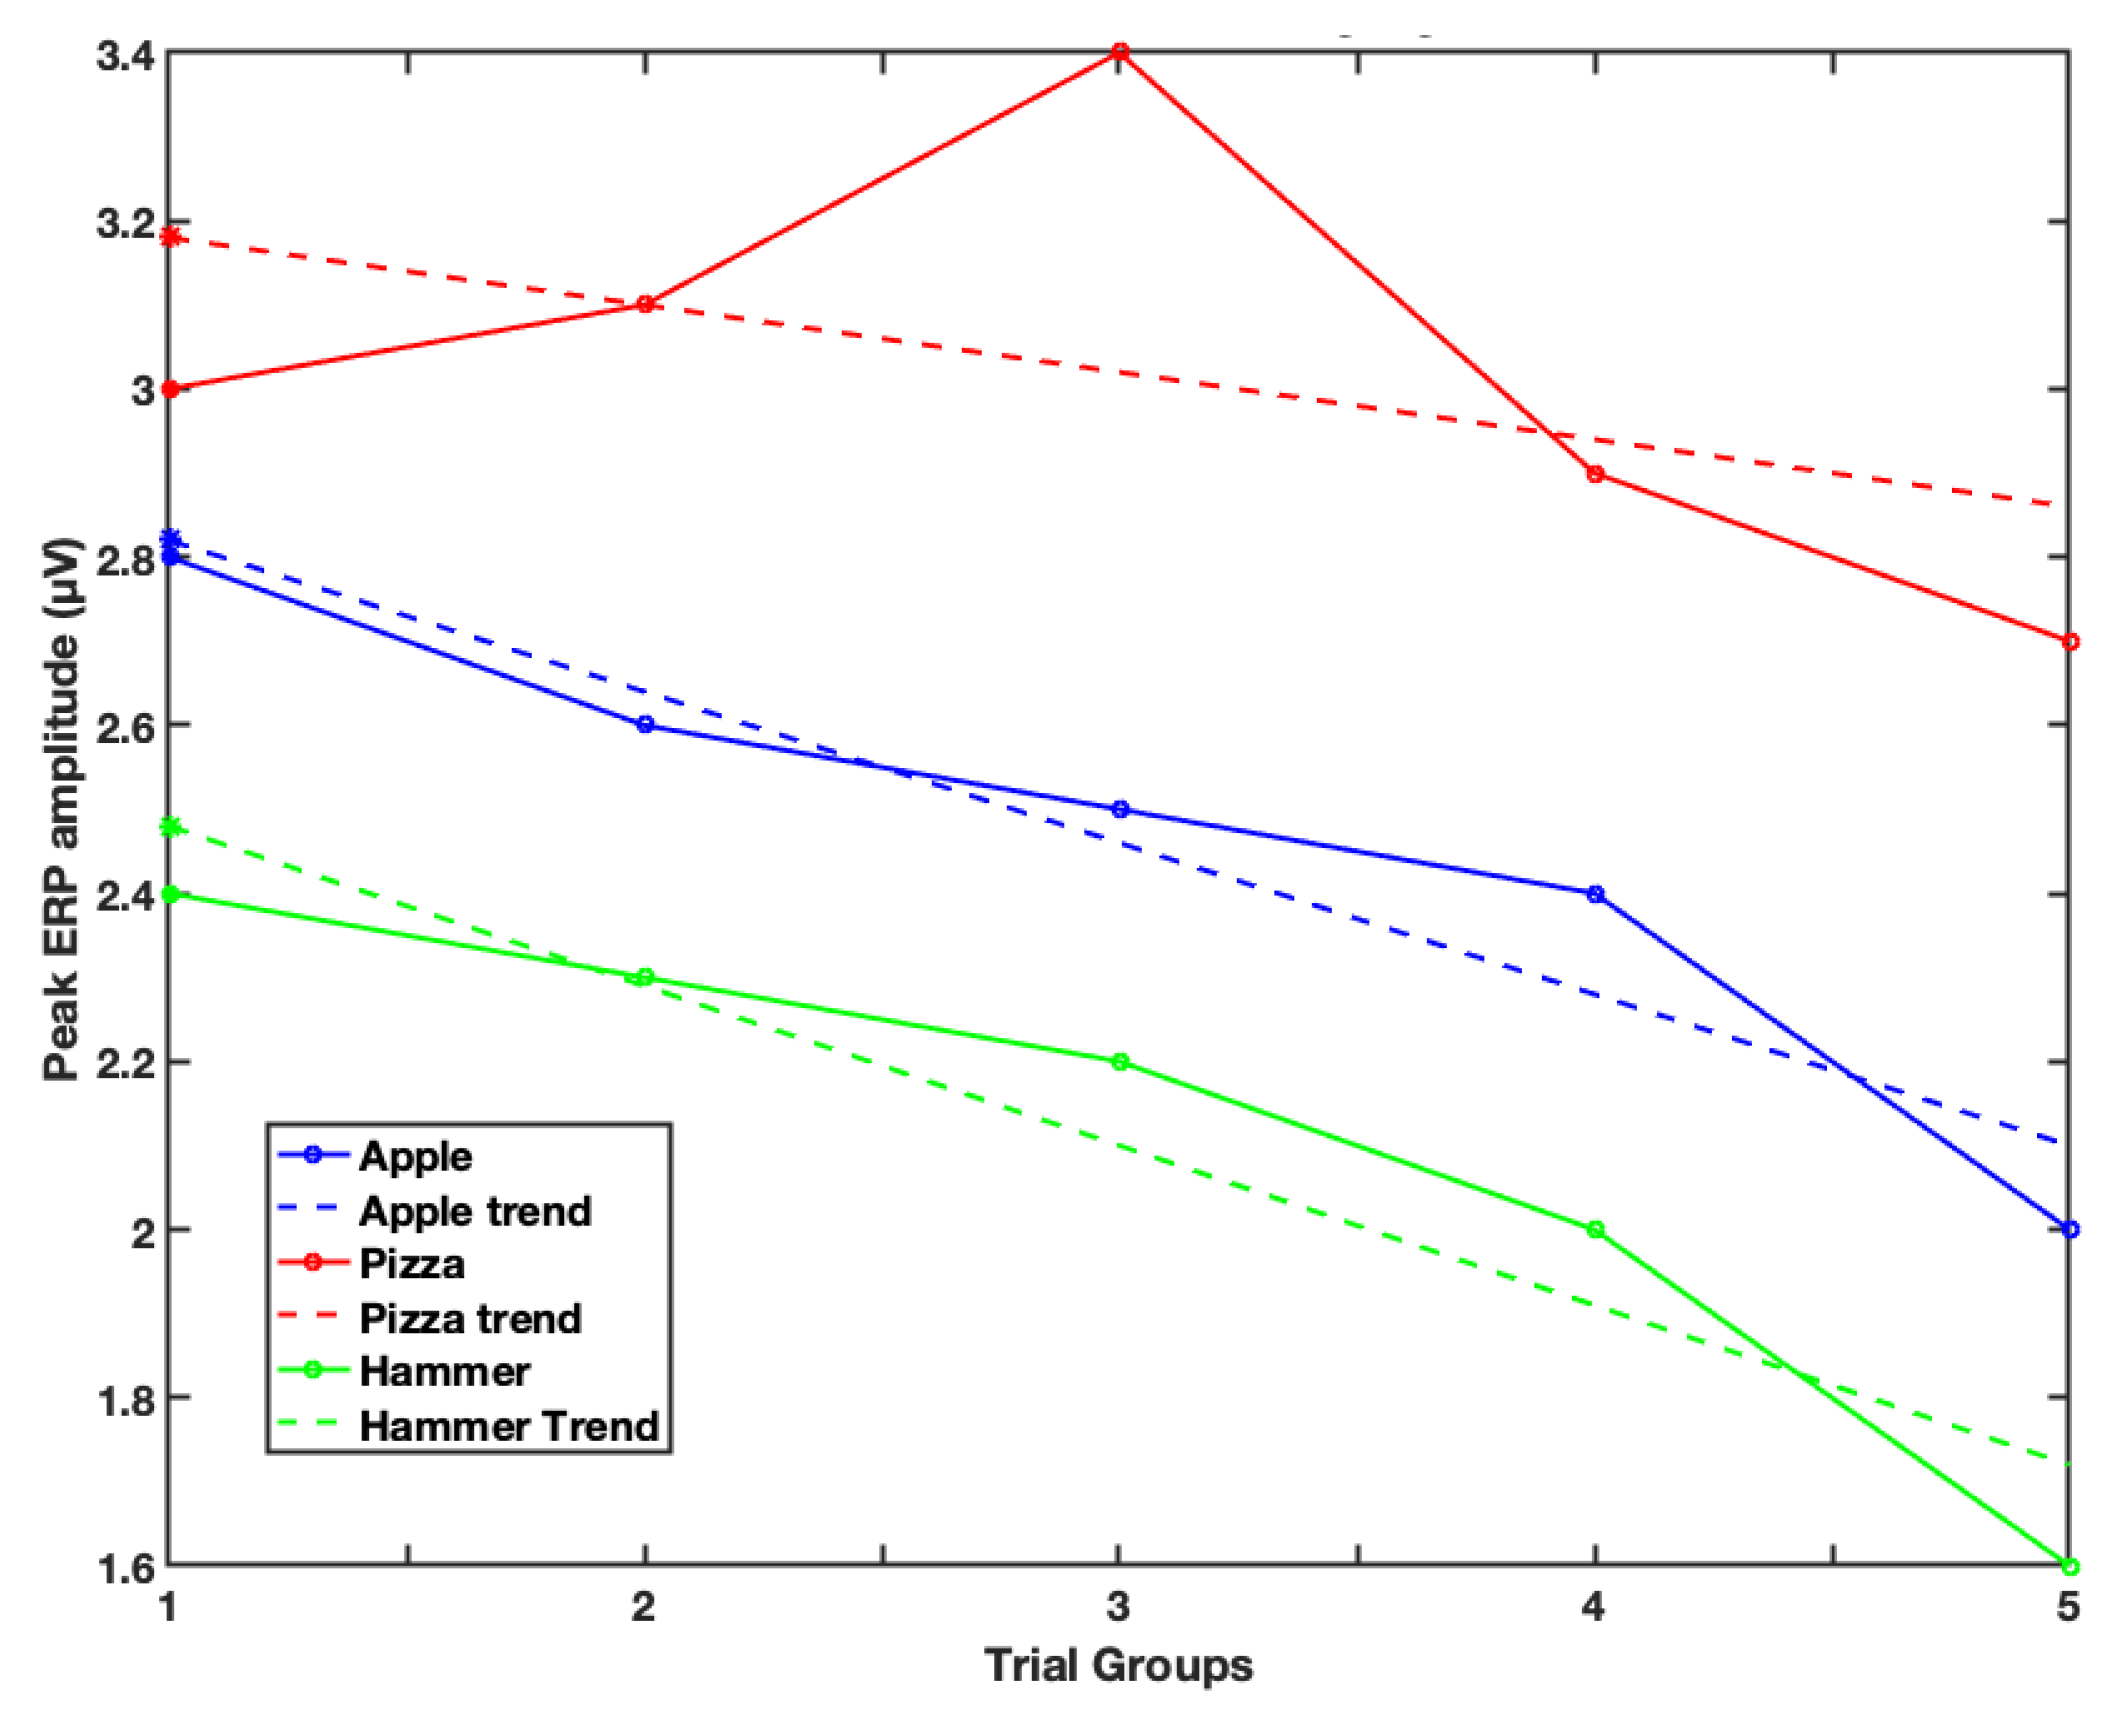
Figure 5 illustrates peak amplitude changes and linear trends for all three image types across trial groups. The slope and intercept values derived from the linear regression model are summarised in Table 2. In this model, the intercept reflects the estimated ERP amplitude in the first trial, serving as a baseline measure of initial attentional engagement before habituation begins. This allows for direct comparison of starting neural responses across stimulus categories. Among the three stimuli, the non-food image showed the fastest habituation, with a slope of −0.19 µV per trial group, indicating a clear decline in ERP amplitude within the session. The low-calorie image followed closely, with a slope of −0.18 µV. In contrast, the high-calorie image exhibited the slowest rate of habituation, with a slope of −0.06 µV per trial group, suggesting that attention to high-calorie food cues remained relatively stable throughout repeated presentations.

4. Discussion

This study investigated how repeated exposure to identical food and non-food images modulates attentional and motivational engagement, using ERP responses as objective neural indicators of habituation. Stimuli representing high-calorie (pizza), low-calorie (apple), and non-food (hammer) items were each presented 30 times, grouped into five sequential trial sets. ERP results showed significant amplitude reductions for low-calorie and non-food images, primarily around the 170–330 ms window over parietal regions, while no such decline was observed for high-calorie images.
These findings align with the prior literature suggesting that the brain reduces attention to repeated stimuli unless they retain motivational salience. The P200 component, occurring around 150–250 ms post-stimulus, is known to reflect early attentional and motivational relevance [11,33]. In this study, declining P200 amplitudes for low-calorie and non-food images indicate neural habituation, while the sustained P200 response to high-calorie images suggests persistent attentional engagement. Although the topographical maps (Figure 4) depict whole-scalp activity, statistical differences were localised to parietal regions. Notably, no significant reductions were found in occipital areas, which supports the interpretation that observed effects were not merely due to visual adaptation but reflect higher-order attentional modulation. This addresses the concern regarding the spatial specificity of ERP effects.
To minimise confounding factors such as fatigue or mere visual repetition, the experimental protocol included short sessions (3 min), interspersed with breaks. Stimulus order was randomised, and each image type was presented an equal number of times. Moreover, stable scores on the Craving Experience Questionnaire (CEQ) and previous ERP findings showing dishabituation with novel stimuli [34] support the interpretation that ERP amplitude reductions were driven by habituation to caloric content rather than by mental fatigue or perceptual dulling.
The persistent P200 response to high-calorie stimuli is consistent with evidence that such cues elicit heightened attentional and motivational processing, even during passive viewing [11,26]. This likely reflects the brain’s intrinsic bias toward calorie-dense foods, evolved to favour energy-rich sources in resource-scarce environments. Such motivational salience continues to operate today, potentially contributing to excessive attention toward high-calorie food cues. The lack of habituation may also be partly driven by the pleasantness of the food image, which likely engages the brain’s reward circuitry and contributes to sustained attentional processing [33]. Nevertheless, it is important to acknowledge the possibility that the sustained engagement with the pizza image may partly reflect greater visual complexity.
Furthermore, our previous study using the same paradigm [35] further showed that low-BMI individuals exhibited stronger habituation to non-food cues compared to high-BMI participants, while sustained responses to food cues were present in both groups, suggesting that BMI may modulate attentional decline specifically for non-food stimuli. This may indicate that individuals with higher BMI have reduced neural flexibility to disengage from repetitive neutral cues, potentially reinforcing sustained attentional bias toward food stimuli. Despite using standardised images from the Food-Pics database [22], high-calorie stimuli like pizza typically contain more visual and semantic detail compared to simpler objects like apples or hammers. This complexity could enhance perceptual engagement and slow habituation. Future studies should use more visually matched stimuli to isolate caloric influence from perceptual factors.
The slower habituation observed for high-calorie cues has implications for understanding attentional biases that may contribute to overeating. Prior work has shown that factors such as dietary variety [9], attentional distraction [4], and media exposure [7] can impair habituation and increase energy intake. Our findings suggest that high-calorie cues maintain their neural salience even with repetition, potentially promoting sustained attention and consumption in food-rich environments. However, the interpretation of these results must be situated within the broader context of feeding behaviour. While attentional bias and habituation are important, they are just one piece of a multifaceted system that includes cognitive and environmental factors [36,37,38]. Although ERP findings may inform future intervention hypotheses, such as retraining attention through repeated neutral exposure to high-calorie foods, such approaches should be explored cautiously and supported by longitudinal evidence.
While this study offers insights into neural habituation to food cues, several important limitations should be acknowledged. First, this study’s interpretation of habituation as a mechanism contributing to attentional bias toward high-calorie foods may oversimplify the complexity of feeding behaviour. Eating is regulated not only by attentional and motivational processes but also by hormonal signals, cognitive control, and social–environmental influences. Second, the suggestion that reducing food variety could support calorie regulation contrasts with established dietary guidelines that emphasise nutritional diversity for balanced health. This interpretation should therefore be regarded as a speculative direction for future research rather than a prescriptive recommendation. Third, although efforts were made to control low-level visual properties using a standardised image set, high-calorie stimuli like pizza may inherently contain more visual detail than simpler items like apples or hammers. This greater complexity could contribute to sustained engagement independently of caloric content, confounding the interpretation of neural habituation. Similarly, images of meals versus snacks may carry differing contextual associations related to satiety or consumption patterns, which were not directly controlled in this design.

5. Conclusions

This study provides electrophysiological evidence of differential habituation effects in response to repeated visual food stimuli, particularly highlighting sustained attention to high-calorie food images. While these findings contribute to understanding neural attentional mechanisms involved in food cue reactivity, it is acknowledged that feeding behaviour is regulated by a complex interplay of cognitive, emotional, social, and metabolic factors. Therefore, interpretations should remain within the scope of attentional processing and not extend to dietary or obesity interventions. Future work may benefit from combining ERP data with behavioural and ecological measures to comprehensively assess the dynamics of food-related attention.

Author Contributions

A.D.: conceptualisation, methodology, data analysis, and writing—original draft. D.S.: supervision at each stage of this study, manuscript—review and editing, and validation. R.P.: conceptualisation of initial idea, primary supervision at each stage of this study, manuscript—review and editing, and validation. All authors have read and agreed to the published version of the manuscript.

Funding

This research received no external funding.

Institutional Review Board Statement

This study was approved by the Faculty of Sciences Research Ethics Committee, University of Kent (ethics approval reference: 0471920), in accordance with the Declaration of Helsinki guidelines.

Informed Consent Statement

All participants consented to participate in the experiment via signed informed consent.

Data Availability Statement

Data was newly acquired for the present research and can be made available after publication upon request.

Acknowledgments

All authors acknowledge the participants involved in data collection.

Conflicts of Interest

The authors declare no conflicts of interest.

Abbreviations

The following abbreviations are used in this manuscript:
EEGElectroencephalogram
ERPEvent-Related Potential
CEQCraving Experience Questionnaire
ISIInter-Stimulus Interval

References

  1. Epstein, L.H.; Temple, J.L.; Roemmich, J.N.; Bouton, M.E. Habituation as a determinant of human food intake. Psychol. Rev. 2009, 116, 384. [Google Scholar] [CrossRef]
  2. Epstein, L.H.; Paluch, R.A. Habituation of facial muscle responses to repeated food stimuli. Appetite 1997, 29, 213–224. [Google Scholar] [CrossRef]
  3. Temple, J.L.; Kent, K.M.; Giacomelli, A.M.; Paluch, R.A.; Roemmich, J.N.; Epstein, L.H. Habituation and recovery of salivation and motivated responding for food in children. Appetite 2006, 46, 280–284. [Google Scholar] [CrossRef]
  4. Temple, J.L.; Giacomelli, A.M.; Roemmich, J.N.; Epstein, L.H. Habituation and within-session changes in motivated responding for food in children. Appetite 2008, 50, 390–396. [Google Scholar] [CrossRef]
  5. Epstein, L.H.; Rodefer, J.S.; Wisniewski, L.; Caggiula, A.R. Habituation and dishabituation of human salivary response. Physiol. Behav. 1992, 51, 945–950. [Google Scholar] [CrossRef]
  6. Epstein, L.H.; Robinson, J.L.; Temple, J.L.; Roemmich, J.N.; Marusewski, A.; Nadbrzuch, R. Sensitization and habituation of motivated behavior in overweight and non-overweight children. Learn. Motiv. 2008, 39, 243–255. [Google Scholar] [CrossRef]
  7. Temple, J.L.; Giacomelli, A.M.; Roemmich, J.N.; Epstein, L.H. Overweight children habituate slower than non-overweight children to food. Physiol. Behav. 2007, 91, 250–254. [Google Scholar] [CrossRef] [PubMed]
  8. Epstein, L.H.; Robinson, J.L.; Temple, J.L.; Roemmich, J.N.; Marusewski, A.L.; Nadbrzuch, R.L. Variety influences habituation of motivated behavior for food and energy intake in children. Am. J. Clin. Nutr. 2009, 89, 746–754. [Google Scholar] [CrossRef] [PubMed]
  9. McCrory, M.A.; Fuss, P.J.; McCallum, J.E.; Yao, M.; Vinken, A.G.; Hays, N.P.; Roberts, S.B. Dietary variety within food groups: Association with energy intake and body fatness in men and women. Am. J. Clin. Nutr. 1999, 69, 440–447. [Google Scholar] [CrossRef]
  10. Asmaro, D.; Jaspers-Fayer, F.; Sramko, V.; Taake, I.; Carolan, P.; Liotti, M. Spatiotemporal dynamics of the hedonic processing of chocolate images in individuals with and without trait chocolate craving. Appetite 2012, 58, 790–799. [Google Scholar] [CrossRef] [PubMed]
  11. Nijs, I.M.; Muris, P.; Euser, A.S.; Franken, I.H. Differences in attention to food and food intake between overweight/obese and normal-weight females under conditions of hunger and satiety. Appetite 2010, 54, 243–254. [Google Scholar] [CrossRef]
  12. Wolz, I.; Sauvaget, A.; Granero, R.; Mestre-Bach, G.; Baño, M.; Martín-Romera, V.; Veciana De Las Heras, M.; Jiménez-Murcia, S.; Jansen, A.; Roefs, A.; et al. Subjective craving and event-related brain response to olfactory and visual chocolate cues in binge-eating and healthy individuals. Sci. Rep. 2017, 7, 41736. [Google Scholar] [CrossRef]
  13. Schwab, D.; Zorjan, S.; Schienle, A. Face the food: Food plating with facial patterns influences appetite and event-related brain potentials. Motiv. Emot. 2021, 45, 95–102. [Google Scholar] [CrossRef]
  14. Feng, P.; Wang, J.; Ding, X.; Li, C.; Guo, F.; Ding, X. How do extrinsic cues influence consumers’ online hotel booking decisions? An event-related potential experiment. Front. Psychol. 2022, 13, 990640. [Google Scholar] [CrossRef]
  15. Dolan, R.J.; Fink, G.; Rolls, E.; Booth, M.; Holmes, A.; Frackowiak, R.; Friston, K. How the brain learns to see objects and faces in an impoverished context. Nature 1997, 389, 596–599. [Google Scholar] [CrossRef]
  16. Grill-Spector, K.; Henson, R.; Martin, A. Repetition and the brain: Neural models of stimulus-specific effects. Trends Cogn. Sci. 2006, 10, 14–23. [Google Scholar] [CrossRef]
  17. Guillaume, C.; Guillery-Girard, B.; Chaby, L.; Lebreton, K.; Hugueville, L.; Eustache, F.; Fiori, N. The time course of repetition effects for familiar faces and objects: An ERP study. Brain Res. 2009, 1248, 149–161. [Google Scholar] [CrossRef]
  18. Tacikowski, P.; Jednoróg, K.; Marchewka, A.; Nowicka, A. How multiple repetitions influence the processing of self-, famous and unknown names and faces: An ERP study. Int. J. Psychophysiol. 2011, 79, 219–230. [Google Scholar] [CrossRef] [PubMed]
  19. Duraisingam, A.; Palaniappan, R.; Soria, D. Attentional bias towards high and low caloric food on repeated visual food stimuli: An ERP study. In Proceedings of the 2021 43rd Annual International Conference of the IEEE Engineering in Medicine & Biology Society (EMBC), Virtual, 1–5 November 2021; IEEE: Piscataway, NJ, USA, 2021; pp. 740–743. [Google Scholar]
  20. Leung, S.O. A comparison of psychometric properties and normality in 4-, 5-, 6-, and 11-point Likert scales. J. Soc. Serv. Res. 2011, 37, 412–421. [Google Scholar] [CrossRef]
  21. Smith, Y.M. Italian Cuisine Is World’s Most Popular. 2019. Available online: https://yougov.co.uk/topics/consumer/articles-reports/2019/03/12/italian-cuisine-worlds-most-popular (accessed on 4 November 2022).
  22. Blechert, J.; Meule, A.; Busch, N.A.; Ohla, K. Food-pics: An image database for experimental research on eating and appetite. Front. Psychol. 2014, 5, 617. [Google Scholar] [CrossRef] [PubMed]
  23. May, J.; Andrade, J.; Kavanagh, D.J.; Feeney, G.F.; Gullo, M.J.; Statham, D.J.; Skorka-Brown, J.; Connolly, J.M.; Cassimatis, M.; Young, R.M.; et al. The Craving Experience Questionnaire: A brief, theory-based measure of consummatory desire and craving. Addiction 2014, 109, 728–735. [Google Scholar] [CrossRef]
  24. Geisler, M.W.; Polich, J. P300, Food Consumption, and Memory Performance. Psychophysiology 1992, 29, 76–85. [Google Scholar] [CrossRef]
  25. Wardle, J. Eating style: A validation study of the Dutch Eating Behaviour Questionnaire in normal subjects and women with eating disorders. J. Psychosom. Res. 1987, 31, 161–169. [Google Scholar] [CrossRef] [PubMed]
  26. Toepel, U.; Knebel, J.F.; Hudry, J.; le Coutre, J.; Murray, M.M. The Brain Tracks the Energetic Value in Food Images. NeuroImage 2009, 44, 967–974. [Google Scholar] [CrossRef] [PubMed]
  27. Zorjan, S.; Gremsl, A.; Schienle, A. Changing the Visualization of Food to Reduce Food Cue Reactivity: An Event-Related Potential Study. Biol. Psychol. 2021, 164, 108173. [Google Scholar] [CrossRef] [PubMed]
  28. Maris, E.; Oostenveld, R. Nonparametric statistical testing of EEG- and MEG-data. J. Neurosci. Methods 2007, 164, 177–190. [Google Scholar] [CrossRef]
  29. Bae, G.Y.; Luck, S.J. Dissociable decoding of spatial attention and working memory from EEG oscillations and sustained potentials. J. Neurosci. 2018, 38, 409–422. [Google Scholar] [CrossRef]
  30. Oostenveld, R.; Fries, P.; Maris, E.; Schoffelen, J.M. FieldTrip: Open source software for advanced analysis of MEG, EEG, and invasive electrophysiological data. Comput. Intell. Neurosci. 2011, 2011, 156869. [Google Scholar] [CrossRef]
  31. Rodriguez-Larios, J.; Faber, P.; Achermann, P.; Tei, S.; Alaerts, K. From thoughtless awareness to effortful cognition: Alpha-theta cross-frequency dynamics in experienced meditators during meditation, rest and arithmetic. Sci. Rep. 2020, 10, 5419. [Google Scholar] [CrossRef]
  32. Quiroga-Martinez, D.R.; Hansen, N.C.; Højlund, A.; Pearce, M.; Brattico, E.; Vuust, P. Decomposing neural responses to melodic surprise in musicians and non-musicians: Evidence for a hierarchy of predictions in the auditory system. NeuroImage 2020, 215, 116816. [Google Scholar] [CrossRef]
  33. Lietti, C.V.; Murray, M.M.; Hudry, J.; le Coutre, J.; Toepel, U. The role of energetic value in dynamic brain response adaptation during repeated food image viewing. Appetite 2012, 58, 11–18. [Google Scholar] [CrossRef] [PubMed]
  34. Duraisingam, A.; Soria, D.; Palaniappan, R. The Habituation-Dishabituation ERP Responses to Repeated Visual Food Cues. In Proceedings of the 2024 IEEE-EMBS Conference on Biomedical Engineering and Sciences (IECBES), Penang, Malaysia, 11–13 December 2024; IEEE: Piscataway, NJ, USA, 2024; pp. 413–418. [Google Scholar]
  35. Duraisingam, A.; Soria, D.; Palaniappan, R. Unraveling Neurophysiological Attentional Habituation Dynamics of Food and Non-Food Paradigms: ERP Correlates with BMI in Response to Repetitive Visual Stimuli. In Proceedings of the 2024 5th International Conference on Data Intelligence and Cognitive Informatics (ICDICI), Tirunelveli, India, 18–20 November 2024; IEEE: Piscataway, NJ, USA, 2024; pp. 318–325. [Google Scholar]
  36. Berthoud, H.R. Metabolic and hedonic drives in the neural control of appetite: Who is the boss? Curr. Opin. Neurobiol. 2011, 21, 888–896. [Google Scholar] [CrossRef] [PubMed]
  37. Lowe, M.R.; Butryn, M.L. Hedonic hunger: A new dimension of appetite? Physiol. Behav. 2007, 91, 432–439. [Google Scholar] [CrossRef]
  38. Carnell, S.; Wardle, J. Appetite and adiposity in children: Evidence for a behavioral susceptibility theory of obesity1. Am. J. Clin. Nutr. 2008, 88, 22–29. [Google Scholar] [CrossRef] [PubMed]
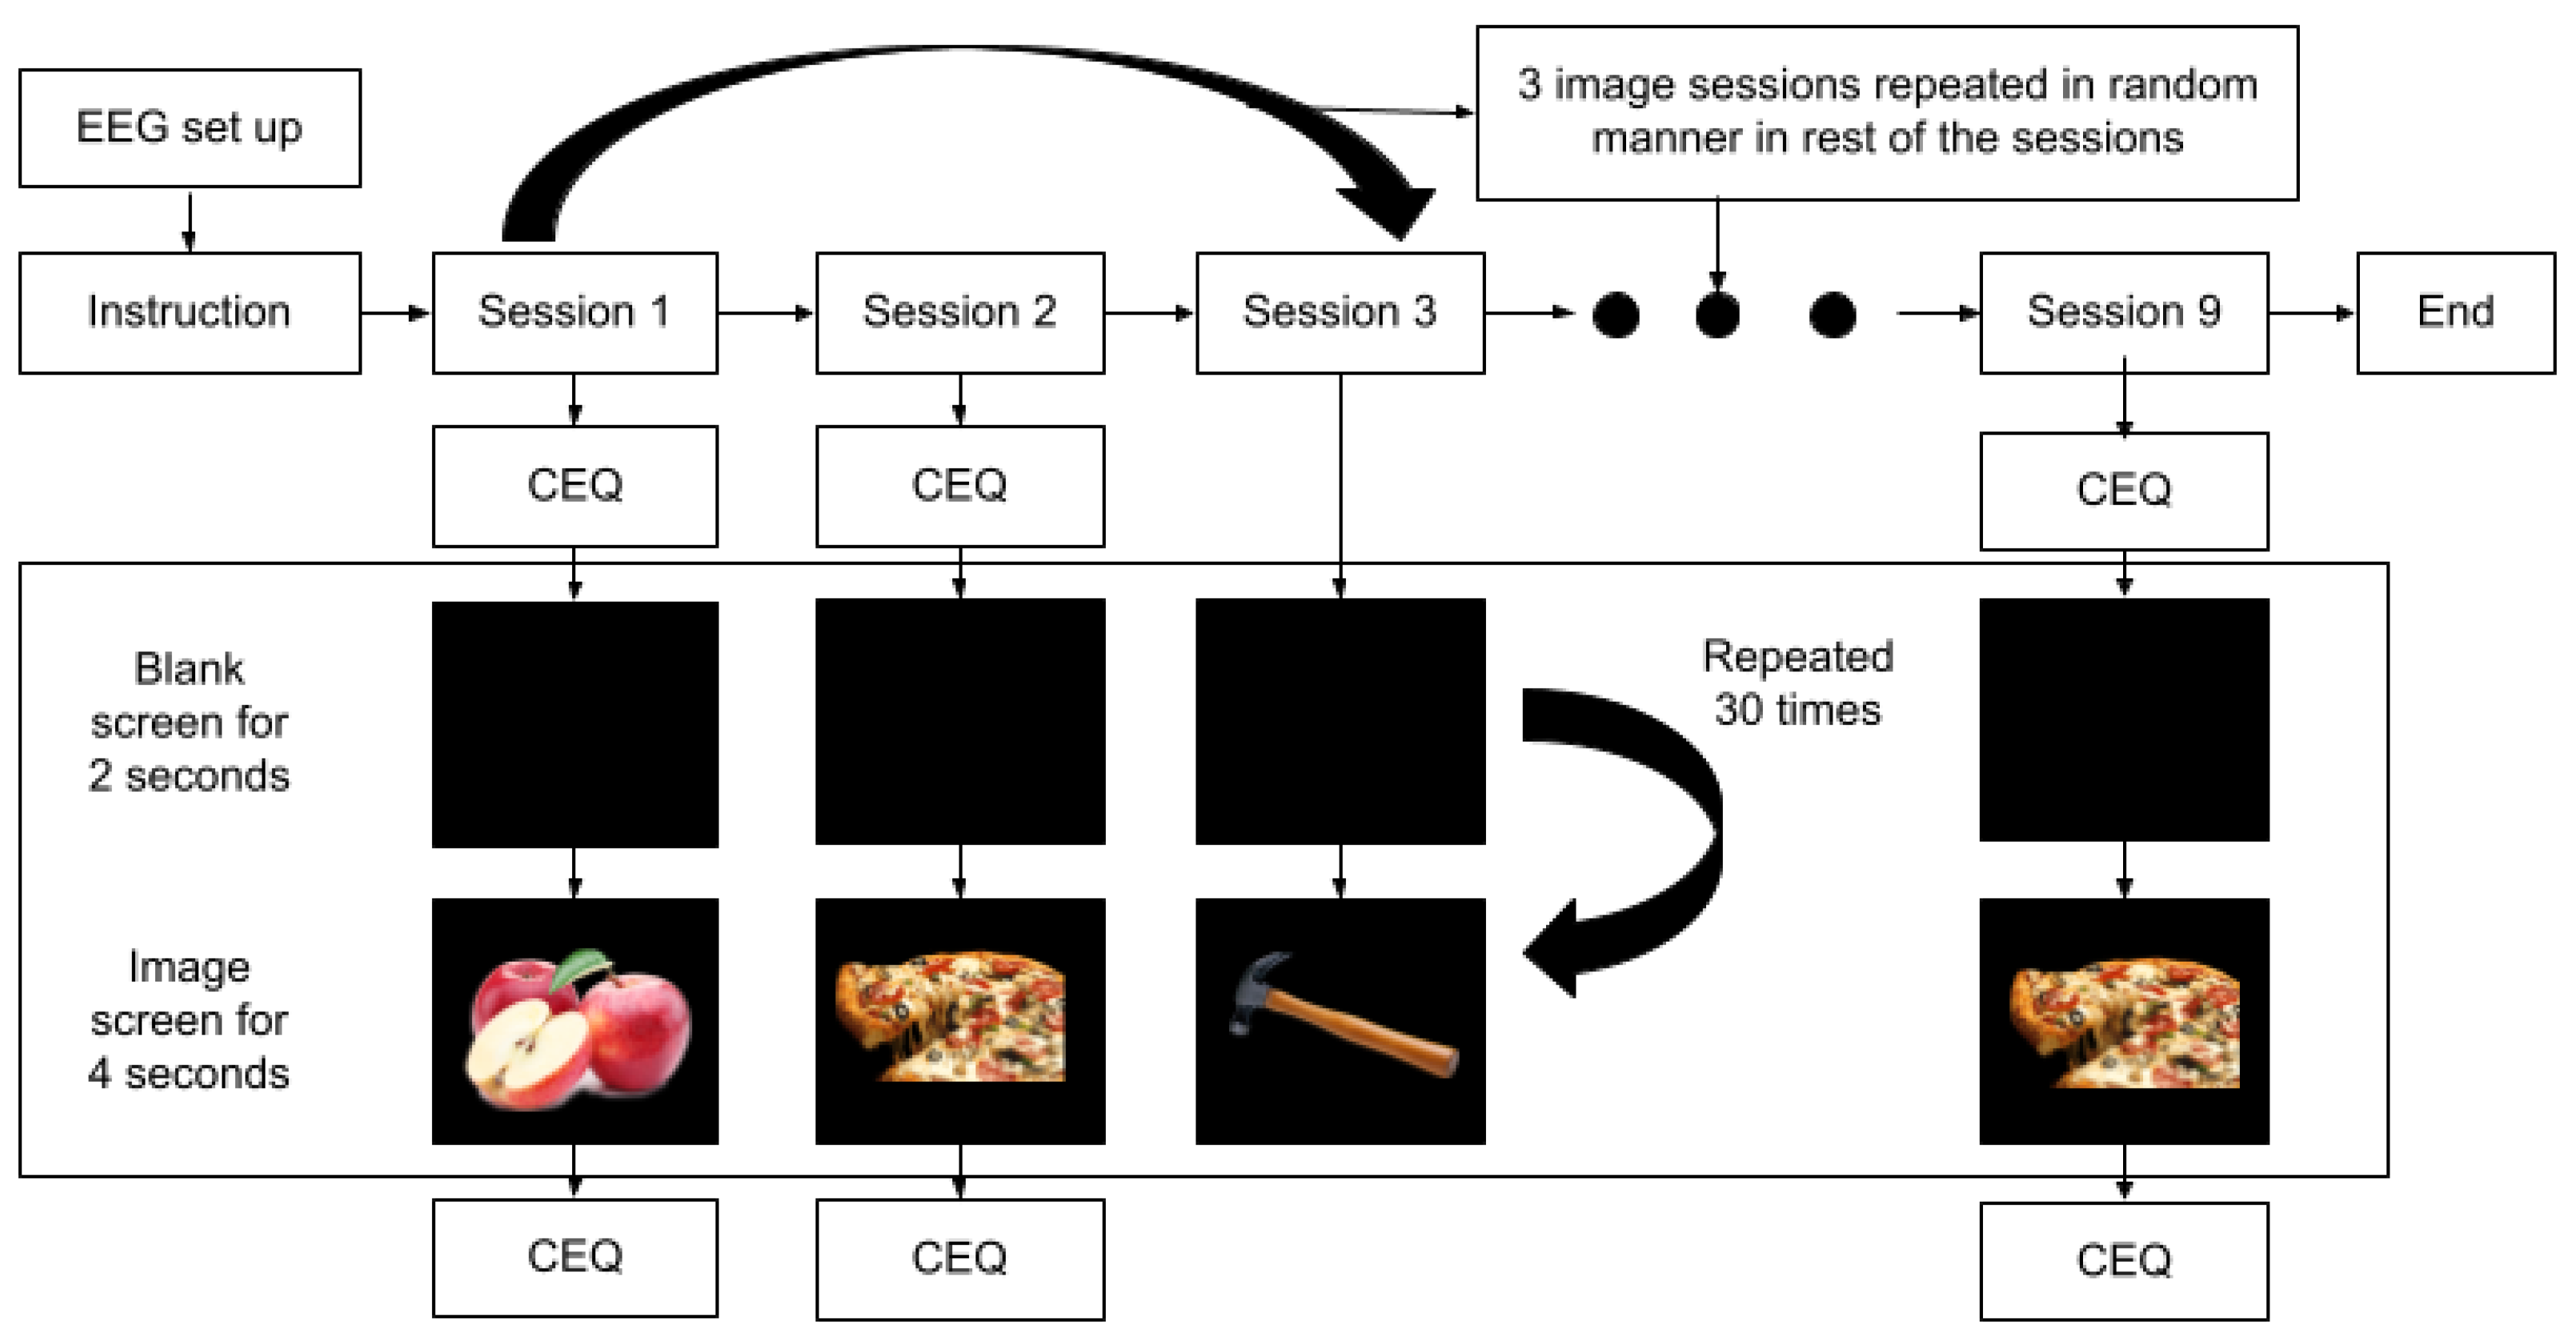
Figure 1. Experimental design: EEG—Electroencephalogram; CEQ—Craving Experience Questionnaire (participants record their current craving intensity) [19].
Algorithms 18 00525 g001
Figure 2. Trial grouping schema: Each session (e.g., apple image repeated 30 times) was divided into five consecutive trial groups. Each trial group consisted of six sequential image presentations (e.g., trial group 1: trials 1–6), used for within-session ERP habituation analysis.
Algorithms 18 00525 g002
Figure 3. (ac) Show mean ERP amplitudes across trial groups for apple, pizza, and hammer stimuli, respectively, recorded from the parietal brain region.
Algorithms 18 00525 g003
Figure 4. Topographical maps of mean ERP amplitudes across trial groups for apple, pizza, and hammer images, showing strongest habituation effects in the parietal region.
Algorithms 18 00525 g004
Figure 5. Peak ERP amplitudes and corresponding linear trends across trial groups for different stimulus types (apple, pizza, and hammer), recorded from the parietal brain region. This figure illustrates the habituation dynamics based on the stimulus category.
Algorithms 18 00525 g005
Table 1. ROI p-values across different image conditions from linear regression analysis.
ROIApplePizzaHammer
Frontal0.2410.3820.196
Central0.1980.4570.273
Temporal0.3240.5110.209
Occipital0.2750.3980.287
Parietal0.0160.2130.011
Table 2. Habituation rate details for different images.
ImageSlopeIntercept
Apple−0.183.01
Pizza−0.063.22
Hammer−0.192.67
Disclaimer/Publisher’s Note: The statements, opinions and data contained in all publications are solely those of the individual author(s) and contributor(s) and not of MDPI and/or the editor(s). MDPI and/or the editor(s) disclaim responsibility for any injury to people or property resulting from any ideas, methods, instructions or products referred to in the content.