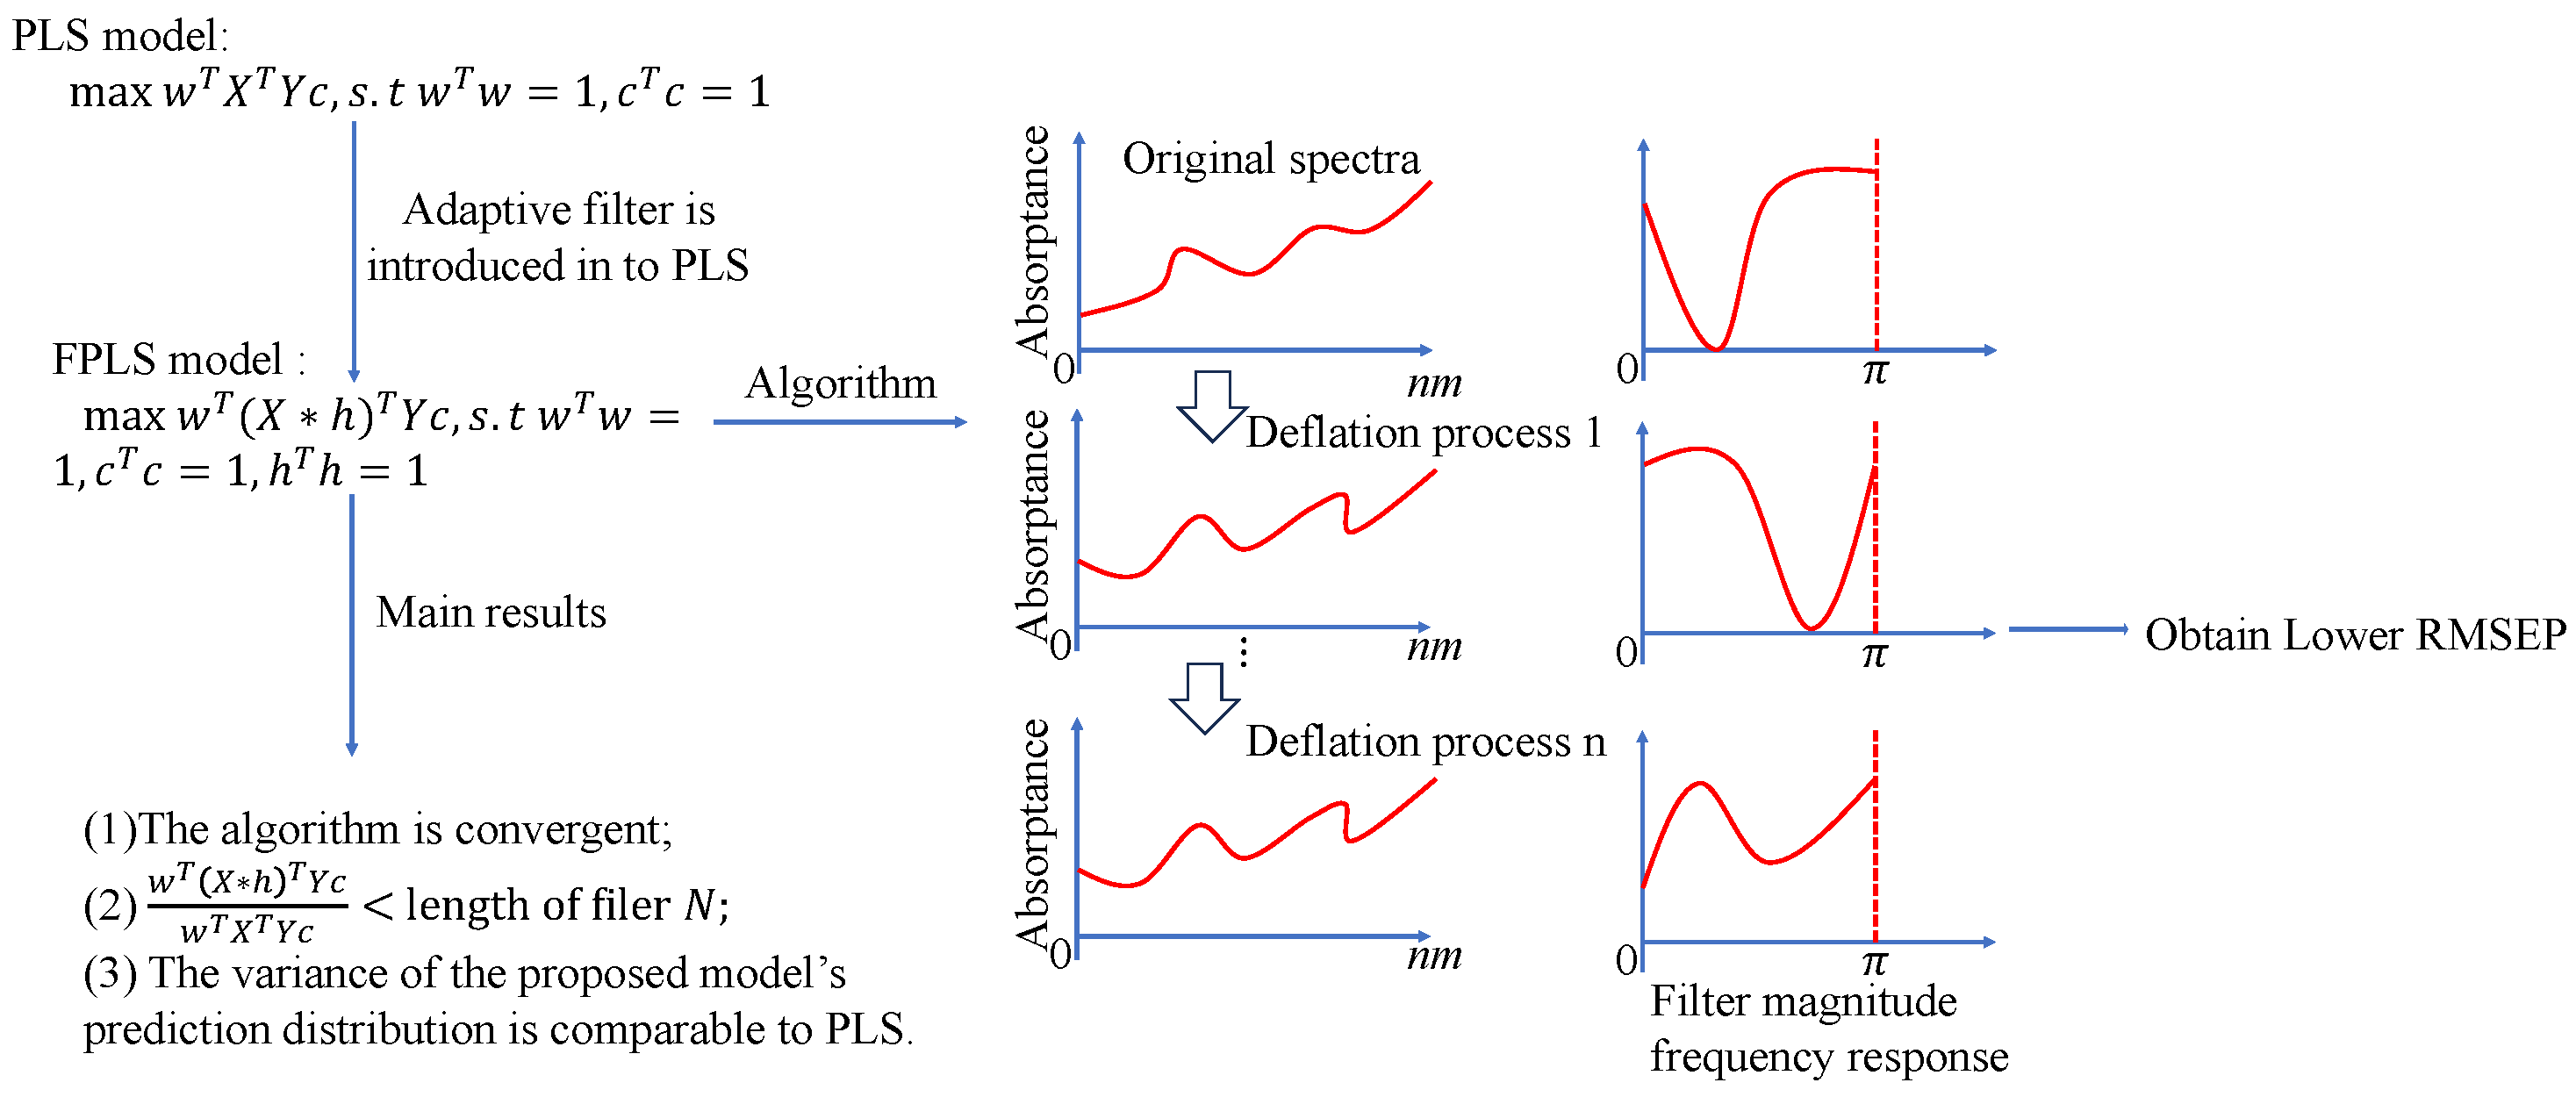
Figure 1.
Flow chart of the proposed method.
Figure 1.
Flow chart of the proposed method.
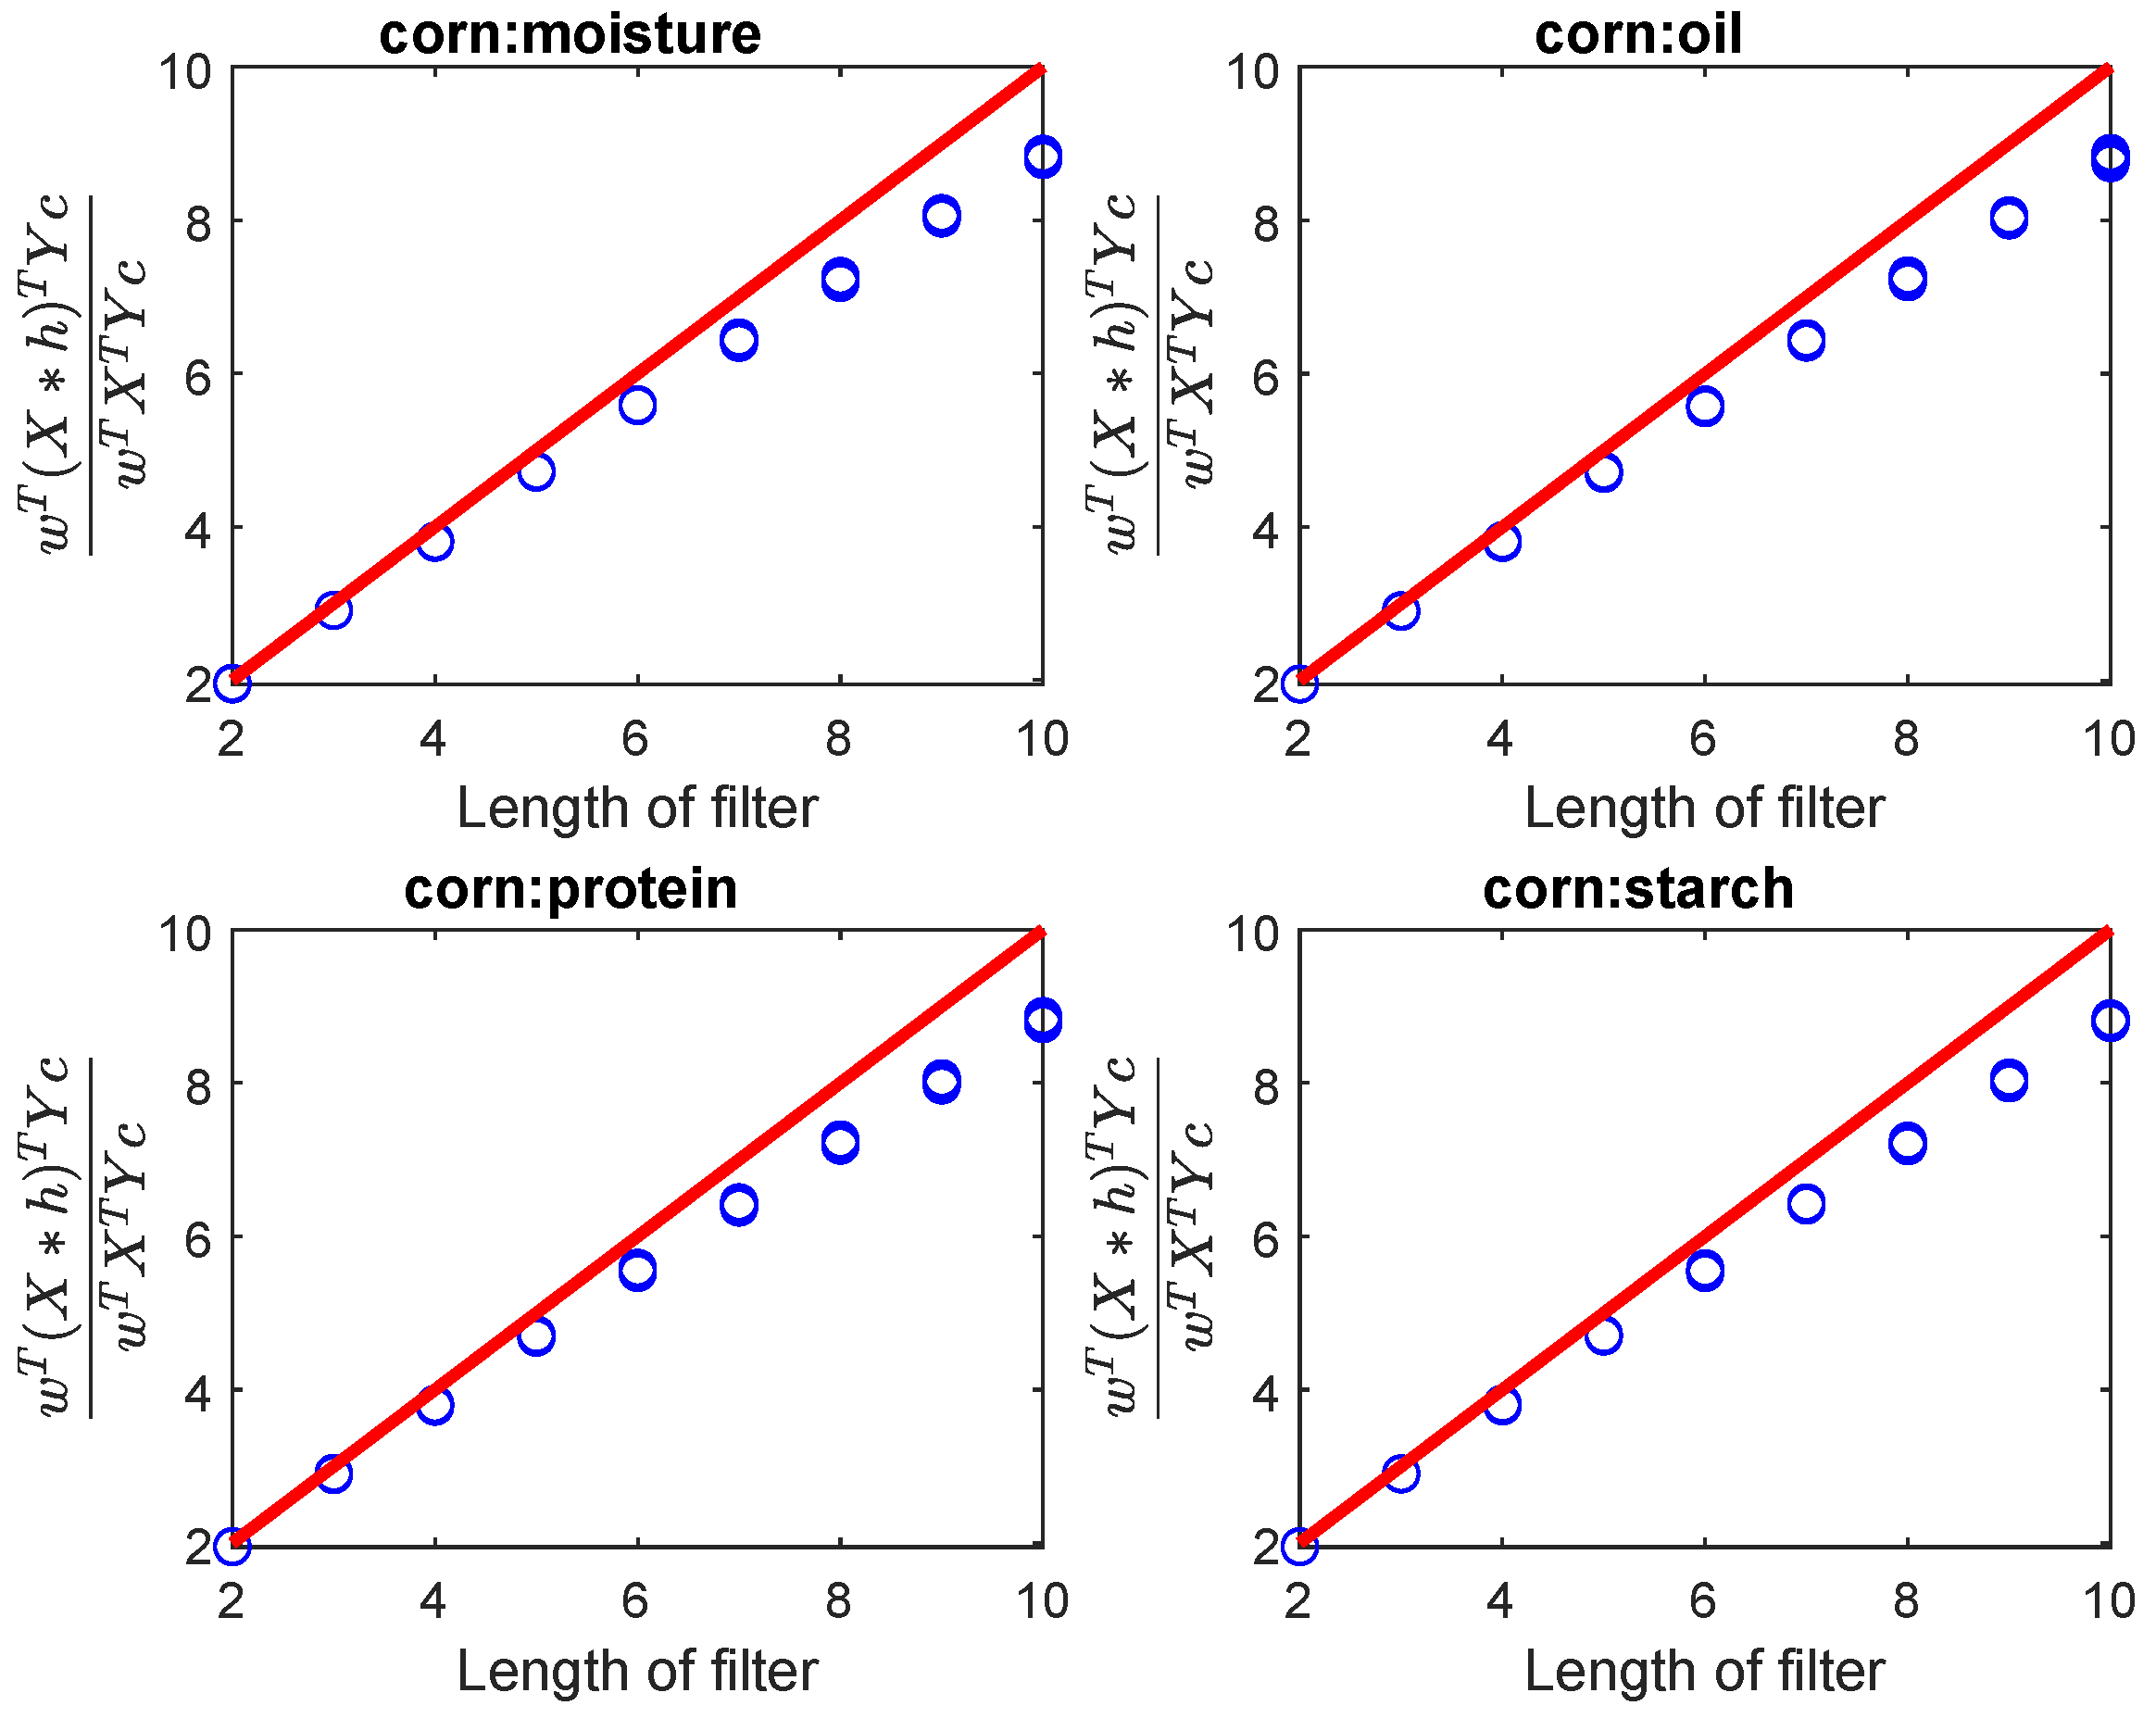
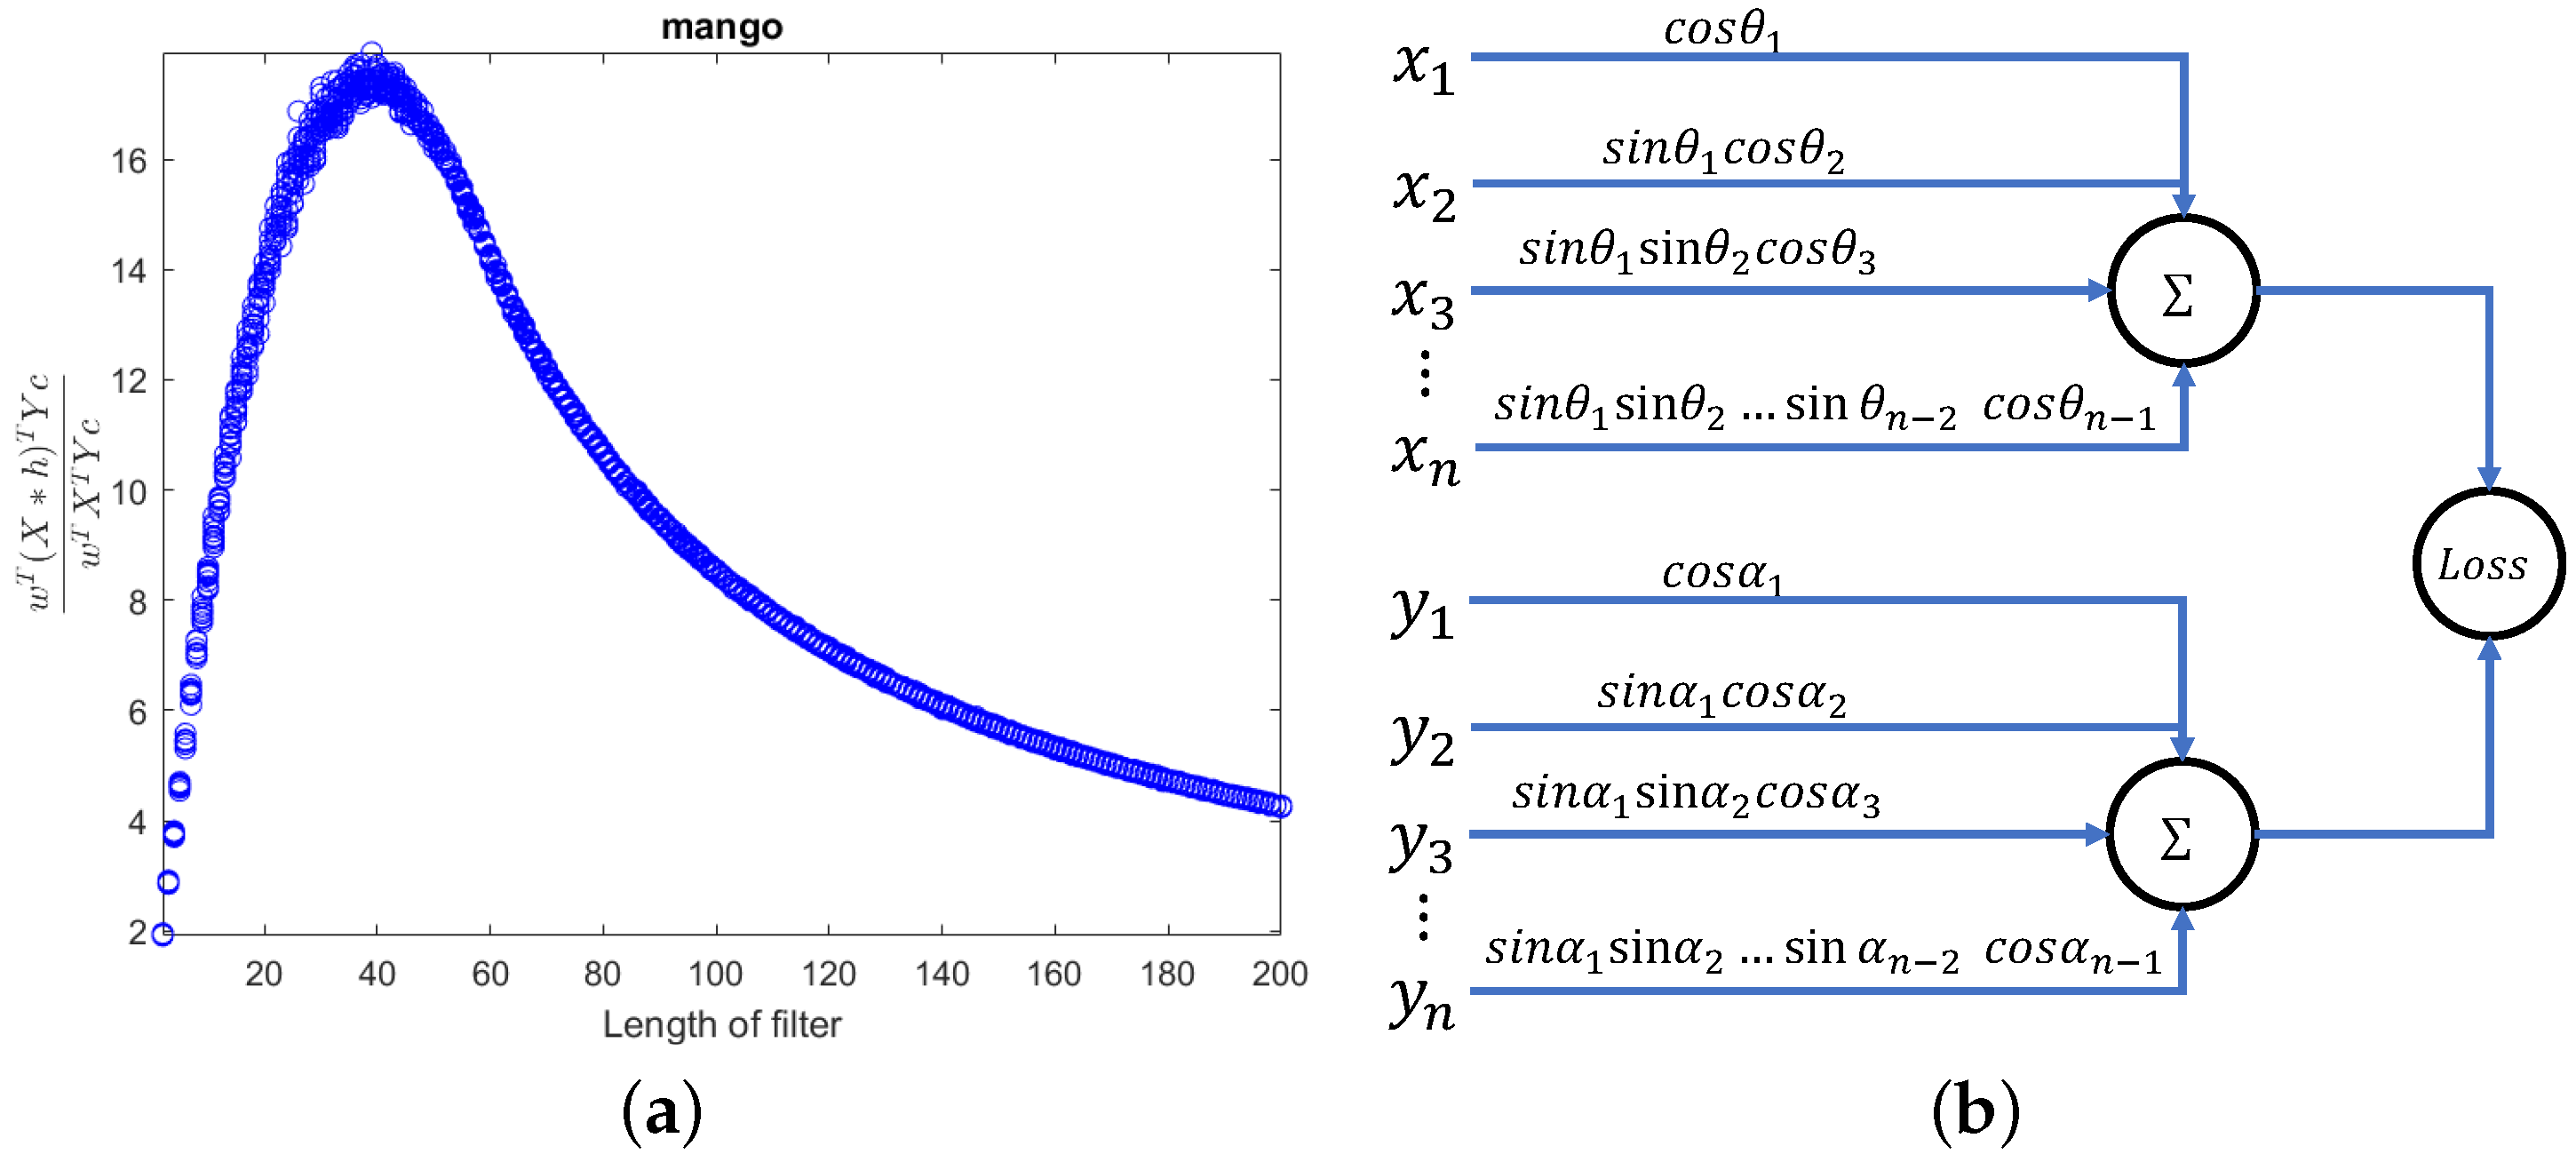
Figure 2.
As the length of the filter increases, the ratio varies. Due to the inability to satisfy the local smoothness of the spectral signal as the filter length increases, gradually moves away from upper bond N. The response Y represents the values for moisture, oil, protein, and starch, respectively.
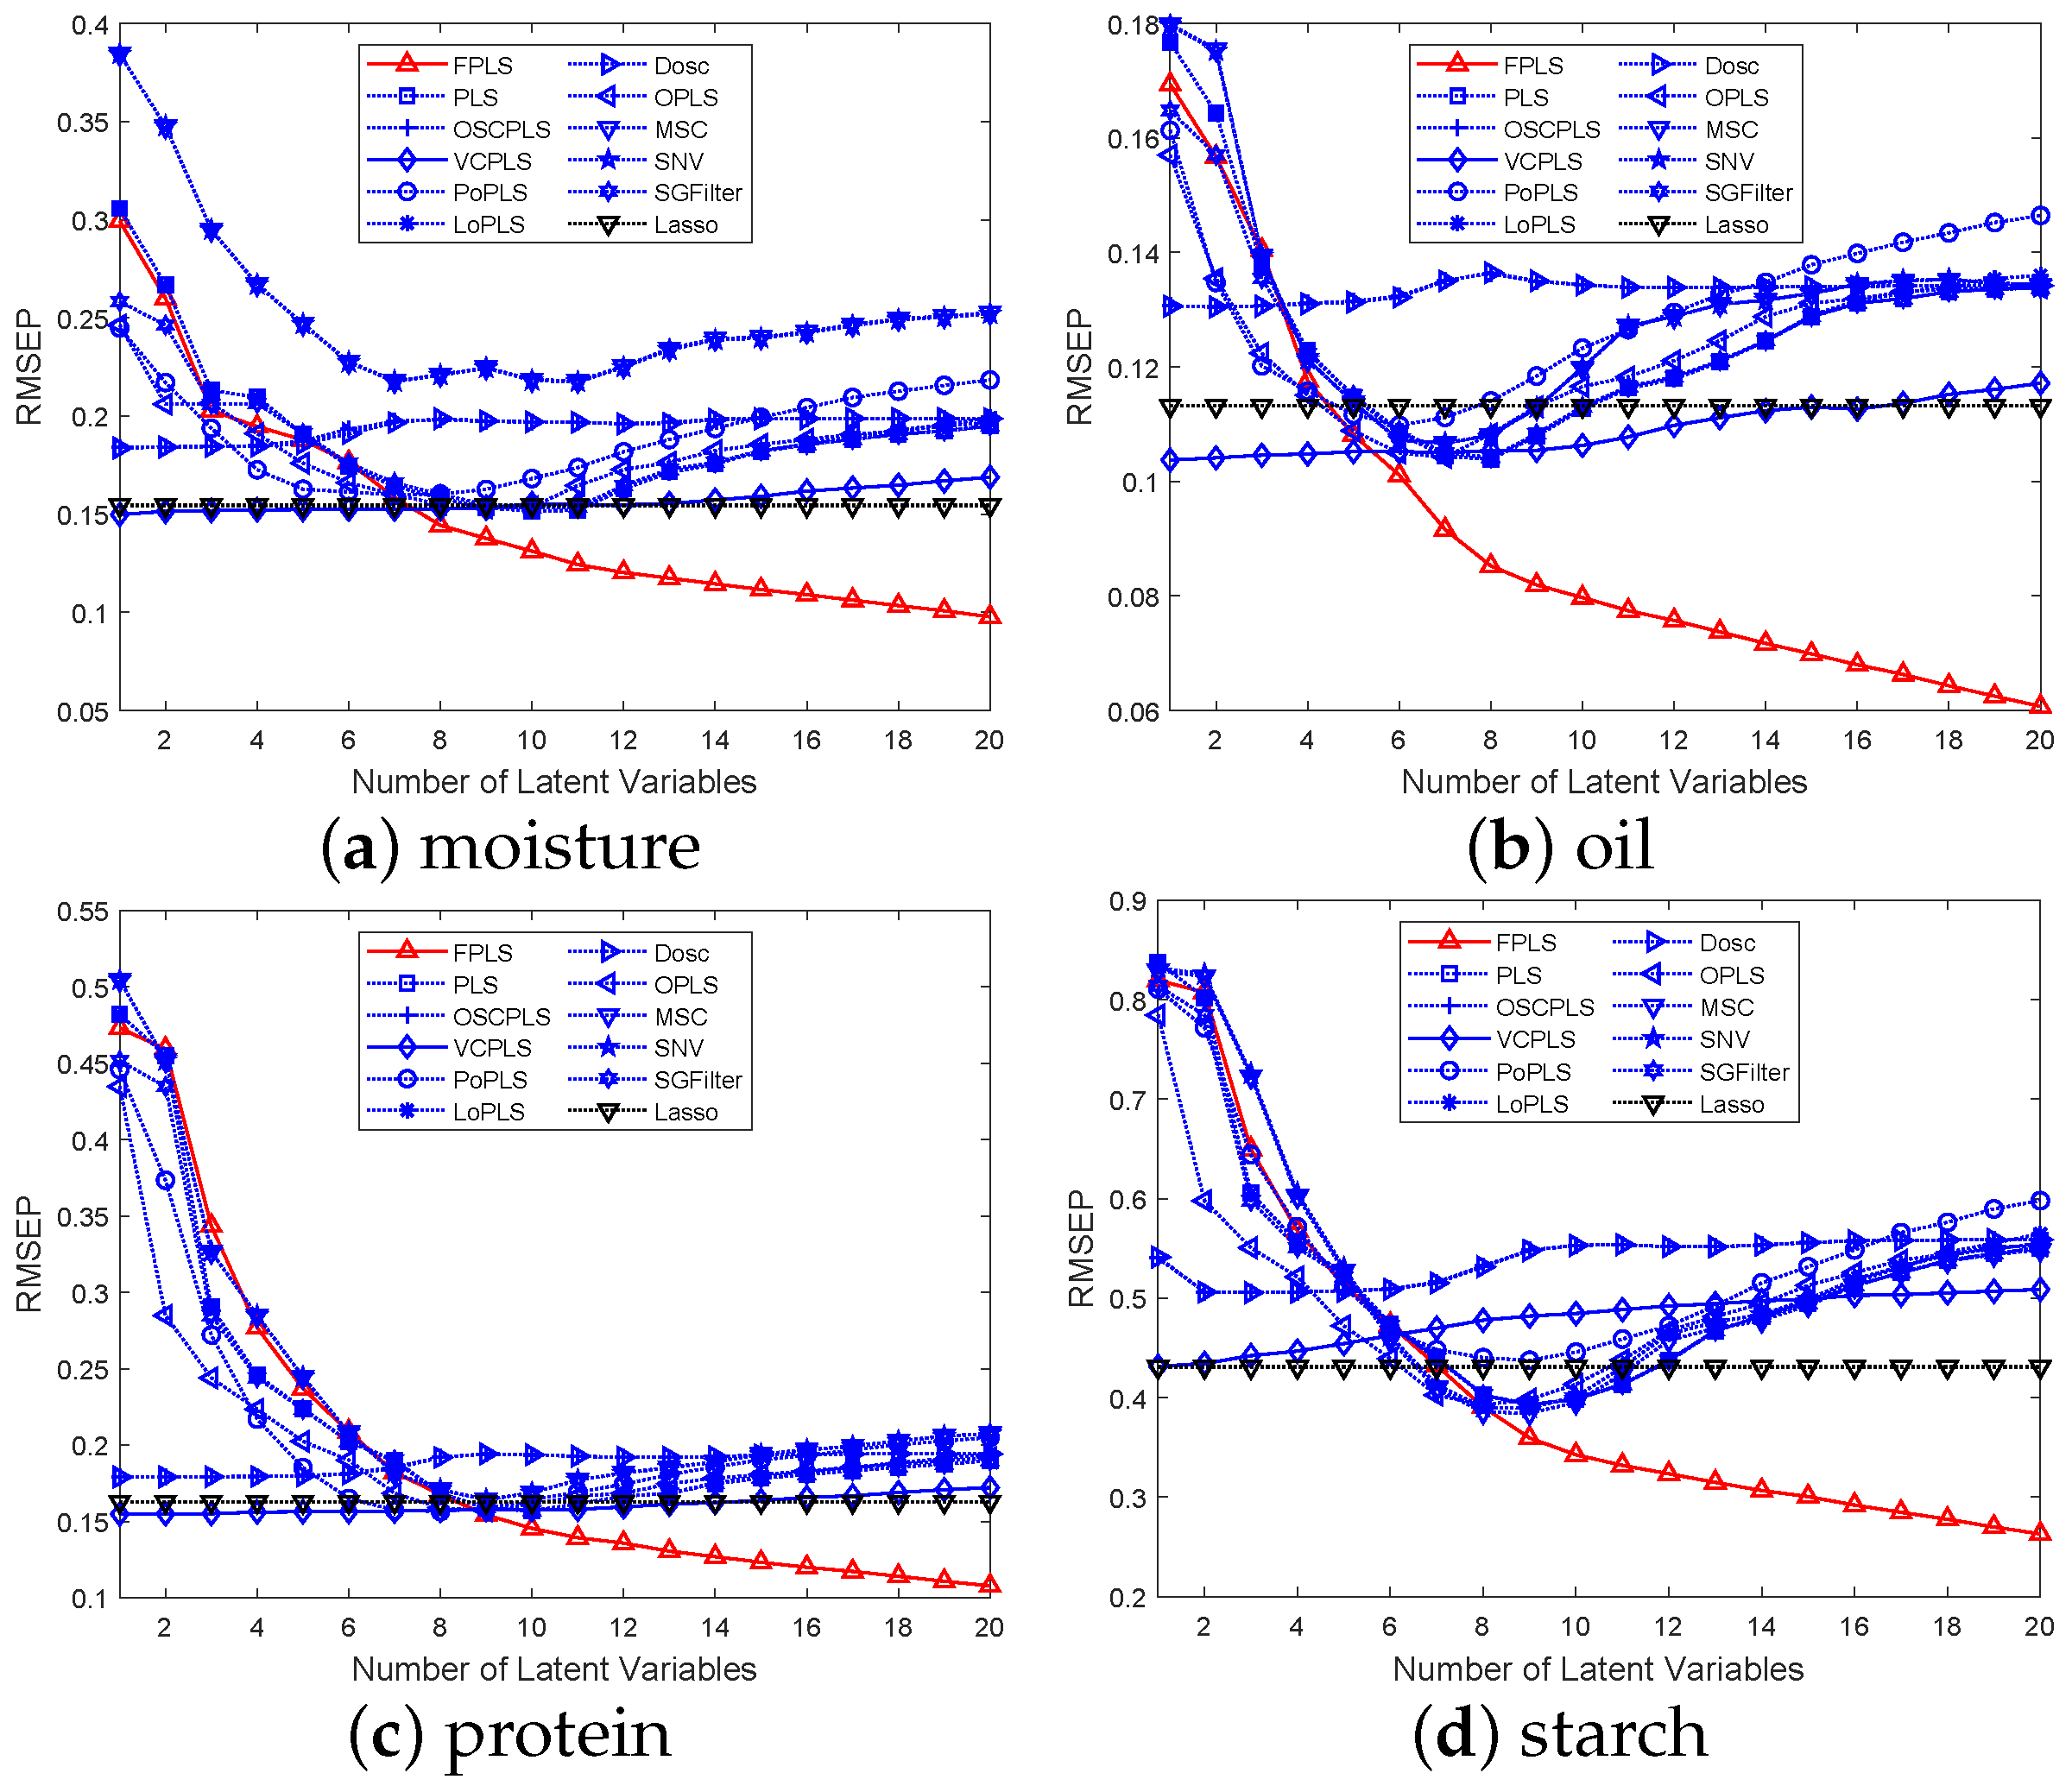
Figure 3.
RMSEP values for the prediction of moisture, oil, and protein content in Corn samples using various methods, including FPLS, PLS, OSCPLS, VCPLS, PoPLS, LoPLS, DOSC, OPLS, MSC, SNV, and SGFilter, with 1 to 20 components each.
Figure 3.
RMSEP values for the prediction of moisture, oil, and protein content in Corn samples using various methods, including FPLS, PLS, OSCPLS, VCPLS, PoPLS, LoPLS, DOSC, OPLS, MSC, SNV, and SGFilter, with 1 to 20 components each.
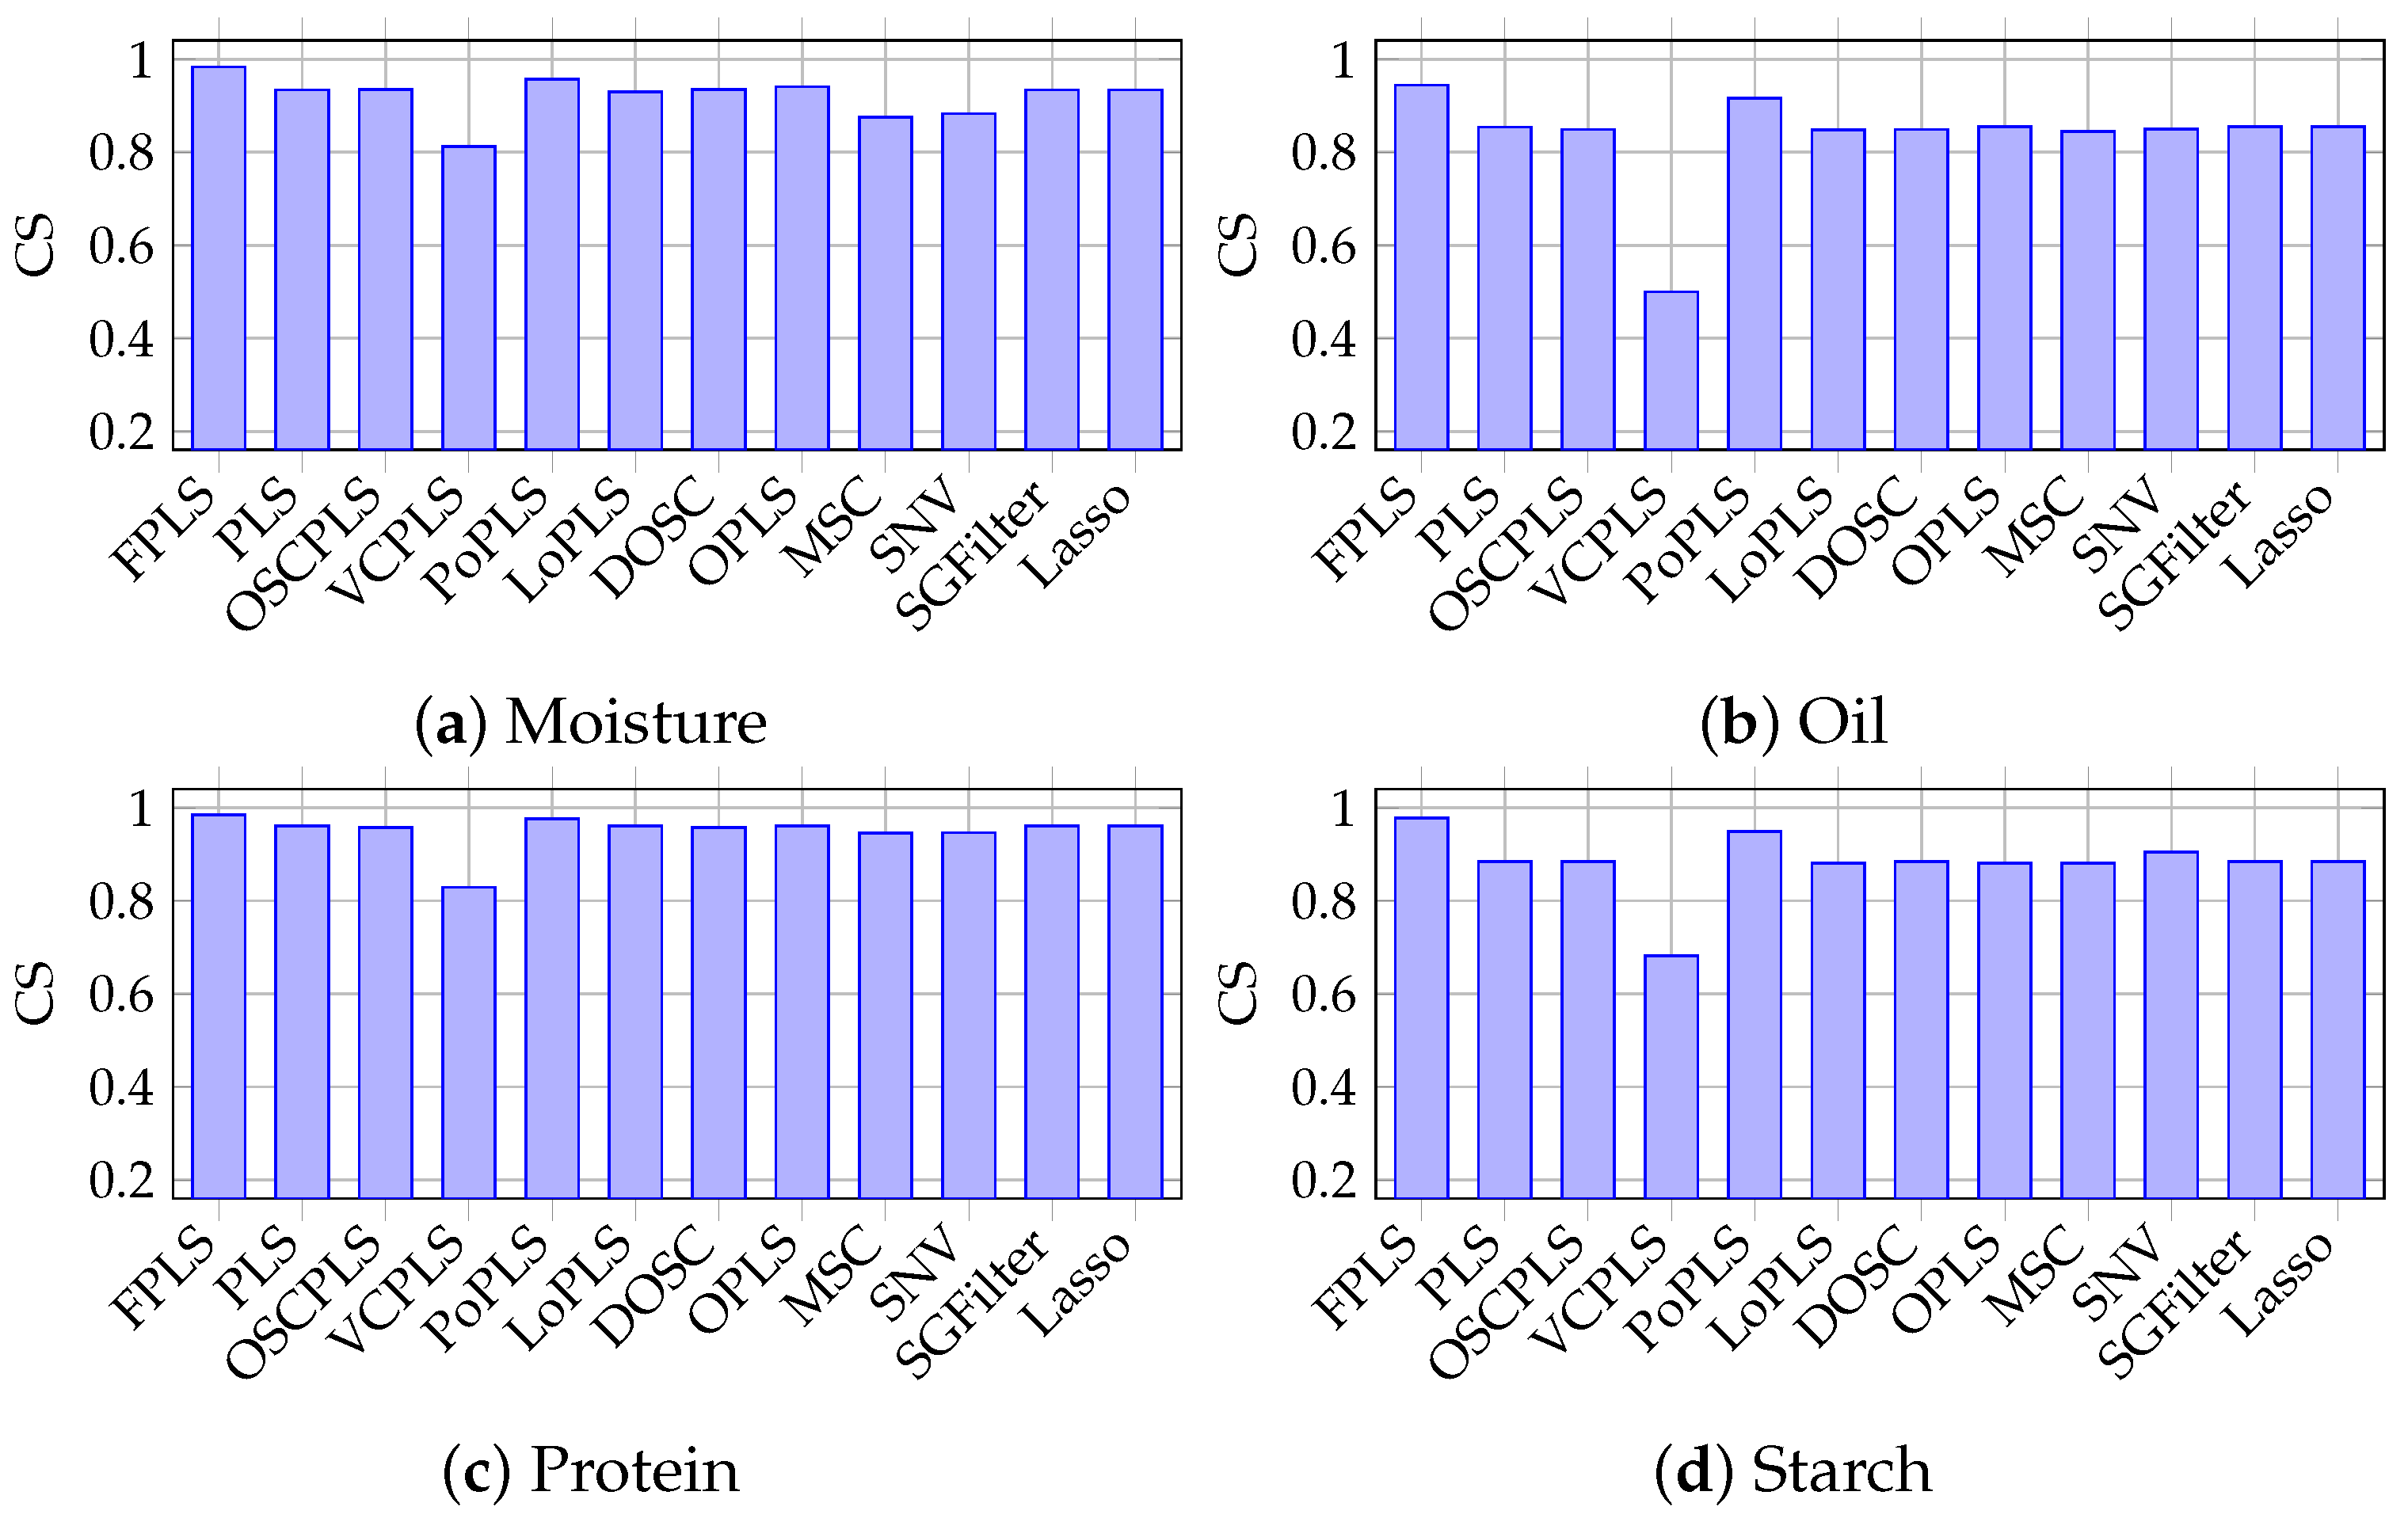
Figure 4.
Cosine Similarity between prediction results and response in moisture, oil, protein, and starch prediction using FPLS, PLS, OSCPLS, VCPLS, PoPLS, LoPLS, DOSC, OPLS, MSC, SNV, SGFilter, and Lasso.
Figure 4.
Cosine Similarity between prediction results and response in moisture, oil, protein, and starch prediction using FPLS, PLS, OSCPLS, VCPLS, PoPLS, LoPLS, DOSC, OPLS, MSC, SNV, SGFilter, and Lasso.
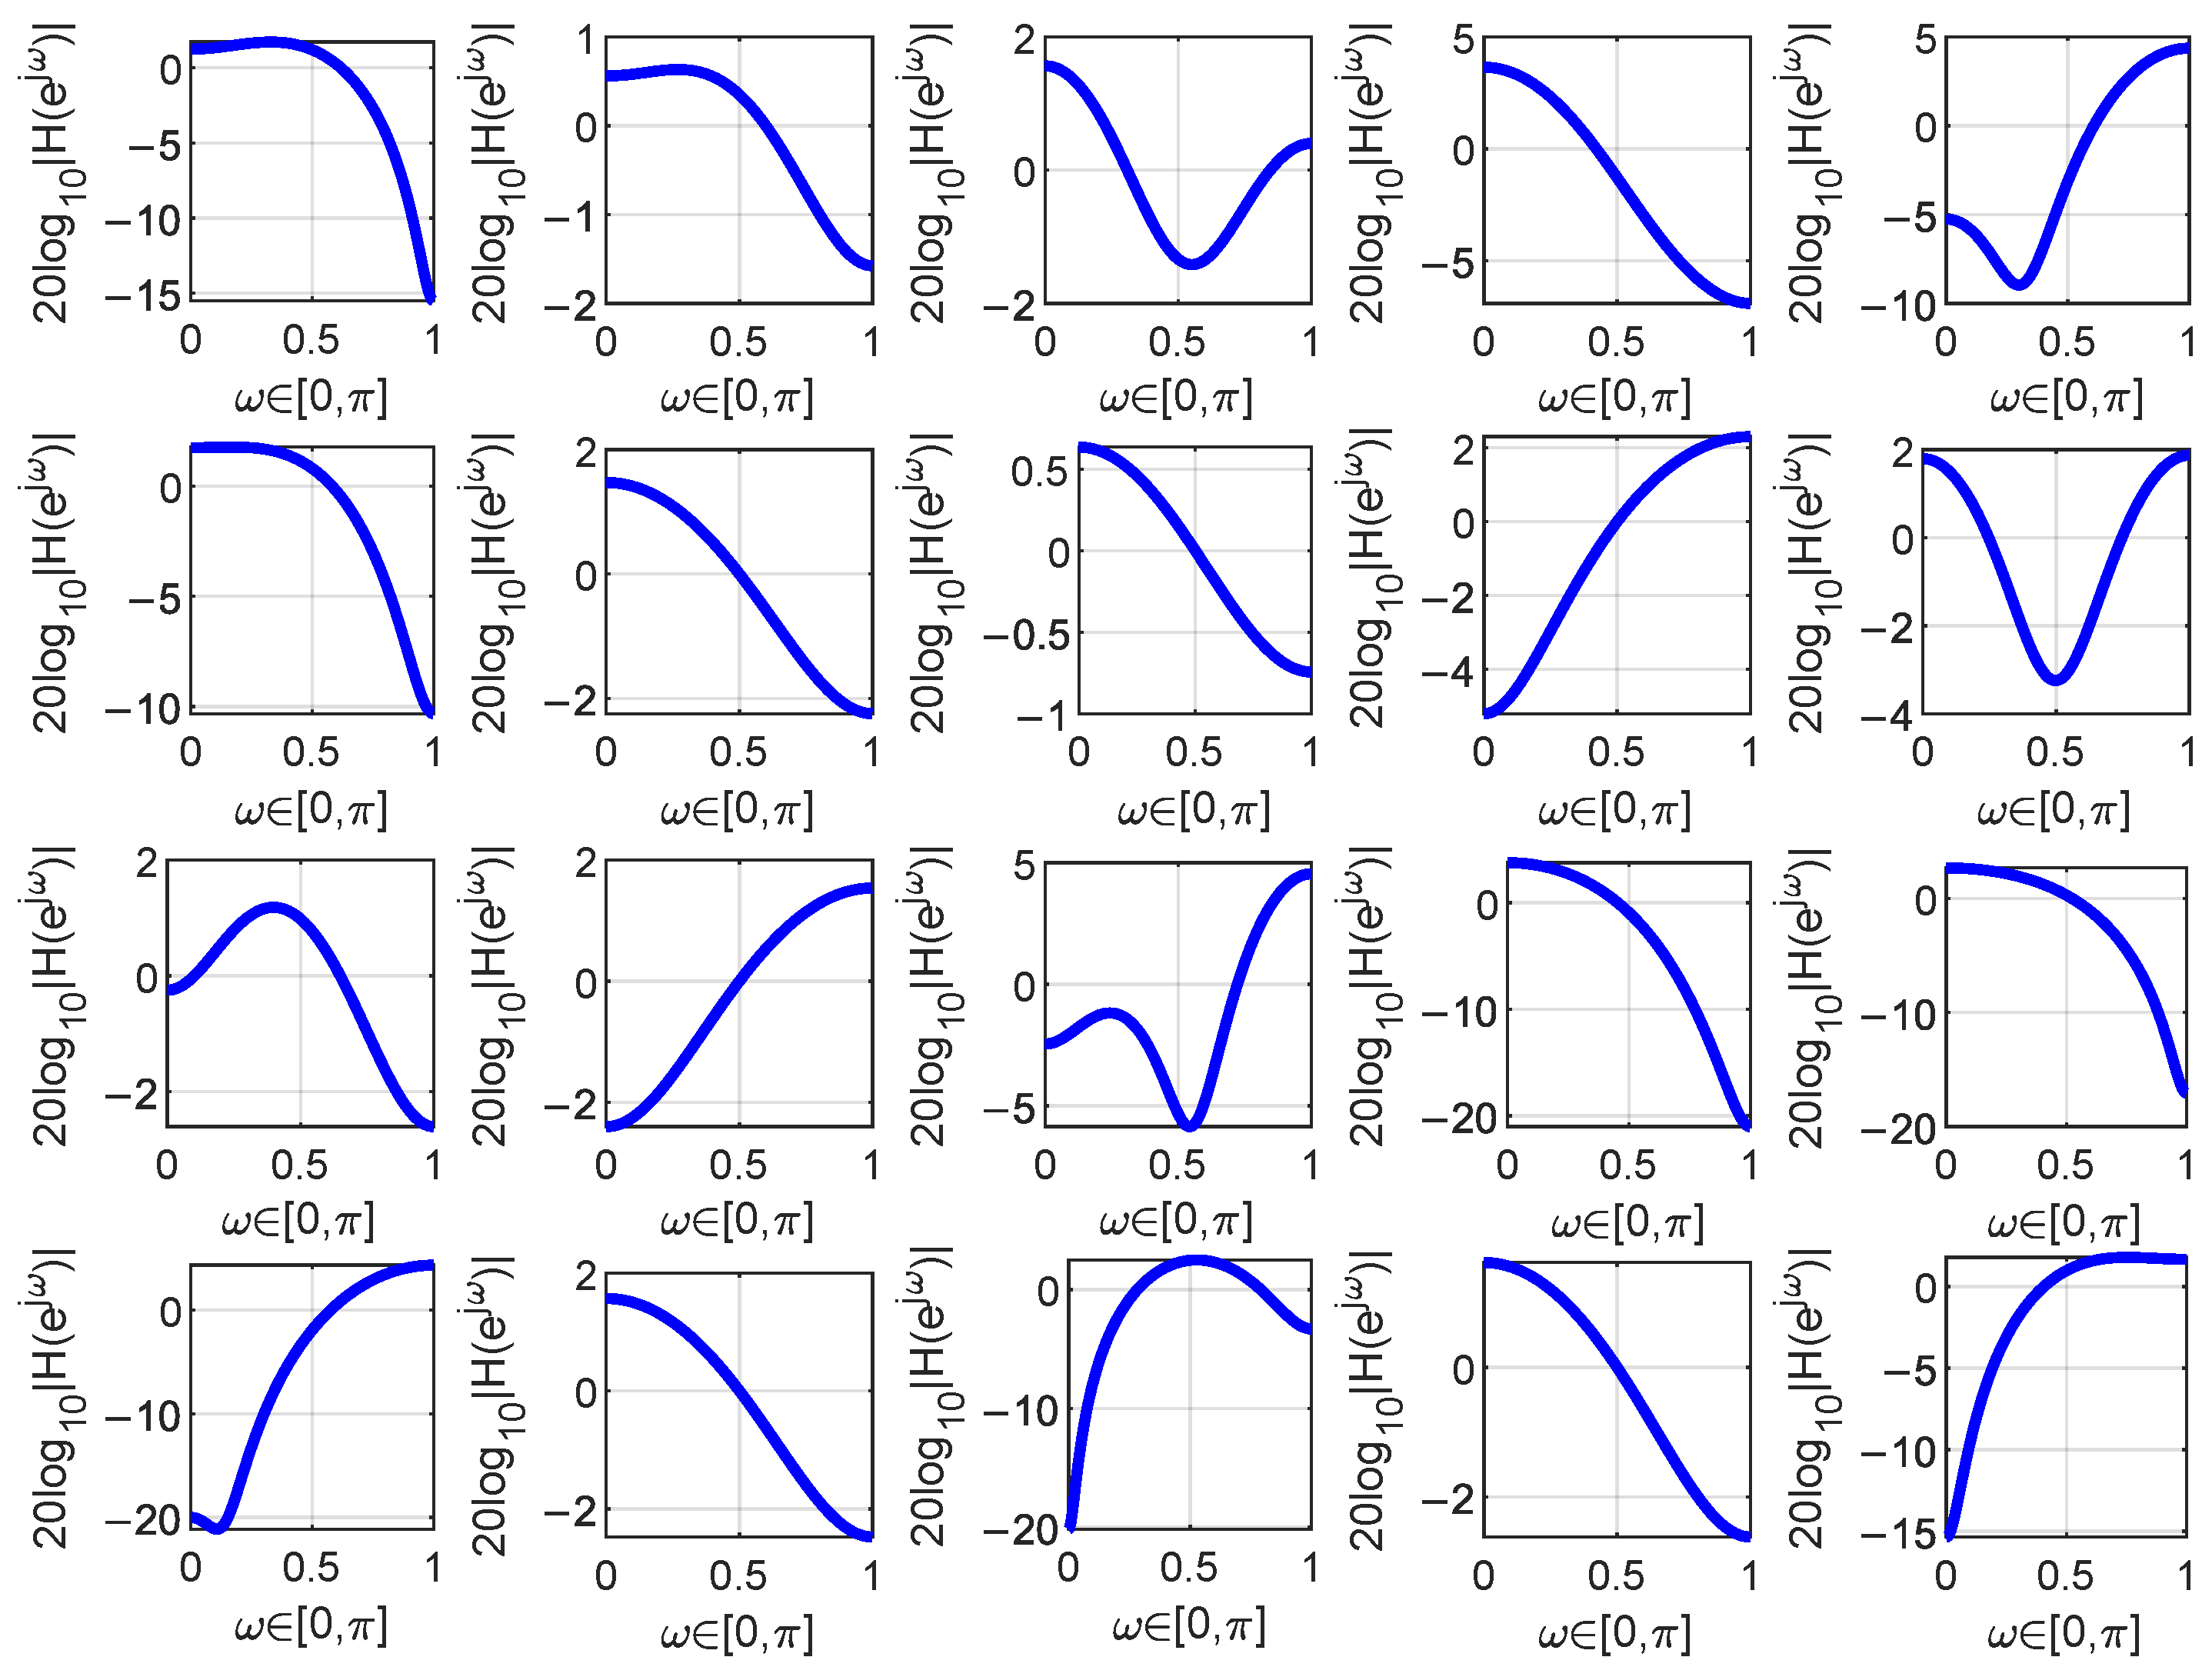
Figure 5.
The filters learned during one iteration when analyzing the moisture content in the Corn dataset are depicted. The blue curve in the figure represents the magnitude frequency response of the filter.
Figure 5.
The filters learned during one iteration when analyzing the moisture content in the Corn dataset are depicted. The blue curve in the figure represents the magnitude frequency response of the filter.
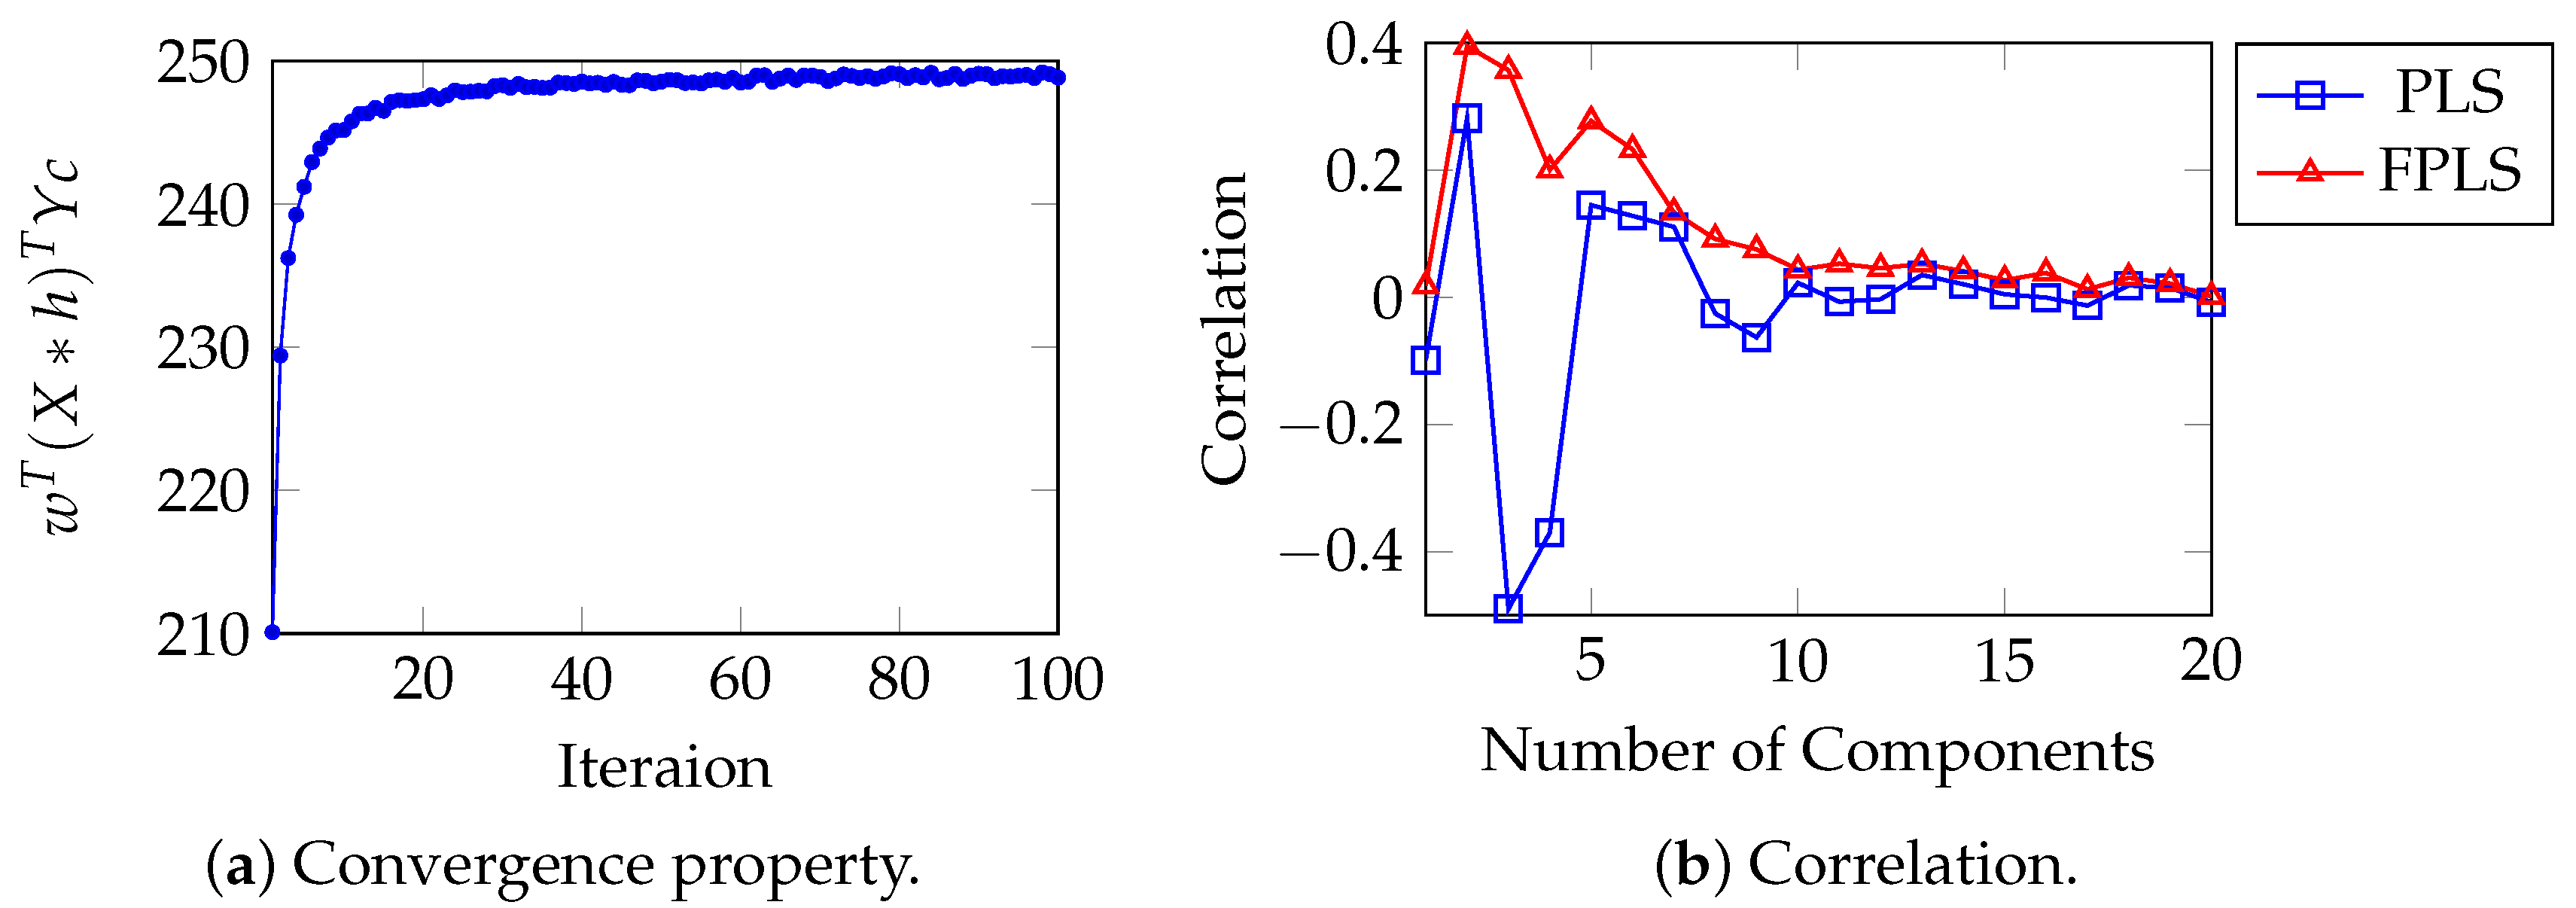
Figure 6.
(a) converges as iteration increases. (b) Correlation between the projection of the test samples of PLS, FPLS models on vector w, and the moisture content.
Figure 6.
(a) converges as iteration increases. (b) Correlation between the projection of the test samples of PLS, FPLS models on vector w, and the moisture content.
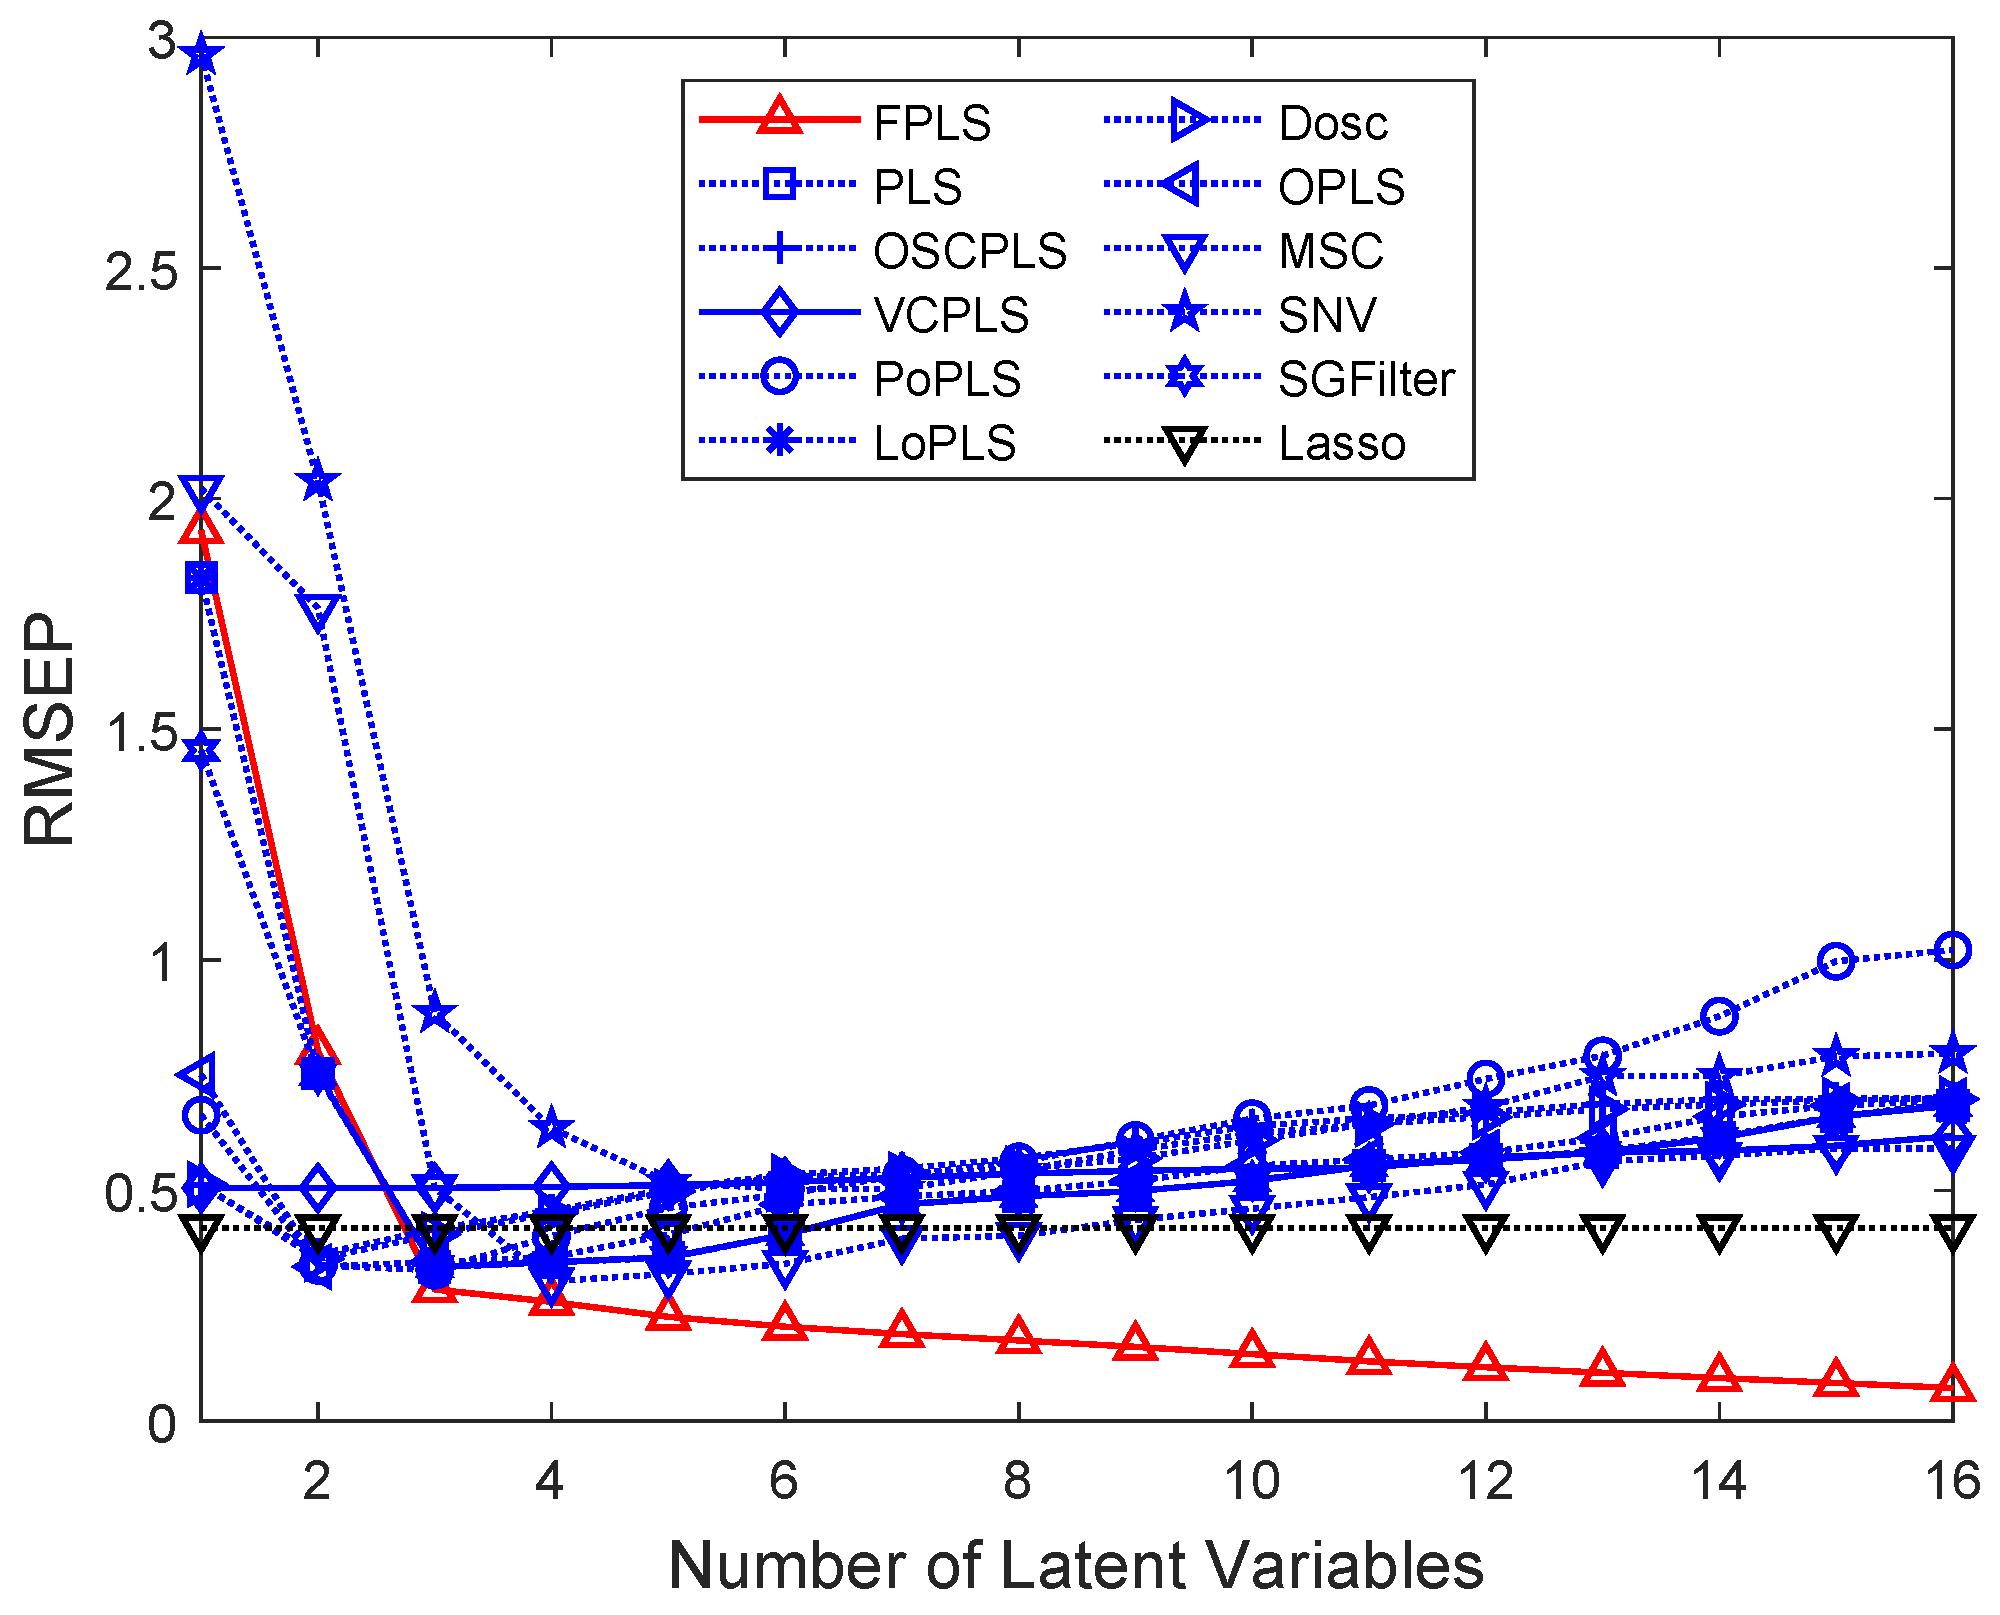
Figure 7.
RMSEP values of Octane prediction using FPLS, PLS, OSCPLS, VCPLS, PoPLS, LoPLS, DOSC, OPLS, MSC, SNV, and SGFilter models with 1–16 components. Lasso is different from the previous methods. It is a feature selection method. The horizontal axis in the RMSEP graph represents the number of random experiments for Lasso.
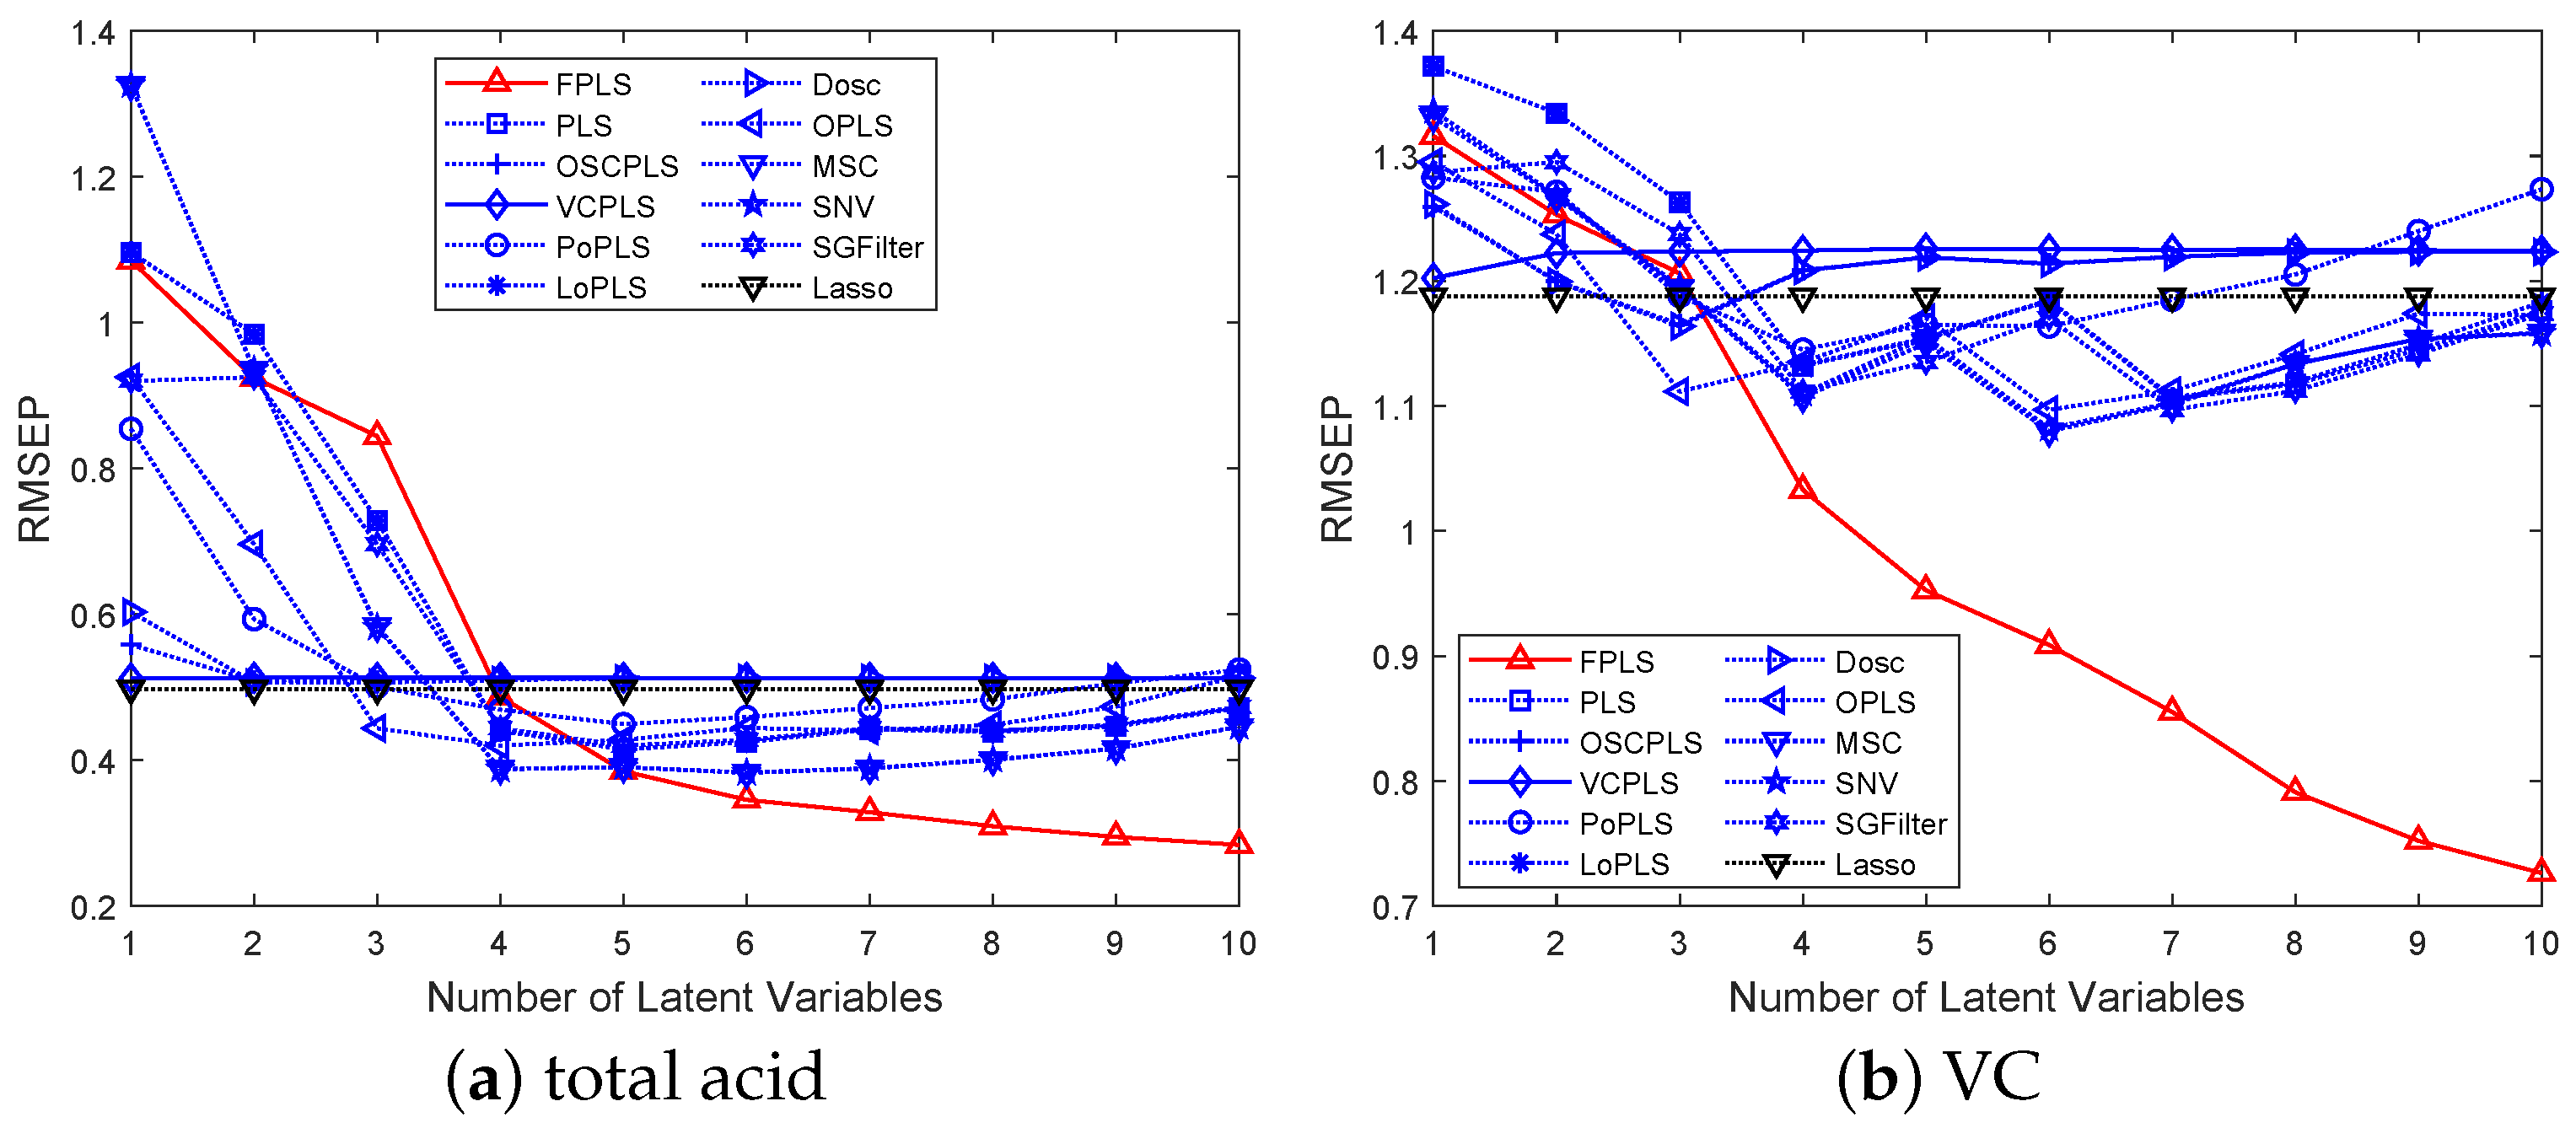
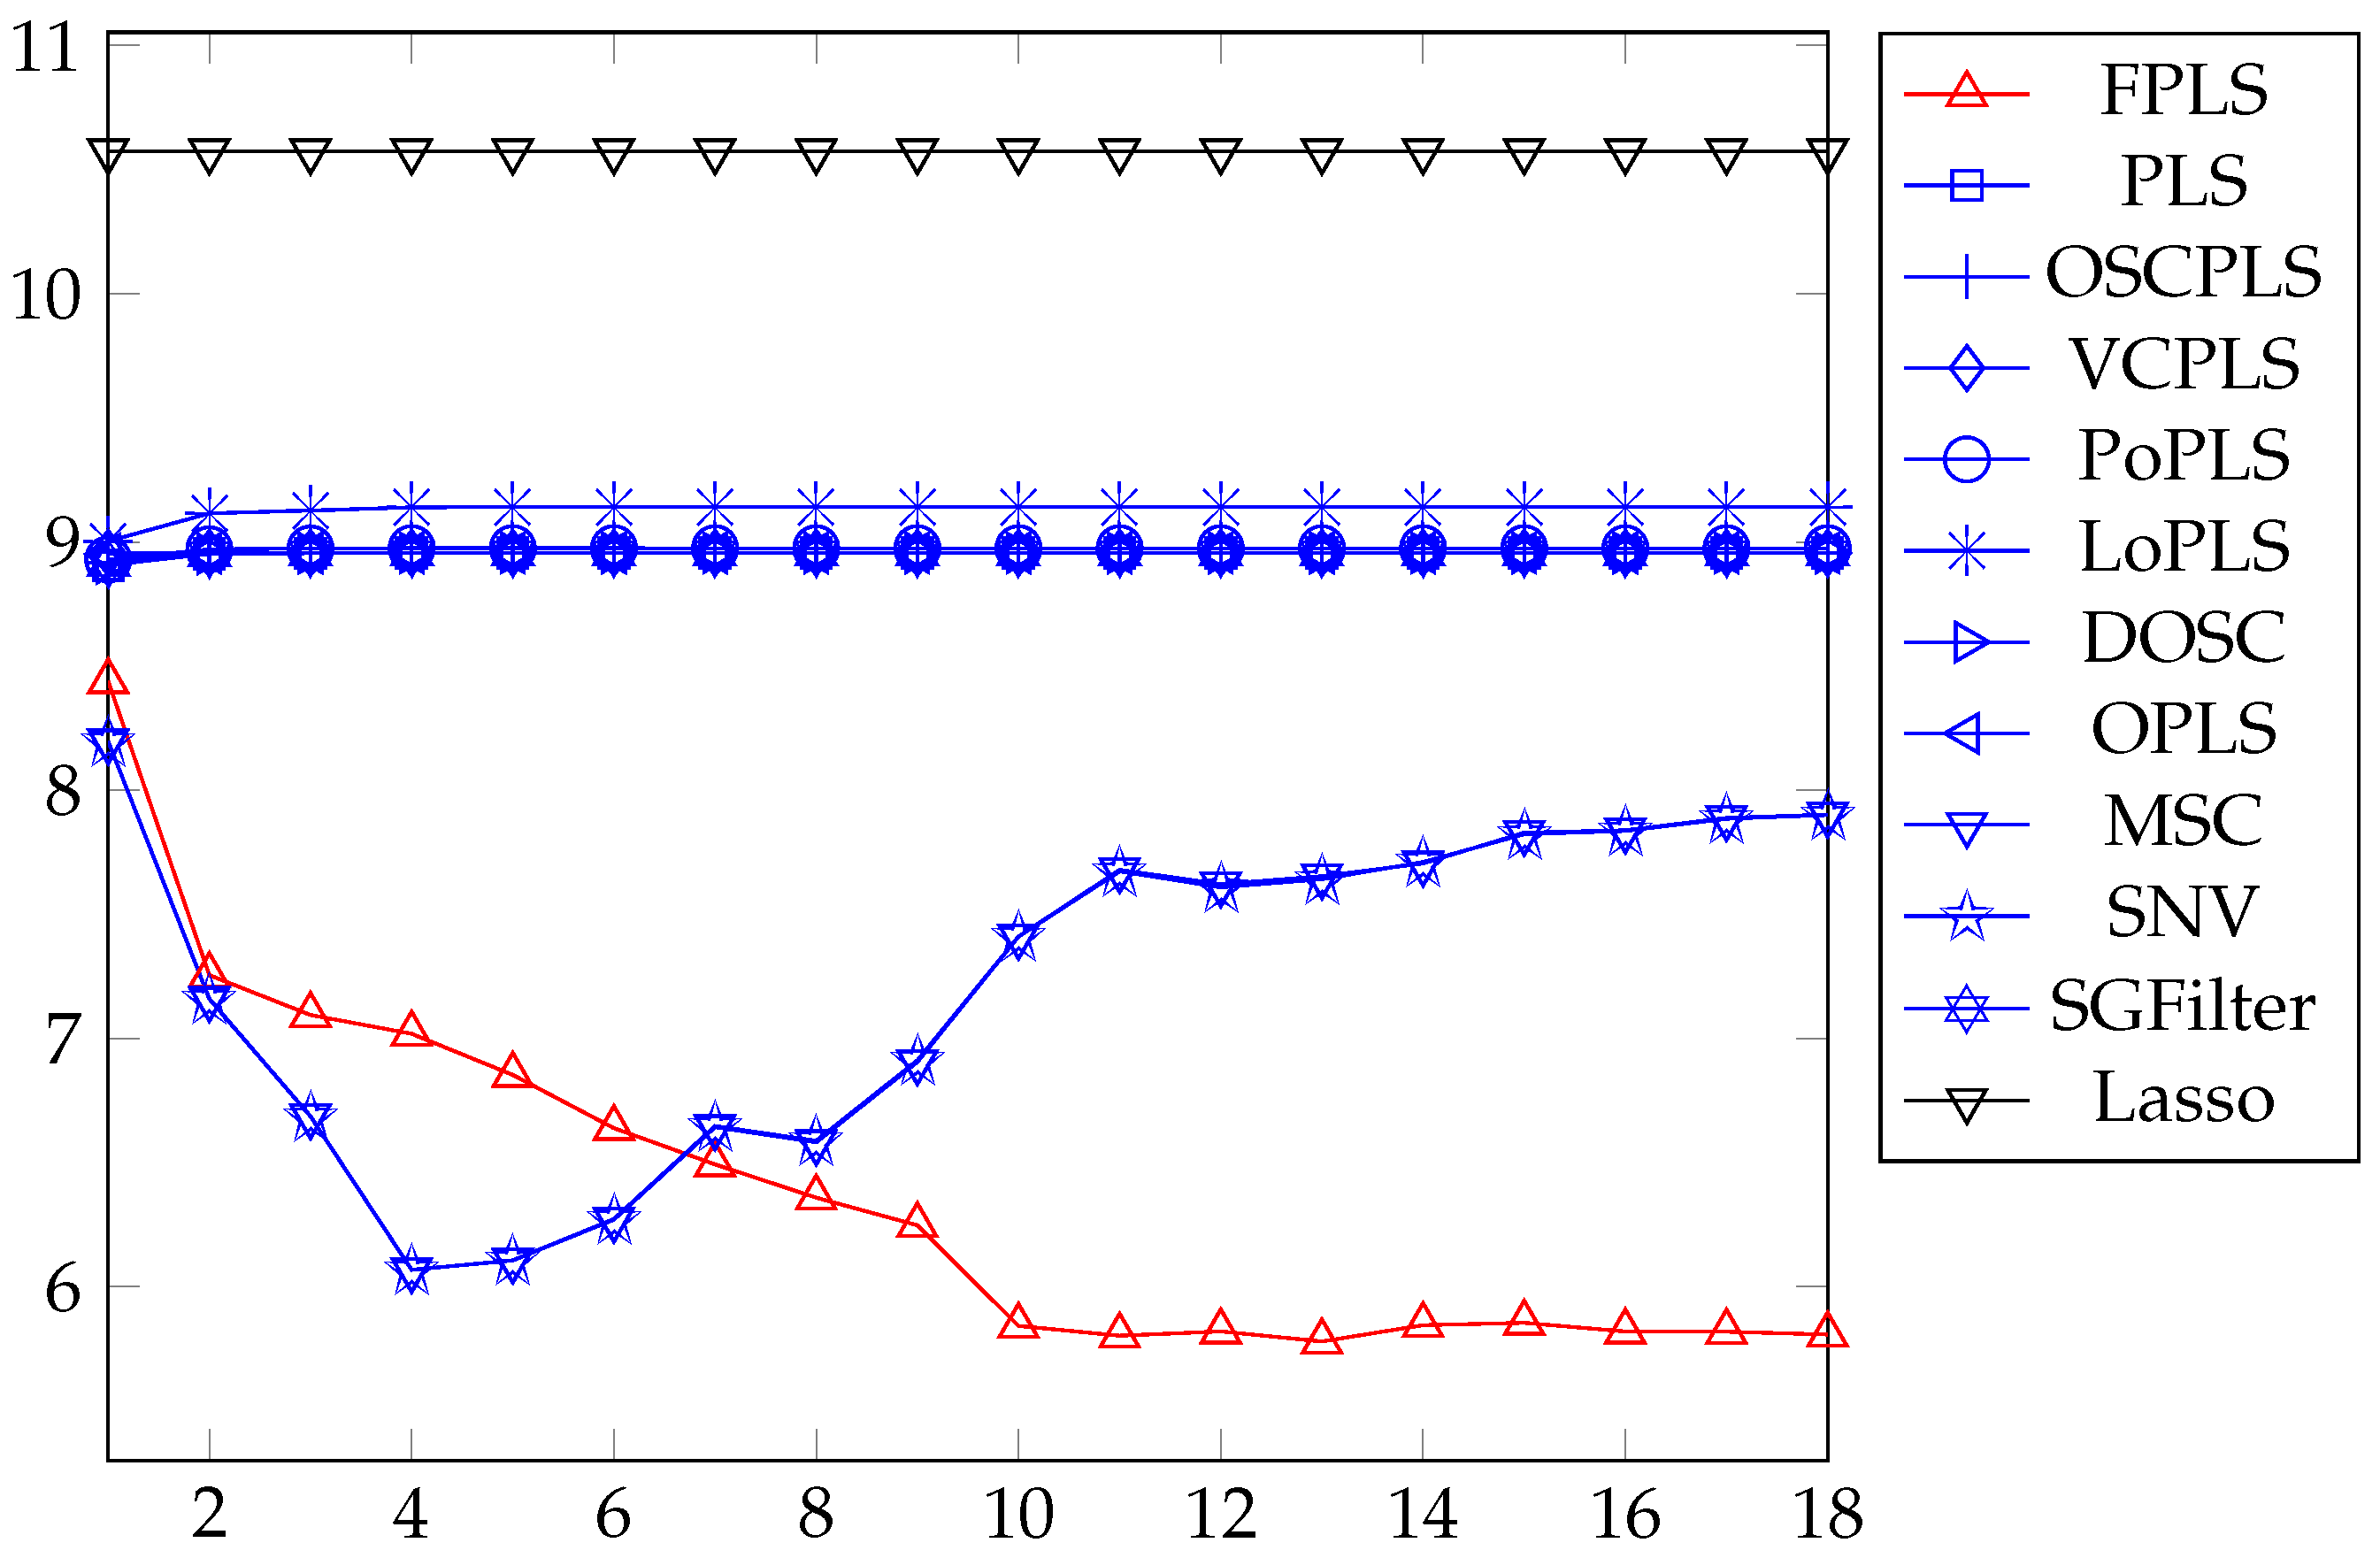
Figure 8.
RMSEP values of the TA and VC prediction using FPLS, PLS, OSCPLS, VCPLS, PoPLS, LoPLS, DOSC, OPLS, MSC, SNV, and SGFilter models with 1–10 components. Lasso is different from the previous methods. It is a feature selection method. The horizontal axis in the figure represents the number of random experiments for Lasso.
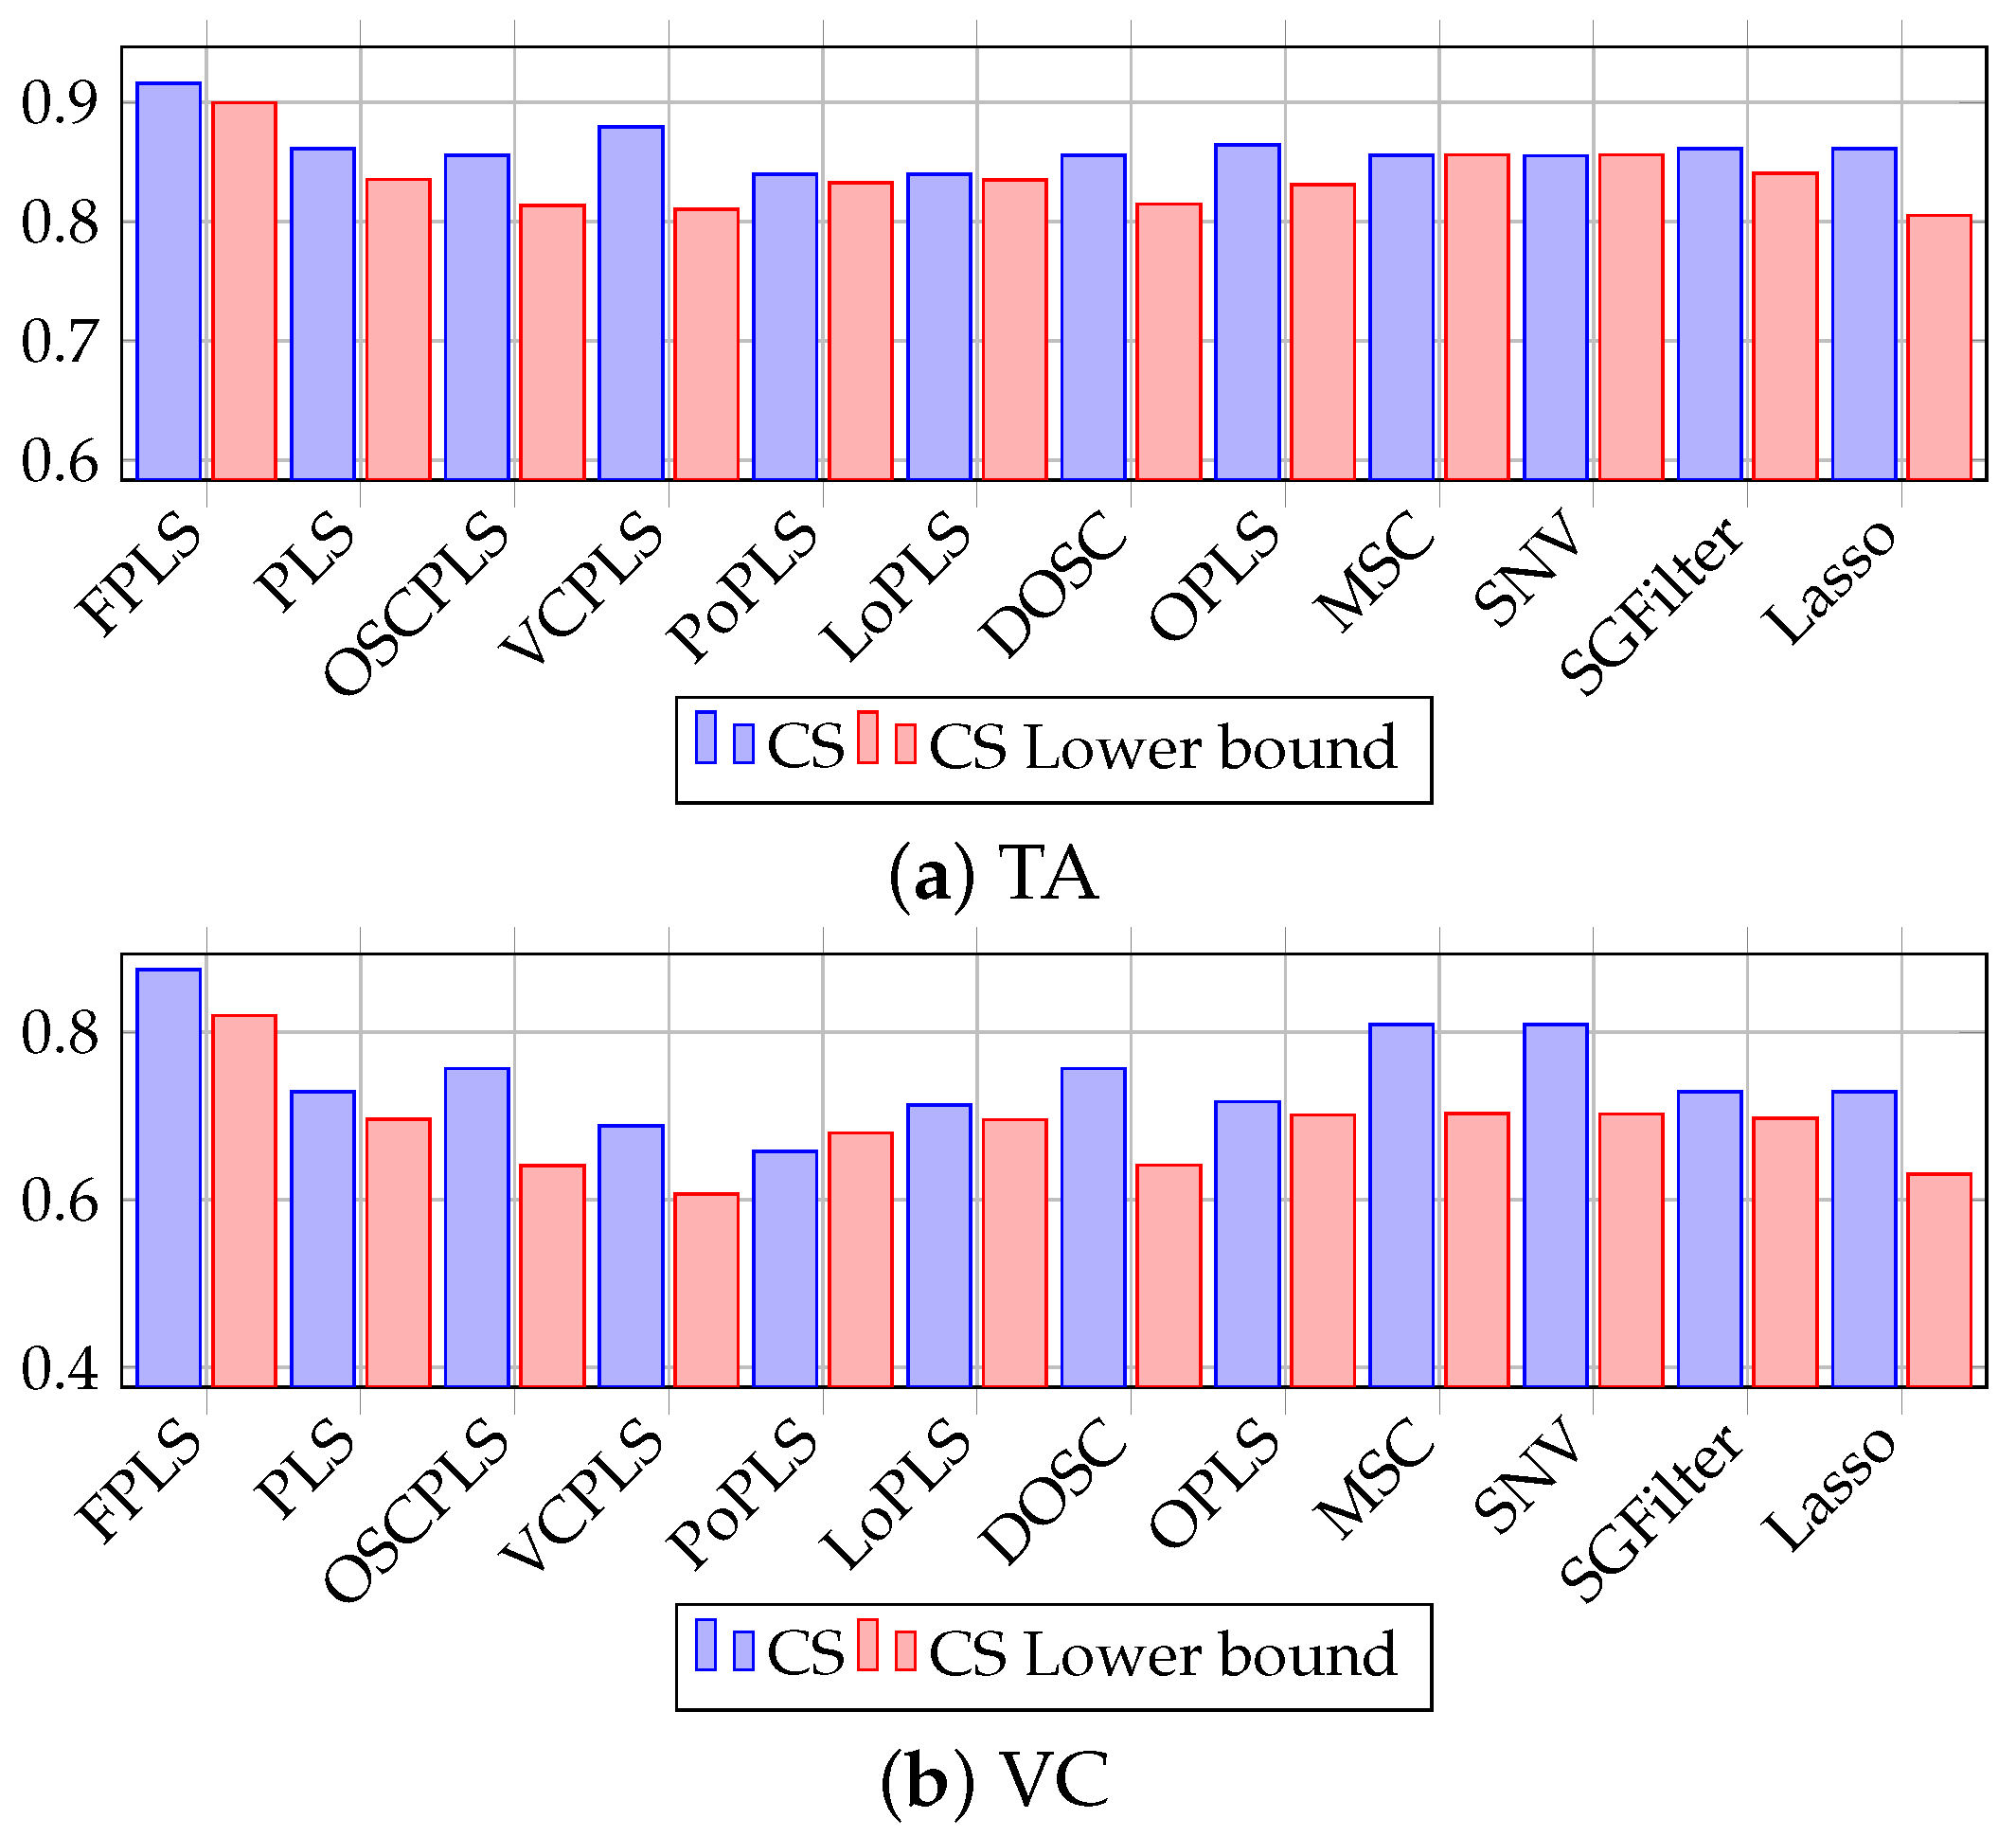
Figure 9.
CS plot of TA and VC prediction using FPLS, PLS, OSCPLS, VCPLS, PoPLS, LoPLS, DOSC, OPLS, MSC, SNV, SGFilter, and Lasso. The horizontal axis represents methods, while the vertical axis represents CS and its lower bound.
Figure 9.
CS plot of TA and VC prediction using FPLS, PLS, OSCPLS, VCPLS, PoPLS, LoPLS, DOSC, OPLS, MSC, SNV, SGFilter, and Lasso. The horizontal axis represents methods, while the vertical axis represents CS and its lower bound.
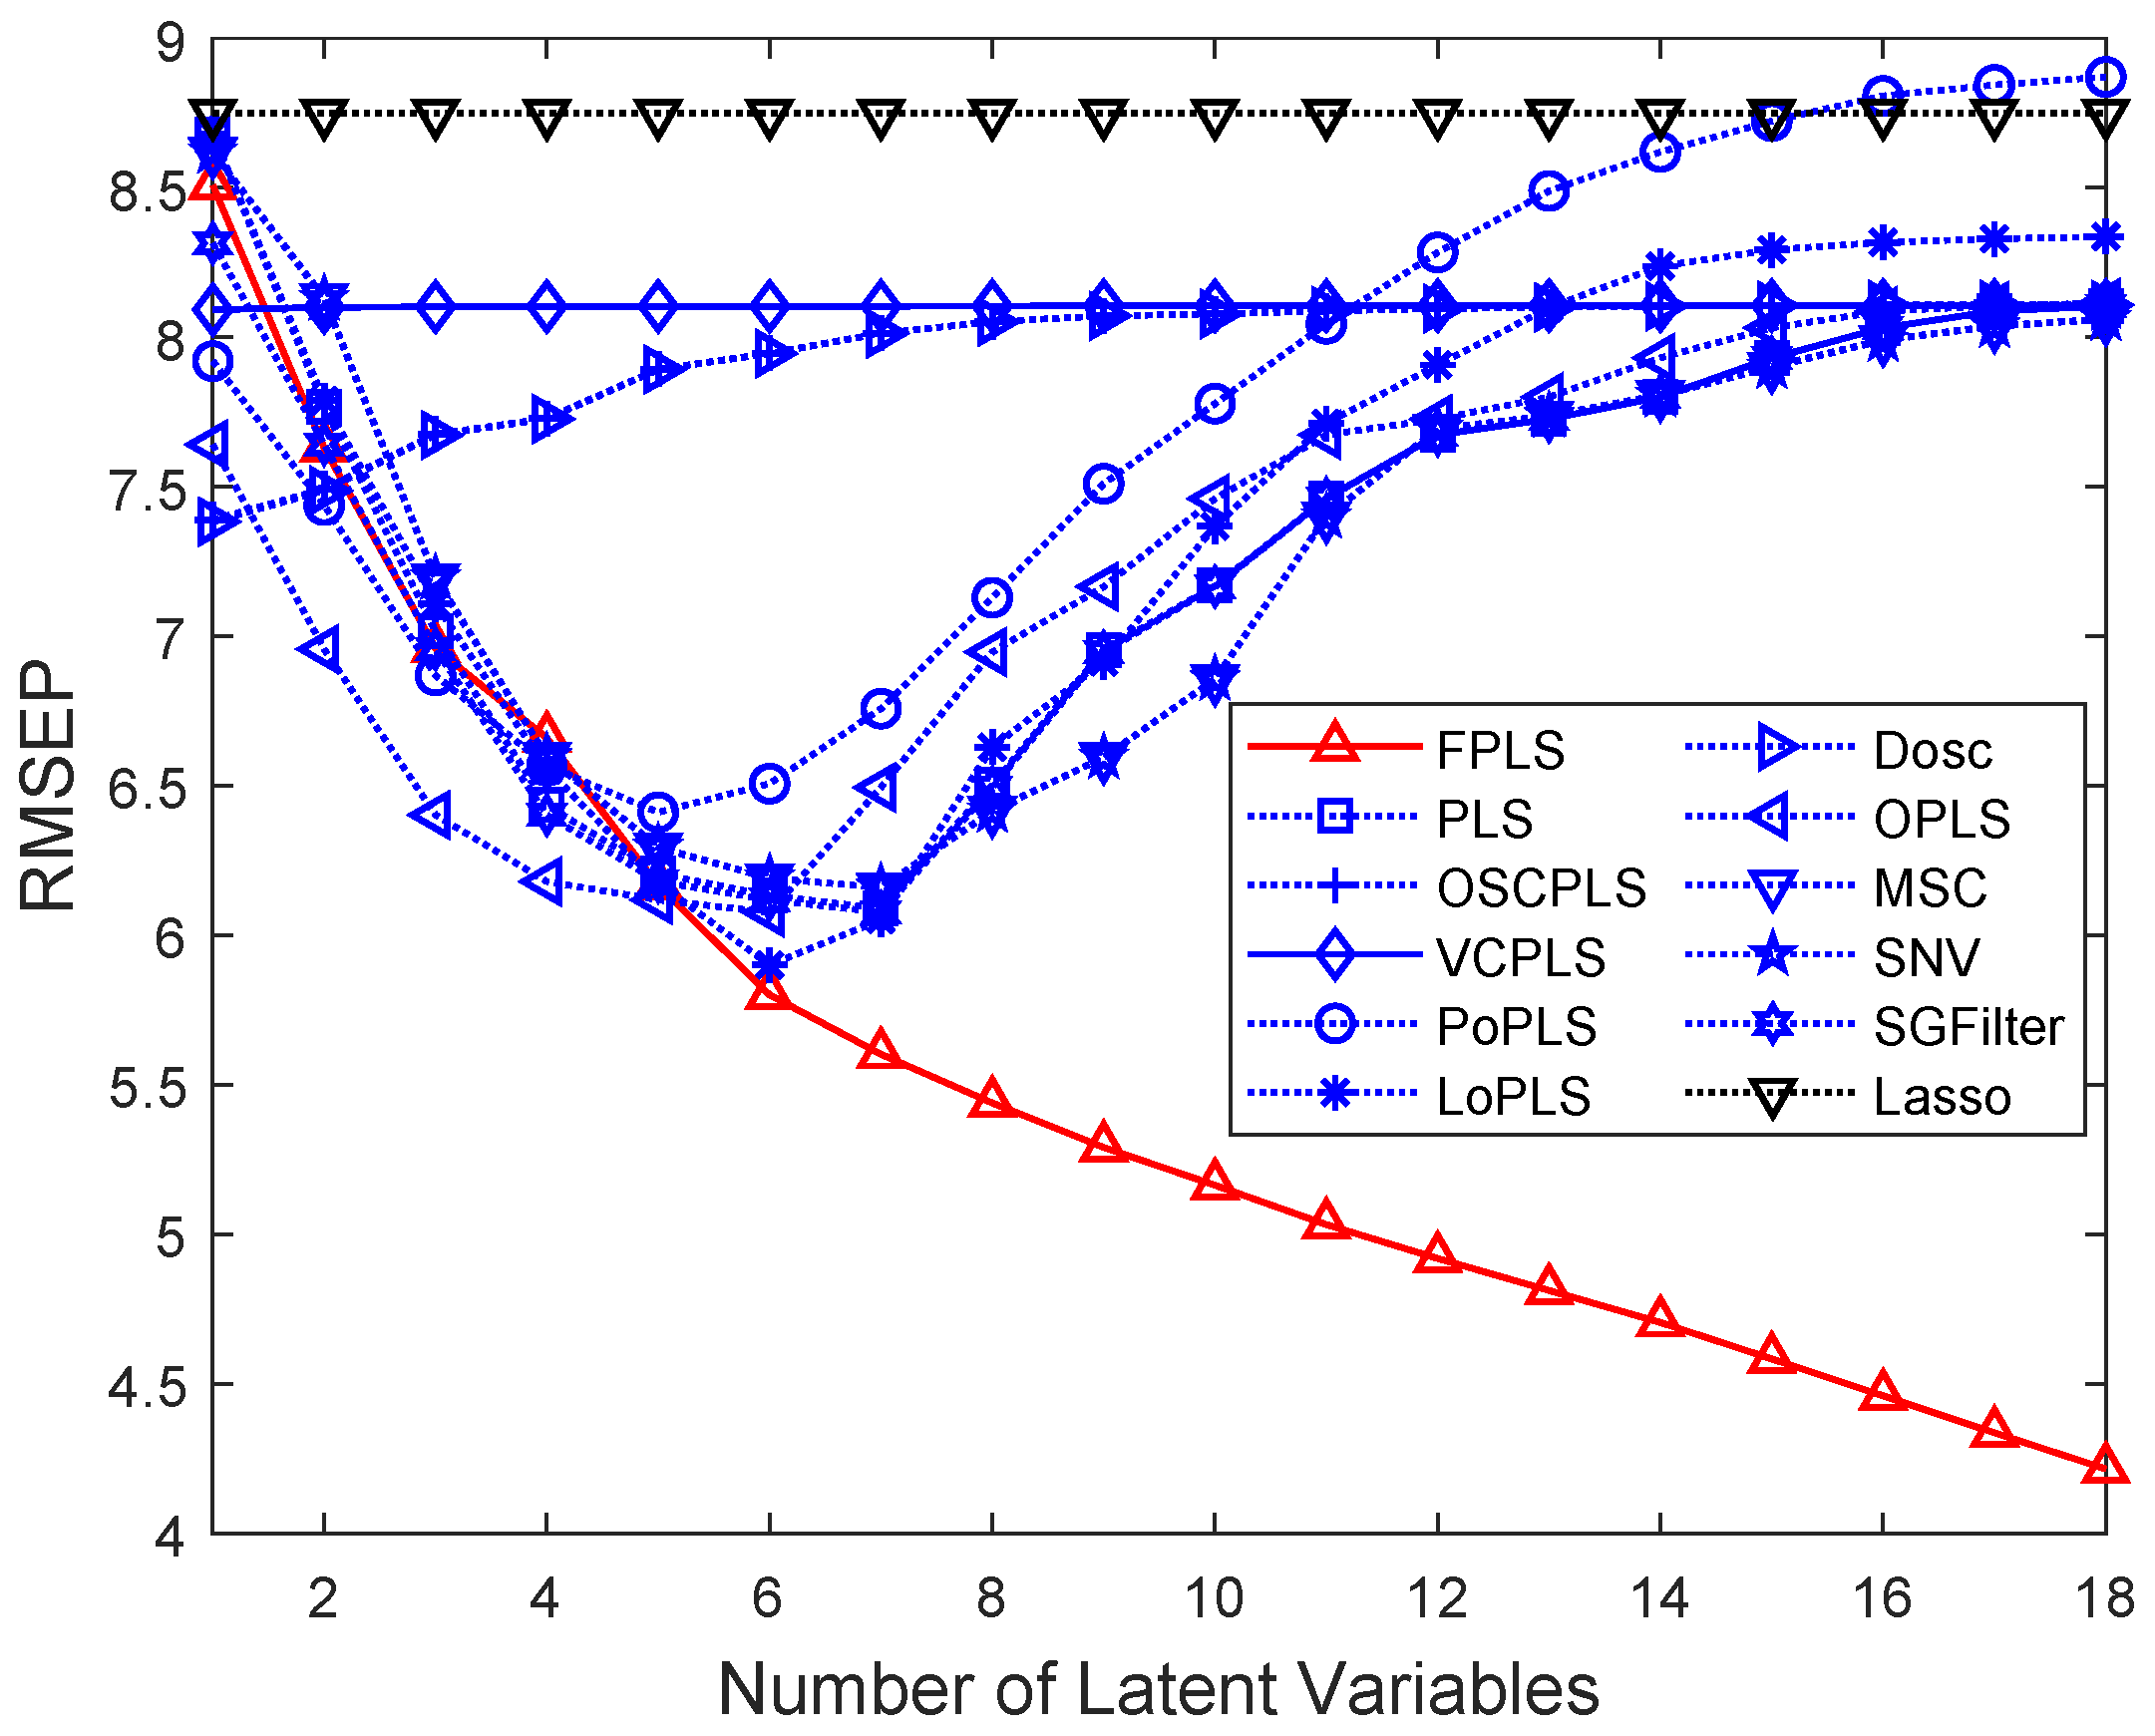
Figure 10.
RMSEP values of the prediction using FPLS, PLS, OSCPLS, VCPLS, PoPLS, LoPLS, DOSC, OPLS, MSC, SNV, and SGFilter models with 1–18 components. Lasso is different from the previous methods. It is a feature selection method. The horizontal axis in the figure represents the number of random experiments for Lasso.
Figure 11.
Experimental results with noise.
Figure 11.
Experimental results with noise.
Figure 12.
Issues that require further research. (a) Relationship between and filter length; (b) a potential network structure.
Figure 12.
Issues that require further research. (a) Relationship between and filter length; (b) a potential network structure.
Table 1.
Corn moisture, oil, protein, and starch prediction results in terms of RMSEP and variance.
Table 1.
Corn moisture, oil, protein, and starch prediction results in terms of RMSEP and variance.
| Method | Moisture | Oil | Protein | Starch |
|---|
| RMSEP
| Variance
| RMSEP
| Variance
| RMSEP
| Variance
| RMSEP
| Variance
|
|---|
| FPLS | 0.0977 (20) | 0.0007 | 0.0601 (20) | 0.0002 | 0.1069 (20) | 0.0010 | 0.2521 (20) | 0.0045 |
| PLS | 0.1516 (10) | 0.0007 | 0.1026 (7) | 0.0002 | 0.1583 (10) | 0.0011 | 0.3929 (9) | 0.0045 |
| OSCPLS | 0.1840 (1) | 0.0006 | 0.1299 (1) | 0.0003 | 0.1788 (2) | 0.0012 | 0.5059 (4) | 0.0152 |
| VCPLS | 0.1498 (1) | 0.0003 | 0.1027 (1) | 0.0002 | 0.1549 (1) | 0.0004 | 0.3877 (2) | 0.0021 |
| PoPLS | 0.1598 (7) | 0.0012 | 0.1085 (6) | 0.0003 | 0.1574 (8) | 0.0018 | 0.4301 (9) | 0.0058 |
| LoPLS | 0.1516 (10) | 0.0007 | 0.2272 (7) | 0.0002 | 0.1583 (10) | 0.0011 | 0.3927 (9) | 0.0045 |
| DOSC | 0.1837 (1) | 0.0006 | 0.1297 (1) | 0.0003 | 0.1788 (2) | 0.0012 | 0.5057 (4) | 0.0154 |
| OPLS | 0.1533 (9) | 0.0015 | 0.1029 (6) | 0.0003 | 0.1585 (9) | 0.0024 | 0.3926 (8) | 0.0121 |
| MSC | 0.2179 (7) | 0.0009 | 0.1067 (7) | 0.0017 | 0.1642 (9) | 0.0012 | 0.3843 (9) | 0.0314 |
| SNV | 0.2174 (11) | 0.0009 | 0.1067 (7) | 0.0017 | 0.1642 (9) | 0.0012 | 0.3896 (9) | 0.0317 |
| SGFilter | 0.1533 (10) | 0.0012 | 0.1042 (8) | 0.0003 | 0.1569 (9) | 0.0019 | 0.3925 (9) | 0.0353 |
| Lasso | 0.1545 (1) | 0.0004 | 0.1123 (1) | 0.0002 | 0.1629 (1) | 0.0006 | 0.4290 (1) | 0.0041 |
Table 2.
Upper and lower boundaries of RMSEP and CS. In this experiment on Corn moisture prediction, the lower and upper bounds of RMSEP and the lower bound of CS are provided. In this table, “Lower RMSEP” and “Upper RMSEP” denote the respective lower and upper boundaries of RMSEP, while “Lower CS” signifies the lower boundary of CS.
| Method | RMSEP | CS | Lower RMSEP | Upper RMSEP | Lower CS |
|---|
| FPLS | 0.0977 | 0.9834 | 0.0052 | 0.5363 | 0.9691 |
| PLS | 0.1516 | 0.9343 | 0.0199 | 0.5531 | 0.9237 |
| OSCPLS | 0.1840 | 0.9347 | 0.0198 | 0.5529 | 0.8854 |
| VCPLS | 0.1498 | 0.8124 | 0.0533 | 0.6049 | 0.9256 |
| PoPLS | 0.1598 | 0.9576 | 0.0130 | 0.5448 | 0.9149 |
| LoPLS | 0.1516 | 0.9298 | 0.0212 | 0.5547 | 0.9237 |
| DOSC | 0.1837 | 0.9347 | 0.0198 | 0.5529 | 0.8858 |
| OPLS | 0.1533 | 0.9407 | 0.0180 | 0.5507 | 0.9219 |
| MSC | 0.2179 | 0.8760 | 0.0365 | 0.5758 | 0.8348 |
| SNV | 0.2174 | 0.8828 | 0.0346 | 0.5730 | 0.8356 |
| SGFilter | 0.1533 | 0.9344 | 0.0199 | 0.5530 | 0.9219 |
| Lasso | 0.1545 | 0.9344 | 0.0199 | 0.5530 | 0.9207 |
Table 3.
Quantitative analysis results in terms of RMSEP, prediction variance, Lower and Upper boundaries of RMSEP and lower boundary of CS. The proposed FPLS is compared to PLS, OSCPLS, VCPLS, PoPLS, LoPLS, DOSC, OPLS, MSC, SNV, SGFilter, and Lasso using the Octane dataset.
Table 3.
Quantitative analysis results in terms of RMSEP, prediction variance, Lower and Upper boundaries of RMSEP and lower boundary of CS. The proposed FPLS is compared to PLS, OSCPLS, VCPLS, PoPLS, LoPLS, DOSC, OPLS, MSC, SNV, SGFilter, and Lasso using the Octane dataset.
| Method | Octane |
|---|
| RMSEP
| Variance
| CS
| Lower RMSEP
| Upper RMSEP
| Lower CS
|
|---|
| FPLS | 0.0645 (16) | 0.0165 | 0.9998 | 0.0015 | 2.7065 | 0.9994 |
| PLS | 0.0949 (3) | 0.0166 | 0.9911 | 0.0796 | 2.2716 | 0.9894 |
| OSCPLS | 0.0883 (2) | 0.0045 | 0.9910 | 0.0766 | 2.2711 | 0.9898 |
| VCPLS | 0.4435 (9) | 0.0413 | 0.9798 | 0.4752 | 2.4115 | 0.9736 |
| PoPLS | 0.3036 (3) | 0.0296 | 0.9477 | 0.4735 | 2.8059 | 0.9352 |
| LoPLS | 0.0950 (3) | 0.0167 | 0.9899 | 0.0811 | 2.7219 | 0.9892 |
| DOSC | 0.0885 (2) | 0.0043 | 0.9990 | 0.0766 | 2.2711 | 0.9898 |
| OPLS | 0.0949 (2) | 0.0049 | 0.9988 | 0.0766 | 2.2711 | 0.9898 |
| MSC | 0.0843 (2) | 0.0049 | 0.9995 | 0.0038 | 2.7065 | 0.9991 |
| SNV | 0.0945 (2) | 0.0049 | 0.9994 | 0.0045 | 2.7065 | 0.9988 |
| SGFilter | 0.0853 (2) | 0.0049 | 0.9990 | 0.0796 | 2.2716 | 0.9894 |
| Lasso | 0.4313 (1) | 0.0354 | 0.9894 | 0.0796 | 2.2716 | 0.9750 |
Table 4.
Quantitative analysis results in terms of RMSEP and RMSEP bounds. The proposed FPLS compared to PLS, OSCPLS, VCPLS, PoPLS, LoPLS DOSC, OPLS, MSC, SNV, SGFilter, and Lasso using the Mango dataset.
Table 4.
Quantitative analysis results in terms of RMSEP and RMSEP bounds. The proposed FPLS compared to PLS, OSCPLS, VCPLS, PoPLS, LoPLS DOSC, OPLS, MSC, SNV, SGFilter, and Lasso using the Mango dataset.
| Method | Total Acidity | Vitamin C |
|---|
| RMSEP
| Variance
| Lower RMSEP
| Upper RMSEP
| RMSEP
| Variance
| Lower RMSEP
| Upper RMSEP
|
|---|
| FPLS | 0.2731 (10) | 0.0191 | 0.2310 | 1.7415 | 0.6988 (10) | 0.0196 | 0.5006 | 2.1907 |
| PLS | 0.4328 (5) | 0.0239 | 0.3696 | 1.8053 | 1.1015 (5) | 0.0248 | 0.9996 | 2.4569 |
| OSCPLS | 0.4837 (2) | 0.0004 | 0.3832 | 1.8122 | 1.2581 (3) | 0.0753 | 0.9129 | 2.3978 |
| VCPLS | 0.4912 (8) | 0.0043 | 0.3248 | 1.7831 | 1.3499 (1) | 0.1033 | 1.1249 | 2.5569 |
| PoPLS | 0.4396 (10) | 0.0081 | 0.4225 | 1.8334 | 1.1491 (4) | 0.0141 | 1.2111 | 2.6385 |
| LoPLS | 0.4332 (5) | 0.0239 | 0.4222 | 1.8333 | 1.1023 (5) | 0.0248 | 1.0504 | 2.4951 |
| DOSC | 0.4818 (2) | 0.0025 | 0.3832 | 1.8122 | 1.2568 (3) | 0.0743 | 0.9129 | 2.3978 |
| OPLS | 0.4433 (4) | 0.0013 | 0.3615 | 1.8011 | 1.0847 (4) | 0.0167 | 1.0376 | 2.4852 |
| MSC | 0.3825 (6) | 0.0014 | 0.3841 | 1.6631 | 1.0797 (6) | 0.0192 | 0.5573 | 2.2137 |
| SNV | 0.3829 (6) | 0.0014 | 0.3844 | 1.6632 | 1.0820 (6) | 0.0194 | 0.5573 | 2.2137 |
| SGFilter | 0.4201 (5) | 0.0014 | 0.3696 | 1.8053 | 1.0969 (7) | 0.0186 | 1.0002 | 2.4573 |
| Lasso | 0.5035 (1) | 0.0074 | 0.3696 | 1.8053 | 1.2863 (1) | 0.0488 | 1.0002 | 2.4573 |
Table 5.
Quantitative analysis results in terms of prediction variance, RMSEP—including its lower and upper bounds—as well as CS and its lower bound. The proposed FPLS is compared to PLS, OSCPLS, VCPLS, PoPLS, LoPLS, DOSC, OPLS, MSC, SNV, SGFilter, and Lasso using the Soil Available Nitrogen dataset.
| Method | Nitrogen |
|---|
| RMSEP
| Variance
| CS
| Lower RMSEP
| Upper RMSEP
| Lower CS
|
|---|
| FPLS | 4.2388 (18) | 0.5872 | 0.9667 | 2.8807 | 9.5146 | 0.9506 |
| PLS | 6.0781 (7) | 0.7593 | 0.9561 | 3.7772 | 9.5697 | 0.9283 |
| OSCPLS | 7.4131 (1) | 1.0854 | 0.9356 | 5.4830 | 9.6807 | 0.9118 |
| VCPLS | 8.0386 (1) | 0.9987 | 0.9364 | 5.4172 | 9.6763 | 0.9040 |
| PoPLS | 6.4054 (5) | 0.7488 | 0.9410 | 5.0373 | 9.6509 | 0.9243 |
| LoPLS | 5.9168 (6) | 0.7523 | 0.9427 | 4.8964 | 9.6416 | 0.9303 |
| DOLS | 7.4078 (1) | 1.0842 | 0.9306 | 5.8935 | 9.7087 | 0.9119 |
| OPLS | 6.0622 (6) | 1.2427 | 0.9330 | 5.6967 | 9.6953 | 0.9285 |
| MSC | 6.1594 (7) | 0.6804 | 0.9331 | 5.6885 | 9.6947 | 0.9273 |
| SNV | 6.1596 (7) | 0.6798 | 0.9331 | 5.6885 | 9.6947 | 0.9273 |
| SGFilter | 6.0766 (7) | 0.7792 | 0.9212 | 6.6591 | 9.7624 | 0.9284 |
| Lasso | 8.6914 (1) | 1.5812 | 0.9212 | 6.6591 | 9.7624 | 0.8958 |


