Article

Plugging Small Models in Large Language Models for POI Recommendation in Smart Tourism

1
College of Computer Science and Technology, Zhejiang University of Technology, Hangzhou 310023, China
2
Zhejiang Key Laboratory of Visual Information Intelligent Processing, Hangzhou 310023, China
3
Zhejiang Supcon Information Co., Ltd., Hangzhou 310053, China
*
Author to whom correspondence should be addressed.
Algorithms 2025, 18(7), 376; https://doi.org/10.3390/a18070376
Submission received: 6 May 2025 / Revised: 7 June 2025 / Accepted: 16 June 2025 / Published: 20 June 2025

Abstract

:
Point-of-interest (POI) recommendation is a crucial task in location-based social networks, especially for enhancing personalized travel experiences in smart tourism. Recently, large language models (LLMs) have demonstrated significant potential in this domain. Unlike classical deep learning-based methods, which focus on capturing various user preferences, LLM-based approaches can further analyze candidate POIs using common sense and provide corresponding reasons. However, existing methods often fail to fully capture user preferences due to limited contextual inputs and insufficient incorporation of cooperative signals. Additionally, most methods inadequately address target temporal information, which is essential for planning travel itineraries. To address these limitations, we propose PSLM4ST, a novel framework that enables synergistic interaction between LLMs and a lightweight temporal knowledge graph reasoning model. This plugin model enhances the input to LLMs by making adjustments and additions, guiding them to focus on reasoning processes related to fine-grained preferences and temporal information. Extensive experiments on three real-world datasets demonstrate the efficacy of PSLM4ST.

1. Introduction

As cities are constantly developing and innovating, smart tourism—a crucial part of smart cities—is gaining more attention. With the diversification of tourism options, it uses cutting-edge technology such as IoT, big data, and AI [1]. Its aim is to connect and manage urban areas and tourism resources in a smart way. In this way, it offers personalized services to tourists, making tourism more convenient and satisfying [2]. In particular, the rise of location-based social networks (LBSNs) such as Yelp (https://www.yelp.com/) and Foursquare (https://foursquare.com/) has led to explosive growth in spatiotemporal data. These rich data present great opportunities for the advancement of point-of-interest (POI) recommendation, an important task in smart tourism. POI recommendation aims to recommend POIs that users may be interested in according to their historical data, so as to achieve a more user-friendly smart tourism service. Recent advances [3] in POI recommendation are shifting from classical neural network models to new LLM-based frameworks.
In addition to early methods [4], existing mainstream classic models based on deep learning mainly have two directions. Firstly, sequence-based approaches are harnessed for trajectory modeling. Secondly, graph-based methods for learning complex relations. Moreover, a handful of recent studies [5,6] have begun to shift their focus to mining time information to capture time slot preferences. Some studies [6,7] have further introduced target time to provide users with recommendations for specific time slots, which better meet their daily needs. Recently, LLMs have attracted significant attention. Existing research [8,9,10] has proven that LLMs can acquire and represent spatiotemporal knowledge from training corpora, as well as exhibit strong capabilities for time series prediction, thus laying a theoretical foundation for the next POI recommendation. Wang et al. [11] have made preliminary attempts. They primarily rely on users’ check-in history records to execute zero-shot prompting. Based on extensive common sense [12,13], LLMs can perform robust predictions even for cold-start users. Moreover, LLMs can provide corresponding explanations while predicting, thus addressing the issue of poor interpretability in classic DL-based methods [14].
However, the aforementioned existing research still has some limitations. First, unlike LLMs that possess a lot of common sense, classic models need to extend proprietary modules to solve specific problems. For example, users frequently check in various affordable stores, we can realize that users have poor economic ability and recommend affordable POIs, while classic models need to expand an economic preference module. More critically, classic models lack the ability to directly explain their predictions, which limits their interpretability and practicality in real-world applications. Second, LLMs’ limited context window hinders their ability to process complete trajectory datasets simultaneously, restricting comprehensive analysis of macro-level user behavior patterns. And it also introduces an important issue, that is, due to the random sampling and extraction of partial trajectories, the target POI may not appear in the current context. Moreover, many LLM-based models perform only simple in-context learning (ICL). Therefore, although LLM-based models have extensive common sense and can eliminate many unreasonable candidate POIs, it is difficult to fully capture the various fine-grained preferences of users.
To address the aforementioned limitations, we propose PSLM4ST, a novel framework that Plugs Small Models into Large Language Models for POI recommendation in Smart Tourism. As shown in Figure 1, small models can finely adjust and supplement the input of LLMs and guide LLMs to focus on the reasoning process of various fine-grained preferences, thereby more accurately capturing changes in user preferences across different temporal and spatial contexts, and thus significantly improve the accuracy and degree of personalization of the recommended results. In conclusion, the contributions of this paper are as follows:
  • To our knowledge, we are the first to use DL-based models as LLM plugins, combining their strengths for the next POI recommendation. By introducing target time and fully exploring time slot preferences, PSLM4ST can provide users with more accurate and user-friendly recommendations.
  • The plugin model is a temporal knowledge graph reasoning model, built on multiple lightweight modules designed to capture fine-grained preferences. Hence, it generates more precise candidate sets for LLMs, derived from various preference sources.
  • Extensive experiments on three real-world datasets demonstrate the superiority of our proposed PSLM4ST.
The rest of this paper is organized as follows: Section 2 discusses related work. Section 3 provides the problem definition and analyzes the check-in data. Section 4 introduces our proposed PSLM4ST in detail. Our experiments and results are described in Section 5. In Section 6 and Section 7, we discuss and conclude our work.

2. Related Work

2.1. Next POI Recommendation

2.1.1. Classic Methods

Mainstream research treats the next POI recommendation as a sequence prediction task. Earlier studies proposed RNN-based models [15,16,17,18] to fully model long- and short-term patterns. Moreover, inspired by Transformer, some studies proposed Transformer-based models [19,20,21], resulting in stronger sequence modeling capabilities. Researchers then introduced graph structures to alleviate the limitations of sequence-based approaches designed to enhance the global collaboration signal [22,23,24,25]. For example, GETNext [19] innovatively proposes a global trajectory graph, which aims to mine the global collaborative information of user trajectories. This design cleverly addresses the limitation of merely treating the point-of-interest recommendation as a sequential prediction task, enabling the model to understand user behavior patterns and interest preferences from a more macroscopic perspective. In contrast, STHGCN [26] takes an alternative approach by employing hypergraphs to capture trajectory–granularity information. It can learn from both the historical trajectories of individual users (intra-user) and the collaborative trajectories among different users (inter-user). The introduction of hypergraphs allows the model to effectively capture the high-order relationships between fine-grained and coarse-grained user movement patterns.

2.1.2. Time-Aware Methods

In the development of POI recommendation systems, numerous studies [27,28] have highlighted the significant impact of temporal factors on user behavior patterns. Time-aware POI recommendation methods aim to provide precise suggestions based on specific time slots, making it easier for users to plan their schedules and better aligning recommendations with their needs. Although some studies [29,30] have incorporated additional temporal information, such as periodic patterns, transition costs, and time preferences, most research fails to explicitly consider the target time when predicting the next location, resulting in recommendations that do not meet personalized needs in practical scenarios. For example, MTNet [5], which employs a tree-structured LSTM, captures time preferences but still has room for improvement in considering the target time. Recently, TPG [7] developed a time-aware framework based on the Transformer architecture, using target timestamps as prompt information. ROTAN [6] introduced time rotation techniques, encoding time periods as rotations to naturally capture periodic patterns without altering the original embedding space, thus significantly improving the accuracy of the recommendation.

2.1.3. LLM-Based Methods

Recently, some studies [11,31,32] have begun to explore novel LLM-based frameworks, which offer advantages that are difficult to match with classic DL-based methods. In particular, an LLM-based model also easily utilizes target time information as context and provides recommendation reasons, enabling more user-friendly recommendations, such as [11]. Specifically, LLMMob [11] leverages individual users’ check-in data and target check-in times to perform the next POI recommendation using zero-shot prompting. LLM-ZS [31], a simplified version of LLMMob, delves into the effects of zero-shot, one-shot, and few-shot prompting. LLMMove [14] further integrates geographical information of POIs. However, simple prompt engineering methods have limitations in effectively extracting fine-grained user preferences. LLM4POI [33], which is based on fine-tuning large language models, identifies states similar to the current trajectory from historical data by computing trajectory similarity. However, this approach requires substantial training data and computational resources. In contrast, GenUP [32] saves significant computational resources by periodically updating user profiles instead of frequently computing trajectory similarity.

2.2. Temporal Knowledge Graph Reasoning

A temporal knowledge graph (TKG) is a dynamic knowledge graph that contains facts that change over time, making it an ideal data structure to describe check-in behavior. TKG reasoning refers to the process of predicting future facts based on historical facts in the TKG. Therefore, we can easily transform the next time-specific POI recommendation task into the TKG reasoning task. The two main patterns of facts in TKGs are as follows: the repetition or circulation of facts and the evolution of adjacent facts. For example, refs. [34,35] adopted a copy-generation mechanism to identify global repetition patterns of facts.

3. Preliminaries

3.1. Problem Definition

This section introduces the definitions and preliminary concepts pertinent to the time-specific next POI recommendation problem. Specifically, we define U = { u 1 , u 2 , , u | U | } as the set of users, L = { l 1 , l 2 , , l | L | } as the set of locations, i.e., POIs, T = { t 1 , t 2 , , t | T | } as the set of types of temporal relationships, C = { c 1 , c 2 , , c | C | } as the set of categories, and A = { a 1 , a 2 , , a | A | } as the set of regions obtained by clustering coordinates using the k-means method.
Definition 1
(Check-in Record). A check-in record is denoted by c = ( u , l , c , a , t , d ) , where user u visits POI l during the time slot t on the date d, and POI l belongs to the category c, located in the region a.
Definition 2
(Trajectory). A trajectory is an ordered sequence of check-in records sorted chronologically by timestamp, represented as T u i = { c 1 , c 2 , , c m } . Here, c k represents the k-th check-in on the trajectory, and c m is the most recent check-in record for the user u i .
Definition 3
(Temporal knowledge graph, TKG). A TKG, symbolized by G = { G 1 , G 2 , , G d } , is constructed from a set of factual quadruples arranged in ascending order according to their timestamps. A quad ( s , r , o , t ) G t represents a fact with s (subject), r (relation), o (object), and t (timestamp). Each G t represents a TKG snapshot, and all events within a snapshot occur at the same time.
Definition 4
(Time-Specific Next POI Recommendation). Consider the historical trajectory T u i of the user u i , as well as a new query q = ( u i , t , ? , d ) , with u i belonging to the set of users U . The objective of the time-specific next POI recommendation task is to identify and recommend the top k POIs that are most likely to pique the interest of the user u i at the specific time t on the date d.

3.2. Check-In Behavior Data Analysis

In order to explore the rationality of the POI recommendation in mining time slot patterns and POI transfer relationships, we performed data analysis based on the NYC dataset from the Foursquare platform and the CA dataset from the Gowalla platform. Firstly, we investigated the activity of user check-in behavior under different check-in periods. Dividing the data into 24 groups based on user check-in times in UTC, we calculated the check-in proportion for each time slot. As shown in Figure 2, the changes in check-in activity across different time slots are evident in both the NYC and CA datasets. Obviously, the frequency of check-in behavior is closely related to the users’ daily routines.
Furthermore, based on common knowledge, different POI categories correspond to different peak visit hours. For instance, bars have their peak visiting hours concentrated between midnight and early morning locally, while restaurants typically experience peak times during local lunch and dinner hours. Therefore, we further analyze the impact of different time slots on the popularity of various POIs, as shown in Figure 3. It can be observed that, regardless of the dataset, there is a significant variation in user preferences for POIs across different time slots. Consequently, incorporating visiting hours into recommendations can lead to more targeted and accurate suggestions for POIs.
Finally, we analyze the potential transfer patterns of successive check-in pairs. Specifically, on the one hand, we select the 50 most frequent POIs from the NYC dataset and analyze their transfer heat values, as shown in Figure 4a, where the heat values are the results of a logarithmic transformation using log 10 n + 1 . We can draw the following two conclusions: First, the heat values along the main diagonal are significantly higher compared to the surrounding heat values, indicating that users generally exhibit a pronounced tendency for repeated check-ins. Second, the transfer preferences for POIs are not uniformly distributed, but show a higher preference for certain types of POIs or specific POIs. On the other hand, we analyze the temporal relationship between two successive check-ins, as shown in Figure 4b. It can be clearly observed that the heat values near the main diagonal are relatively higher, meaning that the transfer heat values for POIs in similar time slots are higher. Furthermore, the transfer heat values are generally lower or higher during specific time slots, for example, showing lower transfer heat values between time slot 9 and time slot 12.

4. Methodology

In this section, we detail our proposed PSLM4ST model. As shown in Figure 5, PSLM4ST mainly includes the following four steps: user check-in data processing, user profile generation, plugin model implementation, and LLM fine-tuning and prediction. In the following sections, we will detail the individual modules of PSLM4ST.

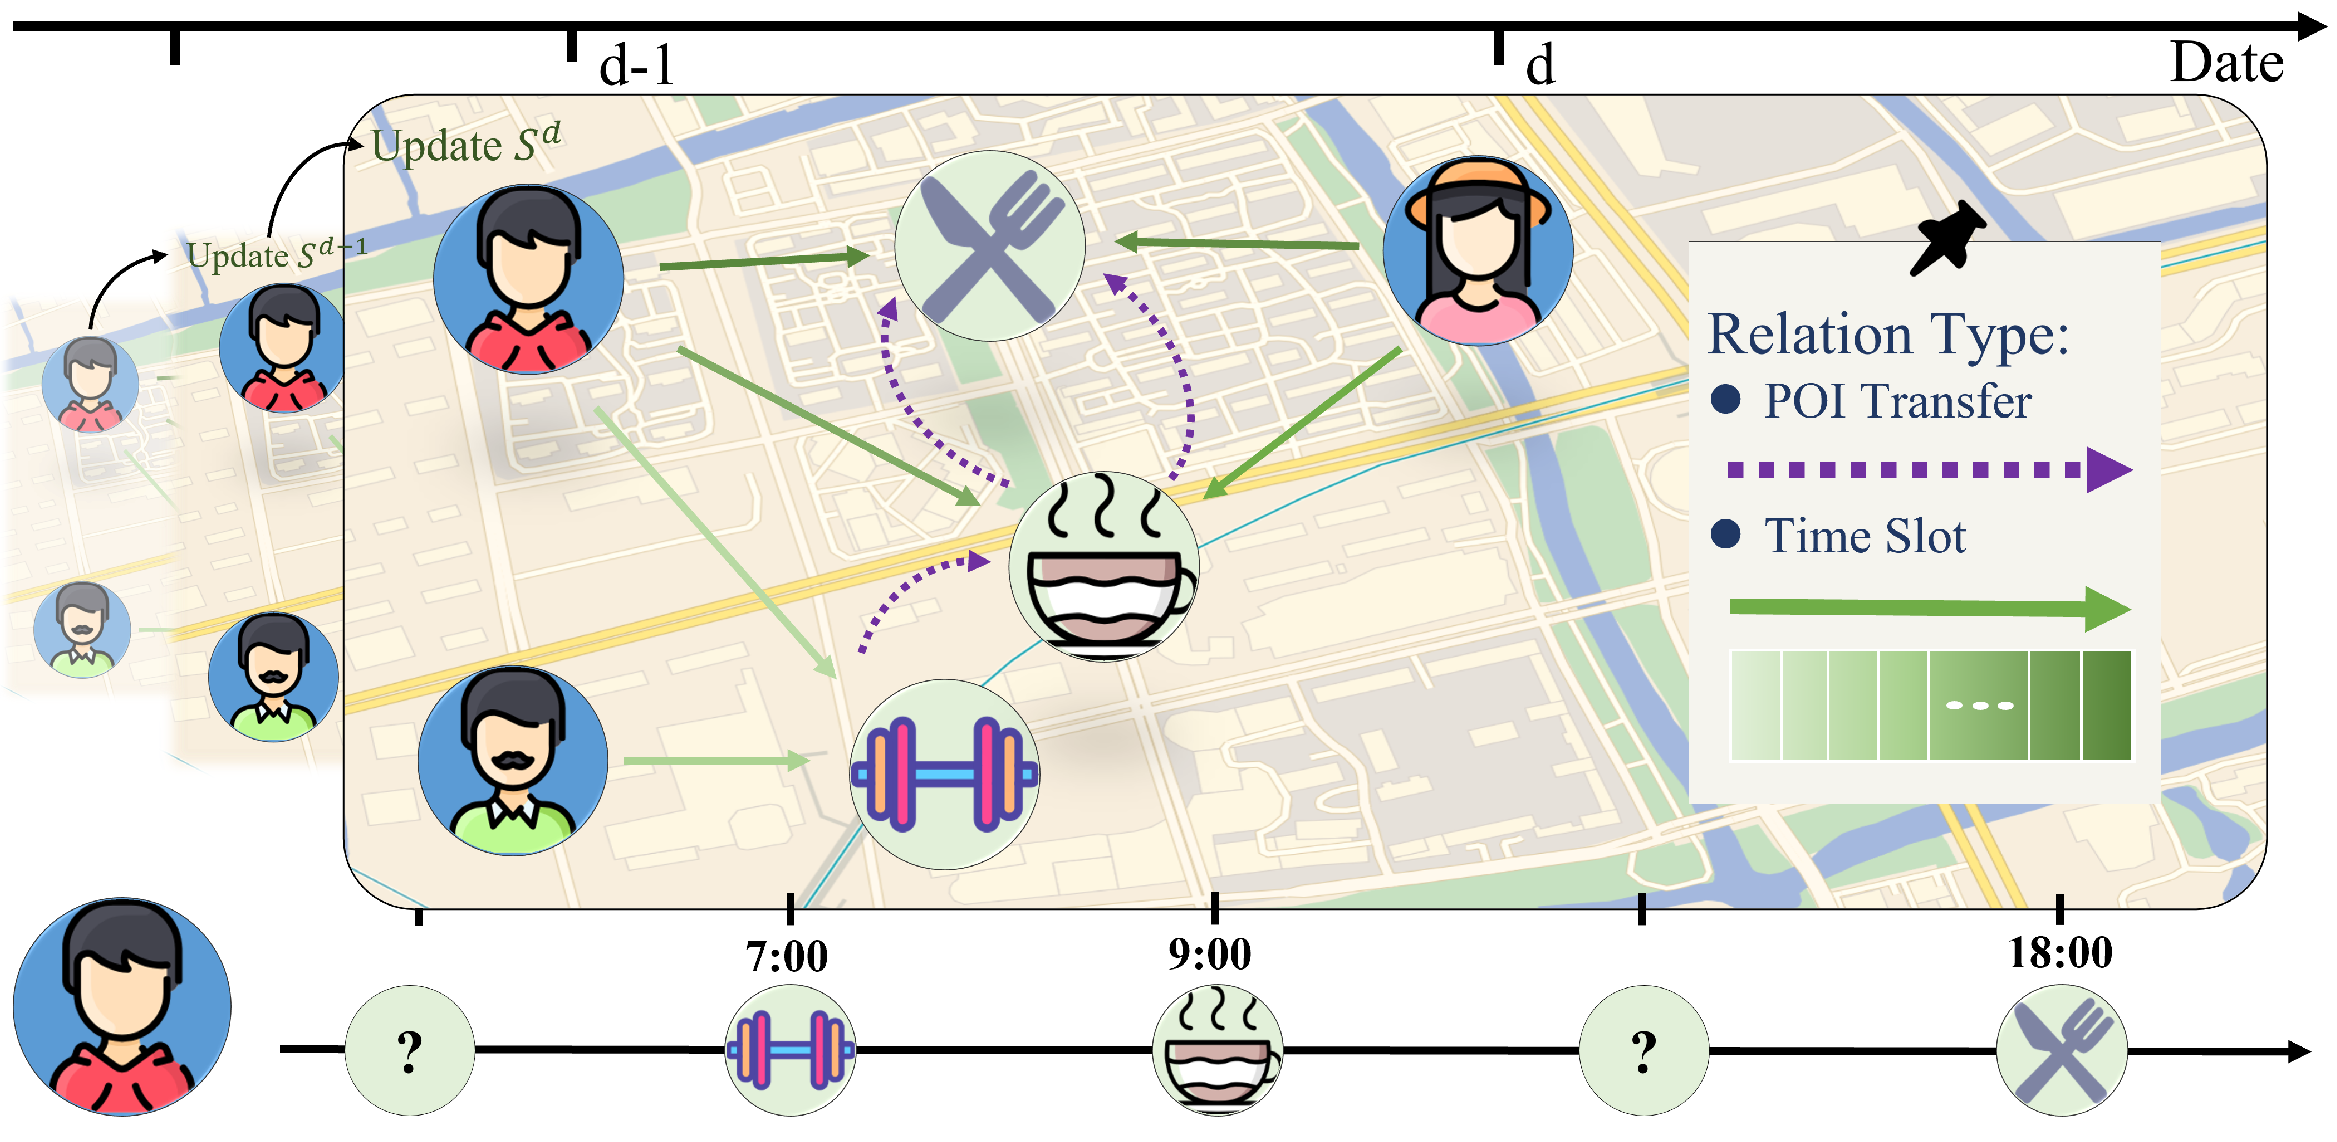
4.1. TKG and Schedule

Since TKG emphasizes the importance of temporal information, it serves as the foundation for capturing dynamic temporal patterns effectively. Additionally, its extrapolation tasks align well with POI recommendations, and extracting specific quadruple structures is particularly well-suited for recommendation scenarios in specific time slots. Therefore, we incorporate TKG and utilize its reasoning model as a crucial component of our work. Concretely, a day is divided into | T | time slots. Then all check-in records are generated into corresponding fact quads ( u , t , l , d ) based on their time information and divided into different snapshots by date d. Each G d = { ( u , t , l , d ) u U , t T , l L , d N } represents a TKG snapshot on the date, d, with all check-ins within a snapshot occurring on the same date, d. The time slot relation t represents the relationship of checking in at a specific time slot within a day, as shown in Figure 6. We formulate a schedule based on our TKG to depict users’ daily check-in patterns. First, we calculate the frequency of check-ins at all POIs within each time slot for each user and update these frequencies for each date. Then, we construct the schedule matrix S u d R | T | × | L | for each user, u, by
S u d i = S u d i 1 + S ˙ u d i ,   S u d 0 = 0
where S ˙ u d i is the schedule change matrix on the date d i . 0 denotes the zero matrix with dimensions | T | × | L | .

4.2. User Profile

Inspired by [32], to generate a far more lifelike user profile, we construct two forms of input data with distinct organizational structures from historical check-in data. The first involves the historical trajectories of users, T u , which are used mainly to identify user transfer preferences between various POIs. A check-in within T u is organized as follows: At the time, the user uid visited the POI pid, which is a poi category name with the category id cid. The second is the daily user behavior schedule S u d , which is applied primarily to statistically analyze the patterns of user interests during different times. The ten most frequently checked-in POIs and their categories are used for each time slot. Subsequently, these two forms of data are fed into GPT-4o Mini (https://chat.openai.com) to generate the user profile. Due to the anonymity of user data, the user profile predicted by the LLM includes the following two parts, as follows:
  • Attributes. Some basic user attributes are intricately linked to their preferences with respect to POIs. For example, restaurants with different price ranges are tailored to customers who have diverse economic capacities. Chen et al. [36] found evidence that a chatbot develops internal representations of its users’ states, including the following basic attributes. Specifically, we use LLMs to predict the following four basic attributes: gender, age, education, and income level. Gender is categorized as male or female. Age is segmented into the following five groups: child, teen, young adult, middle-aged, and elderly. Education and income levels are classified into the following three levels: low, medium, and high.
  • Summary. To more comprehensively capture the subtleties of user preferences, we instruct the LLM to generate a 200-word summary that simulates user check-in behavior for another LLM. The summary should include information on user behavior patterns, preferences, schedules, etc., such as whether the user tends to explore unfamiliar points of interest or prefers consistently checking in at familiar locations. This empowers the second LLM to simulate the user’s thought processes with greater depth and precision.

4.3. Plugin Model

4.3.1. User Personal Habit and Novelty Preferences

A user’s personal preferences are pivotal in personalizing the next POI recommendation. Within this module, our aim is to discern each user’s habitual preference and novelty preference based on a copy-generation mechanism [34]. Users usually show their habitual behavior patterns in different time slots and may be interested in unfamiliar POIs at any time. For example, Bob drinks a cup of coffee at his favorite coffee shop at 2 p.m. almost every weekday, but occasionally tries other activities. Therefore, we can capture user preferences during specific time slots through user embeddings and the time slot embeddings of the current query context q = ( u , t , ? , d ) . First, we transform S u d into S ˘ u d by
S ˘ u d = f ( S u d ) , f ( x ) = + λ , if x > 0 . λ , if x = 0 .
Then, with the help of S ˘ u d , the set of familiar POIs is extracted through the copy mode to mine habit preferences, v h a b , and unfamiliar POIs are identified through the generation mode to mine novelty preferences, v n o v .
v h a b = t a n h ( W h a b [ u , t ] + b h a b ) L + S ˘ u d ,
v n o v = t a n h ( W n o v [ u , t ] + b n o v ) L S ˘ u d ,
where t a n h ( · ) is the activation function. And W h a b , W n o v R 2 d × d and b h a b , b n o v R d × d are trainable parameters. L represents all location embeddings. [ · ] denotes concatenation.

4.3.2. Personal and Global POI Transfer Preferences

Users’ check-in behaviors are highly susceptible to their recent check-in situations. From a macroscopic perspective, there exists a significant causal relationship among numerous event pairs formed by users’ check-in behaviors in adjacent time slots. Therefore, we need to capture the personal POI transfer preference between different time slots. For each check-in record c i = ( u , l i , t i , d i ) , we retain the previous check-in record to achieve ( u , l i , t i , d i , l j , t j , d j ) .
v p t f = t a n h ( W p t f [ u , t i , t j , l j ] + b p t f ) L .
From a global perspective, POI transfer patterns contain global collaborative signals. We can obtain the global POI transfer preference v g t f by
Δ d = ( d i d j ) × d u ,
v g t f = t a n h ( W g t f [ t i , t j , l j , Δ d ] + b g t f ) L ,
where d u is the unit date embedding. We use linear layers with the t a n h ( · ) activation function to aggregate information from the query. The output of the linear layers is then multiplied by the transpose of L to obtain | L | -dimensional vectors, where each element represents the similarity between the query and the corresponding POI.

4.3.3. Mirror Modules

The user’s temporal preferences are also reflected in the potential regions they may be in (e.g., different regions during working hours versus off-hours) and the categories of POIs they are interested in (as shown in the data analysis in Section 3). Therefore, we aim to capture multi-dimensional preferences to enhance the representation. Similar to the various POI preference modules mentioned above, we further constructed mirror modules for POI categories and regions. Specifically, first, since the check-in data do not contain regional division information, we cluster the coordinates of all POIs using the K-means method, dividing them into 60 regions. Second, we construct corresponding schedules for users’ check-in behaviors regarding different categories and regions during each time slot, using the same approach as mentioned earlier. Then, we capture the various preferences mentioned above using the corresponding learnable parameters, the transpose of the embedding matrix, and the tail entity embeddings from the previous query. Finally, in addition to the preference vectors ( v l ) for POIs, we can also obtain preference vectors for POI categories ( v c ) and regions ( v a ).

4.4. Next POI Recommendation

4.4.1. Model Inference and Optimization

We apply the activation function s o f t m a x ( · ) to estimate the output of the preference vectors for each module. Each module can output its own predictions. Then, the plugin model will select the top-N locations with the highest probability as the preliminary prediction. For our independent plugin model, we use the hyperparameter α to balance users’ habit preferences and novelty preferences, thereby reflecting their needs for POIs (categories or regions) in each time slot. Subsequently, we integrate the personal location transfer preference and the global location transfer preference. These two types of preferences are derived from the internal logic of location transfer as reflected in personal habits and global regularities. We utilize the hyperparameter β to regulate the balance between them.
y ^ h n = α · s o f t m a x ( v h a b ) + ( 1 α ) · s o f t m a x ( v n o v ) ,
y ^ t f = β · s o f t m a x ( v p t f ) + ( 1 β ) · s o f t m a x ( v g t f ) ,
where both α and β are hyperparameters ranging from 0 to 1. Then, we adopt the same method to combine the above preferences. y ^ denotes the prediction probabilities in all locations by adding y ^ h n and y ^ t f . And y ^ h n represents the prediction results modeled through a copy-generation mechanism for user behavior patterns, whereas y ^ t f denotes the prediction results based on location transfer modeling.
The plugin model serves as a temporal knowledge graph reasoning model for the next POI (category or region) recommendation. When given the user’s historical check-in trajectory T u and current query q = ( u , t , ? , d ) , predicting the target POI (category or region) can be regarded as a multi-category classification task, where each category corresponds to a POI. The learning objective is to minimize the following cross-entropy loss L C E on all check-in records of our TKG snapshots that exist during training.
L C E = d = 1 | D | u = 1 | U | t = 1 | T | k = 1 K y ( x k ( u , t , d ) ) log ( y ^ k ( u , t , d ) ) ,
where y ( · ) is an indicator function that is equal to 1 if x k ( u , t , d ) is the ground truth POI (category or region) of the k-th query ( u , t , ? , d ) in the snapshot G d and 0 otherwise.
Next, in order to promote the model to learn robust representations, we jointly learn three prediction subtasks through a multi-task training framework. The overall loss function is as follows:
L f i n a l = 1 2 σ l 2 L C E l + 1 2 σ c 2 L C E c + 1 2 σ a 2 L C E a + l o g σ l σ c σ a ,
where σ l , σ c , and σ a are learnable parameters, and the last term serves as a regularization term for denoising. L C E l , L C E c , and L C E a are the cross-entropy losses for the three subtasks of POI recommendation, category recommendation, and region recommendation, respectively.

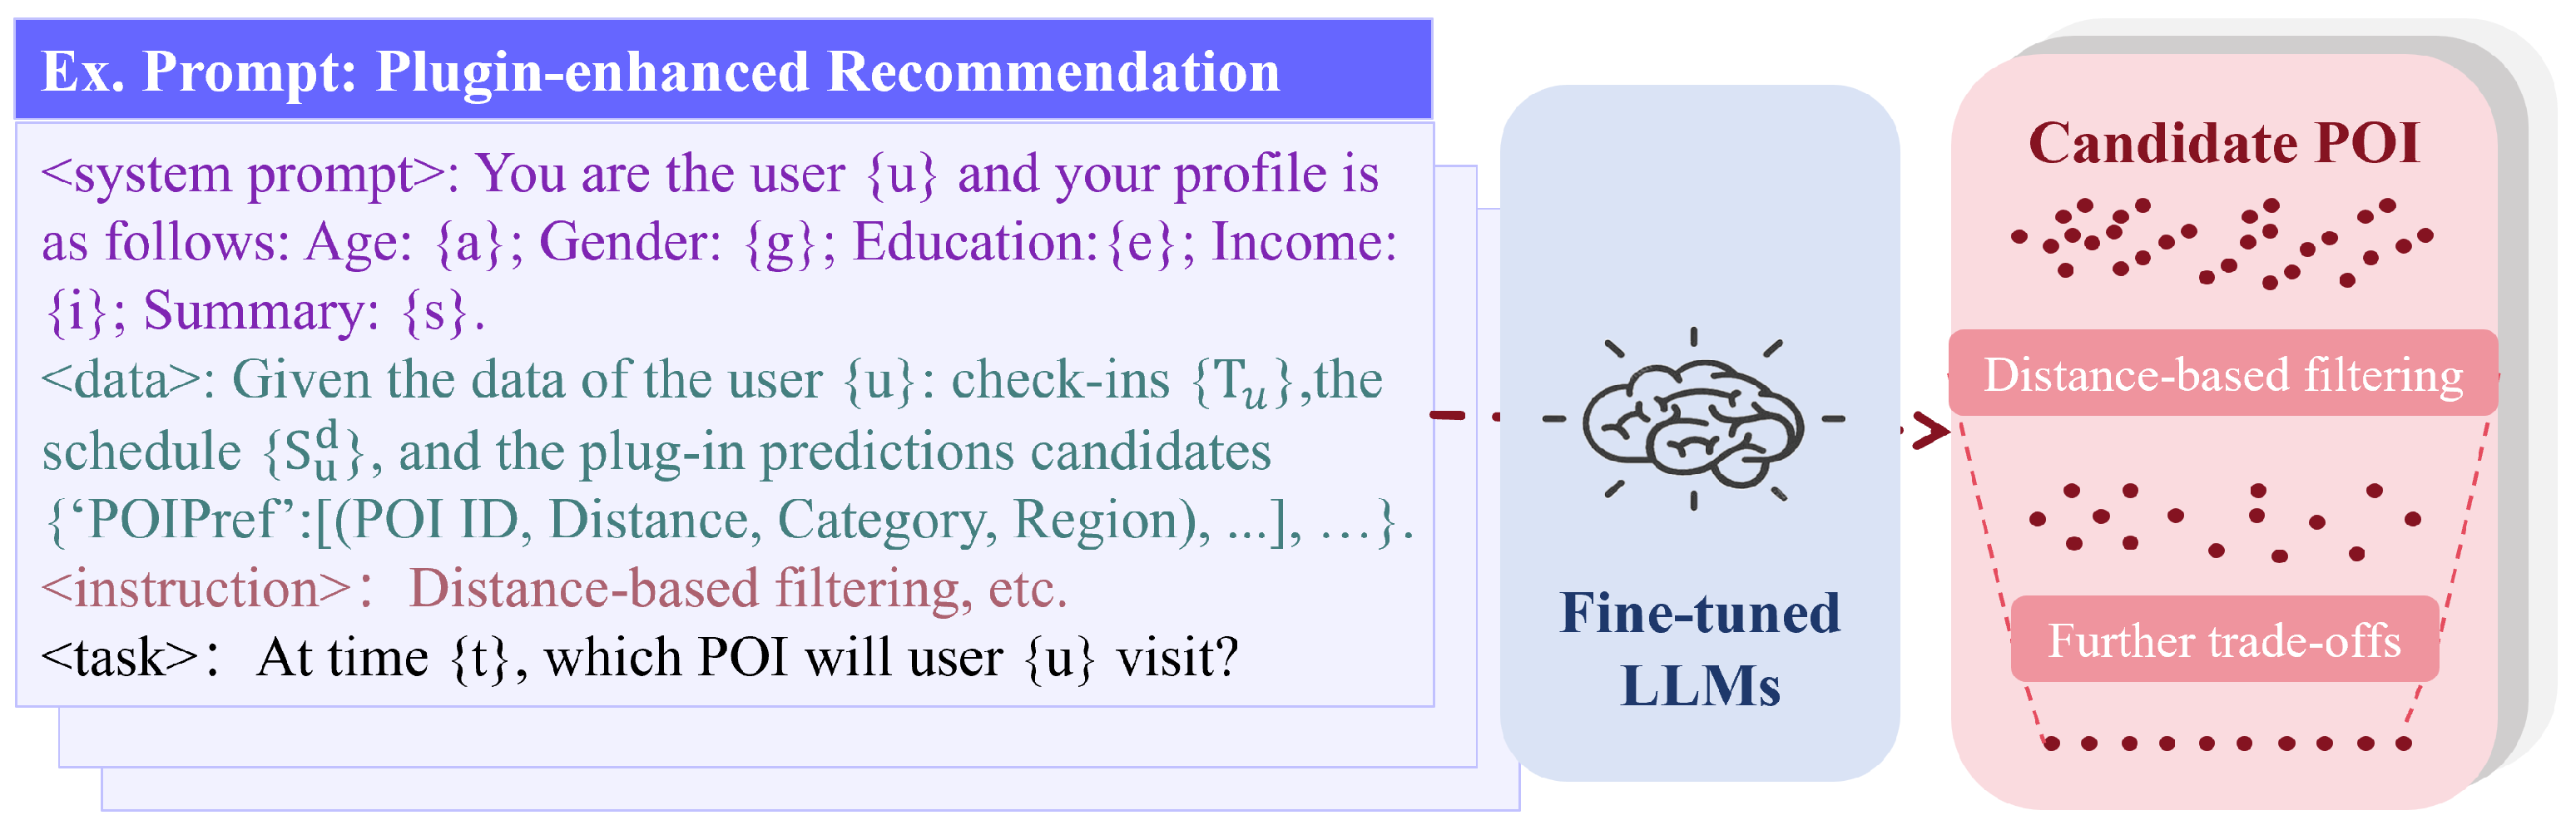
4.4.2. Plugin-Enhanced Prompt

We take the preliminary prediction results generated by the plugin model, along with the user profile and the check-in trajectory, as the given data for the plugin-enhanced prompt. Specifically, we construct the prompt by designing different sentence blocks for various purposes. As shown in Figure 7, a key part of the prompt consists of the user profile block, the trajectory block, the plugin block, and the instruction block. In addition, the hint block and target block are used to explain data formats and obtain results. The POI preliminary prediction results from the plugin block are organized into a list of entries (POI ID, distance, category, region), in descending order of probability, and with the overall historical confidence of the preference module. In addition, preliminary predictions for categories and regions are also included.
Subsequently, the LLM can conduct in-depth reasoning based on the given data and follow the instructions at the prompt. Specifically, first, we combine the previous check-in location to calculate the distance of the candidate POIs from the preliminary predictions. By evaluating the time gap between successive check-ins, we eliminate candidates with insufficient time feasibility, narrowing the analysis scope and enhancing prediction accuracy. Second, the plugin model’s preliminary predictions for categories and regions serve as auxiliary information for POI prediction. Then, the LLM conducts an in-depth analysis of user behavior patterns using the user profile, integrating context information and preliminary predictions from plugin models. Through multi-dimensional evaluation—such as whether the user has checked in at the POI before, whether there is a habitual check-in pattern during the time slot, or whether the user tends to explore new POIs—the POIs that best match the user’s behavior pattern are selected as the recommendation. This process fully leverages personalized user profile information and combines spatiotemporal features of check-in trajectories to achieve precise optimization of POI prediction.

4.4.3. Supervised Fine-Tuning

Following [32], we apply parameter-efficient fine-tuning (PEFT) technology during the fine-tuning phase to avoid excessive costs, where we use Llama-2-7b-longlora-32k as our base LLM.

5. Experiments

In this section, we introduce experiments that demonstrate the validity of our proposed model.

5.1. Datasets and Experimental Settings

We evaluate our PSLM4ST model on three widely adopted real-world datasets: Foursquare (https://sites.google.com/site/yangdingqi/home)-NYC (accessed on 5 May 2025), Foursquare-TKY, and Gowalla (http://snap.stanford.edu/data/loc-gowalla.html)-CA (accessed on 5 May 2025). During preprocessing, we follow previous studies. We sort the records chronologically and split the datasets; 80% of the check-ins form the training set, 10% form the validation set, and 10% form the test set. The validation and test sets must include all users and POIs in the training set. And we filter out POIs and users with fewer than 10 check-in records and divide check-in records into 24-h trajectories. Table 1 shows the statistics of the three datasets.
We use the Xavier initialization method to initialize the model parameters and then optimize using the Adam optimizer with a learning rate of 0.001 and 50 epochs. We set the weight decay to 1 × 10 5 , the embedding dimension to 200, and the batch size to 4096.

5.2. Baselines and Evaluation Metrics

We use the following methods as baselines for our experiment. In addition to a traditional method, FPMC [4], an RNN-based method, STGN [16], and GCN-based methods, GETNext [19] and STHGCN [26], we also use the following methods:
  • UTopRec counts the check-in frequency of each user for all POIs within each time slot according to our TKG.
  • MTNet [5] is a time-aware state-of-the-art method that introduces a hierarchical check-in description method named Mobility Tree.
  • ROTAN [6] is a time-aware method that proposes Time2Rotation, which encodes the given time slots as rotations.
  • LLM-ZS [31] considers long- and short-term dependencies, solving the time-aware prediction problem by using temporal information.
  • GenUP [32] is an LLM-based state-of-the-art model that focuses on user profile generation and fine-tuning.

5.3. Results and Analysis

5.3.1. Overall Comparison

Table 2 presents the experimental results of our model compared to mainstream classic models. Table 3 shows the results of the comparison between our model and LLM-based models. The results show that PSLM4ST outperforms the baselines in most cases, validating our model’s advantages.
It is worth noting that, from the variations in suboptimal models across different datasets, recent research competition in the field of POI recommendation has been quite intense. For instance, on the NYC dataset, MTNet and ROTAN—both of which focus on temporal awareness—achieved suboptimal results on different metrics. This indicates that users in the NYC dataset exhibit more regular temporal patterns, and the optimal-performing PSLM4ST is capable of effectively capturing the time slot preferences. On the TKY dataset, STHGCN, based on hypergraph Transformers, achieved suboptimal results, while MTNet and ROTAN performed relatively worse. This might be due to the fact that users in the TKY dataset had relatively richer check-in trajectories, and both STHGCN and PSLM4ST demonstrated strong capabilities in capturing global collaborative signals. Although ROTAN also considers point-of-interest transition relationships, it only incorporates them as pre-trained embeddings, and subsequent extensive learning through sequence models does not lead to significant final performance. On the final CA dataset, PSLM4ST and ROTAN engaged in intense competition. Similar to the situation in the NYC dataset, PSLM4ST performed relatively better in the Acc@5 and Acc@10 metrics. This suggests that PSLM4ST possesses strong generalization capabilities when expanding the prediction scope, enabling it to cover correct results more comprehensively.
Compared to LLM-based methods, the related work only adopts Acc@1 evaluation, and we maintain consistency. GenUP achieves higher accuracy by utilizing supervised fine-tuning and constructing user profiles, outperforming LLM-ZS’s basic ICL approach. Due to the limited context length of LLMs, the actual POI visited by the user may not be present in their context. This means that the true POI may not have been included in the candidate set determinable by the LLM (e.g., through random sampling or by selecting the preceding segment of historical check-in data). Our plugin model can provide a more accurate candidate set. Therefore, PSLM4ST achieves significant performance improvements with the help of the plugin model.
Overall, the advantages of the PSLM4ST model mainly stem from the following reasons: (a) Our plugin model effectively captures users’ behavioral preferences within each time slot and their POI transfer preferences across different time slots, thereby providing LLMs with more accurate candidate sets derived from diverse preferences. By mining global POI transfer preferences, it can capture global collaborative signals. (b) LLMs can effectively analyze user profiles and simulate user behaviors based on extensive common knowledge, which is an ability that classic DL-based models do not possess. (c) Synergy between LLM and the plugin model combines the advantages of both.

5.3.2. Analysis of Preliminary Predictions’ Top-N Picks

The preliminary prediction result of the plugin model module is a long list with a length equivalent to the total number of POIs. Given the constraint on the length of the prompt, it is essential to select a sub-list from the preliminary prediction result to serve as the plugin’s preliminary prediction chunk for the prompt. The temporal knowledge graph plugin model can extract the following five modules: the personal POI transfer preference module (PTF), the global POI transfer preference module (GTF), the user habit preference module (HAB), the user novelty preference module (NOV), and the user check-in frequency statistics module based on the user’s schedule S u d (UTOP).
Figure 8 shows the accuracy of the top-N prediction results for each module. It can be seen that as N increases, the prediction accuracy in the three datasets initially experiences a rapid improvement, followed by a gradual slowdown in the rate of improvement, maintaining a relatively slower upward trend. PSLM4ST should consider both the accuracy of the top-N predictions and the prompt length constraints to select an appropriate N value. For example, we set N to 60. Additionally, it can be seen that compared to the results of the NYC and TKY datasets, the GTF module achieves the highest accuracy in the CA dataset, while other modules related to specific users exhibit lower performance. The CA dataset has the fewest average check-ins, which means that the model finds it more challenging to capture preferences related to specific users. However, relatively richer global check-in data can support the GTF module in achieving relatively better performance. The UTOP module only mechanically responds to users’ habits. It can be seen that its prediction accuracy is almost stable. After N = 10, the accuracy barely improves, so only the first 10 items in each time slot on the schedule need to be used.
Figure 9 shows the prediction accuracies of mirror modules in the plugin model for points of interest (POIs), categories (CAT), and regions (COO). Since the number of POI categories or regions is significantly smaller than the number of POIs, the corresponding prediction tasks are far less challenging than the POI prediction tasks. Therefore, the mirror modules perform well in POI category prediction and region prediction tasks, achieving satisfactory levels of accuracy. In particular, on the TKY dataset, the mirror modules demonstrate relatively better performance in the two subtasks, with POI category prediction accuracies of Acc@1 = 0.4958 and Acc@20 = 0.9212, and region prediction accuracies of Acc@1 = 0.5235 and Acc@20 = 0.9629. Through joint multitask prediction, valuable semantic information can be provided to the subsequent predictive LLM.

5.3.3. Sensitivity Analysis

To evaluate the impact of weight balance within the preference modules, we conducted a sensitivity analysis on the hyperparameters α and β for specific preference modules on three datasets. As shown in Figure 10, performance trends exhibit an initial increase followed by a decrease as hyperparameters increase across all three datasets. For instance, setting α to 0 causes the model to consider only the user’s novelty preference, while setting α to 1 makes the model consider only the user’s habit preference. And setting β to 0 causes the model to consider only the user’s personal POI transfer preference, while setting β to 1 makes the model consider only the user’s global POI transfer preference. In both extreme cases, performance is lower than when both preferences are considered simultaneously. This shows that users are affected by multiple preferences, and different preference modules can generate different effective candidate sets.

5.3.4. Ablation Study

Figure 11 shows the performance comparison on the NYC and TKY datasets. To validate the effectiveness of the different modules in PSLM4ST, we compare the performance of the full model with its four variants. (a) w/o-U&P removes the user profile and plugin model; (b) w/o-S&P adds the user profile to w/o-U&P, but removes the user summary in the system prompt; (c) w/o-A&P adds the user profile to w/o-U&P, but removes user attributes in the system prompt; (d) w/o-PG adds the user profile to w/o-U&P; (e) w/o-TF removes personal and global POI transfer preferences in the plugin model; (f) w/o-HN removes the personal habits and novelty preferences in the plugin model; (g) w/o-MR removes the mirror modules for the category and region. We can see that the performance of the full model is generally higher than the rest of the variants, so we can say that each module in PSLM4ST contributes to the performance improvement.
After removing the plugin model, the model’s performance dropped significantly. This indicates that the plugin model has a substantial impact on overall performance, particularly due to its preliminary prediction candidate set. Furthermore, the summary section of the user profile has a greater impact on the model than the basic attributes of the user. This is likely because the summary describes the user’s life status and personality traits, which reflect and summarize the underlying impact of the user’s basic attributes. Finally, it can be seen that the preference modules of the plugin model provide valuable candidate sets. As shown in Figure 8, differences in users’ latent preferences across datasets affect the prediction accuracy of the various preference modules.

6. Discussion

Section 5 discusses the experimental results and the phenomena we observed. In this section, we discuss the complexity of the model and other limitations.
Since the main working mechanism of PSLM4ST involves collaboration between the LLM and plugin models for recommendations, its time consumption reflects the sum of the costs of both the LLM and plugin models. Thus, work based on this architecture requires plugin models to have relatively higher inference efficiency. Specifically, the PSLM4ST plugin model is a simple yet effective network, and we analyze its complexity in the training and inference stages. For a minibatch M, the time complexity of learning the preferences is O ( | M | | L | ) , and the inference complexity for a single query is O ( L ) since we only need to calculate the final distribution. The total space complexity is O ( | T | + | U | + | L | + N ) , where N is the number of layers in the neural modules.
Regarding the limitations of our model, the approach employing empirical hyperparameters, such as the balance coefficients between multiple preference modules and the granularity of time-slot division, is a common practice in related studies [5,34,35]. However, this approach often necessitates targeted adjustments for different datasets, thus significantly increasing the complexity of model debugging and the overall cost of the application. Consequently, it is imperative to explore adaptive mechanisms in future work that can enable models to automatically adapt to the characteristics of diverse datasets, thereby mitigating the reliance on empirical parameter tuning. In addition, we plan to integrate more multimodal data sources, including text reviews, images, videos posted by users on social platforms, users’ social relationships, and detailed POI descriptions. By extracting relevant features from these multimodal data sources, we can enrich the POI information and achieve a more comprehensive understanding of users’ needs and preferences.

7. Conclusions

In this paper, we propose a novel framework that aims to facilitate the collaborative work between the plugin model and the pre-trained LLM. Using their complementary strengths, we can predict the POIs at which users will check in during specific time slots with greater precision. Among them, the lightweight plugin model based on TKG reasoning can deeply capture users’ various multi-dimensional fine-grained preferences. Meanwhile, the LLM can effectively filter preliminary predictions based on common sense and conduct reasonable reasoning by integrating various sources of information. The efficacy of our proposed method was validated through extensive experiments on three datasets.

Author Contributions

Conceptualization and methodology, H.Z.; data curation and formal analysis, H.Z.; experiments and analysis, H.Z., Z.X., Q.P. and Z.Z.; investigation, Z.X.; validation and visualization, Z.X., Q.P. and Z.Z.; writing—original draft preparation, H.Z., Z.X. and Q.P.; writing—review and editing, X.K. and H.Z.; resources and supervision, X.K.; funding acquisition, X.K. All authors have read and agreed to the published version of the manuscript.

Funding

This research was supported in part by the National Natural Science Foundation of China under Grant 62476247, 62073295 and 62072409, in part by the “Pioneer” and “Leading Goose” R&D Program of Zhejiang under Grant 2024C01214, and in part by the Zhejiang Provincial Natural Science Foundation under Grant LR21F020003.

Institutional Review Board Statement

Not applicable.

Informed Consent Statement

Not applicable.

Data Availability Statement

Data will be available upon reasonable request.

Conflicts of Interest

Author Zhenhui Xu was employed by the company “Zhejiang Supcon Information Co., Ltd.”. The remaining authors declare that the research was conducted in the absence of any commercial or financial relationships that could be construed as a potential conflict of interest.

References

  1. Wang, W.; Kumar, N.; Chen, J.; Gong, Z.; Kong, X.; Wei, W.; Gao, H. Realizing the potential of the internet of things for smart tourism with 5G and AI. IEEE Netw. 2020, 34, 295–301. [Google Scholar] [CrossRef]
  2. Zhang, Y.; Sotiriadis, M.; Shen, S. Investigating the impact of smart tourism technologies on tourists’ experiences. Sustainability 2022, 14, 3048. [Google Scholar] [CrossRef]
  3. Zhang, Q.; Yang, P.; Yu, J.; Wang, H.; He, X.; Yiu, S.M.; Yin, H. A Survey on Point-of-Interest Recommendation: Models, Architectures, and Security. IEEE Trans. Knowl. Data Eng. 2025. [Google Scholar] [CrossRef]
  4. Rendle, S.; Freudenthaler, C.; Schmidt-Thieme, L. Factorizing personalized markov chains for next-basket recommendation. In Proceedings of the 19th International Conference on World Wide Web, Raleigh, NC, USA, 26–30 April 2010; pp. 811–820. [Google Scholar]
  5. Huang, T.; Pan, X.; Cai, X.; Zhang, Y.; Yuan, X. Learning time slot preferences via mobility tree for next poi recommendation. In Proceedings of the AAAI Conference on Artificial Intelligence, Vancouver, BC, Canada, 26–27 February 2024; Volume 38, pp. 8535–8543. [Google Scholar]
  6. Feng, S.; Meng, F.; Chen, L.; Shang, S.; Ong, Y.S. Rotan: A rotation-based temporal attention network for time-specific next poi recommendation. In Proceedings of the 30th ACM SIGKDD Conference on Knowledge Discovery and Data Mining, Barcelona, Spain, 25–29 August 2024; pp. 759–770. [Google Scholar]
  7. Luo, Y.; Duan, H.; Liu, Y.; Chung, F.L. Timestamps as prompts for geography-aware location recommendation. In Proceedings of the 32nd ACM International Conference on Information and Knowledge Management, Birmingham, UK, 21–25 October 2023; pp. 1697–1706. [Google Scholar]
  8. Manvi, R.; Khanna, S.; Mai, G.; Burke, M.; Lobell, D.; Ermon, S. Geollm: Extracting geospatial knowledge from large language models. arXiv 2023, arXiv:2310.06213. [Google Scholar]
  9. Gurnee, W.; Tegmark, M. Language models represent space and time. arXiv 2023, arXiv:2310.02207. [Google Scholar]
  10. Harte, J.; Zorgdrager, W.; Louridas, P.; Katsifodimos, A.; Jannach, D.; Fragkoulis, M. Leveraging large language models for sequential recommendation. In Proceedings of the 17th ACM Conference on Recommender Systems, Singapore, 18–22 September 2023; pp. 1096–1102. [Google Scholar]
  11. Wang, X.; Fang, M.; Zeng, Z.; Cheng, T. Where would i go next? large language models as human mobility predictors. arXiv 2023, arXiv:2308.15197. [Google Scholar]
  12. Brown, T.; Mann, B.; Ryder, N.; Subbiah, M.; Kaplan, J.D.; Dhariwal, P.; Neelakantan, A.; Shyam, P.; Sastry, G.; Askell, A.; et al. Language models are few-shot learners. Adv. Neural Inf. Process. Syst. 2020, 33, 1877–1901. [Google Scholar]
  13. Zhao, W.X.; Zhou, K.; Li, J.; Tang, T.; Wang, X.; Hou, Y.; Min, Y.; Zhang, B.; Zhang, J.; Dong, Z.; et al. A survey of large language models. arXiv 2023, arXiv:2303.18223. [Google Scholar]
  14. Feng, S.; Lyu, H.; Li, F.; Sun, Z.; Chen, C. Where to move next: Zero-shot generalization of llms for next poi recommendation. In Proceedings of the 2024 IEEE Conference on Artificial Intelligence (CAI), Singapore, 25–27 June 2024; pp. 1530–1535. [Google Scholar]
  15. Liu, Q.; Wu, S.; Wang, L.; Tan, T. Predicting the next location: A recurrent model with spatial and temporal contexts. In Proceedings of the AAAI conference on Artificial Intelligence, Phoenix, AZ, USA, 12–17 February 2016; Volume 30. [Google Scholar]
  16. Zhao, P.; Luo, A.; Liu, Y.; Xu, J.; Li, Z.; Zhuang, F.; Sheng, V.S.; Zhou, X. Where to go next: A spatio-temporal gated network for next poi recommendation. IEEE Trans. Knowl. Data Eng. 2020, 34, 2512–2524. [Google Scholar] [CrossRef]
  17. Xu, C.; Zhao, P.; Liu, Y.; Xu, J.; Sheng, V.S.S.; Cui, Z.; Zhou, X.; Xiong, H. Recurrent convolutional neural network for sequential recommendation. In Proceedings of the The World Wide Web Conference, San Francisco, CA, USA, 13–17 May 2019; pp. 3398–3404. [Google Scholar]
  18. Yang, D.; Fankhauser, B.; Rosso, P.; Cudre-Mauroux, P. Location prediction over sparse user mobility traces using rnns. In Proceedings of the Twenty-Ninth International Joint Conference on Artificial Intelligence, Yokohama, Japan, 11–17 July 2020; pp. 2184–2190. [Google Scholar]
  19. Yang, S.; Liu, J.; Zhao, K. GETNext: Trajectory flow map enhanced transformer for next POI recommendation. In Proceedings of the 45th International ACM SIGIR Conference on Research and Development in Information Retrieval, Washington, DC, USA, 14–18 July 2022; pp. 1144–1153. [Google Scholar]
  20. Lim, N.; Hooi, B.; Ng, S.K.; Wang, X.; Goh, Y.L.; Weng, R.; Varadarajan, J. STP-UDGAT: Spatial-temporal-preference user dimensional graph attention network for next POI recommendation. In Proceedings of the 29th ACM International Conference on Information & Knowledge Management, Virtual, 19–23 October 2020; pp. 845–854. [Google Scholar]
  21. Xia, J.; Yang, Y.; Wang, S.; Yin, H.; Cao, J.; Yu, P.S. Bayes-enhanced multi-view attention networks for robust POI recommendation. IEEE Trans. Knowl. Data Eng. 2023, 36, 2895–2909. [Google Scholar] [CrossRef]
  22. Zhang, J.; Li, Y.; Zou, R.; Zhang, J.; Jiang, R.; Fan, Z.; Song, X. Hyper-relational knowledge graph neural network for next POI recommendation. World Wide Web 2024, 27, 46. [Google Scholar] [CrossRef]
  23. Liu, S.; Qi, Y.; Li, G.; Chen, M.; Zhang, T.; Cheng, J.; Lei, J. STGIN: Spatial-Temporal Graph Interaction Network for Large-scale POI Recommendation. In Proceedings of the 32nd ACM International Conference on Information and Knowledge Management, Birmingham, UK, 21–25 October 2023; pp. 4120–4124. [Google Scholar]
  24. Han, H.; Zhang, M.; Hou, M.; Zhang, F.; Wang, Z.; Chen, E.; Wang, H.; Ma, J.; Liu, Q. STGCN: A spatial-temporal aware graph learning method for POI recommendation. In Proceedings of the 2020 IEEE International Conference on Data Mining (ICDM), Virtual, 17–20 November 2020; pp. 1052–1057. [Google Scholar]
  25. Wang, Z.; Zhu, Y.; Liu, H.; Wang, C. Learning graph-based disentangled representations for next POI recommendation. In Proceedings of the 45th International ACM SIGIR Conference on Research and Development in Information Retrieval, Madrid, Spain, 11–15 July 2022; pp. 1154–1163. [Google Scholar]
  26. Yan, X.; Song, T.; Jiao, Y.; He, J.; Wang, J.; Li, R.; Chu, W. Spatio-temporal hypergraph learning for next POI recommendation. In Proceedings of the 46th International ACM SIGIR Conference on Research and Development in Information Retrieval, Taipei, Taiwan, 23–27 July 2023; pp. 403–412. [Google Scholar]
  27. Liu, Y.; Pham, T.A.N.; Cong, G.; Yuan, Q. An experimental evaluation of point-of-interest recommendation in location-based social networks. Proc. VLDB Endow. 2017, 10, 1010–1021. [Google Scholar] [CrossRef]
  28. Sánchez, P.; Bellogín, A. Point-of-interest recommender systems based on location-based social networks: A survey from an experimental perspective. ACM Comput. Surv. (CSUR) 2022, 54, 1–37. [Google Scholar] [CrossRef]
  29. Wang, X.; Sun, G.; Fang, X.; Yang, J.; Wang, S. Modeling Spatio-temporal Neighbourhood for Personalized Point-of-interest Recommendation. In Proceedings of the IJCAI, Vienna, Austria, 23–29 July 2022; pp. 3530–3536. [Google Scholar]
  30. Chen, W.; Wan, H.; Guo, S.; Huang, H.; Zheng, S.; Li, J.; Lin, S.; Lin, Y. Building and exploiting spatial–temporal knowledge graph for next POI recommendation. Knowl.-Based Syst. 2022, 258, 109951. [Google Scholar] [CrossRef]
  31. Beneduce, C.; Lepri, B.; Luca, M. Large language models are zero-shot next location predictors. arXiv 2024, arXiv:2405.20962. [Google Scholar] [CrossRef]
  32. Wongso, W.; Xue, H.; Salim, F.D. GenUP: Generative User Profilers as In-Context Learners for Next POI Recommender Systems. arXiv 2024, arXiv:2410.20643. [Google Scholar]
  33. Li, P.; de Rijke, M.; Xue, H.; Ao, S.; Song, Y.; Salim, F.D. Large language models for next point-of-interest recommendation. In Proceedings of the 47th International ACM SIGIR Conference on Research and Development in Information Retrieval, Washington, DC, USA, 14–18 July 2024; pp. 1463–1472. [Google Scholar]
  34. Zhu, C.; Chen, M.; Fan, C.; Cheng, G.; Zhang, Y. Learning from history: Modeling temporal knowledge graphs with sequential copy-generation networks. In Proceedings of the AAAI Conference on Artificial Intelligence, Virtual, 19–21 May 2021; Volume 35, pp. 4732–4740. [Google Scholar]
  35. Xu, Y.; Ou, J.; Xu, H.; Fu, L. Temporal knowledge graph reasoning with historical contrastive learning. In Proceedings of the AAAI Conference on Artificial Intelligence, Washington, DC, USA, 7–14 February 2023; Volume 37, pp. 4765–4773. [Google Scholar]
  36. Chen, Y.; Wu, A.; DePodesta, T.; Yeh, C.; Li, K.; Marin, N.C.; Patel, O.; Riecke, J.; Raval, S.; Seow, O.; et al. Designing a dashboard for transparency and control of conversational AI. arXiv 2024, arXiv:2406.07882. [Google Scholar]
Figure 1. Comparison between classic DL-based models, current LLM-based models, and using DL-based models as LLM plugins.
Algorithms 18 00376 g001
Figure 2. (a) Proportion of check-ins at different time slots in the NYC dataset. (b) Proportion of check-ins at different time slots in the CA dataset.
Algorithms 18 00376 g002
Figure 3. (a) Check-in frequency of some POIs at different time slots in the NYC dataset. (b) Check-in frequency of some POIs at different time slots in the CA dataset.
Algorithms 18 00376 g003
Figure 4. (a) Distribution of POI category transfers for successive check-in pairs in the NYC dataset. (b) Temporal transfer distribution of successive check-in pairs in the CA dataset.
Algorithms 18 00376 g004
Figure 5. Framework of PSLM4ST.
Algorithms 18 00376 g005
Figure 6. An example of our TKG with three snapshots and the POI transfer reflecting global patterns. ‘POI Transfer’ means the potential crowd movement patterns between POIs. ‘Time Slot’ means the user’s check-in in a specific time slot. ‘?’ indicates that the current user did not check in or was missing check-in data during that time slot.
Algorithms 18 00376 g006
Figure 7. Plugin-enhanced recommendations.
Algorithms 18 00376 g007
Figure 8. The top-N accuracy of the plugin model’s preliminary predictions.
Algorithms 18 00376 g008
Figure 9. Top-N accuracy analysis in each module for three tasks.
Algorithms 18 00376 g009
Figure 10. Sensitivity of hyperparameters α and β .
Algorithms 18 00376 g010
Figure 11. Performance comparison from the ablation study. The green line indicates a relative increase in the mean metric values.
Algorithms 18 00376 g011
Table 1. Statistics of the datasets.
Dataset#Users#POIs#CATs#COOs#Check-ins#Time Slots
NYC97849593186091,87296
TKY2267783128960364,40896
CA3695968029560201,52412
Table 2. Performance comparison against baselines on three datasets.
MethodsNYCTKYCA
Acc@1Acc@5Acc@10MRRAcc@1Acc@5Acc@10MRRAcc@1Acc@5Acc@10MRR
UTopRec0.16540.33500.35880.24640.14900.32690.35900.23140.13110.25910.29830.1938
FPMC0.10030.21260.29700.17010.08140.20450.27460.13440.03830.07020.11590.0911
STGN0.17160.33810.41220.25980.16890.33910.38480.24220.09820.31670.40640.2040
GETNext0.24350.50890.61430.36210.22540.44170.52870.32620.13570.28520.35900.2103
STHGCN0.27340.53610.62440.39150.29500.52070.59800.39860.17300.35290.41910.2558
MTNet0.26200.53810.63210.38550.25750.49770.58480.36590.14530.34190.41630.2367
ROTAN0.31060.52810.61310.41040.24580.46260.53920.34750.21990.37180.43340.2931
PSLM4ST0.33880.58940.67870.44640.30590.55960.64930.41720.19480.37940.45810.2855
Table 3. Performance comparison against LLM-based baselines in terms of Acc@1 on three datasets.
MethodBase Model#paramsNYCTKYCA
LLM-ZSGPT-3.5 TurboN/A0.1920.199N/A
GenUPLlama 27B0.25750.16990.1094
PSLM4STLlama 27B0.33880.30590.1948
Disclaimer/Publisher’s Note: The statements, opinions and data contained in all publications are solely those of the individual author(s) and contributor(s) and not of MDPI and/or the editor(s). MDPI and/or the editor(s) disclaim responsibility for any injury to people or property resulting from any ideas, methods, instructions or products referred to in the content.

