1. Introduction
Intelligent automation, monitoring, and optimization are increasingly critical in industrial processes. These systems rely heavily on robust visual perception, including accurately interpreting and aligning critical visual cues, like floor markings, for autonomous-guided-vehicle (AGV) navigation [
1], equipment labels, safety signs, and quality control markers. Understanding and aligning these real-world visual elements with their digital twins, templates, or reference models is crucial for providing automated guidance, tracking assets, verifying processes, and monitoring conditions. However, just like external transportation infrastructure, real-world industrial environments present significant challenges to visual perception due to variations in lighting, dust accumulation, wear and tear, partial occlusion, and changes in viewpoint.
These challenges are highly analogous to those faced when analyzing external road markings. Road markings are fundamental elements of transportation infrastructure, playing critical roles in ensuring road safety [
2], guiding traffic flows, and enabling navigation for both human drivers and autonomous vehicles (AVs). Maintaining the visibility and integrity of these markings is paramount. Consequently, efficient and accurate methods for monitoring their condition, verifying their type and placement against standards or maps, and assessing potential damage are increasingly vital for road authorities and AV developers.
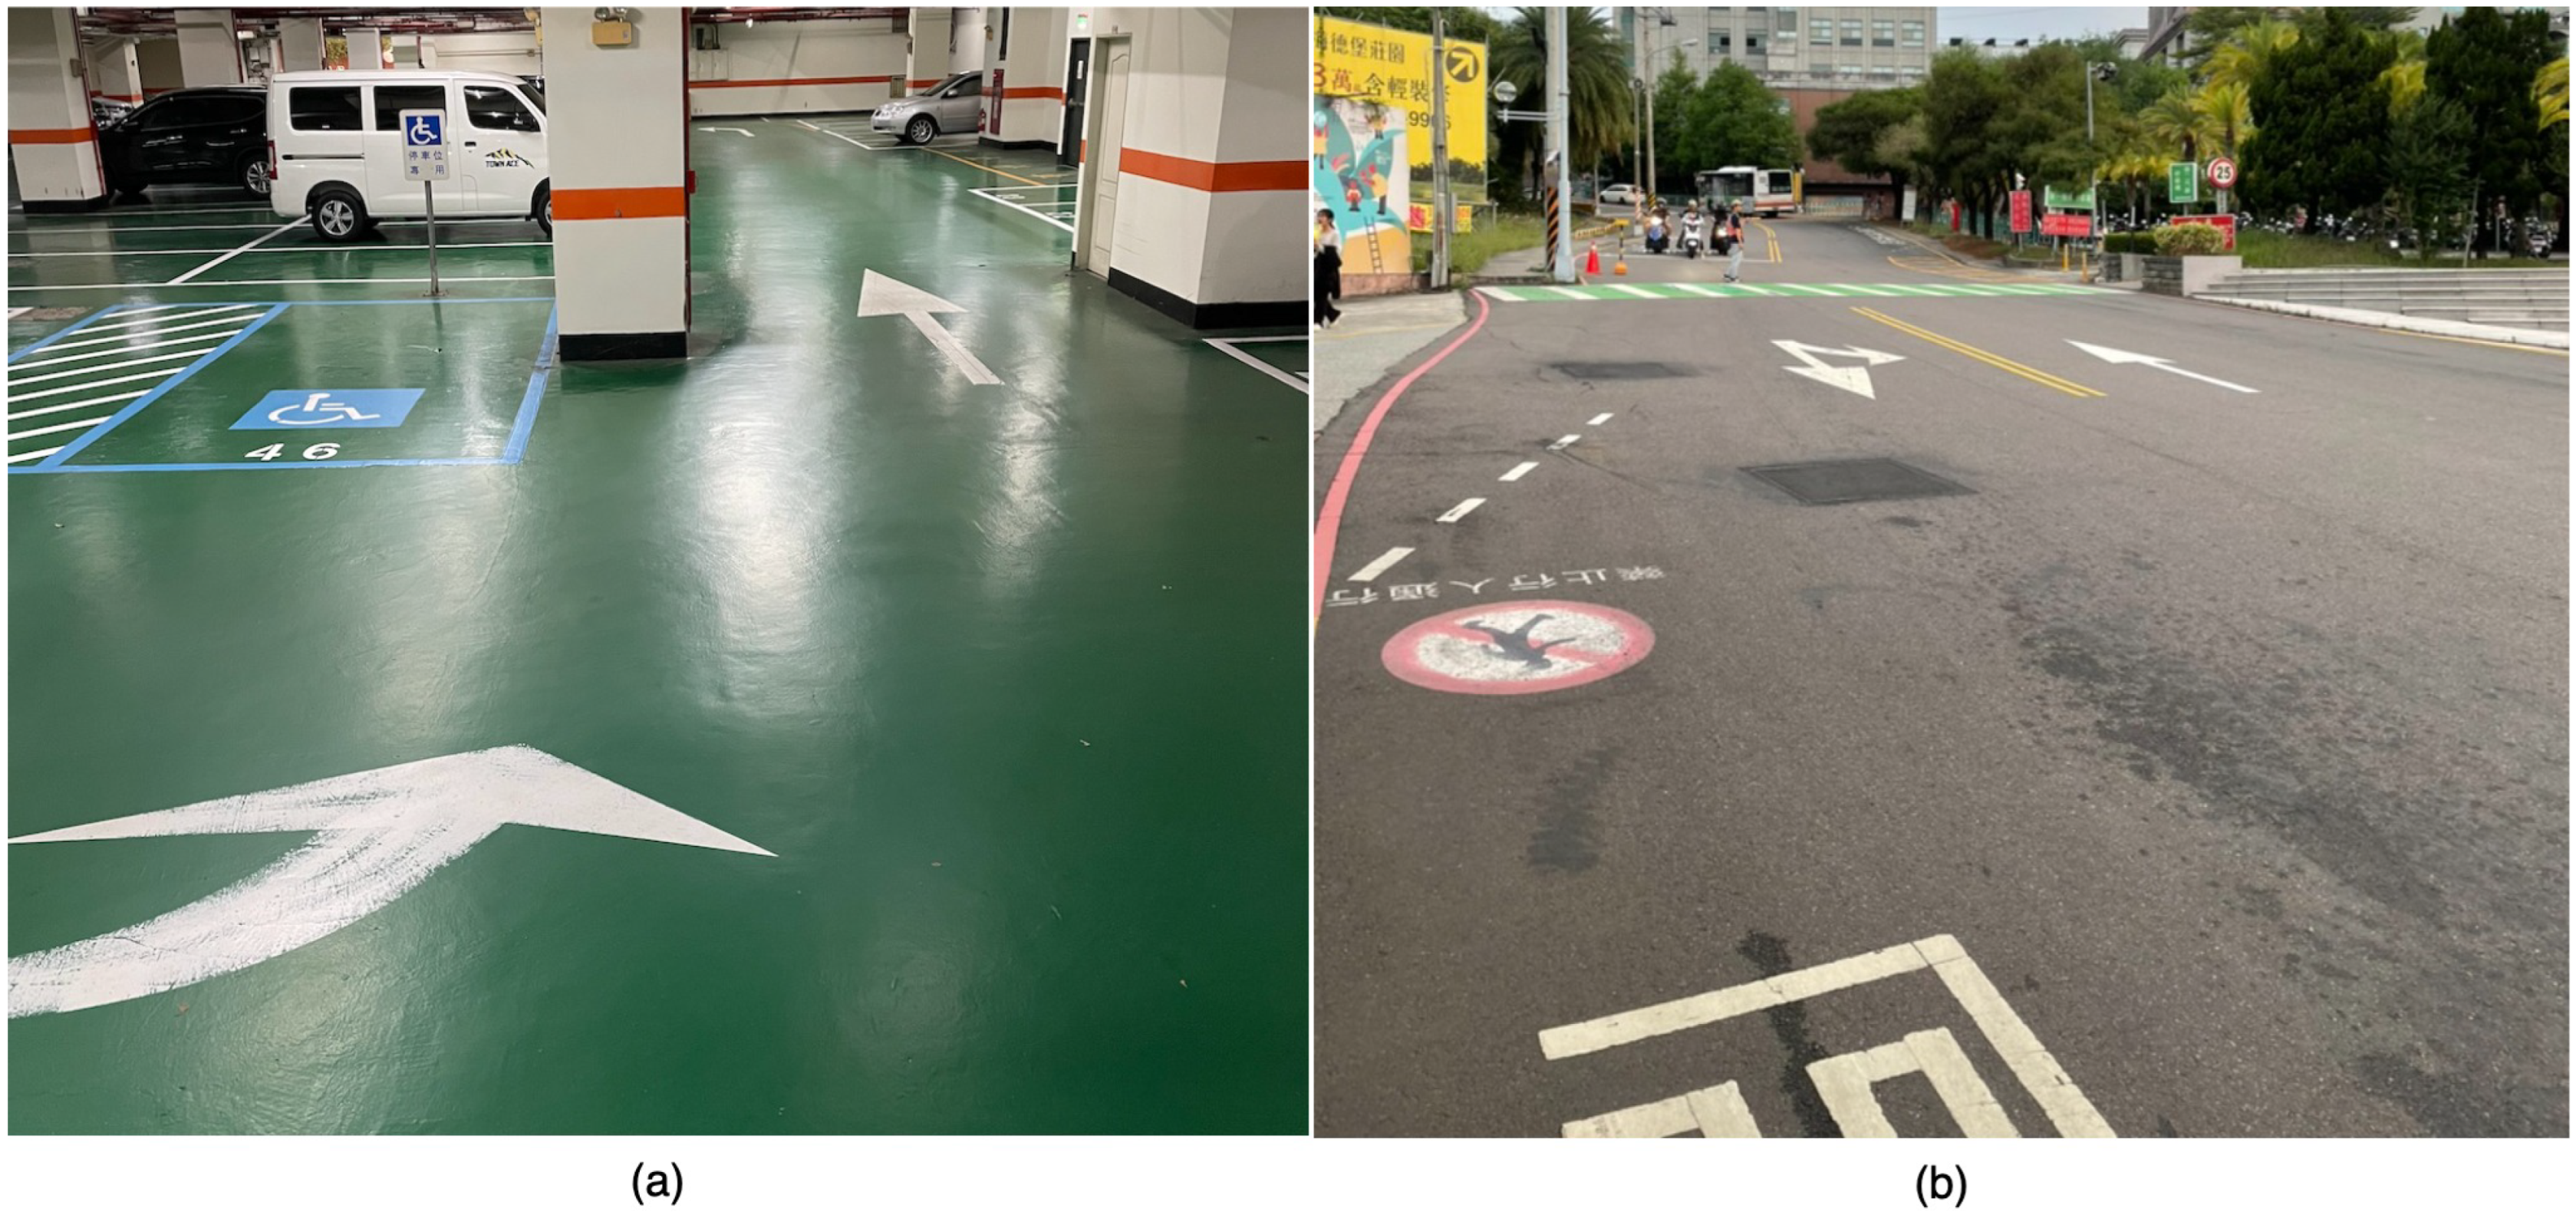
As illustrated in
Figure 1, industrial and road-marking signs share fundamental visual characteristics and are susceptible to similar degradation processes, viewpoint changes, diverse lighting, and potential motion blur. These factors severely impact the appearance of real-world instances. Furthermore, even clean, canonical template images of these elements, such as the road-marking templates we study, often have simple structures, like straight lines and few distinct corners. This characteristic makes them particularly challenging for classical computer vision techniques, such as hand-crafted feature detectors (e.g., SIFT [
3] and ORB [
4]). Traditional methods designed to find complex, textured features often detect only a limited number of points on these plain templates, frequently resulting in fewer than the minimum required correspondences (e.g., four for affine transformations) for robust geometric alignment using methods like RANSAC [
5]. This limitation applies not only to aligning templates with degraded real-world instances but also to the simpler task of aligning a template with its geometrically transformed version.
In addressing the fundamental need for a robust geometric understanding of these visual elements, particularly their template structures, we propose utilizing deep-learning techniques to learn reliable keypoints that overcome the limitations of traditional feature detection in feature-poor templates. The manual annotation of keypoints in extensive datasets is often unfeasible. Consequently, focusing on road-marking templates as representative structured elements, we introduce GeoTemplateKPNet. This innovative framework utilizes self-supervised learning to accurately predict robust, geometrically consistent keypoints tailored to the distinct geometries or structures of specific visual element classes, using only synthetic template data for training and experimentation. This eliminates the need for manual keypoint labels and avoids reliance on real-world instance data during experimental training and evaluation.
Our core idea is that meaningful keypoints or features can be learned by enforcing equivariance and consistency constraints under various relevant transformations applied to input template data. Uniquely, GeoTemplateKPNet is trained and experimentally evaluated exclusively on synthetic template images, enabling the model to learn features that are robust to geometric transformations of the template itself. We employ a multi-head architecture where a shared backbone extracts common visual features, and class-specific heads learn to predict K keypoints tailored to the distinct geometry or structure of each visual element class, focusing on five arrow-based road-marking template types in this work.
Despite advancements in image alignment, a persistent issue remains: aligning structured, feature-poor templates accurately to their transformed versions. This challenge is critical in areas like road-marking analysis, where templates (e.g., arrow shapes and crosswalks) lack distinctive textures and are geometrically simple and and symmetrical. Traditional feature-based methods, such as SIFT or ORB, fail due to the unreliability of their features. Moreover, creating comprehensive datasets with manually labeled ground-truth keypoints for all road-marking variants is impractical and often undefined. This gap—lacking a reliable method for self-supervised keypoint learning on these templates—hinders applications needing precise geometric analysis, such as automated condition assessment and maintenance planning. This paper proposes a novel framework to learn geometrically consistent keypoints in a self-supervised manner on these challenging template structures.
The keypoints learned by GeoTemplateKPNet on the template serve as a foundation for robust geometric analysis. By detecting corresponding keypoints on a template and its transformed version (using the class ID to select the appropriate class head) and establishing correspondences, we can estimate the transformation that aligns the template. Achieving such robust and accurate alignment on templates, where traditional methods often fail due to insufficient features, demonstrates the significant potential of our method. This capability is a crucial step toward the larger goal of robust template-to-real-world instance alignment, which, in turn, enables a range of critical downstream analysis tasks in infrastructure monitoring and analogous industrial applications, such as transferring segmentation masks or performing condition assessments, by analyzing discrepancies between the aligned template and the real-world instance. While our method demonstrates significant potential and succeeds in learning robust keypoints for most of the tested classes, it is essential to note that it was not successful with every class, highlighting areas for future improvement.
The main contributions of this paper are as follows:
A self-supervised deep-learning technique for detecting robust, geometrically meaningful keypoints on synthetic templates of visual element classes (demonstrated on road-marking templates) and trained without manual keypoint annotations by enforcing equivariance to geometric transformations applied to the template data;
The successful application and evaluation of a multi-head architecture for class-specific keypoint prediction within this self-supervised framework, tailoring feature learning to different template geometries;
The demonstration and quantitative evaluation of a robust template-to-transformed-template alignment pipeline leveraging the learned keypoints on synthetic data, highlighting its effectiveness compared to the failure of classical feature-based methods (like ORB) on these templates, thereby showcasing the method’s potential for future template-to-real-world instance alignment.
This paper is structured as follows:
Section 2 reviews related work.
Section 3 describes the proposed GeoTemplateKPNet methodology, covering the model architecture, self-supervised loss functions, training strategy, and datasets.
Section 4 outlines the experimental setup and results, with comparisons and ablation studies.
Section 5 offers a discussion. Lastly,
Section 6 wraps up the paper and proposes directions for future research.
2. Related Work
Robust visual perception, including the accurate analysis and alignment of critical visual cues (like floor markings, labels, or infrastructure elements), is fundamental for intelligent automation, monitoring, and optimization in industrial processes and civil infrastructure management. However, real-world environments in both domains present significant challenges due to variations in viewpoint, lighting, degradation, and occlusion, which severely impact the robustness of traditional computer vision techniques and complicate downstream analysis tasks, such as condition assessment or state estimation. This section reviews relevant work in the automated analysis of visual elements, focusing on road markings as a representative case study, geometric image alignment, and self-supervised feature learning, while highlighting the limitations that motivate our approach to address these shared challenges.
2.1. Visual-Element Analysis and Condition/State Assessment
Identifying and localizing visual elements are often necessary precursors for automated analysis tasks in industrial and infrastructure monitoring. In the context of road markings, these involve detecting markings despite challenging conditions experienced by vehicle-mounted cameras [
6,
7,
8]. Such tasks often necessitate aligning the observed real-world instance to a standardized template or a digital model for consistent measurement, verification against standards, or condition assessment (e.g., quantifying wear or damage) [
9,
10]. A critical challenge here is that appearance changes due to genuine degradation or state change must be disentangled from those caused by variations in viewpoint, scale, rotation, or illumination. This highlights the fundamental need for robust geometric normalization, typically achieved through aligning the real-world instance with its corresponding template.
However, achieving reliable and accurate template-to-real-world instance alignment remains a significant challenge. Traditional methods often struggle with the large appearance gap between clean templates and degraded, noisy instances. There is currently no widely accepted solid solution for this specific alignment problem in challenging real-world conditions. The ability to robustly align a template to a real-world instance is crucial for reliable downstream analysis. Still, it first requires a method capable of understanding the underlying geometric structure of the template itself in a transformation-robust manner.
2.2. Image Alignment and Registration
Image alignment, also known as registration, aims to find the spatial transformation that maps points or regions between images or a template and an image. This process is crucial for normalizing the view of a visual element’s instance (such as a road marking or an industrial label) relative to a canonical template or a digital model, enabling consistent measurement and comparison. Classical feature-based methods, like SIFT [
3], SURF [
11], and ORB [
4], detect local invariant features and use robust estimators like, RANSAC [
5], to compute transformations. While effective in many general vision tasks, these methods often struggle significantly when applied to template images of structured elements, such as road markings. Such templates frequently possess simple geometric shapes with limited texture or distinct corner features. Traditional feature detectors designed for complex images often detect only a sparse set of points on these plain structures.
Furthermore, standard SIFT and ORB, while offering some robustness to scale and rotation, are not fully invariant to the general affine transformations commonly encountered in viewpoint changes. This combination of difficulty in detecting a sufficient number of features on simple template structures and limited invariance to affine distortions makes traditional feature-based methods unreliable for robust template-to-transformed-template alignment, let alone the more complex template-to-real-world instance problem. Direct template matching based on correlation is similarly sensitive to geometric variations [
12]. Deep learning has also been applied to image alignment; Spatial Transformer Networks (STNs) [
13] learn implicit transformations, and more recent deep keypoint correspondence networks learn robust features [
14,
15]. Our work falls into this broader category but is specifically tailored for the challenge of learning keypoints on structured templates, using a self-supervised approach.
2.3. Deep Learning for Road-Marking Analysis and Alignment
The demand for robust and autonomous navigation systems has accelerated advancements in deep-learning-based road-marking analysis and alignment. Unlike traditional methods, deep-learning models can learn complex patterns directly from data, making them effective in managing the diverse appearances and environmental variations of road markings.
A key application of deep learning in this area is the detection of road markings, using CNNs [
16,
17] for semantic segmentation, allowing for pixel-level classification of lane lines, arrows, and crosswalks. Many studies have employed encoder–decoder CNN architectures to effectively detect and outline lane markings and road signs in real time, frequently using classical post-processing techniques for precise geometric fitting. These models can accurately identify and localize road markings across a range of lighting and weather conditions.
In addition to detection, deep learning is increasingly used for extracting structured geometric representations that aid in alignment and mapping. Advanced systems, such as the Vectorized-Map-Annotation (VMA) [
18] framework, utilize transformer-based architectures to represent road markings as ordered “corner point sequences”. This output provides detailed geometric information suitable for dense mapping tasks. Deep models also enhance our understanding of the relationships between road elements; for example, networks, like TopoNet [
19], model the connections among lanes, intersections, and traffic signs, supporting the global alignment and interpretation of road layouts.
These developments underscore the crucial role of deep learning in enhancing road-marking analysis, providing effective solutions for traditionally challenging tasks. While many techniques focus on detection, the results they produce often serve as the foundation for subsequent alignment processes. This manuscript presents a novel self-supervised method for learning consistent keypoints on structured, feature-poor templates, thereby distinguishing it from the broader CNN-based detection and segmentation tasks.
2.4. Self-Supervised Keypoint/Landmark/Feature Detection
Learning reliable keypoints, landmarks, or representative features directly from data, without requiring extensive manual annotations, is a promising direction for overcoming labeling costs in various vision tasks, including industrial inspection and infrastructure monitoring. One major category of self-supervised learning focuses on enforcing geometric equivariance or consistency: Models are trained to predict stable features, even when the input image is transformed [
20,
21,
22,
23]. Another approach involves using reconstruction tasks or bottleneck architectures to force a network to encode an image’s structure through a sparse set of points [
24,
25]. Task-driven methods learn features optimized for a specific downstream task [
26]. A common challenge across self-supervised feature-learning methods is ensuring that the learned points or features are well-distributed and consistently located on meaningful parts of the object or indicative of specific states, rather than collapsing to a single point or drifting into the background. This often requires additional regularization.
2.5. Our Approach in Context
As reviewed, achieving robust visual element analysis and condition/state assessment in challenging real-world environments, common to both industrial and infrastructure domains, is significantly hindered by geometric and photometric variations. A critical prerequisite for such analysis is the accurate alignment of the real-world instance with a standard template; however, robust template-to-real-world instance alignment remains a notable challenge, with no widely accepted solution, largely due to the significant appearance gap and complex variations in real-world data.
Traditional alignment techniques often fail to reliably normalize these variations for degraded or noisy instances. Furthermore, as discussed in
Section 2.2, these traditional methods also struggle with the simpler task of aligning a template to its geometrically transformed version, primarily because they find insufficient reliable features in the plain structures typical of templates and are limited in their invariance to affine transformations. For such visual perception tasks, CNNs are particularly well-suited due to their inherent ability to learn hierarchical spatial features and capture complex patterns directly from image data, making them the standard choice for image-based analyses.
While self-supervised feature learning (
Section 2.4) offers a compelling approach to obtain correspondences or representations without manual labels, existing methods have not been specifically developed and evaluated for the crucial task of learning robust keypoints on structured templates for geometric analysis.
Our proposed GeoTemplateKPNet addresses this gap by presenting a novel self-supervised framework specifically designed to learn robust, geometrically consistent keypoints tailored for structured template images. By training exclusively on synthetic template data and leveraging the advantages of templates, such as the availability of precise masks for the initial localization guidance and the ability to generate vast amounts of heavily augmented training data, our method learns features that are inherently robust to geometric transformations, like affine distortions. This capability is demonstrated through robust template-to-transformed-template alignment, where traditional methods fail. We employ a multi-head architecture to specialize keypoint prediction for different template geometries.
This work serves as a foundational step, demonstrating the potential of our self-supervised approach for learning robust keypoints on templates. While applying these learned keypoints for template-to-real-world instance alignment is the ultimate goal and an area for future work (which may involve strategies like using Generative Adversarial Networks (GANs) [
27] to bridge the domain gap between templates and instances), this paper establishes the critical capability of reliably extracting geometrically robust keypoints directly from the template structure itself. Our work distinguishes itself by providing an effective, self-supervised solution for learning keypoints from challenging, feature-poor template data, thereby showcasing its potential applicability in facilitating alignment tasks across various domains.
3. Methodology
This section outlines the proposed GeoTemplateKPNet methodology, detailing the datasets used, network architecture, keypoint representation, coordinate extraction, self-supervised training strategy, self-supervised loss functions, total loss calculation, and evaluation metrics.
3.1. Datasets
We employed a synthetic template dataset exclusively for training and quantitative evaluation in this work. Examples illustrating a base template and an augmented version are shown in
Figure 2.
Synthetic Template Dataset
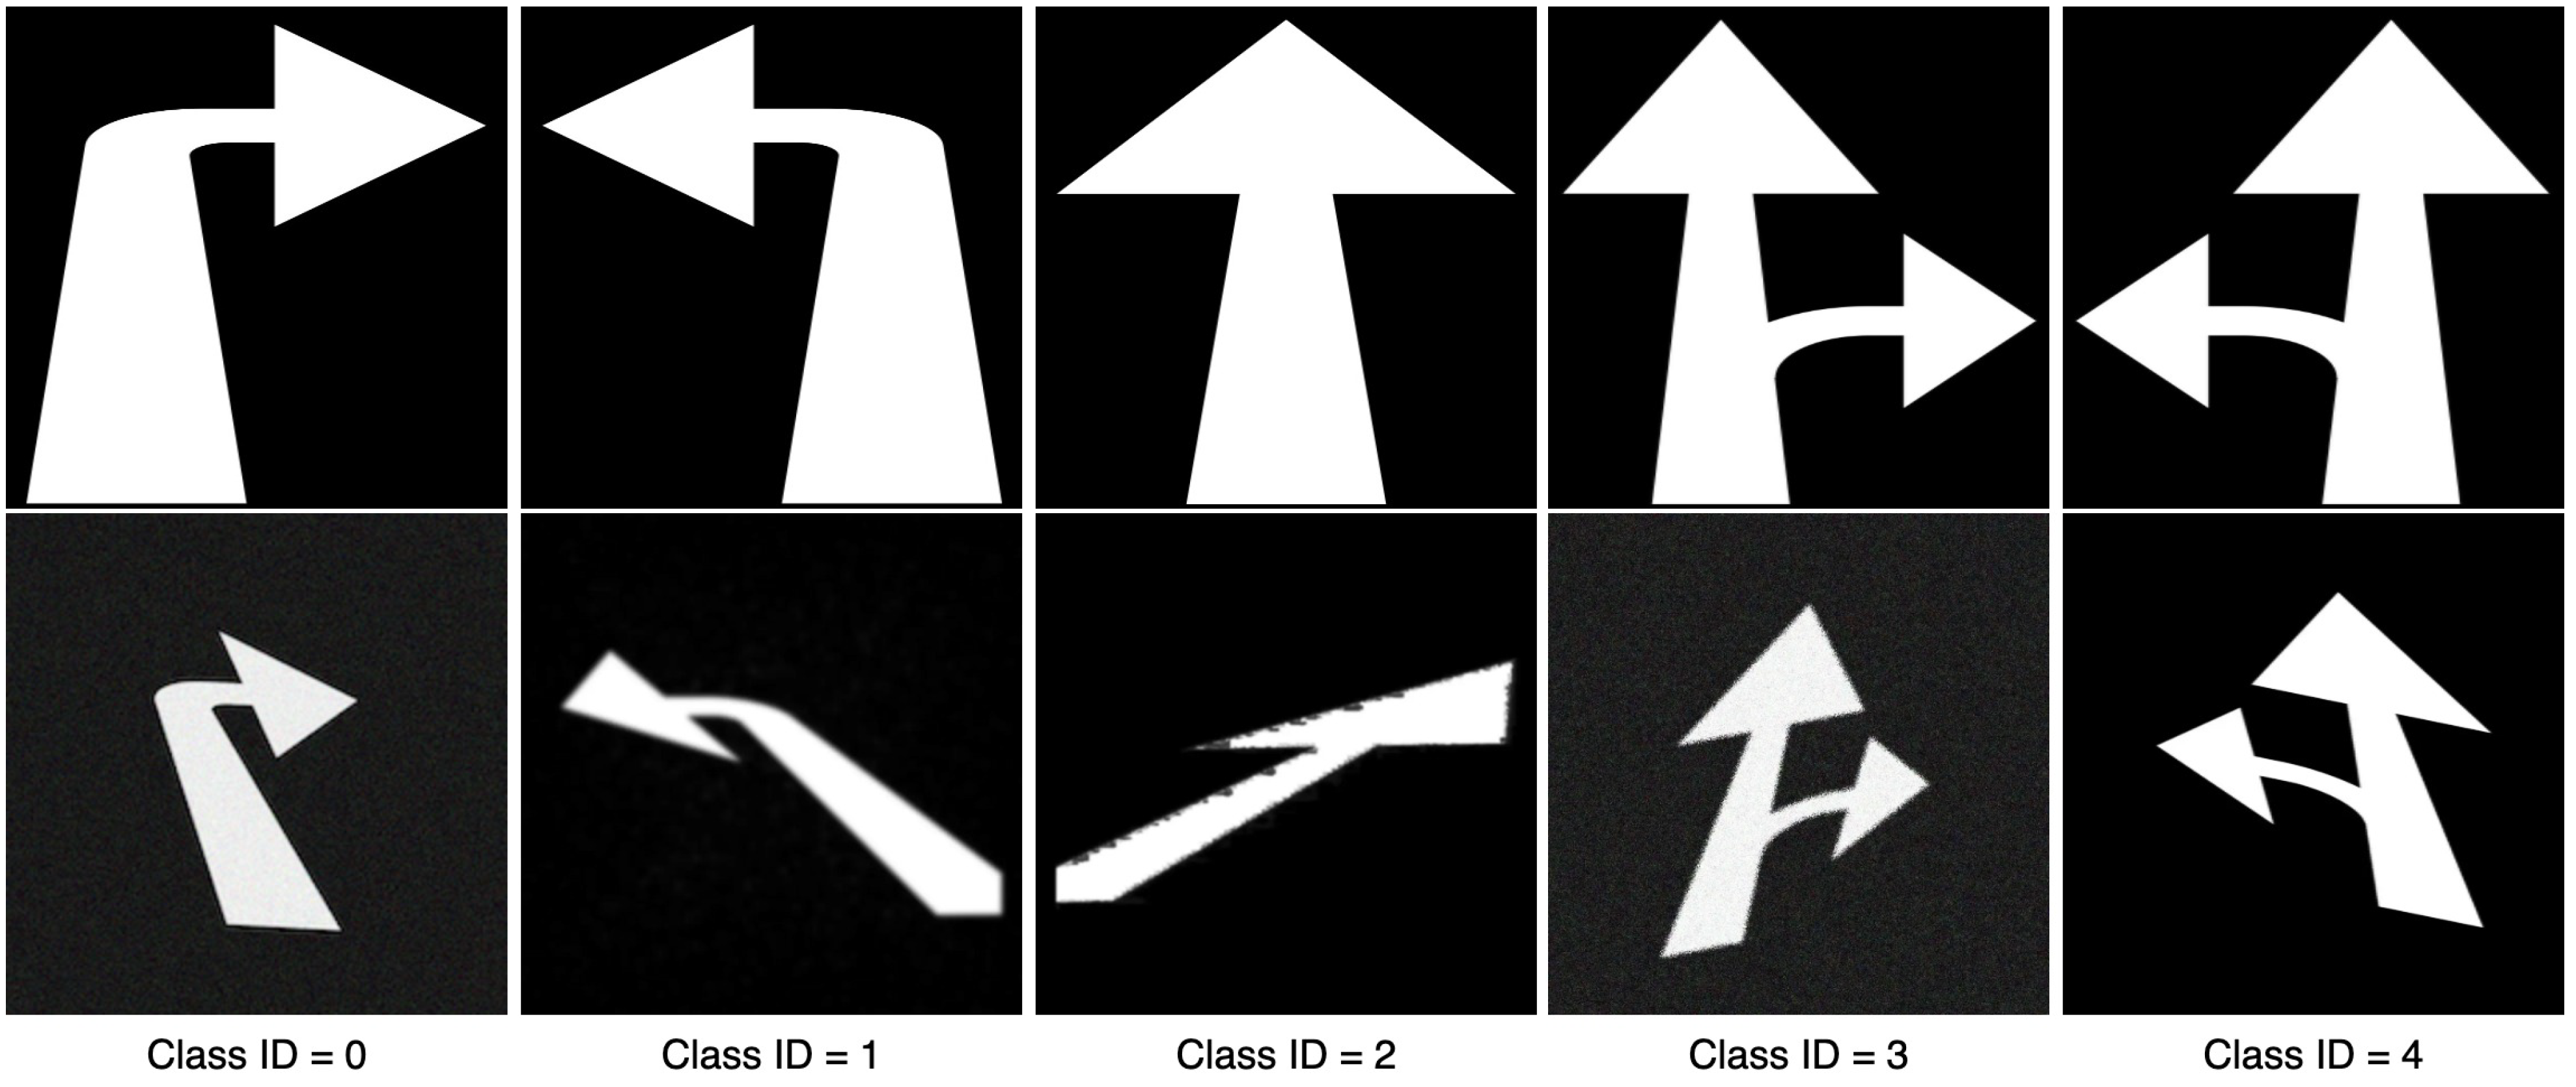
This dataset comprises synthetic template images generated from vector graphics of the five arrow-based road-marking types considered in this work: a straight arrow, a straight arrow with a turn-left arrow, a straight arrow with a turn-right arrow, a turn-left arrow, and a turn-right arrow. These templates are initially simple binary images (black background and white markings), with a consistent resolution of 224 × 224 pixels.
The choice of a synthetic template dataset was primarily driven by its significant advantages for self-supervised keypoint learning. Synthetic data enable the easy and precise generation of ground-truth masks, which are crucial for our Inside Mask Loss (), and allow for rigorous control over geometric transformations, facilitating robust data augmentation. This ensures that the training data consistently contain accurate and well-defined features, essential for training a model in a self-supervised manner without manual keypoint annotations.
For training, we extensively augmented these base templates dynamically during each iteration, using various geometric and photometric transformations from the Albumentations library [
28]. The augmentation consisted of several photometric transformations, including brightness, contrast, noise, random posterize, random solarize, random adjust sharpness, and random autocontrast, each applied with a probability of 0.7. Geometric transformations included ElasticTransform, rotation within the range of (−15, 15) degrees, scaling between 0.5 and 1.0, translation within (−0.05, 0.05) of the image height/width, and shear within the range of (−10, 10) degrees. The affine transformation was applied with a probability of 0.8, while the other geometric transformations (ElasticTransform, rotation, scaling, shear, and translation, excluding affine transformations) were each implemented with a probability of 0.7.
We specifically excluded horizontal and vertical flips due to the potential changes in the class identity for certain road markings. This process successfully produced a diverse array of augmented template instances for training, including two thousand augmented instances for each of the five classes, resulting in a total of ten thousand images for Stage 1 pre-training. Additionally, we generated 500 images per class, amounting to 2500 images for Stage 2.
For quantitative evaluation, a separate synthetic test set was created. This test set comprises five hundred affine-transformed images for each of the five template classes, totaling two thousand five hundred images. These transformations were applied to the base templates to simulate geometric variations and evaluate the model’s ability to predict consistent keypoints under such changes, forming the basis for template-to-transformed-template alignment experiments.
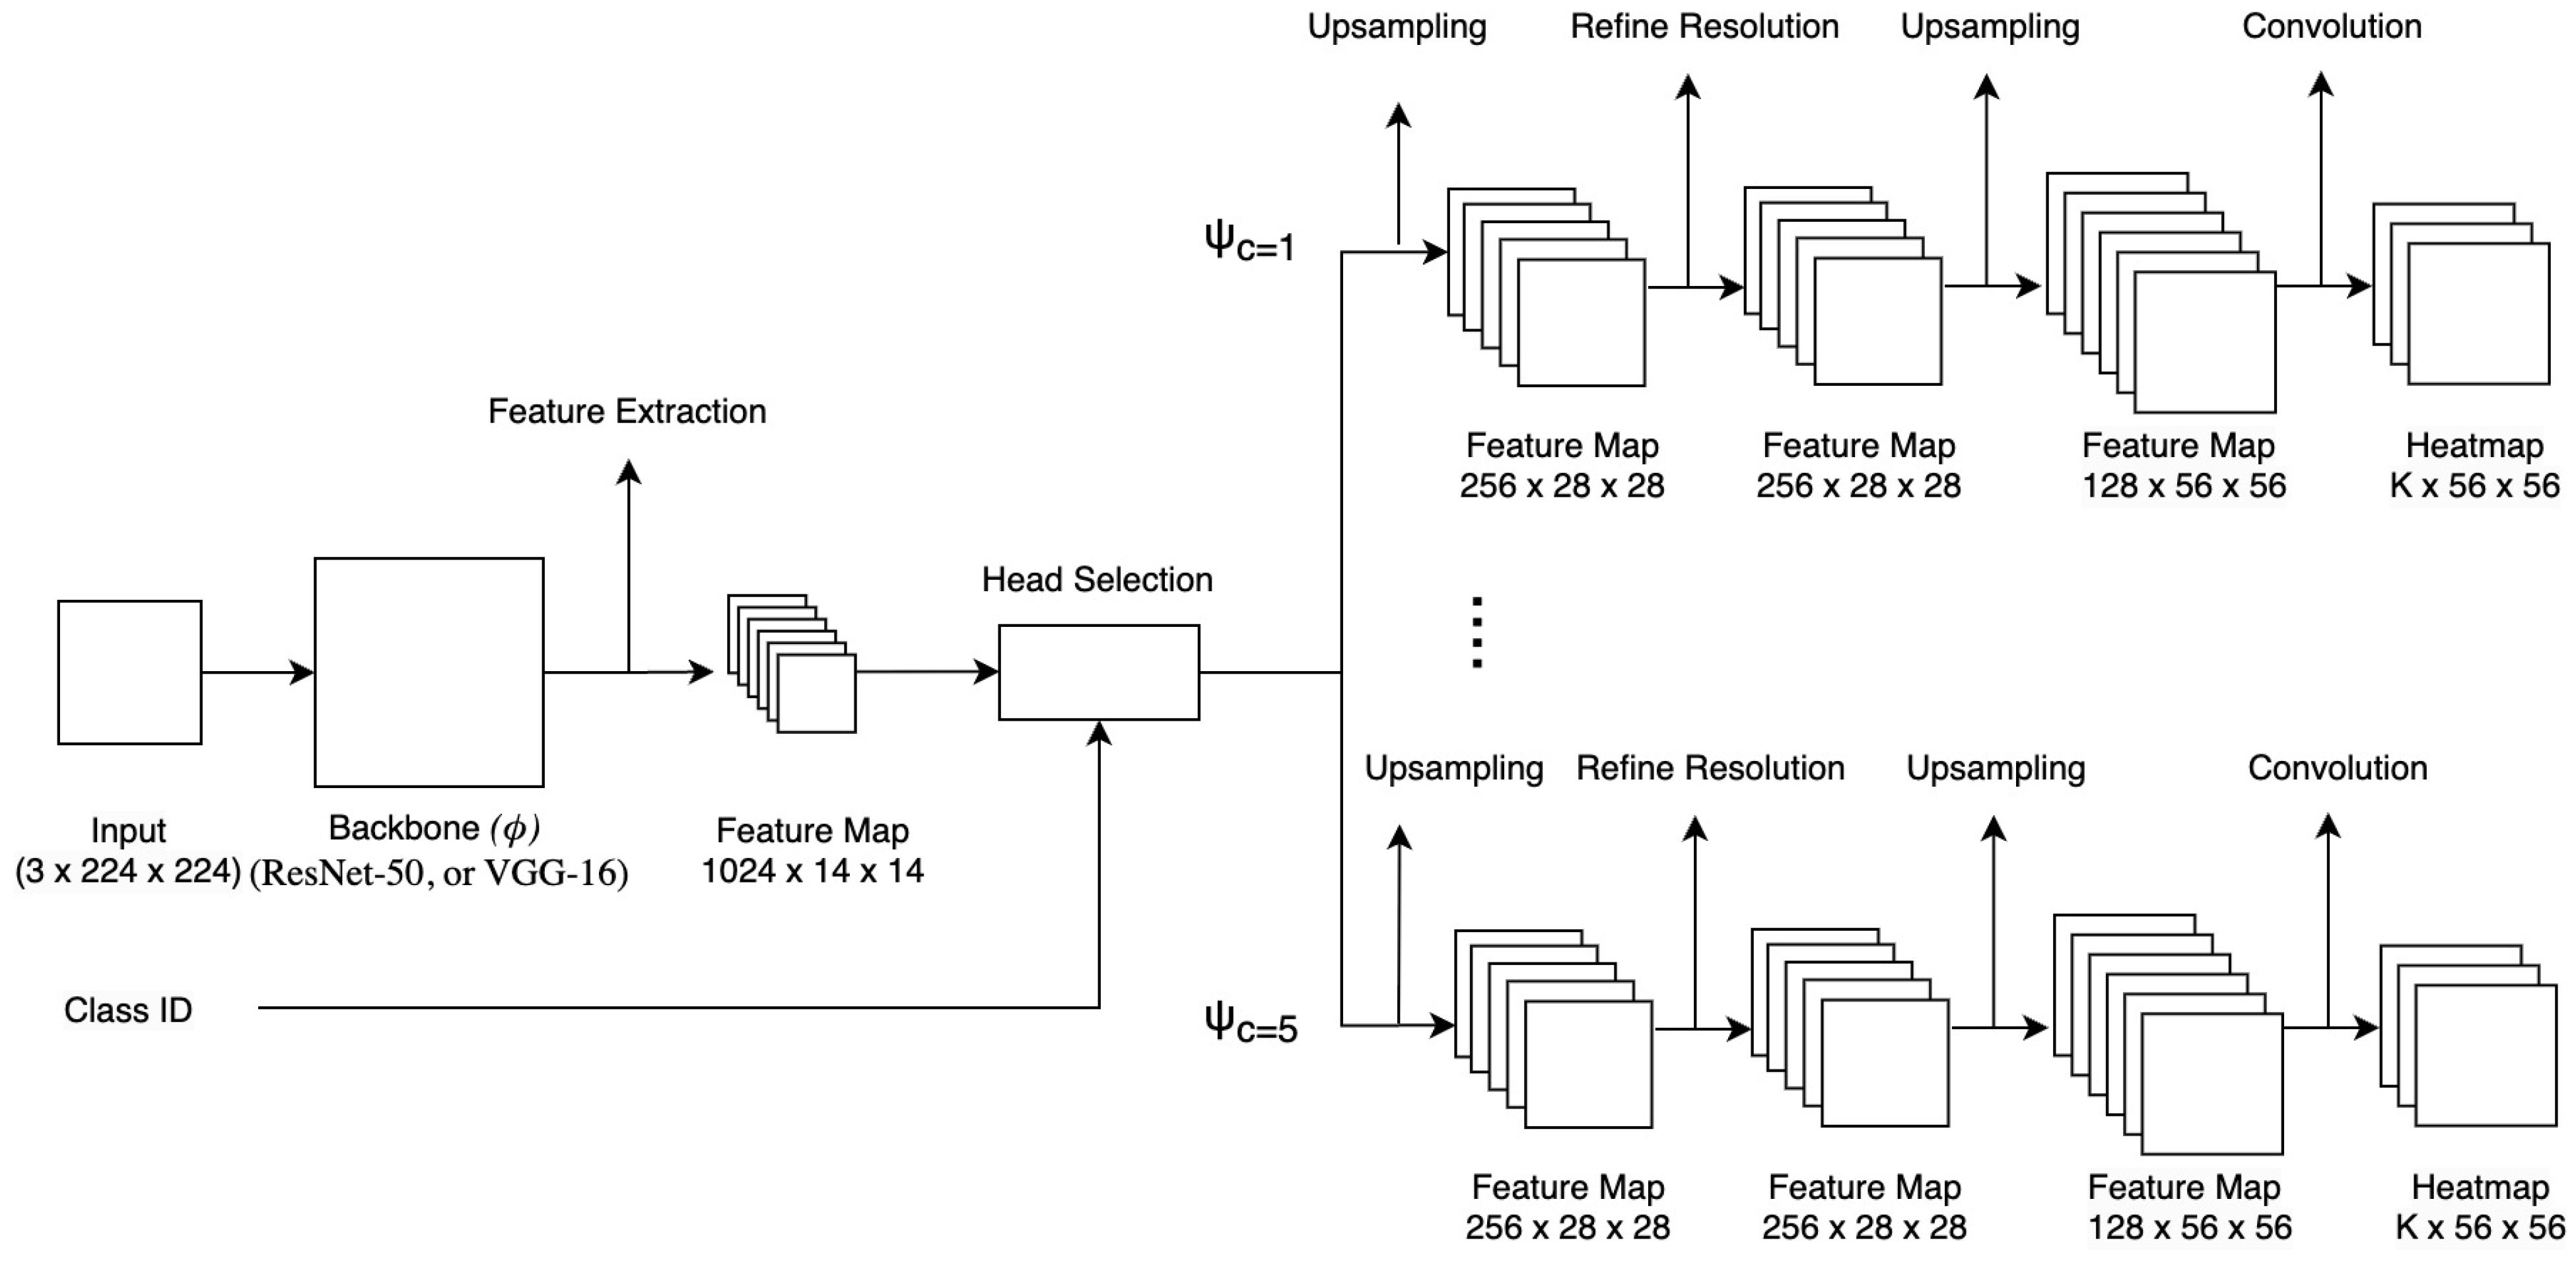
3.2. Network Architecture
The
GeoTemplateKPNet (
Figure 3) employs a multi-head architecture based on a shared convolutional neural network (CNN) backbone, which we denote as the function
. In our experiments, we explore different pre-trained backbone networks for
, including ResNet-50 [
29] or VGG-16 [
30]. The backbone (
) takes an input image (
), where B is the batch size and
are the input image’s height and width, and extracts a feature representation (
). The spatial dimensions of the feature map (
F) depend on the specific backbone architecture and the layer from which features are extracted. To achieve a desired final heatmap resolution, features are typically extracted from an intermediate layer of the backbone, where the spatial dimensions are
. For instance, with a
input image, features might be extracted from a layer yielding a spatial size of
(corresponding to a total stride of 16 from the input).
To handle the five main road-marking classes used in this work—a straight arrow, a straight arrow with a turn-left arrow, a straight arrow with a turn-right arrow, a turn-left arrow, and a turn-right arrow—the network employs
class-specific prediction heads. Each head can be viewed as a function (
), where
is the class ID. Given an input image (
I) of class
c, the corresponding features (
) are routed to the specific head (
). Each head (
) is designed to predict
K keypoints tailored to its specific class geometry. In this work, we explored different values for the number of keypoints (
K) per class, specifically testing
. The architecture described hereafter and detailed in
Table 1 corresponds to the configuration for
, which was found to yield the best performance within this tested range (See the results in
Section 4).
The keypoint predictions for an input image (I) of class c are represented as a set of K heatmaps, denoted as . The spatial resolution of these heatmaps () is determined by the backbone’s feature map size () and the head’s total upsampling factor (U), such that and . In our setup with input images and features extracted at , the heads are designed to produce heatmaps with a resolution of pixels (), implying a total upsampling factor of .
Each class-specific head (
) has the architecture detailed in
Table 1. The heads primarily consist of transpose convolutional layers for upsampling, standard convolutional layers for feature refinement, and batch normalization and ReLU activations. Dropout layers are incorporated within the heads to provide regularization and enhance the model’s generalization capability by mitigating overfitting. A dropout rate of 0.5 was applied. It is important to note that these dropout layers are active exclusively during the training phase to introduce stochasticity and prevent the co-adaptation of neurons. During the testing, the dropout layers are entirely deactivated to ensure deterministic and consistent predictions, which is standard practice in deep learning. These layers are omitted from the main architectural table for the clarity of the core structural components.
3.3. Keypoint Representation and Coordinate Extraction
The network predicts the location of each keypoint (
k) as a dense heatmap, which is a part of the tensor
for an input image (
I) of class
c. Higher values in the heatmap
indicate a higher probability of the keypoint
k being present at that location. To obtain differentiable keypoint coordinates (
) from these heatmaps (
), we employ the spatial softmax operation [
31]. Unlike simple non-differentiable peak-finding methods (such as finding the argmax location), the spatial softmax computes a weighted average (center of mass) over the heatmap, providing continuous, sub-pixel-precise, and, crucially, differentiable coordinates. This differentiability is essential for the self-supervised learning framework, as it allows gradients from the downstream losses to flow back through the coordinate prediction process, enabling the model to learn accurate and distinct keypoint locations without manual supervision and preventing keypoint collapse.
The extraction of the coordinates involves the following two steps:
Probability Calculation: Each keypoint heatmap (
) is normalized to a spatial probability distribution (
), using the softmax function
where
is the predicted heatmap value for keypoint
k at spatial location
,
and
are the height and width of the heatmaps;
Expected-Coordinate Calculation: The continuous coordinate
for keypoint
k is computed as the expected value (center of mass) over this probability distribution as follows:
These coordinates are calculated for each keypoint (k) and each image (b) in the batch, resulting in . The coordinates lie within the heatmap grid, and . This coordinate range reflects that in our experimental setup, the visual elements of interest are consistently contained within the boundaries of the input image.
Both the heatmaps () and the derived coordinates (P) are used in the loss calculations, forming the basis for the self-supervised training signals. The choice of the heatmap resolution factor (e.g., ) in this work was primarily made for experimental simplicity, allowing for the demonstration of the concept, with the potential for exploring other resolutions in future work.
3.4. Self-Supervised Two-Stage Training Strategy
We propose a novel two-stage self-supervised training strategy designed to effectively learn robust keypoints on structured templates without requiring manual annotation. This strategy utilizes the synthetic template dataset exclusively for both training stages. Starting with clean, geometry-based template images in the first stage enables the effective monitoring and adjustment of the learning process, using controllable factors, such as the template mask and known affine transform parameters, thereby providing confidence before attempting more complex scenarios.
Stage 1: Template Pre-training. In this initial stage, the network is trained exclusively in the synthetic dataset of augmented template images described in the section on the synthetic template dataset. These templates are generated from vector graphics of the five road-marking classes considered, with heavy data augmentation applied using the Albumentations library [
28]. The augmentation includes various photometric transformations (e.g., brightness, contrast, noise, random posterize, random solarize, random adjust sharpness, and random autocontrast) and geometric transformations (e.g., ElasticTransform, rotation, scale, shear, and translate), with specific probabilities, as detailed in the experimental setup. Horizontal and vertical flips are specifically excluded due to the potential for changes in the class identity for certain road markings.
The primary goal of this stage is to enable the network to learn the fundamental geometric structure of each template class and associate it with the
K keypoints. Training is performed for 300 epochs, using the Adam optimizer [
32] with a learning rate of 0.0001 and a batch size of 32. The total loss in Stage 1 is a weighted sum of the specific self-supervised loss components (
for rotation and affine transformations,
,
, and
), as detailed in
Section 3.5 and
Section 3.6.
Stage 2: Template Fine-tuning. After pre-training on templates for 300 epochs, the model weights are used to initialize the network for the second stage. In this stage, the network is fine-tuned using the Adam optimizer [
32], with a fixed low learning rate of 0.00001 and a batch size of 32. The training runs until the model converges or the loss stops improving significantly. The training is performed in the synthetic template dataset, using the same augmentation strategy as in Stage 1.
This stage aims to refine the features learned in Stage 1, ensuring robustness to geometric variations present in the augmented templates and optimizing the keypoints for accurate alignment between the templates and their transformed counterparts. Crucially, losses requiring template-specific mask information, such as the inside mask loss (), are not used in this stage, focusing instead on geometric consistency and alignment utility.
3.5. Self-Supervised Loss Functions
The self-supervised training process is guided by a combination of carefully designed loss terms. These losses encourage the network to learn robust, geometrically consistent, and spatially diverse keypoints on the structured templates without requiring manual keypoint annotations.
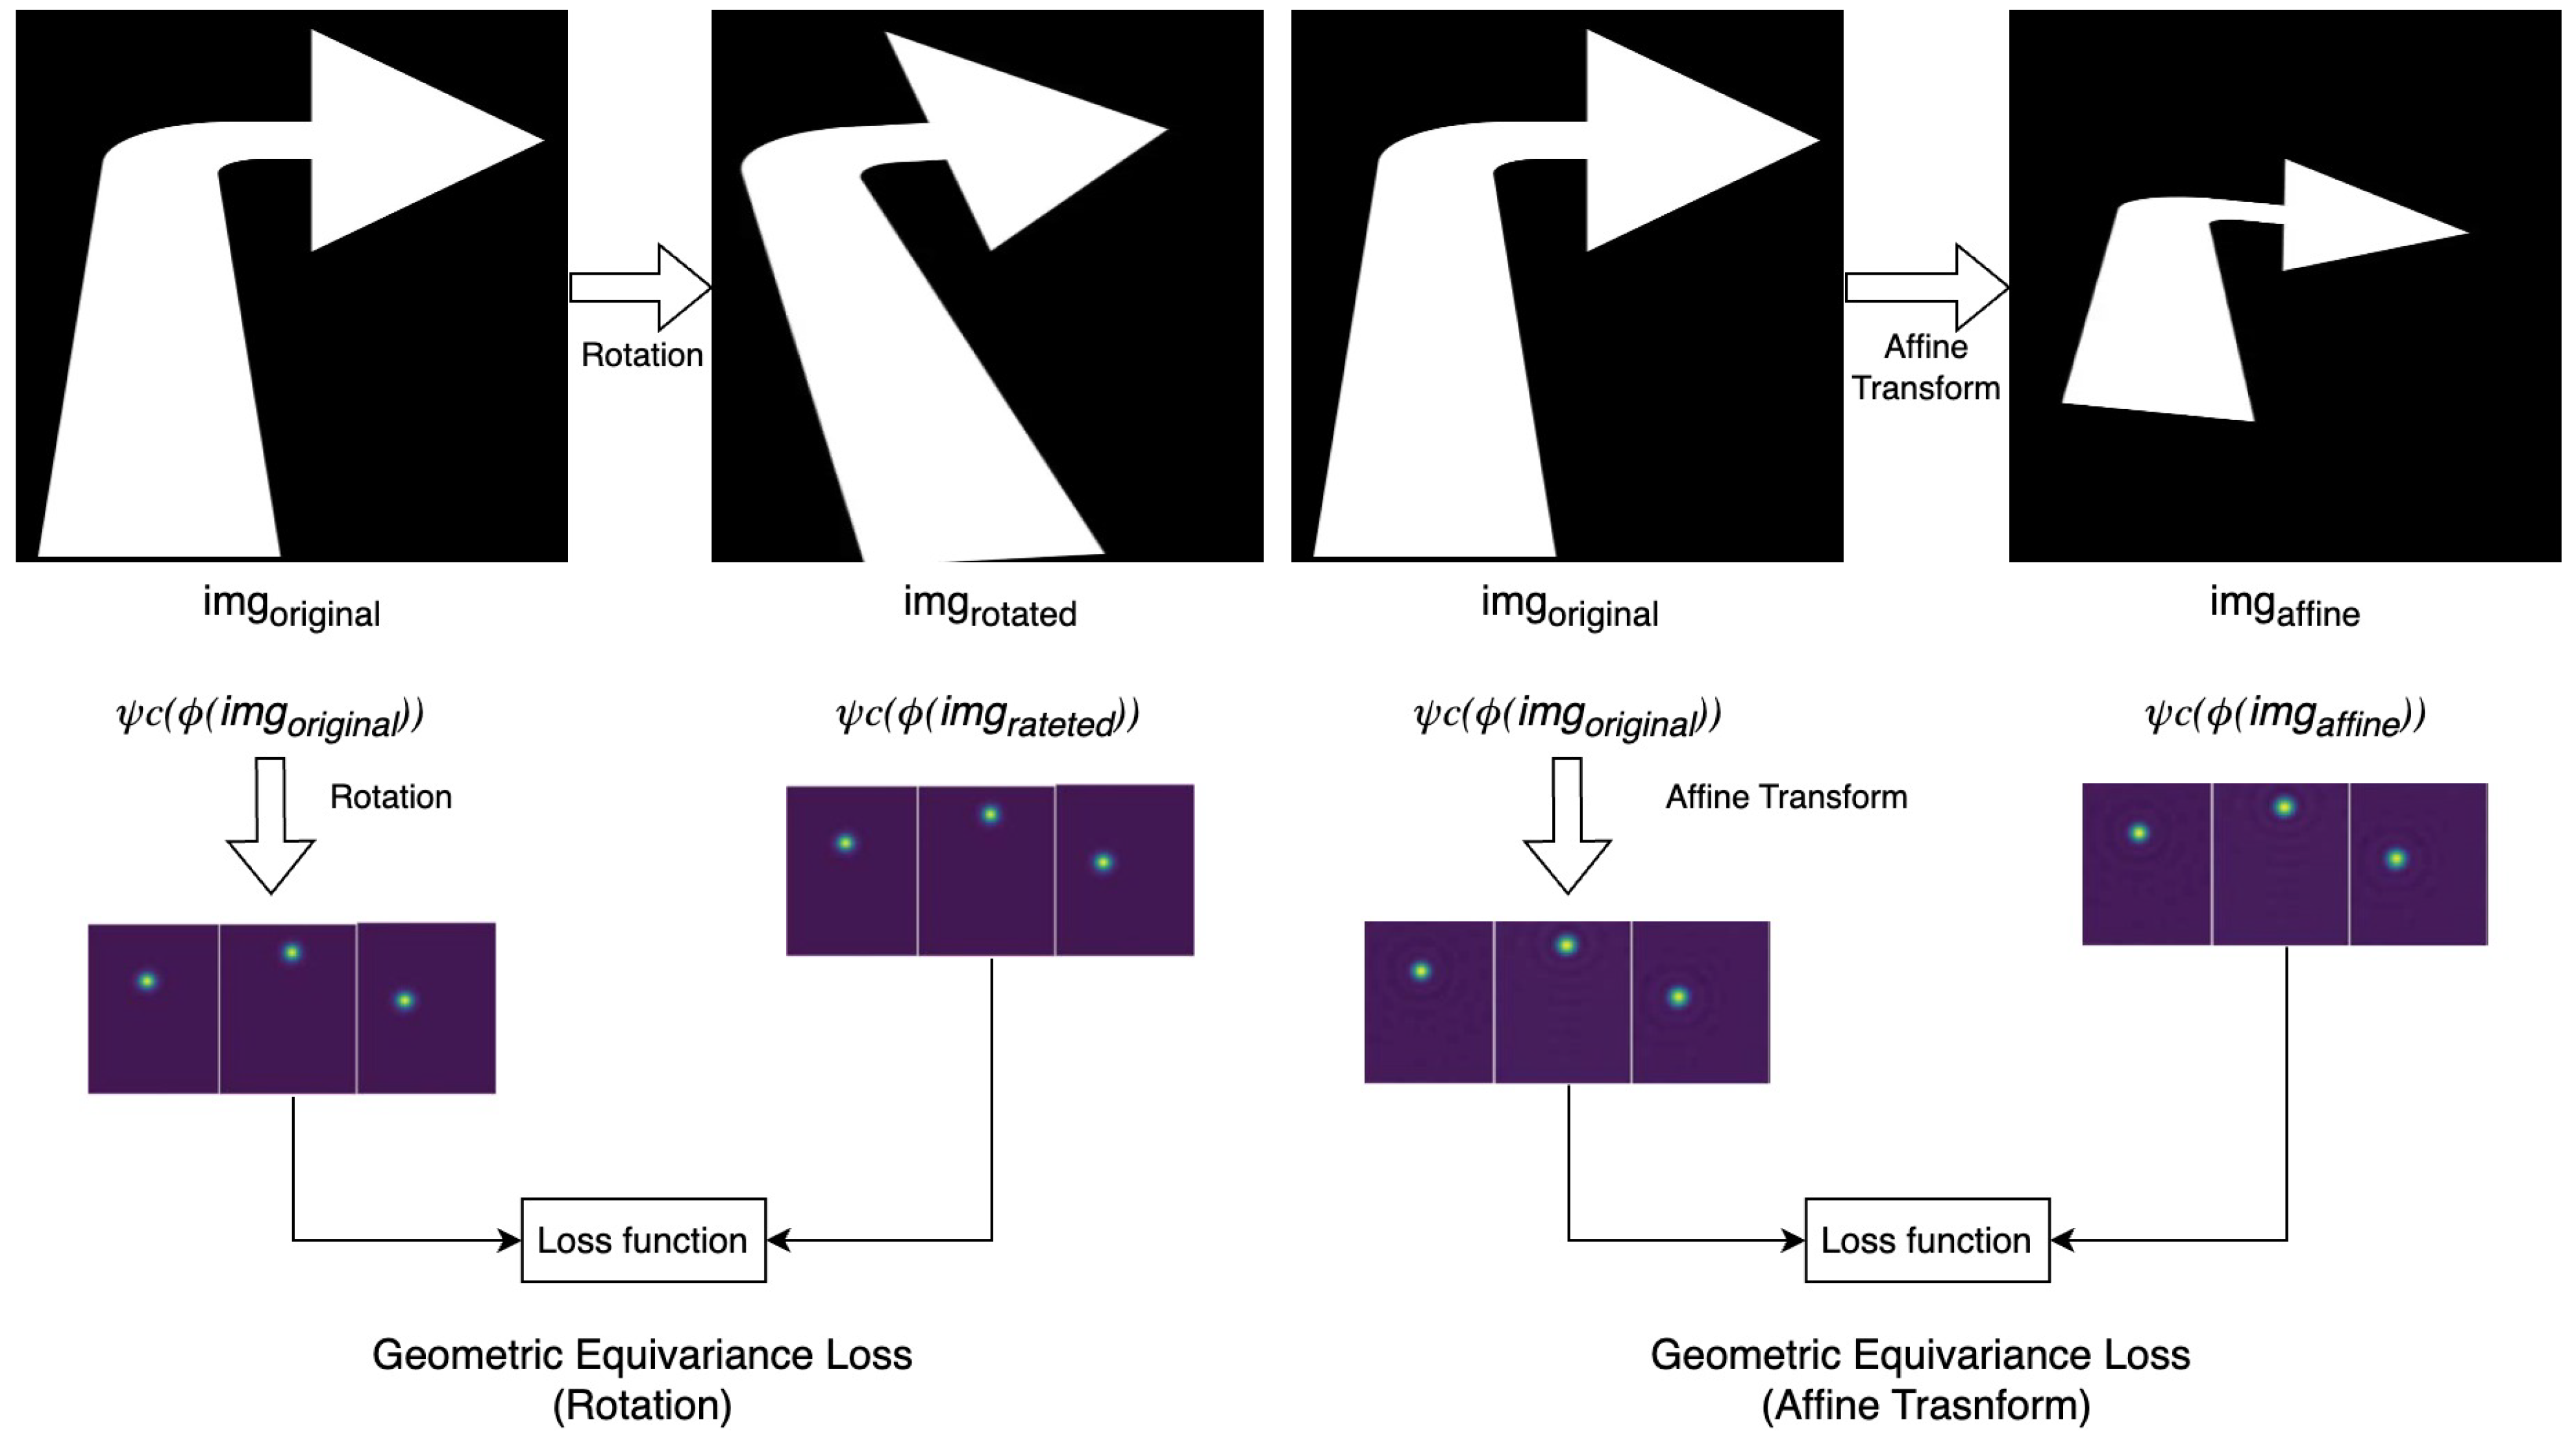
Figure 4 provides a conceptual overview of some key loss components. The specific losses used vary between the two training stages. They are the geometric equivariance loss (
), inside mask loss (
), peakiness loss (
), repulsion loss (
), and keypoint-driven image reprojection loss (
). In the following descriptions,
B denotes the batch size,
K is the number of predicted keypoints per class, and
are the height and width of the predicted heatmaps.
refers to the predicted heatmaps for the current input image batch (potentially augmented),
refers to predictions on the original (untransformed) version of the image batch for the equivariance calculation,
P refers to the
K keypoint coordinates derived from heatmaps
via the spatial softmax (
Section 3.3), and
M refers to the binary template mask (used only in Stage 1).
3.5.1. Geometric Equivariance Loss ()
This is a primary self-supervisory signal ensuring that keypoint predictions on templates transform consistently with input image transformations applied to those templates. Its objective is to ensure that if an input template image batch (
I) is subjected to a geometric transformation (
) (such as a rotation or an affine transformation, specifically excluding horizontal and vertical flips in our setup), resulting in
, the heatmaps predicted from
are equivalent to the heatmaps predicted from the original template image batch (
I) warped by the inverse transformation (
). Let
be the heatmaps predicted from the transformed image batch (
). Let
be the operation that warps a heatmap grid according to the inverse transformation (
), using bilinear interpolation. The loss (
) for a specific transformation (
) penalizes the L2 norm of the difference between the transformed prediction and the inversely warped original prediction as follows:
where
b is the batch index,
k is the keypoint index, and
are the spatial coordinates on the heatmap. In our experiments, this loss is applied for rotation and affine transformations in Stage 1 and for affine transformations only in Stage 2.
3.5.2. Inside Mask Loss ()
This loss is used exclusively during Stage 1 (template pre-training), when reliable segmentation masks are available from the synthetic template images. Its objective is to encourage the predicted keypoint heatmap energy to be concentrated within the object boundaries defined by the template’s binary mask (
M), where
inside and
outside. The mechanism minimizes the heatmap energy located outside the mask by multiplying the predicted heatmaps by the inverse mask (
) and summing the result as follows:
where
is the predicted heatmap value for batch item
b, keypoint
k at location
, and
is the corresponding mask value. Minimizing this sum effectively forces the heatmap values to be close to zero in regions where the template mask is zero, outside the object. This loss is not used in Stage 2, as mask information is not assumed to be available (or relevant) for the fine-tuning objective.
3.5.3. Peakiness Loss ()
To encourage sharp, well-localized keypoint heatmaps on the templates with concentrated activations, we utilize the peakiness loss. Its objective is to promote “peaky” heatmaps, where the probability mass is concentrated at a small number of locations, leading to more precise keypoint localization. The mechanism calculates the negative spatial entropy of each heatmap. Minimizing this negative entropy (equivalent to maximizing the peak value and concentrating the distribution) encourages the desired sharpness as follows:
where
denotes the maximum value over the spatial dimensions of the heatmap for batch item
b and keypoint
k, and
is a low constant (e.g.,
) for numerical stability, preventing issues with the logarithm of zero. This loss is used in both Stage 1 and Stage 2.
3.5.4. Repulsion Loss ()
To prevent different keypoints predicted on the template from collapsing onto the same spatial location and to encourage them to be spatially distinct, we employ the repulsion loss. Its objective is to penalize pairs of keypoints that are predicted to be too close to each other, thus promoting spatial diversity among the learned keypoint locations across the template structure. The mechanism operates on the soft peak locations derived from the predicted heatmaps via the spatial softmax operation (
Section 3.3). It calculates an exponential penalty based on the squared pairwise Euclidean distances between the coordinates
for each batch item.
where
and
are the predicted 2D coordinates for keypoint
i and keypoint
j in batch item
b,
denotes the squared Euclidean distance,
is a hyperparameter controlling the repulsion radius (how close points need to be to incur a significant penalty), and
normalizes by the number of unique pairs of keypoints. The spatial softmax coordinates (
and
) are normalized to the range [−1, 1] based on the heatmap dimensions before calculating the Euclidean distance to make the scale of
consistent. This loss is used in Stage 1 but not in Stage 2.
3.5.5. Keypoint-Driven Image Reprojection Loss ()
This loss is specifically used in Stage 2 to improve the template-to-transformed-template alignment capability of the learned keypoints. Its objective is to encourage the predicted keypoints to be such that an estimated transformation between two template images (a source template and its transformed version), based on these keypoints, accurately warps the source template to match the target-transformed template. The mechanism involves extracting keypoint coordinates from heatmaps predicted for a source template image and a target-transformed template image, assuming a direct
kth keypoint correspondence based on the learned class-specific keypoint ordering. An affine transformation (
) is estimated from the
K correspondences (
), using least squares. The source template image (
) is then warped using this estimated transformation (
) to produce
. The loss is calculated as the mean-square error between the warped-source template image (
) and the target-transformed template image (
) as follows:
where
and
are the height and width of the images, and the summation is over all the pixel locations (
). This loss directly pushes the keypoints toward locations that result in accurate image alignment between templates and their transformations. This loss is used in Stage 2 but not in Stage 1.
3.6. The Total Loss
The total loss function used for training is the weighted sum of the applicable loss components. The specific losses included and their weights vary between the two training stages.
For
Stage 1 (Template Pre-training), the total loss (
) is a weighted sum of the geometric equivariance loss for rotation (
) and affine transformations (
), the inside mask loss (
), the peakiness loss (
), and the repulsion loss (
). The weights (
) control the relative importance of each term and are set as follows:
,
,
,
, and
.
For
Stage 2 (Template Fine-tuning), the total loss (
) is the weighted sum of the geometric equivariance loss for affine transformations (
), the peakiness loss (
), and the keypoint-driven image reprojection loss (
). The weights (
) are set as follows:
,
, and
.
Note that and are omitted in Stage 2.
3.7. Evaluation Metrics
Evaluating the performance of a self-supervised keypoint detection method trained and tested on synthetic templates requires metrics that assess the quality of the learned keypoints and their utility for geometric tasks. All the quantitative evaluations in this paper are performed in the designated synthetic template test set described in the section on the synthetic template dataset.
3.7.1. Inside Mask Rate
One metric used to assess the quality and localization of predicted keypoints on templates, particularly in terms of their adherence to the object’s structure, is the IMR. This metric is evaluated in the synthetic test set (See the section on the synthetic template dataset). For each image in this set, the calculation is based on the number of predicted keypoints that fall within the ground-truth segmentation mask of the template, divided by the total number of keypoints (K) predicted for that class. The final IMR reported is the average of this ratio across all the images in the synthetic test set.
Let
be the number of images in the synthetic test set,
K be the number of predicted keypoints per image, and
be the
kth predicted keypoint coordinate for the
ith image. Let
be an indicator function that is one if point
p is inside the ground-truth mask for template image
i and zero otherwise. The IMR is calculated as follows:
3.7.2. Keypoint-Matching Comparison
To highlight the advantage of our learned, semantically defined keypoints on templates over traditional feature detectors (like SIFT and ORB) for establishing robust geometric correspondence, we compare their performances in the synthetic template test set. For traditional methods, this involves detecting features on both the source template and its transformed-target version, computing descriptors, matching descriptors (e.g., using nearest neighbor matching with a ratio test for SIFT or the Hamming distance for ORB) and then using RANSAC to estimate an affine transformation from the putative matches and identify inliers. For traditional RANSAC-based methods, is the number of RANSAC inliers found for image pair i. Our method bypasses the matching and RANSAC steps by assuming a direct correspondence between the kth learned keypoint on the source and target templates; however, the number of usable keypoints () obtained from the model’s output can vary per image pair.
The metric used for comparison is the percentage of image pairs with sufficient matches for transformation. For each pair of source and target-transformed template images in the test set, we assess whether the number of successfully localized and usable keypoints () derived for that pair meets at least the minimum required number () necessary to estimate the geometric transformation (e.g., for affine transformations). For a given GeoTemplateKPNet configuration (Backbone, K), is the number of successfully localized and usable keypoints derived from the model’s output for pair i.
Let
be the total number of image pairs in the synthetic test set. For each image pair
, let
be the number of sufficient matches (i.e., successfully localized and usable keypoints for GeoTemplateKPNet and RANSAC inliers for traditional methods) found using a given method. Let
be the minimum required number of matches (e.g.,
). The percentage of image pairs with sufficient matches is calculated as follows:
where
is an indicator function defined as
A pair is considered as successful if the number of matches found () is greater than or equal to the minimum requirement (). This metric directly demonstrates the reliability of different approaches in providing the foundational correspondences needed for alignment on template data. For GeoTemplateKPNet configurations (Backbone, K), the single ’rate’ value reported in the results corresponds to the success rate where .
3.7.3. Alignment Reconstruction Error
A second key evaluation metric assesses the ability of the learned keypoints to facilitate accurate geometric alignment between a template and its transformed version. We refer to this as the Mean-Square Error (MSE) or ARE. This metric quantifies the pixel-wise difference between a target-transformed template image and a warped-source template image after estimating the affine transformation, using predicted keypoint correspondences. For our GeoTemplateKPNet method, the keypoint correspondences are established by directly assuming that the
kth keypoint predicted in the source template image corresponds to the
kth keypoint predicted in the target-transformed template image, based on their channel indices and the learned class-specific keypoint ordering. With these
K presumed correspondences, an affine transformation is estimated using least squares (e.g., via ‘cv2.getAffineTransform’ from the OpenCV library [
33]). The source template image is then warped using this estimated transform. The ARE is calculated as the mean-square error between the warped-source template image and the target-transformed template image, restricted to the area within the transformed ground-truth mask of the source template. This ensures that the error calculation focuses on the aligned template region. The ground-truth mask of the source template is warped using the estimated affine transformation to define the evaluation area on the target-transformed template image.
Let
be the number of pairs in the synthetic test set. For the
ith test pair (source template
and target-transformed template
), let
and
be the
K predicted keypoints in the source and target images, respectively. Let
be the estimated affine transformation from
correspondences. Let
be the ground-truth mask for the source template and
be the set of pixel locations within the warped mask area in the target image,
. Let
be the warped-source template image (
). Then, the ARE is calculated as follows:
where
denotes the number of pixels in the set
. This metric directly quantifies the accuracy of the template-to-transformed-template alignment enabled by the learned keypoints.
4. Results
This section presents the experimental results evaluating the performance of the proposed GeoTemplateKPNet framework based on the metrics defined in
Section 3.7. We analyze the quantitative results across various evaluations and provide qualitative examples to illustrate the behavior of our method.
4.1. Experimental Setup
The experiments were conducted on a system equipped with an Intel Core i9-12900F processor and an NVIDIA GeForce RTX 3090 graphics card. The implementation was carried out using the following software environment: Python 3.10, PyTorch 2.4.1, torchvision 0.19.1, OpenCV 4.5, and Albumentations 2.0.7. Training utilized the Adam optimizer with the specific hyperparameters detailed in
Section 3.4. The model evaluation was performed in the dedicated test sets described in
Section 3.1.
4.2. Keypoint-Matching Comparison vs. SIFT/ORB
This evaluation compares the abilities of traditional feature-based methods (SIFT and ORB) and our proposed GeoTemplateKPNet to consistently provide a sufficient number of correspondences required for geometric alignment in the synthetic template test set. The metric used is the percentage of image pairs with sufficient matches for transformation, as defined in
Section 3.7.2.
Table 2 presents the overall average success rates across all the template classes for different minimum required inlier (
) thresholds.
Table 2 presents the overall average success rates in consistently providing sufficient matches in the synthetic template dataset. For traditional methods, ORB+RANSAC achieves high success rates at lower
thresholds (3 and 4), while SIFT+RANSAC performs better at
. Our GeoTemplateKPNet method shows varying success rates, depending on the configuration. GeoTemplateKPNet (ResNet-50, K = 3) achieves a 63.36% rate in providing at least three usable keypoints, while GeoTemplateKPNet (VGG-16, K = 4) shows the highest rate (68.24%) among our configurations for providing at least four usable keypoints. VGG-16 with K = 5 has the highest rate (36.84%) for providing at least five usable keypoints.
Comparing GeoTemplateKPNet configurations to those of traditional methods at comparable thresholds, SIFT and ORB generally show higher success rates for and 4 than our method does in providing at least that many usable keypoints. However, this metric primarily indicates the model’s ability to produce the minimum count of keypoints across the dataset consistently. It does not directly reflect the quality of the resulting alignment or the model’s ability to handle various data transformations, which are evaluated using the ARE and qualitative results in subsequent sections. As observed experimentally, ORB+RANSAC often produces visually poor and inaccurate transformations, despite reporting a sufficient number of inliers, suggesting that the matches deemed as inliers are not geometrically accurate, which supports higher ARE values. SIFT+RANSAC, although better than ORB in terms of alignment quality (when successful), still struggles to consistently provide sufficient matches compared to ORB or the number of heatmaps predicted using our model.
4.2.1. Evaluation of the IMR
The IMR metric assesses the quality of the learned keypoint localization by measuring the percentage of the predicted keypoints that fall within the ground-truth segmentation mask of the template in the synthetic test set, as defined in
Section 3.7.1. A higher IMR indicates better adherence of the predicted keypoints to the object’s shape.
Table 3 presents the overall average IMRs across all the template classes for different GeoTemplateKPNet configurations.
Table 3 shows the overall average IMRs achieved by GeoTemplateKPNet with different backbones and numbers of keypoints (K). For the ResNet-50 backbone, the IMR is 35.49% with K = 3, 29.99% with K = 4, and 30.98% with K = 5. For the VGG-16 backbone, the IMR is 30.38% with K = 3, 28.55% with K = 4, and 36.84% with K = 5. These overall results indicate that the IMR varies with both K and the backbone type, with VGG-16 at K = 5 achieving the highest overall IMR.
To further analyze the performance and understand the reasons behind the overall IMR values, we examine the IMR broken down by individual template classes.
Table 4 presents the per-class IMRs for the tested configurations.
Table 4 highlights the significant variations in the IMR across the different template classes for both backbones and K values. Classes 0 and 1 show relatively high IMR values for most configurations. Class 2 exhibits a consistently low IMR across the configurations, although it improves slightly with K = 4 and K = 5 compared to K = 3. Classes 3 and 4 exhibit varying performances depending on K and the backbone, with some configurations (e.g., ResNet-50 with K = 4/5 and VGG-16 with K = 5) achieving notable improvements in the IMR compared to those with K = 3. This per-class analysis reveals that the model’s ability to localize keypoints within the template mask is highly dependent on the specific geometry and the chosen configuration.
4.2.2. Evaluation of the ARE
The ARE, measured as the Mean-Square Error (MSE), quantifies the accuracy of the estimated geometric transformation by comparing a warped-source template image to the target-transformed template image within the object’s masked area, as defined in
Section 3.7.3. A lower ARE value indicates a more accurate alignment.
Table 5 presents the overall average AREs and their standard deviations across all the template classes for different GeoTemplateKPNet configurations, as well as for traditional SIFT+RANSAC and ORB+RANSAC methods, focusing on cases where at least
matches were found.
Table 5 presents the overall average AREs and standard deviations for different methods and configurations. Comparing GeoTemplateKPNet with traditional methods in cases where at least
matches were available for SIFT/ORB, we observe that GeoTemplateKPNet with VGG-16 and K = 3 achieves the lowest average ARE (0.0889), indicating the most accurate overall alignment among tested configurations and traditional methods. GeoTemplateKPNet with ResNet-50 and K = 3 (0.1392) is also competitive with or better than SIFT+RANSAC (0.207) and significantly better than ORB+RANSAC (0.387) at
. For K = 4 and K = 5, the overall average AREs for GeoTemplateKPNet generally increase compared to those for K = 3, with ResNet-50 with K = 4 showing a particularly high ARE of 0.5300. This supports the observation that K = 3 provides the most suitable balance for the overall alignment accuracy. ResNet-50 generally achieves a lower overall average ARE compared to that for VGG-16 with K = 3 but is worse for K = 4 and similar for K = 5. The overall ARE for VGG-16 with K = 5 is 0.501. These overall results suggest that our self-supervised approach can achieve more accurate geometric alignment on template data compared to traditional feature-based methods, particularly with certain configurations, when sufficient matches are available.
Beyond merely establishing correspondences, the ARE serves as a critical indicator of the geometric precision achieved using each method. The consistently lower ARE values exhibited by GeoTemplateKPNet across various backbone and K configurations, particularly the optimal VGG-16 with K = 3, underscore a key strength: Its self-supervised training successfully guides the model to learn keypoints that are not only localizable but also inherently stable and geometrically reliable for estimating accurate transformations. This contrasts sharply with traditional feature-based methods, where even a high count of matches, as observed with ORB+RANSAC, does not consistently translate to accurate geometric alignments, often leading to visually unreliable reconstructions due to imprecise or inconsistent feature localization. This robust geometric understanding by GeoTemplateKPNet is particularly vital for structured, feature-poor templates, where subtle shifts in keypoint prediction can significantly impact the transformation accuracy.
To provide a more detailed understanding of the alignment performance, particularly for template geometries where the model might struggle or excel, we also examine the AREs broken down by individual template classes for each backbone.
Table 6 presents the per-class AREs for the ResNet-50 backbone, and
Table 7 presents the results for the VGG-16 backbone.
Table 6 and
Table 7 show the per-class average AREs broken down for the ResNet-50 and VGG-16 backbones, respectively. It is important to note that the “NaN” (Not a Number) entries in the ARE tables signify instances where the model failed to predict a sufficient number of geometrically distinct keypoints (typically a minimum of three non-collinear points required for affine transformation estimation) to compute a transformation matrix reliably. This situation is particularly evident for Class 2 (straight arrow) templates, as also reflected in its lower success rates in the keypoint-matching comparison.
Consistent with the overall results, compared to ResNet-50 with K = 3, VGG-16 with K = 3 generally shows lower ARE values across the classes where alignment is possible, particularly for Classes 0, 1, and 2. Classes 0 and 1 consistently exhibit lower AREs for both backbones at K = 3, indicating accurate alignment for these shapes. Class 2 remains challenging, with NaN AREs for ResNet-50 with K = 3 and a calculated ARE of 0.112 for VGG-16 with K = 3, despite a low IMR. This suggests that VGG-16 is sometimes able to find enough points for alignment, even if they are close to or outside the mask. Class 4 consistently shows higher ARE values. For K = 4 and K = 5, the per-class ARE data become much more sparse, with many NaN values, indicating that alignment could not be performed. When calculated, ARE values for K = 4 and K = 5 can be both higher and lower than those for K = 3, depending on the class, supporting the notion that K = 3 likely provides the best balance for the overall accuracy and robustness across the classes. The data for the VGG-16 with K = 5 per-class AREs are missing.
4.2.3. Qualitative Results
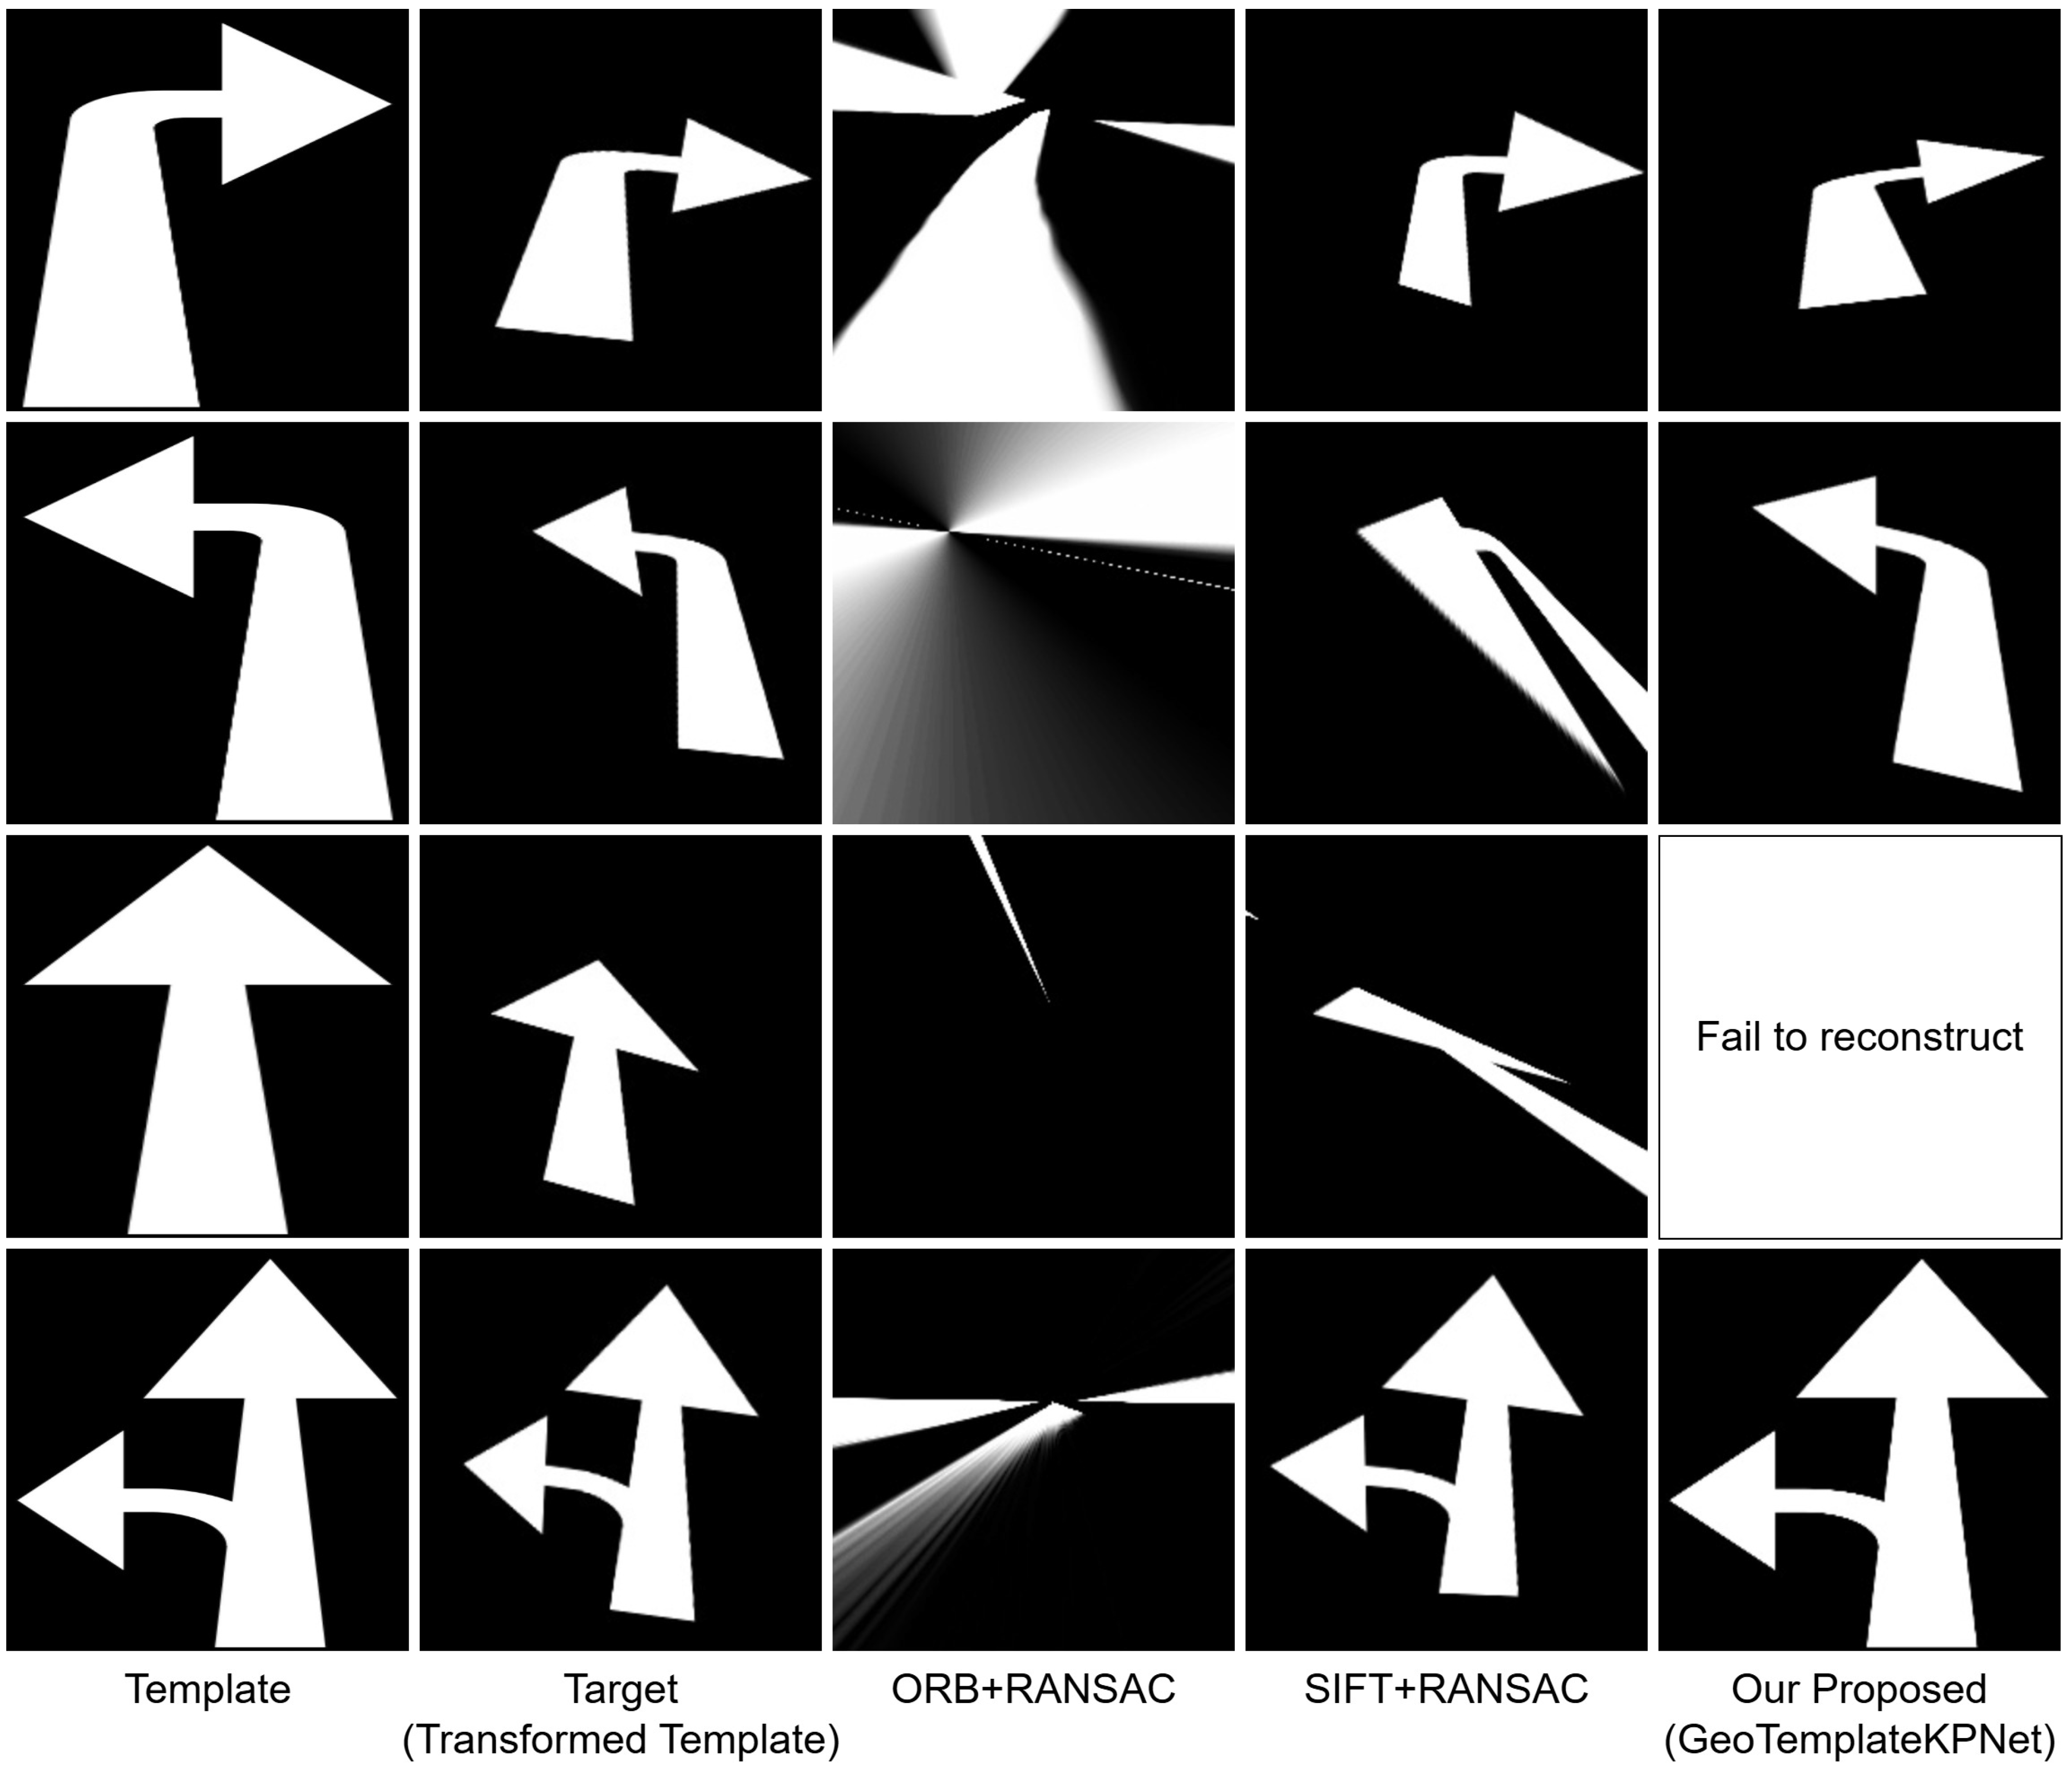
This subsection presents selected visual examples to qualitatively illustrate the alignment performance of our proposed GeoTemplateKPNet method (focusing on the K = 3 configuration for both backbones) and to provide a direct visual comparison with traditional feature-based methods (SIFT+RANSAC and ORB+RANSAC) in the synthetic template test set. These examples complement the quantitative metrics by showing the visual accuracy of the resulting geometric alignments and the typical behavior of each method.
Figure 5 presents a visual comparison of the alignment results obtained from GeoTemplateKPNet (ResNet-50, K = 3), GeoTemplateKPNet (VGG-16, K = 3), SIFT+RANSAC, and ORB+RANSAC for several example image pairs from the test set. Each row in the figure corresponds to a single test example, showing the source template, the target-transformed template, and the reconstructed template obtained by warping the source template using the transformation estimated using each method.
The visual comparisons in
Figure 5 highlight the differences in alignment performances. GeoTemplateKPNet, when successfully predicting keypoints (which vary by class and configuration, as discussed in the quantitative results), produces accurately reconstructed templates that closely resemble the original, demonstrating the geometric reliability of the learned keypoints for alignments. While SIFT+RANSAC can also achieve good visual alignment when it finds sufficient reliable matches, it often struggles to consistently provide enough correspondences across the dataset (as shown in
Table 2). ORB+RANSAC, despite sometimes reporting a high count of sufficient matches (
Table 2), frequently results in visually poor and unrecognizable reconstructed templates, indicating that the matches deemed as inliers by RANSAC are not geometrically accurate for this type of template data (supporting the higher ARE values in
Table 5). These visual examples reinforce the quantitative findings, demonstrating that compared to traditional feature-based methods, our self-supervised approach learns keypoints that enable more consistent and accurate alignment on template data.
4.2.4. Ablation Studies
We conducted ablation studies to analyze the impacts of the key hyperparameters and design choices on the overall performance of GeoTemplateKPNet. The effect of the backbone architecture (ResNet-50 vs. VGG-16) is observable by comparing the results presented for these different backbones in
Table 2,
Table 3, and
Table 5. In this subsection, we specifically investigate the effect of varying the number of keypoints (K) predicted per class and discuss class-specific performance trends.
4.2.5. Effect of the Number of Keypoints (K) and Class-Specific Performances
The number of keypoints (K) is a critical hyperparameter that determines the granularity of the geometric representation learned by the model. We evaluated the impact of using different values for K (
) on the key performance metrics: the IMR and ARE. The overall average results for different K values and backbones are presented in
Table 3 (the overall IMR) and
Table 5 (the overall ARE).
Table 3 shows that the overall average IMR increases as K increases from 3 to 4, for both the ResNet-50 and VGG-16 backbones, but then drops slightly for K = 5 with ResNet-50 and increases further with VGG-16. This suggests that a higher number of keypoints enables the model to capture the template structure better and localize the keypoints within its mask; however, the optimal K value may depend on the backbone.
Similarly,
Table 5 shows the impact of K on the overall average ARE. For both backbones, the average ARE appears to increase significantly as K increases from 3 to 4 and then decreases somewhat for K = 5 (with ResNet-50) or increases further (with VGG-16, data are missing). This supports the observation that while increasing K might improve the structural coverage (IMR), it can negatively impact the overall alignment accuracy (ARE). Compared to higher K values, K = 3 provides the best overall balance for accurate alignment, despite potentially lower IMRs for some classes.
The per-class IMR and ARE tables (
Table 4,
Table 6, and
Table 7) provide a more detailed view, highlighting significant variations in performances across different template classes and configurations. Consistent with the overall trends, increasing K to 4 and 5 appears to benefit the IMR for classes 3 and 4 with both backbones. However, for the ARE, while K = 3 shows consistent performance for most classes where alignment is possible, K = 4 and K = 5 show much sparser data (more NaNs) and higher ARE values (when calculated), indicating decreased reliability in achieving successful alignment with higher K values, despite potential IMR improvements.
The Class 2 (straight arrow) template geometry presents a particular challenge. While the model is often successful in detecting keypoints corresponding to the prominent top and bottom parts of the arrow, capturing sufficient additional distinct keypoints (i.e., the 3rd, 4th, and 5th keypoints) proves to be difficult. If these additional keypoints are predicted too close to the initial two, attempting alignment based on these nearly collinear points can lead to a degenerate transformation, resulting in a messed up and unrecognizable reconstructed template (e.g., three keypoints forming a degenerate rectangle that looks like a straight line), despite the model successfully identifying the basic structure’s top and bottom. This inherent geometric challenge contributes to the low IMRs and high/NaN AREs observed for Class 2, particularly with configurations like ResNet-50 with K = 3, where the ARE is NaN. Addressing the specific difficulty of reliably localizing more than two distinct keypoints for simple, elongated structures, such as that in Class 2, is a focus for future work.
5. Discussion
This paper presents GeoTemplateKPNet, a novel self-supervised deep-learning framework that leverages the strengths of CNNs for learning robust, geometrically consistent keypoints specifically tailored for structured template images, as demonstrated on road-marking templates. The experimental evaluation, conducted in a synthetic template test set with applied affine transformations, aimed to demonstrate the potential of this approach to overcome the limitations of traditional methods on feature-poor template data and serve as a foundational step toward template-to-real-world instance alignment.
The quantitative results from the keypoint-matching comparison (
Section 4.2), ARE (
Section 4.2.2), and IMR (
Section 4.2.1), supported by the qualitative results (
Section 4.2.3), provide insights into the performance of GeoTemplateKPNet compared to those of traditional feature-based methods and the impacts of different configurations.
The keypoint-matching comparison (
Section 4.2) revealed that while traditional methods, like SIFT+RANSAC and ORB+RANSAC, can achieve high success rates in finding the minimum count of matches, particularly ORB at lower
thresholds, they still fail to consistently provide sufficient correspondences across all the test cases, especially at higher
values for SIFT. However, a crucial finding highlighted by the ARE analysis (
Section 4.2.2) and visually demonstrated in the qualitative results (
Section 4.2.3) is that a high match count from traditional methods does not necessarily guarantee geometric accuracy. ORB+RANSAC, despite its relatively high success rate in finding matches, often yields visually inaccurate and unreliable alignments on the template data, as evidenced by its higher ARE values compared to those of SIFT and GeoTemplateKPNet and the poor visual reconstruction quality. SIFT+RANSAC tends to produce better visual alignment when it finds sufficient matches, but its ability to consistently find enough reliable matches is limited compared to those of ORB or the number of heatmaps predicted using our model.
Our proposed GeoTemplateKPNet, by learning to predict a fixed set of keypoints (varying by K), consistently provides a defined number of correspondences for alignment in the template test set when it successfully localizes keypoints. More importantly, the ARE results (
Section 4.2.2) demonstrate that when GeoTemplateKPNet successfully predicts keypoints, the resulting template-to-transformed-template alignment is generally more accurate than that achieved using traditional methods. As shown in
Table 5, the GeoTemplateKPNet configurations, particularly VGG-16 with K = 3, achieve the lowest overall average AREs, indicating superior alignment accuracy compared to those of both SIFT+RANSAC and ORB+RANSAC. This indicates that the self-supervised learning process effectively guides the model to learn keypoints that are not only localizable but also geometrically reliable for estimating accurate transformations on template structures.
The IMR results (
Section 4.2.1) demonstrate that the learned keypoints adhere to the template boundaries, with the adherence generally varying with the K values and backbones. The per-class breakdowns of IMRs and AREs (
Table 4,
Table 6, and
Table 7) highlight significant performance variations across the different template geometries and configurations. Classes with simpler, more prominent features (like Classes 0 and 1) tend to have higher IMRs and lower AREs, indicating more successful keypoint localization and accurate alignment.
The ablation studies (
Section 4.2.5) on the effect of K on the performance further demonstrate that the number of keypoints influences the performance. While increasing K might improve the IMR for some classes, such as Classes 3 and 4, which benefit from higher K values, the overall ARE generally increases with higher K values, supporting the observation that K = 3 often provides the most suitable balance for the overall alignment accuracy. However, the studies also underscore a key limitation: the inherent difficulty with certain template geometries, most notably Class 2 (straight arrow). As discussed in
Section 4.2.5, the challenge lies in reliably localizing more than two distinct keypoints for simple elongated structures, which impacts both the IMR (low) and the ability to perform accurate alignment (high/NaN ARE), potentially leading to degenerate transformations.
The failure to reconstruct the straight arrow shown in
Figure 5 directly illustrates this challenge. Our model struggled to extract distinct keypoints for this geometrically simple and elongated shape, often resulting in keypoints clustering into two main groups (e.g., one at the center and another near the middle bottom of the arrow). The instability and near-collinearity of these clustered keypoints frequently lead to an unstable or degenerate transformation matrix, causing visually inaccurate alignment or “NaN” ARE values. This specific challenge, particularly with certain template geometries, and the need for improved loss functions or strategies to ensure better keypoint distribution, are important areas for our future research.
While this paper demonstrates the potential of GeoTemplateKPNet to learn robust keypoints and perform accurate geometric analysis on synthetic template data, a significant limitation is that the experimental evaluation is limited to synthetic templates. The domain gap between clean synthetic templates and degraded real-world images, including variations in lighting, wear, and background clutter, presents a substantial challenge for aligning templates with real-world instances. The initial attempts to fine-tune the model directly on real-world data, without the aid of instance masks, proved to be difficult. The learned keypoints struggled to reliably stay within the object’s boundaries in the absence of the constraint and in the presence of complex real-world noise.
Future Work
It is important to acknowledge that the current experimental setup does not include direct comparisons with state-of-the-art deep keypoint detection and alignment models. This is primarily because existing general-purpose deep models, often trained on diverse natural images with explicit keypoint annotations, cannot be directly applied to our specific problem. Defining universally consistent and semantically meaningful ground-truth keypoints for all road-marking types is an inherently challenging and often undefined task, which is precisely why our approach leverages self-supervision on synthetic data. Therefore, the focus has been on demonstrating a self-supervised solution that learns geometrically reliable keypoints on feature-poor templates, where traditional methods fail—a unique contribution in itself.
The primary direction for future work is to address the domain gap to achieve robust template-to-real-world instance alignment. This is a critical next step for our self-supervised approach, as the unconstrained nature of real images—including complex backgrounds, varied lighting, shadows, and occlusions—presents significant challenges for our current self-supervision setup. Factors such as background information included in image transformations can destabilize loss functions (e.g., the image reprojection loss), hindering the stable learning of keypoints.
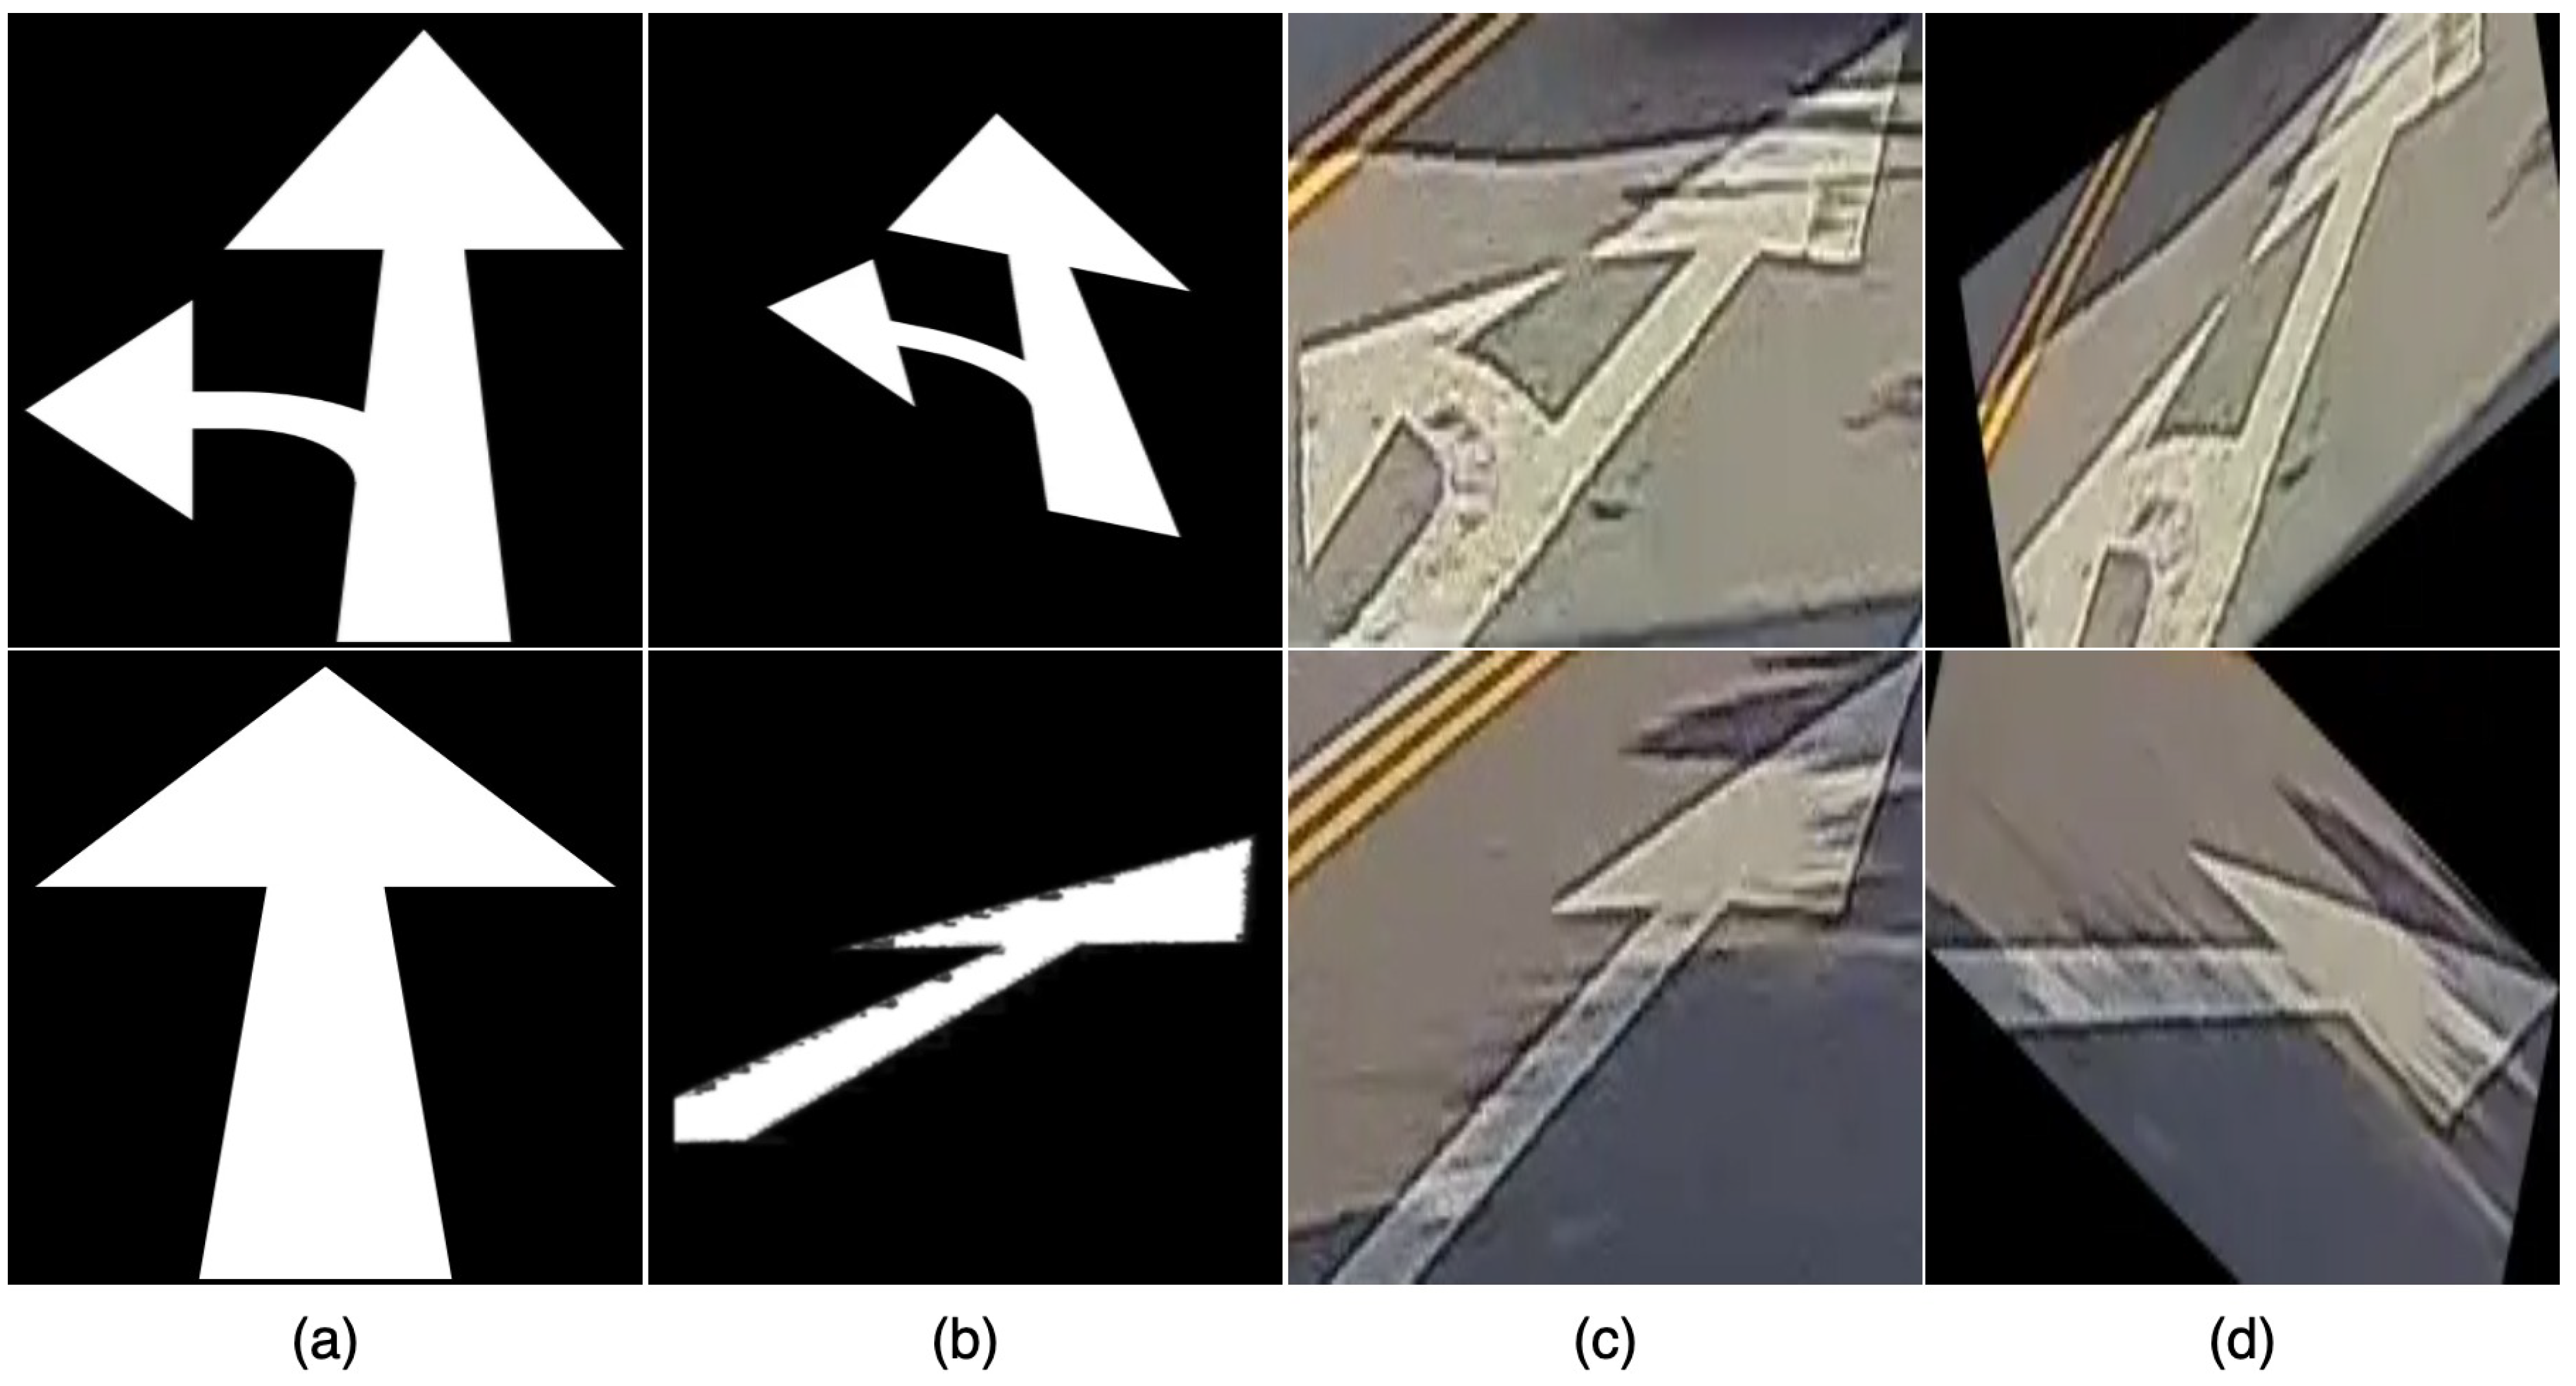
Figure 6 illustrates the differences among the template, transformed template, real-world image [
34], and transformed real-world image, highlighting the challenge of real-world data, which include the environment, nearby signs/objects, and backgrounds.
To tackle this, future work will involve exploring advanced domain adaptation techniques. These include utilizing GANs [
27] to create synthetic templates that more closely resemble real-world degraded instances, thereby generating a synthetic dataset with a distribution closer to that of the target domain for more effective fine-tuning, or using methods such as CycleGAN [
35] to translate synthetic templates to resemble real-world conditions or vice versa, potentially enabling more stable self-supervision and mask estimation in the real domain. While crucial, the extensive experimentation and methodical development required for this work fall outside the scope of the present work.
Future research directions include extending the framework to encompass a broader range of road-marking types beyond arrow-based templates. This involves investigating its applicability to other common geometric shapes, such as zebra-line crossings, pedestrian crossings, and numerical or textual marking signs. These new shapes present unique challenges, including varying complexities in their geometric structures, different requirements for keypoint distribution, and the need for the robust handling of their canonical forms under diverse transformations. Exploring these additional geometries will further validate the generalizability and robustness of our self-supervised keypoint-learning approach for geometric analysis in real-world intelligent automation and infrastructure-monitoring applications. While not the immediate focus for current offline maintenance processes, evaluating the real-time performance of the proposed method will also be crucial for future real-world deployments, particularly once robust template-to-instance alignment is achieved.
Furthermore, a more in-depth analysis of the individual contribution and optimal weighting of each loss term, including the impacts of hyperparameters, such as in , is warranted. The preliminary findings from our experiments, which involved grid searching for hyperparameter tuning, indicate that each loss function is necessary for the model’s convergence; for instance, setting all the weights equally leads to non-convergence. Specifically, for the repulsion loss, setting its weight () at lower than 0.3 resulted in keypoints clustering rather than separating effectively, especially for higher K values (e.g., K = 4 and 5), where keypoints tended to converge to two main groups, with subsequent keypoints still appearing close to one of these groups. Therefore, future work will include a comprehensive ablation study to explore these effects further and develop more robust loss functions or strategies for improved keypoint distribution in such challenging scenarios.
6. Conclusions
Geometric shape alignment, while seemingly a straightforward task, presents significant challenges in practice due to factors that hinder reliable feature matching and the absence of standard keypoint definitions for many geometric structures. Achieving robust alignment is crucial for numerous applications, including automated labeling and condition assessment. This paper addresses the foundational aspect of this problem by proposing GeoTemplateKPNet. This novel framework leverages self-supervised learning to automatically learn meaningful keypoints directly from geometric shapes, specifically road-marking templates.
Our work demonstrates that it is indeed possible to train a model to predict geometrically consistent and meaningful keypoints on structured templates, using a carefully designed self-supervised approach. This involved overcoming key challenges, such as preventing the model from finding trivial solutions, like predicting keypoints at the image center, through the use of balanced and targeted loss functions.
The experimental results in a synthetic template test set demonstrate that the learned keypoints enable accurate template-to-transformed-template alignment, outperforming traditional feature-based methods, such as ORB and SIFT, in this task, particularly in achieving lower alignment errors when sufficient correspondences are available. While the proposed method demonstrates the potential of self-supervised keypoint learning for templates, the evaluation also revealed variations in the performance across different template geometries, with the model succeeding in some classes while struggling in others. The multi-head architecture, however, offers the flexibility to combine specialized heads trained for individual classes, thereby optimizing the overall performance in practical applications.
This research establishes a crucial step toward developing robust template-to-real-world instance alignment capabilities. By demonstrating the feasibility of learning reliable keypoints on template structures without manual supervision, our work lays the groundwork for addressing the more complex challenges posed by real-world variations and domain gaps in future research.


