1. Introduction
E-commerce has become a popular activity among internet users both for searching and for buying goods, with a consistent increase in sales volume and visitors over time. According to the research completed by eMarketer [
1] and Statista [
2], online retail e-commerce sales in 2022 exceeded 5.7 trillion U.S. dollars worldwide and will reach
$6.51 trillion by 2023, with e-commerce websites taking up 22.3% of total retail sales.
Online shops meet challenge to attract high-value customers and capture their interest for making purchase decisions during their online search. A high-value customer is someone who actively engages with a business, showing a strong interest in their products or services. These customers make more frequent purchases compared to others, and when they do buy, they tend to spend a significant amount of money. In essence, their consistent engagement and higher spending make them particularly valuable to the business.
Our research introduces a novel algorithm designed to gauge customer engagement and identify high-value customers. Important part of the activities aiming to engage customers and convince them to make buying decision is made in the areas of improving purchase experience via shopping sites, extending payment modes, using direct communication with the customer and other online marketing strategies.
Despite wide usage of customer engagement approaches it is still not clear what drives such big e-commerce growth. In 2022 the survey “Drivers of online purchases” was conducted among 9989 U.S. respondents [
3]. According to their opinion, online purchases are most influenced by the convenient delivery and shopping method, avoiding crowds, cheaper goods price, wide product range, etc.
To attract customers and influence their purchasing decisions, e-commerce businesses aim to enhance the customer experience on their websites, make a clickstream analysis and utilize diverse online marketing strategies.
Clickstream analysis is used in web analytics to track and analyze the navigational behavior of users as they interact with a website. The term “clickstream” refers to the sequence of clicks or actions that a user takes during a session on a website. Clickstream analysis involves collecting and analyzing this data to gain insights into user behavior, preferences, and the overall user experience.
Clickstream data records contain online actions of internet users, including the number of visited pages, time spent on each page, and devices used for browsing, as explained by Amaral et al. [
4]. By analyzing clickstream data, companies can identify potential buyers, measure their level of engagement, and offer personalized promotions and incentives to encourage them to make a purchase.
Different methods have been proposed to analyze clickstream data, such as visualization of online shopping behavior [
5], evaluating time spent on each item page [
6], and detecting browsing patterns to identify potential customers [
7,
8,
9].
Overall, clickstream analysis provides valuable insights into customer behavior and preferences, allowing e-commerce companies to offer more personalized and effective advertising campaigns. With the increasing importance of e-commerce in today’s digital economy, clickstream analysis is becoming an essential tool for companies looking to optimize their online sales and marketing strategies. The research works tend to employ more customer history information for increasing precision of the models.
However, measuring customer engagement still remains a challenge, especially for predicting behavior and ad targeting success to the new customers who do not have long browsing history in general, or losing their browsing history due to deleting cookies, changing browsing devices. This article proposes a novel algorithm to measure customer engagement and identify high-value customers for personalized advertising campaigns. The algorithm uses clickstream data to calculate a customer merit (CM) index that reflects the customer’s engagement level and predicts their intention to make a purchase. The algorithm dynamically evaluates the CM index, taking into account the customer’s activity level, expediency in choosing items, and time spent exploring them. It is assumed that the proposed dynamic Customer Merit (CM) index can be used for triggering advertising only to the specific customers defined by their online activities, therefore the customer response ratio by taking buying decision after seeing the ads is increased, and the total advertising costs can be reduced.
The main results of the study are described below. In the next section we will review articles on Targeted Advertising, Clickstream Data and User Behavior Analysis.
Section 3 of this research presents the methodology of research and proposed algorithm for evaluating customer behavior and identifying high-value customers.
Section 4 introduce and explains the experimental results of applying the algorithm to clickstream data from two different e-commerce platforms, demonstrating its effectiveness in improving sales and targeting personalized advertising campaigns. The article ends with a discussion of the results and the most important conclusions.
2. Literature Review
The dynamic landscape of e-commerce has prompted businesses to adopt innovative strategies for customer engagement, with personalized advertising. This literature review explores the integration of clickstream data for personalized advertising, specifically emphasizing its role in targeting high-value customers. As businesses seek to tailor their marketing efforts to individual preferences, understanding and leveraging clickstream data has become instrumental in optimizing the efficacy of personalized advertising campaigns within the e-commerce domain. In order to find out the trends in this area, we carried out the review of existing research, shedding light on the evolution, challenges, and opportunities associated with this intersection of personalized advertising and clickstream analytics.
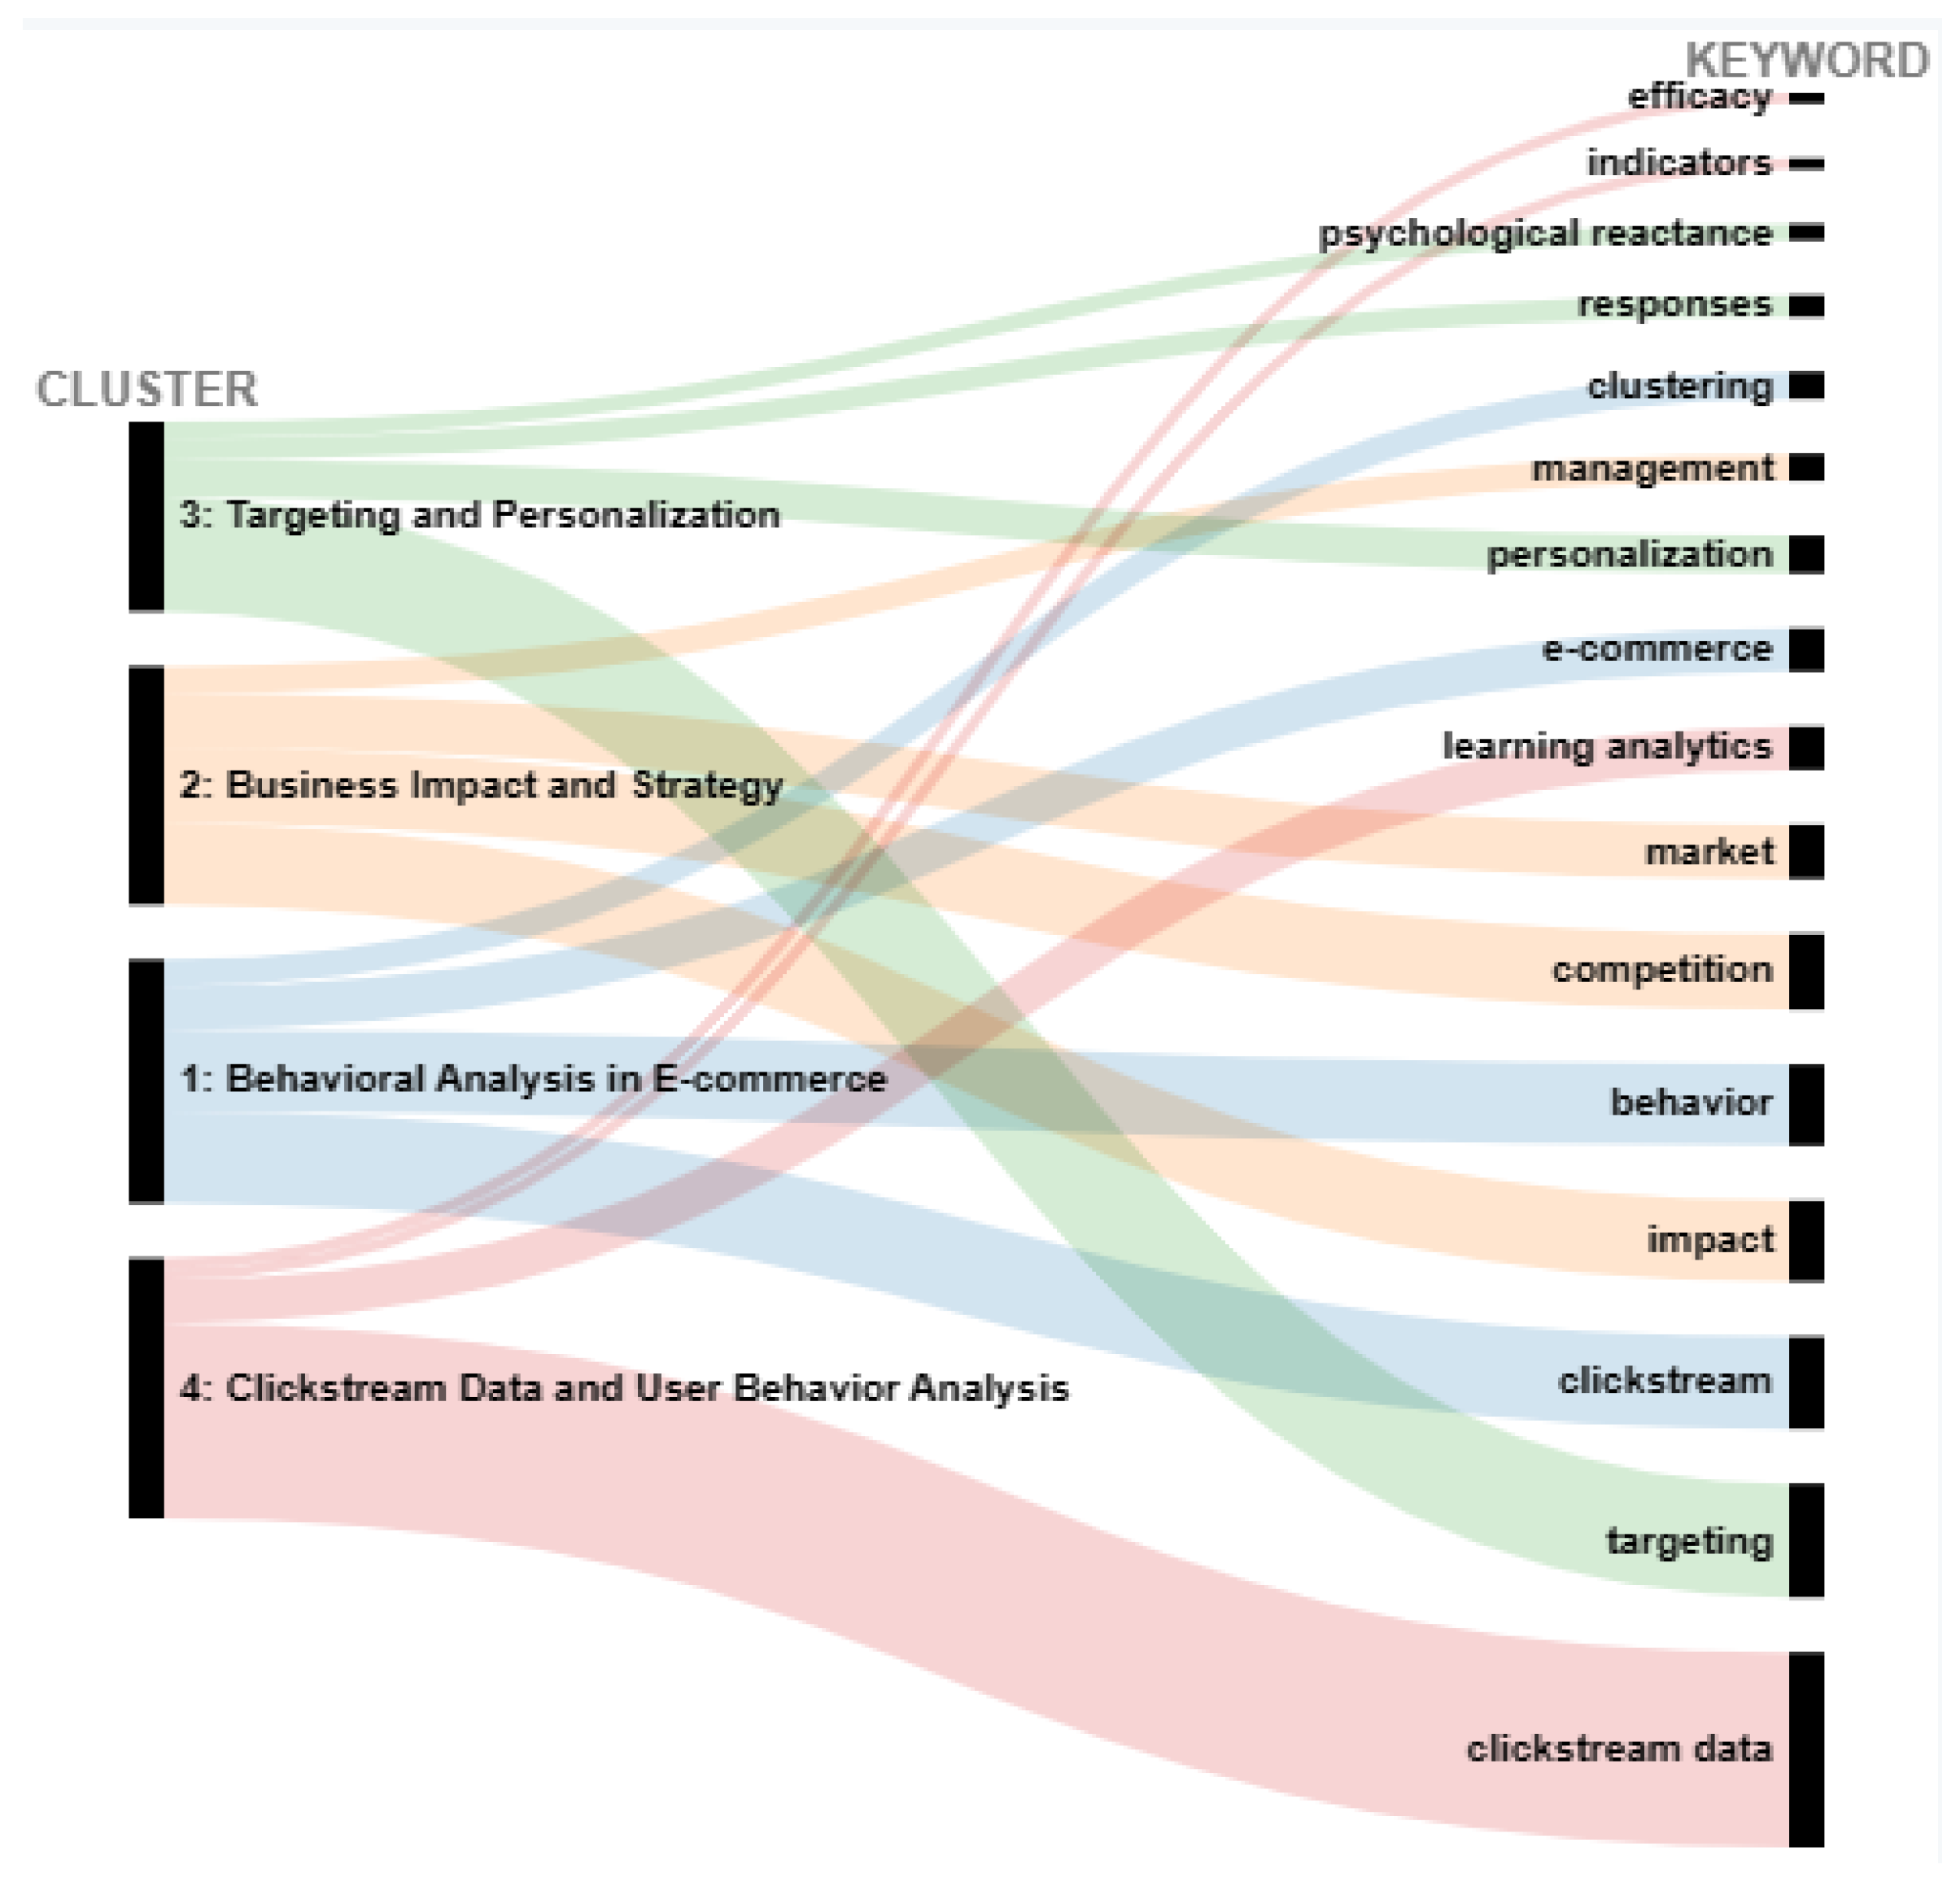
We started by employing a broad set of more than 50 different keywords (see
Table 1) relevant to e-commerce, including user behavior patterns, personalized advertising, high-value customers, business strategy in the context of advertising competition, and clickstream data for understanding user behavior. These keywords were carefully chosen to encompass a broad spectrum of aspects within the targeted research domains.
Utilizing academic databases and search engines, we conducted thorough searches using the selected keywords to identify a diverse range of articles. We applied strict inclusion criteria to filter articles relevant to the scope of our study, considering factors such as publication date, relevance to e-commerce, and focus on user behavior, advertising, and business strategy. The initial search yielded 236 articles that met our inclusion criteria.
Based on the identified keywords and themes present in the articles, we implemented a clustering methodology to categorize the papers into four distinct groups representing different aspects of personalized advertising in e-commerce. Each cluster represents a specific facet within the field of personalized advertising. From behavioral analysis to business impact and advertising strategies, the clusters collectively contribute to the evolving landscape of personalized advertising, disclosing key themes such as user behavior, trust, strategy, targeting, and the utilization of clickstream data.
Table 1 in the manuscript presents a condensed overview of these clusters, encapsulating their characteristics and keywords. The table also includes illustrative article examples selected to represent each cluster, offering tangible instances that exemplify the themes discussed within each category. The process of selecting illustrative articles was driven by the goal of offering concrete examples to enhance the understanding of the varied research areas in the field of personalized advertising in e-commerce.
By adhering to this systematic approach, we aimed to ensure a comprehensive and well-organized representation of the literature related to personalized advertising in e-commerce. The selected keywords and articles collectively contribute to the multidimensional exploration of this dynamic field.
Next presented alluvial diagram in
Figure 1 shows the size of our 4 clusters representing them as flows and visually linking them with shared most popular 4 keywords. Keywords popularity are represented with curved lines whose width is proportional to their frequency in selected cluster.
After analyzing these articles, we noticed that many studies examine the impact of personalization in advertising for boosting e-commerce sales. NAI’s study report [
23] found that behaviorally-targeted ads more than twice as valuable, twice as effective as non-targeted online advertising in converting users who click on the ads into buyers and that behavioral advertising accounted for approximately 18% of advertising revenue. 91% of consumers say they are more likely to shop with brands that provide offers and recommendations that are relevant to them and 49% will likely become repeat buyers (repeat buyer denotes a customer who makes at least two purchases with the same company) after a personalized shopping experience with a retail brand, according to Segment’s 2022 State of Personalization report [
24]. Personalized advertising campaigns have shown promising results, according to Chen et al. [
25] and Kim et al. [
26]. These campaigns designed to target specific customer segments based on their browsing and purchasing behaviors, and have been shown to be highly effective in increasing sales and customer engagement [
27,
28].
Our primary novelty of research objective aimed to develop an algorithm that effectively minimizes advertising costs while concurrently safeguarding e-commerce sales from any adverse impact. In this sense, it would be very difficult to assign such a topic to one of the examined clusters. Articles that closely align with our research goal are those investigating customer behavior through an examination of their browsing history.
In Kagan & Ron Bekkerman [
29] the machine learning has been applied to develop a panel-based customer purchase model, trained by large data base of purchase history, including products, their categories and number of purchases, which allows to recognize potential customers for the target group for ads. The model proved to be highly effective in determining the profile of a website’s audience and predicting product categories.
According to Yin et al. [
30], personalized ads based on clickstream data led to a 50% increase in conversion rates and a 46% increase in revenue per visitor compared to non-personalized ads. Zhang et al. [
31] found that by segmenting customers based on their browsing behavior, e-commerce companies could increase click-through rates by up to 14% and conversion rates by up to 20% compared to non-segmented campaigns. Several studies have proposed different methods, such as using the frequency of purchases [
32], demographic and other customer data [
33], and machine learning algorithms [
34].
Even more variables were applied for clustering customers and predicting their churn rate by taking into account spending variables (spending amount in the last month, average payment amount per time) and behavioral variables (average number of products purchased at one time, number of searches in the last month, average stay time per session, number of visits in the last month) of each customer data [
35].
The idea of analyzing sequence of customer journey in the website has been also tested for selecting target groups for advertising. The sequential browsing behavior of consumers was experimentally tested for targeted marketing strategies for e-commerce platforms, by using clickstream data [
36]. In this research the sequential browsing behavior of consumer groups with heterogeneity expressed by demographic data was analyzed in relationship to browsing duration, time of the day and other calendar feature analysis, and by product categories.
This studies conducted by e-commerce researchers, found that using clickstream data to personalize online advertisements can lead to significant improvements in conversion rates and revenue for e-commerce companies. At the same time, we did not find in them calculations of how this affects advertising company costs, although this is also a very important issue when organizing an ads company.
3. Methodology for Calibrating the Customer’s Value Metric
The efficient advertising problem is firstly related to cost decisions, as showing ads for each customer means expenses for the company in case those ads are clicked. Achieving high precision of identification of target customer group which can potentially bring biggest turnover becomes an extremely important marketing problem. The conservative and widely accepted selection strategy mean that the target group for advertising is selected from customers who have added an item to their shopping basket. The number of such customers is about 10–30% from total number of surfers. The maximalist advertising strategy includes all customers who have ever viewed the description of at least one item, which should address about 90% of total number of surfers.
Increasing the target group of customers for showing advertising ads dramatically increases advertising budget, and lowers the profit of e-shop. The features which could enable optimal selection of target group for advertising should increase the interest and response of the customers to the advertisement which shows for them.
This article presents a comprehensive approach to targeting advertising scenarios for e-commerce websites by utilizing clickstream data analysis and calculating the accumulated customer activeness indicator. Target clusters of customers are built by weight-based adjustment of visited links of different types. Clickstream data provides a detailed record of a visitor’s online journey, including the sequence of pages visited, visit durations, timestamps, search terms, ISPs, countries, browsers, and computer specifications. The algorithm used in our strategy dynamically evaluates the accumulated activeness indicator, taking into account the customer’s activity level, expediency in choosing items, and time spent for exploring them. This helps to identify customers who are actively engaged to the e-shop and are more likely to make a purchase.
The most widespread approach of reaching the customers by ads is to display advertising and tagging, which implies that the advertising banner is shown when the customer has left the webpage of the e-shop. This advertising tool attempts to retain visitors by offering particular products and attractive pricing. Any type of classification based on highlighting particular characteristics of customer behavior meets difficulties of identifying them by data analysis and machine learning tools, it especially concerns e-shop visitors who have not made any purchase decisions, and their clickstream data consists mainly of browsing history. In general, we can characterize the e-shop surfers by assigning them to three large classes:
The first class consists of random surfers who are amused by the web-searching process, but they do not have any buying intentions.
The second class consists of customers who already have made a buying decision and are looking for the particular item in the e-shop. In this case the surfers pre-analyze the supply for these particular goods, make comparative evaluation of prices, and in some cases they even pre-test the quality of goods by arriving to the “real” shop. Therefore, the online shop is used only for getting discounts and other price awards, also for making payment and arranging delivery of goods.
The third class of the web-surfers consists of individuals who have not yet decided about the object and location of their purchase, they use online search for discovering most attractive propositions of e-shops. This particular class is the most attractive for the organizers of marketing advertising campaigns.
The size of the third class greatly depends on the goals of the e-shop, its size and popularity. The approximate assumption on the size of these parameters is based on expert knowledge, which generally specify number of indecisive customers as of approximately 50%.
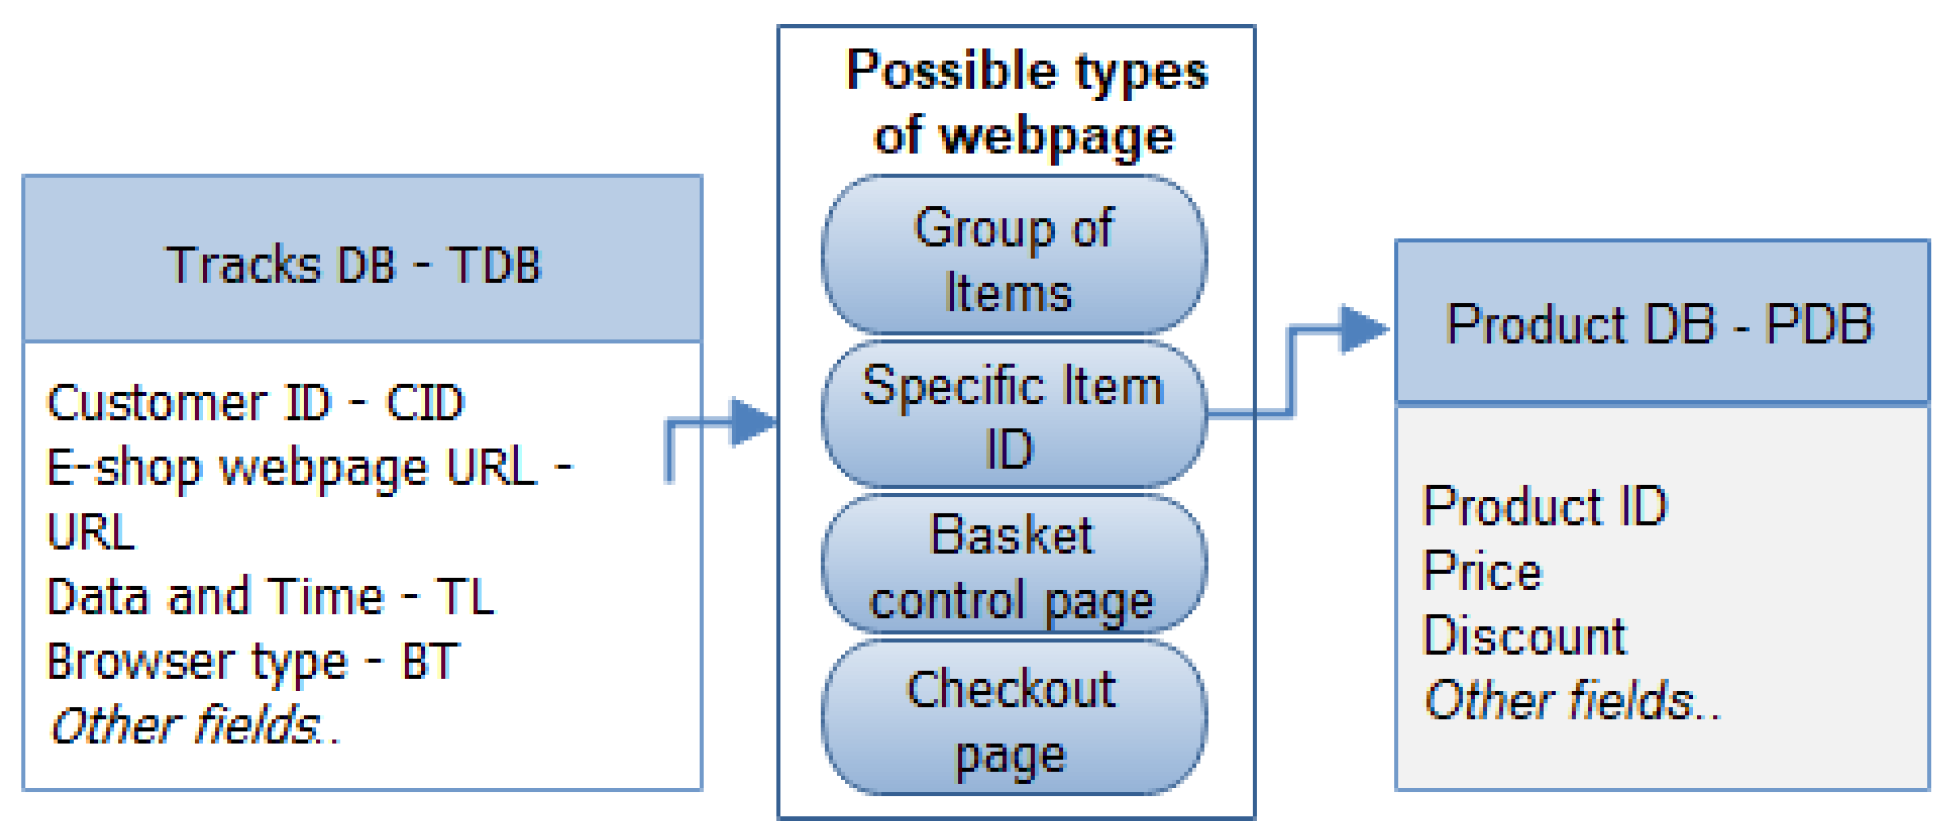
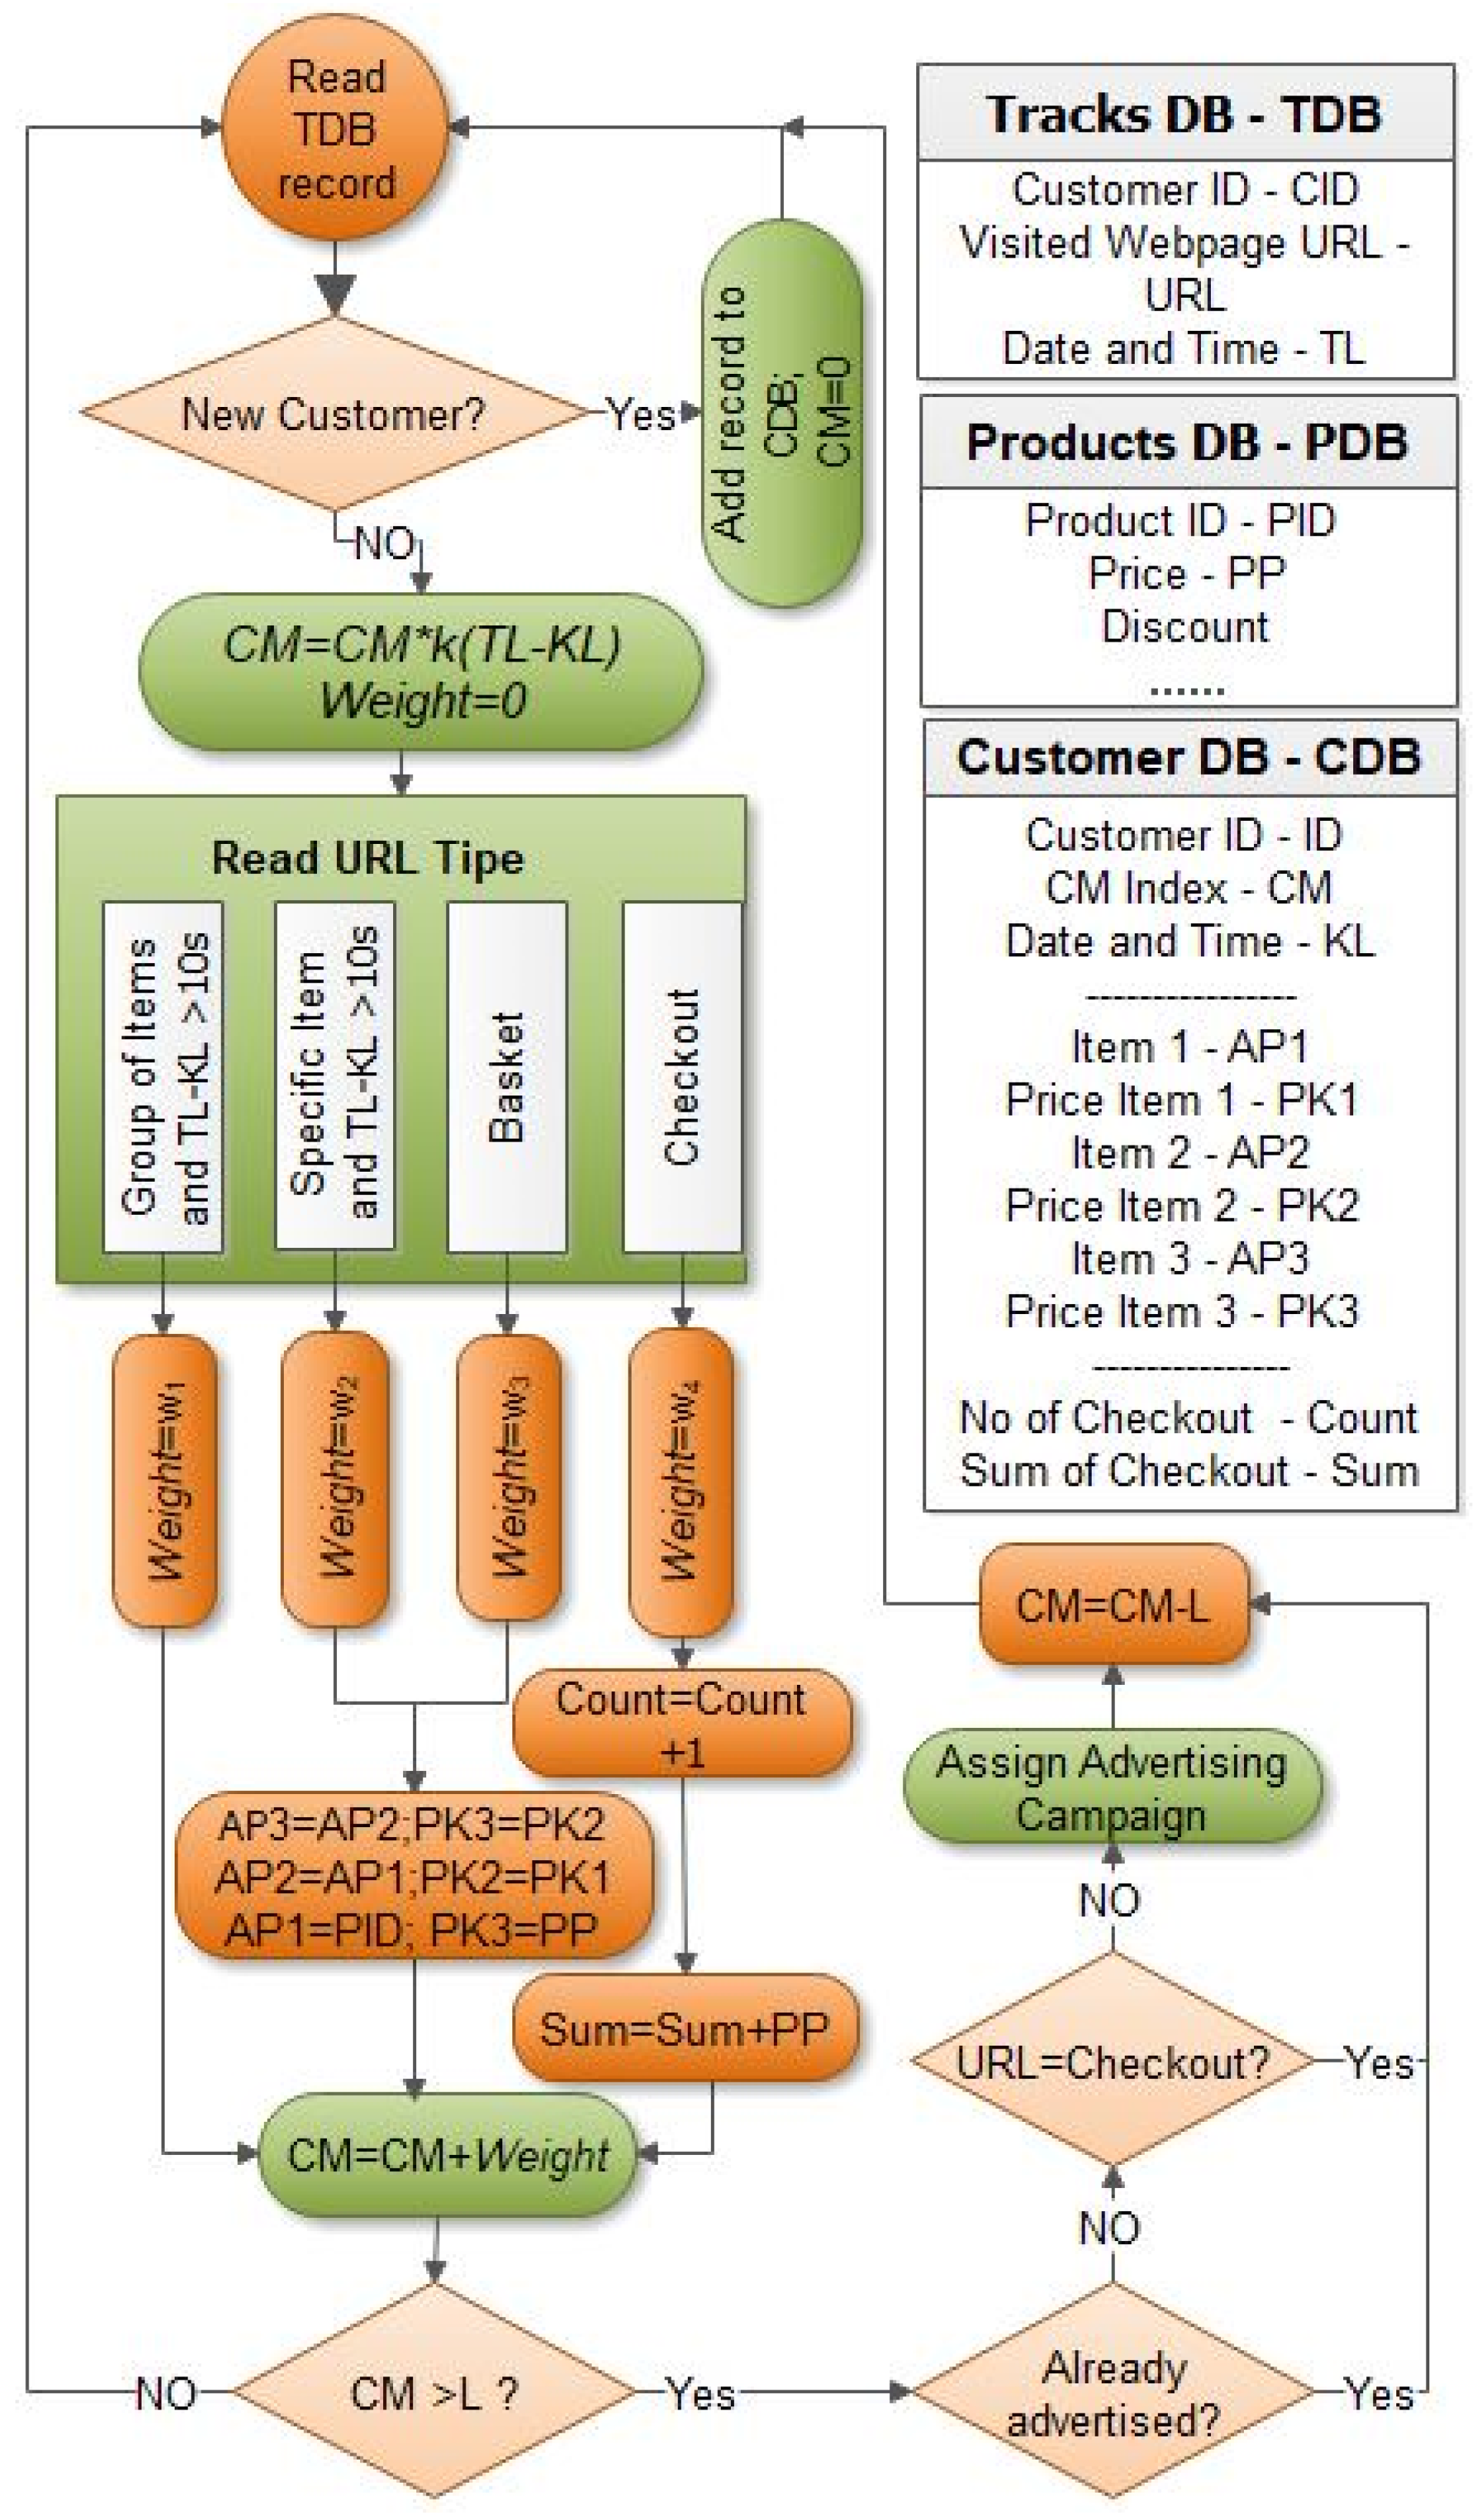
Our research covers the population of e-commerce online site users and their interactions within the web browser, all meticulously documented in a clickstream file. The clickstream data file used for analysis we will call Tracks DB (TDB) (see
Figure 2). It contains basic information such as customer ID (CID), the URL of the visited webpage, and the date and time of the page visit.
According to the structure of the clickstream data file the E-shop webpage URL can describe four different types-levels of visited webpages: Group of items, Specific Item ID, Shopping Basket control page and Checkout page (
Figure 2). Each type of link provides more information gathered about the selected product and stronger evidence of purchase possibility.
The presence of 4-level specific links in TDB file (E-shop webpage URL) indicates a different level of customer readiness to purchase. The main home webpage of an e-shop may indicate just customer curiosity, while the use of links to detailed item descriptions shows a stronger desire to analyze and compare product features or prices among different suppliers. Adding items to the shopping basket does not necessarily indicate a purchase, as about 20% of basket items are abandoned without payment, but this action main mean more serious intention to buy than home page visit. The most valuable customers are those who frequently visit the e-shop, make purchases, and have a high total purchase value.
The Specific Item ID link is connected to the second file—Product DB (PDB), which contains detailed information about the products, such as product name, price, current discount, etc. By analyzing the product-related data, the proposed strategy can recommend personalized advertising scenarios that are tailored to each customer’s preferences and needs.
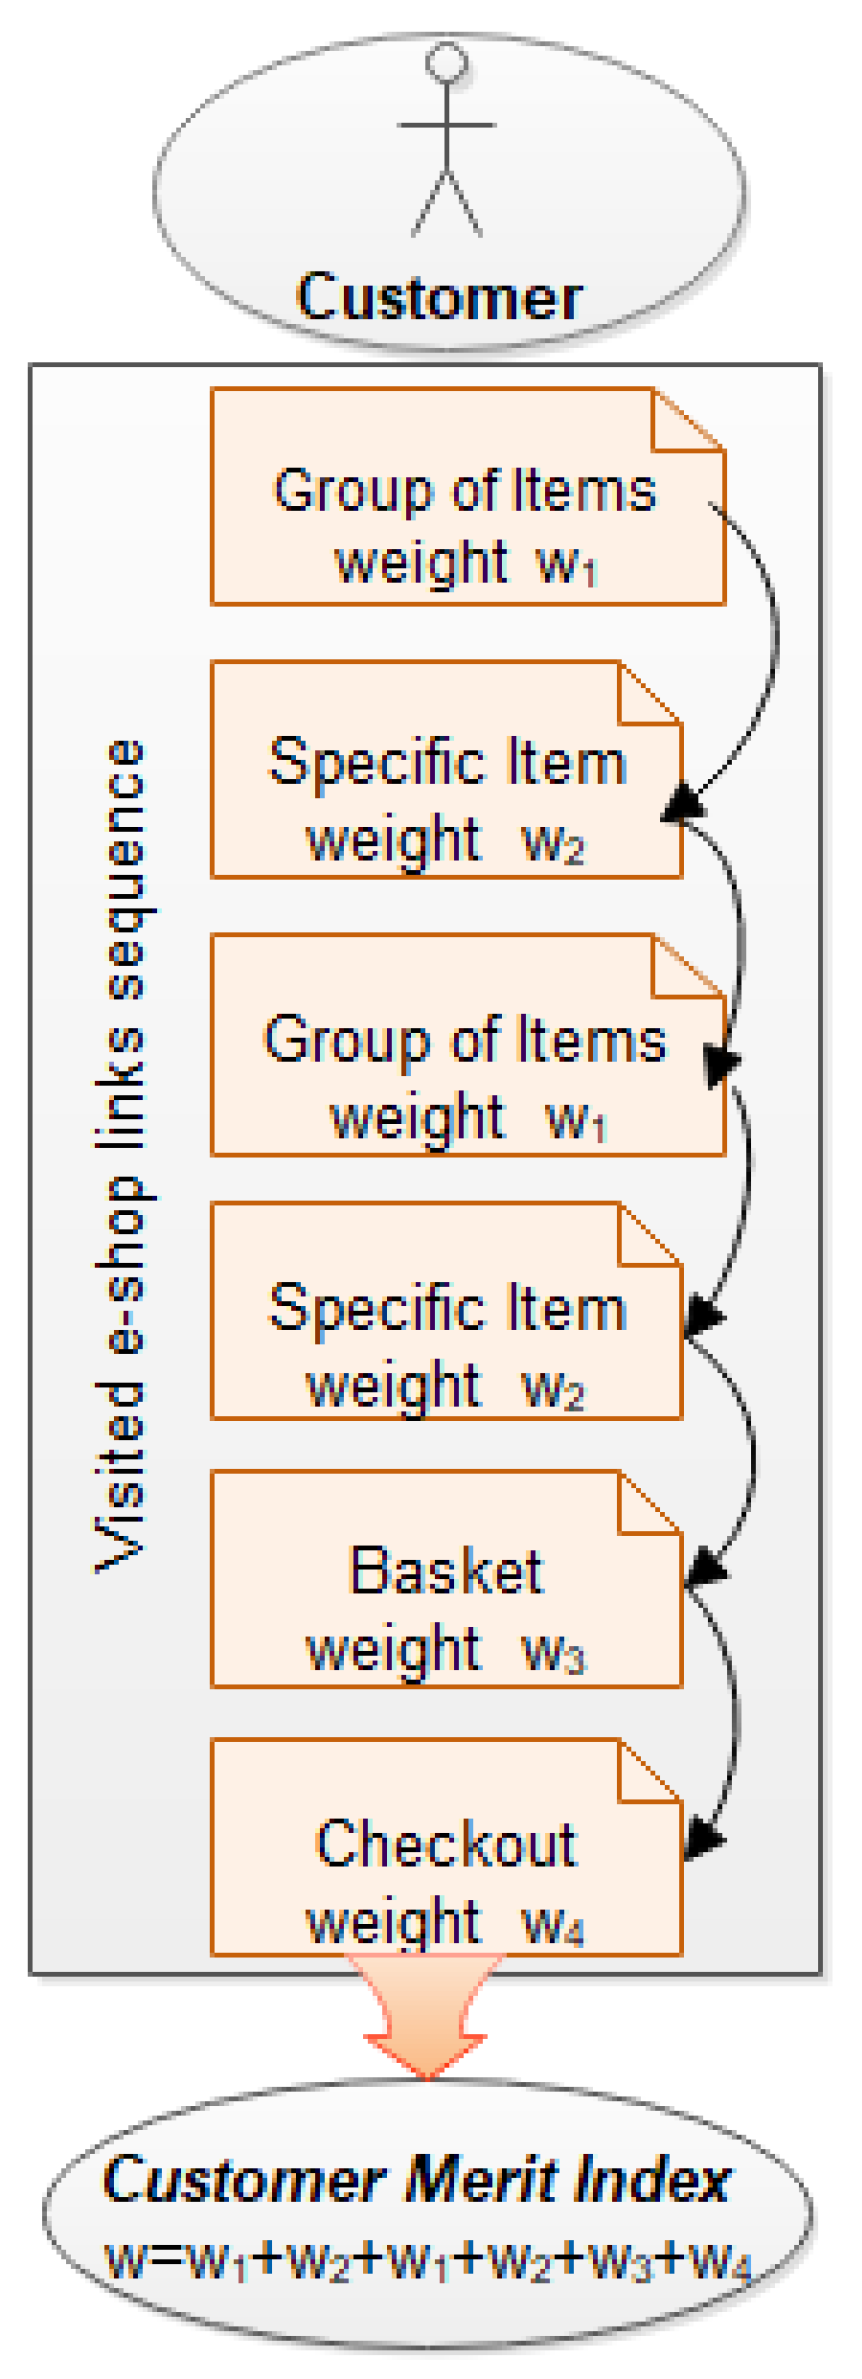
Our methodology fundamentally revolves around displaying advertisements exclusively to the most valuable customers. The value of the customer is assumed to increase if their spending value at the e-shop increases. The proposed link-based customer’s value indicator can be expressed by assigning different weights to the visited links. The total indicator characterizing the dynamics of customer engagement in e-shop surfing is defined as the cumulative value or the Customer Merit (CM) index. The CM index is the total weighted sum of the visited links, where the weights of possible links are denoted as w1, w2, w3, and w4, accordingly to 4 possible types of webpages. The CM index takes into account all types of adjustments and parameter settings, such as defining minimum time spent on the webpage to ensure that the customer’s awareness of the presented information is sufficient. Only the customers with a sufficient value of the index CM can be assigned to the advertising campaign for showing ads to them.
Additionally, the CM calculation takes into account the recency of the visits, as the more recent visits are considered to be stronger indicators of customer engagement than the elder ones. The algorithm also considers the frequency of visits to the e-shop, as frequent visits indicate a higher level of interest and engagement.
The CM index calculation is performed dynamically, taking into account the customer’s activity level, expediency in choosing items, and time spent exploring them. The algorithm also considers the customer’s behavior across different types of links to determine their level of engagement and interest. The dynamic cumulative CM index value for each customer is registered in a third file—Customer DB (CDB). It enables to track customer value in real time and select candidates for a personalized advertising campaign.
The visual example of calculating CM index for a selected customer is shown in
Figure 3, where we can observe an illustrative example of a customer’s sequence of actions at the e-shop site.
The session starts with the customer visiting the webpage showing a group of items, then it follows by clicking on a specific product item and transferring it to the basket. The customer then proceeds to preview another product before making a purchase of a specific item. At each step of the browsing session, the CM index is recalculated and checked if it has reached the limit value L. Customers with a CM index above the limit L are assigned to the advertising campaign, and their CM index is set to the initial value for starting new calculation. If the CM index does not reach the limit value L, it is updated dynamically based on the customer’s activities. The initial CM index can be set to different values depending on the customer’s merits. The default initial value is 0, but it can be set as a bigger value for the customers who have registered with the e-shop, agreed to receive promotional information, or engaged in other interactions that might be feasible to start dynamic calculation of CM from higher initial CM index value.
3.1. Adjustment Weights of Visited Links
The weight values of e-shop customer visited links are defined as w1, w2, w3, and w4. They are not fixed and need to be adjusted for each e-shop separately and even as changing e-shop trading conditions. The experimental research showed that they should be regularly recalculated within time periods (monthly, weekly) or after any events that have a significant effect on the e-shop’s turnover. Various methods can be employed to evaluate the weights for e-shop links using tracking data (file Tracks DB), including artificial neural networks, analytical hierarchical process, expert and decision support systems, machine learning models or statistical analysis. In our experimental research, the statistical stream data analysis was used to assign weights in a way that ensures the total weights sum equals 1. The example of procedure in Python for calculating weights values can be found in
Appendix A.
The presented code defines weights of the visited links during 7-day period window. This period better characterizes the variety of e-shop trading patterns. The initial observations of the e-shop data showed that the number of visitors, total number of visited links, e-shop surfing time is different for particular weekdays. The minimum time denoting significant interest to the website links is set to 10 s, which is especially important for showing interest to ‘Group of Items’ and ‘Specific Item’ content.
According to this procedure, we loop over all customers in the TDB and check if the time spent in the ‘Group of Items’ and ‘Specific Item’ links is greater than 10 s. If yes, the sums for each link for that day are updated. After looping over all customers and all days, the daily averages of visited links frequency are calculated. Finally, the weights for each link are calculated by applying reverse value of averages of visited links per week, making total sum of 1. We use reverse averages value to ensure greater weight for less frequently visited Basket and Checkout links. The obtained ratio of weights enables reliable selection of indecisive customers by the value of Customer Merit index.
3.2. The Algorithm of Advertising Campaign Assignment
In order to accumulate the changes of customer’s merit (CM) index, we suggest to use a separate Customer DB (CDB) file. The CDB file contains a number of variables that provide valuable insights into the behavior characteristics of customers. These variables include the customer’s unique ID, their current CM index value, and the date/time of their last access. Additionally, the CDB tracks the customer’s browsing behavior, including the last items viewed with their prices, as well as the count and value of items they have purchased. In
Figure 4, a list of all the CDB variables with assigned names is provided.
Moreover, the CDB contains additional information that can further support customer analytics. This includes whether the customer has a registration ID, the type of browser they are using, the operating system they are on, and other relevant characteristics. This information is used to set initial CM index values, determine a limit value L and provide a more comprehensive understanding of each customer’s behavior and preferences. By analyzing these variables, businesses can better tailor their marketing strategies and optimize their e-commerce platforms to improve customer satisfaction and drive sales.
The algorithm for calculating the customer index (CM) involves increasing it after each customer action (visited link) according the Tracks DB file records until it reaches a limit value (L), at which point an advertising campaign is assigned.
The value of L is then returned to the personalized initial value of L. To assign the next advertising campaign, the customer’s CM must once again reach the limit value (L).
If a customer has not been active on the e-shop for a significant period of time, their CM value should decrease. We suggest their CM index is decreased by 1% for each day of inactivity.
For more detailed explanation of the CM computing algorithm, please refer to
Figure 4. In the diagram of the algorithm, we use the file variable names shown at the top right on
Figure 4.
Figure 4, illustrates the procedure of the customer index (CM) computing algorithm. It involves the use of a coefficient k to decrease the CM index value. When k is set to 0.01, it implies that the CM index will be reduced by 1% for each day since the customer’s last visit to the e-shop.
If a customer makes a new visit to the e-shop, but their CM index exceeds the limit value L and an advertising campaign has already been assigned, no new campaign is provided. Additionally, the CM value is decreased by L. Similarly, if a customer has just made a checkout, an advertising campaign is not assigned.
As we can see from
Figure 4, the algorithm follows and register in the Customers DB file the 3 last products the user was interested in, their price and the total value and count of all purchases. This does not affect the CM index value, but can be used to determine the nature of the advertisement campaign.
Our algorithm let as to choose the advertising campaign limit value L depending on how much money we want to spend on this company. If we select L at level 0, advertising will be assigned to all customers who visit the e-shop site. By increasing the value of L, we will reduce the customers number included in advertising company and, at the same time, the budget required for this. How to determine the optimal value of L that ensures the minimum advertisement company price and the maximum attraction of customers is a rather complex task that requires extensive calculations on click-stream data for each individual e-shop.
In the next section, using 2 real e-shops click-stream data, we will demonstrate the performance of our proposed algorithm for different values of limit value L. The number of advertising campaigns assigned to customers in e-shop, as well as the size of the target group of e-shop surfers, is adjusted based on the dynamics of their CM index.
4. Experimental Results for Validating Proposed Algorithm
Targeted advertising is challenging to define due to various factors that influence it. Nevertheless, e-shops set their advertising budgets based on historical data or consultant advice. It is widely accepted that targeted advertising has a positive impact.
The effectiveness of ad campaigns and our proposed algorithm to boost e-commerce sales and reduce advertising cost is experimentally tested on two different Lithuanian e-commerce websites (A and B) characterized by distinct daily visitor counts and varied numbers of visited webpages. The website A specializes in a comprehensive range of cutting-edge computer and household appliances, offering customers the latest technology and innovative solutions for their homes. E-Shop B stands out as a go-to destination for computer and household appliances, featuring a diverse selection that caters to various needs, from high-performance computing devices to modern home essentials. The website A receives approximately 40 while website B has around 20 thousand visitors per day. The approximate daily number of items in clickstream data files are correspondingly 460 and 180 thousand. The analysis performed is based on data from 8 trading days, dealing with more than 4500 thousand clickstream records. Personalized data for this study was generously provided by the e-commerce platforms. The choice of an 8-day research window was guided by the necessity to ensure a minimum of 7 days for the comprehensive evaluation of visited weblinks weights, specifically focusing on days characterized by typical trade turnover.
Original clickstream data was collected in comma delimited files-one file for one day. The variables collected in this file are: pixel—record identification, user—customer ID, data -link accessed, time—Unix timestamp, referrer—previous site link and device—device used. The example of data used is presented in
Table 2.
All calculations were done by using EXCEL and Python 3.8.10 64-bit software.
The aim of this experiment is to identify dependencies in weblinks weights distributions used to compute the CM index values and the selection of limit value L to target customer groups for advertising campaigns between the two websites.
We start with some statistical characteristics of websites A and B, including the average number of links per day visited by customers, are presented in
Table 3.
Based on the data presented in
Table 3, it can be observed that e-shop A has more than 2 times as many visiting customers compared to e-shop B. The percentage of customers who make a purchase is similar between the two e-shops.
However, customers of e-shop A tend to use the shopping basket twice as often compared to those of e-shop B. This suggests that e-shop A has a lot of unused resources in convincing the customer to pay for the items placed in the cart.
Additionally, the average duration of time spent by surfers on site A is twice as long as that of site B. This may be the case if the e-shop A provides a lot of information on one page, or the information provided is quite complicated.
Overall, the results suggest that e-shop A has a larger and more engaged customer base, with customers spending more time on the website and using the shopping basket feature more frequently. Meanwhile, e-shop B has a smaller customer base with less engagement.
Next, we will try to calculate the dynamics of the customer’s index CM and select members appropriate for behaviorally-targeted advertising campaign. First, using the procedure described in
Appendix A, we estimate the weights of visited links separately for each e-store A and B.
The results of calculation are given on the
Table 4.
These results show that the weights assigned to visited links Group of items and Specific item in e-shop A is more than twice lower than for e-shops B links. This mean that in e-shop A, these links are often opened without going to the shopping basket or checkout page. This is also confirmed by the results from
Table 3, where the traffic of these links is significantly higher in e-shop A.
The overlap of weights for the shopping basket implies a very similar percentage of customers on both e-commerce platforms using this opportunity. We have already seen from
Table 3 that only every fourth item placed in shopping basket e-shop A is paid, while e-shop B approximately 40% of such items. Thus, in order to encourage a visit to the checkout page, a weight of 0.622 is given to such a visit in e-shop A.
Of course, we can use other algorithms already mentioned to select the weights, but we should not forget that these methods should be easily implemented, realizing the necessity of frequent recalculation of these weights.
Next, we will try to investigate how the limit value L affects the CM index values and the size of the target group of customers selected for advertising campaigns. For that, we will apply the algorithm described in
Figure 4 to calculate CM index from the available clickstream data of both e-shops to target high-value customer groups. The results of calculation are collected in file CDB and we can investigate the influence of limit value L on the size of target group.
Table 5 shows the average percentage of target customers selected for advertising campaigns based on 9 values of L: 0.2, 0.3, 0.4, 0.5, 0.6, 0.7, 0.8, 0.9, and 1.
Regardless of the rather different parameters of the considered e-commerce sites, the size of the selected group for personalized advertising is very similar and depends only on the CM limit value L. Optimizing the size of target customers group and the intensity of personalized advertising campaigns can be achieved by changing the CM limit value L. Thus, each e-shop can assess its financial capabilities and choose the appropriate size of the target group according to the parameter L.
Bearing in mind that the same advertising campaign was applied to all visitors of e-commerce sites, we will determine how effective can be our target group selection for personalized advertising campaign, i.e., we will see what percentage of visitors in the selected target group and those who did not enter it, made purchases in stores A and B respectively (see
Table 6).
Observing the behavior of customers in store A, we notice that the larger the selected target group for ads, i.e., L is smaller, the success rate is lower. By success we mean checkout for goods. So, if L = 0.2 and the target group consists of 41% of all customers, we have only 8% of successful transactions. And when L = 1 we have selected only 12% of customers, but the success of the advertising company reaches almost 28%.
Conversely, based on our data, only approximately 1% of customers who were not exposed to the advertising campaign made a purchase.
Examining the results of e-shop B, we observe trends very similar to those of store A, but the efficiency of target group in B was almost twice as low as that of group A. At the same time, we observe an increased number of purchases among unselected for ads customers. Why did this happen? There can be many reasons for this. First of all, our data on purchases is already conditioned by advertising, since the e-commerce portals apply advertising to all interested customers. We propose that the advertising companies used in e-stores A and B are very different, and e-store A’s advertising is significantly more effective. The design of online stores sites can also affect the success of an advertising company. The more attractive, more complete and more organized it is, the more customers will return back to make a purchase.
Therefore, for the application of proposed algorithm, it is very important to correctly determine the links weights and select the optimal limit value L for customer index CM. Only in this case we will have the sufficient size of the personalized advertising group which will allow to reduce ads company cost and ensure the effectiveness of the advertising campaign.
5. Conclusions and Future Works
The majority of e-commerce sites face the challenge of selecting customers who need assistance and encouragement to make purchasing decisions. The problem is that customers do not always admit they need help, and may simply switch to a different e-shop where they feel more attended to. Moreover, e-commerce platforms typically aspire to autonomously control advertising campaign costs and delineate the dimensions of their target audience. To address this issue, the article presents an algorithm for calculating the Customer Merit index (CM), which estimates the value of a customer based on their clickstream data and determines whether assistance should be provided during their online shopping experience. Typically, this assistance comes in the form of personalized advertising campaigns that reflect the customer’s interests. While the duration and modes of these campaigns were not specified, the presented scenario of accumulating customer surfing history data could facilitate decision-making in this area.
Given the agile and migratory nature of e-commerce websites, which cater to a wide range of customers and goods, the proposed method of dynamic customer ranking allows for the weights of evaluation factors to be recalculated and adjusted CM values to be obtained in response to changes in the trading situation. Additionally, the setting of CM limit value L allows for the modification of the cluster size of customers who are assigned to the advertising campaign. This feature is crucial for meeting changes in advertising budget, modes, and campaign formats.
The experimental testing of the proposed method was carried out on two online shops A and B with different parameters such as size, number of customers, and assortment of goods. The e-shop A has more than 40 thousand visitors per day and near half million clicks records, The B respectively 20 and 110 thousand. The results of the empirical research confirm the stability of the method, which can reliably select a sample of the most valuable customers by applying the same value of L across different e-commerce structures.
By analyzing the effectiveness of advertising campaigns on two different e-commerce sites A and B, we have selected 9 different size target groups. The target group size is directly influenced by the limiting value L of the CM index. The study found that the success of advertising campaigns highly depends on the size of the targeted customer group. Specifically, a bigger CM index limit value L resulted in a higher success rate, as fewer customers were targeted but the advertising was more effective. As example, for target group L = 0.2 which consists of 41% customers, we have only 8% of successful transactions, while for smaller target group with L = 1 and 12% of customers we have almost 28% of success in advertising company. On the other hand, only about 1% of purchases are observed among unselected customers.
The study also found that the design and effectiveness of the advertising campaigns varied between the two e-commerce sites, highlighting the importance of selecting the optimal L value and accurately weighting the links used by customers. Overall, the study suggests that personalized advertising based on the Customer Merit index can significantly reduce advertising costs while maintaining or even increasing the effectiveness of the advertising campaign.
The presented experimental case study demonstrates that the practical implementation of the algorithm can produce reliable clustering results and select a sample of the most valuable customers for advertising campaigns. By providing personalized assistance to customers based on their clickstream data, e-commerce sites can improve customer satisfaction and increase sales providing flexibility in the advertising budget and campaign format.
The scientific implications of our study extend to researchers and students, offering insights into the effectiveness of personalized advertising algorithms in the context of e-commerce. For online store managers, practical implications arise in optimizing advertising campaigns for increased customer engagement and sales. Customers of these online websites may benefit from a more personalized and relevant shopping experience.
Future research could explore how to make advertising campaigns more effective by adjusting their duration, intensity, and content. Additionally, there is potential to use a newly created Customer Database (CDB) to determine key aspects of advertising, like the number of items promoted and personalized values for targeted ads based on Customer Metrics (CM) and customer behavior history. While it’s challenging to find e-commerce companies that do not utilize advertising agencies, studying such data and comparing e-commerce sales before and after ad campaigns, using our proposed methodology, would be of interest.


