1. Introduction
Global spending on road repair and maintenance exceeds USD 400 billion annually [
1]. Road pavement is the uppermost surface layer of a road designed to support vehicular traffic and provide a durable and seamless driving surface. Several studies and investigations have been carried out regarding the impact of road pavement damage on both safety and the economy [
2,
3]. The principal aim of researchers in this field is to reduce expenditures associated with inspections and maintenance. Furthermore, creating efficient and economical technologies for detecting road surface cracks is crucial in establishing a sustainable road management framework [
4]. The present techniques utilized for evaluating road pavement damage can be classified into three distinct categories: manual assessment, automatic assessment, and image processing. Road assessment in developing nations often involves the utilization of manual inspection techniques. Members of the maintenance department must assess the severity of road damage in real time. However, in practical circumstances, the manual procedure proves to be tedious due to the extensive nature of the testing routes and the significant resource requirements of the task. The employment of automated detection systems for road pavement assessment is on the rise. Using sensor-equipped vehicles exemplifies technological progress [
5]. However, the complexity of pavement conditions poses a challenge for automated assessment tools. Consequently, the attainment of precision and swiftness becomes increasingly challenging. Additionally, the equipment requires costly hardware, which incurs high maintenance expenses.
Image processing techniques can integrate high efficiency while maintaining low cost. As technological advancements are made, the precision of detection is increasing. As a result, many researchers have employed image processing methodologies to identify pavement deterioration [
6,
7]. The complexity of road surroundings makes manual feature extraction impractical using conventional image processing techniques. In contrast to traditional image processing methods, deep learning-based image processing techniques have gained widespread adoption to detect pavement damage due to their superior accuracy, speed, and embeddability [
8].
Deep learning technology has made significant advancements in detecting road damage. The authors Naddaf et al. (2019) [
9] employed the Faster Region Convolutional Neural Network (Faster R-CNN network) to detect road damage. They additionally evaluated the impact of different lighting and weather conditions on the detection process. A study by Mandal et al. [
10] presented a novel approach for detecting pavement damage using the one-stage YOLO CSPDarknet53 network. The authors’ work contributes to the growing research on the pavement damage dataset, further expanding the range of models explored in this domain. Although the research in pavement damage detection has made progress, there remains significant potential for improvement in accuracy and detection speed.
In recent years, the maintenance of roads has become a critical responsibility for traffic management departments due to the rapid expansion of the traffic network. Road pavement damage detection and classification application can be used for various purposes. Some of its applications are Structural Health Monitoring, Autonomous Personal Mobility Vehicles, and Intelligent Transportation Systems (ITS). This study aims to design a deep neural network model that utilizes object detection techniques to identify instances of pavement damage in photographic representations of outdoor road surfaces, as manual inspection is labor-intensive and time-consuming, requiring individuals to capture images to evaluate road damage in real time. Object detectors based on deep learning, such as YOLOv5, have the advantage of efficiently identifying road pavement damage caused by a moving vehicle. This method eliminates the restrictions inherent to manual road inspection. Road pavement damage detection tasks using YOLOv5 are primarily motivated by YOLOv5’s impressive accuracy and detection speed as an object detection algorithm. YOLOv5 is one of the most popular and easily customizable object detection algorithms, making it ideal for custom object detection tasks [
11,
12]. YOLOv5 proves to be a perfect fit for this study due to its speed and considerable accuracy. The contributions can be summarized below:
The Efficient Channel Attention module (ECA-Net) was initially incorporated into the model’s backbone and neck network to enhance the model’s accuracy.
Label smoothing techniques are employed as a way of enhancing the generalization of the model.
The K-means++ algorithm was utilized to identify an acceptable anchor box for the dataset instead of the default COCO dataset-based anchor box.
Subsequently, this research utilizes Focal Loss, a cost-sensitive loss function, to address the class imbalance by assigning higher importance to challenging data points.
Finally, an additional prediction layer has been incorporated to extend the model’s learning capacity across various objects and scales.
2. Related Work
The employment of methods based on deep learning has gained substantial acceptance because of their remarkable efficacy across a wide range of domains, such as computer vision, soil science, and solar flare prediction [
13]. The transportation industry is subject to the effects of technological advancements. The rapid progress and extensive implementation of deep learning technologies can potentially enhance the ability to detect road pavement damage. According to current studies, maintaining road infrastructure is essential for establishing a secure, economically feasible, sustainable transportation system. Therefore, researchers are now aiming to utilize techniques such as deep learning to evaluate road pavement damage and optimize cost reduction.
Several methodologies based on deep learning have achieved noteworthy advancements. The efficacy of deep learning techniques has catalyzed the creation of additional algorithms that rely on feature extraction and pattern recognition to detect road pavement damage. Oliveira and Correia [
14] proposed using the mean and standard deviation from unsupervised learning to discriminate between road pavement cracks and non-crack blocks. Cord and Chambon [
15] suggested using the Adaboost algorithm to select structural descriptors that effectively depict fractured images and produce the crack saliency map. Despite the impressive outcomes produced by these techniques, their practical utility is significantly limited by their dependence on extracted features. The detection of objects can be achieved through various techniques, with Faster R-CNN and YOLO being two of the approaches most commonly used. The Faster R-CNN approach was utilized by Li et al. to propose a method for the recognition of road surface damage [
16]. The system can discriminate among six distinct categories of road surface defects and accurately pinpoint the precise location of the affected region within a given image. The research employed 5966 photographs, resulting in an average precision rate of 96.3%.
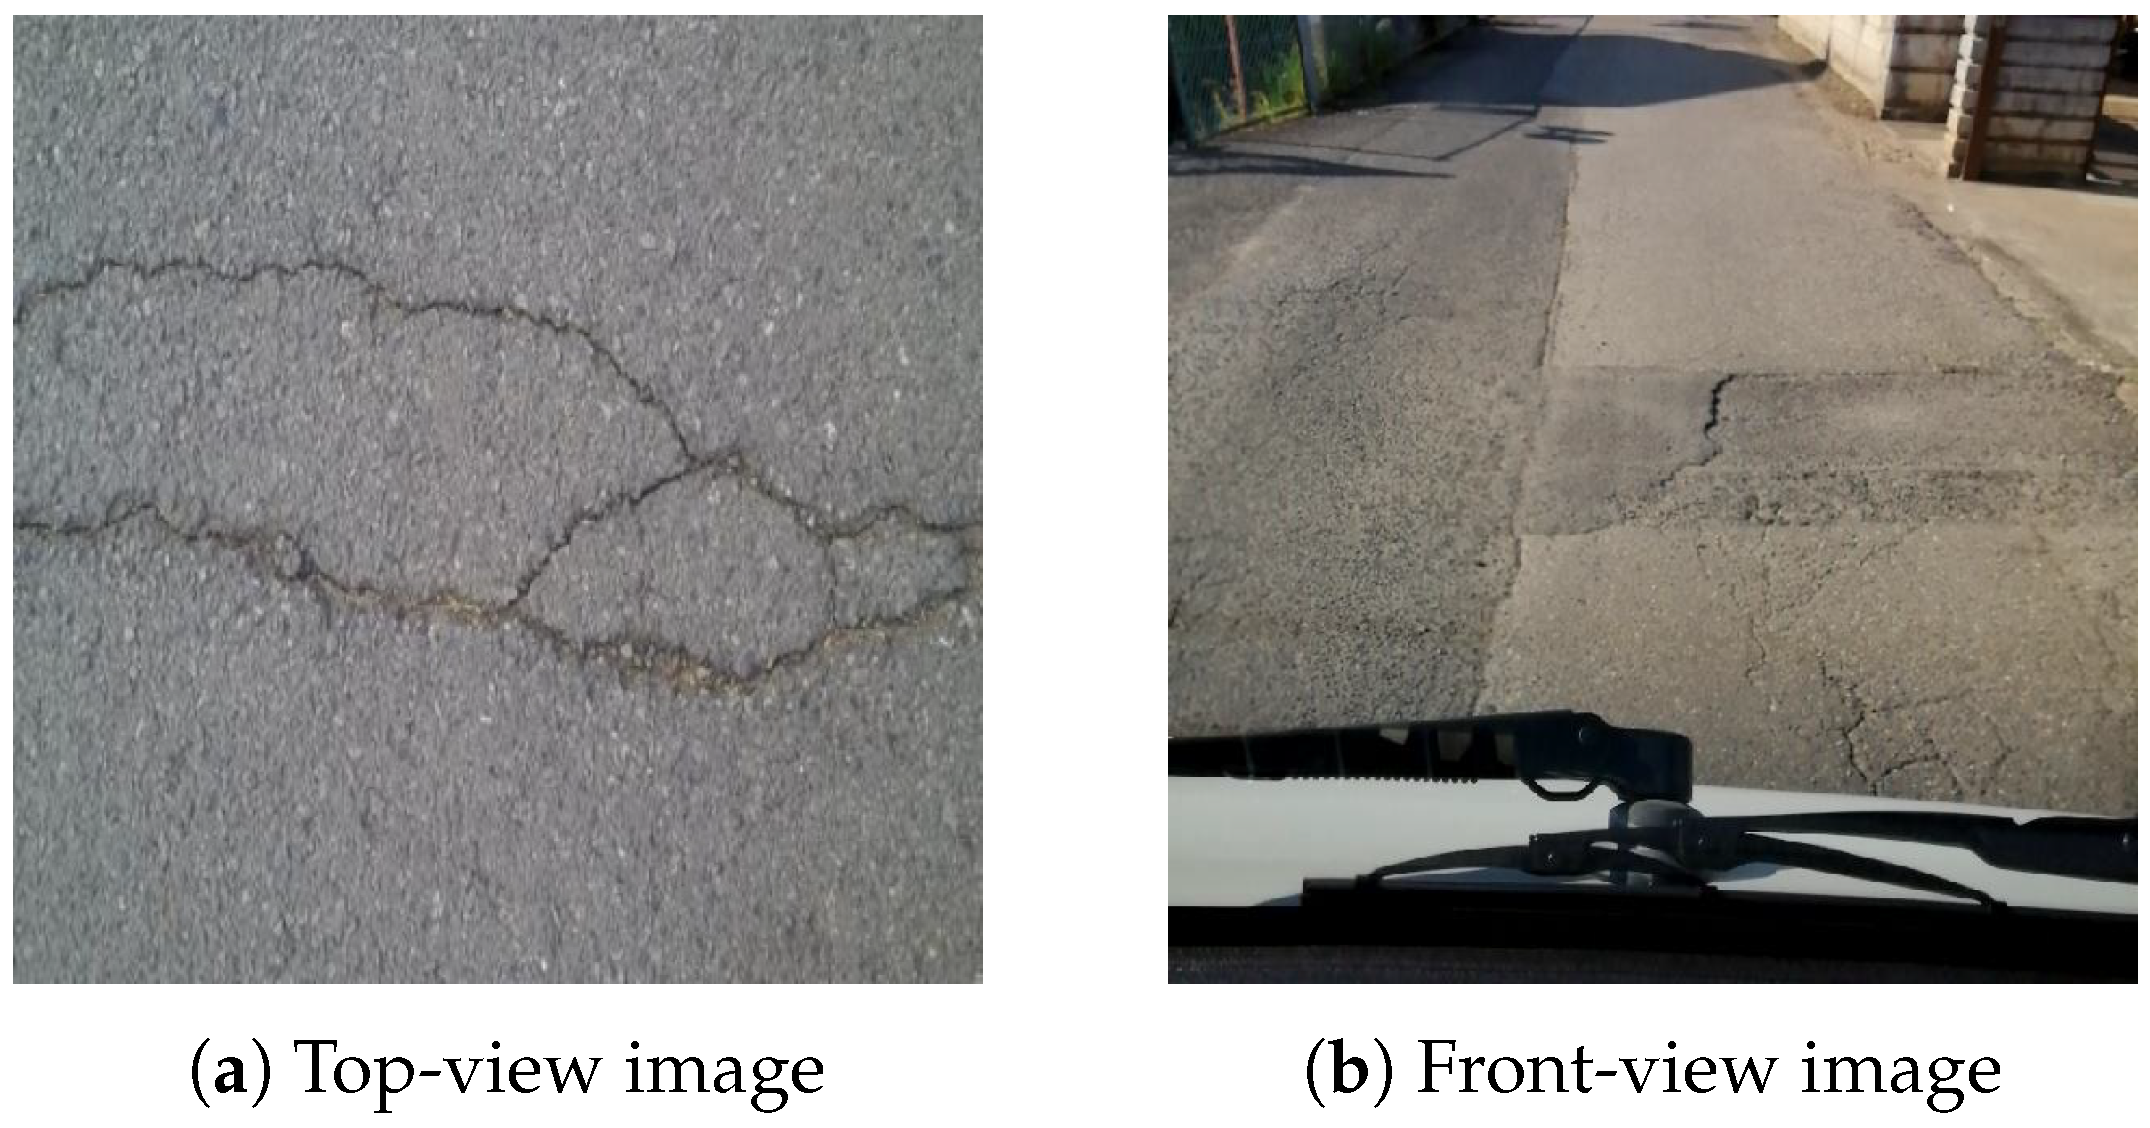
Researchers use two distinct image types for road pavement damage detection study. One is a snapped photo of the top view, while the other is of the front perspective. It is described in
Figure 1. Top-view photographs are acquired from the road’s surface, while a dashboard-mounted camera captures front-view images.
Top-view damage photos are less complicated, and most studies on top-view damage have excellent detection accuracy. However, most of these models solely exhibit damage caused by cracks. Most studies based on top-view images did not attempt to classify different types of road pavement damage. Naddaf et al. [
17] used a Bayesian technique to optimize CNN design to maximize the abstraction of the final model with a 97% percent accuracy rate. In their study, Yusof et al. [
18] conducted fine-tuning of the filter sizes in a Convolutional Neural Network (CNN) to attain a satisfactory accuracy rate of 94.5% in determining various types of cracks in road photographs. The authors’ findings suggest that this approach may be effective in road maintenance and inspection. The majority of research about top-view images is centered around semantic segmentation. Liu et al. [
19] utilized the U-Net architecture to identify cracks in concrete. The model that has undergone training exhibits a high degree of accuracy in identifying cracks present in images. FCNs can be outperformed by this approach, as it requires a smaller number of training sets to achieve superior results. Wu et al. achieved a recall rate of 97% through the utilization of diverse image processing techniques on the UNET model, as reported in their study [
20]. Zhang et al. [
21] developed a CrackNet architecture that does not incorporate a pooling layer to detect cracks on roads. The model achieved a high level of accuracy, specifically 90.1%. The model exhibited impressive results by attaining a precision of 98.00% and an accuracy of 97.92% in the classification of various types of crack damage. While the models mentioned above exhibit remarkable detection capabilities, their practical implementation is restricted. The acquisition of such road images through specialized vehicles regularly incurs substantial costs.
The road damage detection model using front-view images focuses on developing detection and classification models employing images captured by dashboard-mounted cameras. Identifying road pavement damage through automated means is a viable and pragmatic approach in real-world scenarios, with extensive ongoing research being conducted in this domain. However, the procedure is considered challenging due to the complex and obscure nature of the damage in this particular type of image. Furthermore, apart from the road surface, the contextual elements captured in these photographs include environmental factors such as atmospheric conditions, geographical features, and other noise, which pose challenges to identifying pavement damage. Nevertheless, effectively utilizing these images for damage detection would yield significant benefits in pavement monitoring activities. Currently, the repositories of front-view images are extensive. Furthermore, it has the potential to be swiftly and effortlessly augmented. Again, utilizing comprehensive pavement coverage images during inspections and camera installation procedures is simple and cost-effective. Despite the numerous benefits of using images as a resource, studies in this area remain limited due to images’ diverse and complex textures. Deep learning-based models have been proposed as a viable solution to tackle these challenging requirements effectively [
22]. However, only a few models have their performance evaluated using images taken by dashboard-mounted cameras.
Shim et al. [
23] proposed a lightweight semantic segmentation method. This is noteworthy, as most research on front-view images typically focuses on object detection. Their proposed approach enhances precision, decreases parameters by 85.7%, and improves computational speed by 6.1%. Furthermore, they enhanced the model’s parameters without considering any potential impact on its detection speed. They proposed additional research utilizing a lightweight auto-encoder network with a hierarchical layout to detect pavement damage [
24,
25]. Most of these models did not attempt to categorize damage into distinct classifications. Instead, researchers employ object detection models, such as Faster R-CNN, YOLO, and SSD, to identify and categorize instances of pavement damage. Maeda et al. [
26] proposed combining a Single shot detector (SSD) with an Inception backbone and an SSD with a MobileNet backbone to detect and classify eight categories of pavement damage with a 71% Recall score. Jeong et al. [
27] proposed a model based on the YOLOv5x architecture, which yielded an F1 score of 67%. However, the detection speed could be more satisfactory. Wang et al. [
28] identified and classified pavement damage with a 62.5% F1 score using a Faster R-CNN model with data augmentation techniques. Guo et al. [
29] employed the Mobilenetv3 architecture as the backbone and trained YOLOv5s using the RDD 2020 dataset. The algorithm utilized by the authors integrates coordinate attention, K-means, and label smoothing techniques. Incorporating diverse techniques in their algorithm resulted in a 2.5% enhancement of the F1 score compared to the YOLOv5 baseline model. Wan et al. [
30] trained RDD 2020 using ShuffleNetv2 as the backbone and ECA-Net as the attention mechanism in YOLOv5s. They use Focal Loss and BiFPN neck instead of YOLOv5’s original neck. Their model increases the efficiency of image recognition by 22.3%. Recently, Pham et al. [
31] employed the YOLOv7 model with coordinate attention and label smoothing techniques on the RDD 2022 dataset. In addition, they customize the default image enhancement settings of YOLOv7. This exhibits enhanced capacity for generalization and resilience.
Rapid and precise road damage identification can greatly benefit the road maintenance industry and contribute significantly to the economy. The maintenance of road pavement technology is of utmost importance in ensuring the preservation of pavement quality, injury prevention, and prompt detection and resolution of road surface issues.
3. Methodology
YOLOv5 was chosen as the object detection model to be utilized for detecting and classifying pavement damage. Initially, a thorough exposition of the YOLOv5 framework will be presented. Subsequently, we shall expound upon our proposed adapted framework tailored to suit our designated objective. Finally, a comprehensive elucidation of every altered constituent will be presented, delineating the modifications implemented to augment the precision and efficacy of the model.
3.1. YOLOv5s Architecture
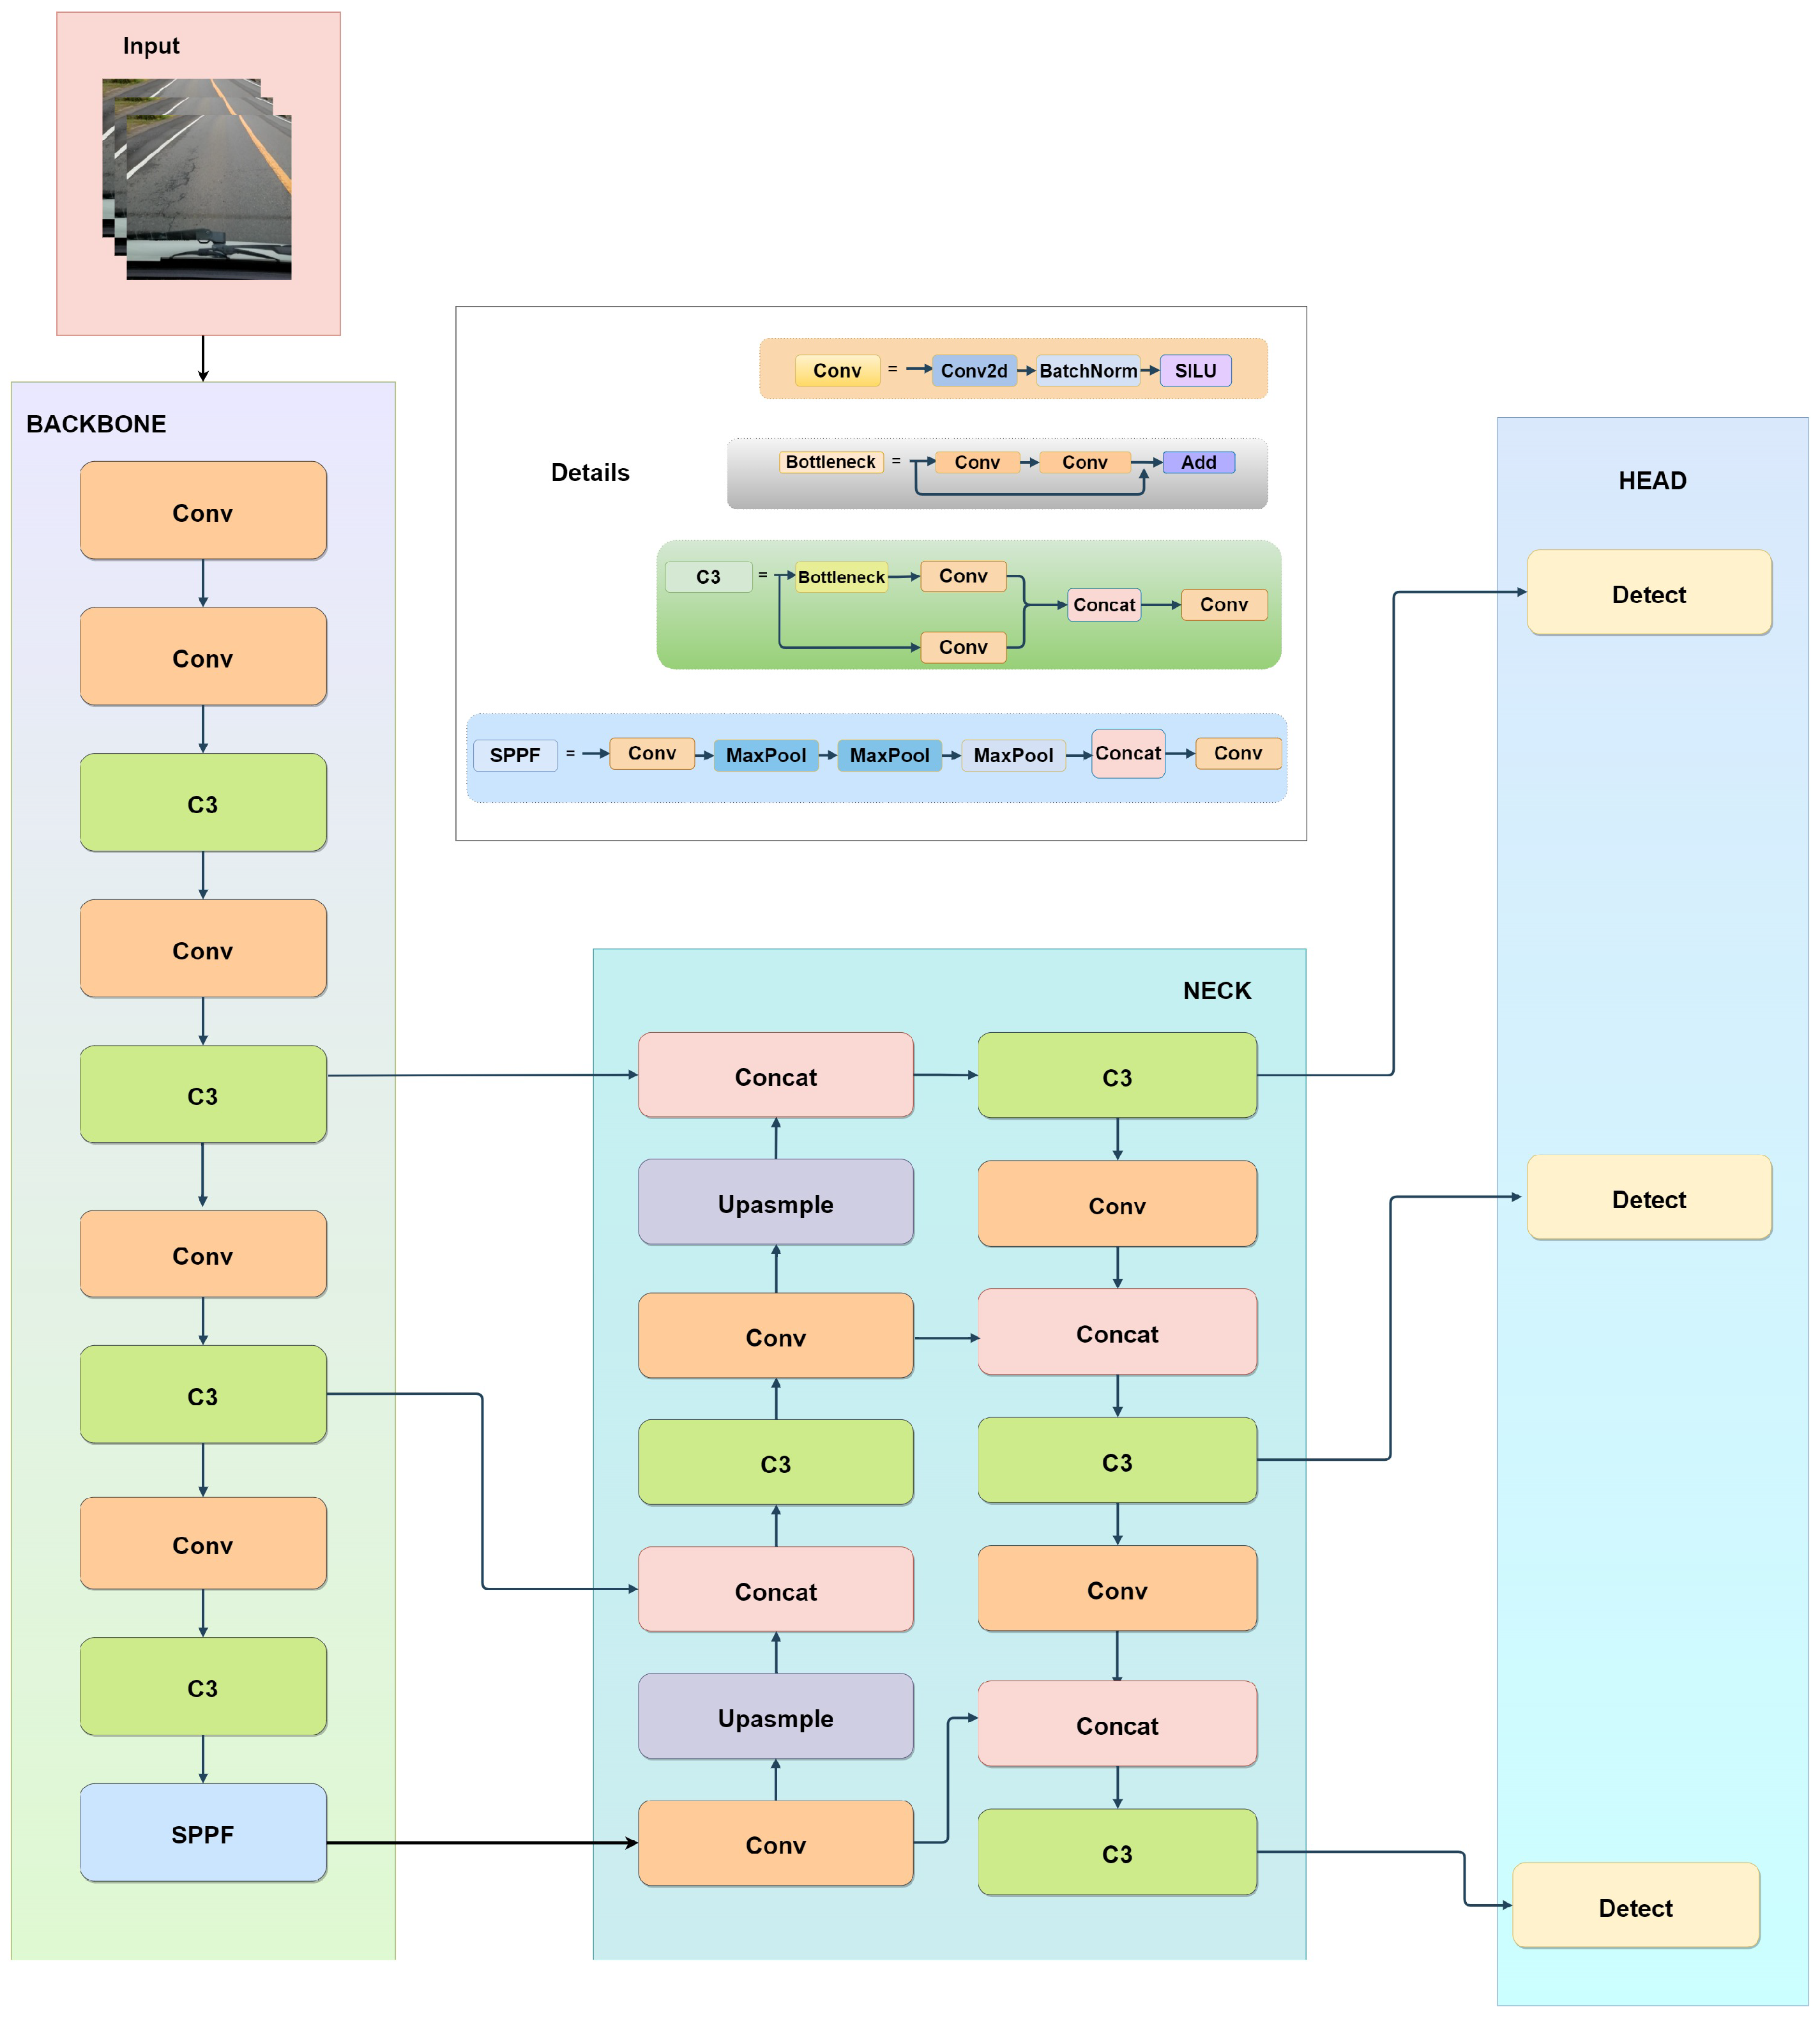
The YOLOv5 model is a one-stage object detection framework that comprises four distinct versions, namely YOLOv5s, YOLOv5m, YOLOv5l, and YOLOv5x. These versions are regulated by two parameters, namely multiple-depth and multiple-width. The smallest and quickest model is YOLOv5s, with a parameter of 7.0 M, while the most prominent model is Yolov5l, with 76 M. The architectural structure is partitioned into four distinct components, the input, backbone, neck, and head, as illustrated in
Figure 2.
3.1.1. Input
The YOLOv5 network initiates image pre-processing, then resizes the image to 640 × 640 × 3 before feeding it into the backbone network. The greater efficiency of YOLO with a 640 × 640 image can be linked to the algorithm’s built-in design [
32]. The YOLO algorithm partitions an image with dimensions of 640 × 640 into a grid consisting of 20 × 20 cells, where each cell measures 32 × 32 pixels. This particular grid dimension facilitates an optimal equilibrium in detecting objects of varying sizes.
The YOLOv5 input undergoes adaptive image scaling and mosaic data enhancement for processing. The process of adaptive image scaling involves resizing the source image to a predetermined size, followed by its input into the neural network for detection. The utilization of mosaic data enhancement is observed during the training phase of the model. The mosaic data enhancement technique involves the integration of four images employing random arrangement, random cropping, and random scaling to augment the training dataset. Subsequently, the image integrated with mosaic undergoes rotation, panning, flipping, and color adjustment.
3.1.2. Backbone
The primary constituents of the backbone network are the Convolution Module (Conv), the C3 module, and the Spatial Pyramid Pooling Fusion (SPPF) module. Conv is a fundamental component encompassing Convolution, Batch Normalization, and Sigmoid Linear Unit operations that extract features from input data. These operations of conv aid in detecting and highlighting relevant image patterns and structures. The C3 module plays a crucial role in feature extraction by facilitating cross-stage connections. It enables data exchange between the various phases or layers of the neural network. This exchange contributes to a greater understanding of the input data by simultaneously capturing low-level and high-level features. The parameter N in C3 specifies using the BottleNeck module N times within a single module. Including a residual structure within the BottleNeck module has been observed to effectively address the gradient disappearance arising from the deepening of neural networks. The SPPF structure evolved from Spatial Pyramid Pooling (SPP) to alleviate computational pressure and increase network speed. This module is designed to capture information at multiple spatial dimensions. It divides the input feature maps into various grid sizes, and the network’s feature extraction is accomplished via maximum pooling with varying pooling kernel sizes independent of each grid. This process enables the model to concentrate on multiple image details regardless of their spatial dimension, thereby improving object detection accuracy.
3.1.3. Neck
The neck can be regarded as the feature fusion network. The neck includes the Conv module, C3 module, an upsampling module, and a Concat module. The neck structure employs a fusion approach that combines top-down and bottom-up features. The bottom-up approach facilitates the effective transmission of positional data from the lower to the upper layers. The fusion of high-level and low-level features through the top-down path enhances the detection efficacy of small objects. Integrating the two paths can consolidate the characteristics of distinct detection layers originating from diverse backbone layers. The utilization of this particular structure has the potential to enhance the detection efficacy of dense objects.
3.1.4. Head
The YOLOv5 algorithm’s head mechanism employs three different YOLO Head classifiers to identify feature images of varying scales: large-scale, medium-scale, and small-scale. The prediction outcome encompasses the projected category, level of confidence, and positioning of each predicted box. Hence, it is essential to compute the losses of the three predicted results distinctly during the formulation of the loss function. The YOLOv5 model’s loss function comprises three parts, namely the confidence loss (
), localization loss (
), and classification loss (
). The aggregate loss is computed as the summation of three distinct losses, and each is assigned a specific weight. Equation (1) represents the full loss function.
The weighting factors denoted by
a,
b, and
c correspond to the three partial losses. Equations (2)–(4) represent all these partial losses. We utilized the default settings as suggested in the YOLOv5 implementation, wherein we set the values of a, b, and c to 1.0. This decision also corresponds with the results of other cutting-edge research, such as YOLOv4 and YOLOv3, where these setup values have exhibited favorable compromises between accuracy and computational efficacy [
33,
34].
The symbol is utilized to ascertain the presence of a detection object in cell i. The is utilized to ascertain the responsibility of the jth prediction box located in cell i for detecting the given object. The notation is utilized to indicate the classification score of a specific category C, whereas denotes the actual value of the category linked with the prediction box. The weight coefficient in the absence of an object is denoted as , while represents the confidence score. Additionally, the intersection portion of the prediction box and the actual box is defined by .
Binary cross-entropy loss (BCE) is mainly used in classification and confidence loss, while CIoU (Complete Intersection Over Union) loss is commonly used for localization loss.
Equation (5) defines the binary cross-entropy loss. In the given equation,
denotes the actual label of the sample in the real-world scenario, whereas
signifies the anticipated likelihood of the data point being affirmative, taking into account all
N data points. The augmented form of the localization loss is described in Equation (6).
The symbols l and g in the equation represent the ground truth and prediction box, respectively. The symbol denotes the Euclidean distance. The parameter c represents the diagonal length of the smallest possible closed box that can cover both boxes above. The intersection degree of IoU of two boxes is represented by Equation (7). v in Equation (8) denotes the aspect ratio’s consistency. Finally, the symbol , denoted in Equation (9), represents the trade-off parameter.
3.2. Improved YOLOv5s
The YOLO architecture size varies considerably from nano to extra-large based on multiple-depth and multiple-width parameters, and selecting the appropriate model for training is essential. Accuracy will improve as the model size increases, but model deployment will become problematic. The YOLOV5m and other large versions are unsuitable for real-time road damage detection and classification because they require excessive parameters. So, an effort was made to improve the YOLOv5s model, which contains 7 million parameters suitable for detection speed.
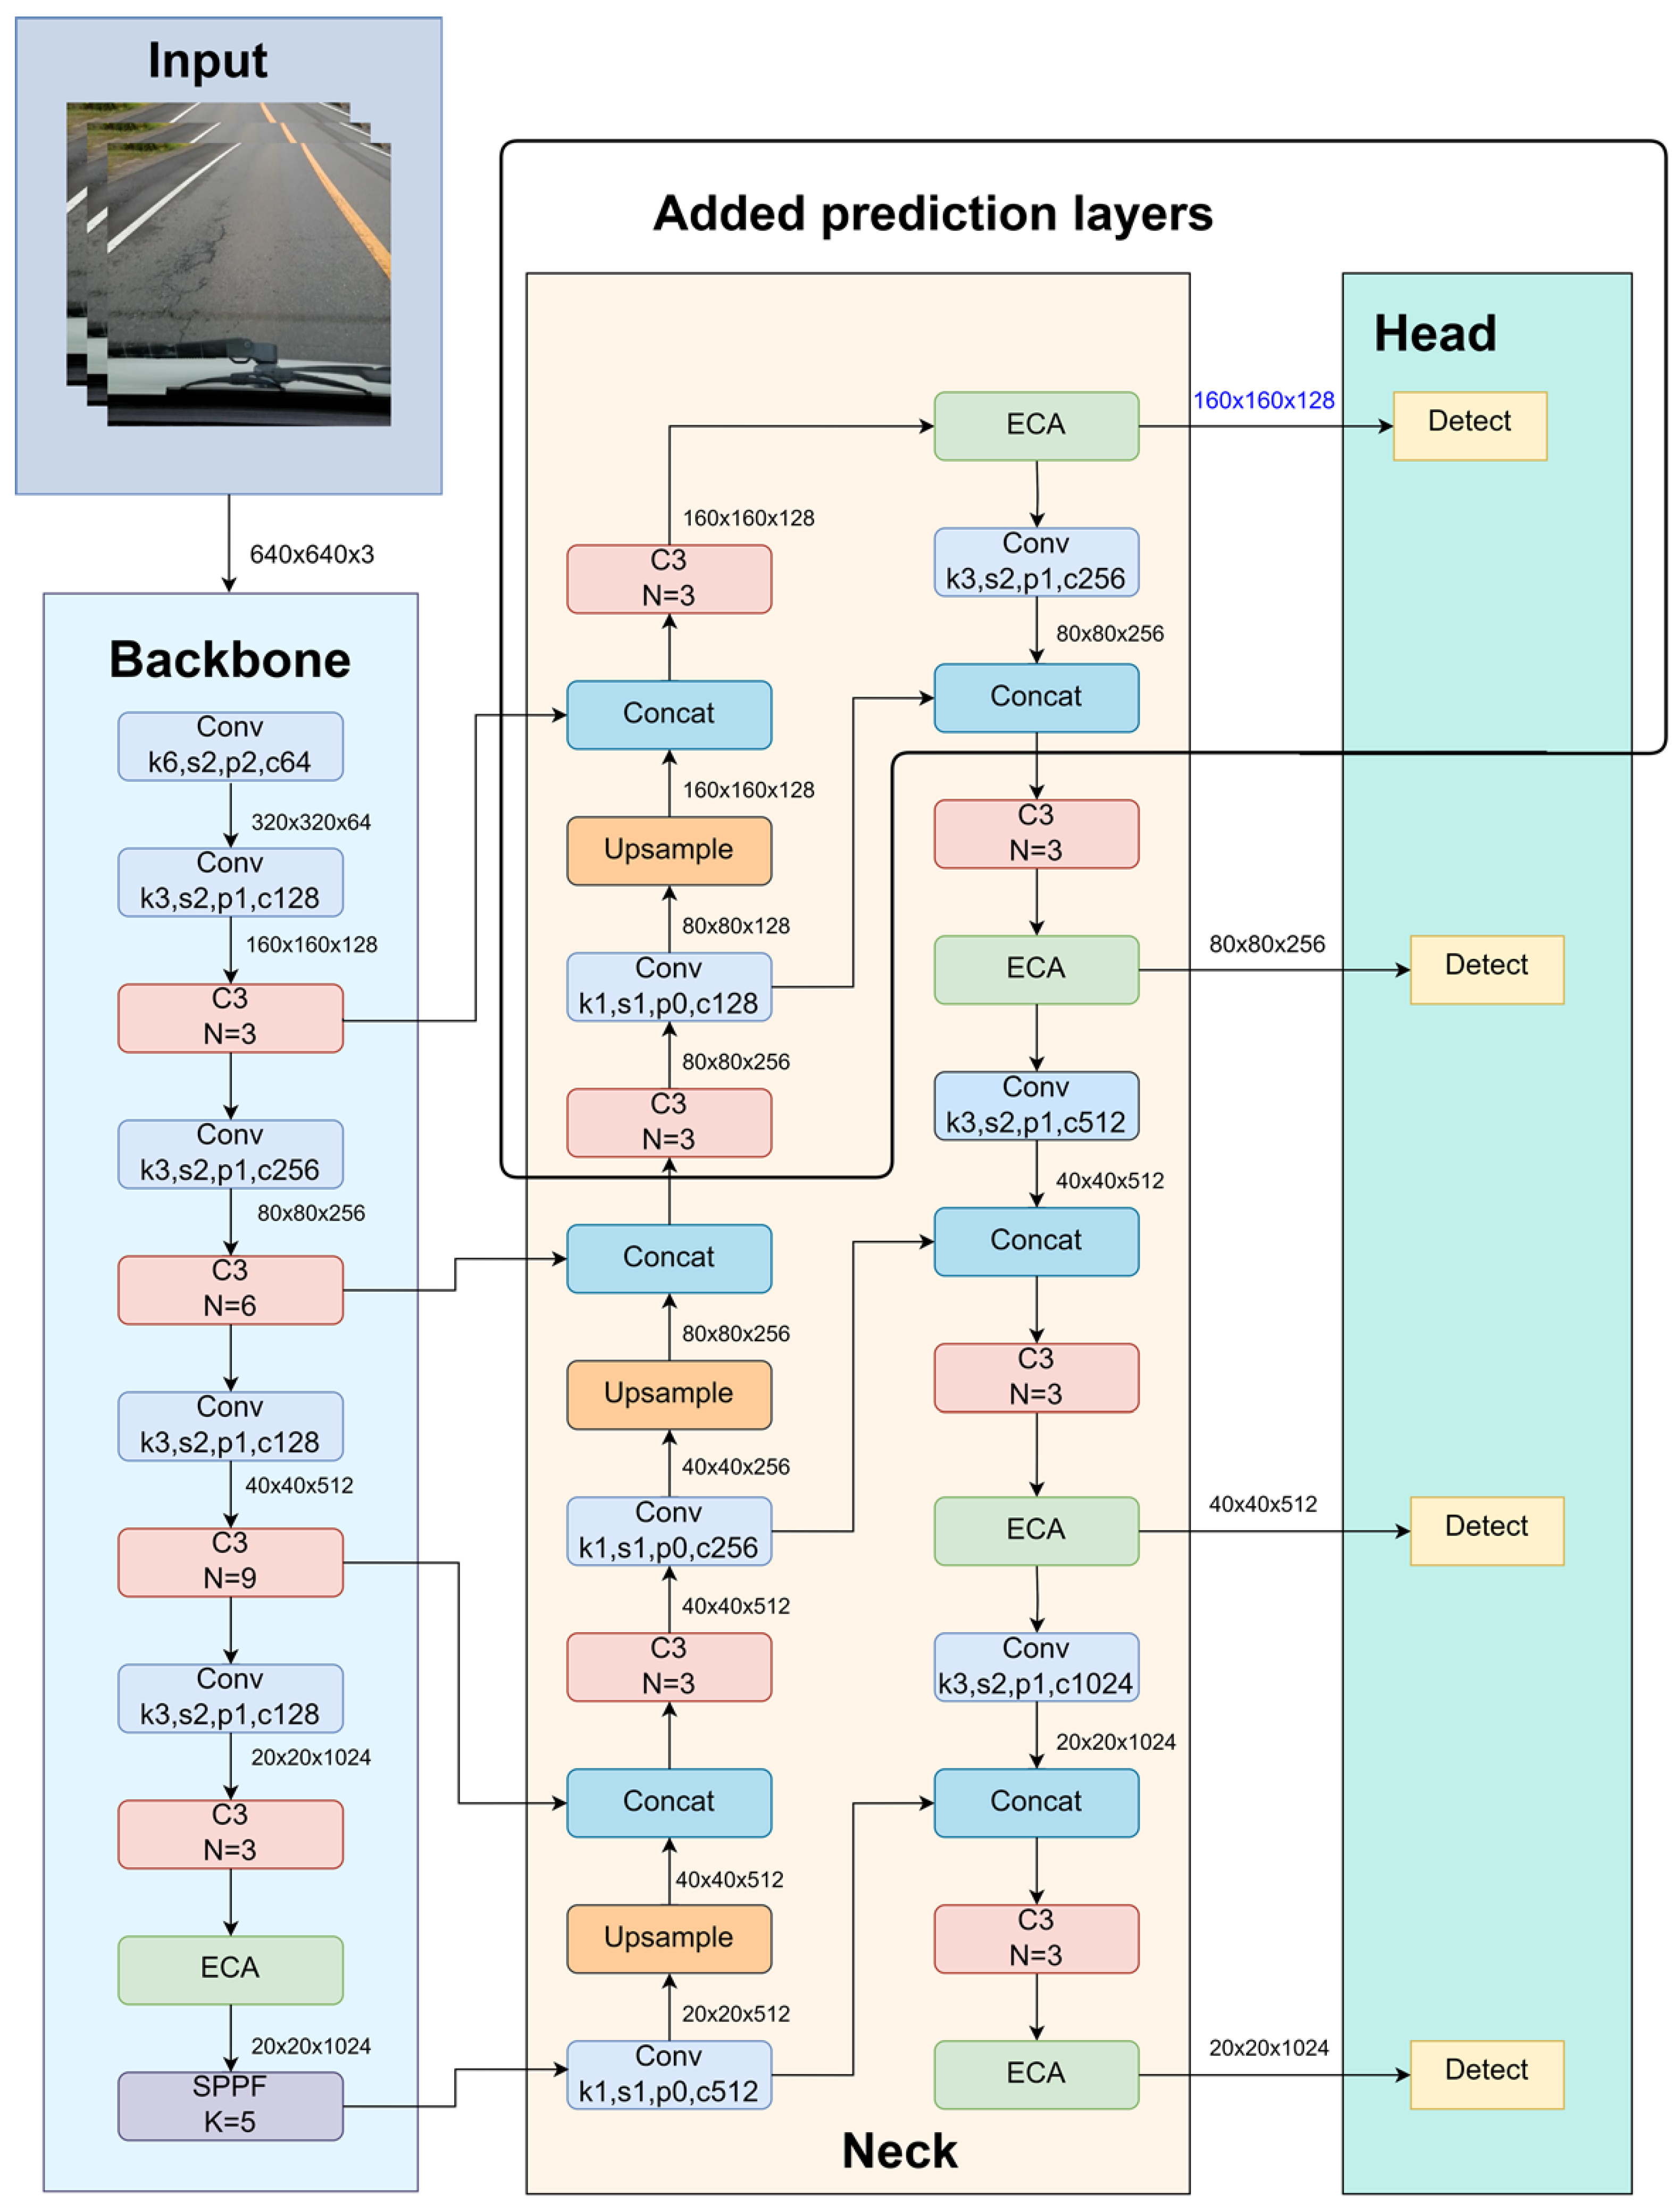
Figure 3 represents our improved YOLOv5s network architecture. It satisfies the requirements for road pavement damage detection tasks, particularly regarding detection speed. The primary obstacle in pavement damage detection and classification is sustaining detection speed while improving accuracy. To accomplish this, we modify the architecture of YOLOv5s significantly. Comparing diverse backbones, the default backbone of YOLOv5, CSPDarknet, is chosen as the model’s backbone network.
Our modifications to the YOLOv5 model include several essential techniques designed to improve its performance in detecting road damage. Our YOLOv5 model enhancements include incorporating the efficient Channel Attention module (ECA-Net) into the network’s backbone and neck. ECA-Net recalibrates channel-specific feature responses, improving the model’s precision by focusing on relevant information and reducing noise. This refinement enables the model to capture intricate details and contextual information from images of road damage, significantly enhancing its accuracy. Secondly, label smoothing was used to improve the generalizability of the model. This method replaces rigid labels with smoothed probabilities, making the model more resistant to data variations and less prone to overfitting. Label smoothing is preferable when dealing with various road pavement damage images and lighting conditions, enhancing the model’s performance on unseen data for real-world applications. Thirdly, the K-means++ algorithm, instead of the default K-means algorithm, was used to iteratively analyze the dataset to identify an appropriate anchor box for our dataset instead of the default COCO dataset-based anchor box. This modification ensures that anchor boxes align closely with pavement damage object features, increasing the accuracy of the model’s bounding box predictions. Fourth, Focal Loss was utilized instead of binary cross-entropy loss because it is more effective when there is an imbalance between positive and negative examples. Focal Loss places greater emphasis on complex examples, ensuring that the model does not prioritize straightforward cases when calculating loss. This modification allows the model to concentrate more intently on identifying instances of pavement damage. Finally, we have added an additional layer of prediction to improve the model’s ability to learn across numerous objects and scales. It enables the model to capture fine-grained details and adapt to objects of varying sizes, which is crucial for accurate pavement damage detection. Collectively, these techniques improve the YOLOv5 model’s accuracy, robustness, and adaptability, making it an effective instrument for pavement damage detection in real-world scenarios.
3.2.1. Enhancing Object Detection with Attention Mechanism
The analysis of human vision yielded the concept of attention mechanisms. Thus, attention mechanisms in deep learning are comparable to the selective attention mechanism of humans. Their primary objective is to select more critical information regarding the current task objective from many pieces while disregarding other unimportant details. Spatial, channel, and mixed mechanisms are the three primary categories of attention mechanisms.
The ECA-Net is a recently developed attention mechanism characterized by its lightweight and efficient design [
35]. It improves the Squeeze and Excitation Network (SENet) framework [
36]. The YOLOv5 model was enhanced by integrating an ECA attention mechanism to enrich defect detection accuracy in complex scenes.
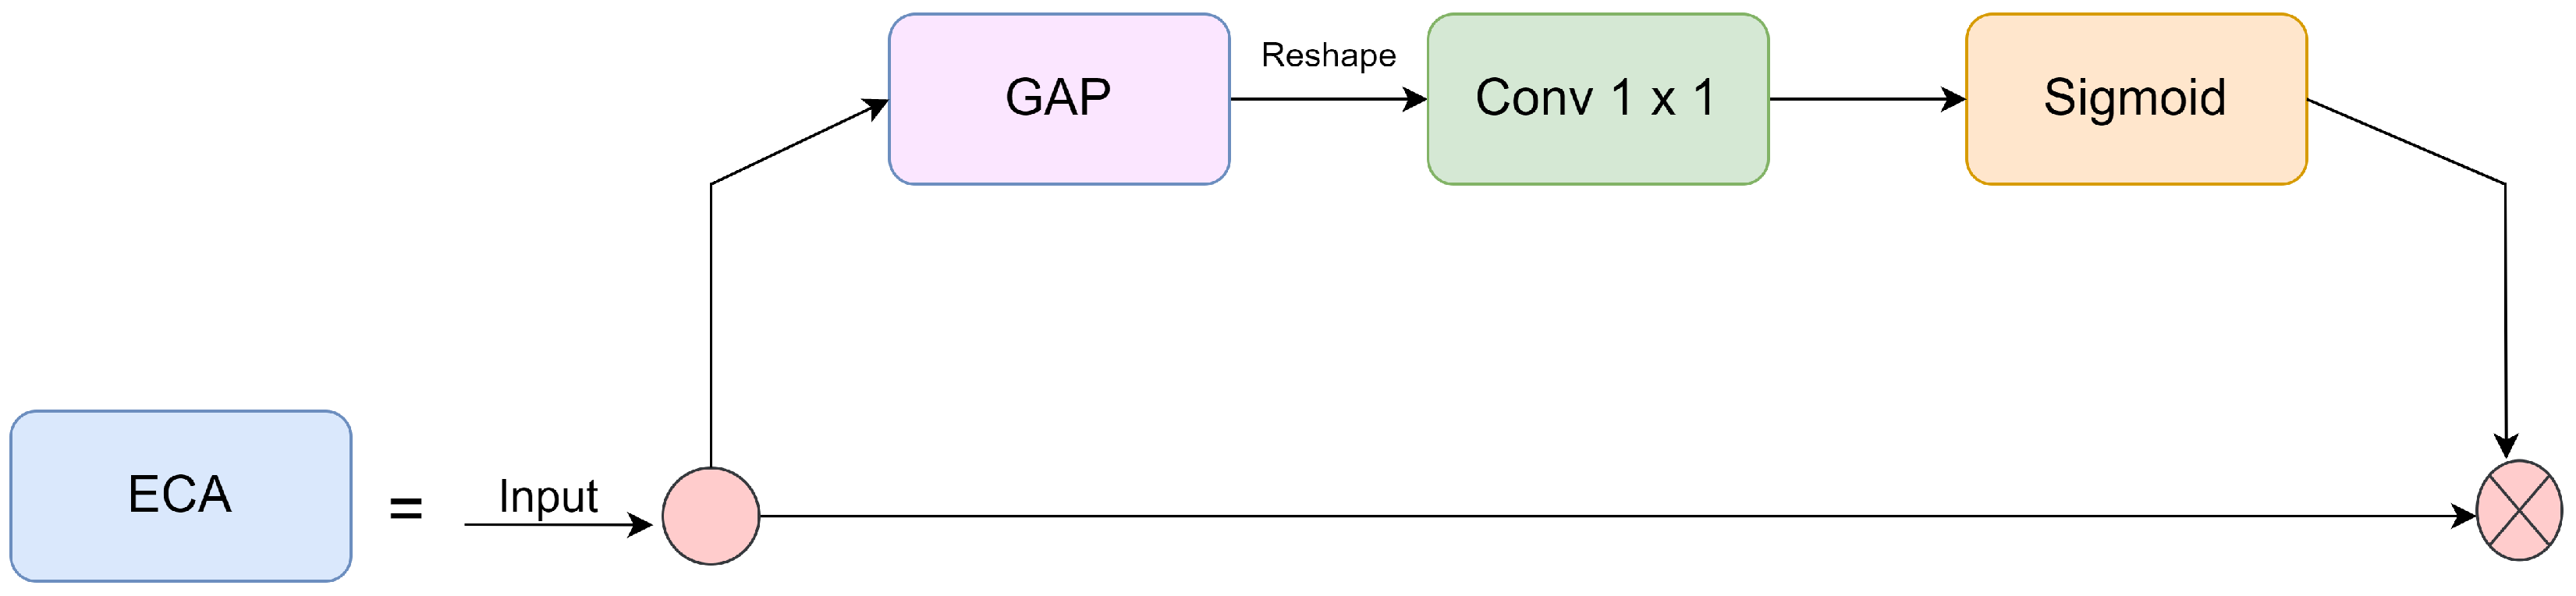
Figure 4 depicts the ECA attention mechanism. This integration facilitated the model’s focus on object regions while training and reducing insignificant information representation. ECA employs the one-dimensional sparse convolution filter to generate channel weights to replace the full connection layer in the SENet. According to the study’s findings, implementing the proposed method can enhance the precision of predictions without imposing additional computational demands. Furthermore, the method can be readily integrated into mobile networks, facilitating widespread deployment.
The ECA-Net model utilizes Global Average Pooling (GAP) to transform the input feature map
X, a real-valued matrix with dimensions
W ×
H ×
C, into a singular real value. The resulting features are
, a matrix with 1 × 1 ×
C dimensions. The variables
W,
H, and
C correspond to the feature’s width, height, and channel, respectively, as indicated in Equation (10). The feature extraction process from
is achieved through a convolutional operation using a one-dimensional convolution kernel of size
K.
K is represented as Equation (11).
The sigmoid activation function is commonly employed to trigger the output result following convolution to obtain the weight parameter. This parameter reflects the correlation and significance of all the channels. Then, the weight variable W is applied to the input feature map, resulting in the completion of the capturing of each channel feature of the feature map. This approach amplifies significant characteristics by assigning greater weights, whereas insignificant factors are subdued by assigning lesser weights.
To complete the objective, four attention modules were examined. Various positions were utilized for their incorporation, including after each C3 module in the backbone, solely after the final C3 module in the backbone, the neck portion of the architecture, and the neck and backbone. Our findings indicate that incorporating an attention module into the backbone of the model results in increased weightiness due to the substantial number of parameters present in each C3 block of the backbone. The feature extraction process that passes through these attention modules also contributes to this increased weightiness. The attention module was added right after the final C3 block and before the SPPF. By placing the attention module before the SPPF, the refined feature representation from the attention module can be efficiently combined with the spatially pooled features. This strategic placement facilitates enhanced network performance by enabling selective focus on the most relevant features [
37]. Furthermore, including ECA-Net after every C3 block in the downsampling process can improve the network’s performance by augmenting its capacity to capture long-range interdependencies among distinct spatial locations within the feature map [
38].
3.2.2. Optimized Anchor Generation
The initial dimensions of the anchor box in YOLOv5 are determined through edge clustering using the K-means algorithm [
39] on the MS COCO dataset [
40]. However, the MS COCO dataset predominantly comprises large and medium-sized targets. In contrast, this study’s Road Damage Detection dataset encompasses small and medium-sized targets that deviate from the COCO dataset. Hence, the initial dimensions of the anchor box in YOLOv5 are deemed unsuitable for the RDD-2022 dataset samples. To address this issue, The K-means
++ clustering algorithm was used instead of the K-means algorithm to reconfigure the anchor box’s dimensions for the samples present within the RDD 2022 dataset. K-means
++ is an enhanced variant of the K-means clustering algorithm that addresses certain limitations of the original K-means algorithm [
41]. These limitations include random initialization of centroids, slower convergence speed, and reduced accuracy. The present study employs the K-means
++ algorithm to perform clustering on the training set, acquiring 12 anchor boxes that serve as the initial clustering boxes. Upon completing dataset reclustering, a novel anchor box was discovered, comprising the following coordinates: ‘15, 15, 44, 26, 33, 63’, ‘116, 24, 81, 62, 44, 120’, ‘228, 36, 92, 142, 175, 97’, and ‘191, 190, 126, 464, 410, 199’.
3.2.3. Utilizing Focal Loss Strategy
Focal Loss was utilized to substitute the binary cross-entropy loss. The Focal Loss is a variant of the conventional cross-entropy loss function, which aims to decrease the impact of accurately classified instances on the overall loss while emphasizing the significance of misclassified cases [
42]. In addition, Focal Loss is a technique utilized in object detection to tackle the problem of disproportionate representation of foreground and background classes. YOLOv5 can increase detection performance by employing focus loss, particularly for small objects that are difficult to identify due to their small size and low contrast. Furthermore, focus loss can reduce the probability of incorrect identifications by assigning relatively lower weights to less complicated instances, reducing the influence of unwanted information on the final detection outputs.
The YOLOv5 model employs the Focal Loss function on the classification branch of the network. This branch forecasts every anchor box’s objectness score and class probabilities. The calculation of the Focal Loss is as in Equation (12):
The equation involves the predicted probability for the actual class, denoted as , and a hyperparameter , which modulates the degree of weighting assigned to challenging examples. When equals zero, the Focal Loss function simplifies to the conventional cross-entropy loss.
The modified formula for binary cross-entropy with Focal Loss is given in Equation (13):
where
is the projected likelihood of the actual class,
is a binary class sign (i.e.,
if the actual class is present and
otherwise), and
is the focusing parameter that regulates how much weight is placed on complex examples.
3.2.4. Label Smoothing Algorithm
Label smoothing is a widely employed regularization technique in deep neural networks (DNNs) that effectively mitigates the issue of overfitting during training. Its implementation has been observed to enhance the classification accuracy of Deep Neural Networks [
43]. Overfitting is a prevalent issue arising during deep learning models’ movement. It refers to a scenario where the model exhibits good performance on the training set, but its performance on the test set is unsatisfactory. This poor generalization ability renders the model ineffective in predicting unknown data. It is widely accepted that including mislabeled labels is a crucial measure for reducing the potential for excessive confidence in identifying data used for training.
The technique of label smoothing involves the integration of a uniform distribution, wherein the conventional label vector
is substituted with the modified label vector
. Equations (14) and (15) represent label smoothing.
The total count of
K multicategory groups and the small hyperparameter
(typically set to 0.1) are the focal points of assessment.
In our study, the effectiveness of the label smoothing method was analyzed with a default value of 0.1, which has yielded favorable results in various scenarios [
44].
3.2.5. Added Prediction Layer
Initially, YOLOv5 only performed feature prediction on the final three C3 layers. The utilization of multiple feature images with varying dimensions is employed to detect objects of varying sizes. The network acquires three feature images of different dimensions from the initial input image using downsampling at 8×, 16×, and 32×. After deep convolution, the feature image contains lots of semantic information. Nevertheless, the loss of certain positional information about the object occurs during multiple convolutions, rendering it impractical to detect tiny objects. The present study incorporates a 4× downsampling in the spatial resolution of the initial input image utilizing the YOLOv5 backbone network. As illustrated in
Figure 3, the initial image undergoes a downsampling process four times. It is subsequently inputted into the feature fusion network, acquiring a feature map with a different size. As each C3 has been followed by an ECA-Net, the detection head obtains its feature map from ECA-Net. The image in question exhibits a reduced receptive field and increased location information. By utilizing the multilevel feature information of complex objects, the featured image can enhance the detection efficacy of the model in complex environments.
4. Result Analysis
In this section, we endeavored to present all of our experiments. Through the execution of these tests, we aimed to conduct a comprehensive evaluation of our proposed model. First, we will discuss the training configuration and dataset employed, followed by a discussion of the implemented study.
4.1. Dataset Description
Various intelligent equipment, such as drones and dashcams, have made the automatic collection of road damage data much more accessible in recent years. Especially the dashboard-mounted camera is quicker to install and more effective than manual scanning techniques in detecting road damage. Moreover, classifying road damage data manually is a time-consuming process. An existing benchmark dataset was employed to train the road damage detection model. Most top-view datasets do not have the class name; hence, classification is impossible. The road damage detection dataset (RDD 2022) is the largest front-view road damage dataset ever compiled about road pavement damage, encompassing four types of damage in six countries. This dataset follows the preceding RDD dataset and is an expanded version of the earlier RDD 2020 [
45] and RDD 2018 [
26] datasets. While the RDD 2018 dataset has 9053 photos and the RDD 2020 dataset contains 26,336 images from three countries, the RDD 2022 dataset [
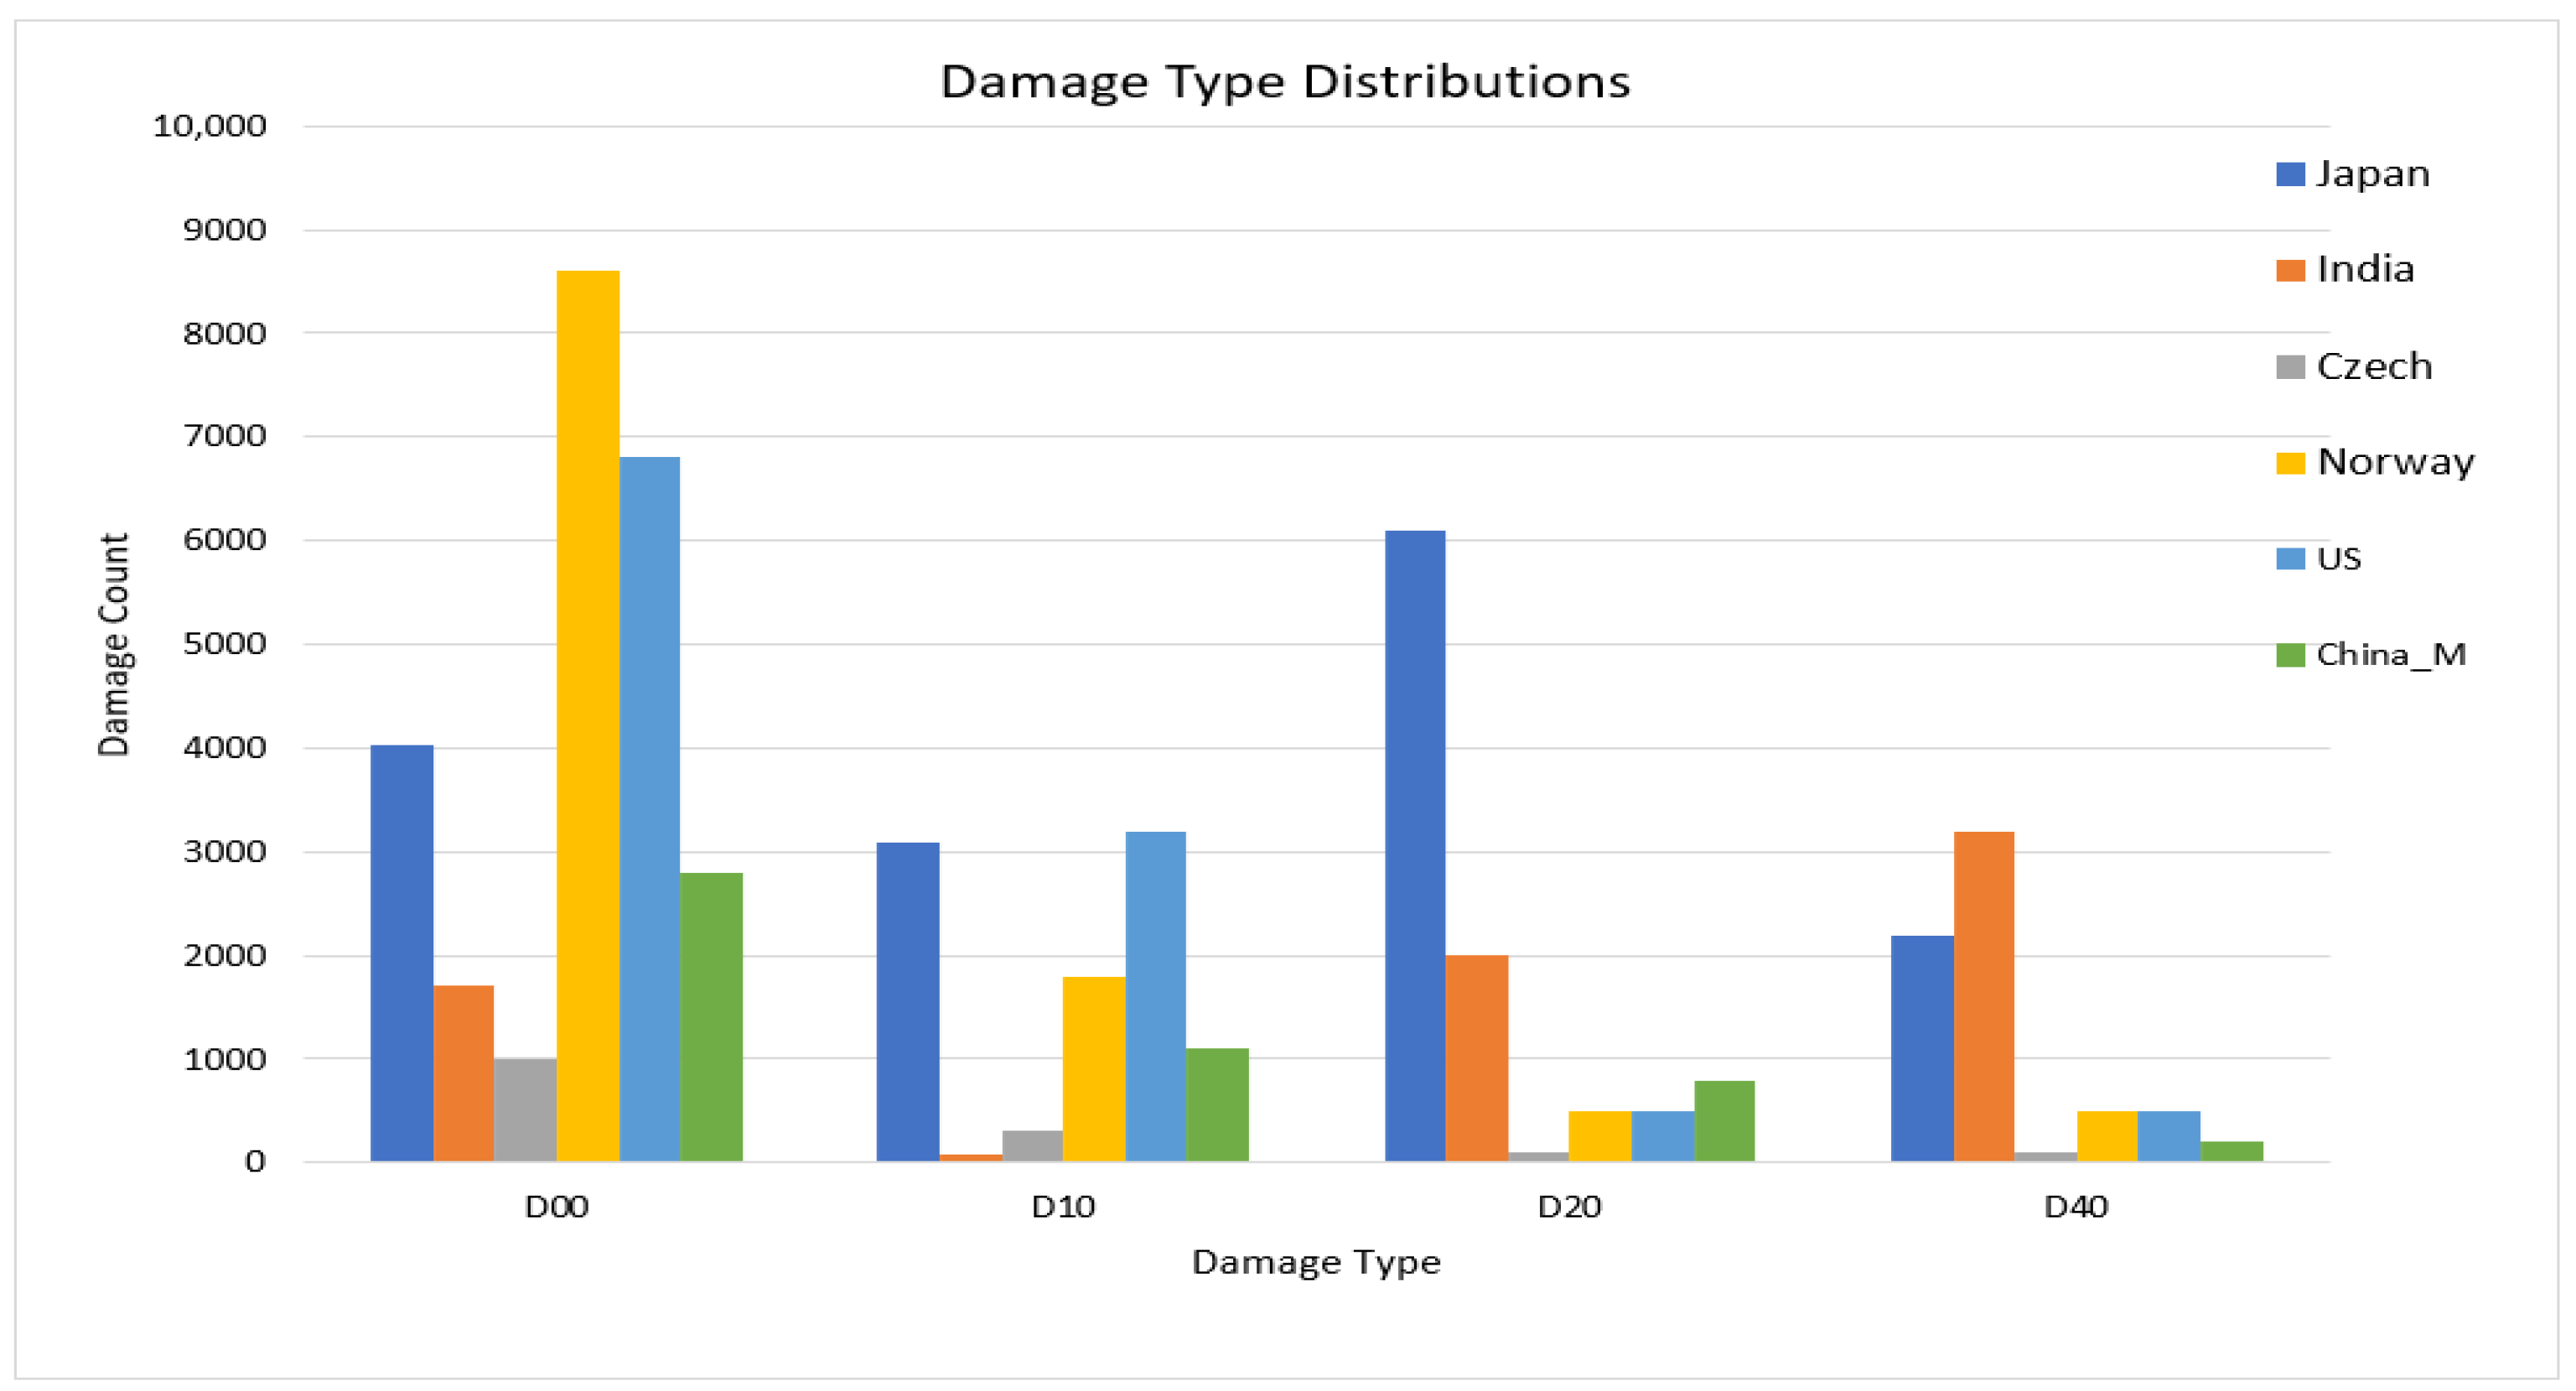
46] comprises 47,420 images compiled from numerous sources in six nations. It includes Japan, the United States, Norway, the Czech Republic, India, China Motorbike, and China Drone.
Figure 5 depicts the distributions of damage types (of the four main damage types) among the six countries. It also illustrates the diversity of road pavement damage across countries by showing that India has a more significant number of D40, whereas D00 is adequately represented in the dataset for all countries. Moreover, Japan, India, and Norway have a higher rate of pavement damage than the other three nations. From the present standpoint, this cutting-edge dataset is the most practical and effective for road pavement damage detection and classification.
4.2. Data Processing and Training Configuration
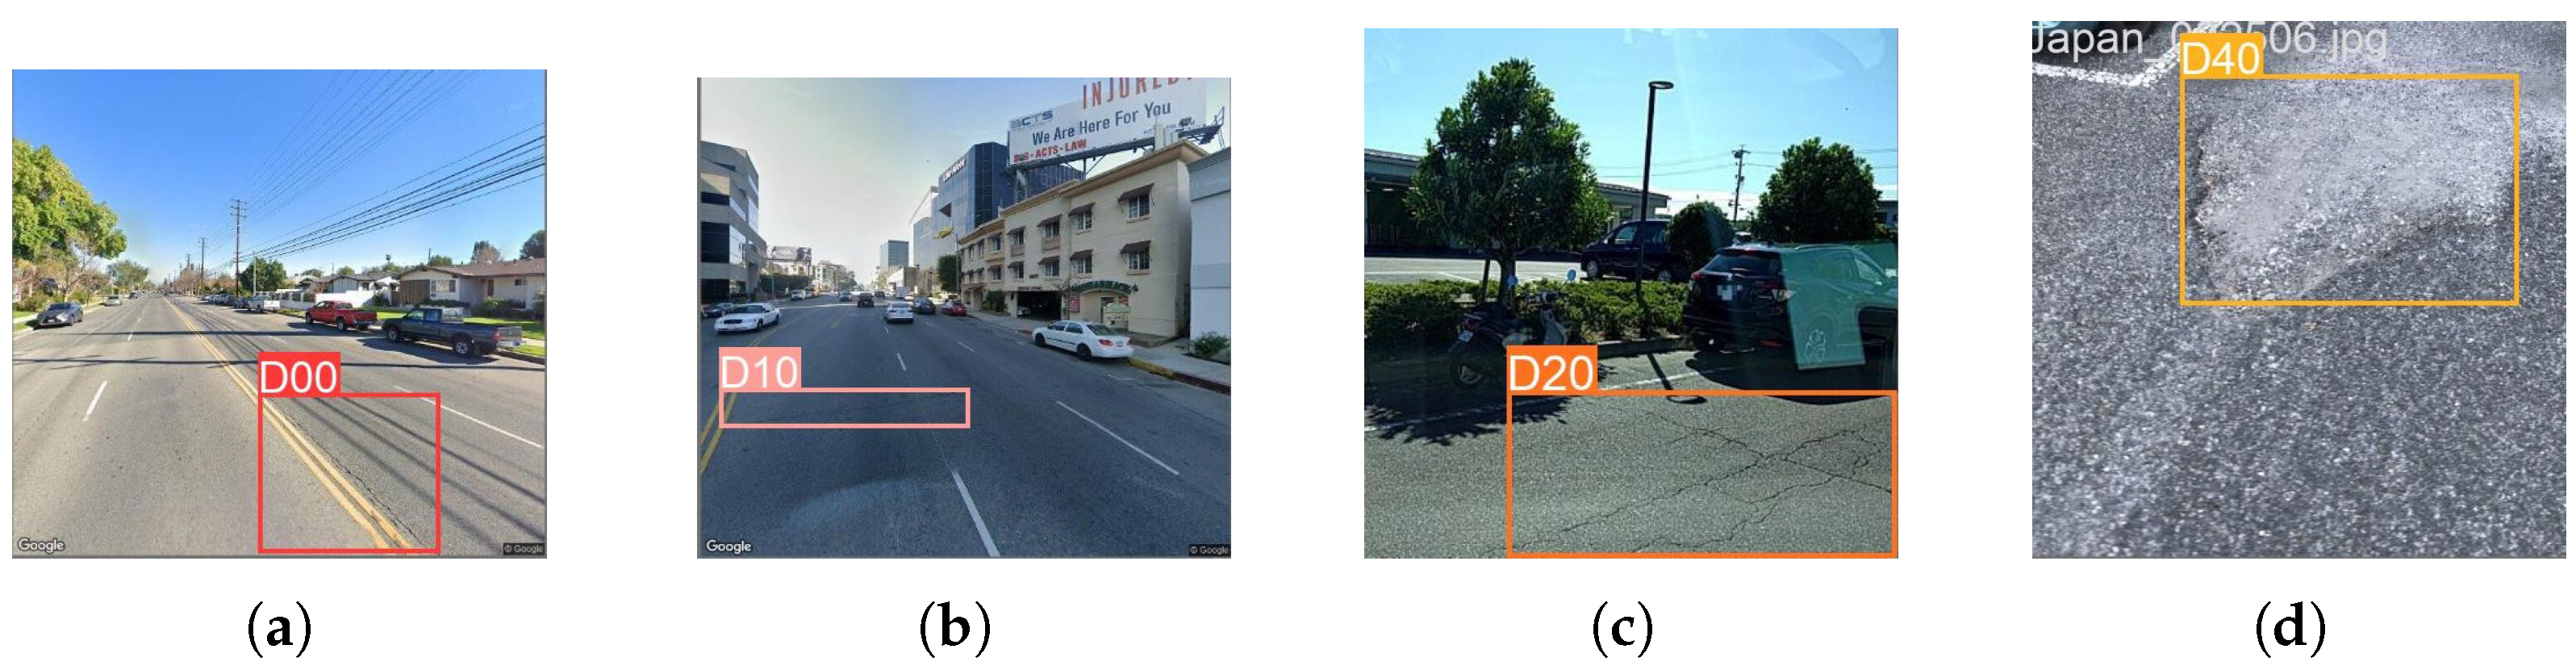
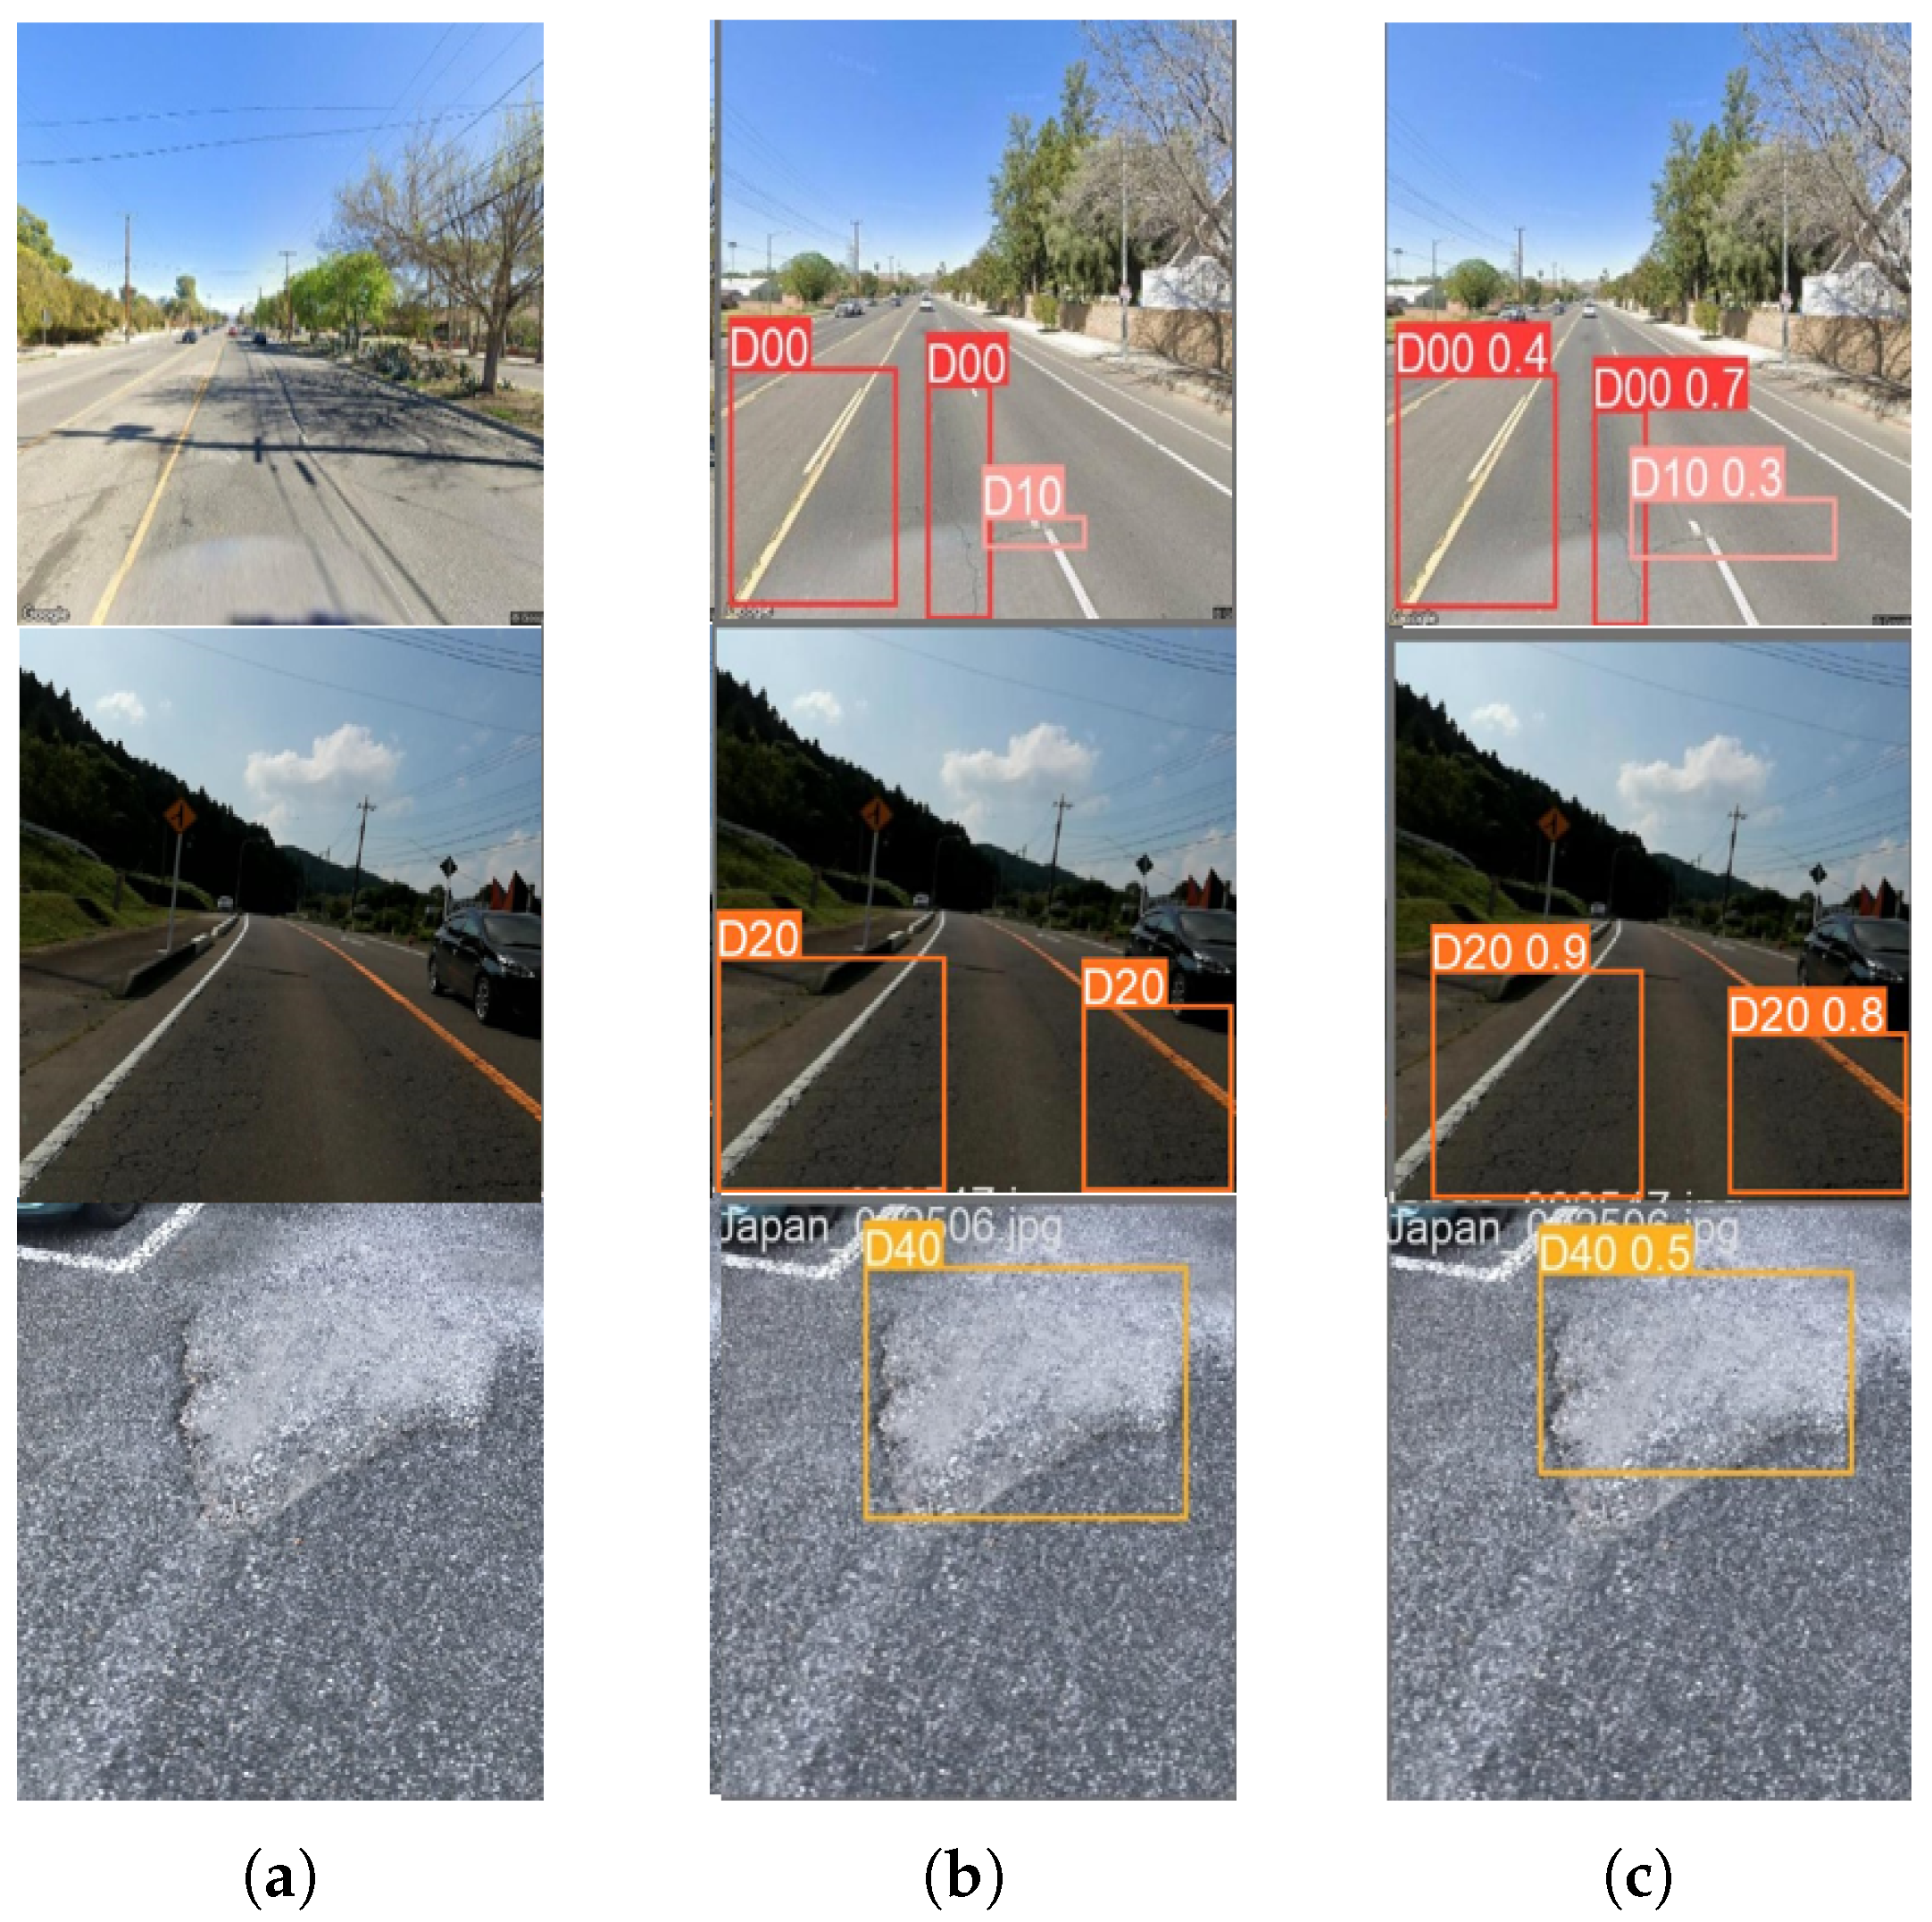
RDD 2022 contains 47,420 images, of which 36,000 have annotations from six distinct countries. Approximately 14,700 of the 36,000 annotation files were found to be empty as they did not contain an object, so those images were manually removed by us. YOLO is designed to detect objects in a single pass across the entire image; unlike two-stage detectors (such as Faster R-CNN), this method does not require negative photos for training. The dataset had a country-specific sub-folder for each country’s images and corresponding annotations. China-Drone was omitted in our work because it needed to be obtained from a front-mounted vehicle image for this research. A close inspection of the RDD 2022 dataset provides us with a few insights for selecting images efficiently. Countries such as Norway and Japan had various image sizes. For example, the resolution of the Norway photos (3072 × 3720) is incompatible with our GPU configuration. Each image was manually scaled to 640 × 640 to train the YOLOv5 model. Numerous photos have distinct labels for a single country. For instance, China Motorbike has a label named Repair. Japan and India have multiple labels with the uncommon names D01, D11, D43, D44, and D50. In light of this, the unique classes were manually eliminated, the remaining classes were merged, and the four common categories were retained for six countries. Four types of damage were included: D00: longitudinal cracks, D10: transverse fractures, D20: alligator cracks, and D40: potholes.
Figure 6 depicts an example of these four classes.
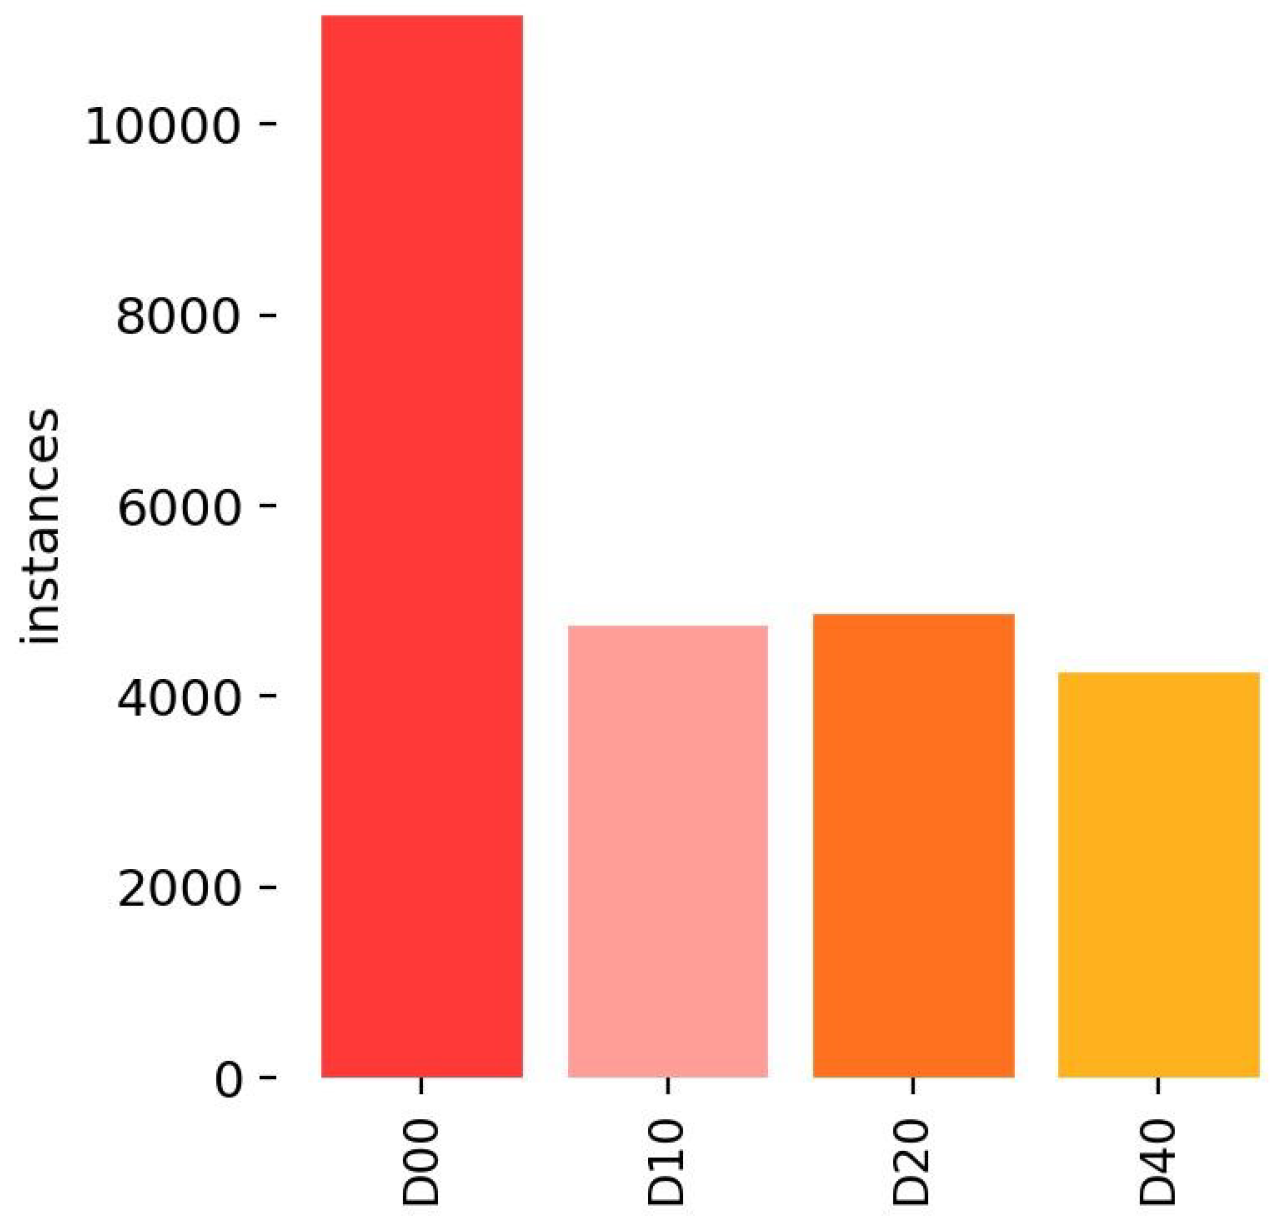
The dataset was split 70:20:10 for training, validation, and testing purposes. After all preprocessing is completed, the model is evaluated using 1542 images. The testing size is sufficient for estimating the model’s performance on new, unobserved data. This model was trained with 10,798 images and validated with 3042 images to prevent overfitting. The results of the different classes of this study and their quantity are presented in
Figure 7, which includes details about the dataset’s class and amount.
Upon creation of the training set, the YOLOv5s model is subsequently trained through the utilization of the yolov5s.pt pretraining weights, and a “custom.yaml” was created as the configuration file to specify the model architecture. Logarithmic and weight files are recorded and stored throughout the training process. The training configuration is given in
Table 1. For this research, the Google Colab Pro platform was utilized, operating in a Linux environment and offering substantial computational resources. These included an Intel Xeon CPU with a clock speed of 2.2 GHz, 32 GB of RAM, and Nvidia A100 GPU. These resources played a pivotal role in meeting the demanding computational requirements of deep learning experiments and model training.
4.3. Evaluation Metric
This research utilizes various evaluation metrics, including precision, recall rate, F1 score, mean Average Precision (mAP), number of parameters, and GFlops (i.e., One billion Floating-Point Operations per second). The precision metric of a model determines the proportion of correctly predicted positive labels compared to the overall number of predicted positive labels. The precision formula is presented in Equation (16).
Recall is a metric that evaluates the accuracy of a model’s ability to predict positive outcomes based on actual positive results, in contrast to other performance metrics. The metrics of True Positive (TP), False Positive (FP), and False Negative (FN) are employed in the calculation of precision and recall. The Recall equation is provided in Equation (17).
The F1 score is a metric that evaluates a model’s effectiveness by considering both its precision and recall scores. The F1 score is a performance metric that assigns equal importance to Precision and Recall when assessing the effectiveness of a machine learning model. The technical expression for this is the harmonic mean of the precision and recall scores. The mathematical expression for the F1 score is presented in Equation (18).
The Mean Average Precision (mAP) is a typically used metric for assessing object detection models. Initially, the precision and recall metrics are calculated for every detection within the category across a spectrum of confidence threshold values. Subsequently, the mean Precision is determined by utilizing the region beneath the class’s precision–recall curve (AUC). Upon computation of the AP score for every class, the mAP score is derived using the average of these individual scores. The mAP score is a significant metric that provides a comprehensive evaluation of the detection performance of the model across all categories in the dataset. The mathematical expression for mAP is presented in Equation (19).
where
= the
of class
k and
n = the number of classes.
GFlops are employed for assessing the efficacy of a model or algorithm. Typically, a lower GFlops value corresponds to reduced computational demand for model rendering, lower hardware performance requirements, and increased feasibility for implementation in low-end devices. Measuring parameters is crucial in assessing a model’s complex nature and computational requisites. A model’s complexity is directly proportional to its number of parameters. A more significant number of parameters signifies the complexity of a model, which could require more computational resources for training and deployment. Hence, it is essential to evaluate the efficacy of object detection models by examining their parameter count and performance on relevant metrics such as mAP, Precision, and Recall.
4.4. Evaluation of Performance
In this section, the effectiveness of our proposed method is evaluated through various experiments.
Finding Suitable Backbone
The first study aimed to determine the most effective backbone for the given task. The objective of our study was to maximize the outcome by limiting the parameter count. Different kinds of backbones were tested to meet our requirements.
Table 2 represents this experiment. The baseline yolov5s model yields a mean average precision of 65.91% while utilizing 7.01 million parameters and a GFlops of 16. With the Swin transformer, the result drops to 3.44% in terms of mAP, attaining 62.47%, and a 4.07% decrease in the F1 score, achieving 61.14%. Moreover, the GFlops increased hugely, reaching a value of 102.00. The parameter count displayed a rise of 1.59 million. Using the RepVGG backbone resulted in a mean average precision (mAP) of 61.32% and an F1 score of 60.51%. Mobilnet v3 and Mobileone backbone were examined, and their parameter count and GFlops are relatively less than other backbone architectures. The MobileNet V3 model achieved a mean average precision (mAP) of 56.72%. The model’s parameter count and GFlops were recorded at 5.21 million and 10, respectively. Mobileone, a recently invented novel architecture by APPLE, attained 58.81% mAP and a 58.67% F1 score. The parameter count for this is higher than Mobilenet v3, though both have the same GFlops of 10. Finally, the default backbone CSPDarknet was selected by us as our backbone, representing the best performance while containing an acceptable amount of parameters.
4.5. Experiment of Different Attention Mechanisms
The study revealed that the CBAM necessitates more parameters and GFlops, encompassing 8.35 million parameters, significantly higher than the other three attention modules. This is attributed to the CBAM providing both spatial and channel attention, despite not obtaining the optimal result.
Table 3 depicts this experiment. In our study, it was determined that the utilization of Squeeze and Excitation (SENet) and Convolutional Block Attention Module (CBAM) did not yield significant benefits compared to Channel Attention (CA) and Efficient Channel Attention (ECA) in our specific scenario. The results indicate that CBAM produces a mAP of 64.81%, whereas SE and CA yield mAP values of 64.72% and 65.57%, respectively. Therefore, the ECA attention module was identified as the optimal choice due to its relatively low parameter count compared to other attention modules and its ability to yield the highest performance metrics of 65.99% mAP and 65.35% F1 score when compared to other attention modules.
4.6. Ablation Experiment
The reliability and importance of individual enhanced modules within the model are assessed by utilizing YOLOv5s as a benchmark and gradually integrating improved modules to perform ablation experiments. The assessment criteria used in this investigation comprise Precision, Recall, F1 Score, mAP, Number of parameters, and frames per second (FPS).
Table 4 displays the results of the experimental findings. The default version of YOLOv5s exhibits a mAP of 65.91 and comprises 7.06 parameters. Including ECA-Net in the architecture has resulted in a 0.08% improvement in mAP. Additionally, there was an increase of 0.12 million parameters and a reduction of 9 FPS. Incorporating Focal Loss resulted in a 0.27% increase in mAP, while the number of parameters and FPS remained constant. Incorporating an adaptive anchor box by utilizing the K-means
++ algorithm resulted in a 0.31% increase in mAP and a 0.97% increase in precision. Reducing parameters by 110,000 resulted in a corresponding increase of 7 FPS. Upon increasing the label smoothing value by 0.01, a notable enhancement of 0.39% was observed in the Recall metric. Ultimately, incorporating an additional detection layer resulted in a 67.81% mAP score, an F1 score of 66.51%, accompanied by a parameter increase of 1.05 million. The obtained FPS value in this experiment is 58, with an increased mAP of 1.9% from the Yolov5s baseline.
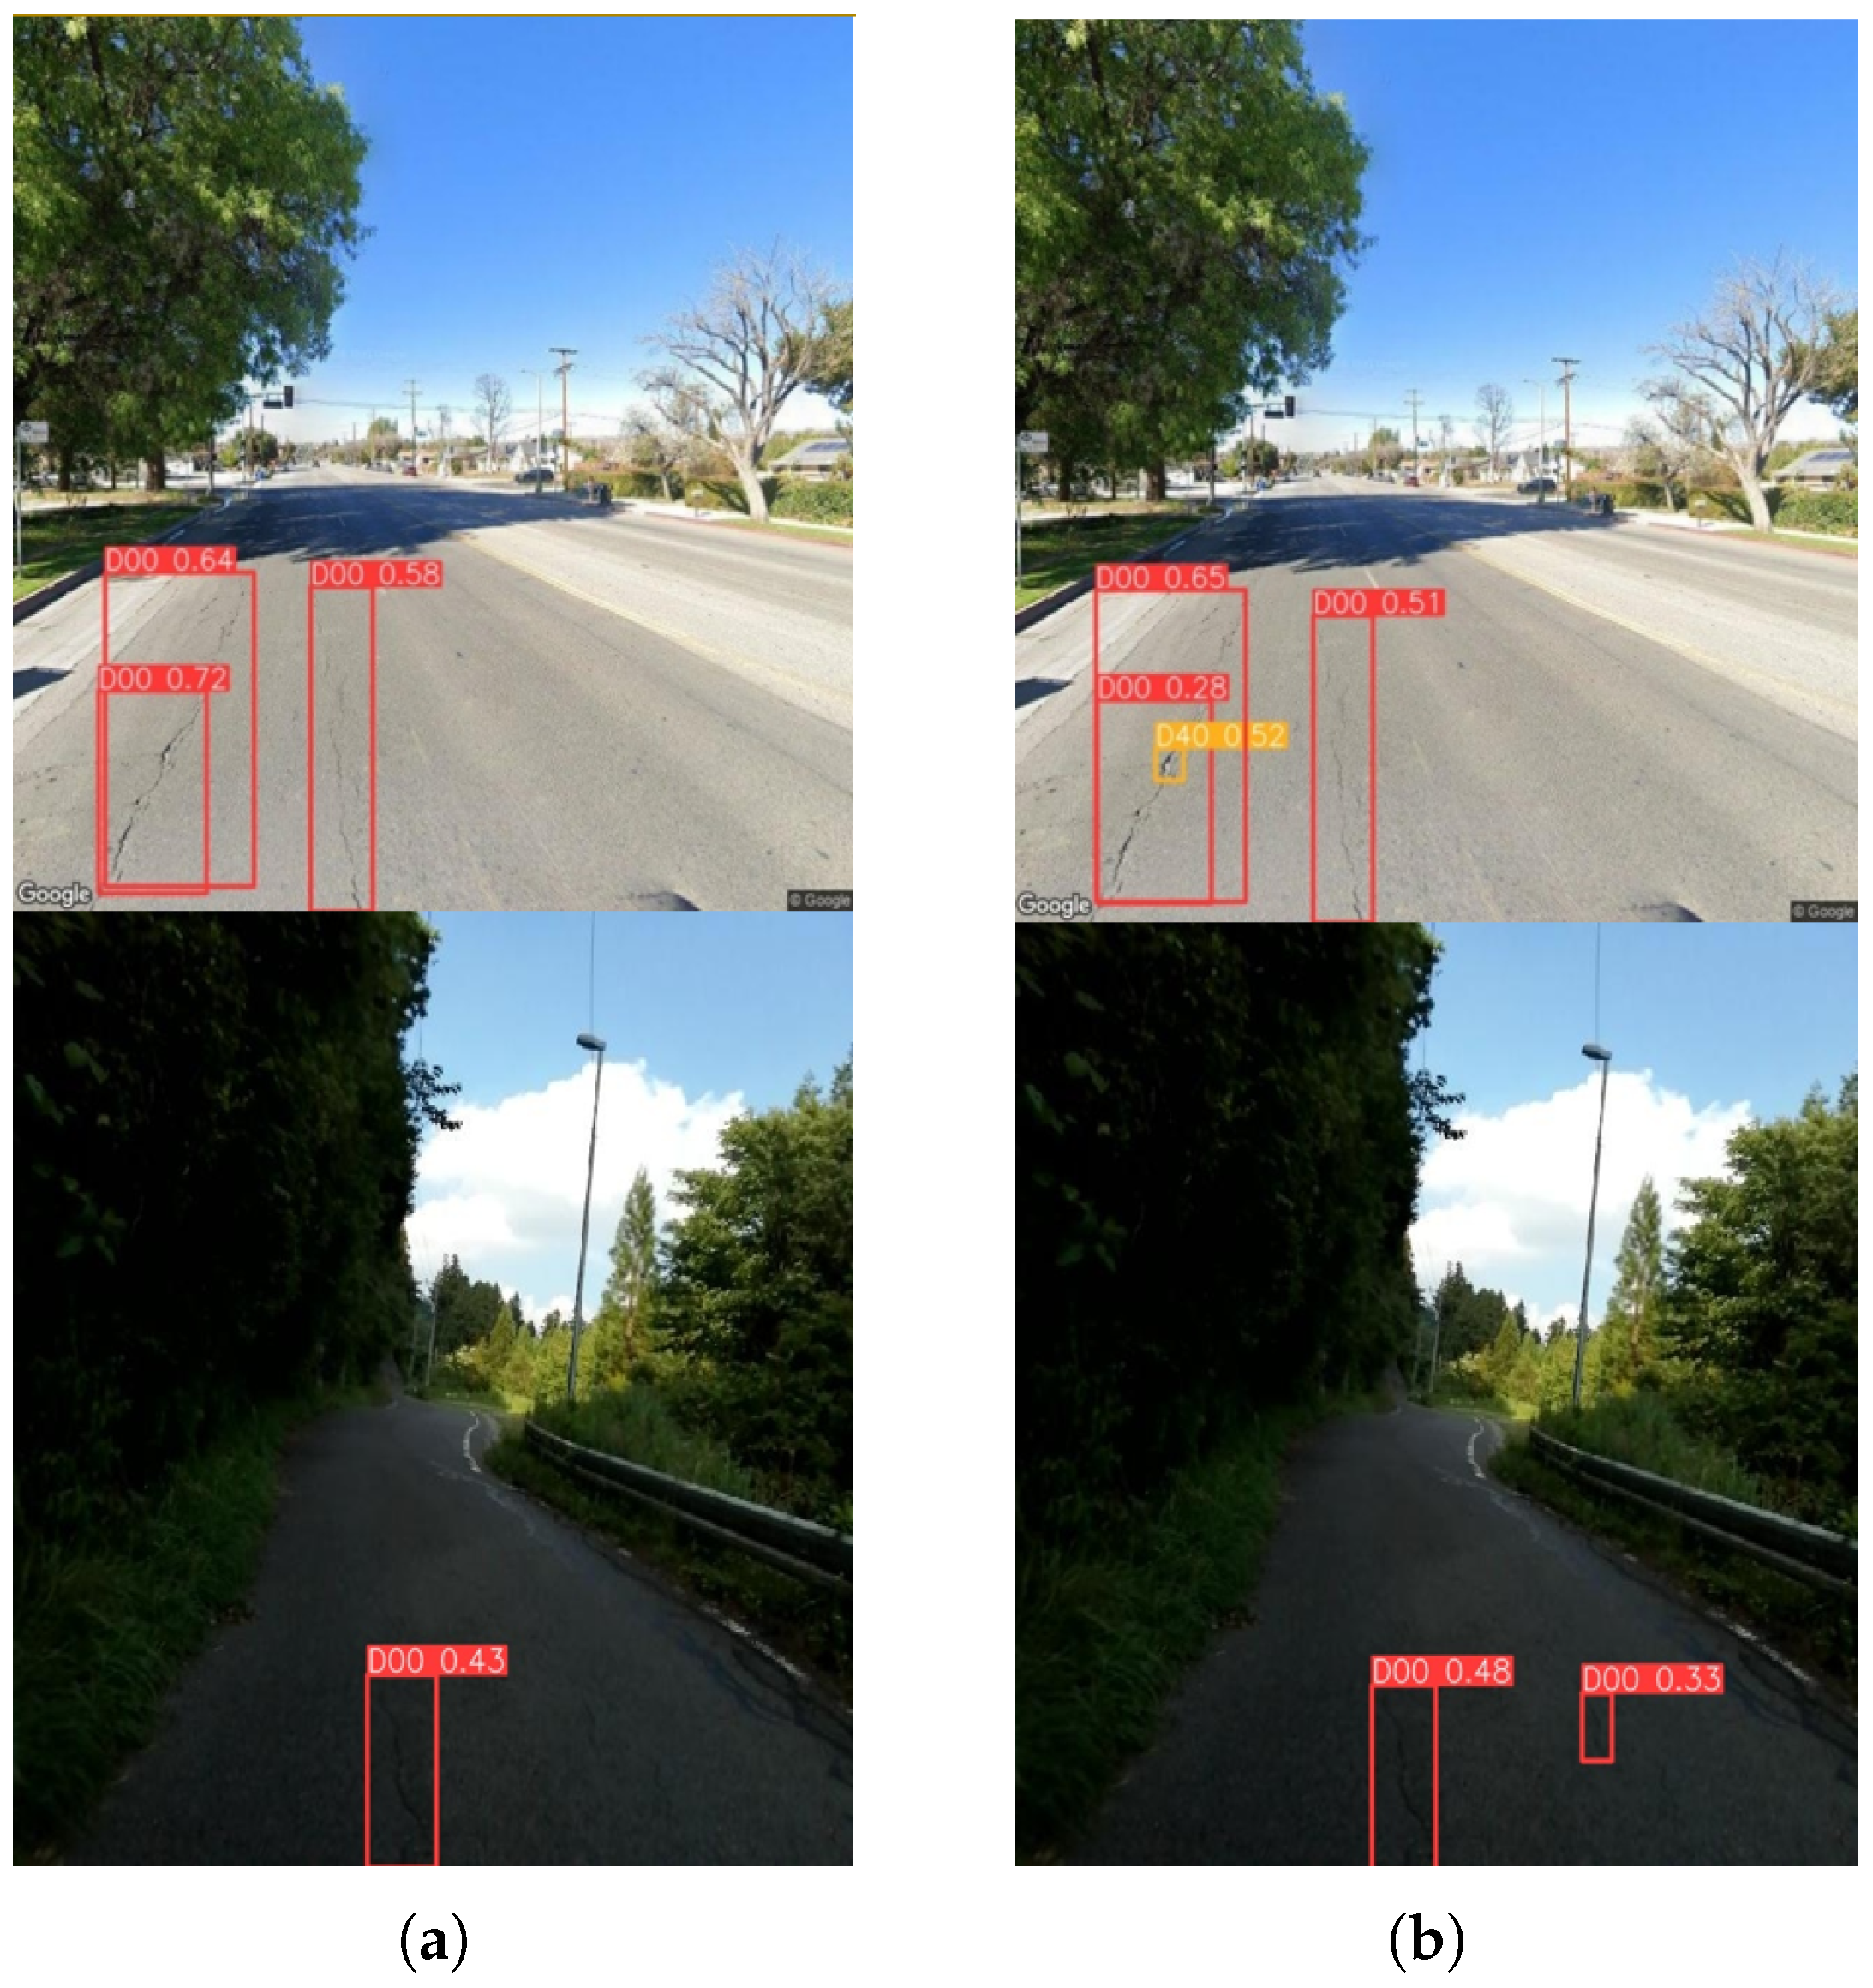
Our newly added prediction layer helps to locate tiny objects, thus improving the detection performance.
Figure 8 represents our model’s effectiveness in detection performance. This implies that this model is reliable in detecting and classifying road pavement damage in real-time scenarios.
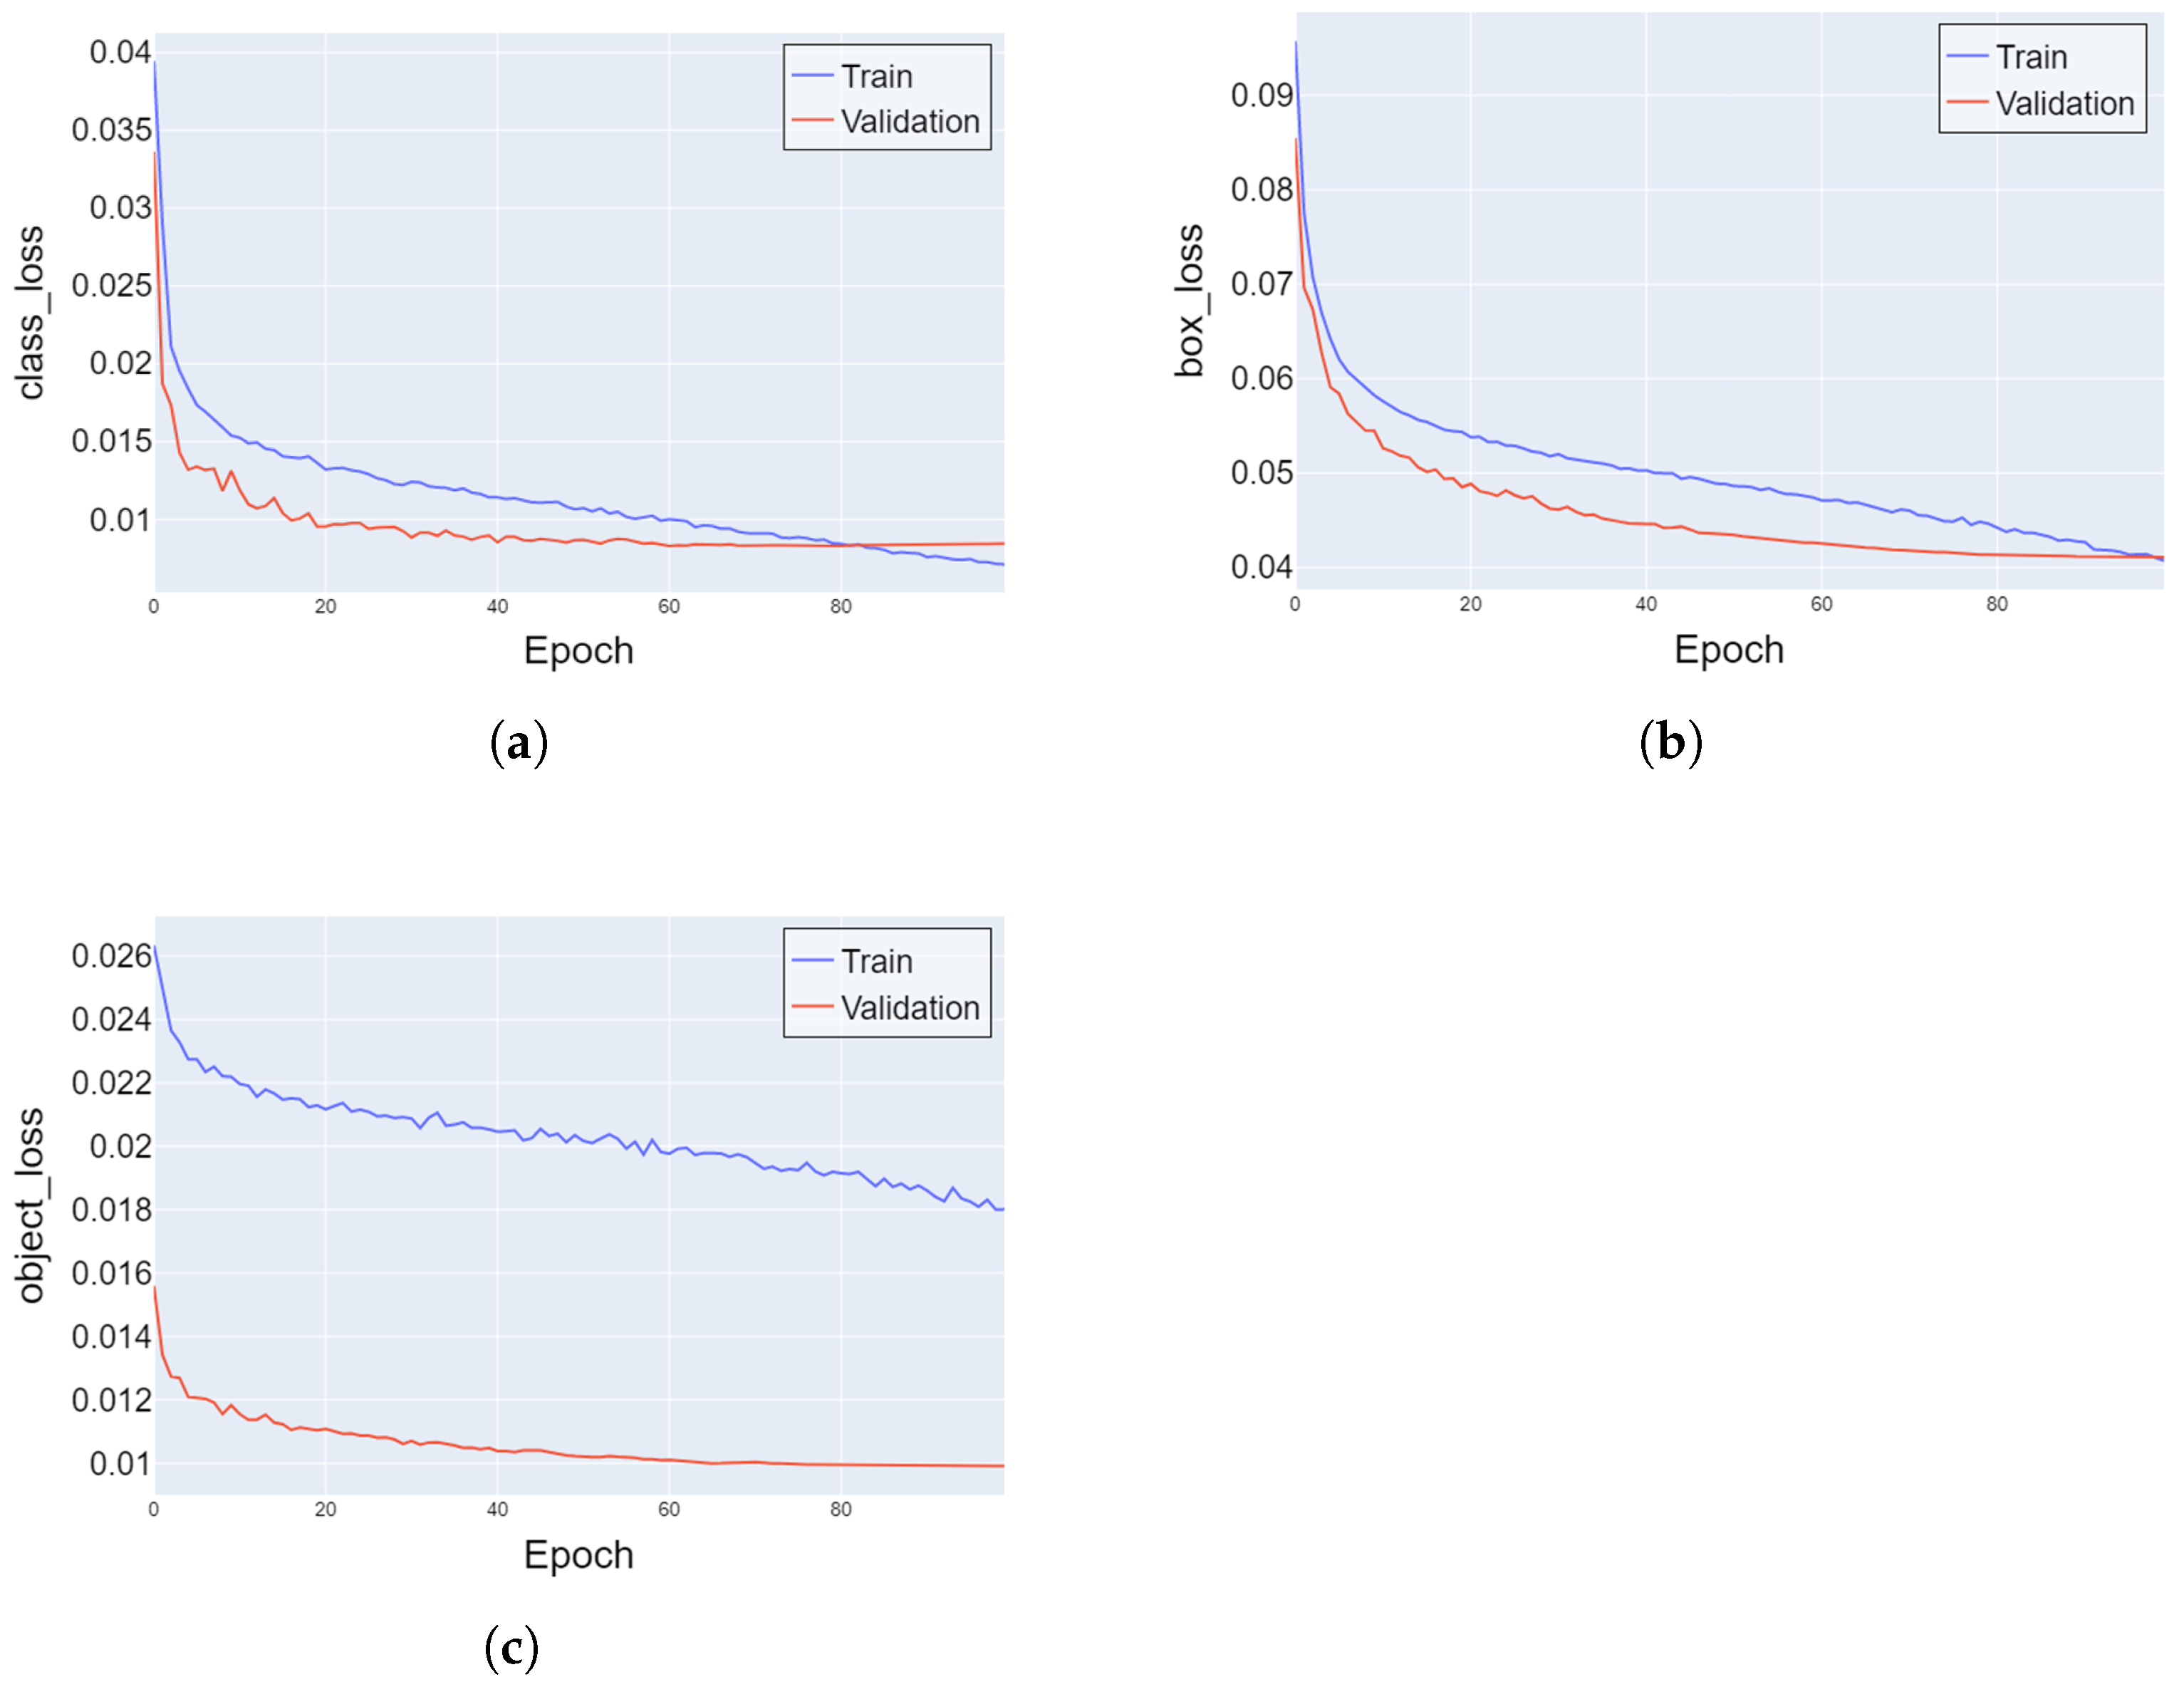
Figure 9 demonstrates our proposed model detection results. We thoroughly analyzed the training and validation curves for class_loss, box_loss, and object_loss and presented the results in
Figure 10 of the paper. Our findings indicate no overfitting, as there was neither an increase in validation loss nor any substantial fluctuations after the initial decrease.
4.7. Comparison of Different YOLO-Based Object Detectors
All state-of-the-art large, medium, and small-sized versions of the Yolo model’s results are given in
Table 5. The YOLOv8l, YOLOv5l, YOLOv8m, and YOLOv5m represent all the large and medium models that we trained with the RDD 2022 dataset where we obtained the best mAP and F1 score but with a large number of parameters and low FPS. The YOLOv8l attains the highest mAP of 71.50% with 43.7 million parameters among these models. The YOLOv8m achieved 70.79% mAP and 68.63% F1 score with 25.80 million parameters. With YOLOv5l and YOLOv5m, we obtained 70.90% and 69.23% mAP, corresponding to 46.50 and 21.2 million parameters. These large and medium-sized models’ parameter counts and higher GFlops make the model heavyweight and unsuitable for real-time damage detection. All the small-sized models were experimented with, and they are suitable for real-time damage detection and more lightweight to integrate into mobile devices. To assess this, we trained the dataset with YOLOv7-tiny, YOLOv5s, YOLOv8s, and our improved YOLOv5s.
The YOLOv5s attains 65.91% mAP with 7.01 million parameters. YOLOv7-tiny consists of 6.27 million parameters, and there is a decrease of 0.24% in mAP from the YOLov5s. Yolov8s consists of 11.2 million parameters, which is 4.2 million more than the v5s, and contains larger GFlops than YOLOv5s, and it achieved 67.70% mAP. However, we obtained a 1.9% improvement from Yolov5 in terms of mAP and 1.29% in terms of F1 while increasing by only 1.1 million parameters. Moreover, a 0.11% improvement in mAP and 0.05% in F1 score was achieved from YOLOV8s while having 3 million fewer parameters and 12 gigabytes less GFlops.
4.8. Comparison with Existing Methods Regarding Road Pavement Damage Detection and Classification
Table 6 shows the drastic performance gap between our improved YOLOv5s and other object detection methods on the RDD 2018, RDD 2020, and RDD 2022 datasets. Singh et al. used Mask RCNN with the RDD 2018 dataset to acquire an F1 score of 52.8% [
47]. Numerous studies utilized RDD 2020, the successor to RDD 2018, and produced a higher F1 score than previous research [
48,
49]. Using the RDD 2020 dataset and other object detection algorithms, the researcher discovered that the YOLO-based approach outperformed most of the other studies [
27]. An average F1 score of 66.46% was obtained by the only research found using RDD 2022, with 28.46 million parameters [
31]. Their average F1 score was exceeded by 0.05% with 20 million fewer parameters. Moreover, all previous studies that utilized RDD 2018 and RDD 2020 datasets were outperformed by a significant margin in this study.
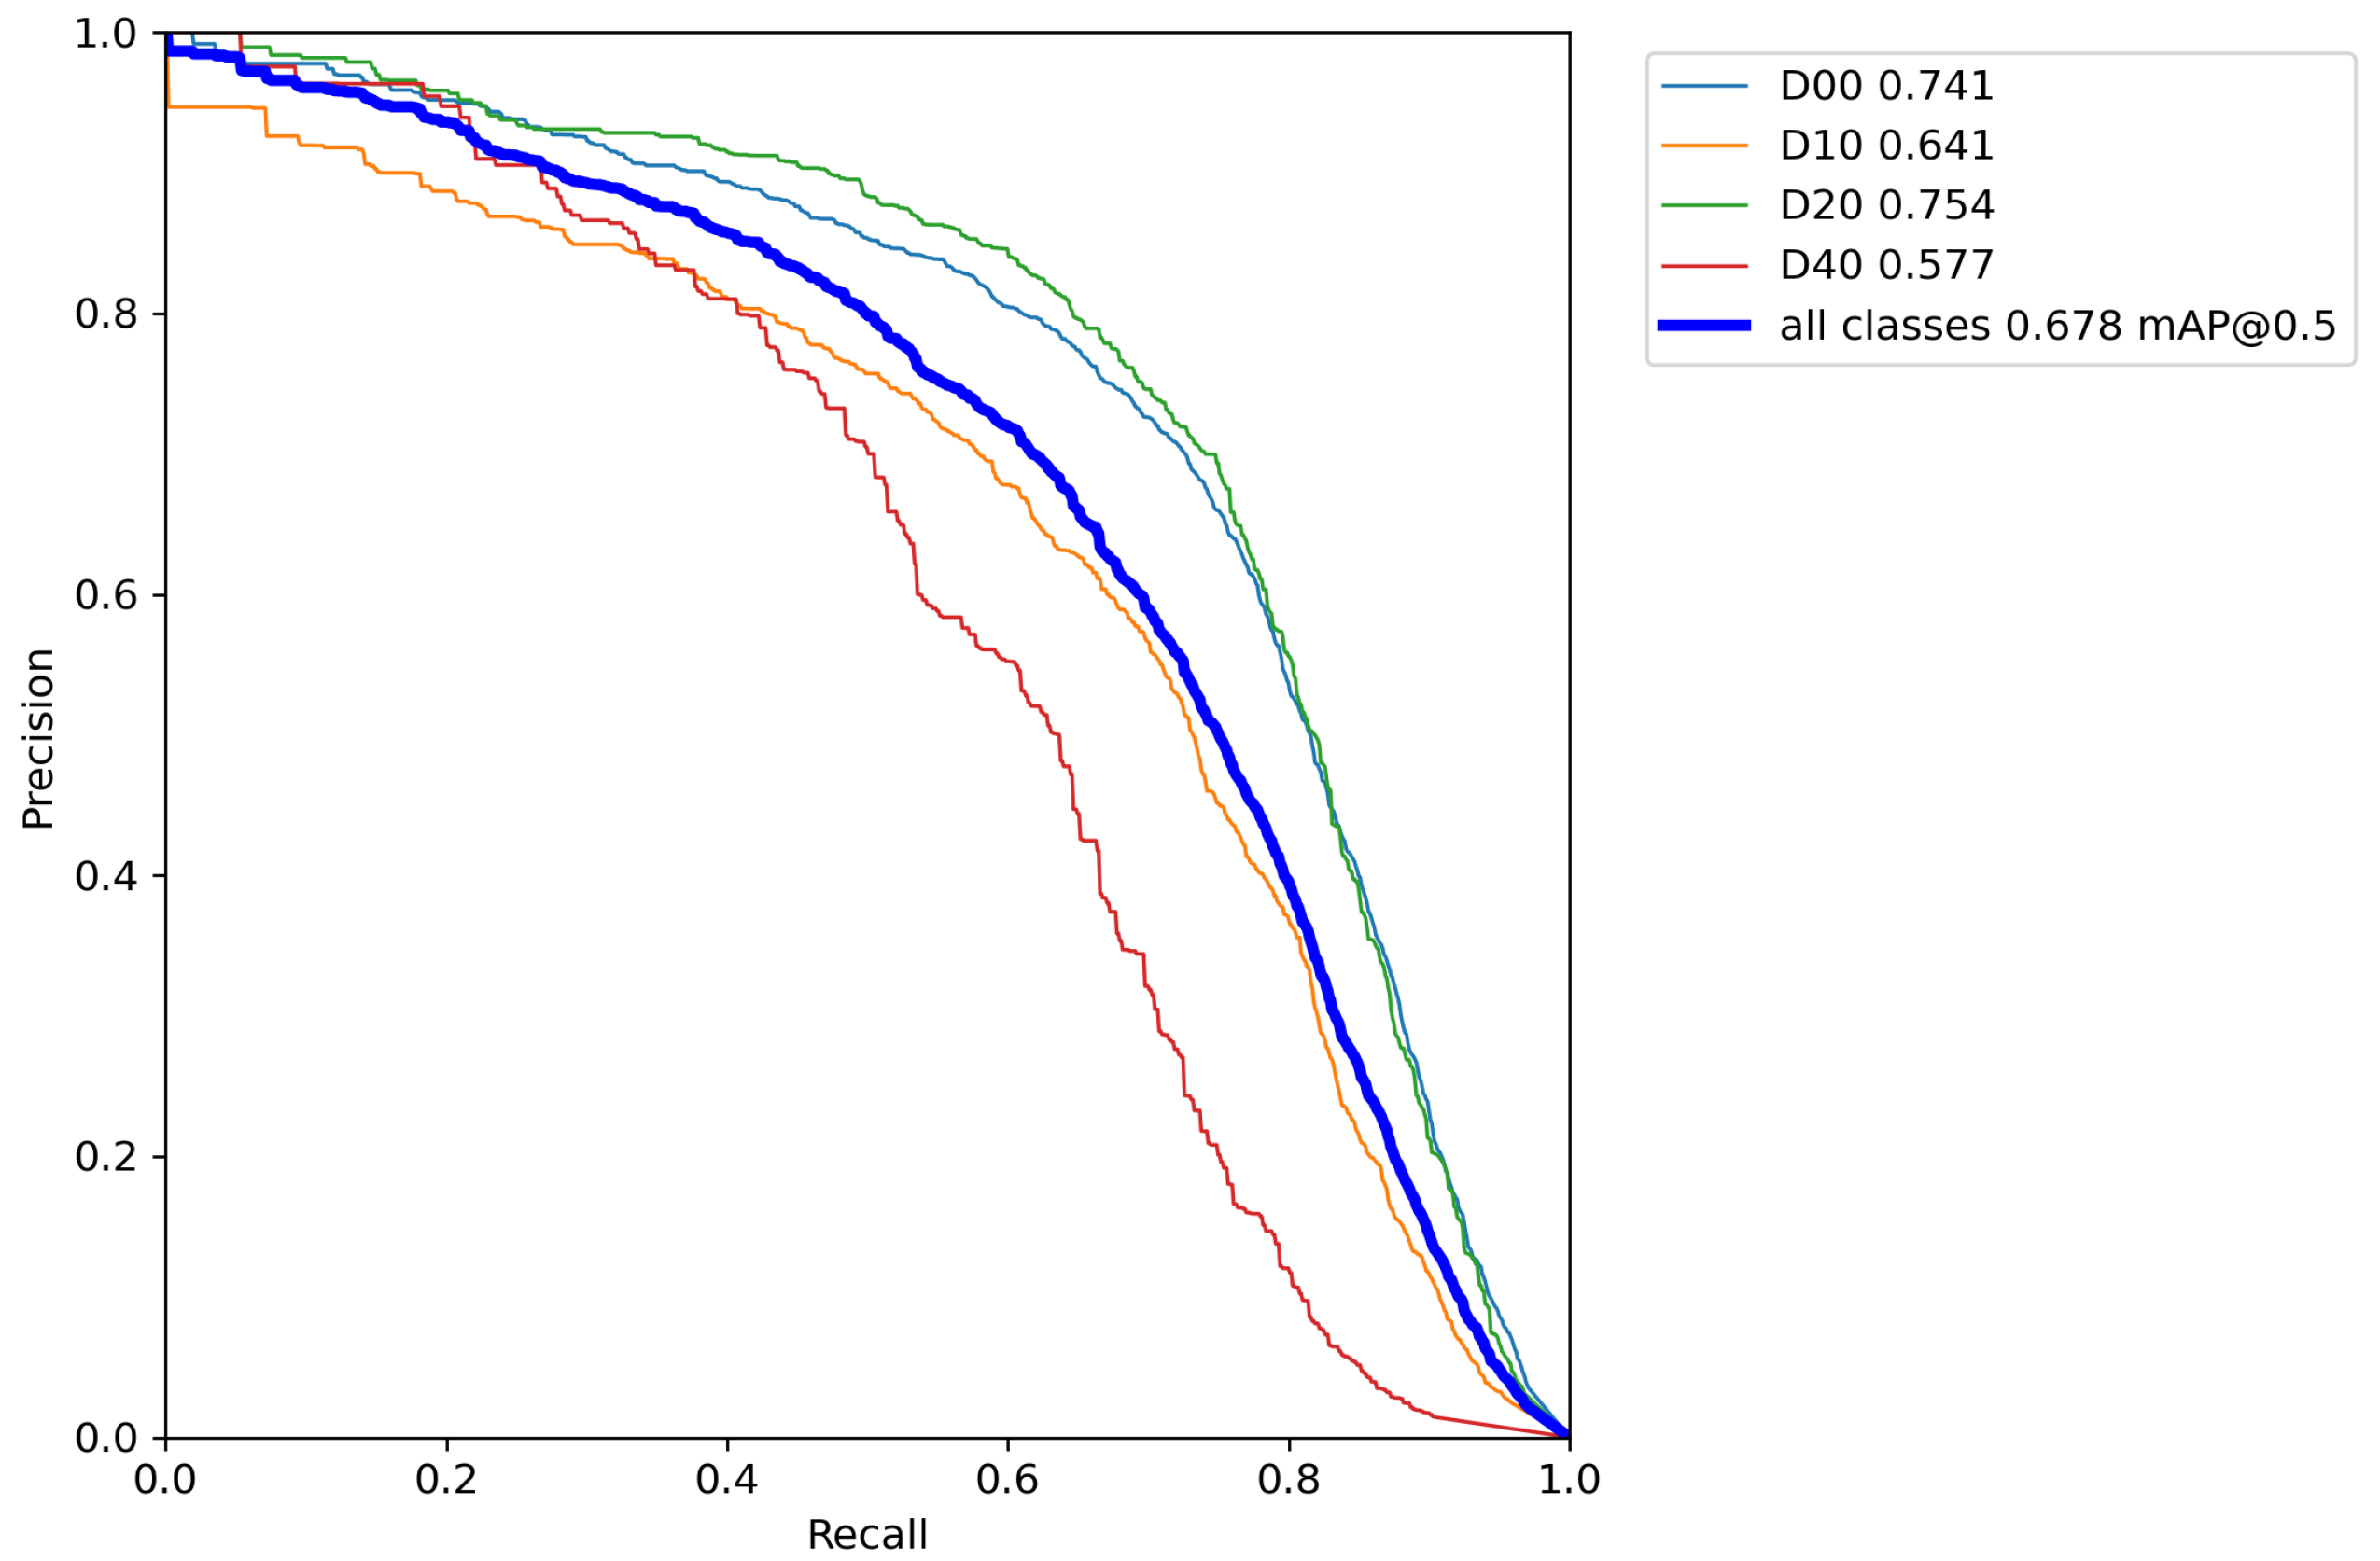
Figure 11 represents the precision–recall curve of our proposed improved YOLOv5s model.
5. Discussion
Modern societies depend on efficient road infrastructure, enabling safe and cost-effective transportation. Traditional manual road inspection is time-consuming and dangerous, resulting in repair delays. The detection of road pavement damage is crucial to sustaining a functional transportation network. Limited research has been conducted on the effectiveness of the RDD 2022 dataset, which encompasses road damage from six nations, including Japan, Norway, the United States, the Czech Republic, and China. Automated methods, such as deep learning models, have emerged as valuable instruments for identifying road pavement damage types with high accuracy. These developments contribute to a safer and more sustainable transportation system by mitigating risks, decreasing maintenance costs, and enhancing overall road management.
Our framework for object detection using deep learning, YOLOv5, has produced significant outcomes. Accuracy and generalization were substantially improved by incorporating techniques such as the Efficient Channel Attention module, label smoothing, the K-means
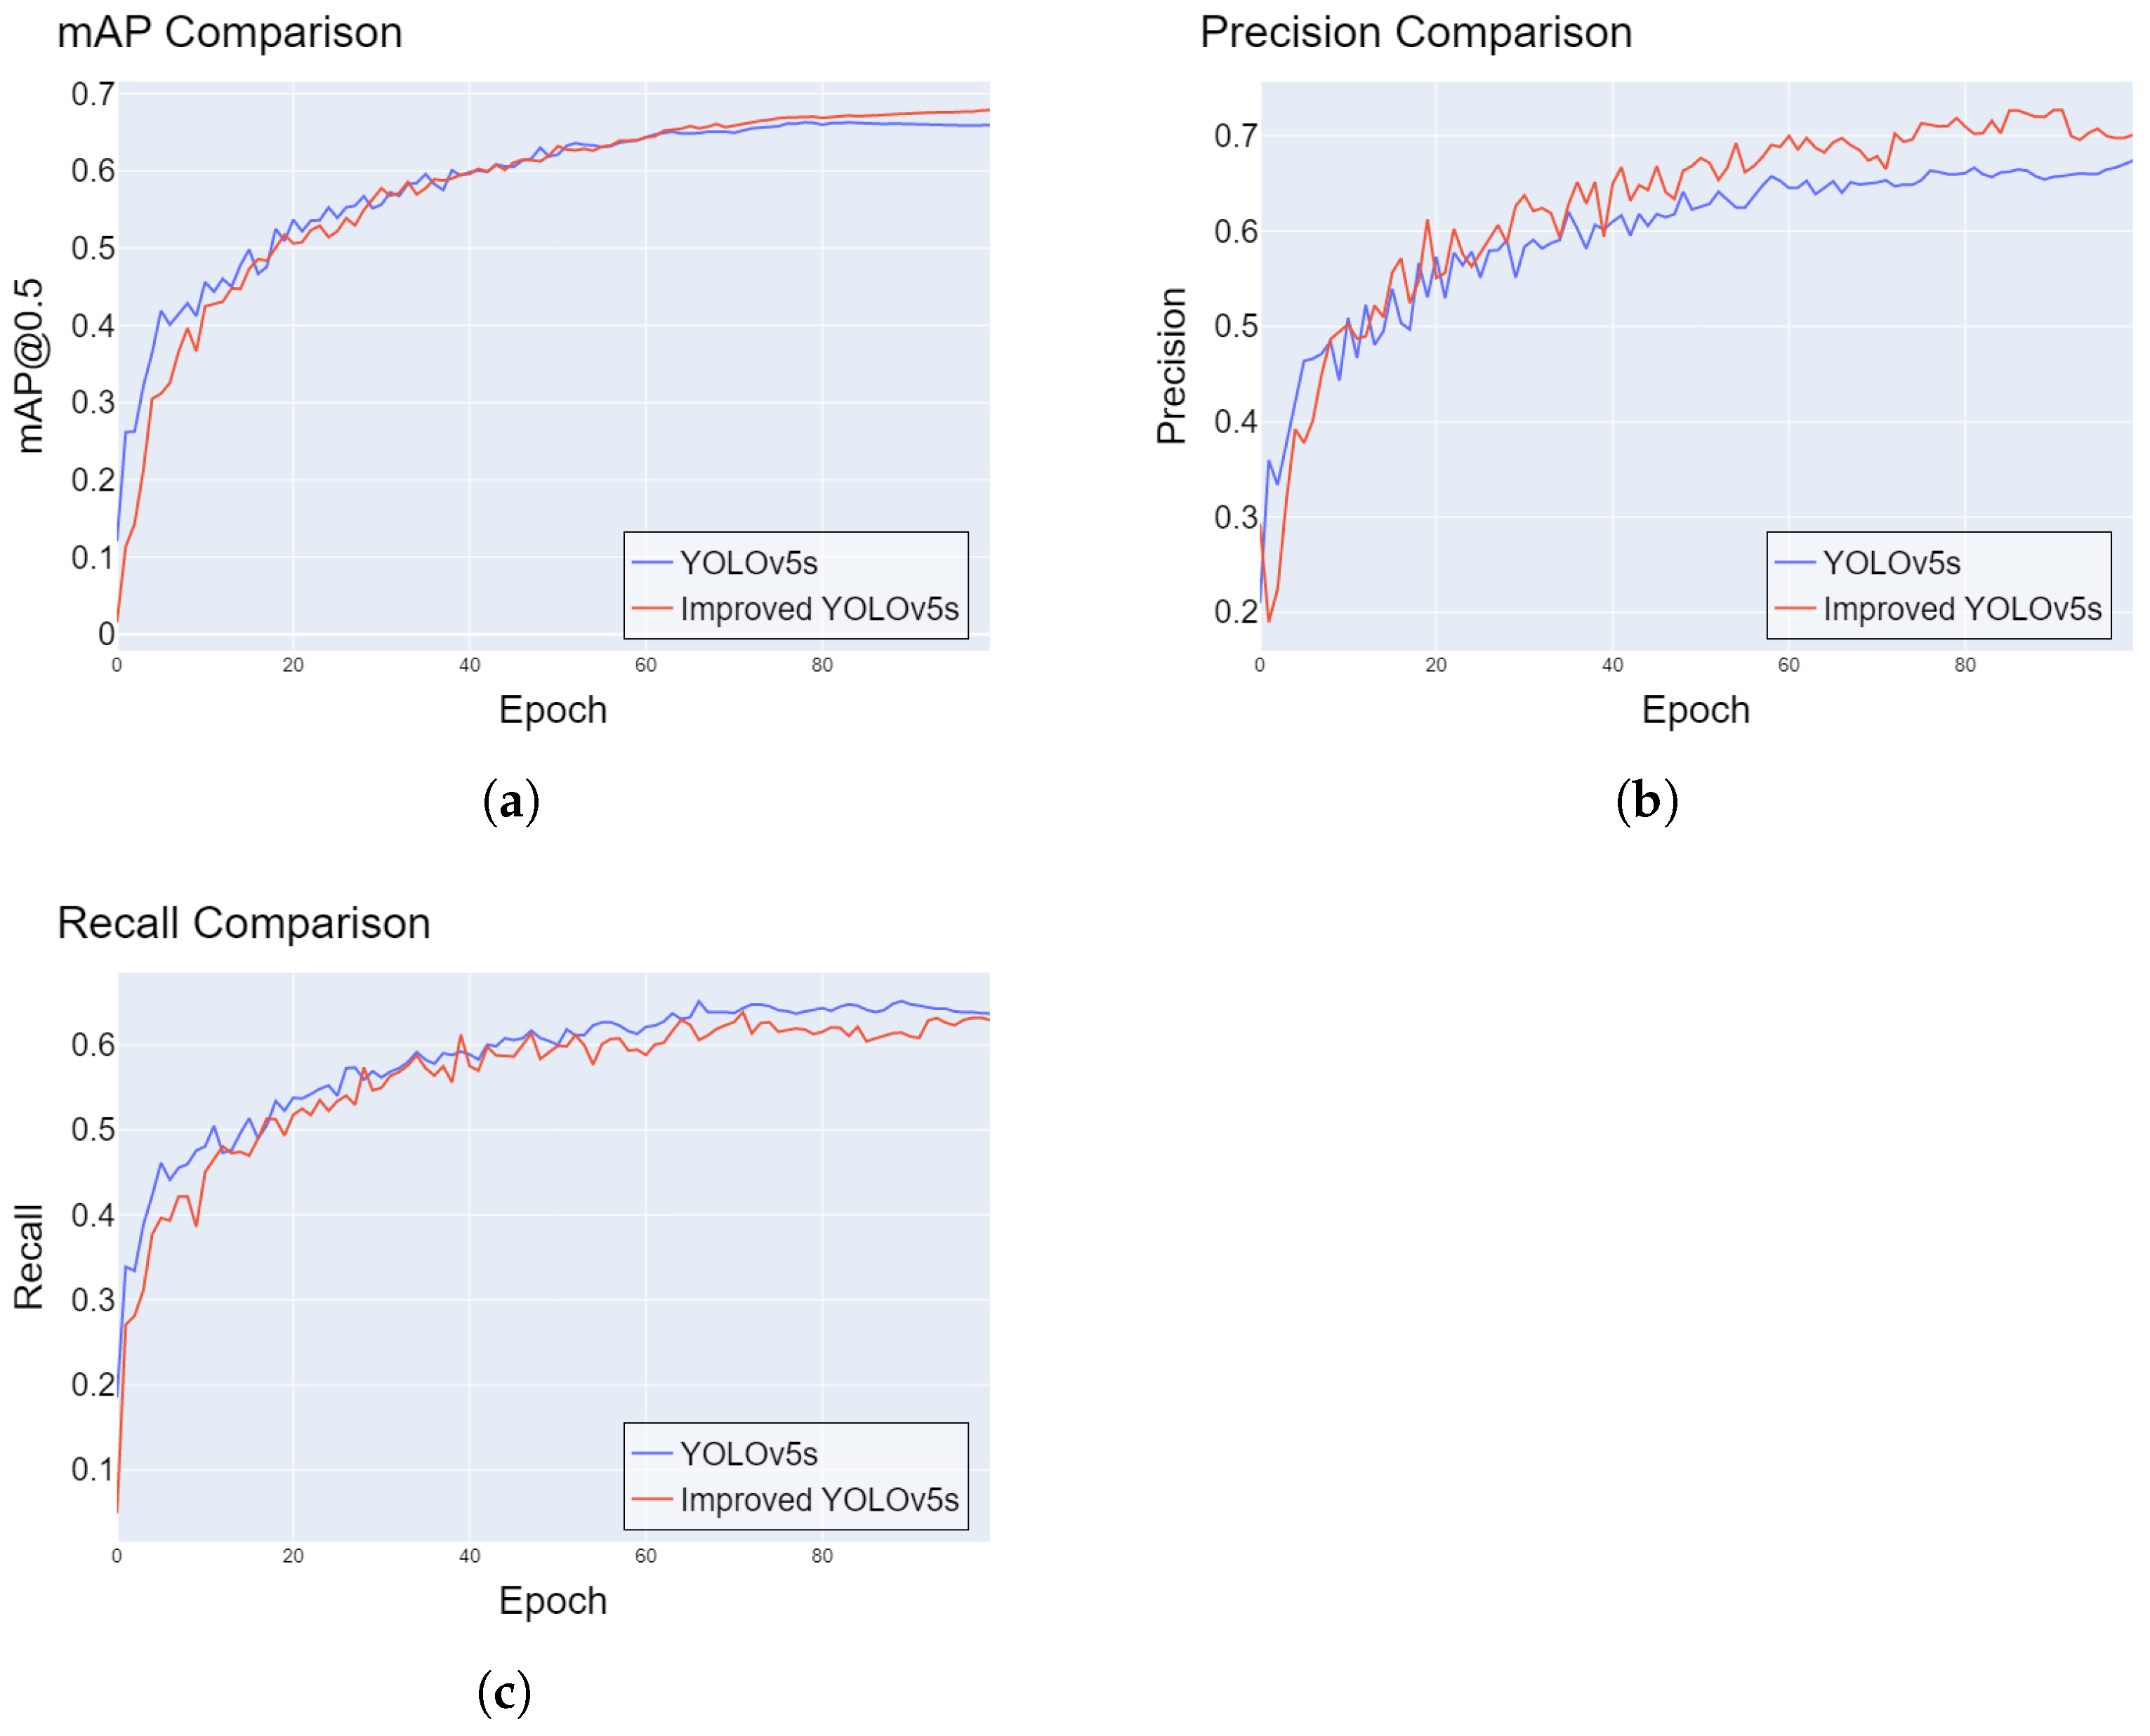
++ algorithm, Focal Loss, and an additional prediction layer. Despite containing a different 1.1 million parameters, our model showed an extraordinary 1.9% improvement in mAP and 1.29% improvement in F1-Score over Yolov5s. In addition, it demonstrated a 0.11% improvement in mAP and a 0.05% improvement in F1 score over YOLOv8s while containing 3 million fewer parameters. These results underscore the effectiveness of our model in advanced road pavement damage detection, contributing to the creation of safer and more efficient transportation networks.
Figure 12 shows the comparison of performance between the YOLOv5s-baseline and our improved YOLOv5s.
In real-world scenarios, it is essential to observe that our model is primarily trained to detect four common types of pavement damage found in six countries. If the detection setup encounters a damage type that lies outside the scope of our model’s training data, it may not be recognized as damage. Future work includes crafting a substantial dataset for our country. While object detection is standard, instance segmentation can be valuable in locating damage precisely. We plan to develop an instance segmentation model with a robust instance-segmentation-based dataset to accurately find road damage in front-view images, as this task has yet to be carried out due to its labor-intensive nature. Moreover, we would like to develop a model for indoor road environments that includes areas such as indoor car parking areas, tunnels, and underground facilities.


