


Automated Segmentation of Optical Coherence Tomography Images of the Human Tympanic Membrane Using Deep Learning


Abstract
:1. Introduction
2. Methods
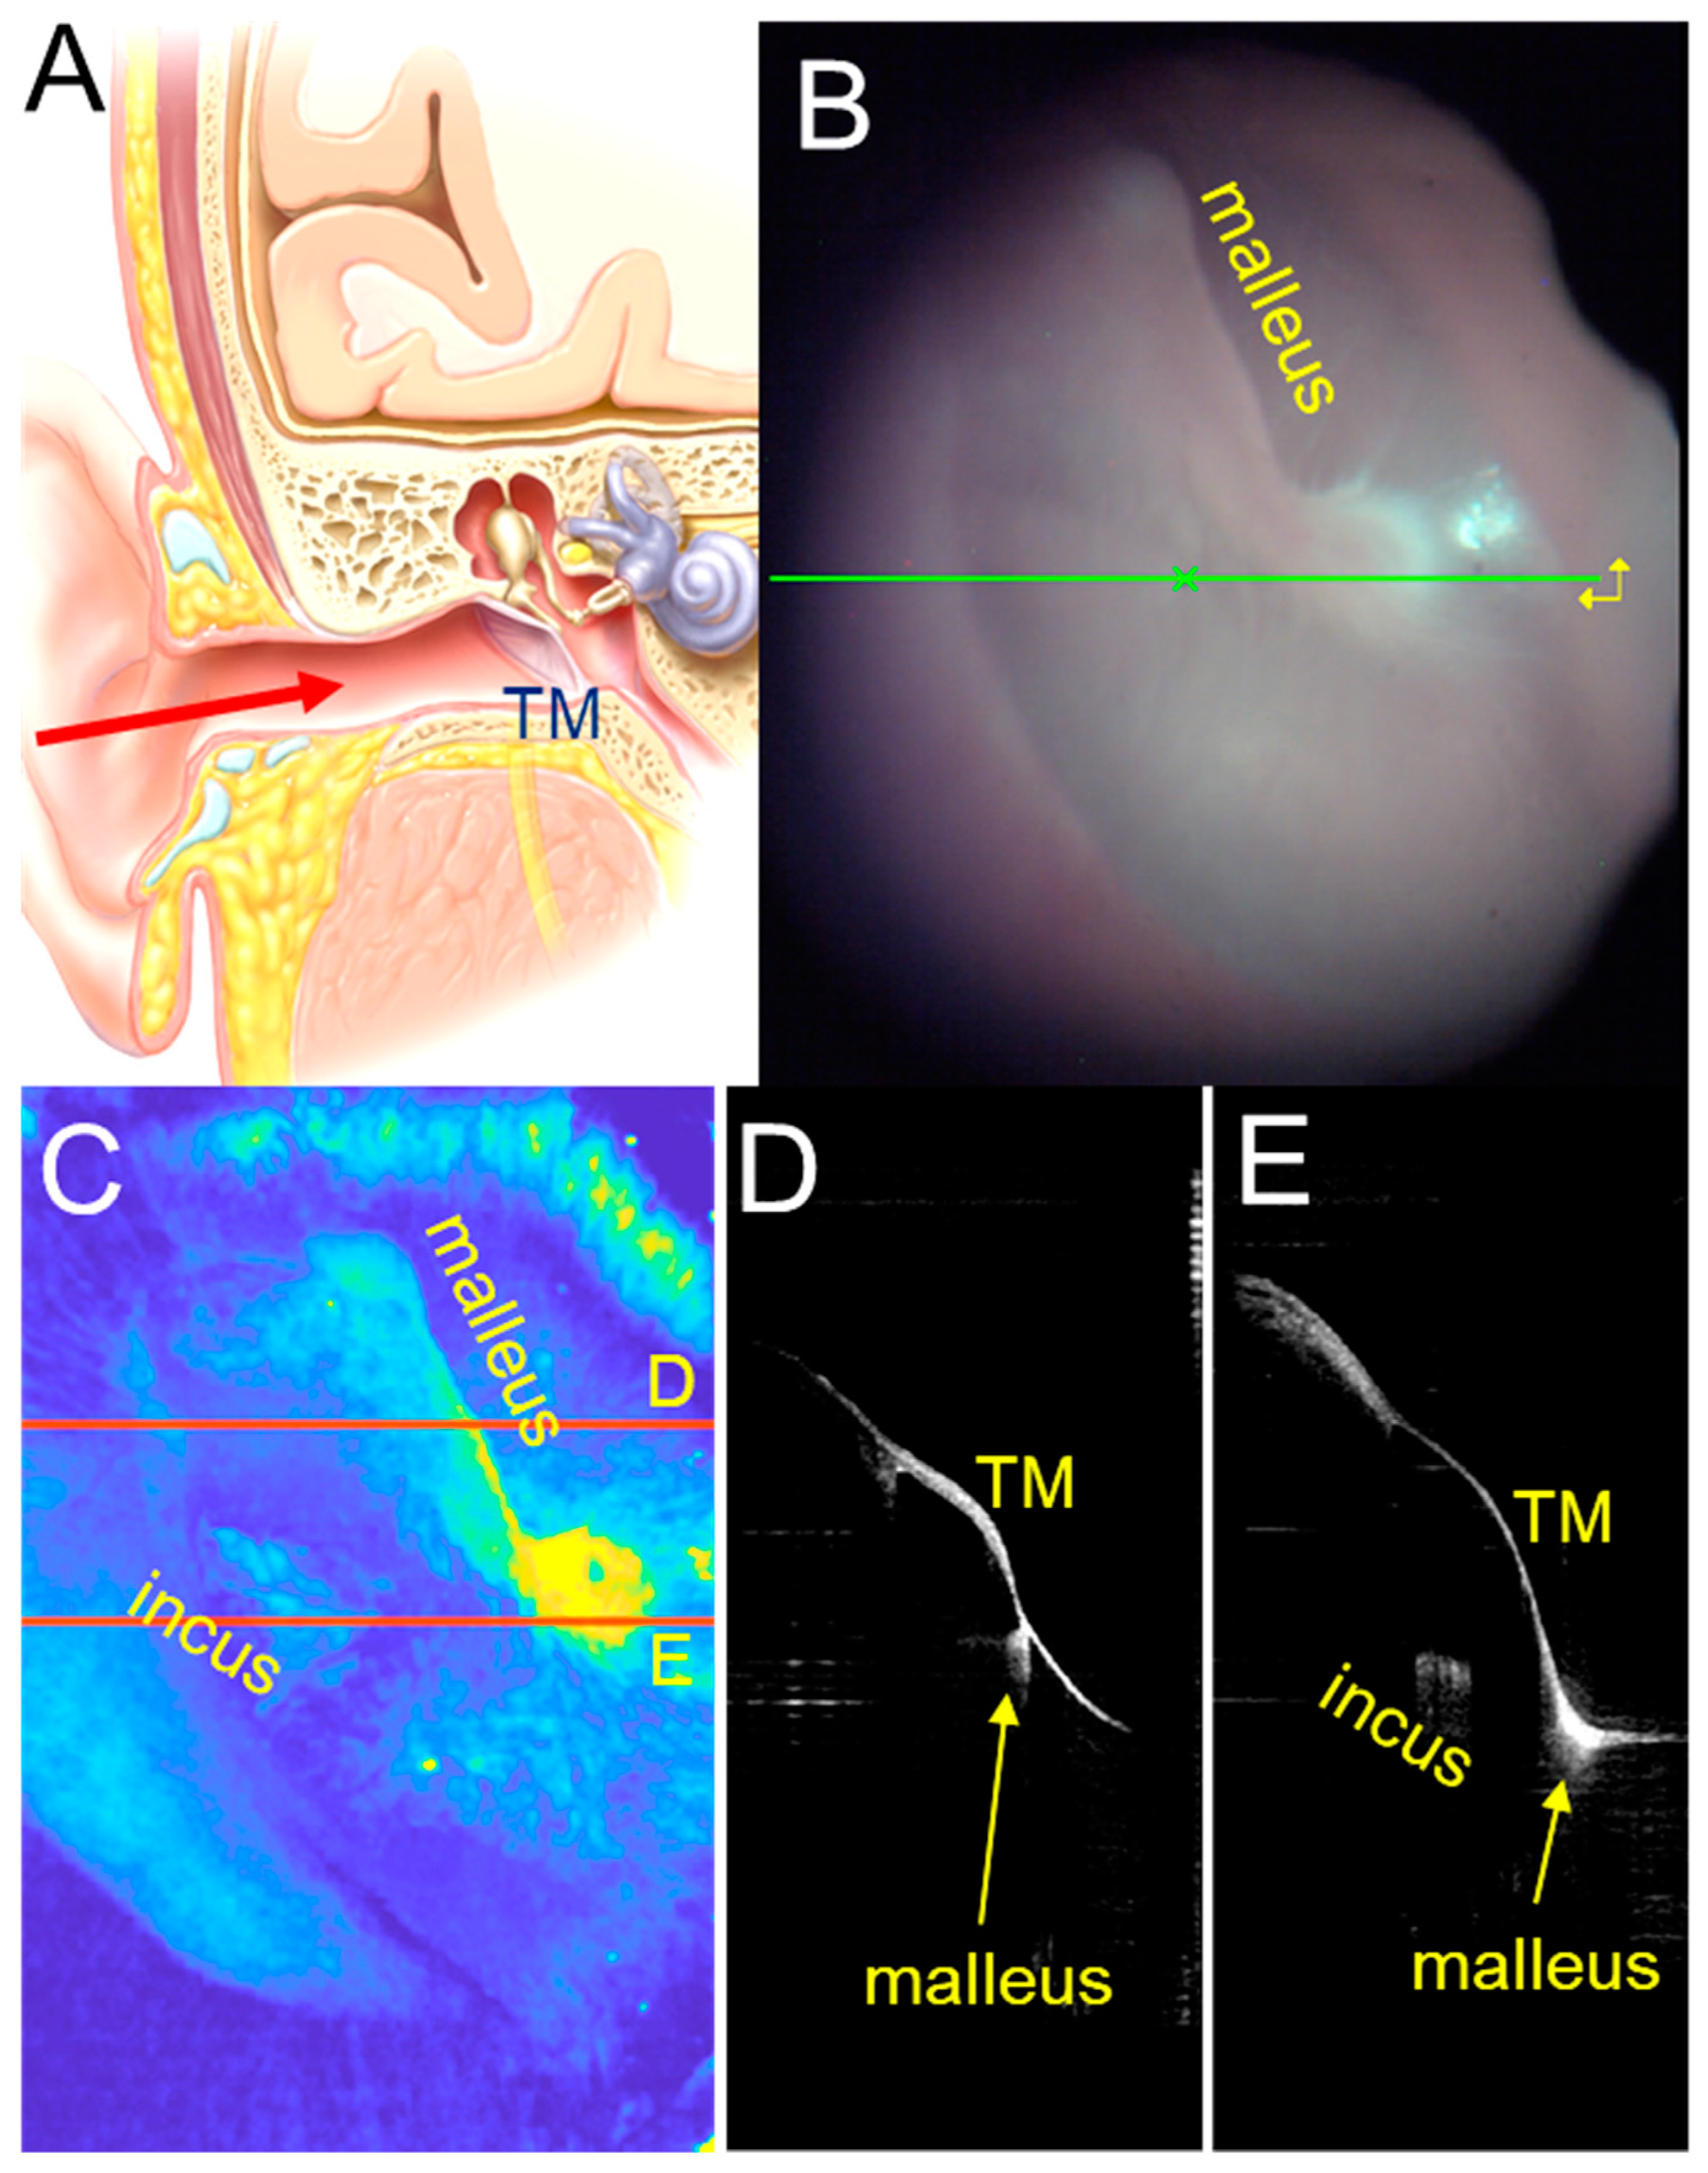
2.1. Patient Dataset
2.2. Overview of Our AI methodology
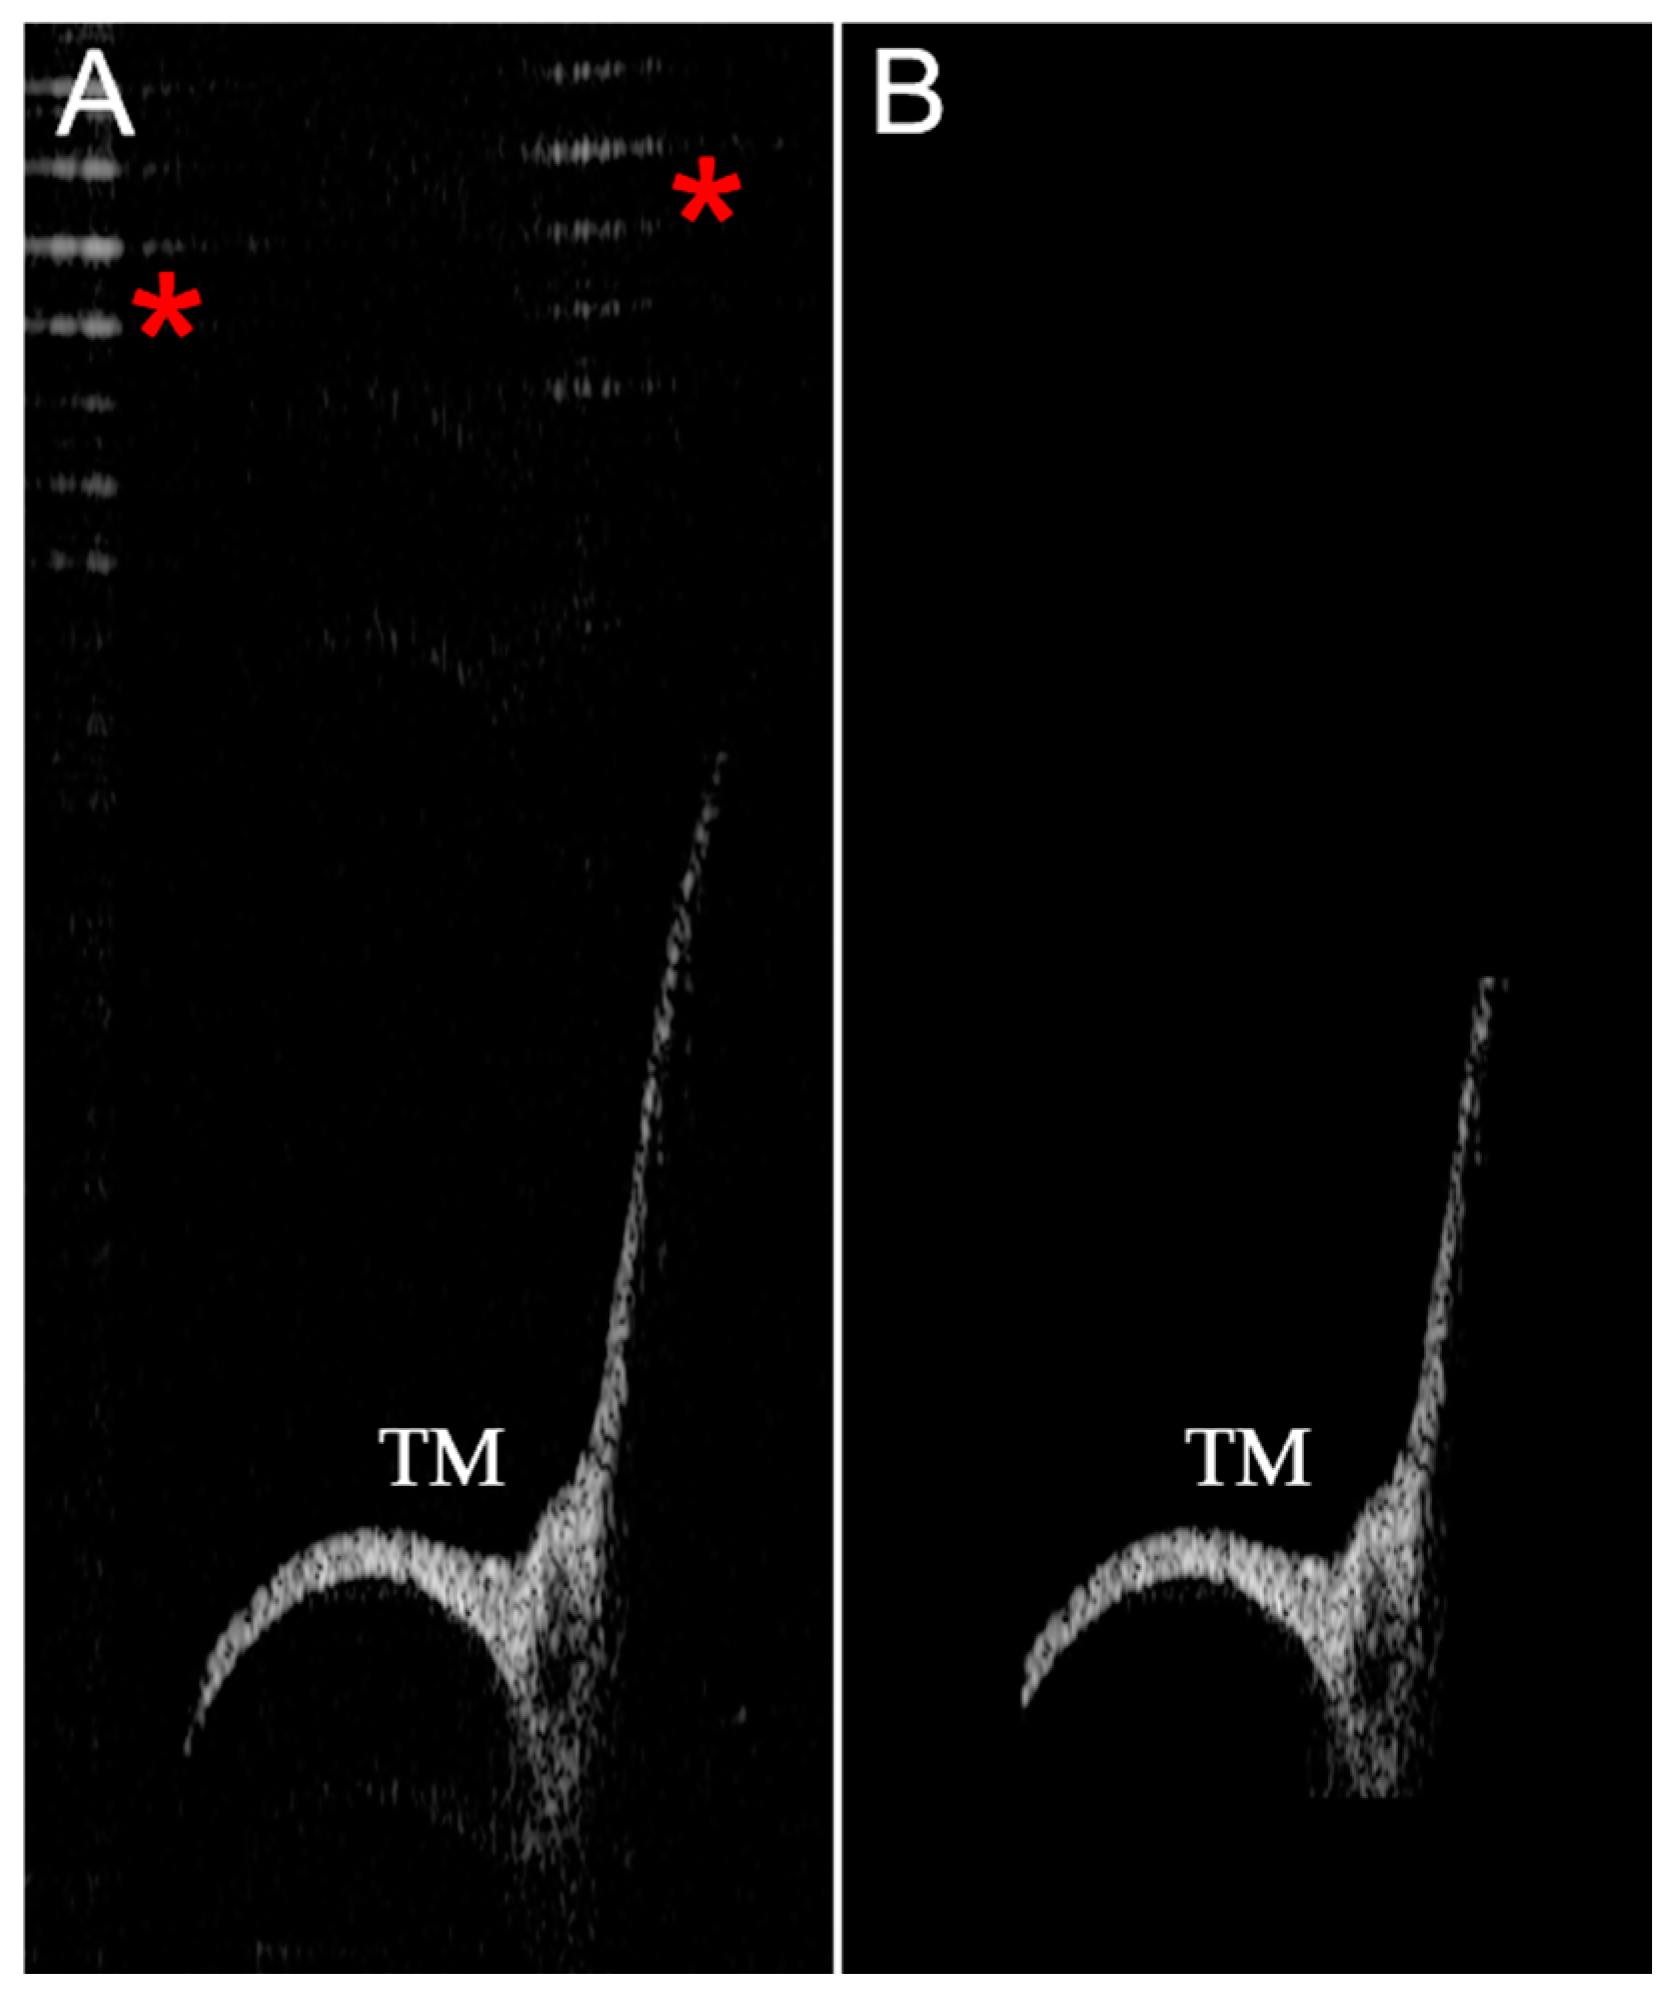
2.3. Large Object Detection Algorithm
2.4. Small Object Detection Algorithm
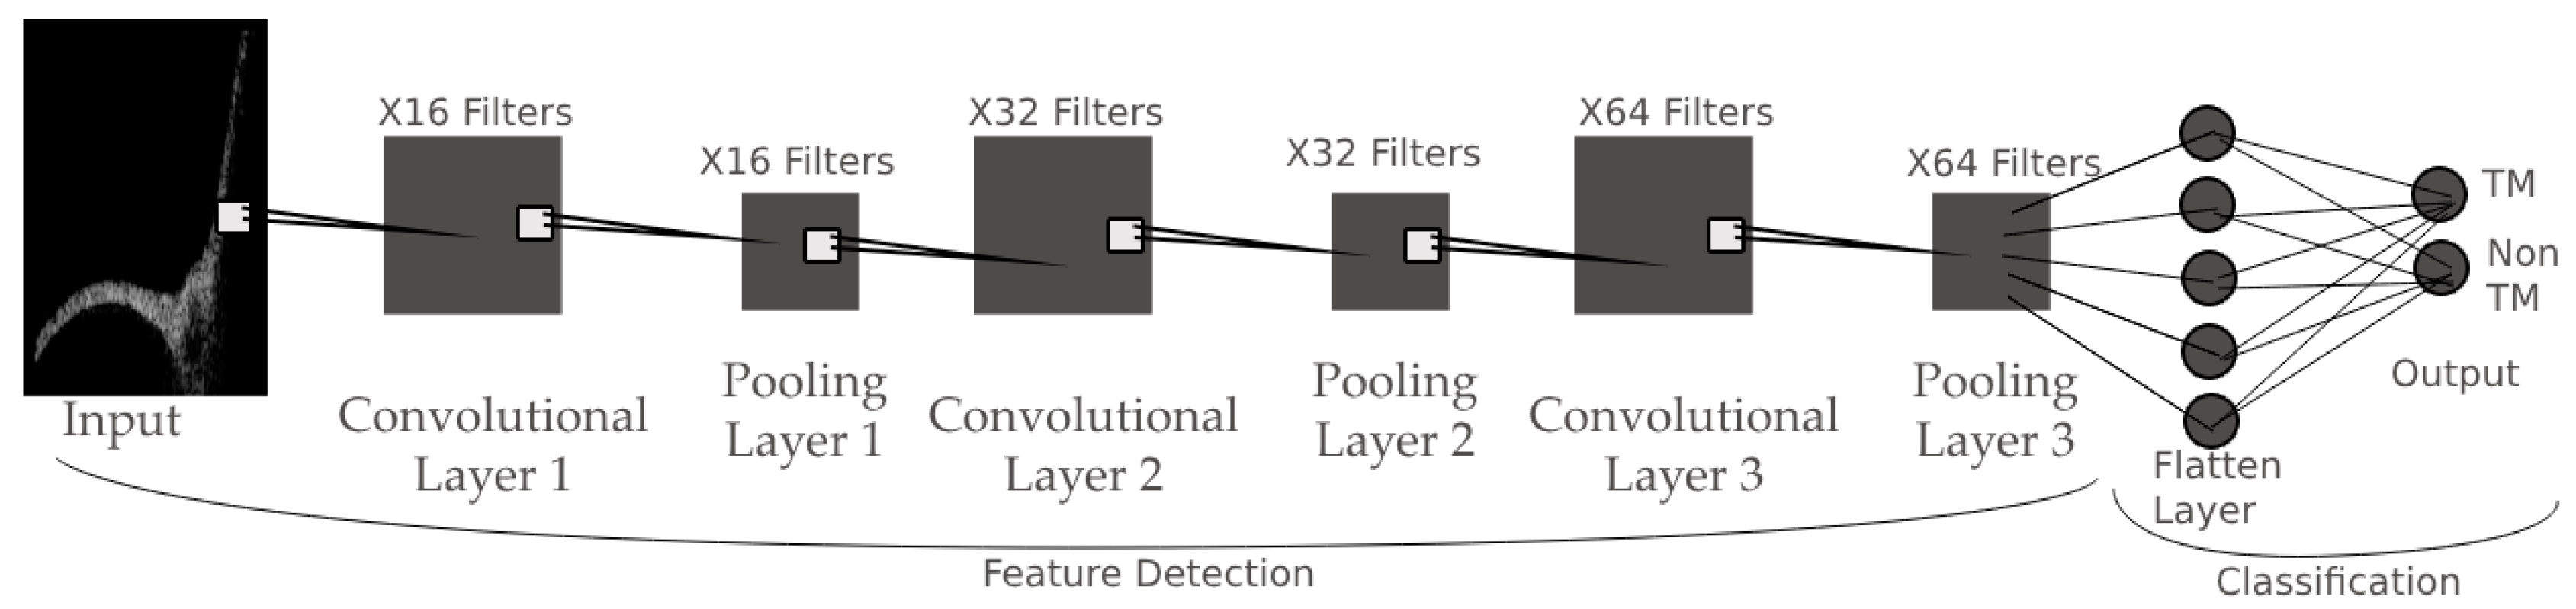
2.5. Image Recognition Algorithms
2.6. 3D Reconstruction Algorithm
3. Results
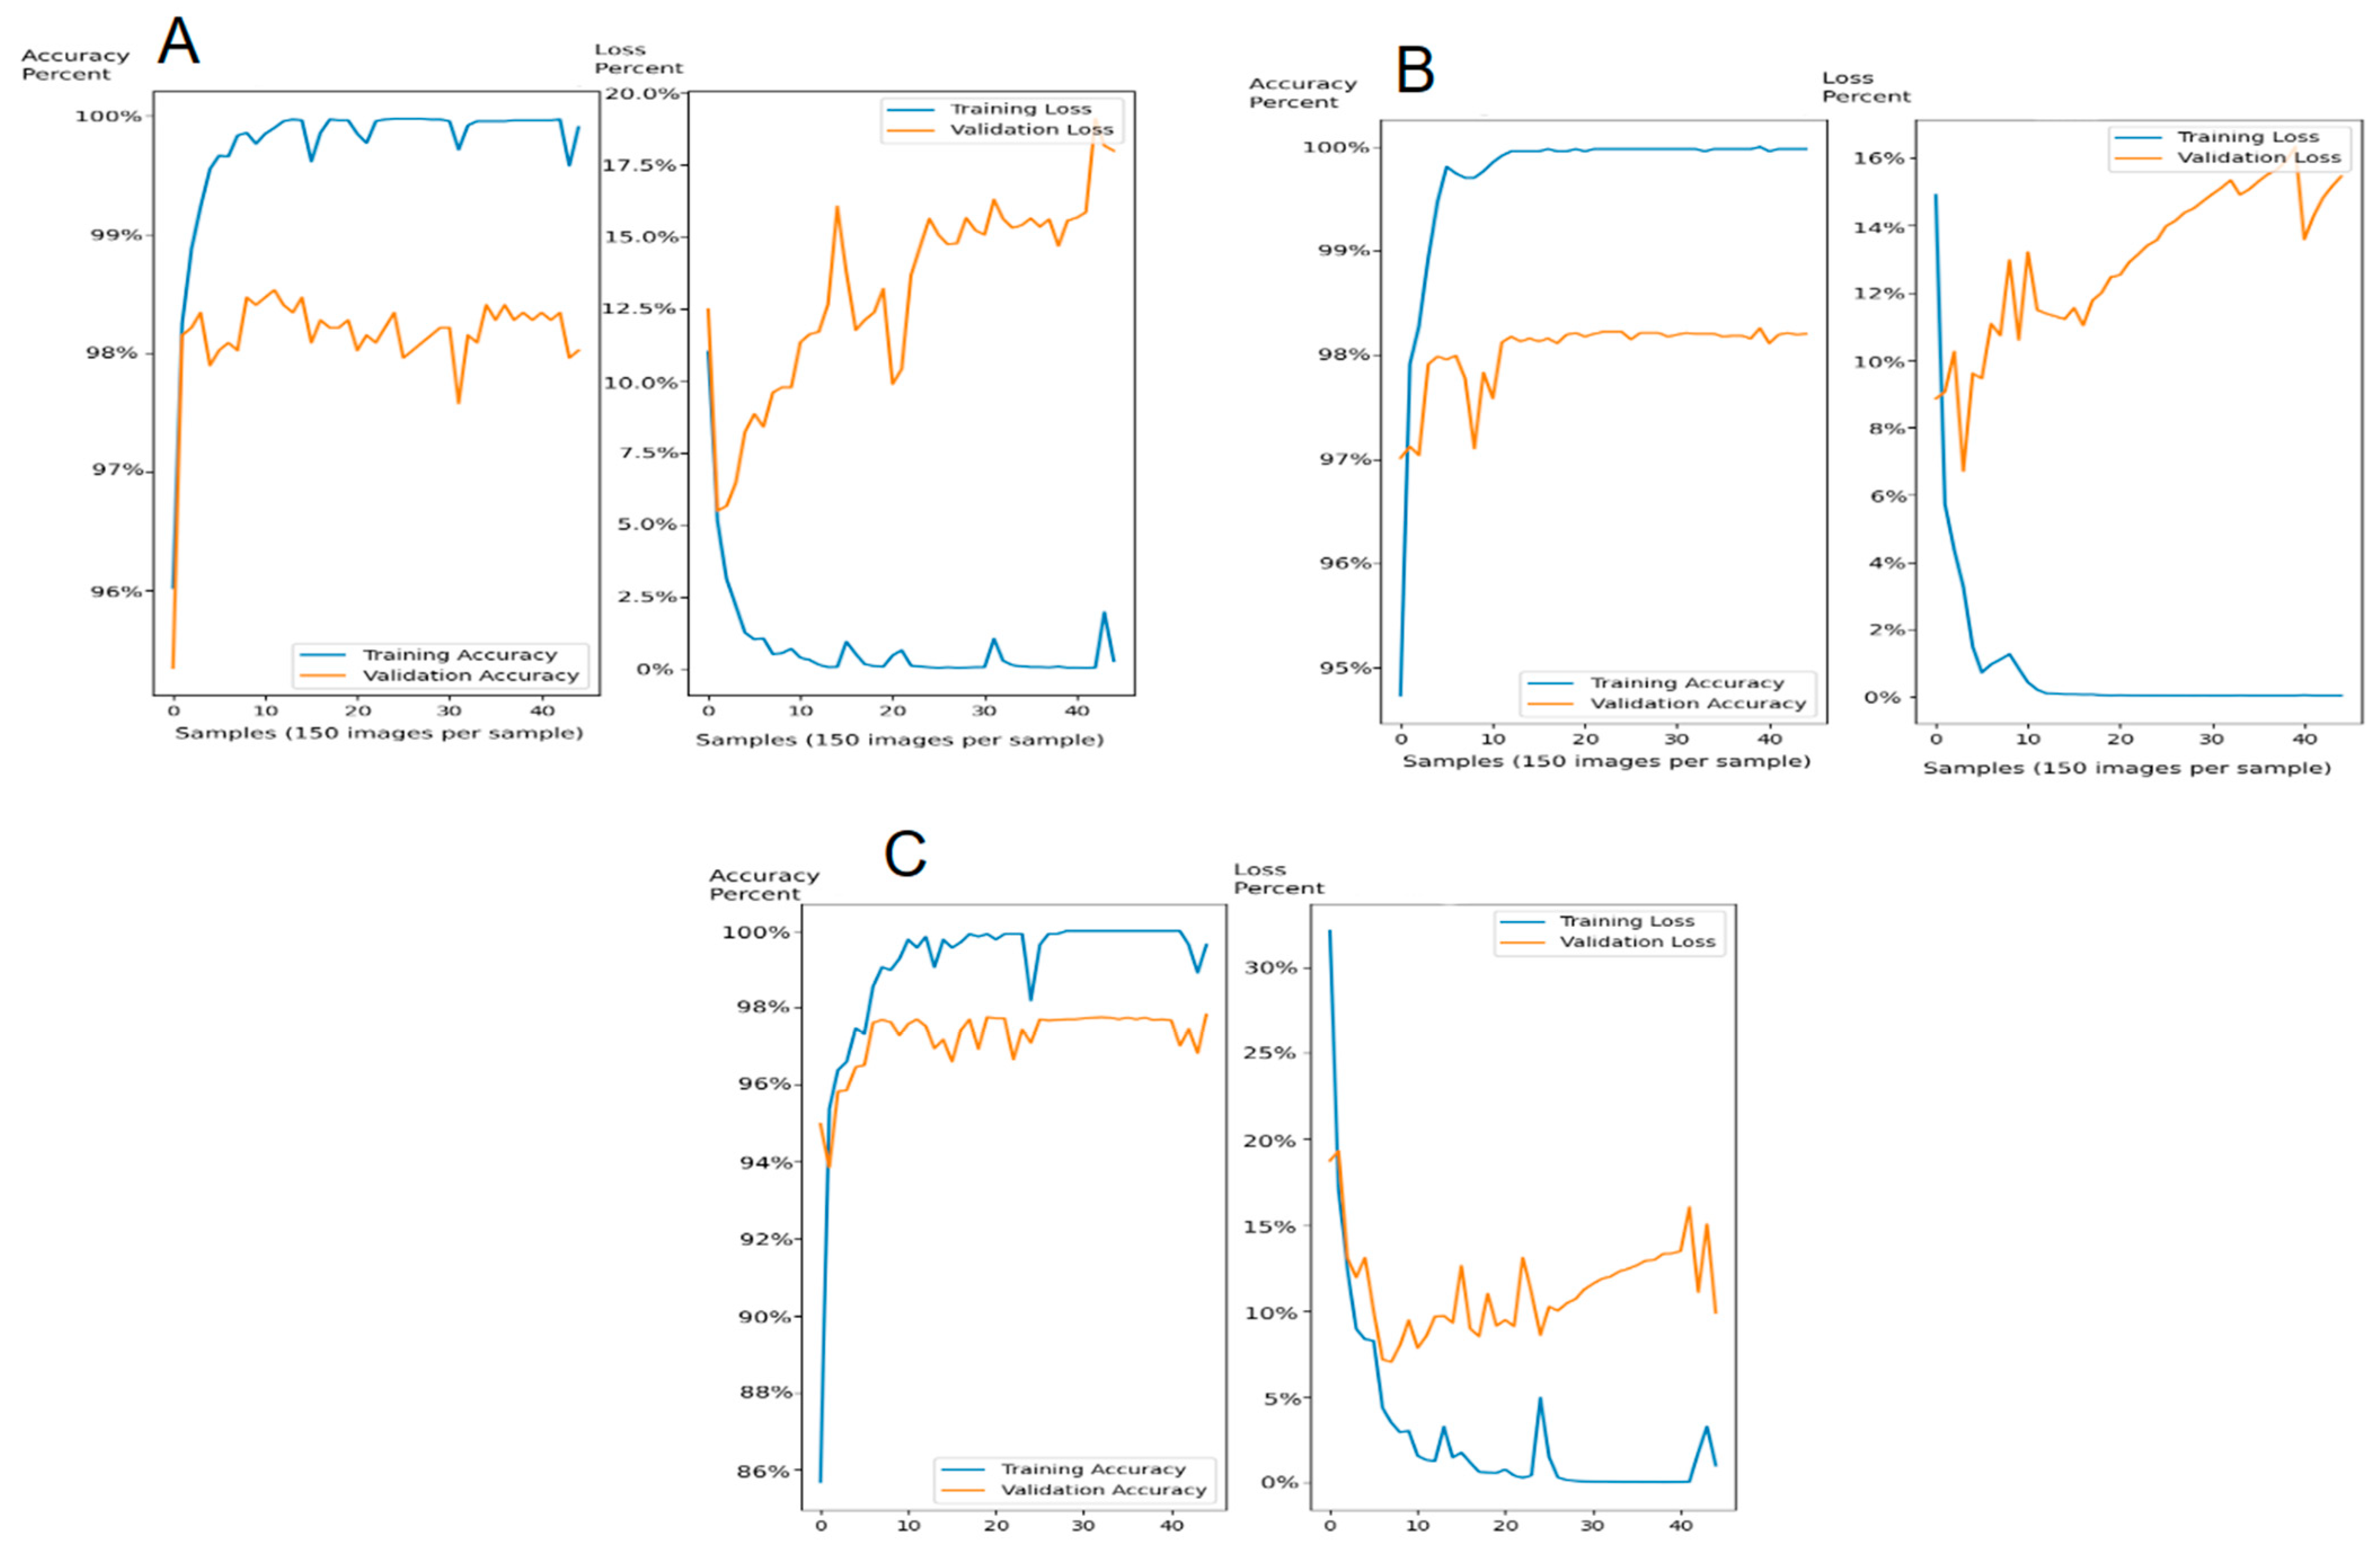
3.1. Model Results
3.2. Model Details and Rationale for Overfitting
4. Discussion
4.1. Deep Learning and Model Limitations
4.2. The Future: Automated Diagnosis of Ear Pathology
5. Conclusions
Author Contributions
Funding
Data Availability Statement
Acknowledgments
Conflicts of Interest
References
- Luers, J.C.; Hüttenbrink, K.B. Surgical anatomy and pathology of the middle ear. J. Anat. 2016, 228, 338–353. [Google Scholar] [CrossRef] [PubMed]
- Geisler, C.D. From Sound to Synapse: Physiology of the Mammalian Ear; Oxford University Press: New York, NY, USA, 1998; ISBN 0195100255. [Google Scholar]
- Saliba, I.; Abela, A.; Arcand, P. Tympanic membrane perforation: Size, site and hearing evaluation. Int. J. Pediatr. Otorhinolaryngol. 2011, 75, 527–531. [Google Scholar] [CrossRef] [PubMed]
- Lerut, B.; Pfammatter, A.; Moons, J.; Linder, T. Functional Correlations of Tympanic Membrane Perforation Size. Otol. Neurotol. 2012, 33, 379–386. [Google Scholar] [CrossRef]
- Lou, Z.C.; Lou, Z.H.; Zhang, Q.P. Traumatic Tympanic Membrane Perforations: A Study of Etiology and Factors Affecting Outcome. Am. J. Otolaryngol. 2012, 33, 549–555. [Google Scholar] [CrossRef]
- Ibekwe, T.S.; Adeosun, A.A.; Nwaorgu, O.G. Quantitative analysis of tympanic membrane perforation: A simple and reliable method. J. Laryngol. Otol. 2009, 123, e2. [Google Scholar] [CrossRef] [PubMed]
- Xydakis, M.S.; Bebarta, V.S.; Harrison, C.D.; Conner, J.C.; Grant, G.A.; Robbins, A.S. Tympanic-Membrane Perforation as a Marker of Concussive Brain Injury in Iraq. N. Engl. J. Med. 2007, 357, 830–831. [Google Scholar] [CrossRef]
- Bateman, L.; Borsetto, D.; Boscolo-Rizzo, P.; Mochloulis, G.; Vijendren, A. A narrative review of the management of pars flaccida tympanic membrane retractions without cholesteatoma. Clin. Otolaryngol. 2023. [Google Scholar] [CrossRef]
- Maddineni, S.; Ahmad, I. Updates in Eustachian Tube Dysfunction. Otolaryngol. Clin. N. Am. 2022, 55, 1151–1164. [Google Scholar] [CrossRef]
- Spinos, D.; Mallick, S.; Judd, O. Management of retraction pockets: Historic and novel approaches. J. Laryngol. Otol. 2022, 136, 582–587. [Google Scholar] [CrossRef]
- Urík, M.; Tedla, M.; Hurník, P. Pathogenesis of Retraction Pocket of the Tympanic Membrane—A Narrative Review. Medicina 2021, 57, 425. [Google Scholar] [CrossRef]
- Gutierrez, J.A.; Cabrera, C.I.; Stout, A.; Mowry, S.E. Tympanoplasty in the Setting of Complex Middle Ear Pathology: A Systematic Review. Ann. Otol. Rhinol. Laryngol. 2023, 132, 1453–1466. [Google Scholar] [CrossRef]
- Piras, G.; Sykopetrites, V.; Taibah, A.; Russo, A.; Caruso, A.; Grinblat, G.; Sanna, M. Long term outcomes of canal wall up and canal wall down tympanomastoidectomies in pediatric cholesteatoma. Int. J. Pediatr. Otorhinolaryngol. 2021, 150, 110887. [Google Scholar] [CrossRef]
- Nicholas Jungbauer, W.; Jeong, S.; Nguyen, S.A.; Lambert, P.R. Comparing Myringoplasty to Type I Tympanoplasty in Tympanic Membrane Repair: A Systematic Review and Meta-analysis. Otolaryngol. Head Neck Surg. 2023, 168, 922–934. [Google Scholar] [CrossRef] [PubMed]
- Mankowski, N.; Raggio, B. Otoscope Exam. Available online: https://www.statpearls.com/point-of-care/27339 (accessed on 25 July 2023).
- Schilder, A.G.M.; Chonmaitree, T.; Cripps, A.W.; Rosenfeld, R.M.; Casselbrant, M.L.; Haggard, M.P.; Venekamp, R.P. Otitis media. Nat. Rev. Dis. Primers 2016, 2, 16063. [Google Scholar] [CrossRef] [PubMed]
- Carr, J.A.; Valdez, T.A.; Bruns, O.T.; Bawendi, M.G. Using the shortwave infrared to image middle ear pathologies. Proc. Natl. Acad. Sci. USA 2016, 113, 9989–9994. [Google Scholar] [CrossRef]
- Aumann, S.; Donner, S.; Fischer, J.; Müller, F. Optical Coherence Tomography (OCT): Principle and Technical Realization. In High Resolution Imaging in Microscopy and Ophthalmology; Springer: Berlin/Heidelberg, Germany, 2019; pp. 59–85. [Google Scholar]
- Kudsieh, B.; Fernández-Vigo, J.I.; Flores-Moreno, I.; Ruiz-Medrano, J.; Garcia-Zamora, M.; Samaan, M.; Ruiz-Moreno, J.M. Update on the Utility of Optical Coherence Tomography in the Analysis of the Optic Nerve Head in Highly Myopic Eyes with and without Glaucoma. J. Clin. Med. 2023, 12, 2592. [Google Scholar] [CrossRef] [PubMed]
- Mahendradas, P.; Acharya, I.; Rana, V.; Bansal, R.; Ben Amor, H.; Khairallah, M. Optical Coherence Tomography and Optical Coherence Tomography Angiography in Neglected Diseases. Ocul. Immunol. Inflamm. 2023, 1–8. [Google Scholar] [CrossRef] [PubMed]
- Tan, H.E.I.; Santa Maria, P.L.; Wijesinghe, P.; Francis Kennedy, B.; Allardyce, B.J.; Eikelboom, R.H.; Atlas, M.D.; Dilley, R.J. Optical Coherence Tomography of the Tympanic Membrane and Middle Ear: A Review. Otolaryngol. Head Neck Surg. 2018, 159, 424–438. [Google Scholar] [CrossRef]
- Badash, I.; Quiñones, P.M.; Oghalai, K.J.; Wang, J.; Lui, C.G.; Macias-Escriva, F.; Applegate, B.E.; Oghalai, J.S. Endolymphatic Hydrops is a Marker of Synaptopathy Following Traumatic Noise Exposure. Front. Cell Dev. Biol. 2021, 9, 3163. [Google Scholar] [CrossRef] [PubMed]
- Dewey, J.B.; Altoè, A.; Shera, C.A.; Applegate, B.E.; Oghalai, J.S. Cochlear outer hair cell electromotility enhances organ of Corti motion on a cycle-by-cycle basis at high frequencies in vivo. Proc. Natl. Acad. Sci. USA 2021, 118, e2025206118. [Google Scholar] [CrossRef]
- Kim, J.; Xia, A.; Grillet, N.; Applegate, B.E.; Oghalai, J.S. Osmotic stabilization prevents cochlear synaptopathy after blast trauma. Proc. Natl. Acad. Sci. USA 2018, 115, E4853–E4860. [Google Scholar] [CrossRef]
- Lui, C.G.; Kim, W.; Dewey, J.B.; Macías-Escrivá, F.D.; Ratnayake, K.; Oghalai, J.S.; Applegate, B.E. In vivo functional imaging of the human middle ear with a hand-held optical coherence tomography device. Biomed. Opt. Express 2021, 12, 5196–5213. [Google Scholar] [CrossRef] [PubMed]
- Merchant, G.R.; Siegel, J.H.; Neely, S.T.; Rosowski, J.J.; Nakajima, H.H. Effect of Middle-Ear Pathology on High-Frequency Ear Canal Reflectance Measurements in the Frequency and Time Domains. J. Assoc. Res. Otolaryngol. 2019, 20, 529–552. [Google Scholar] [CrossRef]
- Deliwala, S.S.; Hamid, K.; Barbarawi, M.; Lakshman, H.; Zayed, Y.; Kandel, P.; Malladi, S.; Singh, A.; Bachuwa, G.; Gurvits, G.E.; et al. Artificial intelligence (AI) real-time detection vs. routine colonoscopy for colorectal neoplasia: A meta-analysis and trial sequential analysis. Int. J. Color. Dis. 2021, 36, 2291–2303. [Google Scholar] [CrossRef]
- Suzuki, H.; Yoshitaka, T.; Yoshio, T.; Tada, T. Artificial intelligence for cancer detection of the upper gastrointestinal tract. Dig. Endosc. 2021, 33, 254–262. [Google Scholar] [CrossRef]
- Mahmood, H.; Shaban, M.; Rajpoot, N.; Khurram, S.A. Artificial Intelligence-based methods in head and neck cancer diagnosis: An overview. Br. J. Cancer 2021, 124, 1934–1940. [Google Scholar] [CrossRef] [PubMed]
- Liu, Y.; Han, G.; Liu, X. Lightweight Compound Scaling Network for Nasopharyngeal Carcinoma Segmentation from MR Images. Sensors 2022, 22, 5875. [Google Scholar] [CrossRef] [PubMed]
- Zhi, Y.; Hau, W.K.; Zhang, H.; Gao, Z. Vessel Contour Detection in Intracoronary Images via Bilateral Cross-Domain Adaptation. IEEE J. Biomed. Health Inform. 2023, 27, 3314–3325. [Google Scholar] [CrossRef] [PubMed]
- Kim, W.; Kim, S.; Oghalai, J.S.; Applegate, B.E. Stereo Microscope Based OCT System Capable of Subnanometer Vibrometry in the Middle Ear. In Proceedings of the Progress in Biomedical Optics and Imaging—Proceedings of SPIE, Prague, Czech Republic, 23 June 2019; Volume 11078. [Google Scholar]
- Oghalai, J. GitHub Repository. Available online: https://github.com/jso111/linear-mixed-effect-modeling (accessed on 16 September 2023).
- Snider, E.J.; Hernandez-Torres, S.I.; Hennessey, R. Using Ultrasound Image Augmentation and Ensemble Predictions to Prevent Machine-Learning Model Overfitting. Diagnostics 2023, 13, 417. [Google Scholar] [CrossRef]
- Shorten, C.; Khoshgoftaar, T.M. A survey on Image Data Augmentation for Deep Learning. J. Big Data 2019, 6, 60. [Google Scholar] [CrossRef]
- Khosla, C.; Saini, B.S. Enhancing Performance of Deep Learning Models with different Data Augmentation Techniques: A Survey. In Proceedings of the 2020 International Conference on Intelligent Engineering and Management (ICIEM), London, UK, 17–19 June 2020; pp. 79–85. [Google Scholar] [CrossRef]
- Neves, C.A.; Tran, E.D.; Kessler, I.M.; Blevins, N.H. Fully automated preoperative segmentation of temporal bone structures from clinical CT scans. Sci. Rep. 2021, 11, 116. [Google Scholar] [CrossRef]
- Lv, Y.; Ke, J.; Xu, Y.; Shen, Y.; Wang, J.; Wang, J. Automatic segmentation of temporal bone structures from clinical conventional CT using a CNN approach. Int. J. Med. Robot. Comput. Assist. Surg. 2021, 17, e2229. [Google Scholar] [CrossRef] [PubMed]
- Wang, J.; Lv, Y.; Wang, J.; Ma, F.; Du, Y.; Fan, X.; Wang, M.; Ke, J. Fully automated segmentation in temporal bone CT with neural network: A preliminary assessment study. BMC Med. Imaging 2021, 21, 166. [Google Scholar] [CrossRef] [PubMed]
- Ding, A.S.; Lu, A.; Li, Z.; Sahu, M.; Galaiya, D.; Siewerdsen, J.H.; Unberath, M.; Taylor, R.H.; Creighton, F.X. A Self-Configuring Deep Learning Network for Segmentation of Temporal Bone Anatomy in Cone-Beam CT Imaging. Otolaryngol. Head Neck Surg. 2023. [Google Scholar] [CrossRef] [PubMed]
- Windsor, G.O.; Bai, H.; Lourenco, A.P.; Jiao, Z. Application of artificial intelligence in predicting lymph node metastasis in breast cancer. Front. Radiol. 2023, 3, 928639. [Google Scholar] [CrossRef]
- Koseoglu, N.D.; Grzybowski, A.; Liu, T.Y.A. Deep Learning Applications to Classification and Detection of Age-Related Macular Degeneration on Optical Coherence Tomography Imaging: A Review. Ophthalmol. Ther. 2023, 12, 2347–2359. [Google Scholar] [CrossRef] [PubMed]


Disclaimer/Publisher’s Note: The statements, opinions and data contained in all publications are solely those of the individual author(s) and contributor(s) and not of MDPI and/or the editor(s). MDPI and/or the editor(s) disclaim responsibility for any injury to people or property resulting from any ideas, methods, instructions or products referred to in the content. |
© 2023 by the authors. Licensee MDPI, Basel, Switzerland. This article is an open access article distributed under the terms and conditions of the Creative Commons Attribution (CC BY) license (https://creativecommons.org/licenses/by/4.0/).
Share and Cite
Oghalai, T.P.; Long, R.; Kim, W.; Applegate, B.E.; Oghalai, J.S. Automated Segmentation of Optical Coherence Tomography Images of the Human Tympanic Membrane Using Deep Learning. Algorithms 2023, 16, 445. https://doi.org/10.3390/a16090445
Oghalai TP, Long R, Kim W, Applegate BE, Oghalai JS. Automated Segmentation of Optical Coherence Tomography Images of the Human Tympanic Membrane Using Deep Learning. Algorithms. 2023; 16(9):445. https://doi.org/10.3390/a16090445
Chicago/Turabian StyleOghalai, Thomas P., Ryan Long, Wihan Kim, Brian E. Applegate, and John S. Oghalai. 2023. "Automated Segmentation of Optical Coherence Tomography Images of the Human Tympanic Membrane Using Deep Learning" Algorithms 16, no. 9: 445. https://doi.org/10.3390/a16090445
APA StyleOghalai, T. P., Long, R., Kim, W., Applegate, B. E., & Oghalai, J. S. (2023). Automated Segmentation of Optical Coherence Tomography Images of the Human Tympanic Membrane Using Deep Learning. Algorithms, 16(9), 445. https://doi.org/10.3390/a16090445