1. Introduction
The automatic identification system (AIS) serves as a vital monitoring apparatus for maritime vessel surveillance. It supplies essential input parameters that feed into naval traffic simulation models. These models are instrumental in conducting maritime risk analysis and devising strategies for incident prevention. The AIS enables the monitoring of maritime movements via the electronic exchange of navigational data between various entities. This system interlinks vessels, onboard transmitters, ground stations, and satellites, fostering a comprehensive network for efficient tracking. These data include information that is relevant to traffic safety. Although the exchange of AIS data is legally mandatory only for larger vessels, the usage is on the rise, enabling the deduction of various levels of contextual information, from the characterization of ports and offshore platforms to the spatial and temporal distribution of routes.
Numerous studies have harnessed AIS data to examine anomalies in ship behaviors, intending to pinpoint potential navigational threats. Unsupervised anomaly detection algorithms have been employed, using Ornstein–Uhlenbeck stochastic processes based on the analysis of historical routes [
1], or identifying outliers derived from the clustering of behaviors and trajectories [
2]. Other studies have concurrently used infrared images to discriminate noise, irrelevant objects, and suspicious vessels [
3]. Recently, deep learning techniques have been applied, with models aimed at classifying suspicious trajectories using convolutional neural networks (CNNs) and generative-discriminative learning algorithms [
4].
Within the specific context of vessel classification aimed at tracking fishing activities, and more broadly, in the pursuit of augmenting maritime situational awareness (MSA), supervised multiclass methodologies have been implemented. These methodologies employed several algorithms, frequently including random forest models [
5,
6,
7] and light gradient-boosting machine (Light GBM) [
8], to distinguish between different types of vessels. In the latter case, a classification model was effectively implemented using 60-dimensional feature vectors as input, although its application was confined to just three distinct categories of vessels. These feature vectors encapsulated various metrics derived from AIS trajectory data, such as the mean, first quartile, median, third quartile, standard deviation, and coefficient of dispersion associated with changes in speed, course, longitude, latitude, and displacement.
From the studies examined so far, it emerges that current approaches mainly rely on the creation of a single, albeit complex, neural network to which the entire task of recognition is delegated. From an innovative perspective, this paper proposes an alternative strategy rooted in the idea of building an ecosystem of neural networks, diverse in both topological and mathematical terms, and not based exclusively on gradient descent or decision trees. In this regard, each network is purposefully designed to focus on a particular statistical subset of ship trajectories, resulting in an enhancement in performance.
More specifically, this study has focused on the need to provide the Italian Navy with an accurate and efficient solution for monitoring and classifying ship trajectories, employing AIS signals in the context of the Mediterranean Sea. A significant problem arises when ships refuse to respond to AIS signals or provide potentially misleading responses, making it difficult for the Navy to correctly identify the type of ship and its intention. In this context, a solution was needed that allowed the Navy to filter and prioritize its interventions, enabling it to focus resources on cases that presented higher levels of risk or suspicion. This involved the development of a system capable of distinguishing, for example, between a fishing boat and a cruise ship based solely on trajectories, thereby improving the efficiency and effectiveness of the Navy’s monitoring and response operations.
The approach presented here aims to recognize the type of vessel among N possible classes using adaptive algorithms specifically trained for this purpose. The data considered for the feature vector include the identifier, position, instantaneous velocity, and heading of each vessel. The adaptive algorithms have been trained using data acquired from radars on multiple vessels (after excluding the identifiers). Positional data are not included as vessels may follow new routes that are not present in the database, making the algorithm less reliable. Additionally, changes in vessel positions have been eliminated due to variations in sampling frequency, which could result in unreliable acceleration and deceleration data.
2. Materials and Methods
The experiments that were conducted during the search are summarized in three steps: (A) data preparation; (B) experimentation; (C) results analysis. The first step, data preparation, is structured in additional three phases: (A.I) data cleaning; (A.II) data pre-processing; (A.III) model definition;
2.1. A.I—Data Cleaning
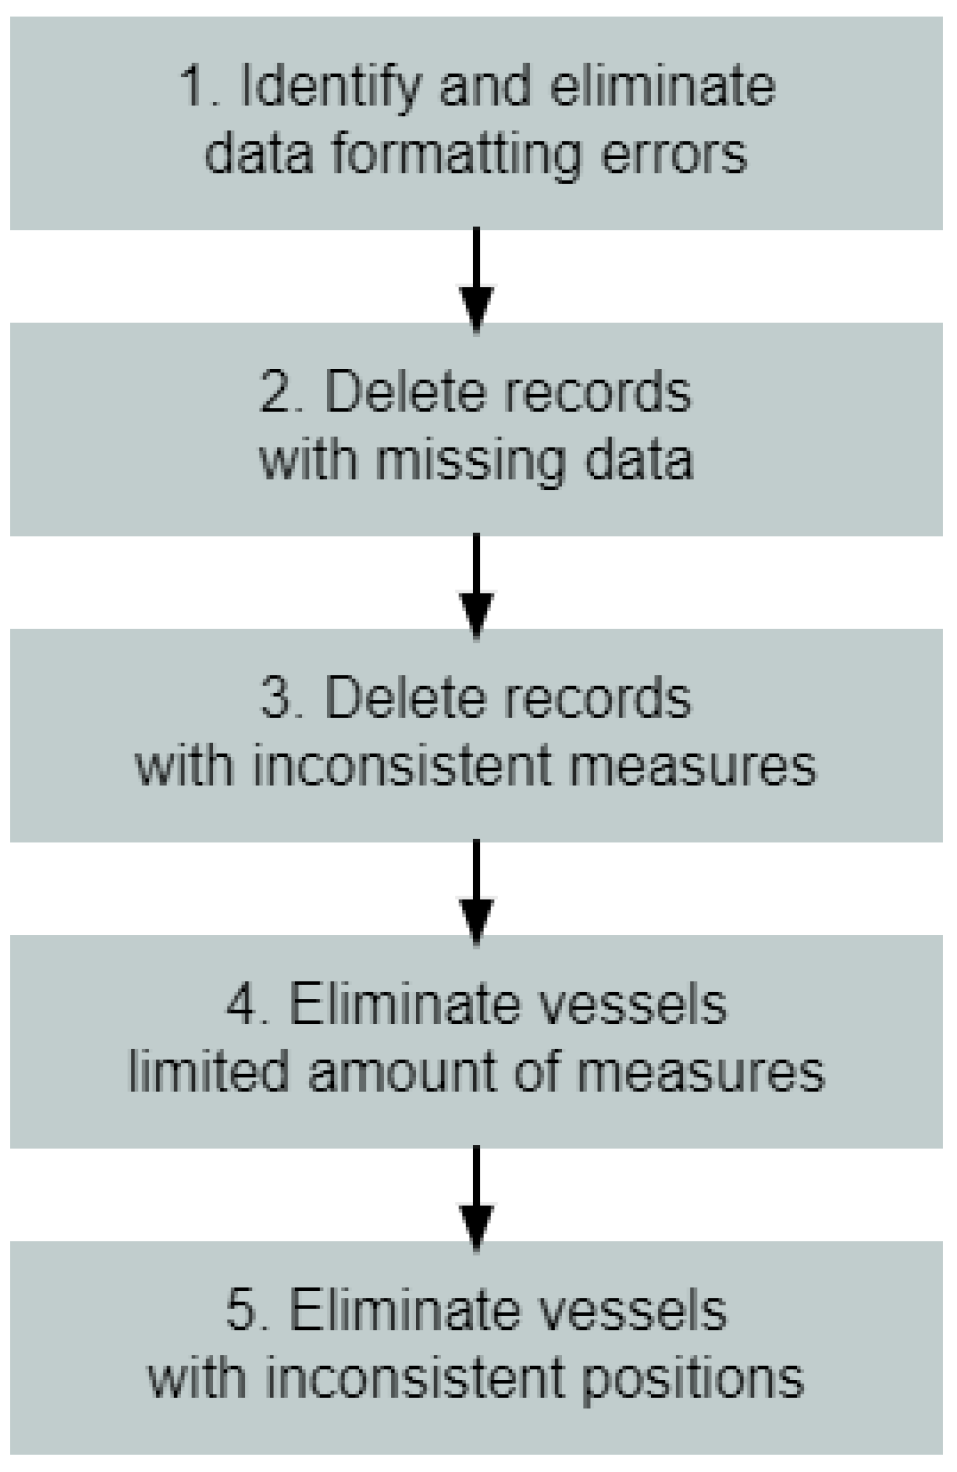
To ensure a reliable dataset for the experiments, the following data-cleaning procedure was implemented (
Figure 1):
Following this process, the analysis sample comprises 3669 vessels, each with a minimum of 100 consecutive radar detection points. Furthermore, in accordance with the Navy’s approval, six distinct vessel classes have been identified (N = 6), serving as the targets for intelligent recognition by the adaptive models (
Table 1). Note that it was not possible to measure the acceleration of naval vessels as their positions were detected at non-uniform time intervals.
2.2. A.II—Data Pre-Processing
The strategic objective of this experiment is to represent each vessel through the statistical profile of its route. In the dataset provided by the Navy, there are only two variables that characterize the route of a vessel: the velocity and direction of the bow at the time of radar detection. This is regardless of the stretch of sea crossed.
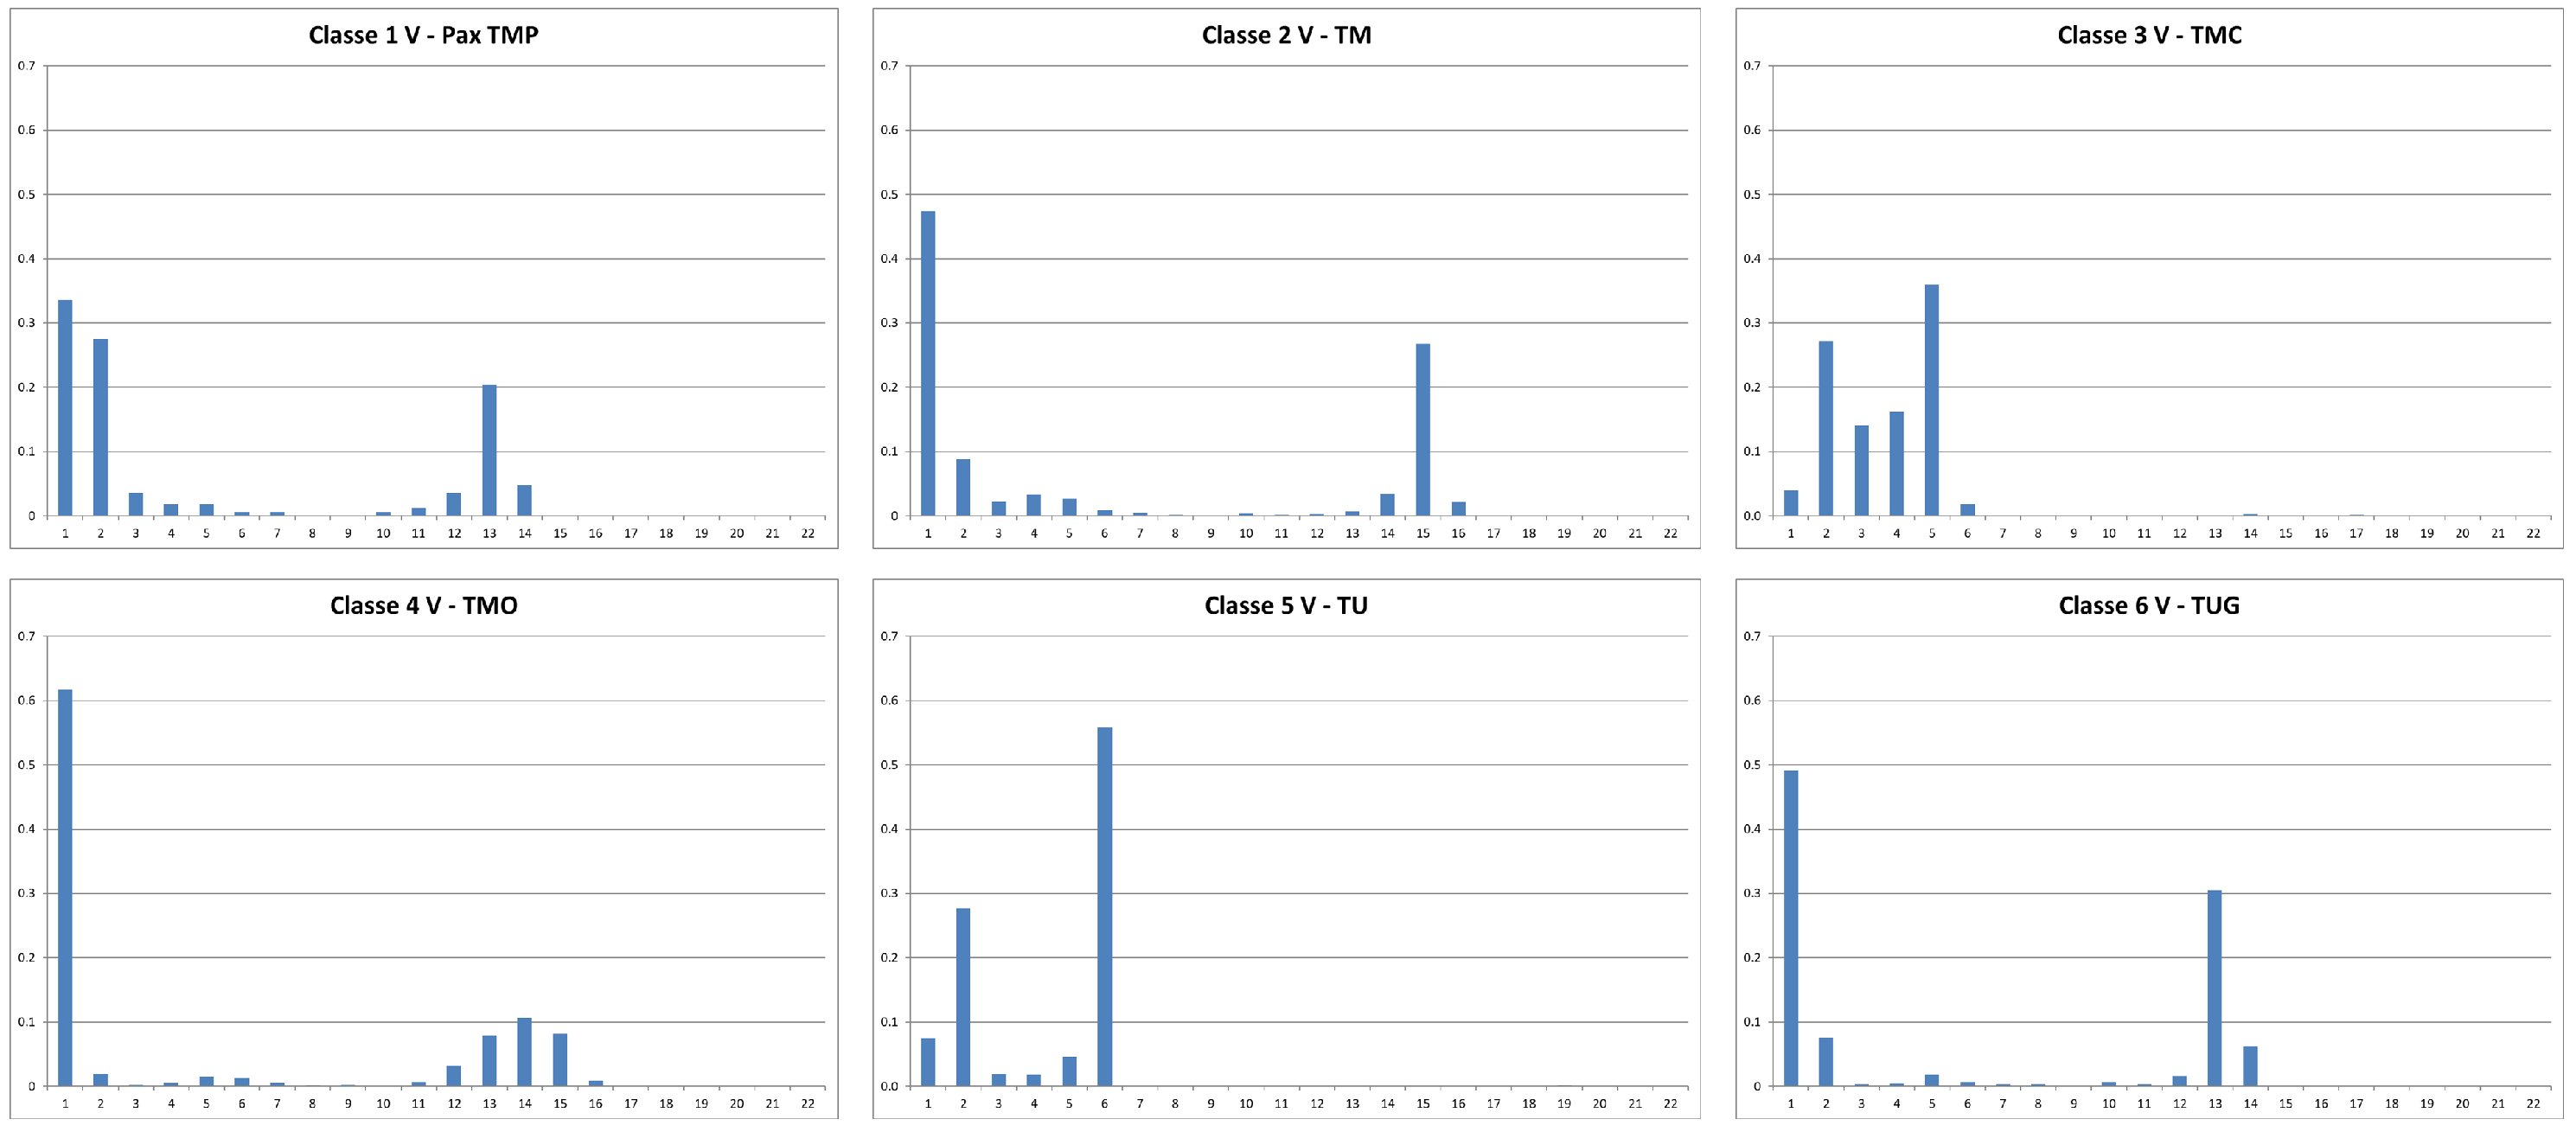
For example, by dividing the variable “velocity” into regular intervals (bins), you can measure how often the velocity of each vessel falls within each of them, during its journey. With an appropriate transformation, one can define the general probability with which a vessel can be found in each of these intervals. By establishing a defined number of intervals (bins) for each variable that characterizes the vessel’s navigation, the statistical profile of each vessel’s route can be established through the use of the probability density function.
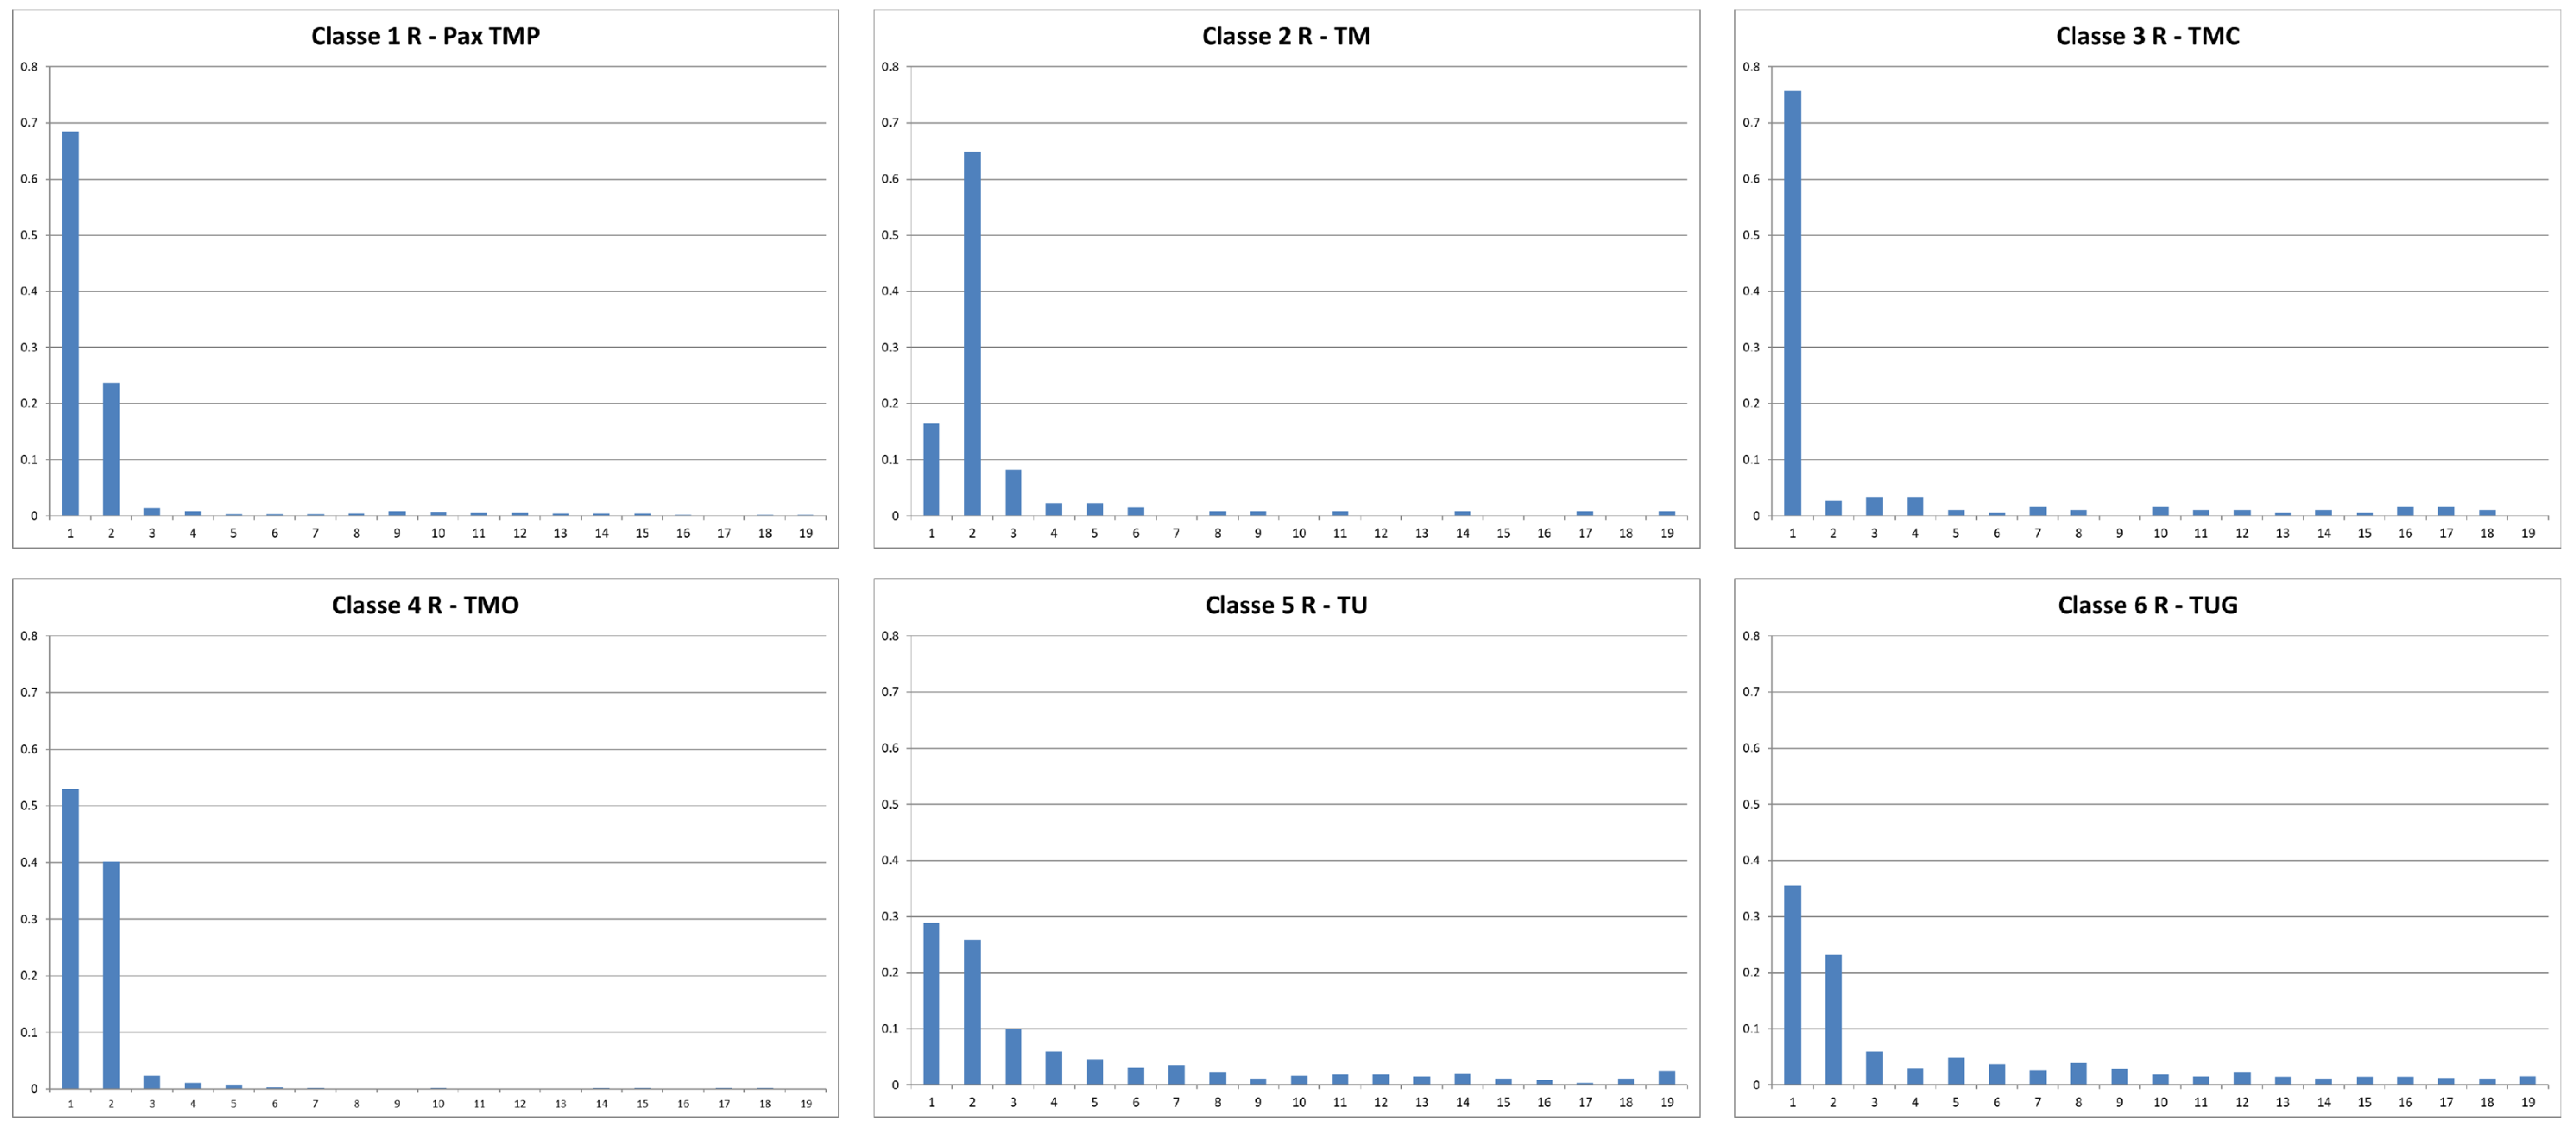
Utilizing these intervals, we decided to characterize the only two variables available in the database for each vessel: Punctual velocity and direction at every radar detection point along the route. However, it is important to note that these measurements are taken in an unsystematic manner, rather than following a strict sampling plan.
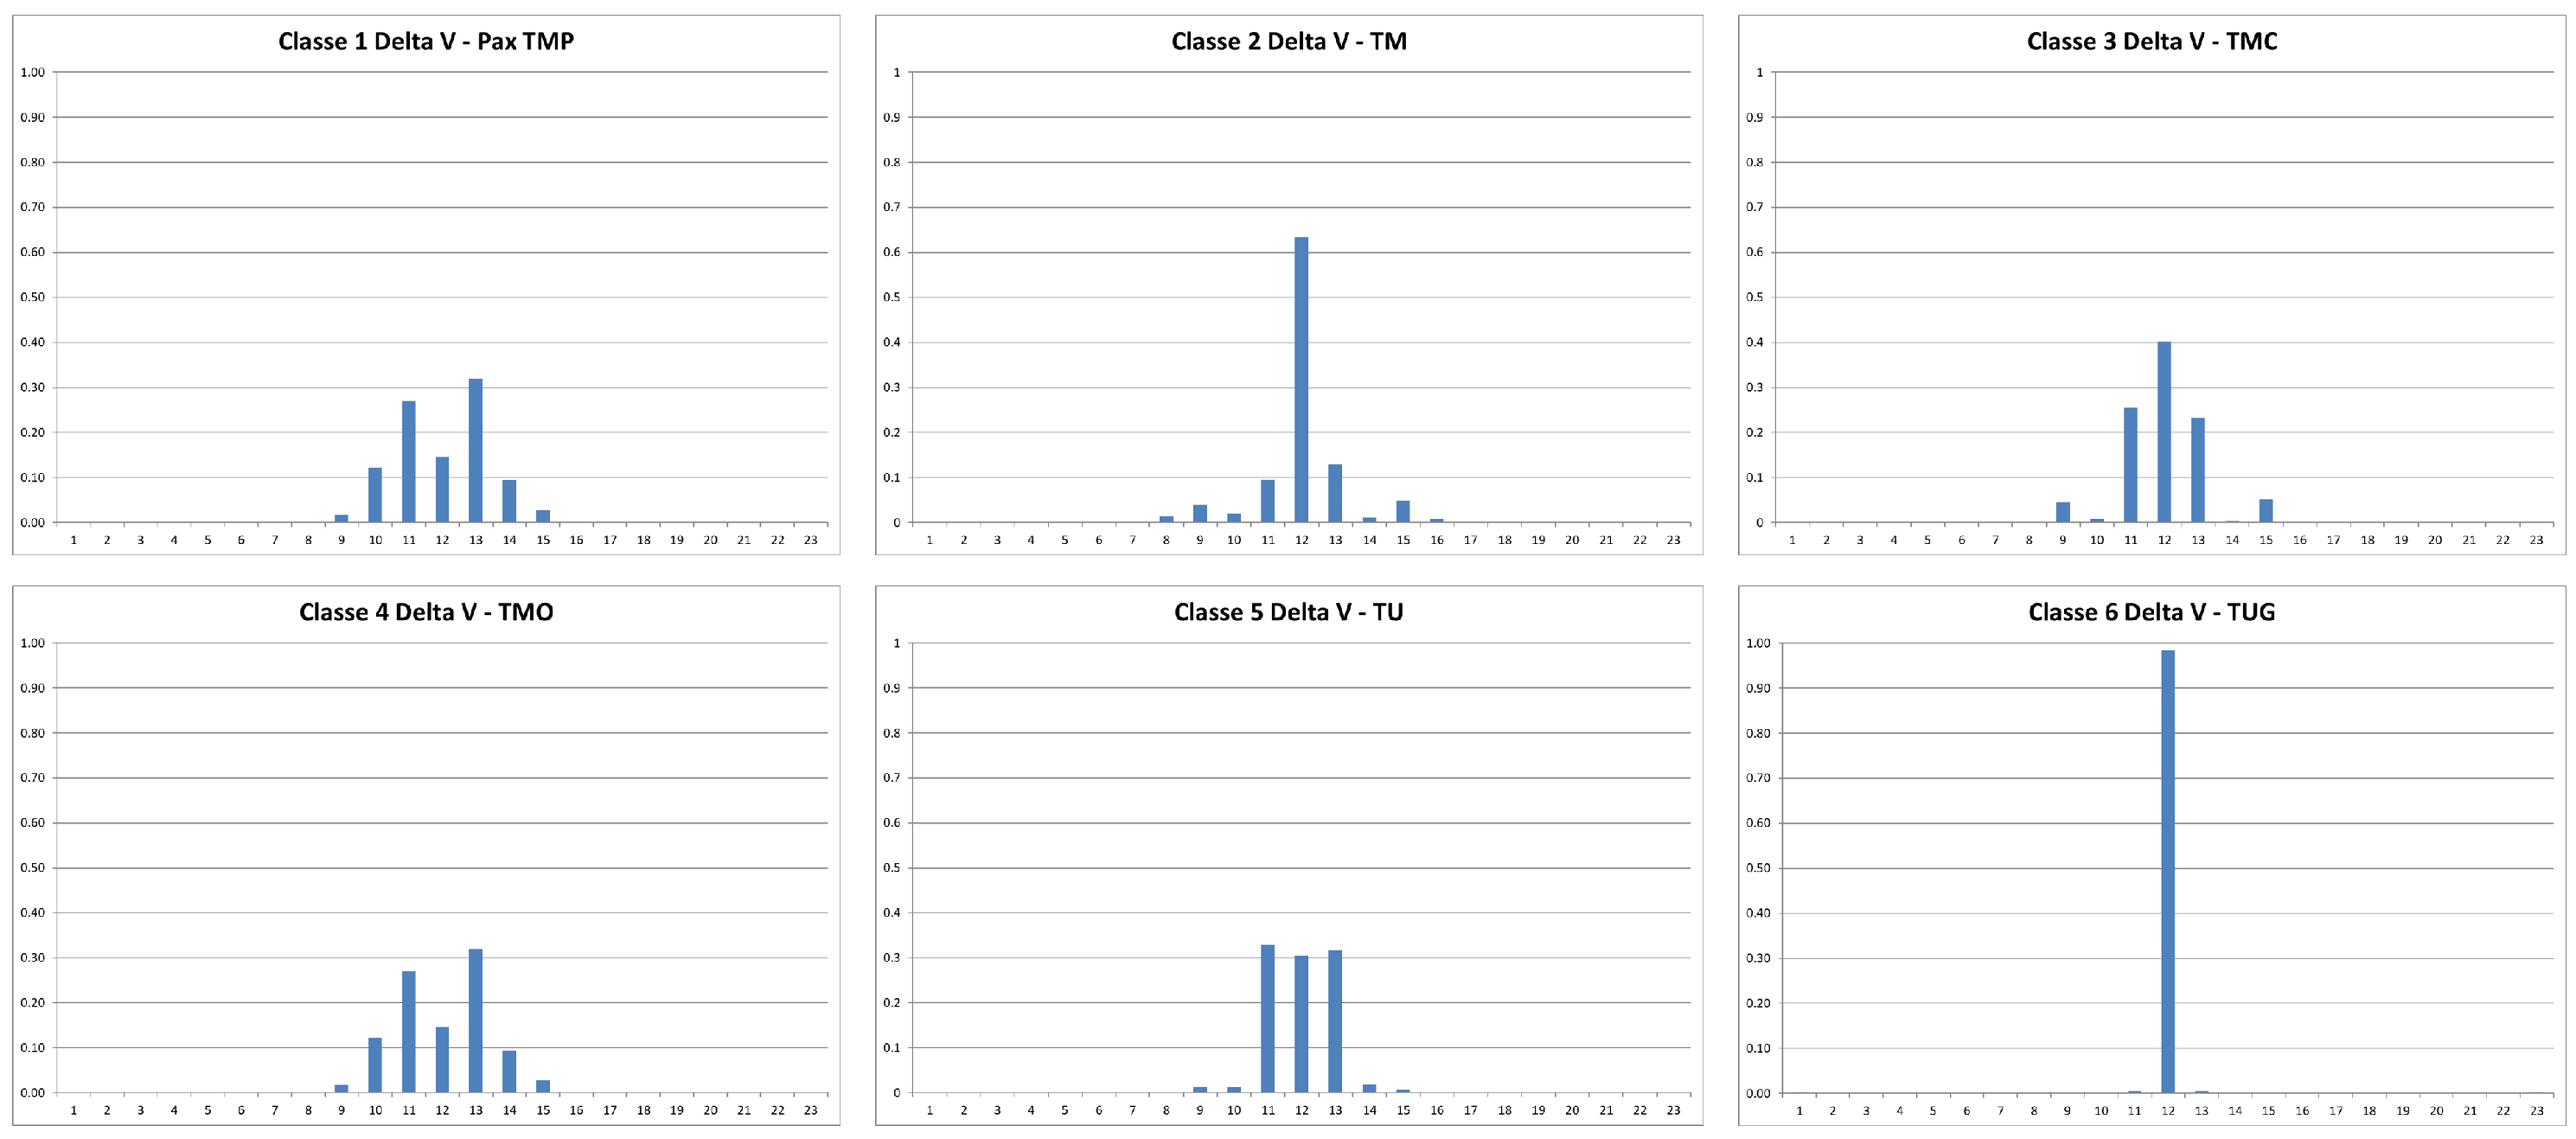
A new variable is introduced to the statistical profile of the route of each vessel: delta velocity.
Table 2 illustrates the variables that define the statistical profile of the route of each vessel, according to the pre-processing strategy adopted in experimentation no. 3.
For illustrative purposes, we provide the statistical profile of the velocity,
, of the change of route,
, and of the dynamic delta of the velocity,
, of a vessel randomly selected for each class. This is to give an idea of the type of input that the adaptive algorithms must manage to define an analysis model that allows the automatic classification of unknown vessels. See
Figure 2,
Figure 3 and
Figure 4.
Although
Figure 2,
Figure 3 and
Figure 4 represent examples of vessels randomly chosen in the database, it is evident that these new variables should provide a reliable portrait of the navigation style of each of the six types of vessels. In the following paragraphs, we will measure the accuracy and precision of this third pre-processing strategy.
2.3. A.III—Model Definition
To address the complexities in this classification problem, we propose a new approach, denoted as ’Take One Class at a Time’ (TOCAT). This classification strategy operates on two fundamental principles during the training/testing stage:
(a) Breakdown of a multinomial classification (1 of N) into N independent binary classifications (1 of 2). Each class is treated separately: all records of the focus class are assigned target 1 while all records belonging to other classes are assigned target 0. The advantage of this system is that even when faced with a high number of classes N, these are reduced to N binary classification processes. Therefore, instead of having a single process that must decide the class membership of a record to N possible classes, there will be N processes, each specialized in a single class, which must decide whether the record is of that class or not;
(b) Free identification of the best algorithm for each class. As each class is treated separately, each will be reviewed by multiple Machine Learning methods to select the type of algorithm and structure that obtains the best predictive result in testing. This procedure, which allows for the selection of a different algorithm for each class, can improve the overall performance of the system.
TOCAT, therefore, is not tied to a specific algorithm, but draws on a variety of algorithms to tackle individual bimodal classifications. At the end of the training/testing stage, each class will be associated with the algorithm that achieved the best result, as assessed by the values of Sensitivity and Specificity on the confusion matrix. Only the algorithm with the best performance will be used for the recall stage on new records.
The output of the recall stage of the TOCAT system, in which unclassified new input records are assigned a target by the N networks, is complex. Each network specialized in a single target is called to respond; thus, there may be conflicts in the assignments. This feature is an advantage when it is important to identify ambiguous records that need to be reported by the system. Therefore, using the TOCAT strategy, it is possible for each new pattern to be attributed a fuzzy membership (from 0 to 1) with each of the N Classes.
For the training phase, many adaptive algorithms are used (machine learning and artificial neural networks). The results of these algorithms were finally filtered by a neural meta-network [
9,
10], which significantly exceeded the results of the best basic algorithm. The different algorithms were implemented through two types of Software, accredited for scientific research: (a)
Supervised ANNs (version 27.5, Semeion, 1999–2017); (b)
Meta Net Multi Train (version 3.5, Semeion, 2010–2015).
For the experimental phase, a set of algorithms was utilized to explore and analyze the data. Some of the algorithms are commonly used in the literature (kNN [
11,
12], naive Bayes [
13,
14,
15,
16,
17], majority vote [
9,
10,
18]), while the remaining algorithms have been specifically developed by Semeion for pattern recognition. The objective was to compare the effectiveness and efficiency of the algorithms and determine which ones would yield the most accurate and reliable results: (a)
backpropagation (Bp) [
19,
20,
21]; (b)
deep learning (Deep) [
22,
23,
24]; (c)
adaptive vector quantization (AVQ) [
25,
26,
27,
28]; (d)
kNN [
11,
12]; (e)
meta Bayes (Mb) [
29]; (f)
Conic Net [
30]; (g)
Sine Net (Sn) [
31]; (h)
bimodal (Bm) [
32]; (i)
majority vote (Mv) [
9]; (j)
naive Bayes [
13,
14,
15,
16,
17]; (k)
supervised contractive map (SVCm) [
32]. The validation protocol used for all the algorithms is the training–testing protocol [
33,
34,
35] (
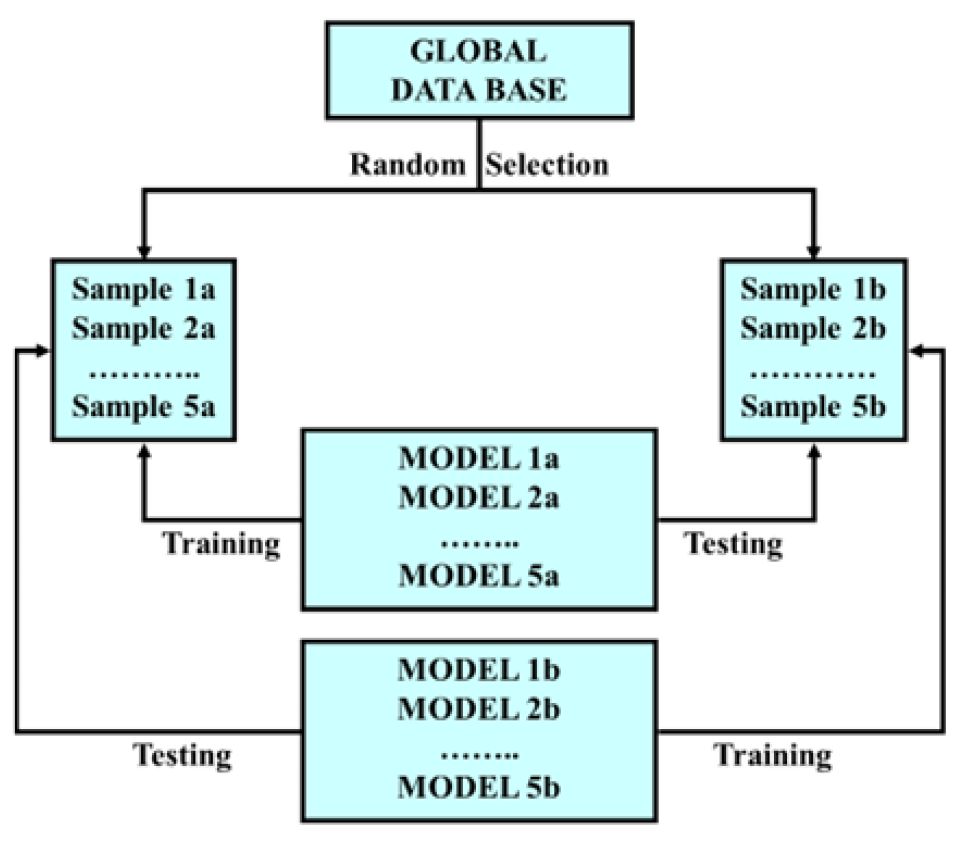
Figure 5: Validation protocol—5 × 2 CV (training–testing)).
In this experiment, three classification lines are used: (a) Classification 1 of 5: The attempt is to automatically classify each vessel in one of the five possible classes. In this specific case, class 2 (TM9) is excluded, as the results appear to be difficult to interpret and potentially confusing. This complexity arises from the indiscriminate inclusion of vastly different types of vessels within this class. (b) Classification 1 of 6: The attempt is to automatically classify each vessel in one of the six classes provided; (c) Classification “Take One Class at a Time” (TOCAT): Adaptive algorithms are trained to recognize when each vessel belongs or not to a specification of the six possible classes, and the operation is repeated by placing one class at a time in relation to all the others. This procedure generates six different datasets, each of which is subjected to two-class validation (focused class versus other classes).
3. Results
3.1. Exploratory Analysis
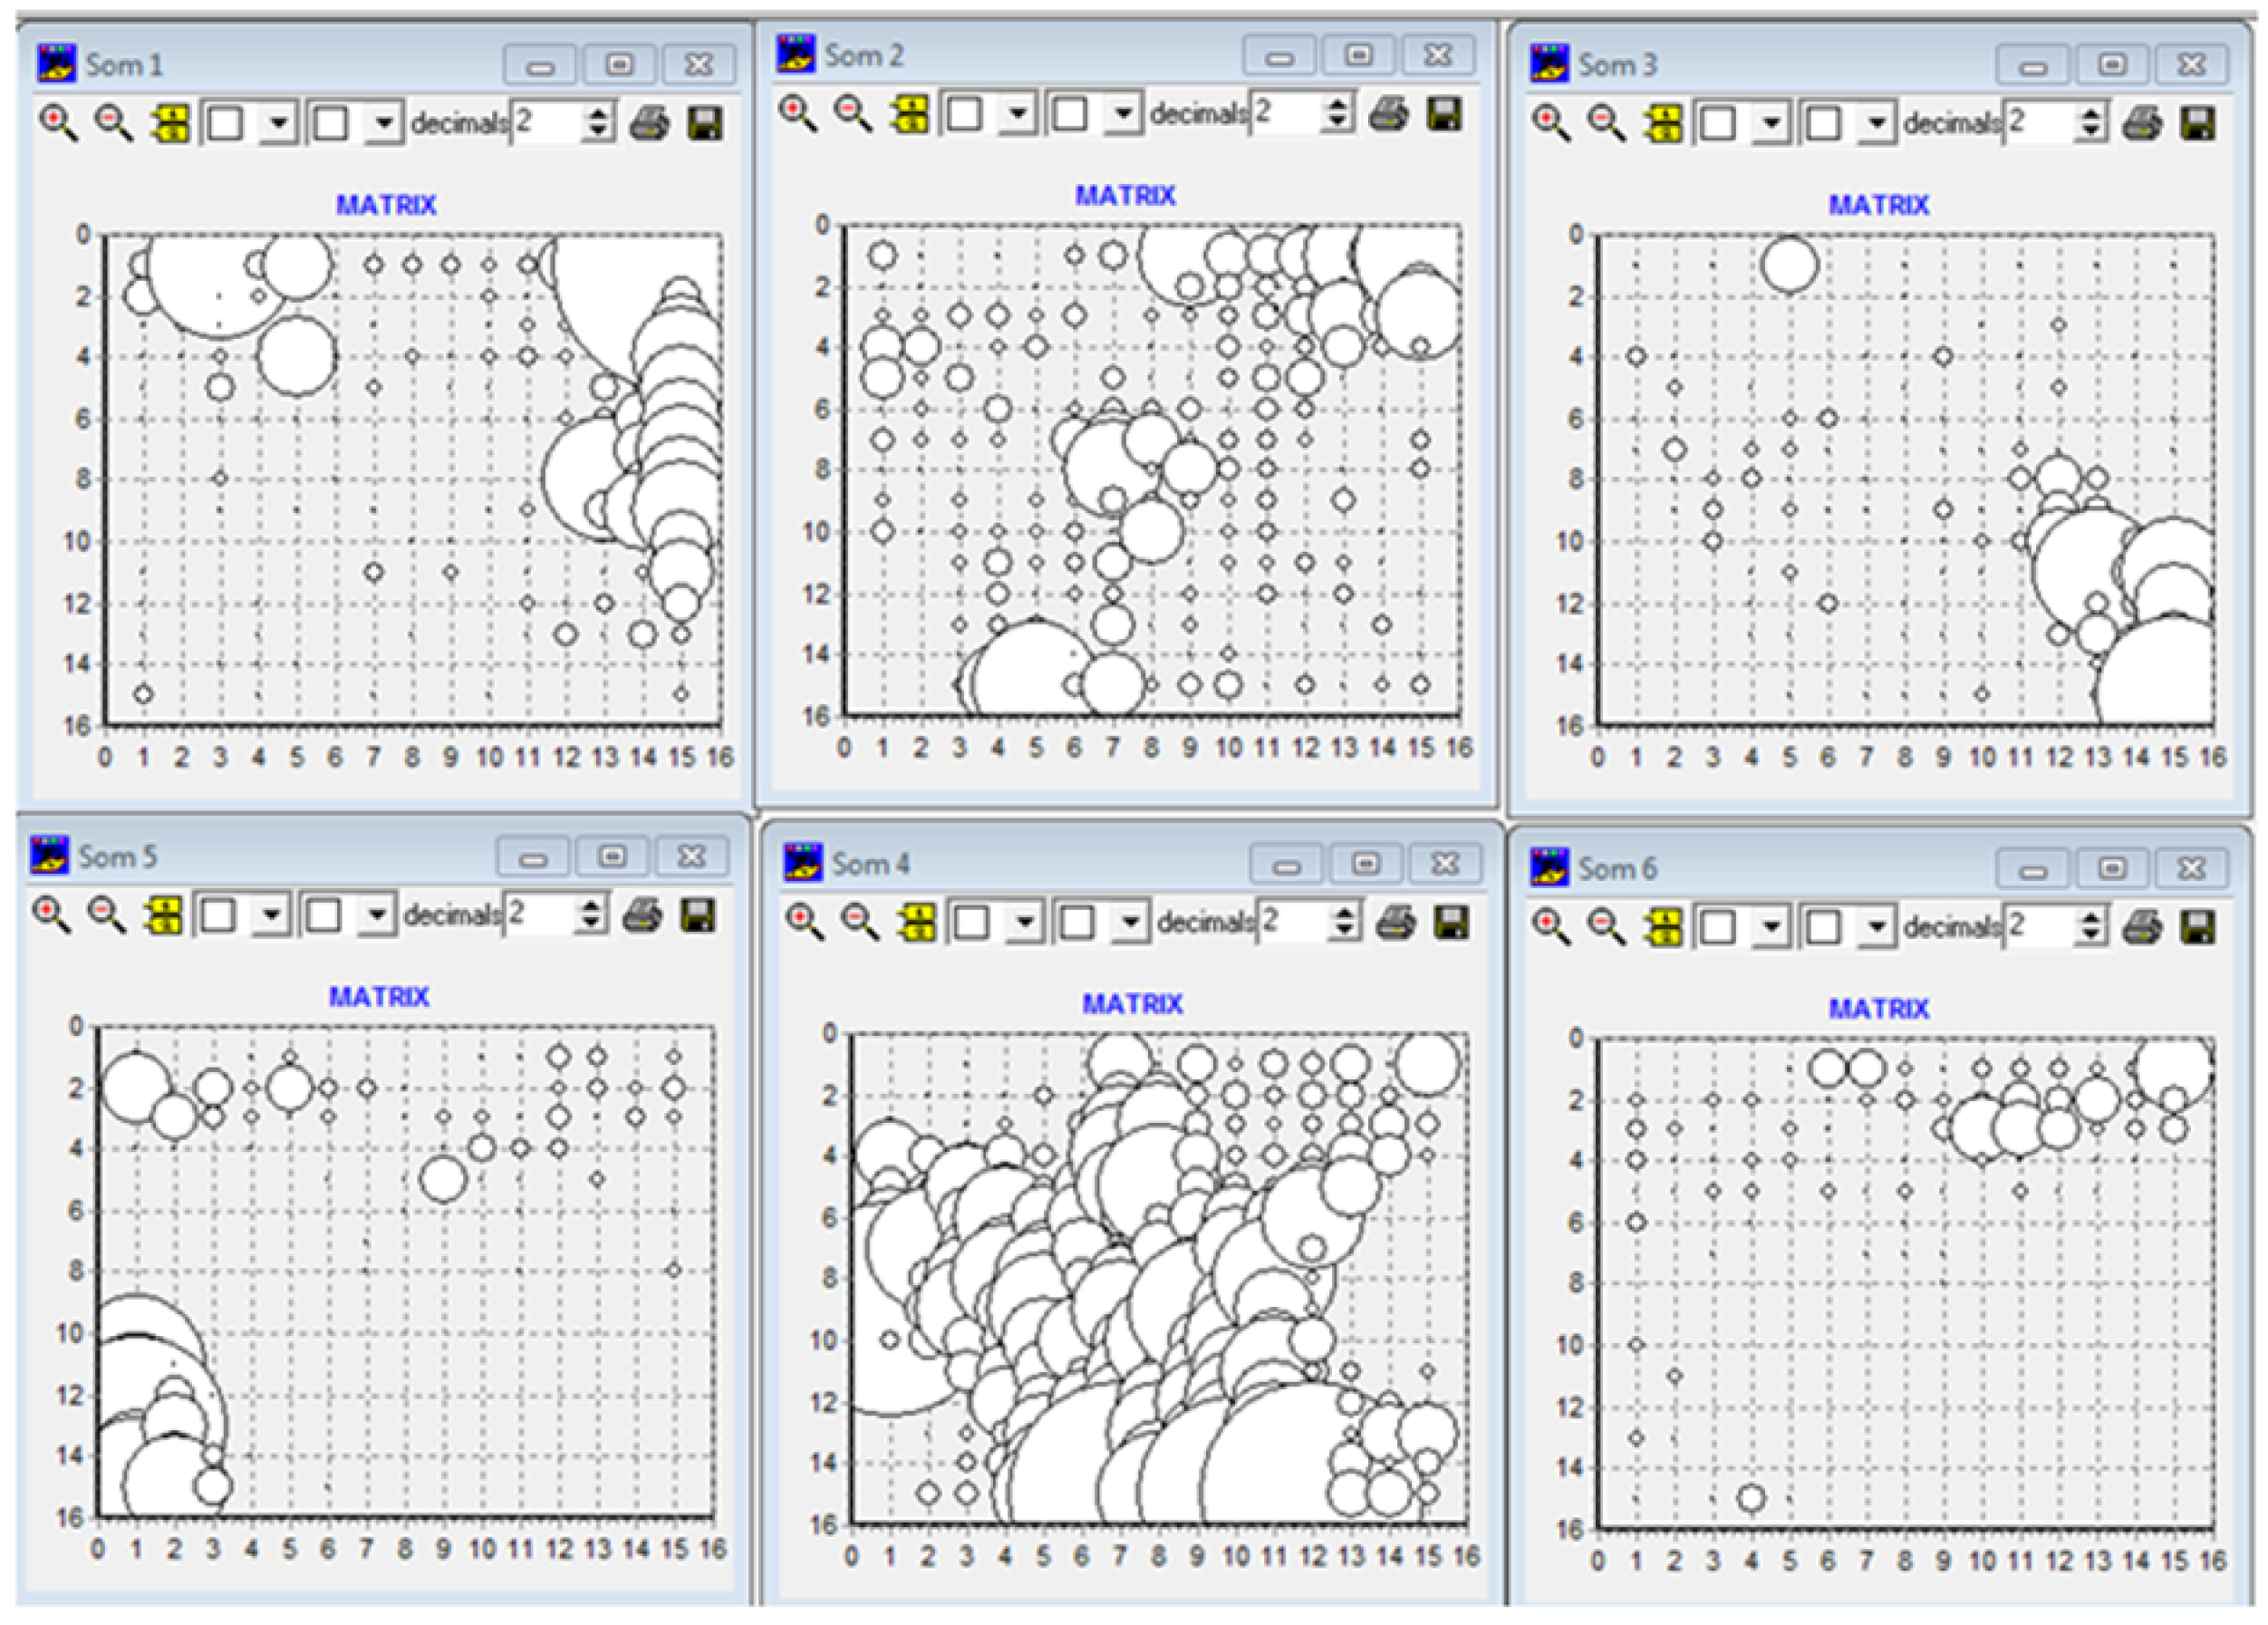
At this juncture, an unsupervised neural network is deployed once more to discern the extent to which our pre-processing step can spontaneously segregate the database into the six distinct vessel classes. A self-organizing map (SOM) [
28] is used for this purpose with a square grid of 15 × 15, capable of generating 225 codebooks, where each codebook represents a similar group of vessels;
Figure 6 shows the results of the SOM software.
Figure 6 illustrates a more defined spontaneous separation of vessels into the six targeted classes for classification, compared to the outputs produced by previous pre-processing strategies. Class 2 (TM) remains the most difficult to characterize and therefore to be separated from the others. In all cases, even with this pre-processing strategy, the definition of the classification model is very complex due to the notable non-linear separability of some classes.
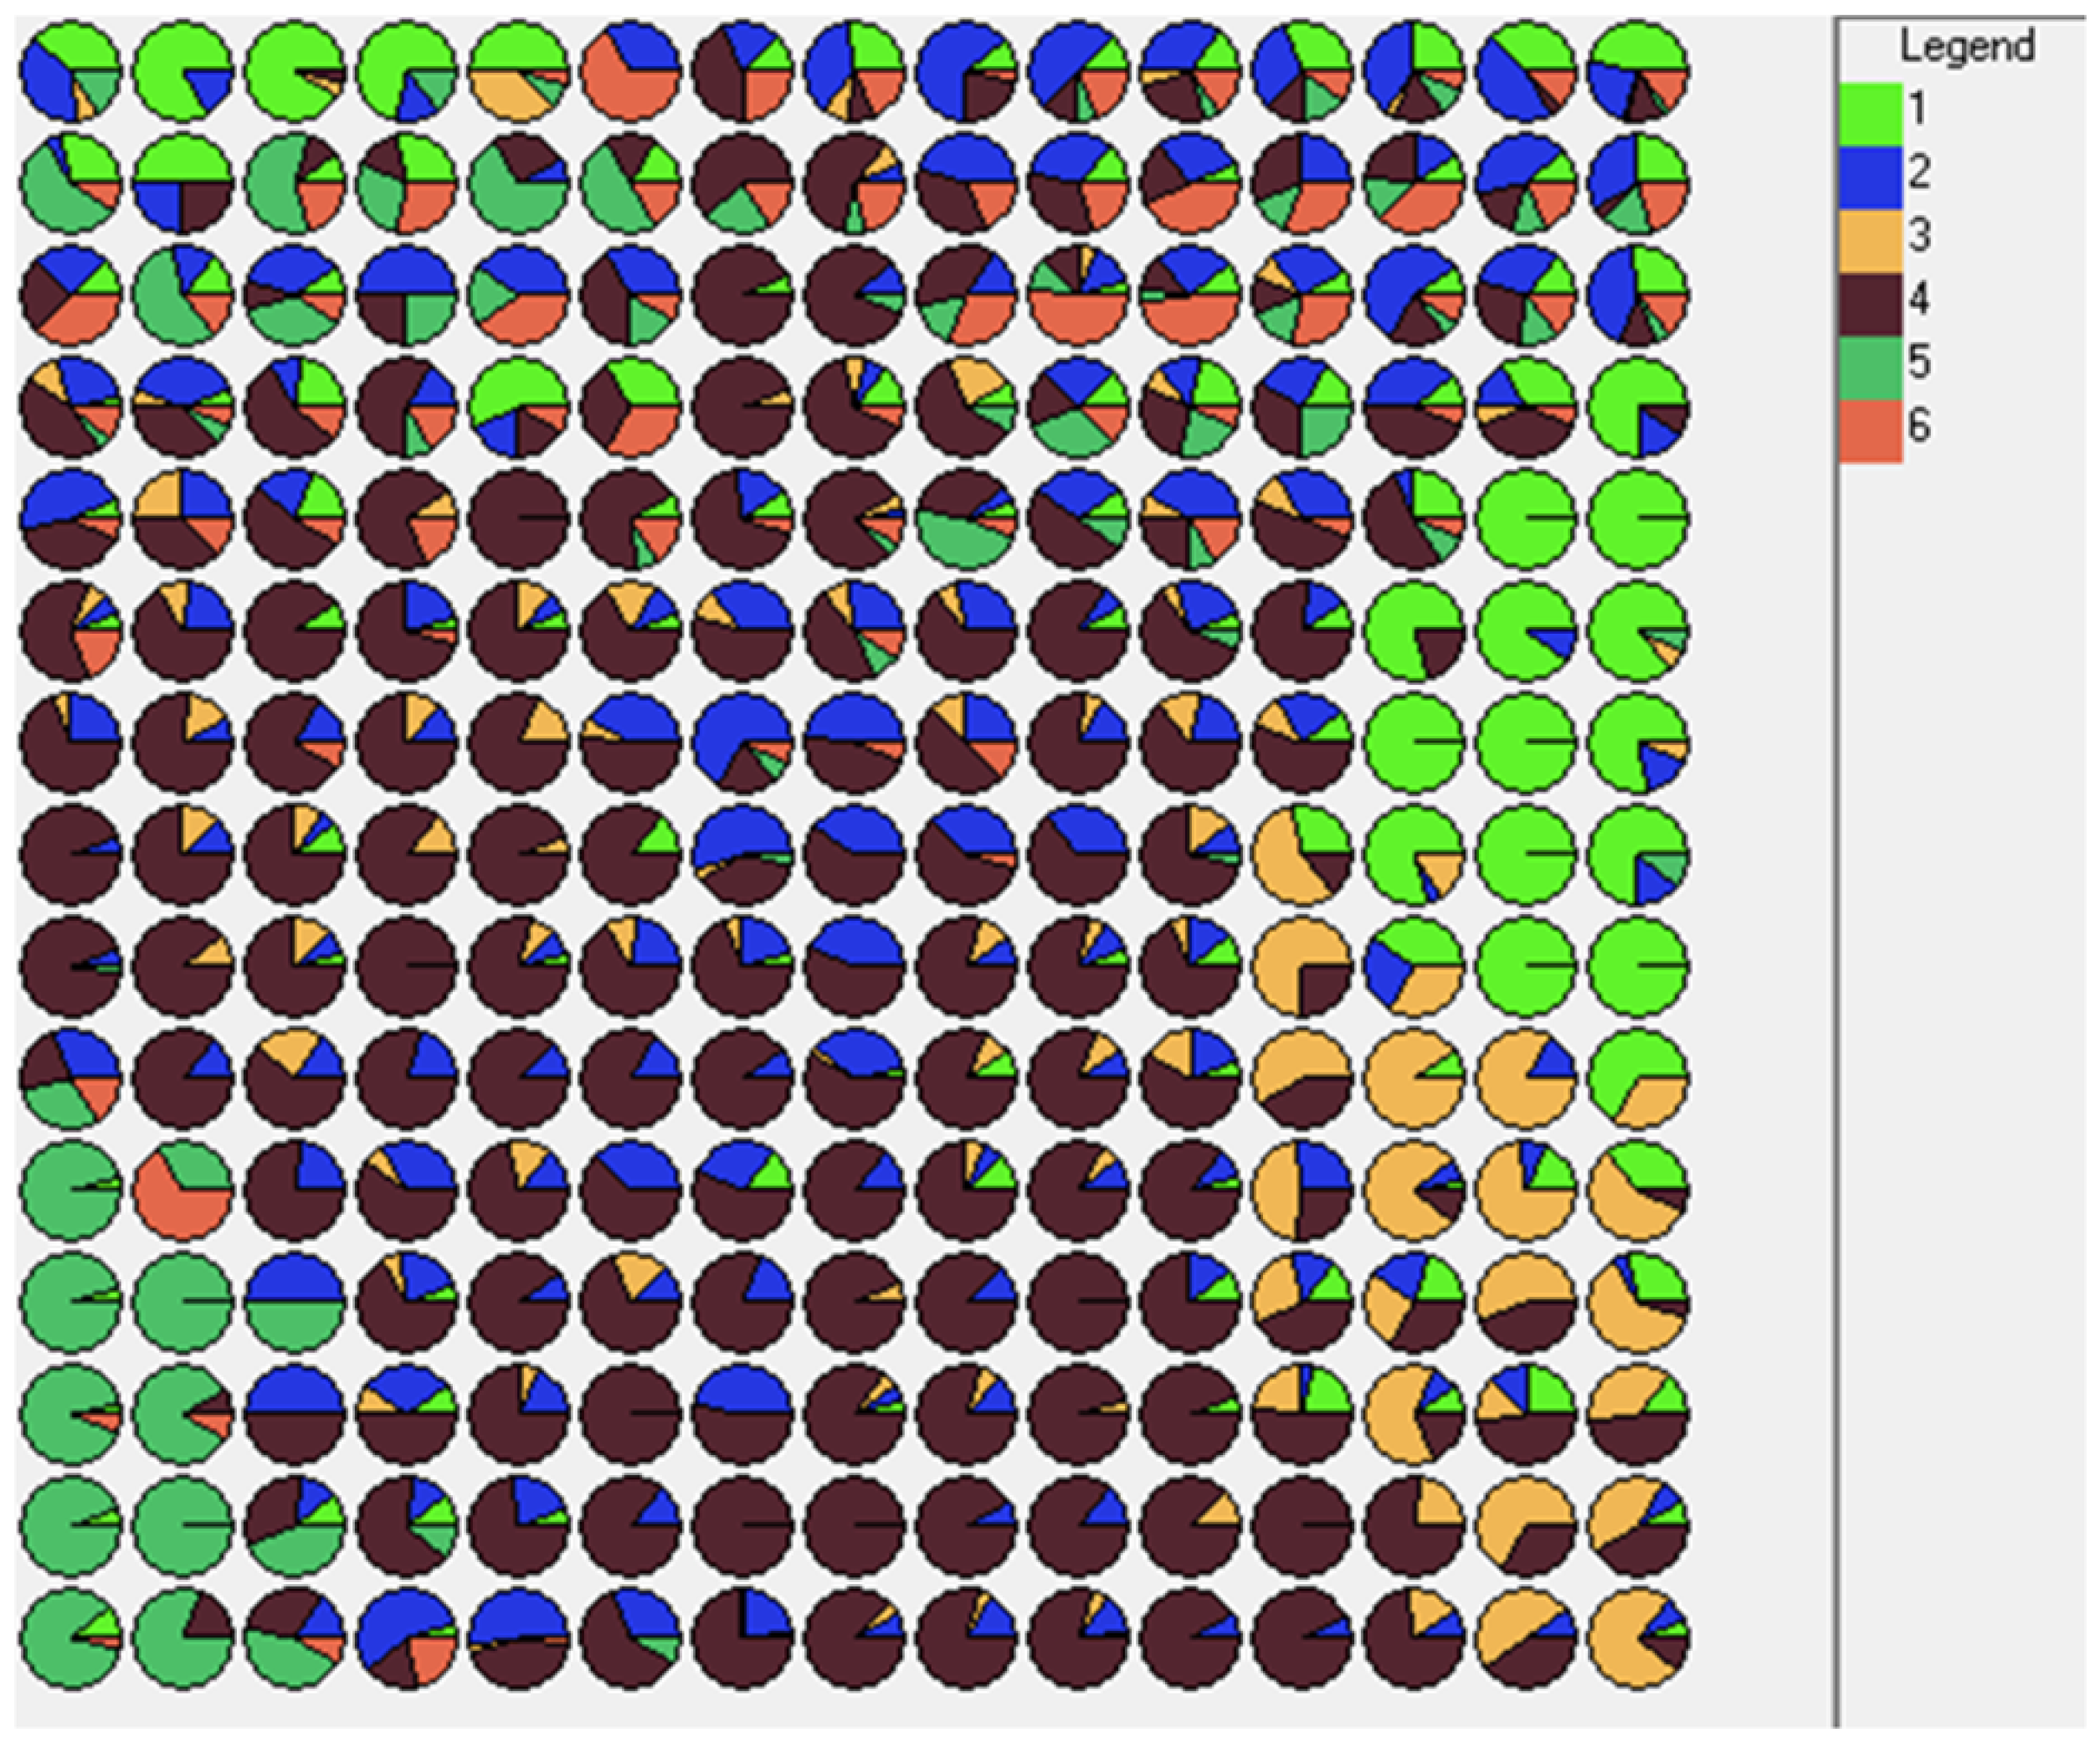
Figure 7 shows the projection grid of the SOM with the overlap percentage of vessels of different classes in each of the 225 codebook cells.
The results of the analysis using SOMs highlight the potential of the selected set of variables. Each class is distributed in specific areas of the map, even though the resulting overlaps between classes make it difficult to obtain an accurate classification system that can be used in operational mode.
3.2. Results Analysis
3.2.1. Classification with Five Classes
Table 3 shows the results of classifications one of five.
3.2.2. Classification with Six Classes
Table 4 shows the results obtained by repeating the experiment with all six classes. In this case, the use of the meta-network is ineffective.
The outcomes of this experiment hold merit academically, but their practical applicability remains limited.
3.2.3. Class Classification of TOCAT
In this experiment, we present results from the six one-of-two classifications (class vs. other classes) to determine the sensitivity and specificity for each classification, as detailed in (
Table 5,
Table 6,
Table 7,
Table 8,
Table 9 and
Table 10).
Table 11 summarizes, in an overview, the results of the best algorithms in each of the 6 classifications
4. Discussion
Significant findings have emerged. Firstly, the study highlighted the potential of an approach that involves transforming a sparse and incomplete dataset of vessel paths into a consistent set of features that could be universally applicable across all types of vessels, despite variations in the number of observations. While the individual techniques employed to convert vessel trajectories into fixed features were not new, the innovation lay in their combined application, resulting in the transformation of temporal flows into spatial features, derived from highly heterogeneous data.
The second significant result was the development of the TOCAT (take one class at a time) research design. While the TOCAT strategy itself is not entirely new, as it is already used in support vector machine algorithms [
36,
37] for multinomial classifications, our innovative application of this processing strategy was significant. Existing methods typically rely on the development of a singular, albeit sophisticated, convolutional or recurrent neural network, which shoulders the full responsibility of recognition. The TOCAT strategy, however, hinges on the concept of creating a diversified ecosystem of neural networks, varying both topologically and mathematically, which is not strictly reliant on gradient descent or decision trees. Each of these networks is adept at specializing in a statistical niche within the vessels’ trajectories.
By utilizing different artificial neural networks (ANNs) and machine learning techniques for distinct “one of two” classification tasks, we achieved diverse mathematical and topological representations for each ANN used. This diversity enhanced classification accuracy, as each “one of two” classification tasks could leverage a specific ANN suitable for recognizing a particular class of vessels. The efficacy of this mathematical “biodiversity” in improving the final results represents an important milestone in this work. In summary, the collective integration of small, distinct artificial systems outperformed a single large ANN attempting to comprehend the entire scope independently.
5. Conclusions
This paper proposes a novel approach to vessel classification, using the normalization of sparse and incomplete vessel trajectory data into a universal set of features, which is applicable despite varying observation numbers. Our model utilizes the TOCAT (take one class at a time) design, a strategy typically used in support vector machine algorithms, but uniquely applied in this study to individual ’one versus rest’ classification tasks using a variety of diverse artificial neural networks (ANNs). We derived distinct mathematical and topological representations from vessel trajectory data for each ’one versus rest’ classification task, leveraging the proven capabilities of specific ANNs for recognizing certain vessel classes. The findings, which show a mean accuracy of 83% in a six-class classification task, suggest that the collaborative employment of these specialized ANNs could potentially outperform a single, larger ANN assigned to the entire classification task. During the experiments, we also pinpointed several critical aspects tied to data processing: primarily, the need for statistical sampling of the AIS signals from each vessel’s trajectories. This method enables a robust estimation of vital parameters such as the vessel’s speed, deceleration, and acceleration. Furthermore, as anticipated, the analysis highlights the importance of avoiding the use of overly complex algorithms, especially when the number of input variables is limited and the samples have not been collected through robust sampling procedures. Future research endeavors may explore the scalability and generalizability of the proposed approaches and extend their applications to other domains beyond vessel recognition and comparisons with the most recent techniques existing in the field.
Author Contributions
Conceptualization, P.M.B.; Methodology, P.M.B., G.M., M.B. and R.P.; Software, P.M.B. and G.M.; Validation, P.M.B. and G.M.; Formal Analysis, P.M.B.; Investigation, P.M.B., G.M., M.B. and R.P.; Resources, G.R. and G.C.; Data Curation, P.M.B., G.M., G.C., M.B. and R.P.; Writing—Original Draft Preparation, P.M.B., G.M., G.C., M.B. and R.P.; Writing—Review and Editing, P.M.B., M.B. and R.P.; Visualization, P.M.B., G.M., M.B. and R.P.; Supervision, P.M.B., G.M., M.B. and R.P.; Project Administration, P.M.B. and M.B.; Funding, P.M.B. All authors have read and agreed to the published version of the manuscript.
Funding
This research received no external funding.
Data Availability Statement
The data are not publicly available due to legal agreements between the research institution and collaborating parties.
Conflicts of Interest
The authors declare no conflict of interest.
References
- Pallotta, G.; Horn, S.; Braca, P.; Bryan, K. Context-enhanced vessel prediction based on Ornstein-Uhlenbeck processes using historical AIS traffic patterns: Real-world experimental results. In Proceedings of the 17th International Conference on Information Fusion (FUSION), Salamanca, Spain, 7–10 July 2014; pp. 1–7. [Google Scholar]
- Pallotta, G.; Vespe, M.; Bryan, K. Vessel Pattern Knowledge Discovery from AIS Data: A Framework for Anomaly Detection and Route Prediction. Entropy 2013, 15, 2218–2245. [Google Scholar] [CrossRef]
- Teutsch, M.; Krüger, W. Classification of small boats in infrared images for maritime surveillance. In Proceedings of the 2010 International WaterSide Security Conference, Carrara, Italy, 3–5 November 2010; pp. 1–7, ISSN: 2166-1804. [Google Scholar] [CrossRef]
- Duan, H.; Ma, F.; Miao, L.; Zhang, C. A semi-supervised deep learning approach for vessel trajectory classification based on AIS data. Ocean. Coast. Manag. 2022, 218, 106015. [Google Scholar] [CrossRef]
- Breiman, L. Bagging predictors. Mach. Learn. 1996, 24, 123–140. [Google Scholar] [CrossRef]
- Breiman, L. Random Forests. Mach. Learn. 2001, 45, 5–32. [Google Scholar] [CrossRef]
- Zhong, H.; Song, X.; Yang, L. Vessel Classification from Space-based AIS Data Using Random Forest. In Proceedings of the 2019 5th International Conference on Big Data and Information Analytics (BigDIA), Kunming, China, 8–10 July 2019; pp. 9–12. [Google Scholar] [CrossRef]
- Guan, Y.; Zhang, J.; Zhang, X.; Li, Z.; Meng, J.; Liu, G.; Bao, M.; Cao, C. Identification of Fishing Vessel Types and Analysis of Seasonal Activities in the Northern South China Sea Based on AIS Data: A Case Study of 2018. Remote Sens. 2021, 13, 1952. [Google Scholar] [CrossRef]
- Kittler, J.; Hatef, M.; Duin, R.; Matas, J. On combining classifiers. IEEE Trans. Pattern Anal. Mach. Intell. 1998, 20, 226–239. [Google Scholar] [CrossRef]
- Kuncheva, L. Combining Pattern Classifiers: Methods and Algorithms: Second Edition; Wiley: Hoboken, NJ, USA, 2004; Volume 47. [Google Scholar] [CrossRef]
- Kowalski, B.R.; Bender, C.F. K-Nearest Neighbor Classification Rule (pattern recognition) applied to nuclear magnetic resonance spectral interpretation. Anal. Chem. 1972, 44, 1405–1411. [Google Scholar] [CrossRef]
- Aha, D.W.; Kibler, D.; Albert, M.K. Instance-based learning algorithms. Mach. Learn. 1991, 6, 37–66. [Google Scholar] [CrossRef]
- Friedman, N.; Geiger, D.; Goldszmidt, M. Bayesian Network Classifiers. Mach. Learn. 1997, 29, 131–163. [Google Scholar] [CrossRef]
- Watson, T.J. An empirical study of the naive Bayes classifier. In Proceedings of the IJCAI 2001 Workshop on Empirical Methods in Artificial Intelligence, Seattle, WA, USA, 4–10 August 2001. [Google Scholar]
- Zhang, H. The Optimality of Naive Bayes. In Proceedings of the Seventeenth International Florida Artificial Intelligence Research Society Conference, FLAIRS 2004, Miami Beach, FL, USA, 17–19 May 2004. [Google Scholar]
- Nielsen, S.H.; Nielsen, T.D. Adapting Bayes network structures to non-stationary domains. Int. J. Approx. Reason. 2008, 49, 379–397. [Google Scholar] [CrossRef]
- John, G.H.; Langley, P. Estimating continuous distributions in Bayesian classifiers. arXiv 2013, arXiv:1302.4964. [Google Scholar]
- Lam, L.; Suen, S. Application of majority voting to pattern recognition: An analysis of its behavior and performance. Appl. Major. Voting Pattern Recognit. Anal. Its Behav. Perform. 1997, 27, 553–568. [Google Scholar] [CrossRef]
- Rumelhart, D.E.; McClelland, J.L.; Group, P.R. Parallel Distributed Processing: Explorations in the Microstructure of Cognition: Foundations; The MIT Press: Cambridge, MA, USA, 1986. [Google Scholar] [CrossRef]
- Rumelhart, D.; Hinton, G.; Williams, R. Learning Internal Representations by Error Propagation. In Readings in Cognitive Science; Elsevier: Amsterdam, The Netherlands, 1988; pp. 399–421. [Google Scholar] [CrossRef]
- Lecun, Y. A Theoretical Framework for Back-Propagation. In Proceedings of the 1988 Connectionist Models Summer School, CMU, Pittsburg, PA; Morgan Kaufmann: Burlington, MA, USA, 1988; pp. 21–28. [Google Scholar]
- Bengio, Y.; Simard, P.; Frasconi, P. Learning long-term dependencies with gradient descent is difficult. IEEE Trans. Neural Netw. 1994, 5, 157–166. [Google Scholar] [CrossRef]
- Hinton, G.E.; Osindero, S.; Teh, Y.W. A fast learning algorithm for deep belief nets. Neural Comput. 2006, 18, 1527–1554. [Google Scholar] [CrossRef] [PubMed]
- Bengio, Y. Learning Deep Architectures for AI; Now Publishers, Inc.: Norwell, MA, USA, 2009; Volume 2, pp. 1–127. [Google Scholar] [CrossRef]
- Kohonen, T. Improved versions of learning vector quantization. In Proceedings of the 1990 IJCNN International Joint Conference on Neural Networks, San Diego, CA, USA, 17–21 June 1990; IEEE: Piscataway, NJ, USA; Volume 1, pp. 545–550. [Google Scholar] [CrossRef]
- Kosko, B. Neural Networks and Fuzzy Systems: A Dynamical Systems Approach to Machine Intelligence; Prentice Hall: Hoboken, NJ, USA, 1991. [Google Scholar]
- Kosko, B. Neural Networks for Signal Processing; Prentice Hall: Hoboken, NJ, USA, 1992. [Google Scholar]
- Kohonen, T. Learning Vector Quantization. In Self-Organizing Maps; Kohonen, T., Ed.; Springer Series in Information Sciences; Springer: Berlin/Heidelberg, Germany, 1995; pp. 175–189. [Google Scholar] [CrossRef]
- Buscema, M.; Tastle, W.J.; Terzi, S. Meta Net: A New Meta-Classifier Family. In Data Mining Applications Using Artificial Adaptive Systems; Springer: New York, NY, USA, 2013; pp. 141–182. [Google Scholar]
- Buscema, P.M.; Massini, G.; Fabrizi, M.; Breda, M.; Della Torre, F. The ANNS approach to DEM reconstruction. Comput. Intell. 2018, 34, 310–344. [Google Scholar] [CrossRef]
- Buscema, M.; Terzi, S.; Breda, M. Using sinusoidal modulated weights improve feed-forward neural network performances in classification and functional approximation problems. WSEAS Trans. Inf. Sci. Appl. 2006, 3, 885–893. [Google Scholar]
- Buscema, M.; Benzi, R. Quakes Prediction Using Highly Non Linear Systems and A Minimal Dataset. In Advanced Networks, Algorithms and Modeling for Earthquake Prediction; River Publishers: Aalborg, Denmark, 2011. [Google Scholar]
- Kohavi, R. A study of cross-validation and bootstrap for accuracy estimation and model selection. In Proceedings of the 14th International Joint Conference on Artificial Intelligence, Montreal, QC, Canada, 20–25 August 1995; Morgan Kaufmann Publishers Inc.: Burlington, MA, USA; Volume 2, pp. 1137–1143. [Google Scholar]
- Dietterich, T.G. Approximate statistical tests for comparing supervised classification learning algorithms. Neural Comput. 1998, 10, 1895–1923. [Google Scholar] [CrossRef]
- Arlot, S.; Celisse, A. A survey of cross-validation procedures for model selection. Statist. Surv. 2010, 4, 40–79. [Google Scholar] [CrossRef]
- Kecman, V. Learning and Soft Computing, Support Vector Machines, Neural Networks, and Fuzzy Logic Models; MIT Press: Cambridge, MA, USA, 2001. [Google Scholar]
- Keerthi, S.S.; Shevade, S.K.; Bhattacharyya, C.; Murthy, K.R.K. Improvements to Platt’s SMO Algorithm for SVM Classifier Design. Neural Comput. 2001, 13, 637–649. [Google Scholar] [CrossRef]
Figure 1.
Flowchart of the data-cleaning procedure. (1) Identifying and eliminating any data-formatting errors; (2) removing records with missing data; (3) discarding records with incorrect data (such as velocity exceeding 100 knots, positional data on land, etc.); (4) excluding all vessels for which the number of sequential detections is below a certain threshold (100 points); (5) excluding any vessels that appear in two different and distant parts of the world within a short time span.
Figure 2.
Statistical profile of the punctual velocity of 6 vessels randomly selected, each belonging to one of the 6 classes, with the goal of automatic classification.
Figure 2.
Statistical profile of the punctual velocity of 6 vessels randomly selected, each belonging to one of the 6 classes, with the goal of automatic classification.
Figure 3.
Statistical profile of the change of direction of route of 6 vessels randomly chosen, each belonging to 6 target classes used for automatic classification.
Figure 3.
Statistical profile of the change of direction of route of 6 vessels randomly chosen, each belonging to 6 target classes used for automatic classification.
Figure 4.
Statistical profile of the dynamic delta of the punctual velocity of 6 vessels randomly chosen, each belonging to the 6 target classes used for the automatic classification.
Figure 4.
Statistical profile of the dynamic delta of the punctual velocity of 6 vessels randomly chosen, each belonging to the 6 target classes used for the automatic classification.
Figure 5.
Validation protocol—5 × 2 CV (training–testing).
Figure 5.
Validation protocol—5 × 2 CV (training–testing).
Figure 6.
PAX-TMP = Som1; TM = Som2; TMC = Som3; TMO = Som4; TU = Som5; TUG = Som6.
Figure 6.
PAX-TMP = Som1; TM = Som2; TMC = Som3; TMO = Som4; TU = Som5; TUG = Som6.
Figure 7.
A 15x15 grid of the SOM with the overlap percentage in each cell of vessels belonging to different classes (PAX-TMP = 1; TM = 2; TMC = 3; TMO = 4; TU = 5; TUG = 6).
Figure 7.
A 15x15 grid of the SOM with the overlap percentage in each cell of vessels belonging to different classes (PAX-TMP = 1; TM = 2; TMC = 3; TMO = 4; TU = 5; TUG = 6).
Table 1.
Number of vessels belonging to each of the six classes, before and after data cleaning. The maximum, minimum, and average readings of each class and the standard deviation from the averages are also shown.
Table 1.
Number of vessels belonging to each of the six classes, before and after data cleaning. The maximum, minimum, and average readings of each class and the standard deviation from the averages are also shown.
| Data | PAX-TMP | TM | TMC | TMO | TU | TUG | TOT |
|---|
| No. Vessels | 871 | 1074 | 576 | 2857 | 849 | 303 | 6522 |
| No. Vessels (no. pts ≥ 100) | 502 | 634 | 323 | 1717 | 304 | 194 | 3669 |
| Min Route Distance | 103 | 101 | 101 | 101 | 100 | 100 | 100 |
| Max Route Distance | 4774 | 5315 | 3550 | 4813 | 3610 | 4985 | 4985 |
| No. Routes-avg | 1240.08 | 1143.85 | 873.88 | 950.60 | 570.01 | 1280.52 | ~ |
| No. Routes-std dev | 956.32 | 971.77 | 602.44 | 650.53 | 495.49 | 937.40 | ~ |
Table 2.
A total of 67 variables that will be used to rewrite the database of 3669 vessels.
Table 2.
A total of 67 variables that will be used to rewrite the database of 3669 vessels.
| ID | Variable Name | Code | Calculation | No. Intervals |
|---|
| 1 | Punctual velocity | | Available | 22 |
| 2 | Delta direction bow | | | 19 |
| 3 | Delta velocity | | | 23 |
| 4 | Global average velocity | | | 1 value |
| 5 | Global velocity variance | | | 1 value |
| 6 | Global velocity variance with | | | 1 value |
| Total variables | | | 67 |
Table 3.
Results of the classifications on 5 classes. Class 2 (TM) is excluded.
Table 3.
Results of the classifications on 5 classes. Class 2 (TM) is excluded.
| Adaptive Algorithms | PAX-TMP | TMC | TMO | TU | TUG | A.Mean | W.Mean | Error | SW |
|---|
| Mb | 0.7602 | 0.6757 | 0.9468 | 0.8593 | 0.6591 | 0.7802 | 0.8622 | 193 | Sem. no. 55 |
| Mv | 0.6878 | 0.6622 | 0.885 | 0.837 | 0.7614 | 0.7667 | 0.818 | 255 | Sem. no. 55 |
| DeepSn | 0.6742 | 0.6554 | 0.8702 | 0.8148 | 0.7727 | 0.7575 | 0.8051 | 273 | Sem. no. 12 |
| kNN_N1 | 0.6471 | 0.7365 | 0.9345 | 0.8667 | 0.5682 | 0.7506 | 0.8387 | 226 | Sem. no. 12 |
| DeepBp | 0.6109 | 0.6959 | 0.8307 | 0.7852 | 0.8295 | 0.7504 | 0.7773 | 312 | Sem. no. 12 |
| DeepBm | 0.7376 | 0.6351 | 0.8863 | 0.8222 | 0.6591 | 0.7481 | 0.8158 | 258 | Sem. no. 12 |
| K-CM | 0.6471 | 0.723 | 0.9333 | 0.8593 | 0.5682 | 0.7461 | 0.8358 | 230 | Sem. no. 12 |
| DeepConic | 0.6968 | 0.6216 | 0.8764 | 0.837 | 0.6818 | 0.7427 | 0.8051 | 273 | Sem. no. 12 |
| Bm | 0.6968 | 0.6892 | 0.8591 | 0.8222 | 0.6364 | 0.7407 | 0.798 | 283 | Sem. no. 12 |
| Sn | 0.6516 | 0.7095 | 0.8739 | 0.8667 | 0.5909 | 0.7385 | 0.803 | 276 | Sem. no. 12 |
| Conic | 0.6561 | 0.6081 | 0.8826 | 0.8519 | 0.6932 | 0.7384 | 0.803 | 276 | Sem. no. 12 |
| Bp | 0.7104 | 0.7162 | 0.8467 | 0.8148 | 0.5909 | 0.7358 | 0.7923 | 291 | Sem. no. 12 |
Table 4.
Results of the classification on 6 classes.
Table 4.
Results of the classification on 6 classes.
| Adaptive Algorithms | PAX-TMP | TM | TMC | TMO | TU | TUG | A.Mean | W.Mean | Error | SW |
|---|
| kNN_1 | 63.89% | 50.95% | 75.51% | 86.79% | 80.95% | 42.16% | 66.71% | 73.45% | 481 | Sem. no. 12 |
| Bm | 71.43% | 21.84% | 67.35% | 84.91% | 78.91% | 55.88% | 63.39% | 68.49% | 571 | Sem. no. 12 |
| Conic | 68.65% | 38.61% | 67.35% | 81.72% | 71.43% | 45.10% | 62.14% | 68.32% | 574 | Sem. no. 12 |
| DeepBp | 71.83% | 37.97% | 61.90% | 76.53% | 79.59% | 34.31% | 60.36% | 65.84% | 619 | Sem. no. 12 |
| SVCm | 71.83% | 27.53% | 63.95% | 83.96% | 72.79% | 41.18% | 60.21% | 67.49% | 589 | Sem. no. 12 |
| DeepConic | 59.52% | 37.34% | 63.95% | 77.48% | 71.43% | 42.16% | 58.65% | 64.40% | 645 | Sem. no. 12 |
| AVQ | 50.00% | 33.86% | 71.43% | 81.72% | 74.83% | 30.39% | 57.04% | 64.68% | 640 | Sem. no. 12 |
| Naive Bayes | 11.11% | 0.32% | 41.50% | 75.83% | 0.68% | 97.06% | 37.75% | 45.97% | 979 | Sem. no. 12 |
Table 5.
Classification of Class 1: PAX-TMP.
Table 5.
Classification of Class 1: PAX-TMP.
| ANN | Class1 | Others | A.Mean | W.Mean | Errors |
|---|
| Conic(C1) | 81.12% | 91.03% | 86.08% | 89.65% | 185 |
| DeepConic(C1) | 80.32% | 91.61% | 85.97% | 90.04% | 178 |
| DeepBm(C1) | 80.32% | 91.61% | 85.97% | 90.04% | 178 |
| FFBp(C1) | 79.92% | 90.57% | 85.25% | 89.09% | 195 |
| DeepBp(C1) | 78.71% | 93.50% | 86.11% | 91.44% | 153 |
| DeepSn(C1) | 76.31% | 92.65% | 84.48% | 90.37% | 172 |
| kNN(C1) | 74.30% | 95.77% | 85.04% | 92.78% | 129 |
Table 6.
Classification of Class 2: PAX-TM.
Table 6.
Classification of Class 2: PAX-TM.
| ANN | Class1 | Others | A.Mean | W.Mean | Errors |
|---|
| Conic(C2) | 72.03% | 70.01% | 71.02% | 70.35% | 539 |
| DeepConic(C2) | 68.81% | 70.74% | 69.77% | 70.41% | 538 |
| DeepBp(C2) | 64.95% | 75.71% | 70.33% | 73.87% | 475 |
| FFBm(C2) | 62.70% | 76.05% | 69.37% | 73.76% | 477 |
| DeepBm(C2) | 62.06% | 77.24% | 69.65% | 74.64% | 461 |
| kNN(C2) | 58.52% | 93.56% | 76.04% | 87.57% | 226 |
Table 7.
Classification of Class 3: TMC.
Table 7.
Classification of Class 3: TMC.
| ANN | Class1 | Others | A.Mean | W.Mean | Errors |
|---|
| Deep_Conic(C3) | 76.36% | 88.70% | 82.53% | 87.57% | 223 |
| FFBm(C3) | 75.76% | 90.67% | 83.21% | 89.30% | 192 |
| Conic(C3) | 73.94% | 93.43% | 83.69% | 91.64% | 150 |
| Conic(C3) | 72.73% | 93.25% | 82.99% | 91.36% | 155 |
| DeepBp(C3) | 71.52% | 92.69% | 82.11% | 90.75% | 166 |
| kNN(C3) | 70.30% | 98.16% | 84.23% | 95.60% | 79 |
Table 8.
Classification of Class 4: TMO.
Table 8.
Classification of Class 4: TMO.
| ANN | Class1 | Others | A.Mean | W.Mean | Errors |
|---|
| kNN(C4) | 88.71% | 87.34% | 88.03% | 87.99% | 218 |
| FFBp(C4) | 84.52% | 82.74% | 83.63% | 83.58% | 298 |
| DeepBm(C4) | 85.10% | 81.17% | 83.14% | 83.03% | 308 |
| DeepBp(C4) | 84.52% | 80.65% | 82.58% | 82.48% | 318 |
Table 9.
Classification of Class 5: TU.
Table 9.
Classification of Class 5: TU.
| ANN | Class1 | Others | A.Mean | W.Mean | Errors |
|---|
| DeepBm(C5) | 88.00% | 88.11% | 88.06% | 88.10% | 207 |
| DeepBp(C5) | 81.33% | 93.90% | 87.62% | 92.82% | 125 |
| Conic(C5) | 80.67% | 96.42% | 88.54% | 95.06% | 86 |
| kNN(C5) | 80.00% | 98.93% | 89.47% | 97.30% | 47 |
| FFBp(C5) | 80.00% | 97.67% | 88.84% | 96.15% | 67 |
| DeepConic(C5) | 79.33% | 96.92% | 88.13% | 95.40% | 80 |
Table 10.
Classification of Class 6: TUG.
Table 10.
Classification of Class 6: TUG.
| ANN | Class1 | Others | A.Mean | W.Mean | Errors |
|---|
| Conic(C6) | 88.24% | 80.51% | 84.37% | 80.95% | 346 |
| DeepBm(C6) | 84.31% | 76.14% | 80.23% | 76.60% | 425 |
| DeepConic(C6) | 63.73% | 91.66% | 77.69% | 90.09% | 180 |
| DeepBp(C6) | 65.69% | 89.26% | 77.48% | 87.94% | 219 |
| FFBp(C6) | 65.69% | 88.62% | 77.15% | 87.33% | 230 |
| kNN(C6) | 53.92% | 98.72% | 76.32% | 96.20% | 69 |
Table 11.
The best algorithms of the 6 classifications with the TOCAT procedure.
Table 11.
The best algorithms of the 6 classifications with the TOCAT procedure.
| Classes | Algorithm | Sensibility | Specificity | A.Mean | W.Mean | Errors |
|---|
| Class 1 | PAX-TMP | Conic | 81.12% | 91.03% | 86.08% | 89.65% | 185 |
| Class 2 | TM | Conic | 72.03% | 70.01% | 71.02% | 70.35% | 539 |
| Class 3 | TMC | DeepConic | 76.36% | 88.70% | 82.53% | 87.57% | 223 |
| Class 4 | TMO | kNN_1 | 88.71% | 87.34% | 88.03% | 87.99% | 218 |
| Class 5 | TU | DeepBm | 88.00% | 88.11% | 88.06% | 88.10% | 207 |
| Class 6 | TUG | Conic | 88.24% | 80.51% | 84.37% | 80.95% | 346 |
| Average × Class | 82.41% | 84.28% | 83.35% | 84.10% | 286.33 |
| Disclaimer/Publisher’s Note: The statements, opinions and data contained in all publications are solely those of the individual author(s) and contributor(s) and not of MDPI and/or the editor(s). MDPI and/or the editor(s) disclaim responsibility for any injury to people or property resulting from any ideas, methods, instructions or products referred to in the content. |
© 2023 by the authors. Licensee MDPI, Basel, Switzerland. This article is an open access article distributed under the terms and conditions of the Creative Commons Attribution (CC BY) license (https://creativecommons.org/licenses/by/4.0/).


 ,
, 


