

Clinical Validation of a New Enhanced Stent Imaging Method

 ,
, 
Abstract
1. Introduction
2. Materials and Methods
2.1. Study Design
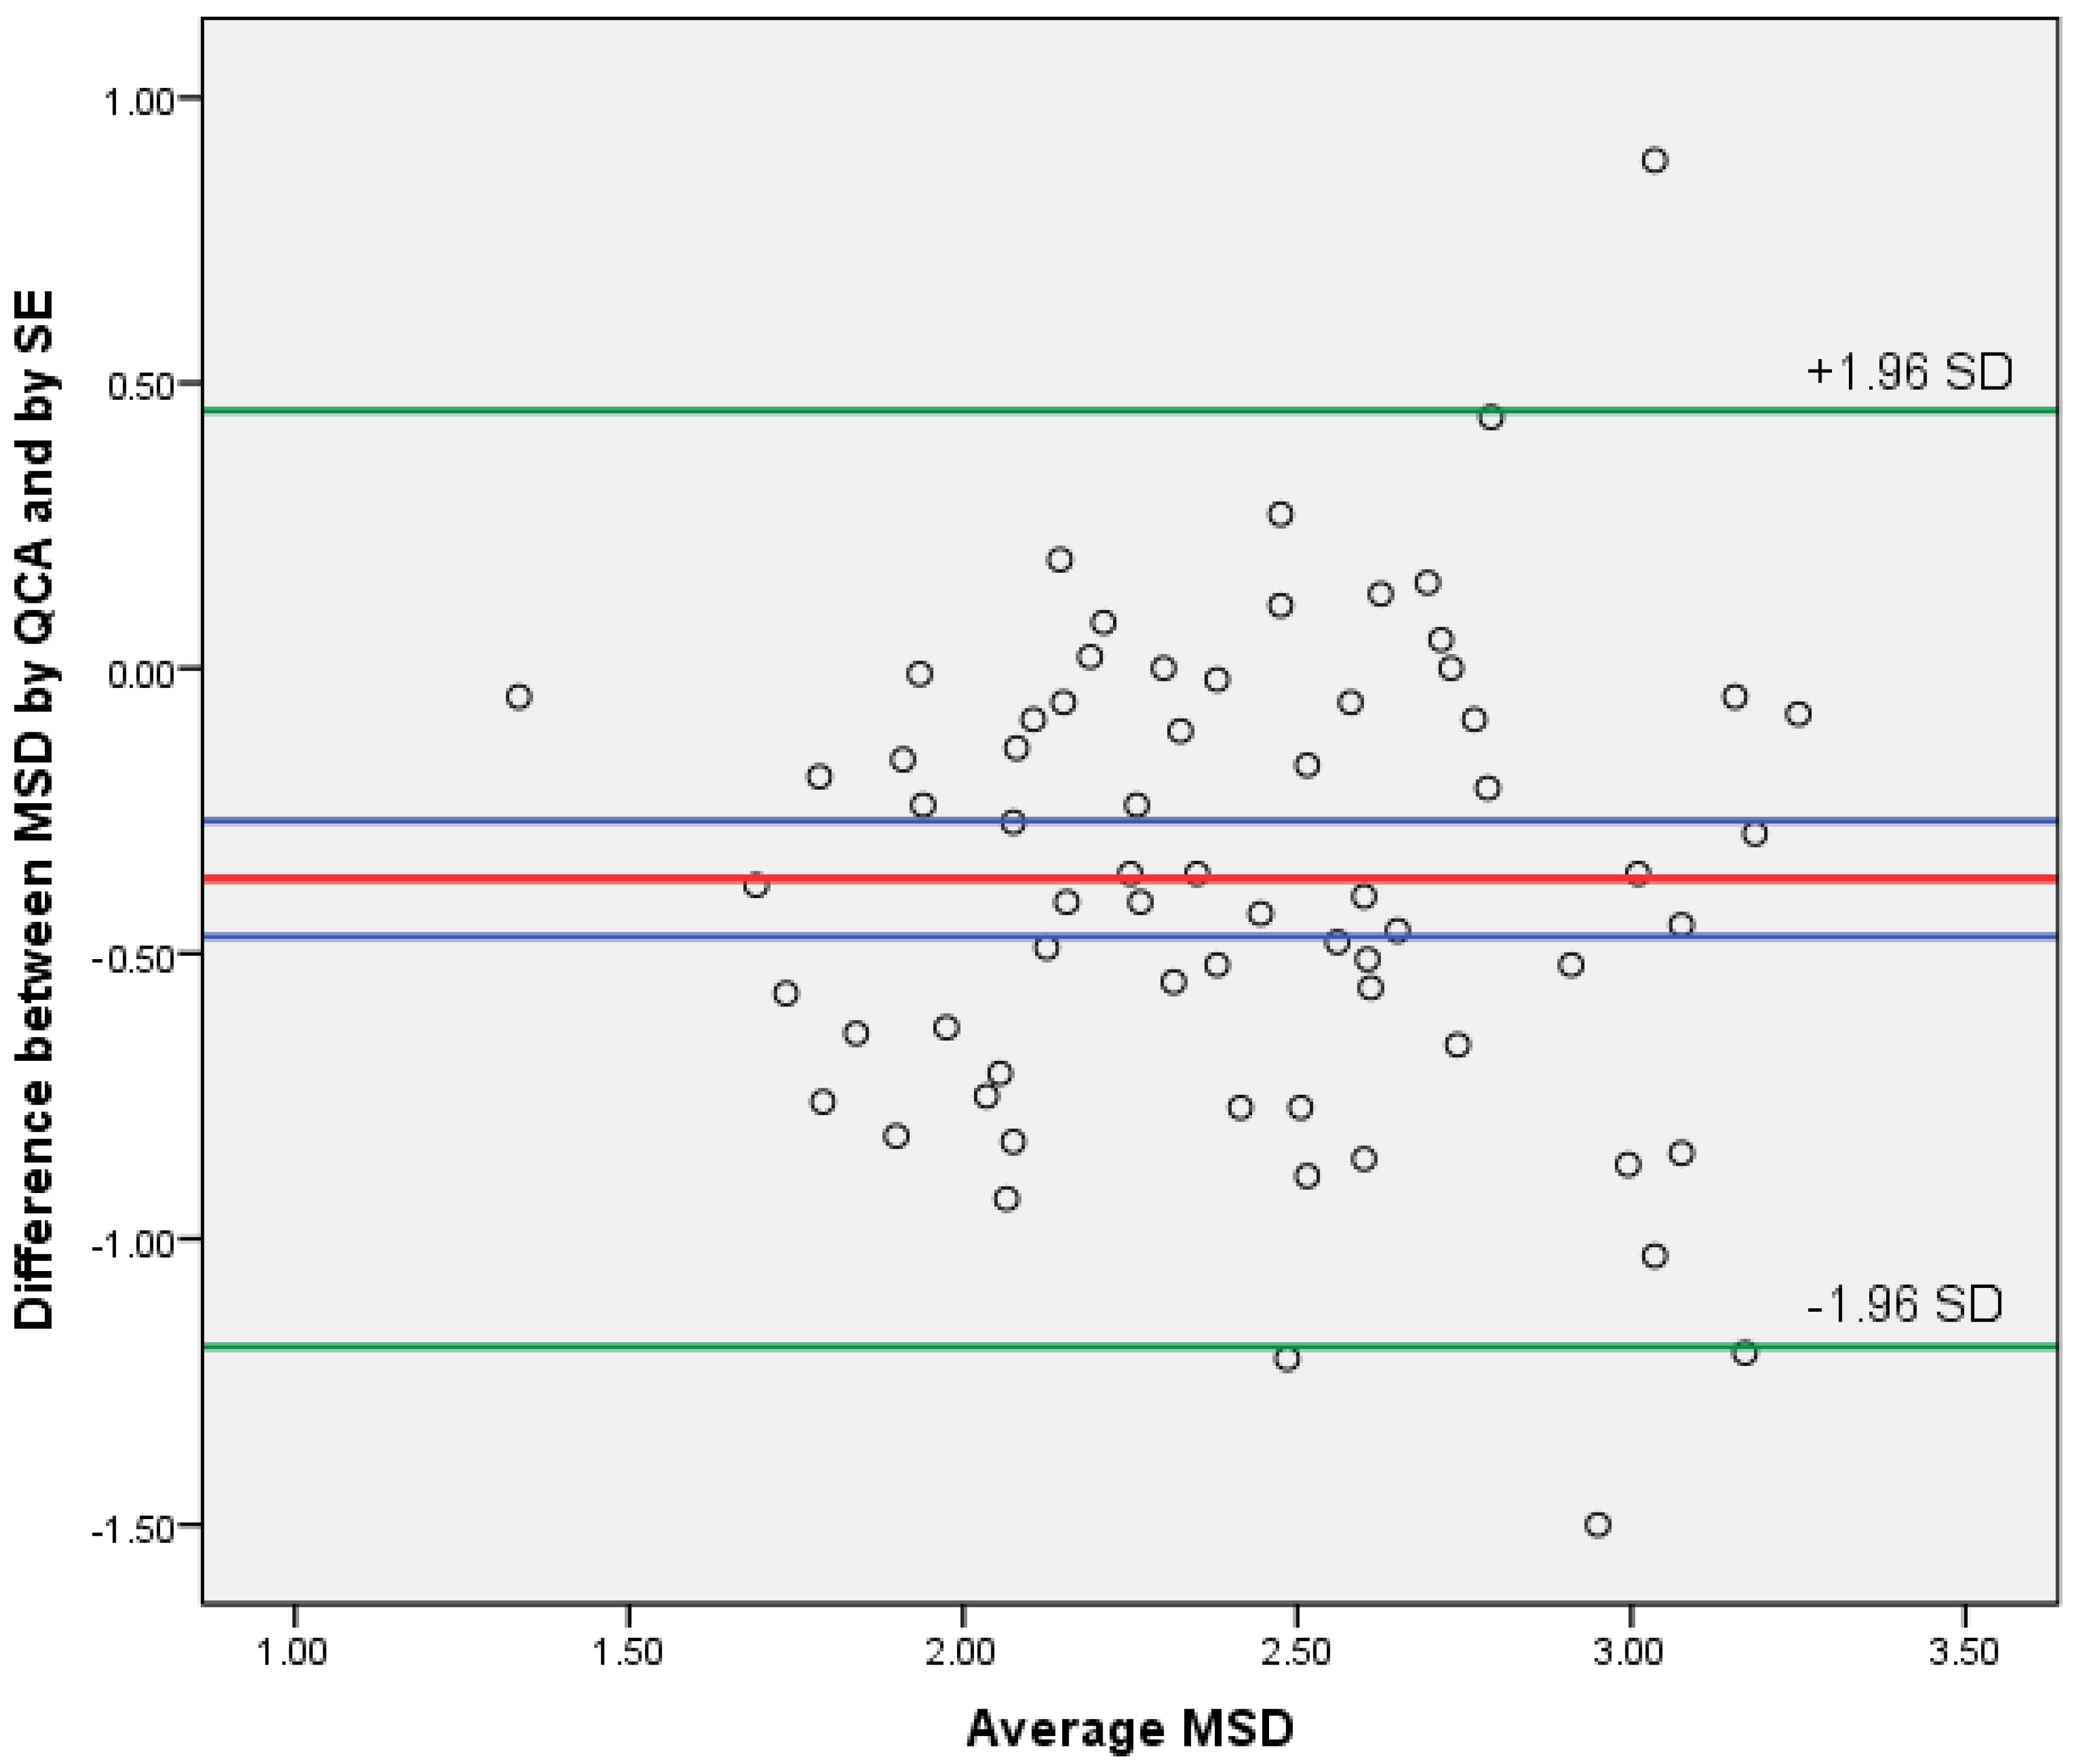
2.2. Statistical Analysis
3. Results
3.1. Patient and Lesion Characteristics
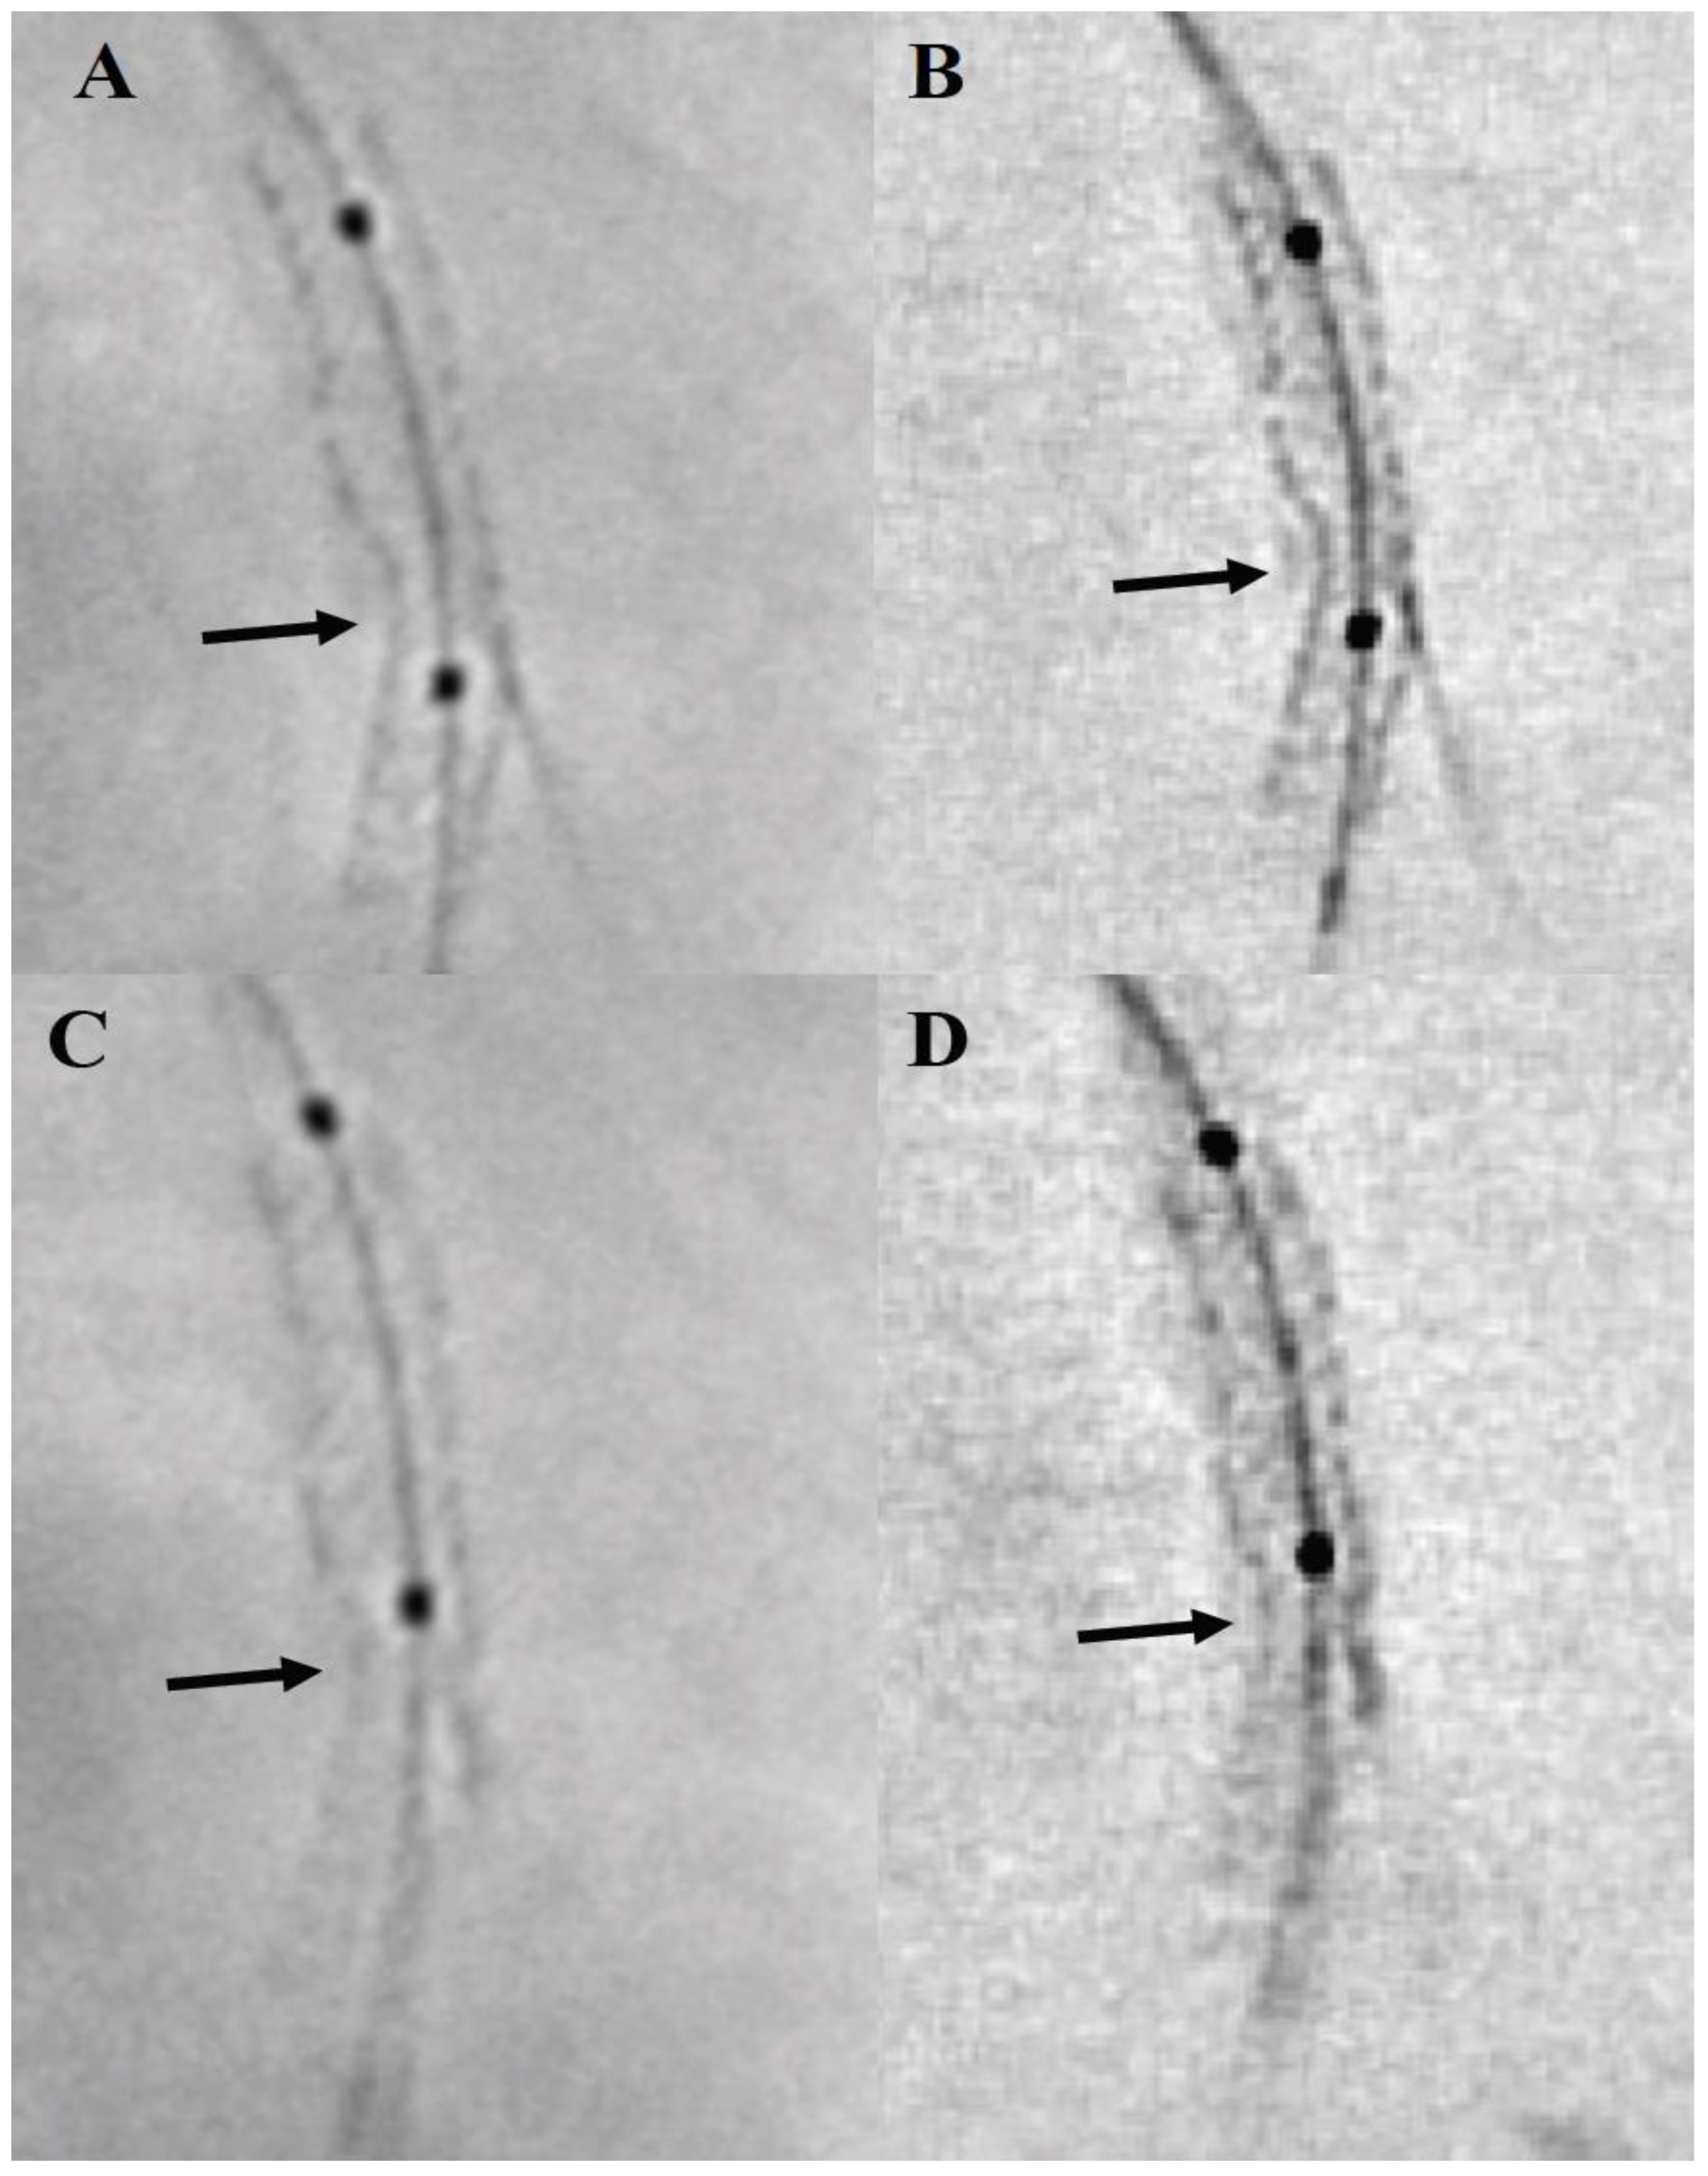
3.1.1. Qualitative Analysis
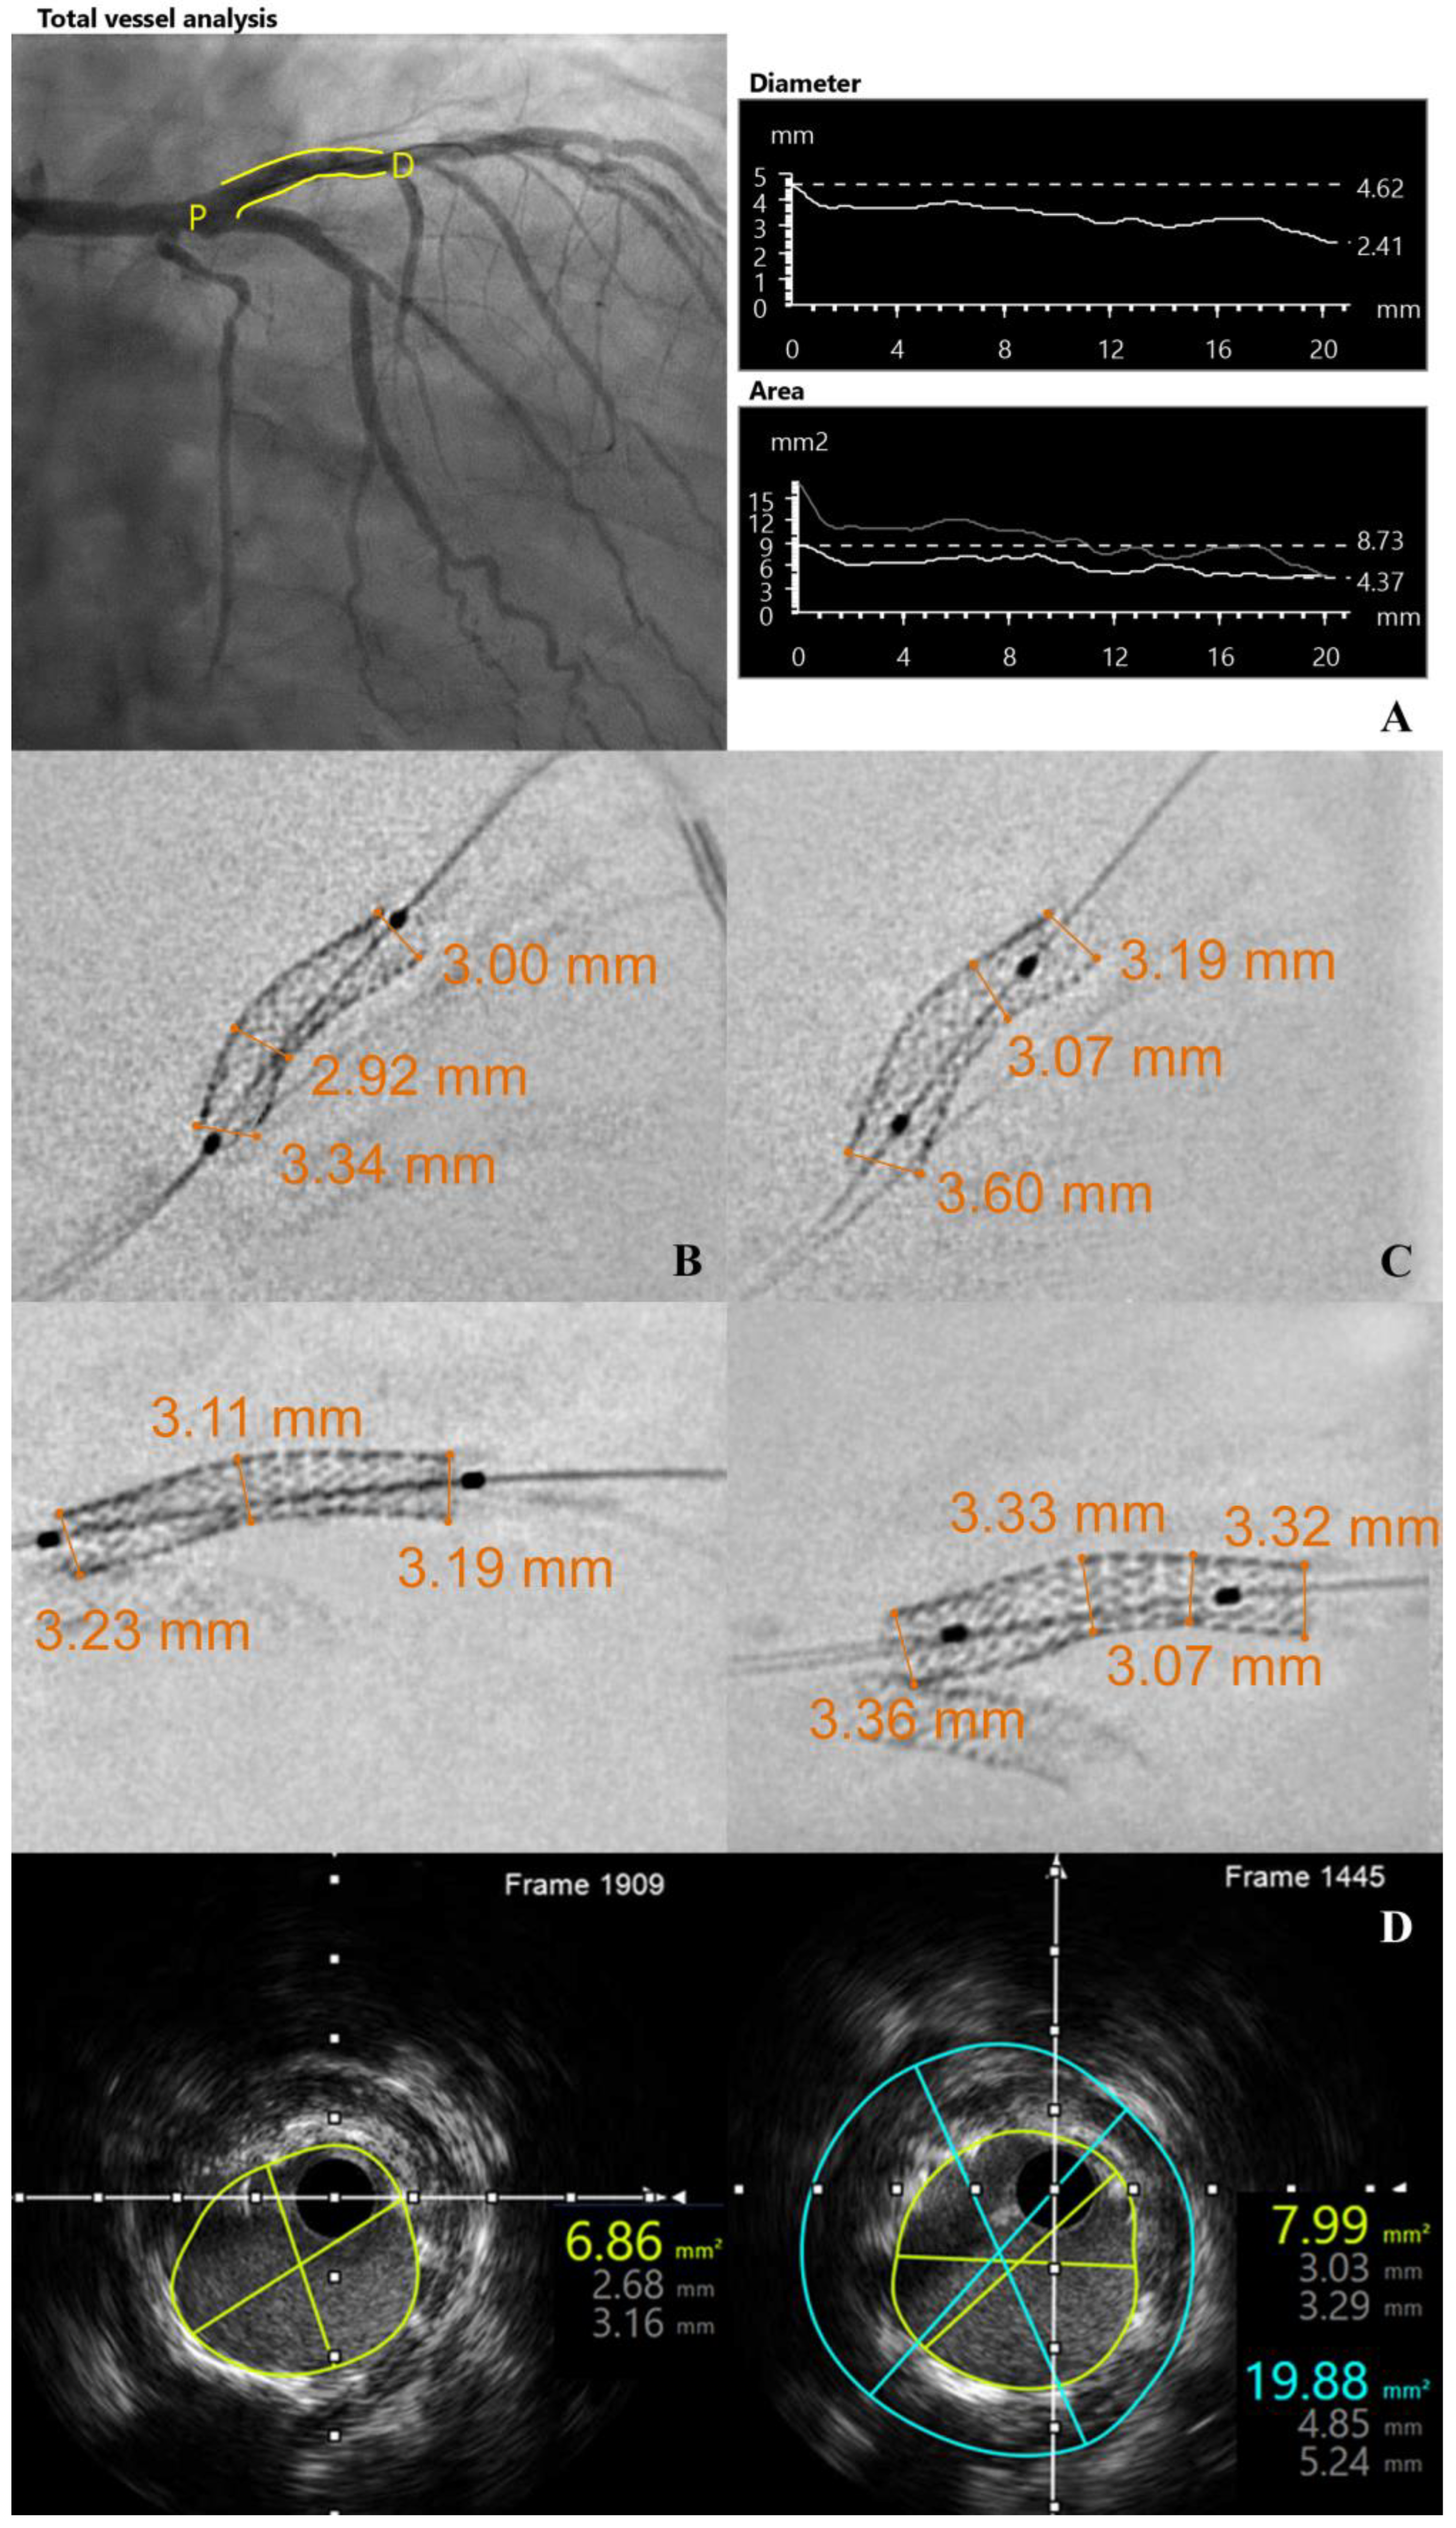
3.1.2. Quantitative Analysis
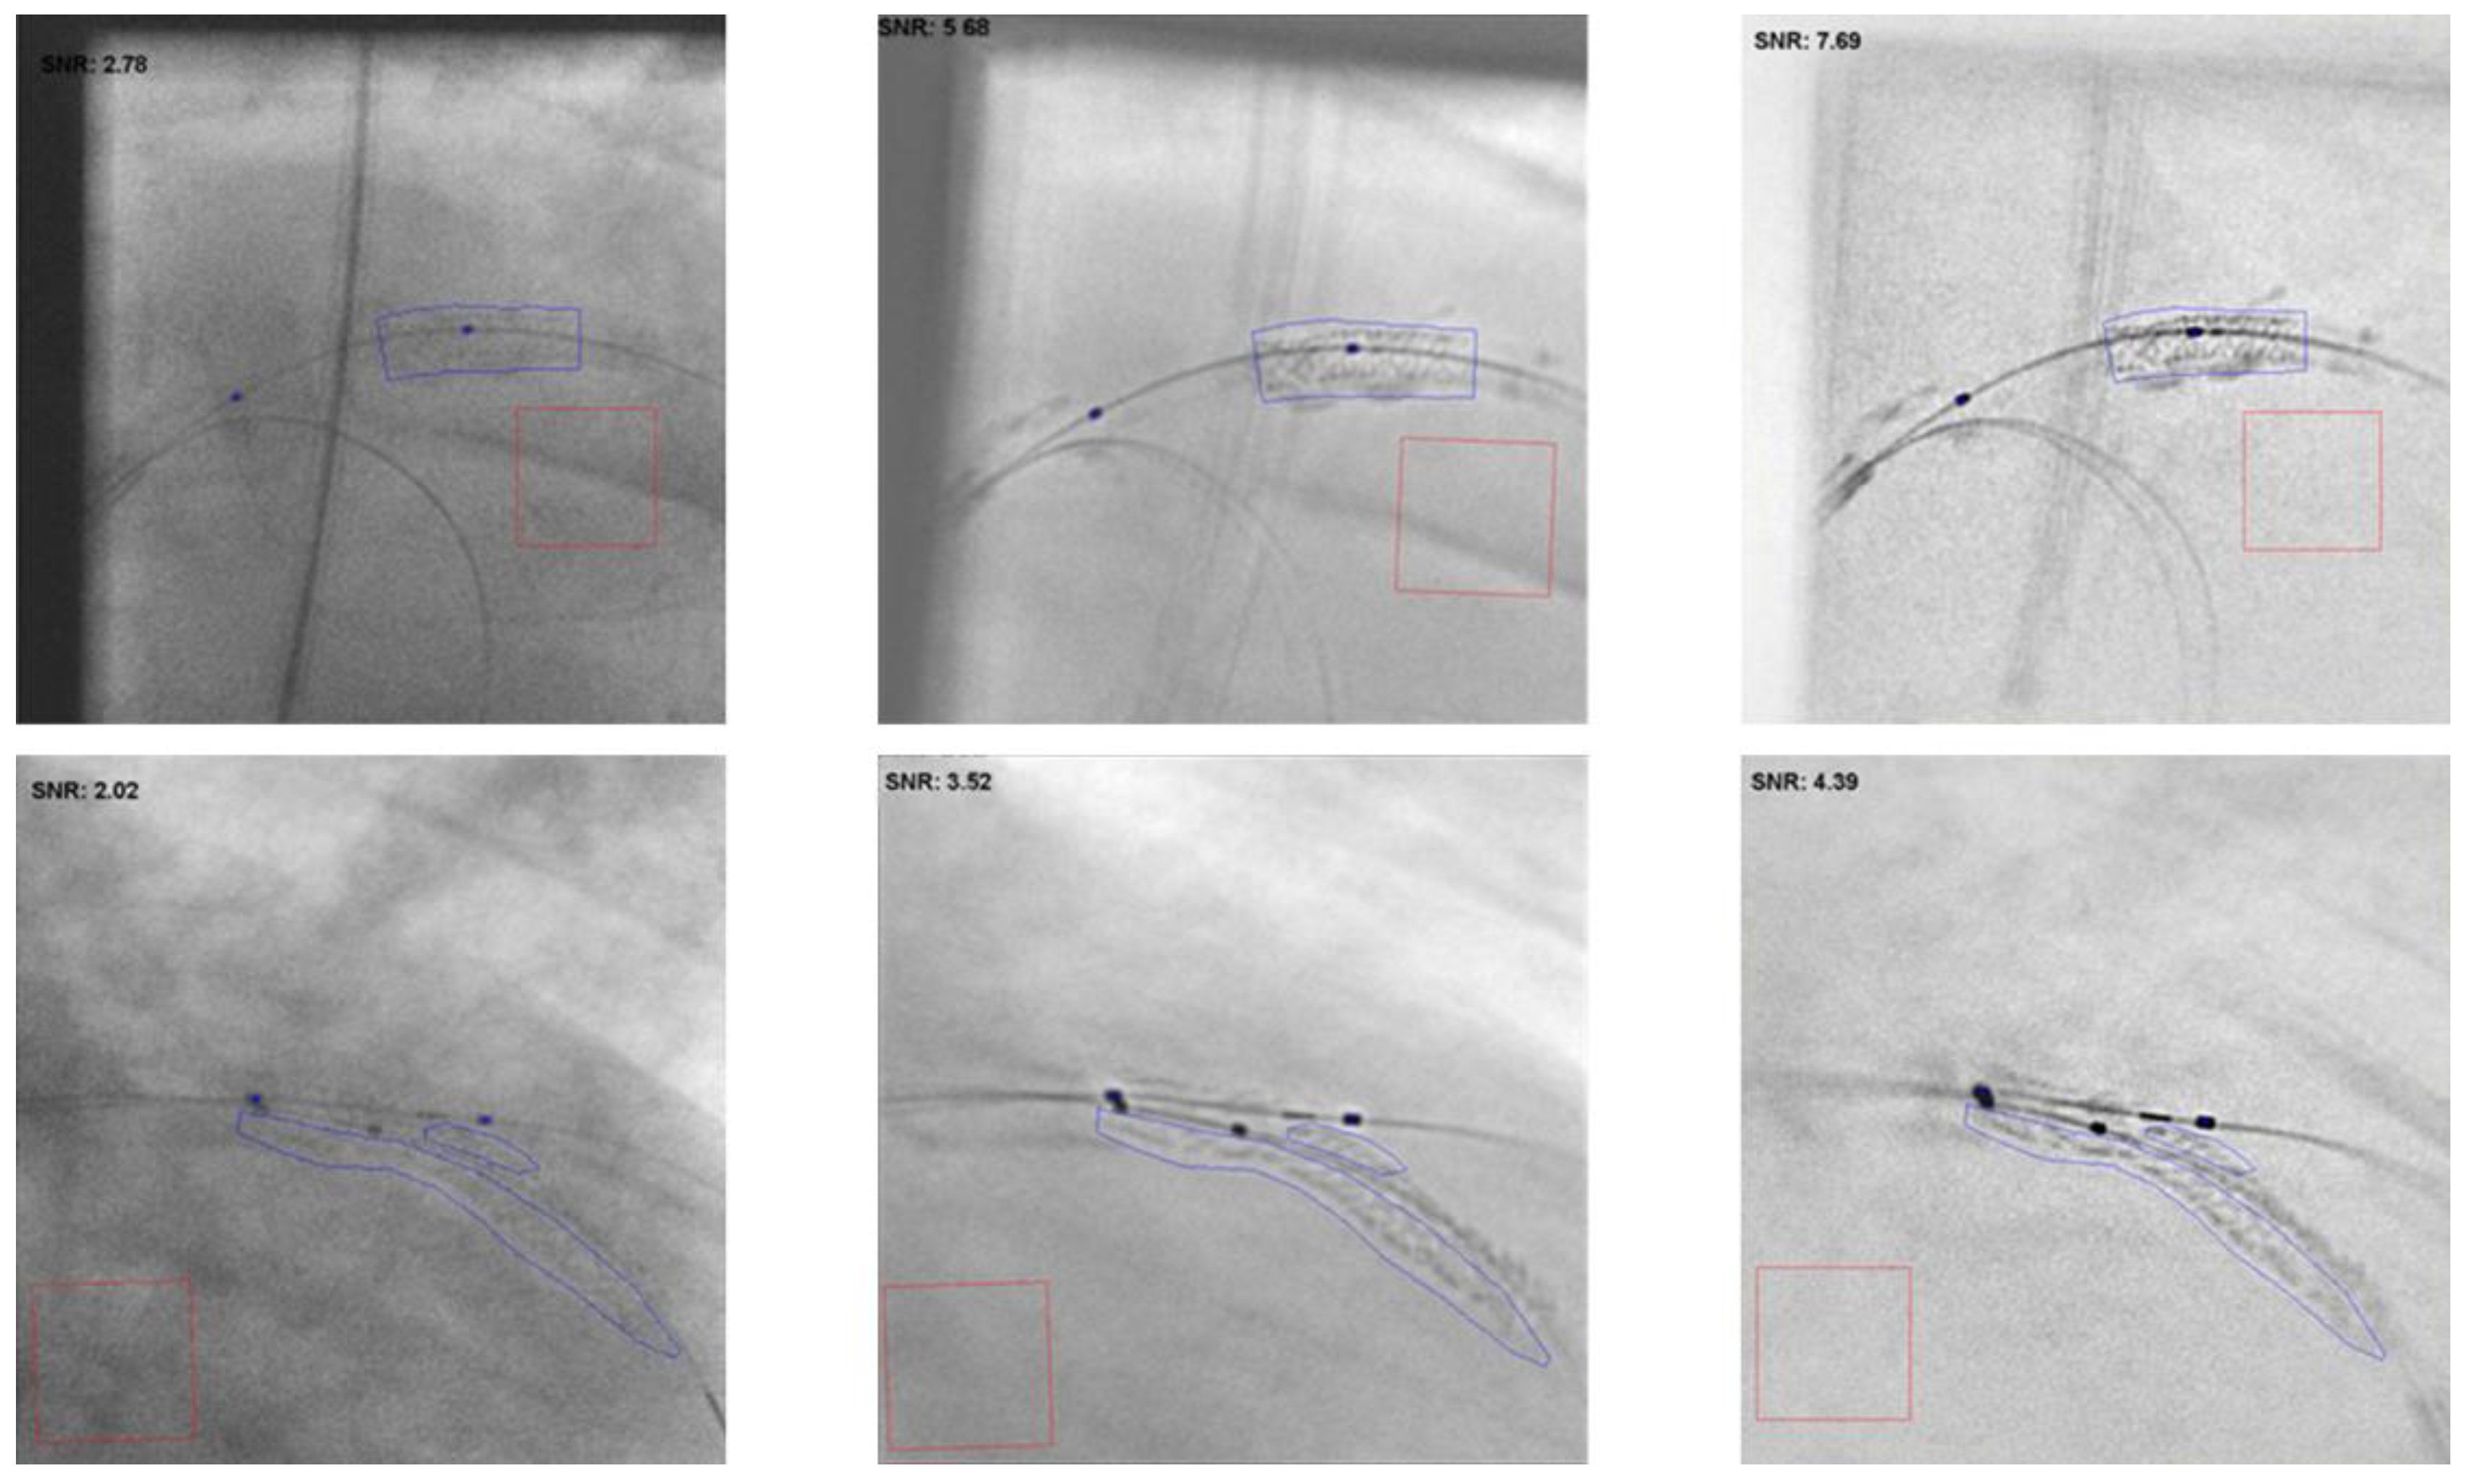
3.2. ESI Image Quality Evaluation
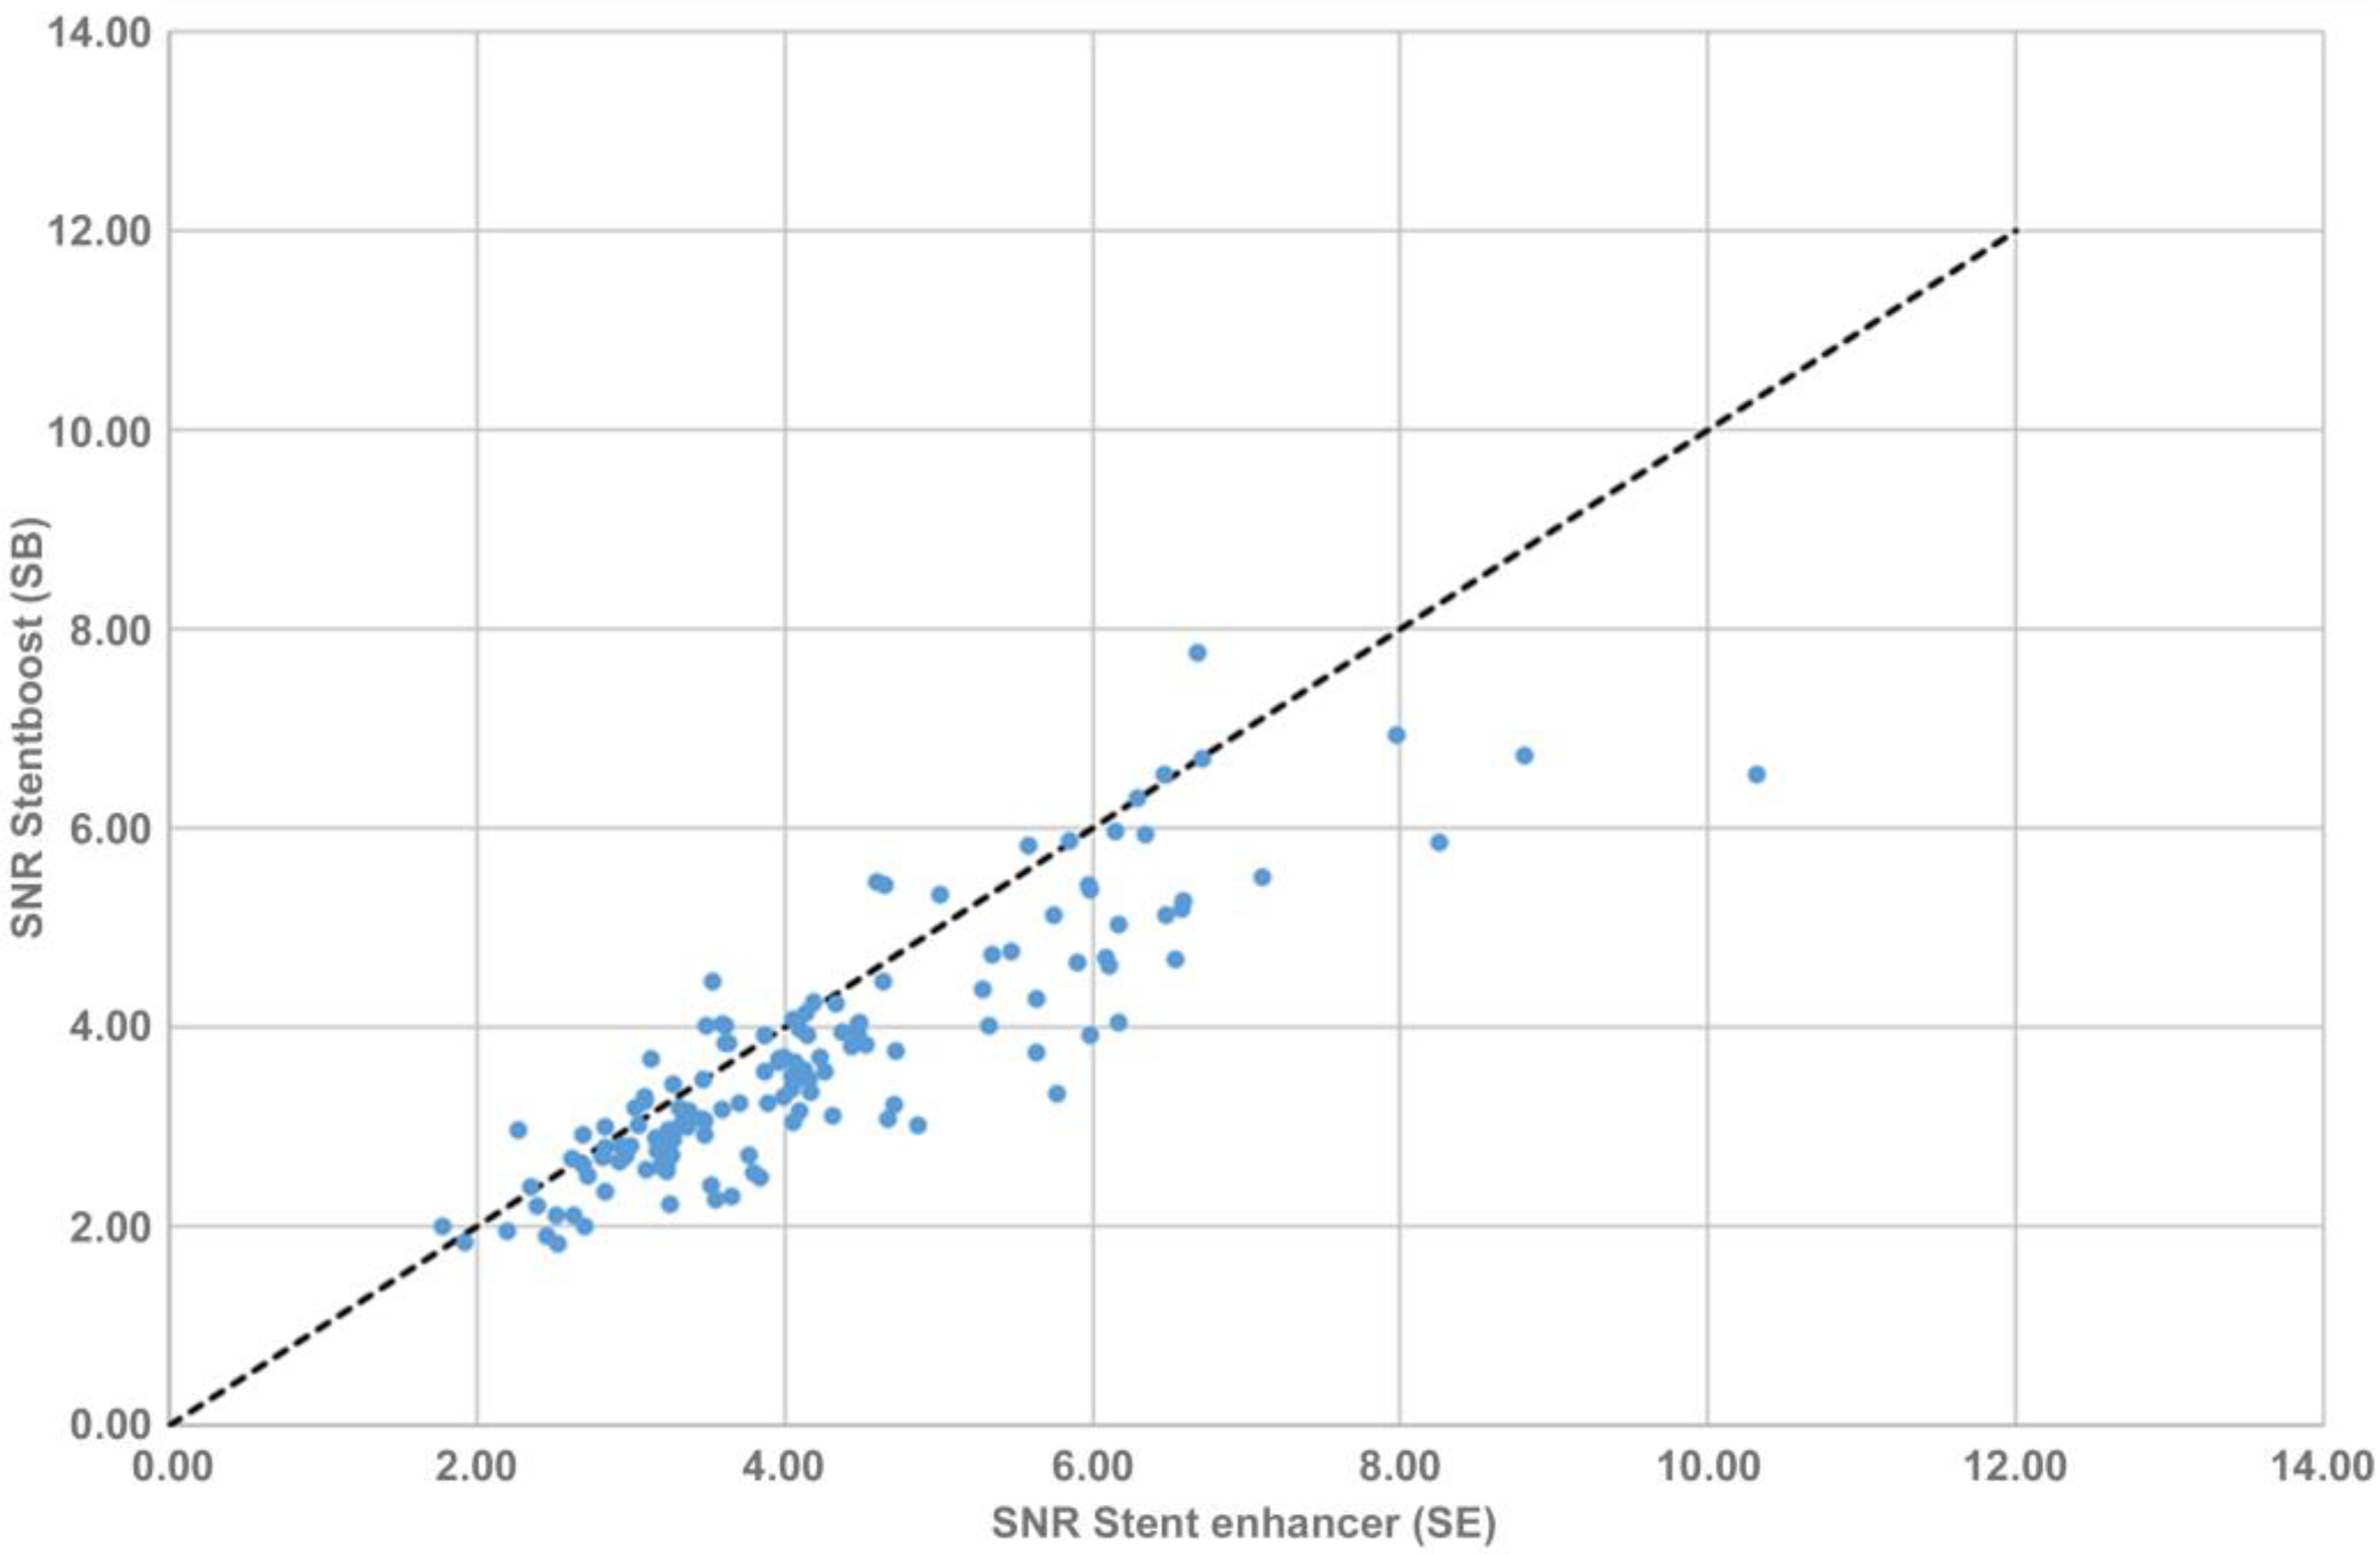
3.3. Signal-to-Noise Ratio
3.4. Quantitative Analysis
4. Discussion
5. Conclusions
Author Contributions
Funding
Data Availability Statement
Conflicts of Interest
References
- Neumann, F.J.; Sechtem, U.; Banning, A.P.; Bonaros, N.; Bueno, H.; Bugiardini, R.; Chieffo, A.; Crea, F.; Czerny, M.; Delgado, V.; et al. 2019 ESC Guidelines for the Diagnosis and Management of Chronic Coronary Syndromes. Eur. Heart J. 2020, 41, 407–477. [Google Scholar] [CrossRef]
- Kawaguchi, R.; Angiolillo, D.J.; Futamatsu, H.; Suzuki, N.; Bass, T.A.; Costa, M.A. Stent Thrombosis in the Era of Drug Eluting Stents. Minerva Cardioangiol. 2007, 55, 199–211. [Google Scholar] [PubMed]
- Gopalakrishnan, M.; Lotfi, A. Stent Thrombosis. Semin. Thromb. Hemost. 2018, 44, 046–051. [Google Scholar] [CrossRef] [PubMed]
- Choi, S.Y.; Maehara, A.; Cristea, E.; Witzenbichler, B.; Guagliumi, G.; Brodie, B.; Kellett, M.A.; Dressler, O.; Lansky, A.J.; Parise, H.; et al. Usefulness of Minimum Stent Cross Sectional Area as a Predictor of Angiographic Restenosis after Primary Percutaneous Coronary Intervention in Acute Myocardial Infarction (from the HORIZONS-AMI Trial IVUS Substudy). Am. J. Cardiol. 2012, 109, 455–460. [Google Scholar] [CrossRef]
- Serruys, P.W.; Kay, I.P.; Disco, C.; Deshpande, N.V.; De Feyter, P.J. Periprocedural Quantitative Coronary Angiography after Palmaz-Schatz Stent Implantation Predicts the Restenosis Rate at Six Months: Results of a Meta-Analysis of the Belgian Netherlands Stent Study (BENESTENT) I, BENESTENT II Pilot, BENESTENT II and MUSIC. J. Am. Coll. Cardiol. 1999, 34, 1067–1074. [Google Scholar] [CrossRef]
- Fujii, K.; Carlier, S.G.; Mintz, G.S.; Yang, Y.M.; Moussa, I.; Weisz, G.; Dangas, G.; Mehran, R.; Lansky, A.J.; Kreps, E.M.; et al. Stent Underexpansion and Residual Reference Segment Stenosis Are Related to Stent Thrombosis after Sirolimus-Eluting Stent Implantation: An Intravascular Ultrasound Study. J. Am. Coll. Cardiol. 2005, 45, 995–998. [Google Scholar] [CrossRef] [PubMed]
- Okabe, T.; Mintz, G.S.; Buch, A.N.; Roy, P.; Hong, Y.J.; Smith, K.A.; Torguson, R.; Gevorkian, N.; Xue, Z.; Satler, L.F.; et al. Intravascular Ultrasound Parameters Associated with Stent Thrombosis After Drug-Eluting Stent Deployment. Am. J. Cardiol. 2007, 100, 615–620. [Google Scholar] [CrossRef] [PubMed]
- Moussa, I.; Di Mario, C.; Reimers, B.; Akiyama, T.; Tobis, J.; Colombo, A. Subacute Stent Thrombosis in the Era of Intravascular Ultrasound-Guided Coronary Stenting without Anticoagulant: Frequency, Predictors and Clinical Outcome. J. Am. Coll. Cardiol. 1997, 29, 6–12. [Google Scholar] [CrossRef] [PubMed]
- Choi, S.Y.; Witzenbichler, B.; Maehara, A.; Lansky, A.J.; Guagliumi, G.; Brodie, B.; Kellett, M.A.; Dressler, O.; Parise, H.; Mehran, R.; et al. Intravascular Ultrasound Findings of Early Stent Thrombosis after Primary Percutaneous Intervention in Acute Myocardial Infarction: A Harmonizing Outcomes with Revascularization and Stents in Acute Myocardial Infarction (HORIZONS-AMI) Substudy. Circ. Cardiovasc. Interv. 2011, 4, 239–247. [Google Scholar] [CrossRef]
- Cheneau, E.; Leborgne, L.; Mintz, G.S.; Kotani, J.; Pichard, A.D.; Satler, L.F.; Canos, D.; Castagna, M.; Weissman, N.J.; Waksman, R. Predictors of Subacute Stent Thrombosis: Results of a Systematic Intravascular Ultrasound Study. Circulation 2003, 108, 43–47. [Google Scholar] [CrossRef]
- Nerlekar, N.; Cheshire, C.J.; Verma, K.P.; Ihdayhid, A.R.; McCormick, L.M.; Cameron, J.D.; Bennett, M.R.; Malaiapan, Y.; Meredith, I.T.; Brown, A.J. Intravascular Ultrasound Guidance Improves Clinical Outcomes during Implantation of Both First-and Second generation Drug-Eluting Stents: A Meta-Analysis. EuroIntervention 2017, 12, 1632–1642. [Google Scholar] [CrossRef]
- Buccheri, S.; Franchina, G.; Romano, S.; Puglisi, S.; Venuti, G.; D’Arrigo, P.; Francaviglia, B.; Scalia, M.; Condorelli, A.; Barbanti, M.; et al. Clinical Outcomes Following Intravascular Imaging-Guided Versus Coronary Angiography–Guided Percutaneous Coronary Intervention with Stent Implantation: A Systematic Review and Bayesian Network Meta-Analysis of 31 Studies and 17,882 Patients. JACC Cardiovasc. Interv. 2017, 10, 2488–2498. [Google Scholar] [CrossRef]
- Maehara, A.; Matsumura, M.; Ali, Z.A.; Mintz, G.S.; Stone, G.W. IVUS-Guided Versus OCT-Guided Coronary Stent Implantation: A Critical Appraisal. JACC Cardiovasc. Imaging 2017, 10, 1487–1503. [Google Scholar] [CrossRef] [PubMed]
- Ghafari, C.; Carlier, S. Stent Visualization Methods to Guide Percutaneous Coronary Interventions and Assess Long-Term Patency. World J. Cardiol. 2021, 13, 416–437. [Google Scholar] [CrossRef] [PubMed]
- Truesdell, A.G.; Alasnag, M.A.; Kaul, P.; Rab, S.T.; Riley, R.F.; Young, M.N.; Batchelor, W.B.; Maehara, A.; Welt, F.G.; Kirtane, A.J. Intravascular Imaging During Percutaneous Coronary Intervention: JACC State-of-the-Art Review. J. Am. Coll. Cardiol. 2023, 81, 590–605. [Google Scholar] [CrossRef] [PubMed]
- Lee, J.M.; Choi, K.H.; Song, Y.B.; Lee, J.-Y.; Lee, S.-J.; Lee, S.Y.; Kim, S.M.; Yun, K.H.; Cho, J.Y.; Kim, C.J.; et al. Intravascular Imaging–Guided or Angiography-Guided Complex PCI. N. Engl. J. Med. 2023, 388, 1668–1679. [Google Scholar] [CrossRef]
- Tanaka, N.; Pijls, N.H.J.; Koolen, J.J.; Botman, K.J.; Michels, H.R.; Brueren, B.R.G.; Peels, K.; Shindo, N.; Yamashita, J.; Yamashina, A. Assessment of Optimum Stent Deployment by Stent Boost Imaging: Comparison with Intravascular Ultrasound. Heart Vessels 2013, 28, 1–6. [Google Scholar] [CrossRef]
- Kastrati, A.; Mehilli, J.; Dirschinger, J.; Dotzer, F.; Schühlen, H.; Neumann, F.J.; Fleckenstein, M.; Pfafferott, C.; Seyfarth, M.; Schömig, A.; et al. Intracoronary Stenting and Angiographic Results: Strut Thickness Effect on Restenosis (Isar Stereo) Trial. Circulation 2001, 103, 2816–2821. [Google Scholar] [CrossRef]
- Pache, J.; Kastrati, A.; Mehilli, J.; Schühlen, H.; Dotzer, F.; Hausleiter, J.; Fleckenstein, M.; Neuman, F.J.; Sattelberger, U.; Schmitt, C.; et al. Intracoronary Stenting and Angiographic Results: Strut Thickness Effect on Restenosis Outcome (ISAR-STEREO-2) Trial. J. Am. Coll. Cardiol. 2003, 41, 1283–1288. [Google Scholar] [CrossRef]
- Mutha, V.; Asrar Ul Haq, M.; Sharma, N.; Den Hartog, W.F.; Van Gaal, W.J. Usefulness of Enhanced Stent Visualization Imaging Technique in Simple and Complex PCI Cases. J. Invasive Cardiol. 2014, 26, 552–557. [Google Scholar]
- Doi, H.; Maehara, A.; Mintz, G.S.; Weissman, N.J.; Yu, A.; Wang, H.; Mandinov, L.; Popma, J.J.; Ellis, S.G.; Grube, E.; et al. Impact of In-Stent Minimal Lumen Area at 9 Months Poststent Implantation on 3-Year Target Lesion Revascularization–Free Survival. Circ. Cardiovasc. Interv. 2008, 1, 111–118. [Google Scholar] [CrossRef][Green Version]
- Ohlmann, P.; Mintz, G.S.; Kim, S.W.; Pichard, A.D.; Satler, L.F.; Kent, K.M.; Suddath, W.O.; Waksman, R.; Weissman, N.J. Intravascular Ultrasound Findings in Patients with Restenosis of Sirolimus- and Paclitaxel-Eluting Stents. Int. J. Cardiol. 2008, 125, 11–15. [Google Scholar] [CrossRef]
- Iantorno, M.; Lipinski, M.J.; Garcia-Garcia, H.M.; Forrestal, B.J.; Rogers, T.; Gajanana, D.; Buchanan, K.D.; Torguson, R.; Weintraub, W.S.; Waksman, R. Meta-Analysis of the Impact of Strut Thickness on Outcomes in Patients with Drug-Eluting Stents in a Coronary Artery. Am. J. Cardiol. 2018, 122, 1652–1660. [Google Scholar] [CrossRef] [PubMed]
- Sanidas, E.A.; Maehara, A.; Barkama, R.; Mintz, G.S.; Singh, V.; Hidalgo, A.; Hakim, D.; Leon, M.B.; Moses, J.W.; Weisz, G. Enhanced Stent Imaging Improves the Diagnosis of Stent Underexpansion and Optimizes Stent Deployment. Catheter. Cardiovasc. Interv. 2013, 81, 438–445. [Google Scholar] [CrossRef] [PubMed]
- Rogers, R.K.; Michaels, A.D. Enhanced X-Ray Visualization of Coronary Stents: Clinical Aspects. Cardiol. Clin. 2009, 27, 467–475. [Google Scholar] [CrossRef]
- Zaid, A.O.; Hadded, I.; Belhaj, W.; Bouallegue, A.; Abdessalem, S.; Mechmeche, R. Improved Localization of Coronary Stents Based on Image Enhancement. Int. J. Biomed. Sci. 2008, 4, 212–216. [Google Scholar] [PubMed]
- Laimoud, M.; Nassar, Y.; Omar, W.; Abdelbarry, A.; Elghawaby, H. Stent Boost Enhancement Compared to Intravascular Ultrasound in the Evaluation of Stent Expansion in Elective Percutaneous Coronary Interventions. Egypt. Heart J. 2018, 70, 21–26. [Google Scholar] [CrossRef]
- Zhang, J.; Duan, Y.Y.; Jin, Z.G.; Wei, Y.J.; Yang, S.L.; Luo, J.P.; Ma, D.X.; Jing, L.M.; Liu, H.L. Stent Boost Subtract Imaging for the Assessment of Optimal Stent Deployment in Coronary Ostial Lesion Intervention: Comparison with Intravascular Ultrasound. Int. Heart J. 2015, 56, 37–42. [Google Scholar] [CrossRef]
- Davies, A.G.; Conway, D.; Reid, S.; Cowen, A.R.; Sivananthan, M. Assessment of Coronary Stent Deployment Using Computer Enhanced X-Ray Images-Validation against Intravascular Ultrasound and Best Practice Recommendations. Catheter. Cardiovasc. Interv. 2013, 81, 419–427. [Google Scholar] [CrossRef]
- Blicq, E.; Georges, J.L.; Elbeainy, E.; Gibault-Genty, G.; Benjemaa, K.; Jerbi, B.; Livarek, B. Detection of Stent Underdeployment by Stentboost Imaging. J. Interv. Cardiol. 2013, 26, 444–453. [Google Scholar] [CrossRef]
- Omran, O.M.; Sherif, M.H.; Saied, E.S.; El-Ashmawy, M.M.; El-guindy, A.D.; El-den, S.M.S. Evaluation of Coronary Stent Expansion during Percutaneous Coronary Interventions Using Stent Boost Visualization in Comparison with Intravascular Ultrasound. J. Adv. Med. Med. Res. 2022, 34, 205–215. [Google Scholar] [CrossRef]
- Garrone, P.; Biondi-Zoccai, G.; Salvetti, I.; Sina, N.; Sheiban, I.; Stella, P.R.; Agostoni, P. Quantitative Coronary Angiography in the Current Era: Principles and Applications. J. Interv. Cardiol. 2009, 22, 527–536. [Google Scholar] [CrossRef] [PubMed]
- Lozano, I.; López-Palop, R.; Pinar, E.; Pérez-Lorente, F.; Picó, F.; Valdés, M. Comparison between Theoretical and Actual Intracoronary Stent Dimensions in Non-Complex Lesions. Rev. Española Cardiol. 2006, 59, 624–627. [Google Scholar] [CrossRef]
- De Ribamar Costa, J.; Mintz, G.S.; Carlier, S.G.; Costa, R.A.; Fujii, K.; Sano, K.; Kimura, M.; Lui, J.; Weisz, G.; Moussa, I.; et al. Intravascular Ultrasonic Assessment of Stent Diameters Derived from Manufacturer’s Compliance Charts. Am. J. Cardiol. 2005, 96, 74–78. [Google Scholar] [CrossRef] [PubMed]
- Blasini, R.; Neumann, F.J.; Schmitt, C.; Bökenkamp, J.; Schömig, A. Comparison of Angiography and Intravascular Ultrasound for the Assessment of Lumen Size after Coronary Stent Placement: Impact of Dilation Pressures. Cathet. Cardiovasc. Diagn. 1997, 42, 113–119. [Google Scholar] [CrossRef]
- Hong, M.-K. Intravascular Ultrasound Predictors of Angiographic Restenosis after Sirolimus-Eluting Stent Implantation. Eur. Heart J. 2006, 27, 1305–1310. [Google Scholar] [CrossRef] [PubMed]
- Silva, J.D.; Carrillo, X.; Salvatella, N.; Fernandez-Nofrerias, E.; Rodriguez-Leor, O.; Mauri, J.; Bayes-Genis, A. The Utility of Stent Enhancement to Guide Percutaneous Coronary Intervention for Bifurcation Lesions. EuroIntervention 2013, 9, 968–974. [Google Scholar] [CrossRef] [PubMed]
- Cura, F.; Albertal, M.; Candiello, A.; Nau, G.; Bonvini, V.; Tricherri, H.; Padilla, L.T.; Belardi, J.A. StentBoost Visualization for the Evaluation of Coronary Stent Expansion during Percutaneous Coronary Interventions. Cardiol. Ther. 2013, 2, 171–180. [Google Scholar] [CrossRef]
- Goto, K.; Mintz, G.S.; Litherland, C.; Lansky, A.J.; Weisz, G.; McPherson, J.A.; De Bruyne, B.; Serruys, P.W.; Stone, G.W.; Maehara, A. Lumen Measurements from Quantitative Coronary Angiography and IVUS: A PROSPECT Substudy. JACC Cardiovasc. Imaging 2016, 9, 1011–1013. [Google Scholar] [CrossRef] [PubMed]
- Jin, Z.; Yang, S.; Jing, L.; Liu, H. Impact of StentBoost Subtract Imaging on Patient Radiation Exposure during Percutaneous Coronary Intervention. Int. J. Cardiovasc. Imaging 2013, 29, 1207–1213. [Google Scholar] [CrossRef]


| N | |||
|---|---|---|---|
| Number of patients | 140 | ||
| Mean age (years) | 64.7 ± 10.7 | ||
| Male gender | 101 (72.1%) | ||
| Mean body mass index (kg/m2) | 29.1 ± 5.9 | ||
| Risk factors | |||
| Hypertension | 91 (65%) | ||
| Dyslipidemia | 119 (85%) | ||
| Diabetes mellitus | 54 (38.6%) | ||
| Current smoker | 37 (26.4%) | ||
| Indication for PCI procedure | |||
| Stable angina | 45 (26.5%) | ||
| Unstable angina | |||
| Non-ST elevation myocardial infarction | 46 (27.1%) | ||
| ST elevation myocardial infarction | 26 (15.3%) | ||
| Other | |||
| Medical history | |||
| Peripheral artery disease | 38 (27.1%) | ||
| Treated coronary artery | |||
| Number of lesions treated | 157 | ||
| Calcifications | 113 (72%) | ||
| Left anterior descending artery | 62 (39.5%) | ||
| Left circumflex artery | 24 (15.3%) | ||
| Right coronary artery | 53 (33.8%) | ||
| Left main coronary artery | 8 (5.1%) | ||
| Other | 10 (6.4%) | ||
| Stents | |||
| Number of stents implanted | 170 | ||
| Coating | Scaffold | Struts Thickness (µm) | |
| Everolimus | |||
| PtCr | 81 | 1 (0.6%) | |
| PtCr | 74 | 67 (39.4%) | |
| Sirolimus | |||
| CoCr | 60 | 38 (22.4%) | |
| CoCr | 80 | 29 (17.1%) | |
| 316L | 100 | 3 (1.8%) | |
| Mg | 150 | 1 (0.6%) | |
| Paclitaxel | PtCr | 81 | 1 (0.6%) |
| TiNO | CoCr | 75 | 5 (2.9%) |
| BMS | |||
| CoCr | 80 | 25 (14.7%) | |
| N | ||
|---|---|---|
| Number of patients | 76 | |
| Mean age (years) | 69.2 ± 9.1 | |
| Male gender | 54 (71.1%) | |
| Mean body mass index (kg/m2) | 28.1 ± 4.6 | |
| Risk factors | ||
| Hypertension | 56 (73.7%) | |
| Dyslipidemia | 57 (75.0%) | |
| Diabetes mellitus | 28 (36.8%) | |
| Current smoker | 12 (15.8%) | |
| Family history of heart disease | 24 (31.6%) | |
| Peripheral vascular disease | 8 (10.5%) | |
| Previous myocardial infarction | 14 (18.4%) | |
| Previous PTCA | 26 (34.2%) | |
| Renal impairment | 2 (2.6%) | |
| Indication for PCI procedure | ||
| Chronic coronary syndrome | 28 (36.8%) | |
| Unstable angina | 6 (7.9%) | |
| Non-ST elevation myocardial infarction | 5 (6.6%) | |
| Silent ischemia | 37 (48.7%) | |
| Treated coronary artery | ||
| Number of lesions treated | 93 | |
| Calcifications burden | ||
| Mild | 29 (38.2%) | |
| Moderate | 35 (46.1%) | |
| Severe | 12 (15.8%) | |
| Lesion classification (AHA/ACC) | ||
| A | 6 (6.5%) | |
| B1 | 62 (66.7%) | |
| B2 | 22 (23.7%) | |
| C | 3 (3.3%) | |
| Left anterior descending artery | 59 (63.4%) | |
| Left circumflex artery | 8 (8.6%) | |
| Right coronary artery | 25 (26.9%) | |
| Left main coronary artery | 1 (1.1%) | |
| Stents | ||
| Number of stents implanted | 98 | |
| Mean stent diameter (mm) | 3.16 ± 0.46 | |
| Mean stent length (mm) | 25 ± 9 | |
| Mean deployment pressure (atm) | 11 ± 2 | |
| Expected chart diameter (mm) | 3.25 ± 0.47 | |
| Post-dilation performed | 81 (82.7%) | |
| Non-compliant balloon | 71 (85.5%) | |
| Mean maximal post-dilatation balloon diameter (mm) | 3.57 ± 0.54 | |
| Mean maximal balloon inflation pressure (atm) | 18 ± 3 | |
| Observer 1 | Observer 2 | p-Value | |||
|---|---|---|---|---|---|
| SE | SB | SE | SB | ||
| Stent strut visibility | 1.28 ± 0.73 | 1.35 ± 0.68 | 0.98 ± 0.69 | 0.96 ± 0.61 | <0.001 |
| Proximal stent edge visibility | 1.46 ± 0.79 | 1.42 ± 0.77 | 1.42 ± 0.64 | 1.38 ± 0.62 | NS |
| Distal stent edge visibility | 1.43 ± 0.77 | 1.46 ± 0.76 | 1.46 ± 0.59 | 1.44 ± 0.61 | NS |
| Total score | 4.10 ± 1.86 | 4.12 ± 1.73 | 3.76 ± 1.58 | 3.67 ± 1.49 | <0.001 |
| Inter-observer Kappa coefficients (n = 249) | |||||
| SE | SB | ||||
| Stent strut visibility | 0.456 | 0.344 | |||
| Proximal edge visibility | 0.434 | 0.498 | |||
| Distal edge visibility | 0.416 | 0.386 | |||
| Stent underexpansion | 0.394 | 0.480 | |||
| Calcifications | 0.352 | 0.447 | |||
| Intra-observer Kappa coefficients (n = 50) | |||||
| Stent strut visibility | 0.760 | 0.557 | |||
| Proximal edge visibility | 0.629 | 0.710 | |||
| Distal edge visibility | 0.647 | 0.783 | |||
| Stent underexpansion | 0.584 | 0.473 | |||
| Calcifications | 0.674 | 0.477 | |||
| SE | SB | p-Value | ||
|---|---|---|---|---|
| Observer 1 | Stent strut visibility | 1.28 ± 0.73 | 1.35 ± 0.68 | NS |
| Proximal edge visibility | 1.46 ± 0.79 | 1.42 ± 0.77 | NS | |
| Distal edge visibility | 1.43 ± 0.77 | 1.35 ± 0.68 | NS | |
| Total score | 4.10 ± 01.86 | 4.12 ± 1.73 | NS | |
| Observer 2 | Stent strut visibility | 0.98 ± 0.69 | 0.96 ± 0.61 | NS |
| Proximal edge visibility | 1.42 ± 0.64 | 1.38 ± 0.62 | NS | |
| Distal edge visibility | 1.46 ± 0.59 | 1.44 ± 0.61 | NS | |
| Total score | 3.76 ± 1.58 | 3.67 ± 1.49 | NS | |
| SE | SB | Kendall Coefficient | ||
|---|---|---|---|---|
| Observer 1 | Stent underexpansion (%) | 71.5 | 73.9 | 61 |
| Calcifications (%) | 64.0 | 43.8 | 58 | |
| Observer 2 | Stent underexpansion (%) | 47.0 | 47.0 | 92 |
| Calcifications (%) | 63.9 | 62.7 | 91 | |
| QCA Analysis | ||
|---|---|---|
| Post-Stent Implantation | n = 14 | |
| Mean stent diameter (mm) | 2.74 ± 0.53 | |
| Minimal in-stent diameter (mm) | 2.26 ± 0.48 | |
| Percentage stenosis (%) | 13.86 ± 9.54 | |
| Post-balloon post-dilation | n = 75 | |
| Mean stent diameter (mm) | 2.84 ± 0.53 | |
| Minimal in-stent diameter (mm) | 2.23 ± 0.46 | |
| Percentage stenosis (%) | 14.7 ± 11.9 | |
| SE analysis | ||
| Mean stent diameter at deployment (mm) | 2.96 ± 0.47 | |
| Minimal in-stent diameter at deployment (mm) | 2.41 ± 0.44 | |
| Deployment diameter to chart (%) | 90 ± 9 | |
| Mean stent underexpansion at deployment (%) | 19 ± 9 | |
| Mean stent diameter after post-dilation (mm) | 3.13 ± 0.49 | |
| Minimal in-stent diameter after post-dilation (mm) | 2.63 ± 0.49 | |
| Post-dilation diameter to balloon (%) | 13 ± 2 | |
| Mean stent underexpansion after post-dilation (%) | 16 ± 7 | |
Disclaimer/Publisher’s Note: The statements, opinions and data contained in all publications are solely those of the individual author(s) and contributor(s) and not of MDPI and/or the editor(s). MDPI and/or the editor(s) disclaim responsibility for any injury to people or property resulting from any ideas, methods, instructions or products referred to in the content. |
© 2023 by the authors. Licensee MDPI, Basel, Switzerland. This article is an open access article distributed under the terms and conditions of the Creative Commons Attribution (CC BY) license (https://creativecommons.org/licenses/by/4.0/).
Share and Cite
Ghafari, C.; Houissa, K.; Dens, J.; Ungureanu, C.; Kayaert, P.; Constant, C.; Carlier, S. Clinical Validation of a New Enhanced Stent Imaging Method. Algorithms 2023, 16, 276. https://doi.org/10.3390/a16060276
Ghafari C, Houissa K, Dens J, Ungureanu C, Kayaert P, Constant C, Carlier S. Clinical Validation of a New Enhanced Stent Imaging Method. Algorithms. 2023; 16(6):276. https://doi.org/10.3390/a16060276
Chicago/Turabian StyleGhafari, Chadi, Khalil Houissa, Jo Dens, Claudiu Ungureanu, Peter Kayaert, Cyril Constant, and Stéphane Carlier. 2023. "Clinical Validation of a New Enhanced Stent Imaging Method" Algorithms 16, no. 6: 276. https://doi.org/10.3390/a16060276
APA StyleGhafari, C., Houissa, K., Dens, J., Ungureanu, C., Kayaert, P., Constant, C., & Carlier, S. (2023). Clinical Validation of a New Enhanced Stent Imaging Method. Algorithms, 16(6), 276. https://doi.org/10.3390/a16060276