Article

Cooperative Attention-Based Learning between Diverse Data Sources

iCONS Lab, Department of Electrical Engineering, University of South Florida, Tampa, FL 33620, USA
*
Authors to whom correspondence should be addressed.
Algorithms 2023, 16(5), 240; https://doi.org/10.3390/a16050240
Submission received: 14 February 2023 / Revised: 30 March 2023 / Accepted: 27 April 2023 / Published: 4 May 2023

Abstract

:
Cooperative attention provides a new method to study how epidemic diseases are spread. It is derived from the social data with the help of survey data. Cooperative attention enables the detection possible anomalies in an event by formulating the spread variable, which determines the disease spread rate decision score. This work proposes a determination spread variable using a disease spread model and cooperative learning. It is a four-stage model that determines answers by identifying semantic cooperation using the spread model to identify events, infection factors, location spread, and change in spread rate. The proposed model analyses the spread of COVID-19 throughout the United States using a new approach by defining data cooperation using the dynamic variable of the spread rate and the optimal cooperative strategy. Game theory is used to define cooperative strategy and to analyze the dynamic variable determined with the help of a control algorithm. Our analysis successfully identifies the spread rate of disease from social data with an accuracy of 67 % and can dynamically optimize the decision model using a control algorithm with a complexity of order O ( n 2 ) .

1. Introduction

The spread of infectious diseases is a major concern worldwide, with potential consequences for human health and the global economy. Social data have been used to monitor and predict disease spread, but its reliability and effectiveness have been questioned due to limitations in traditional methods. Therefore, new approaches are required to utilize social data for effective disease control and prevention. The recent COVID-19 pandemic required optimal control for the spread of disease through person-to-person contact. Thus, the question arose, “How effectively can the spread of any commutable disease be tracked and mitigated”. Hence, we designed a spread model using cooperative learning by utilizing social and physical network data.
In recent years, data analytics have changed the pattern of interpretation through the pair modelling of critical sentences, as well as the identification of paraphrases and important features of textual entailment in many natural language processing (NLP) tasks. An important aspect of this analysis is to not consider the impact of any two sentences, i.e., not defining the impact of each sentence separately, but instead their mutual relationship [1]. This inherently develops limitations concerning data analysis and prediction for short-term analysis. This non-consideration of mutual influence is in contrast with the approach that does not change contexts. As humans, if two people’s arguments are presented, then we extract word identities and relations to understand the entire scenario. Hence, the analysis veracity of a group of sentences becomes challenging. This challenge entails figurative language representation, in which meanings are usually not concrete. This figurative language is often presented as sarcasm, which people often use on social media where they represent negative feelings through positive words, or vice versa.
Detecting sarcasm and the multinomial meaning of a sentence can be categorized as a classical classification problem that depends on efficiently identifying features and the use of advantageous learning techniques. The word advantageous is used to determine a learning technique that can understand the sparseness of social media text and disseminate perpetual information, such as identifying events and trends that correlate the context of sentences. In a network, for example a micro-blogging website such as Twitter, the number of users increases and each of them expresses their own views. Twitter is a popular micro-blog rich in sentiment expression from users. It generates a massive amount of data in real time, but has a limit on the number of words that can be used for each post. This limitation on characters increases the inability to identify words that are critical for the occurrence of an event; techniques to remove this sparseness were recently developed using supervised and unsupervised learning approaches [2,3,4,5].
A model considering natural language generation has been proposed using reinforcement adaptation of an attention-based neural natural language generator (NLG) [6]. This model handles NLG in a spoken dialogue system with short-term memory using a recurrent neural network (RNN) model. The research showed a better integration attention model in the subnetwork, which rephrased the sentences in the network for effective explorations and meaning detection through condition in the environment.
Detecting an event using a determined set of parameters results in the detection of a global event; however, a global event occurs because of, or creates, multi subevents. The detection of subevents is complicated in nature. For example, if pollution in a city increases during a specific time period every week, it can be counted as a subevent; each of these can further have subevents, such as increased factory production, increased wind, or any other natural disasters. Thus, finding distinct subevents is necessary; some subevents are not part of the global event, but they can be direct or indirect factors, such as sports tournaments, political rallies, or protests. Each subevent should be detected in order to augment the exact map of any event.
Mapping and detecting these subevents through contextual and sarcastic words and phrases requires a fine set of features to categorize the dynamics. This requires the identification of important and influential users in a social network. Recently, the authors of [7] suggested ranking the methodology of users through their social standing. However, these standings were based on the activities and posts published users. This method is able to find influential and important posts, and can help pick up prejudiced information in a network. Thus, in [8], the selection of influential words and data were generated for making cooperative decisions.
Cooperation exploitation is a viable test and is in demand in human societies that have a network of engagement. However, how can the interaction information be advanced to create a populous cooperation structure? Accounting for the possible interactions between individual users of a network, emphasizing selective neighbor interactions, can lead to natural reward and cooperation, in line with the game theory model [9,10]. This conditional reward, in accordance with the game theory model, encourages interactions that produce a clustering strategy, known as local interactions with non-random cooperation. The results of these interactions promote cooperation, and better reward systems and relative structures can be seen in various behavioral experiments [11,12,13,14,15,16,17,18,19]. One of the key things in behavioral experiments are the dynamics in a social network. A social network is considered a biased network if it has no dynamics. Here, dynamics refers to the interactions, changes, and patterns that occur within a social network over time. These dynamics influence how individuals in the network relate to one another, share information, and adapt their behaviors based on various events or conditions. It emphasizes that a proper social network should have such dynamics to enable clustering opportunities for different strategies. This means that the network should allow for the formation of groups or sub-networks based on shared interests or behaviors, in response to specific events or conditions. The ability to create variable action in a dynamic network, in this context, is defined as “cooperative attention”, which implies a collective focus or joint effort among network members to address particular situations or challenges.
However, cooperative attention within a network fosters evolution and promotes behavioral reciprocity, which is in line with strategy-based game theory [1,20,21]. This theory characterizes reciprocity as a relational aspect of interactions, where one user’s actions toward another user depend on previous responses. However, this creates a new problem dimension when there are more than three users, the situation becomes more complex, creating a new problem dimension that is not adequately addressed by traditional two-player game theory. To mitigate reciprocity, a strategic approach is needed. An unbiased solution that does not solely rely on past interactions is proposed as a dynamic variable. It involves introducing an additional feature called “neighborhood bond”, which can change dynamically with or without prior interactions between three or more users. The neighborhood bond serves as a connection for establishing reciprocity, allowing users to engage and disengage, while maintaining a fair reward distribution [22,23,24,25,26,27].
Recently, game theory models have highlighted the concept of reciprocity [26], which illustrates the capacity to foster and enhance interactions within a group. These interactions also encourage cooperation in dynamic networks. Dynamic network models directly facilitate matched cooperation support, allowing for dynamic assessment of changes in proposed node connections. This enables non-sequential link updates for node cooperation, which can result in failure to adapt the network appropriately [28,29,30]. Upon further examination of these networks, it is apparent that slow and static network connection variations yield a lower heterogeneity compared with rapidly changing networks. Consequently, to maintain stable and accurately predicted connections, non-essential node connections should have a stable connection probability. This can be achieved by establishing stable bonds based on diverse data sources.

2. Literature Review

When individuals collaborate to support each other, they both save and spend money in the process. Cooperation is a vital component of any human community network [1,2,3,4,9,10,11,12,13]. Accumulating evidence suggests that people are impacted by their social connections, spreading emotions, beliefs, and behaviors throughout their networks [15,16,17,18,19,20,21,22,23]. Consequently, the question of whether collaboration can be transmitted through social contagion emerges. This is an important issue with direct implications for strategies aimed at promoting collaborative action. Homophily, the tendency for individuals to form and maintain relationships with those similar to them, plays a role in these networks [21,23,28]. However, distinguishing between spreader and homophily can be challenging. Past studies have employed observational data to examine the relationship between contagion and homophily, leading to observations on homophily using unobserved attributes. Gaining a clear understanding of these hidden characteristics within a network through statistical learning can be difficult [23,28]. To address the challenges associated with differentiating prior knowledge of node interactions within a specific network topology, controlled data experiments with predetermined sample sizes are used.
A recent study found that social contagion can naturally promote collaboration within an environment. The researchers utilized social contagion to foster cooperation, incorporating data from a controlled sample size into a game theory model that incorporated social data. This enabled them to formulate a hypothesis based on the social data. Throughout the observational cycles, users were randomly assigned to interact with new groups of unrelated nodes, with each group determining the reward distribution among specific nodes in the network. This approach minimized bias by limiting the influence of past node behavior on current connections. Despite the challenges, nodes assigned to larger groups with more substantial reward contributors tended to share more rewards with other network nodes. This finding indicates that without any bias, contribution activities will spread uniquely across a network of random users [31,32,33,34,35,36].
According to the available evidence, activity related to cooperative games spreads quickly in static social networks. On the other hand, homophily within a network can be eradicated by a set of nodes if nodes are pre-bonded with their particular neighbors in each sample size. In the event that we have more than one user, we can employ a multi-player strategy. This technique is analogous to the prisoner’s dilemma problems that arise in static networks that make use of a variety of different systems in order to discover cooperation [34,35,36]. These studies add to the growing body of evidence that social activity in a network, in the sense of cooperation, will spread from one consumer to the next and that this effect can be extended to fixed networks. In other words, these studies show that social activity in a network will spread from one consumer to the next. In addition to this, they hypothesize that the degree to which behaviors of cooperation and selfishness can be contagious can vary. Participants in the fixed network were aware not only of the decisions made by their neighbors, but also of the overall compensation they would receive as a result of their neighbors’ decisions. Assuming that the performance of the rebels in the accumulation of rewards is greater than that of the cooperators, this can lead to an incorrect allocation of rewards among the cooperators as follows: rebels who have a significant number of cooperative neighbors’ nodes will be able to identify an extra link to swap; nevertheless, this impulse link may lessen the overall required payment for the node. As a consequence of this, additional research is required to determine whether or not cooperative action would expand, despite the absence of particular information regarding the allocation of rewards.
Additionally, it is imperative to research the transmission of collaboration in dynamic networks as opposed to fixed networks. In many different types of social experiments, networks exert control over their relationships because of their ability to both break existing linkages and create new ones. When compared with static networks, dynamic networks offer a wider variety of strategies, such as information dissemination, collaboration mechanisms, and consensus mechanisms, among other things. Because of this, the strategic environments of stable and dynamic networks might support distinct approaches; more specifically, the contagion of cooperative and selfish actions may behave quite differently in fixed and dynamic networks. When active user nodes engage frequently in relatively fixed social networks, one of their primary goals may be to find a way to reconcile the conflicting interests of effectively cooperating with others and preventing free-rider manipulation. This is because cooperation is superior to mutual defection (as defecting with a defector is preferable to cooperating with a defector). A common strategy for dealing with this issue is to employ reactive tactics, also known as reacting to the acts of the interaction partners by collaborating with them while they are pleasant and defecting when they are not. In recurrent cooperative games, players appear to either defect unconditionally or employ conditional tactics [35,36,37,38,39].
In contrast, dynamic social networks give rise to the emergence of another goal, which is the recruitment of additional cooperative interaction partners. Individuals may be encouraged to try cooperating, despite the fact that their current relationship partners are relatively uncooperative if they believe (correctly) that cooperators are more likely to establish relations with them when they cooperate. This can be the case even if the individuals’ existing relationship partners are relatively uncooperative. As a consequence of this, less of a connection can be anticipated between the actions of one’s current neighbors and the actions that will take in the future in social networks that are becoming increasingly up to date and in which there is significant potential to attract new cooperation partners.

3. Research Objectives

The objective of this research is to investigate the application of diverse data sources and cooperative learning techniques to analyze the spread of epidemic diseases such as COVID-19. This study emphasizes measuring social spread by observing behavioral changes over time, and establishing a connection between transition probabilities and cooperative approaches. The goal is to propose an algorithm and attention-based cooperative learning method that can potentially enhance disease control and prevention strategies. The research utilizes physical location-based datasets and Twitter data to gain insight into the spread of disease in New York and Florida. Additionally, the study examines the potential of multi-node cooperative problems for determining locations and explores the possibilities of using different data sources to better understand the spread of disease.
The decision spread model block diagram in Figure 1 represents the process for analyzing social and physical data to determine the overall spread factor of an event. The block diagram is divided into four stages. Stage 1 represents the preprocessing and semantic integration of social data by creating an attention-based user category considering physical data events. This stage is important as it provides a deeper understanding of the relationship between social data and physical data events. Stage 2 is physical data analysis using the susceptible exposed infected recovered (SEIR) model, which provides essential information such as hyper parameters for events, infection factor, location spread, and change in spread rate. This stage provides crucial information on how an event is spreading and helps to predict its future spread. Stage 3 represents the cooperation spread and control model [5] to determine the spread variable. This stage takes into account the interplay between social and physical data to determine the overall spread factor. Finally, Stage 4 represents the policy determination and optimization for analysis. The results from the previous stages are used to make informed decisions about how to mitigate or control the spread of an event. This stage is critical for making decisions on how to respond to an event based on the information obtained from the previous stages.
Overall, the decision spread model block diagram shows a comprehensive approach for analyzing social and physical data to determine the overall spread factor of an event. This information can be used to make informed decisions on how to respond to and control the spread of an event.
Here, we provide a solution to test how cooperative attention can predict and learn different actions by asking how the spread occurs by different sources in a social network, where the individual node behaviors depend on a node’s social actions and connectivity with other nodes. We explored this issue using the current pandemic data for COVID-19 collected from Twitter, as well as physical data available from the Johns Hopkins Coronavirus Data Source [40]. In this analysis, the level of connection control was varied conditionally from one user node to another. This was achieved using the dataset in order to find complete information, allowing us to decide on a dimensional approach to separate cooperation with contagion across time, even when bias was possible because of the nature of the homophilic structure. We utilized this dataset to separate the cooperative and selfish node actions and reactions in a dynamic social network. We optimized and created different rules to structurally define the analysis in order to better understand the social interactions and information spread.
In this study, we focused on developing and implementing a novel multi-agent cooperative learning algorithm that leverages social data, particularly Twitter tweets, to analyze and understand the spread of diseases, with a specific focus on the COVID-19 pandemic. To achieve this objective, the following methodologies and approaches were employed:
  • Utilizing reinforcement learning, game theory tools, and complex optimization methods to enable sequential decision-making based on actions and information in a cooperative multi-agent setting.
  • Integrating attention-based cooperative learning and partially observed settings to make the best use of diverse data sources and to simulate states and actions through stochastic games with common rewards.
  • Employing clustering techniques on social data to generate macro actions by learning different scenarios, represented by the spread of yellow, green, and red nodes.
  • Implementing a greedy policy to address decision convergence challenges and to enhance the algorithm’s performance while avoiding action merging in multiple nodes.
  • Developing a policy accumulation mechanism to efficiently distribute the spread decisions within the network and ensure unbiasedness through non-prior information.
  • Conducting a comprehensive evaluation of the algorithm using a dataset of 185,755 tweets collected from January 2020 to October 2020, focusing on the spread of COVID-19 in New York and Florida, and analyzing the results using the SEIR model and natural language processing (NLP) techniques.
The ultimate goal of this research is to provide valuable insight into the correlations between disease spread, information dissemination, and decision-making by addressing the challenges and limitations associated with decentralized decision-making, computational costs, and policy optimization.

4. Methodology

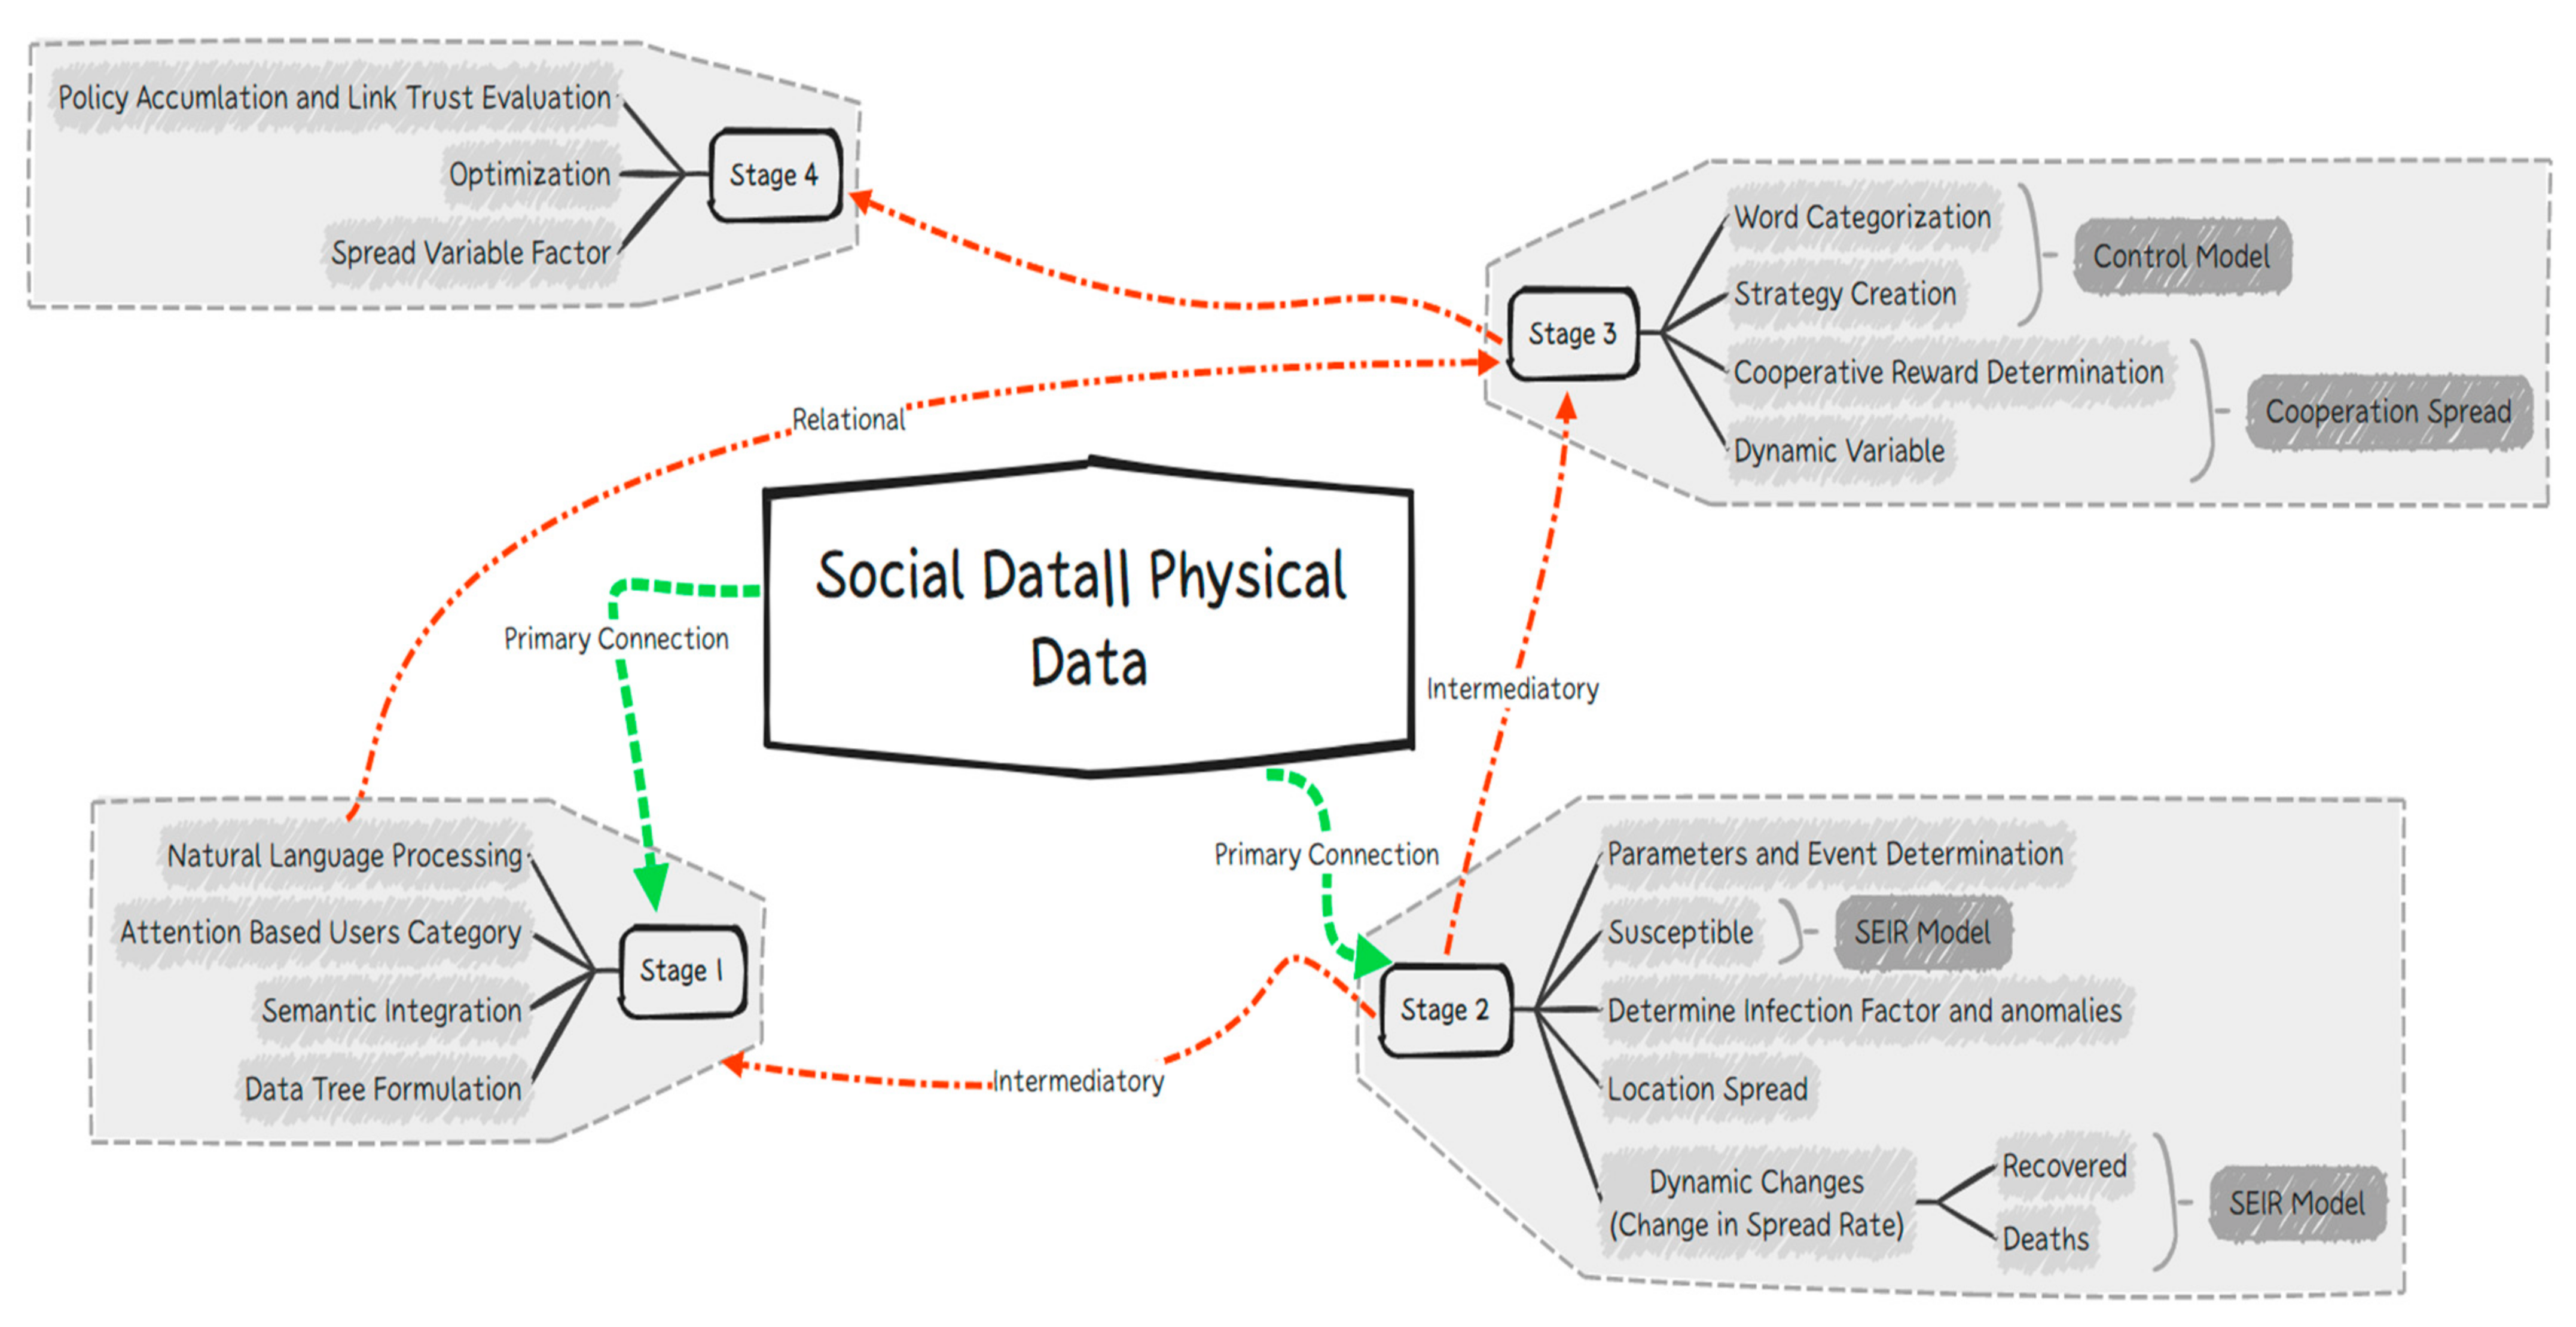
A cooperative learning framework is developed to analyze the spread of epidemic diseases and to leverage diverse data sources, such as social media and traditional public health data. Our approach is based on the use of multi-agent reinforcement learning, where each agent represents a geographical location and makes decisions based on its own observations and the observations of its neighbors. The agents collaborate to determine the optimal policies that minimize the spread of disease while maximizing social welfare. To implement this framework, we collected two types of data: social media data from Twitter and traditional public health data from the John Hopkins Coronavirus Resource Center. Social media data were used to understand the public’s sentiment towards the disease, as well as to identify potential outbreaks and hotspots. The public health data provide information on the number of confirmed cases, deaths, and recoveries, as well as the geographic distribution of these cases. To illustrate our methodology, we provided an example of a tweet that we collected during our data collection phase, namely “Feeling sick today. Staying home to avoid spreading the flu”. Our feature extraction process extracted the location of the tweet, which was used to determine the geographic spread of the disease. The time of the tweet was used to track the spread over time, and the sentiment of the tweet was used to determine the severity of the disease in that location. Our cooperative learning approach used this information to make decisions about how to prevent the spread of disease in that location.
We preprocessed the data by cleaning and filtering out irrelevant information, such as non-English tweets and duplicate entries. We then use NLP techniques to analyze the sentiment of the tweets and identify keywords related to the disease. Next, we used game theory to define the cooperative strategies that the agents could use to make decisions. We formulated the problem as a stochastic game with a common reward function that encouraged cooperation and minimized the spread of disease. The agents used reinforcement learning algorithms to learn the optimal policies, which were updated iteratively based on the observations of their neighbors.
To evaluate the effectiveness of our approach, we use a spread-based analysis that measured the correlation between the spread of disease and the spread of information on social media. We also determined the dynamic variable of the spread rate and optimized the decision model using a control algorithm with complexity of order O n 2 .
As an example, we wanted to understand the relationship between Twitter activity and the spread of COVID-19 in a particular state. Thus, we first collected Twitter data related to COVID-19 for that state, including hashtags, keywords, and geolocation data. We also collected physical data, such as the number of confirmed cases, deaths, and recoveries, from the John Hopkins University COVID-19 dashboard. We then integrated the data and pre-processed it to form a comprehensive dataset. The proposed model was then used to determine the optimal cooperative strategy for analyzing the spread of COVID-19 in that state. A spread-based analysis was carried out by defining the spread variable and using cooperative learning to determine the disease spread rate decision score. The spread dynamic variable was determined through the use of a stochastic game with a common reward, and the results were analyzed to understand the relationship between Twitter activity and the spread of COVID-19 in that state.

4.1. Learning-Based Multi-Agent Cooperation

Learning-based multi-agent cooperation is a framework that enables multiple agents to learn and act together to achieve a common goal. In this framework, agents interact with their environment and other agents to learn and develop strategies that maximize a common reward. The approach is particularly useful in complex scenarios where multiple agents must work together to solve a problem, such as in disease spread analysis. By leveraging learning-based multi-agent cooperation, we can enhance our understanding of the dynamics of disease spread and improve the effectiveness of disease control and prevention strategies. The complete interactions and dependability formulate collective functionalities in a complex network. It was observed that the full cooperation depends on the topological structure of a network with temporal constraints on information links, which constitute the dynamics of the network. The information links are reaction information, which evolve with time, and series of activated events at discrete time. The linked sequence of information dissemination is a state of causal flow, which affects the characteristics of a social network. These characteristics redefine the network structure, which includes clustering, node, controllability, and link length. These show static and irregular patterns of the inter-burst of temporal links. Thus, the systematic encapsulation of these inter-burst temporal links resolves the cooperative decision-making problem in the multi-agent network and require multiagent cooperation for optimized long-term cooperation [18,33].
Assuming nodes x i are choosing actions a i after observing the system link states s simultaneously to distribute the reward γ i (Refer to Table A1 in 
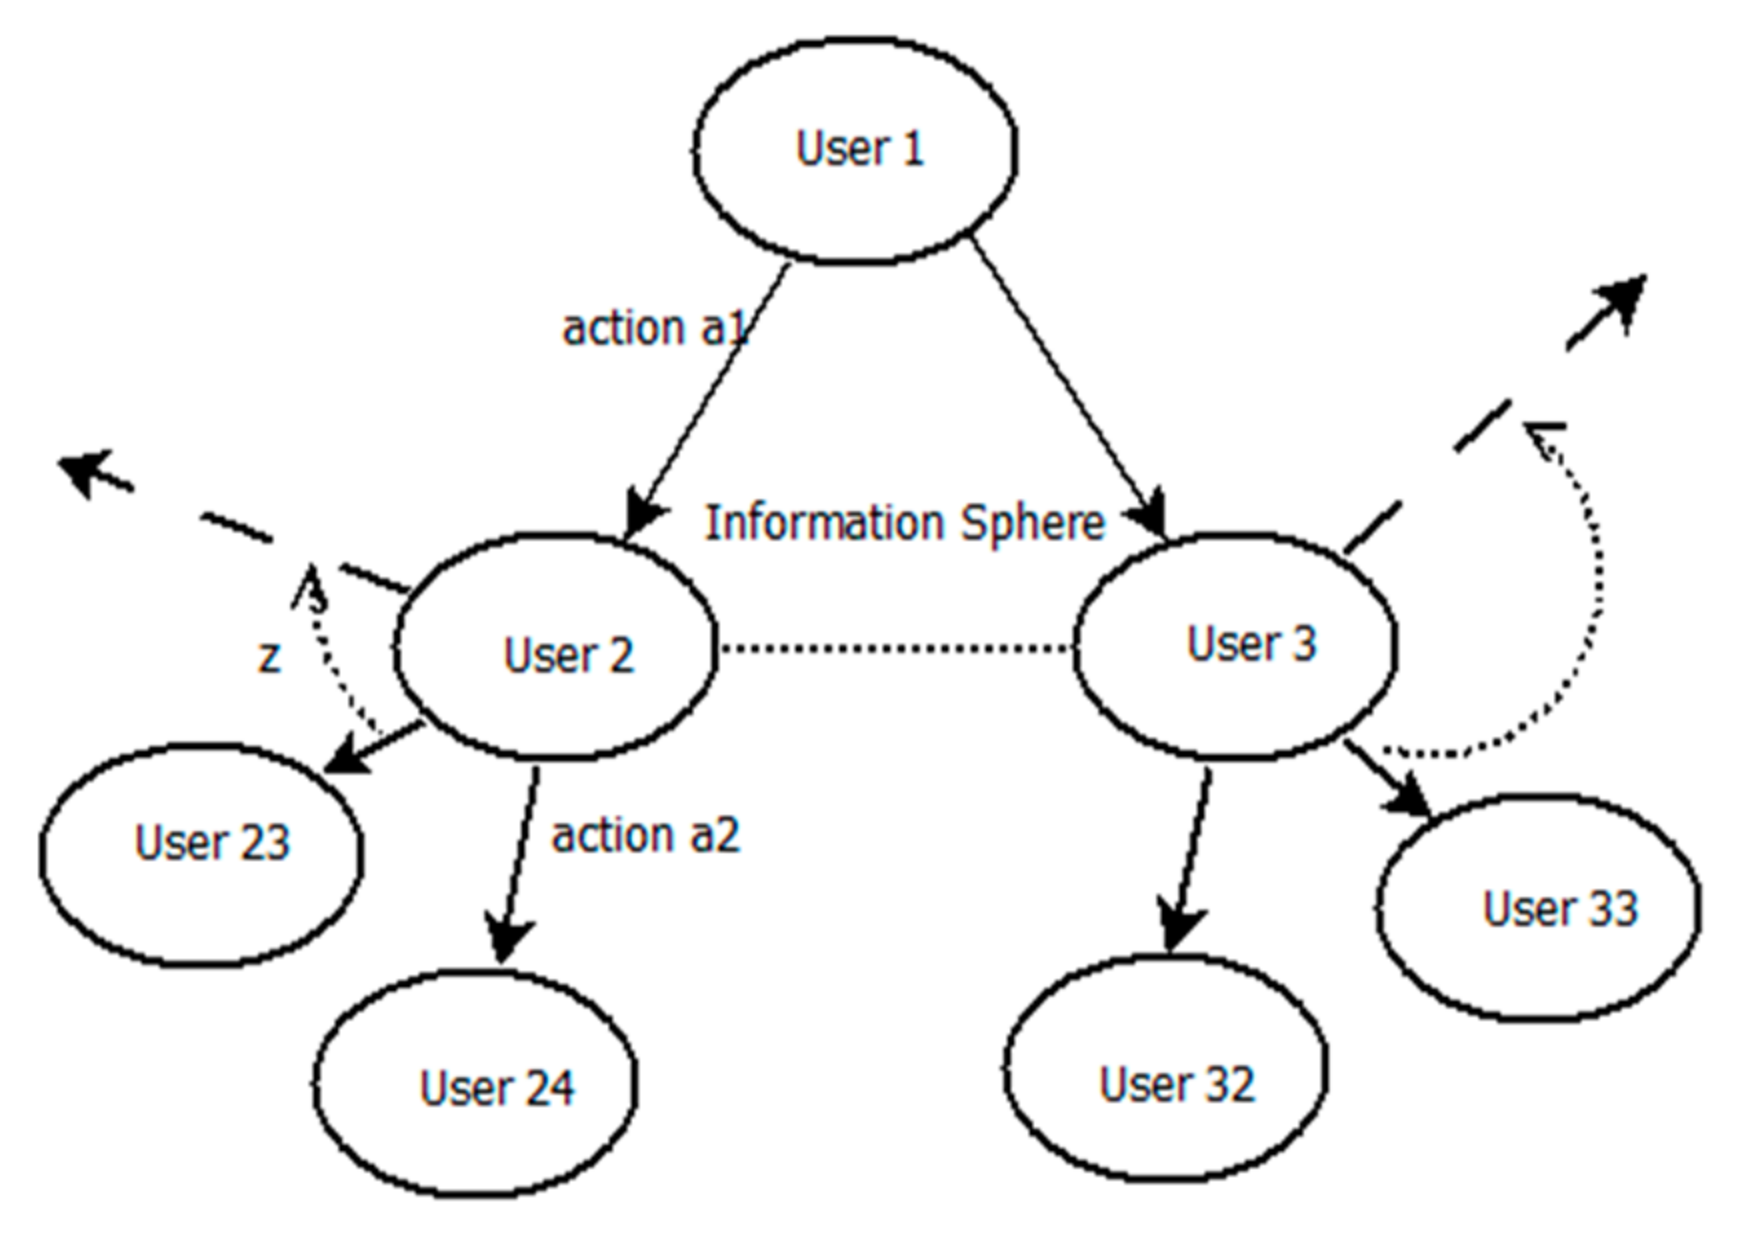
Appendix A for the notations used throughout the paper). Thus, the agents can make decisions and accumulate rewards, as shown in Figure 2. This tree-like diagram illustrates how the agents can make decisions and accumulate rewards based on their actions and the state of the system. It is a visual representation of the relationships between actions and rewards in a cooperative setting, and helps to understand how the agents can work together to achieve the best possible outcome. It displays the information sphere for cooperation, which includes the choices that agents can make and the rewards they can expect to receive based on their actions.
In this figure, the root node represents the initial state of the system, and the branches represent different possible actions that can be taken by the agents. Each branch leads to a different sub-tree that represents the consequences of taking that particular action. The leaves of the tree represent the terminal states, where the agents have completed their actions and received their rewards.
Lemma 1.
Given a multi-agent system, the cooperative algorithm ensures that agents adapt their policies based on local observations, leading to an improved overall system performance.
Proof. 
Assume agents can learn and adapt their policies based on the information available to them. The cooperative algorithm utilizes reinforcement learning to update agents’ policies, resulting in an iterative process where agents make decisions and receive rewards. As agents update their policies, their decision-making process converges towards optimal actions, leading to an improved overall system performance. □
Assuming a variable space containing t states as s t with n actions as a n ; hence, the probable transitions in respect of a Δ s t are stated with reward ( γ ) as P = s t × a n ; γ = s t × a n × s t . Thus, each time t the user chooses action a n , t which causes s t + 1 ~ P E v e n t s t × a n , t to accumulate reward as γ s t × a n , t ,   s t + 1 ; therefore, the function can be defined for n nodes with a trade-off factor of ω   ϵ   0 1 . Suppose we have a state s that represents a person’s health status, and the possible actions are to take a medicine or not. The reward function γ s t × a n , t , s t + 1 could represent the improvement or worsening of the person’s health depending on the action taken. The trade-off factor ω could represent the importance of immediate relief versus potential long-term side effects.
β s = E n > 1 t 0 ω γ s t × a n , t ,   s t + 1 ,   s 0 = s
Hence, for multiple nodes,
β i s = E n > 1 t 0 ω t γ i , n s t × a n , t ,   s t + 1 ,   s 0 = s
Now, to have an optimal reward distribution policy in a cooperative setting γ i , n =   γ i , 1 .   γ i , N , and to obtain global optima, Nash equilibrium is utilized by averaging the reward, i ϵ N , t 0 , n > 1 γ s t × a n , t ,   s t + 1 . Thus, a proper distribution and link formation policy is created by applying a competitive setting i ϵ N , t 0 , n > 1 γ s t × a n , t ,   s t + 1 = 0 to define the link reaction policy ( π ). Suppose we have a multi-agent system where each node represents a different person, and state s represents the current weather conditions. The possible actions could be to go outside or stay indoors. The joint policy function π a s would then represent the probability of each person going outside or staying indoors based on the current weather conditions. The probabilities π i , j a n , i j , t s t would represent the likelihood of each pair of people i , j going outside or staying indoors together based on the weather conditions.
π a | s i ϵ N , n > 1 , t 0 π i , j a n , i j , t s t
where i and j are node links and x i is the neighborhood bond. Hence, the optimal reward link is,
β π i i , j s = E n > 1 t 0 ,   i , j 0 ω t γ i , n s t × a n , t ,   s t + 1 | a n , i j , t ~ π E v e n t | s t ,   s 0 = s
Now optimal joint cooperative policy π i , j : s t i , j Δ a n , t for i, j will be dependent on actions history h i , j ,
τ π t = h : h a h   π p h a | M h S :   τ π i , j t = N p h i , j > 0   h : h a h n   π i , j , p h i , j a i | M h S
where, p h p h = P is the probability of an action user node takes for a policy π P .
β π i i , j s = E [ n > 1 t 0 ,   i , j 0 ω t γ i , n s t × a n , t ,   s t + 1 | a n , i j , t , x i t ~ τ π t ,   s 0 = s ]
The optimal joint cooperative policy π i , j for nodes i and j , is dependent on the actions history h i , j . For example, suppose node i represents a hospital and node j represents a government health department. The actions history h i , j might include information on the number of COVID-19 patients being treated at the hospital, the availability of medical supplies, and the current policies being implemented by the health department. Based on this information, the joint policy π i , j can be determined to optimize the reward distribution for both nodes i and j . To calculate the optimal reward distribution, Equation (5) is utilized, where τ π t represents the probability of a user node taking a certain action for policy π P , and β π i i , j s represents the expected reward for nodes i and j . For example, suppose the joint policy π i , j results in the hospital (node i ) receiving more medical supplies from the health department (node j ) and the health department receiving more data on COVID-19 patients being treated at the hospital. This joint policy can be optimized by calculating the expected reward for both nodes based on the actions taken and the resulting transitions in state s .
The learning-based multi-agent cooperation algorithm is shown in Appendix B.1 to define reward from a single to multimode and policy function for optimal reward distribution.

4.2. Cooperative Learning and Strategy Creation

Cooperative learning refers to the process of agents learning and improving their decision-making strategies through collaboration with other agents. Cooperative learning states the variability in network with the help of reciprocity to maintain the dynamics of the information for unbiased reward distribution by creating a strategy tie for consensus in any two states. This learning strategy constitutes the continuous communication dissemination in a network with continuous and discrete data sources. For example, consider the problem of a cluster of users that are randomly interacting to another cluster of users at any instant. Additionally, the length of the action link and time are not capped (time limitation for each links). However, the reaction can change according to the reciprocity of the user node reactions, thus the user link needs to reach into consensus for reward distribution.
Lemma 2.
Cooperative learning results in the creation of strategies that maximize the collective reward of the multi-agent system.
Proof. 
Assume agents in a multi-agent system can cooperate and learn from each other’s actions. Through cooperative learning, agents update their policies based on the rewards received from the environment and the actions of other agents. This iterative process converges towards strategies that maximize the collective reward of the system. □
Hence, to do this, assume that each user node has an information link of x i where i represents the i th information of reward reciprocity, each user determine the length of time the communication occurs and sets as x i 0 and communicate through a directed graph and undirected graph ρ s , ε [25], where ρ s = 1 , . n user nodes and ε ρ s × ρ s is an edge set of ordered pair of nodes. Assuming the edge i , j ε denotes the user node j which obtains information from i (not vice versa!) (directed) and undirected vice versa works.
Therefore, the amount of information flow is proportional to an accumulated amount of reward link formation. This link accumulation constitutes reactions, actions, and neighbor bond. The dynamics of accumulation of this is a dependent on a consensus breaking factor (CBF) and is designed by having direct messenger link with proportional consensus breaking factor. CBF is defined here as an information bonding link after the node decision. Here, we refer CBF as factors that are depended on influencing information, which can be gathered by other linking constraints to influences as k 0 and k 1 are which are rate of constants of influence and de-influence respectively.
Hence, the establishment of links depends on the rate of reactions with the dependence of neighbor bond. The explanation of the cooperative learning and strategy creation is shown in Appendix B.2. The algorithm states a multi-agent cooperation with class and the constructor as agents, states, actions, reward, and trade-off factors. Here, the reward is used to compute from state and actions, whereas the joint policy and strategy is achieved by computing optimal joint policy [18,29,30,31,32,33]. This is formulated from the below formulation and with respect to a neighbor bond, when given as,
N e i g h b o r   B o n d ( x i t ) = i n f o r m a t i o n   g r a p h   G t i n f o r m a t i o n   s t a t e x t
where G t = 𝕡 i , j t ϵ n × n is a Laplacian communication flow [24] 𝕡 i , j t   i n f o r m a t i o n and x t = [ x 1 . x n ] is an information at any state.
c o m m u n i c a t i o n   f l o w   r a t e   k 0 , i = r a t e   o f   r e a c t i o n   c o e f f i c i e n t λ 0 , 1 exp A c t i v a t i o n   s t a t e   o f   B o n d x 0 , i t / d y n a m i c   e v e n t   c h a n g e   Θ )  
The activation state of bond represents the amount of influence that a node has on other nodes in the network, and the communication flow rate represents the rate at which information is exchanged between nodes. For example, in the context of the COVID-19 pandemic, the activation state of bond represents the level of trust or authority that a person or organization has in providing accurate and trustworthy information about the pandemic. The communication flow rate represents the speed at which information is shared or disseminated among different groups or communities.
We developed a social network formation model with large number of parameters and latent variables. We first allocated values to the unknown variables before testing the model’s validity. We learned the legacy vectors using real-world network observations, assuming the real-world networks were at or near pairwise symmetry, to equip our model with the capacity to match real-world networks. Thus, to construct the latent influence strategy, we defined Equation (9) to establish the optimal accumulated strategy, incorporating the communication link topology. This topology represents the organization and configuration of nodes and their connections within a network, denoted m i j .
k 0 , i π i = λ 0 , 1 e x p ( β π i i , j s min max σ , μ i , j , )
where σ covex and μ i , j concave as joint event evaluation.
Hence, the optimal accumulated strategy is be defined as,
k 0 , 1 i , j π i t = j = 1 n m i j ˙ k 0 , 1 i π i t k 0 , 1 j π i t ,   i = 1 , . n
where m i j defines the communication link topology.

4.3. Spread-Based Analysis for Cooperative Learning

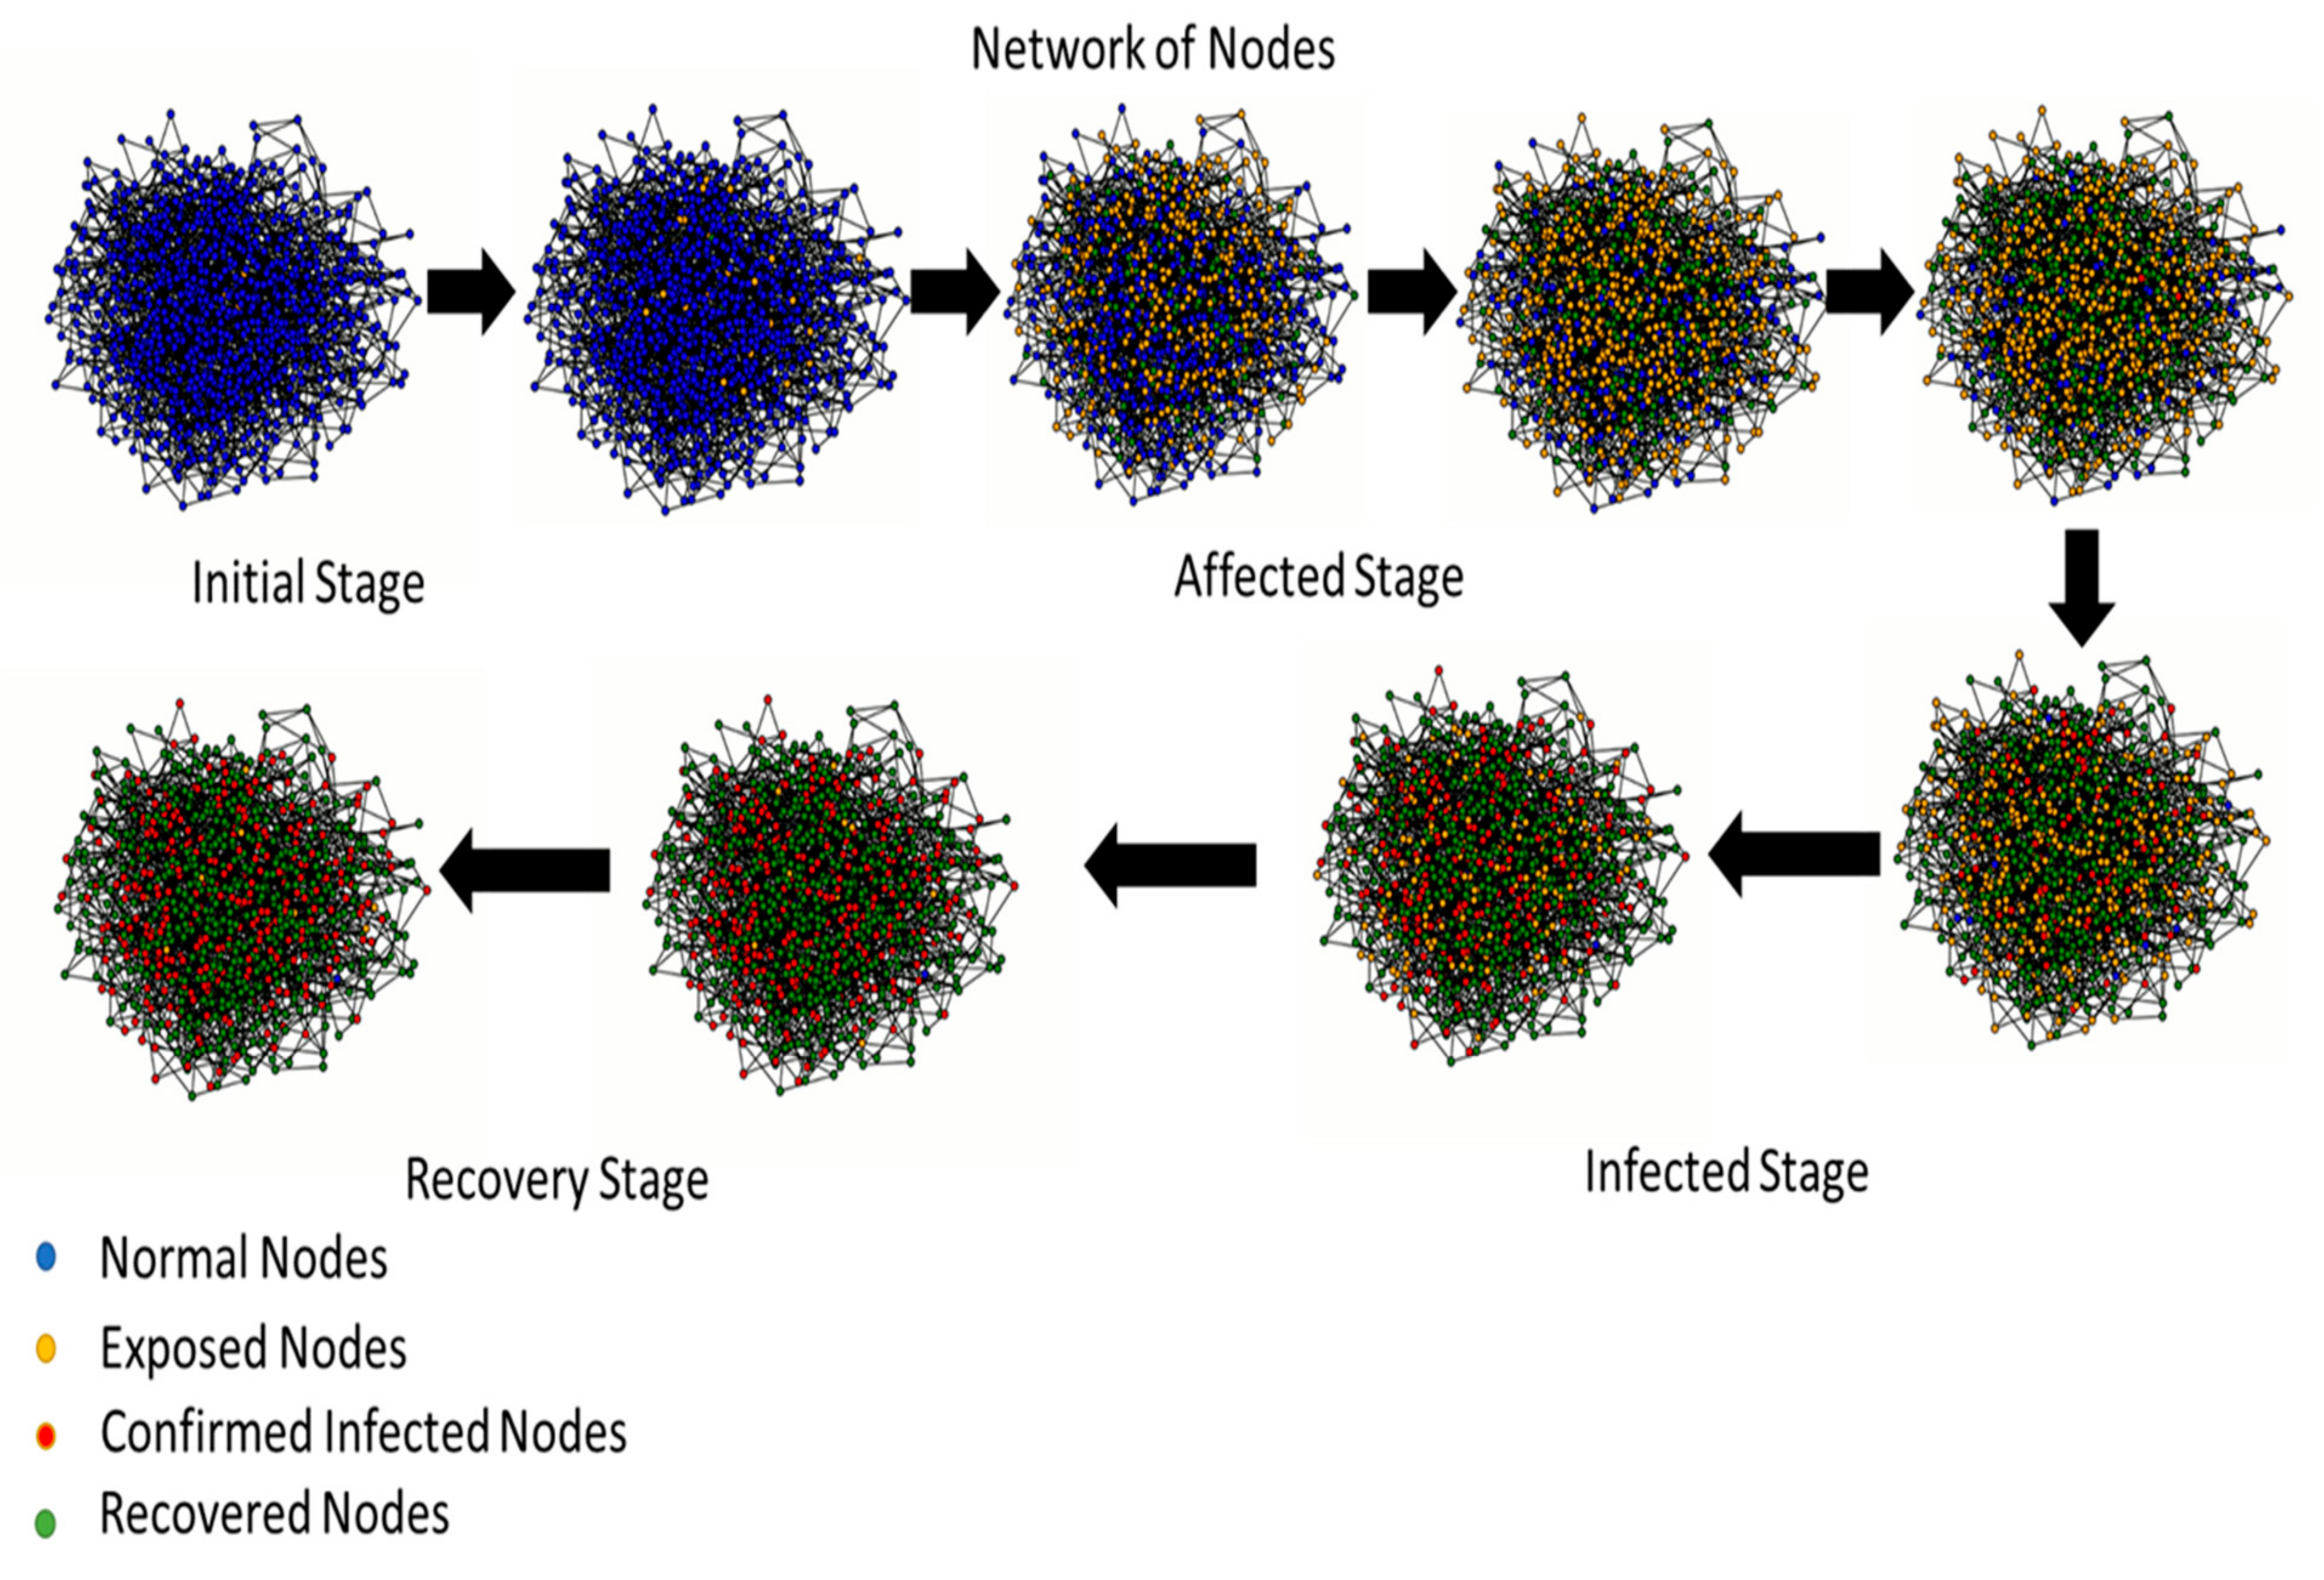
In the context of spread-based analysis, “spread” refers to the dissemination or propagation of a phenomenon, such as the transmission of infectious diseases within a population. Spread-based analysis focuses on understanding and predicting the patterns of this propagation, considering various factors and data sources that may influence the spread. Here, we introduce a spread-based analysis approach for cooperative learning, designed to evaluate the potential of social data in forecasting the spread of disease with the help of the susceptible, exposed, infectious, and recovered (SEIR) model.
The SEIR model is a popular epidemiological model for the spread of diseases. To predict the development of infectious diseases in a community, the SEIR model reflects the progression of individuals through several stages of infection, namely from susceptible to infected to recovered. Individuals are divided into four stages according to the SEIR model [12,31,32,33,34]. Susceptible (S): People in this stage are at risk of contracting the disease, but have not been exposed to it yet. Exposed (E): People in this stage have been exposed to the infection but are not yet contagious. They may not have symptoms just yet because they are still in the incubation stage. Infected (I): People who are in this stage can spread the illness to others. Recovered (R): Those in this stage have made a full recovery from the illness and have developed immunity.
In order to explain how people move between various stages based on variables such as the transmission rate, recovery rate, and incubation duration, the SEIR model uses differential equations. By utilizing these equations, the SEIR model can forecast the progression of the disease over time and assist decision-makers in comprehending the effects of various control methods. In this study, the spread analysis model is defined through reward optimization of a social network with the help of physical network data. The model represents basic stages of susceptible, exposed, infectious, and recovered, in which the probable infections are defined with respect to an event, situation, or state.
Lemma 3.
Cooperative learning enables the multi-agent system to adapt to the spread of a disease, minimizing its impact on the network.
Proof. 
Assume agents in the multi-agent system can cooperate and learn from the spread of the disease. Agents utilize spread-based analysis to update their policies based on the current state of the disease and its impact on the network. As the disease spreads, agents adapt their strategies to minimize its impact, leading to a reduction in the rate of infection and an overall improvement in the network health. □
Here, we propose using cooperative strategy learning, which has a low reward with respect to reward accumulation dynamics. However, to create a consensus in reward distribution, CBF is selected for any unmatched micro events in case of any macro event. The micro and macro events refer to different levels of analysis or granularity when examining events within a system, such as a network or a social setting. Hence, the reward spread is defined as the exponential of the learning-based cooperation, cumulative infection rate, and environment. The spread process is then defined as the maximization of reward spread, which is to maximize the spread estimation ξ s by considering the exponential of the transmission rate between individuals i ,   j , and is formulated as shown below,
S p r e a d   ξ s = m a x π i   [ e x p ( β π i i , j s min max σ , μ i , j , ) × L t   c u m m l a t i v e   i n f e c t i o n   l o c a t i o n   r a t e × η t   D y n a m i c   E n v i r o n m e n t   V a r i a b l e ]
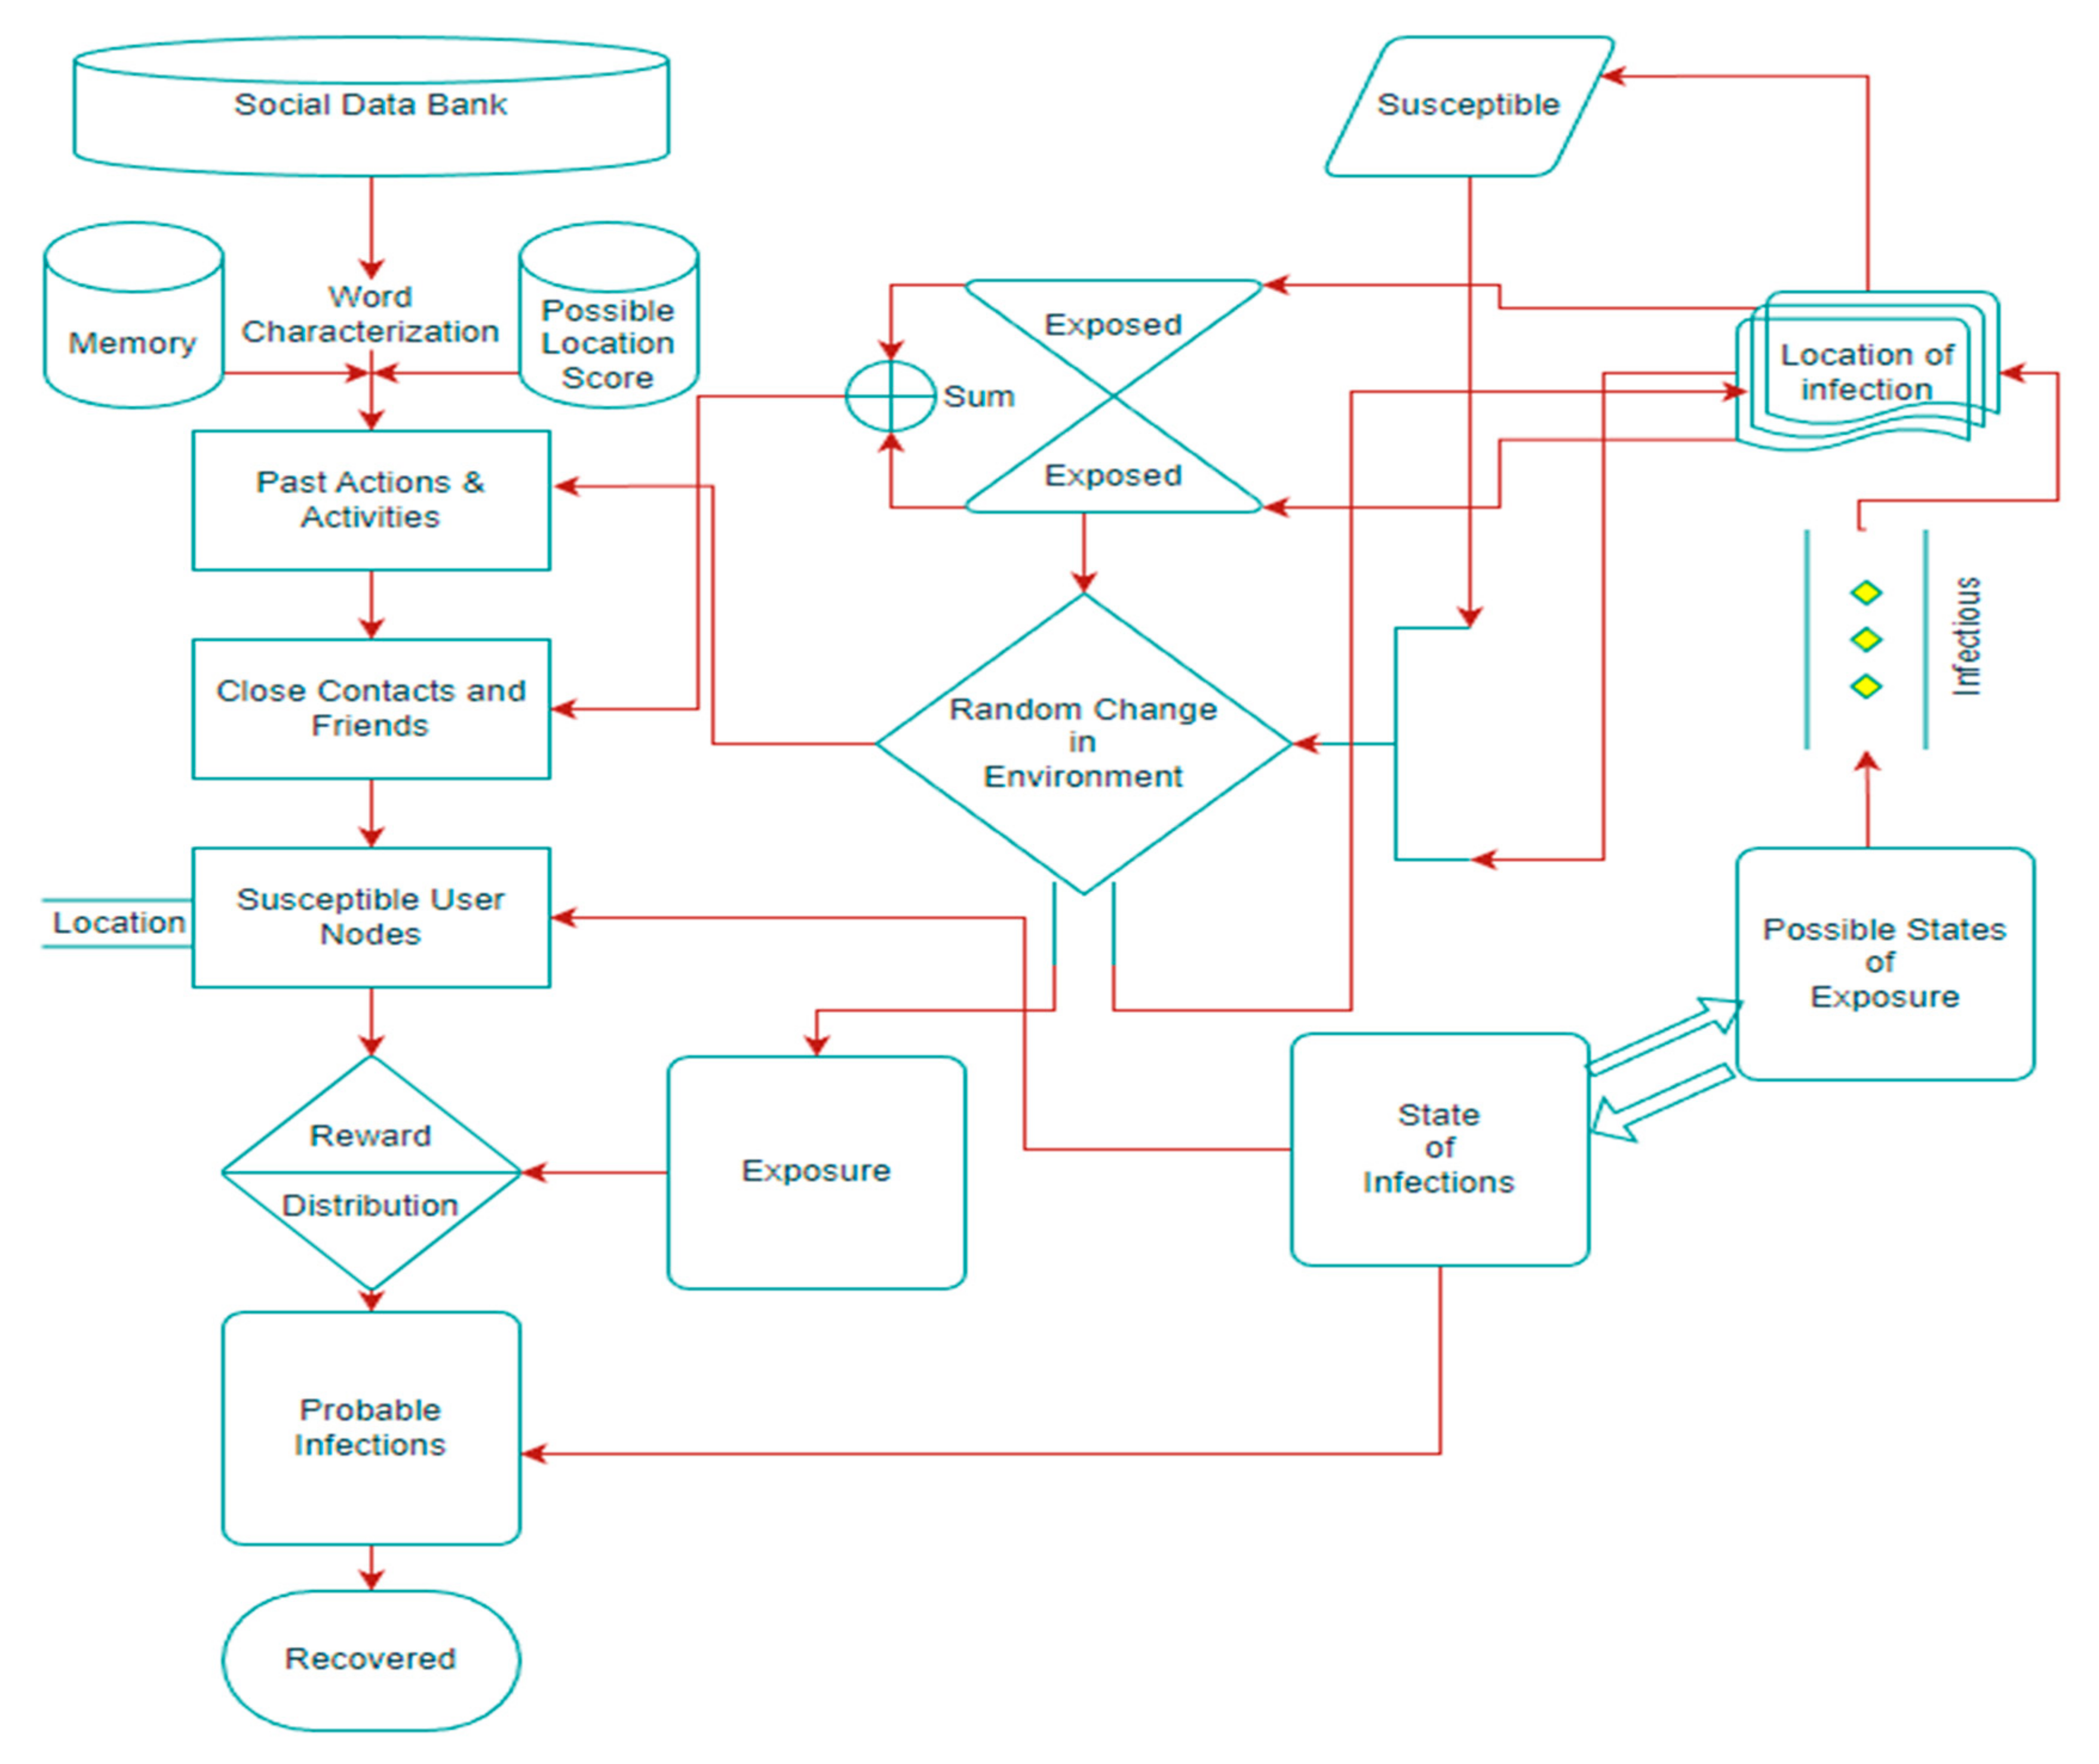
This is considered in order to understand the spread and reward processes considering granularity. The social data bank analysis provides a building block to identify susceptible nodes by monitoring the activities of friends and relatives. The algorithm achieves this by scrutinizing word clusters and identifying hidden outbreaks within the network. These rewards and allocations help track the progression of disease and offer insight into its impact on different individuals and communities. The SEIR model serves to simulate the dissemination of infectious diseases, providing information on parameters such as event occurrence, infection rate, geographical spread, and alterations in the spread rate. The SEIR model is supplemented by data from physical sources, contributing to a more accurate representation of the disease’s propagation.
The method shown in Figure 3 incorporates microenvironment and random change exposure effects, along with social data bank analysis. This increasing complexity represents the diverse factors affecting disease transmission, such as climate change, population mobility, and public health initiatives. Random change exposure effects reveal the disease’s impact on various individuals and communities, influenced by factors such as behavior, socio-economic conditions, and public health measures. The algorithm includes a block for past actions, assisting in tracking the progression of disease and understanding its influencing factors. This block uses data from the SEIR model and social data bank analysis to determine optimal measures and policies for preventing and slowing the spread of disease.
Our proposed technique merges attention-based cooperative learning with a partially observable setting, allowing for the efficient utilization of diverse data sources to predict disease dissemination. The spread-based analysis offers comprehensive insight into the reliability of social data for predicting the spread of disease, while the cooperative learning algorithm uses the SEIR model to predict the spread in specific locations, as demonstrated in Appendix B.3. The model algorithm takes into account various factors, namely transmission, recovery, and the incubation period, concerning social data to forecast the spread. The algorithm calculates the disease spread by considering the combined effect of these factors in a cooperative manner, exponentially emphasizing the importance of each factor’s contribution and accounting for the cumulative effect of these factors over time in a dynamic environment.

4.4. Determination of Spread Dynamic Variable

Determining the spread dynamic variable is a critical aspect of understanding disease transmission. In the current pandemic situation, developing effective methods to gauge disease spread has become increasingly vital. The spread dynamic variable represents the rate at which a disease is transmitted from one person to another, influenced by factors such as infection rate, location, and time. The selection of dynamic variables is best suited for statistical tests or criteria that employ automatic variable selection techniques to optimally fit the sample based on statistical information criteria, including stepwise regression and shrinkage methods. When selecting a variable, the pros and cons are always considered as potential factors for defining and selecting a model in order to justify the global optimal criteria, where the variance of outcomes changes over time and increases the number of computations. It is known that as variables increase, the model’s complexity grows exponentially. Consequently, when time series data incorporate dynamic variables, the correlation may generate nonsensical relationships that affect accuracy and precision [30,33,34,35].
In a dynamic social network, the data source consists of discrete timestamps for a specific period, where interconnected nodes have a high likelihood of forming strong reciprocal links, creating a dynamic cluster. However, this dynamic cluster poses a challenge, as it can cause long-term bias in the social network. Smaller perturbations can lead to significant changes in relationships and bonds within the network, which can be identified as variances from the current state. As a result, small changes can lead to increased variances in link reciprocity due to alterations in the network and the presence of unnecessary links (noise). Furthermore, a cooperative strategy is employed to detect these temporal links and achieve optimal information dissemination.
Lemma 4.
The spread dynamic variable (SDV) quantifies the relationship between the spread of the disease and the actions taken by the multi-agent system.
Proof. 
Assume the spread dynamic variable is a function of the disease spread and the actions taken by the multi-agent system. As the system adapts its policies to minimize the impact of the disease, SDV reflects the effectiveness of these actions. SDV converges as the multi-agent system learns to optimally respond to the spread of the disease, quantifying the relationship between the system’s actions and the disease spread. □
To maximize the objectivity of this strategy, we optimize the function by compositing two or more variables, which results in better network topography by defining the cost difference of the objective function. Assuming the linear objective function is given by the changes in nodes evolution x over the period of t, d x d t = k i k i + 1 x . If the variable environment is stationary for a given time interval, the parameter k i and k i + 1 will result in the following constraints,
x t = x m x m x 0 exp k i + 1 t
where a steady state x m = k i k i + 1 and x 0 ~ i n i t i a l   v a l u e , and the dynamic variable will be defined as,
η t   π i i , j = exp k 0 , 1 j π i t k 0 , 1 i π i t min max μ i , j
Hence, the optimal cooperative spread will be defined as,
O t π i = η t   π i i , j η t   π 0 1 , 0 η t   π n n , n + 1 η t   π j j , i η t   π 0 0 , 1 η t   π n n + 1 , n = t 0 i , j ϵ N 1 exp η t   π i i , j 1 χ i , j π p h i , j 1 exp ( i , j > 1 η t   π i i , j σ t χ i , j + η t   π i i , j σ t + 1 1 χ i , j ) π p h i , j
χ , is a critical state for determining action.
Here, Equation (12), represents the changes in the evolution of nodes over a period. Here, x t is the value of the node at time t ,   x m is the steady state value, x 0 is the initial value, and k i + 1 is the parameter that determines the rate of change of the node. The equation shows that the value of the node approaches the steady state value exponentially over time. Equation (13) calculates the spread dynamic variable (SDV), which measures the relationship between the spread of a disease and the actions taken by the multi-agent system. Here, η t   π i i , j is the SDV between nodes i and j at time t ,   k 0 , 1 j π i t is the number of connections from node i to node j at time t in the cluster π i ,   k 0 , 1 i π i t is the number of connections from node j to node i at time t in the cluster π i , and μ i , j is a normalization factor. It calculates SDV as the difference between the number of connections to node j and the number of connections to node i, normalized by the maximum and minimum value of SDV. Hence, Equation (14) determines the optimal cooperative spread in the network, given the SDV and a critical state of action determination, χ . The equation calculates the probability that a susceptible node will transition from cooperation to defection or from defection to cooperation, based on the determined SDV and the critical state of action. The equation involves multiple parameters such as π i , which is the cluster at time t , where π p h i , j is the probability of a node h to take an action in cluster π i , and σ t is the probability of a node to take a specific action at time t .
The method determines the network configuration at any given time by utilizing clusters extracted from the previous time step. This approach introduces a two-stage event-based adaptive algorithm, illustrated in Figure 3, which employs an event-tracking system. For each time step, the associated components of the spread collected from the last timestamp serve as the initial information for the state. The distribution surrounding the seeds is established by optimizing the ratio of the average internal and external degree of information of the local cluster. The bursty nature of social networks contributes to the complexities of various social and economic phenomena. This event-based spread implicitly acknowledges that network links change over specific time periods. This spread analysis highlights the bursty character of social networks [37,39,41,42,43], where the dynamics of social and economic impact are compared for spread analysis.
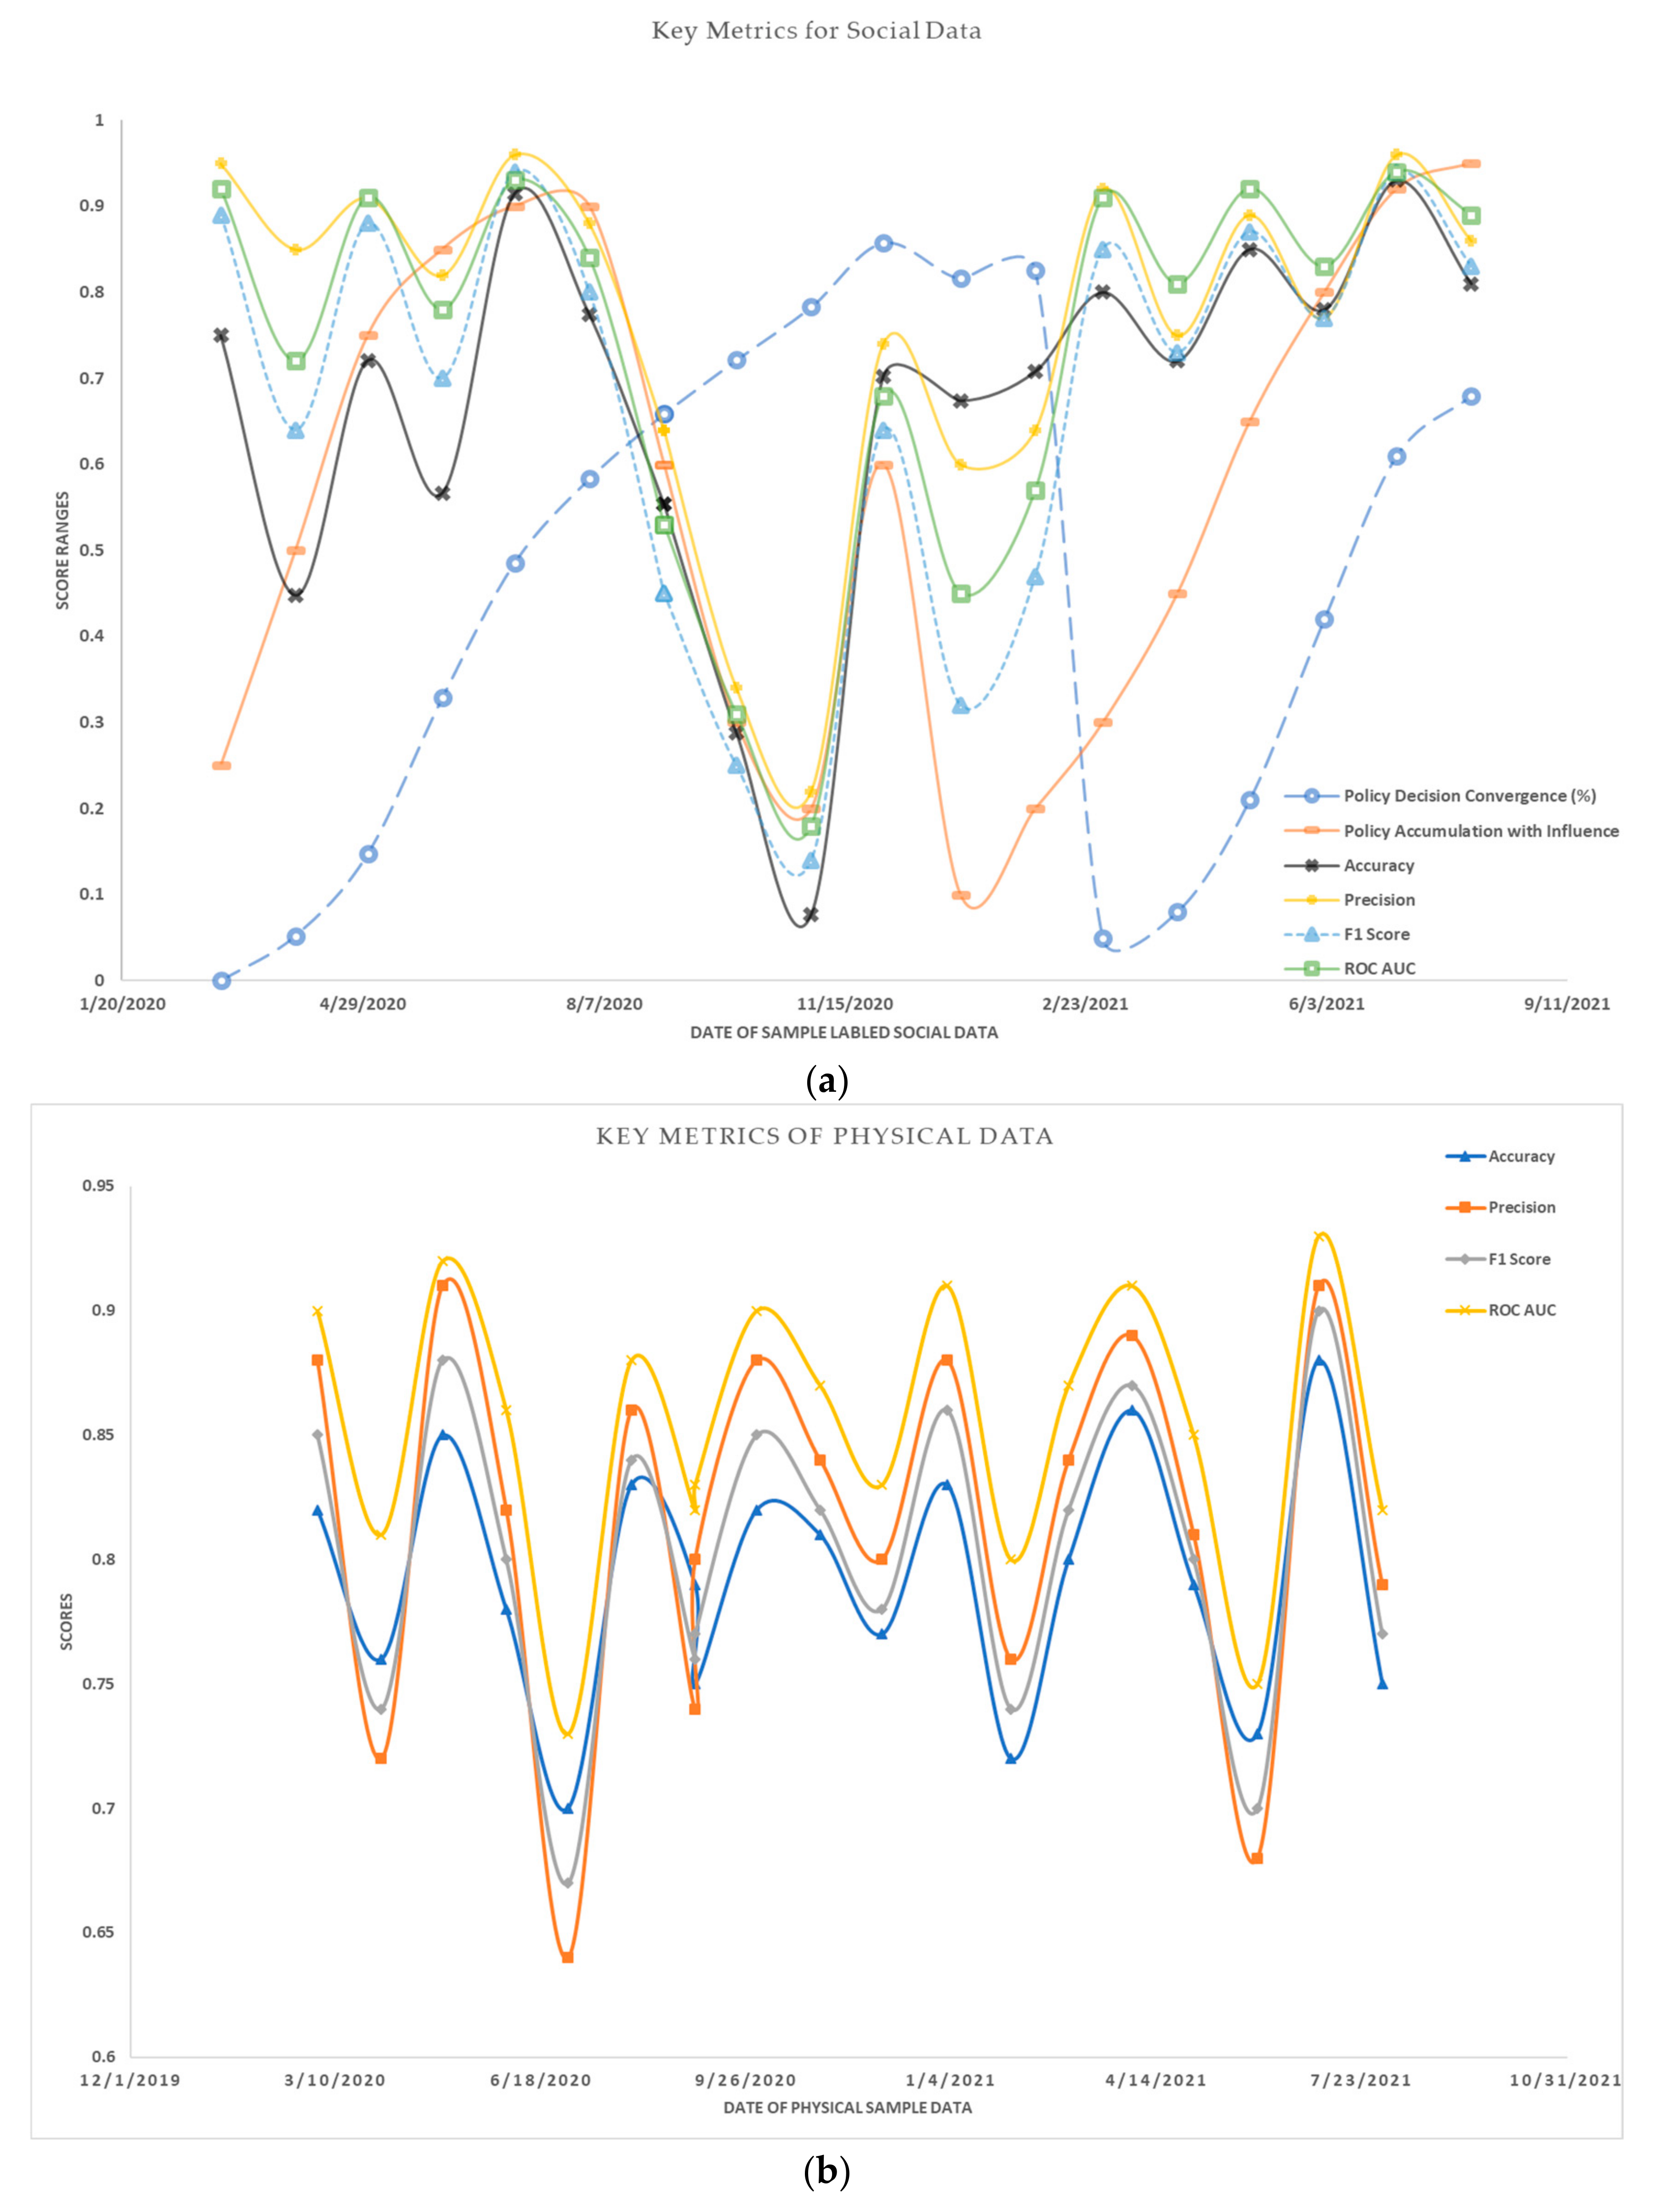
Social network analysis offers a method for examining communications and relationships within groups, providing various measures for understanding and quantifying the spread of information, influence, or other characteristics within a network. To ascertain situational spread, it is essential to have a clear understanding of the cumulative infection location rate L t . To achieve this, information fusion is employed to identify the relationships between objects. In such contexts, one approach to reduce the knowledge presented to the user involves classifying objects based on their capacities or properties [18]. However, in some instances, it may be more beneficial to recognize the observed entities solely according to their relationships with other entities. This relationship is measured through a similarity computation using the Cosine model for a CF model [25,35].
L t x i t ,   a i ,   u = u j i , j ϵ N UserSim u i , u j × r x i t , a i ,   u j r ( x i t , a i ,   u j ) i , j | UserSim ( u i , u j ) |
where u represents a location rating for the spread corresponding to each action. The location rate calculates the cumulative infection location rate L t by considering the similarity between users UserSim and their relationship with other entities. It takes into account the observed entities and their relationships, providing a metric to measure the spread of influence or information within the network. This analysis is conducted using Twitter data related to COVID-19 and physical data obtained from the Johns Hopkins website [40].
To identify vulnerable nodes, word categories were grouped into positive feelings regarding COVID-19. The study created a sampling space with homogeneous spread and actions, but did not fully represent influencing locations. Positivity rates in specific cities were calculated using physical data and similarity scores to map exposed users. 
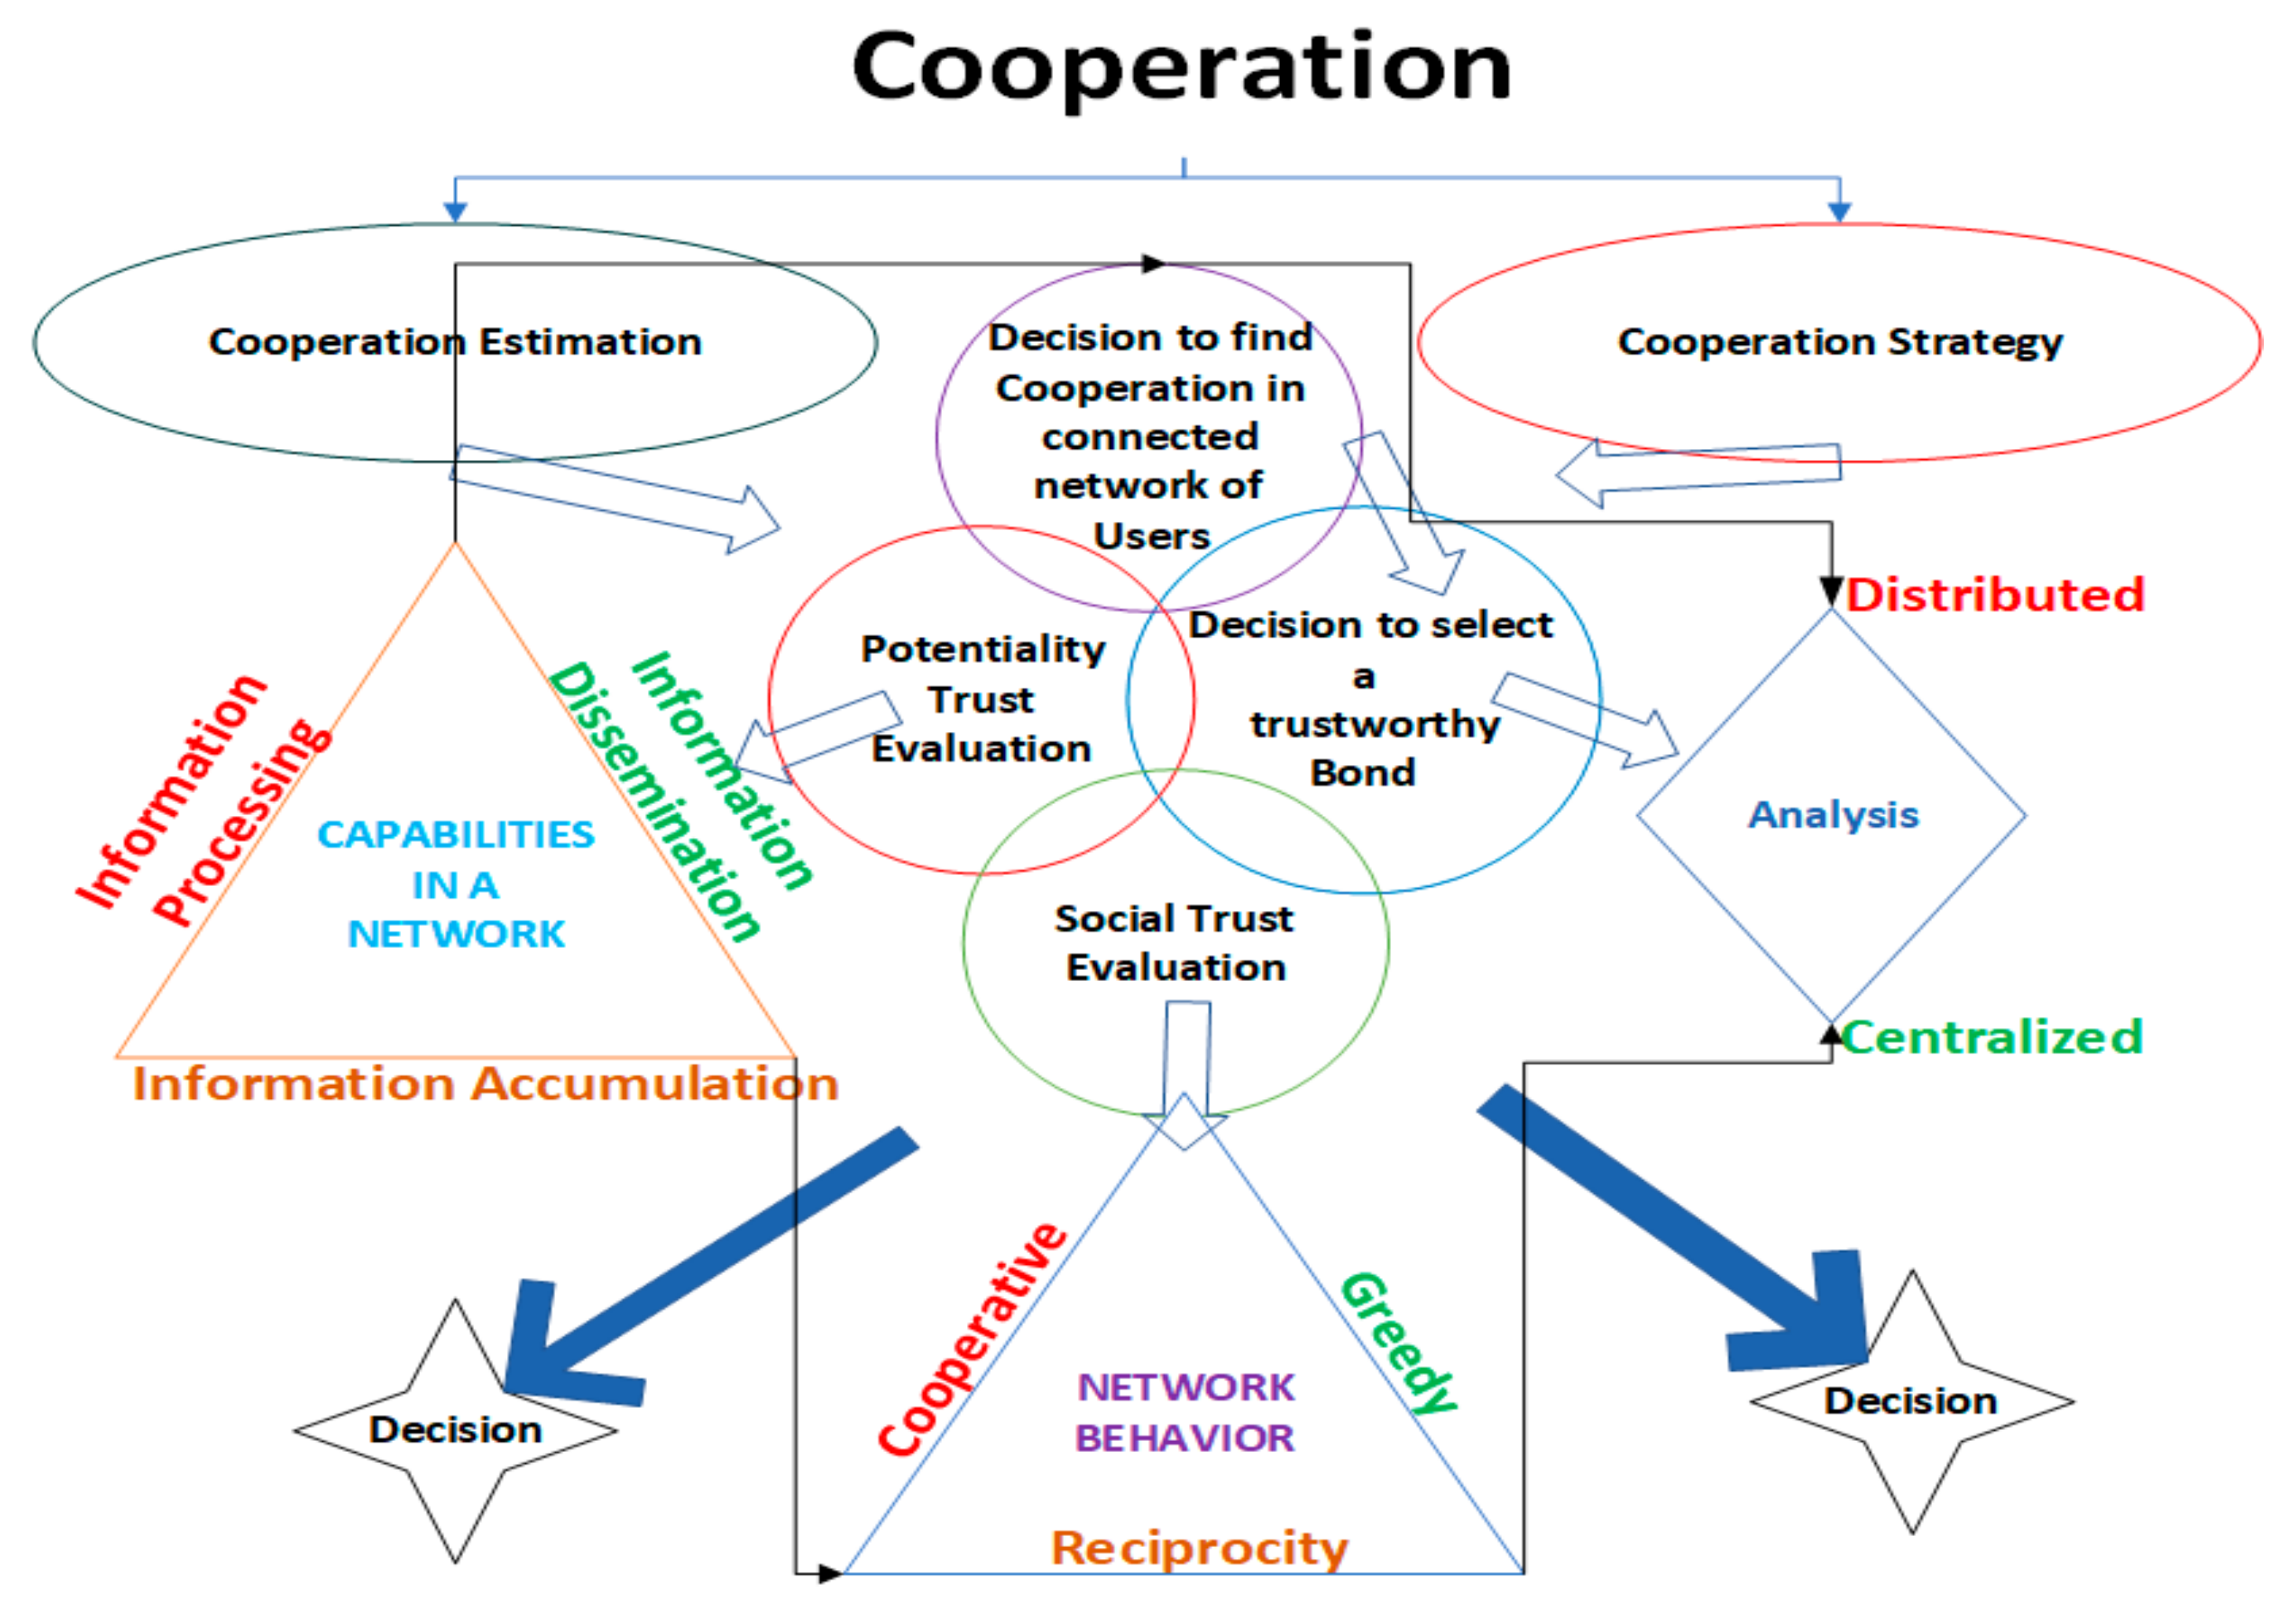
Figure 4 shows that a cooperation estimation and strategy are key components, involving information processing and network distribution. A triangular agenda visually represents this, and the data assess social trust, trust likelihood, and reciprocity-based network actions. Distributed analysis, decision-making, and reliable network ties form the cooperation strategy to foster social trust and effective cooperative spread.
As we know, the social and physical network establishes a multiagent system that is based on decentralized cooperation. It represents the nodes that forward critical information about events or situations in possible conditions. The situations are filtered from the data gathered from physical locations that are behaving abnormally from the threshold values at that time interval, corresponding to the social data. This leads to categorizing the words from the social data in ascending order. The first level is physical data, as per Twitter user-based importance. This data directly relates to user updates copied or correlated with agencies’ reports. This is the raw critical information categorized from real-time data using physical data. Assuming each user network node u X , where X is a set of all of the network nodes, with the capability to perceive a local and global directed and direct path for link reciprocity. Each node x i receives observation as y i via a noisy observation link A i : s p y i   , such that the node i observes a random variable y i ~ A i E v e n t | s for the environment state s . Thus, the collective information links is defined as [5],
I t i = A i , O t π i j ϵ N ( S p r e a d   ξ s j i ) : t = 0 t 1 A i t
Therefore, utilizing the control algorithm [5],
Κ g ϵ p s p , t , I t i = ρ = max g . [ i = 1 ρ l i τ i I m l a t i + 1 λ 1 λ 2 . t = 0 ,     T i = 1 N [ x i γ , t + 1 I m C a t i ] + A γ , t t + 1 { λ 1 C t j = 1 m   C T S c o r e j y j . I m C a t i + λ 2 C E k = 1 p S S k z k m a x i T , S S k I m C a t i } ]
As time passes, the size of information increases, leading to memory utilization challenges. To address this issue, the latent space is defined using weight sharing and an attention mechanism that incorporates a policy adapted to the multi-agent environment. 
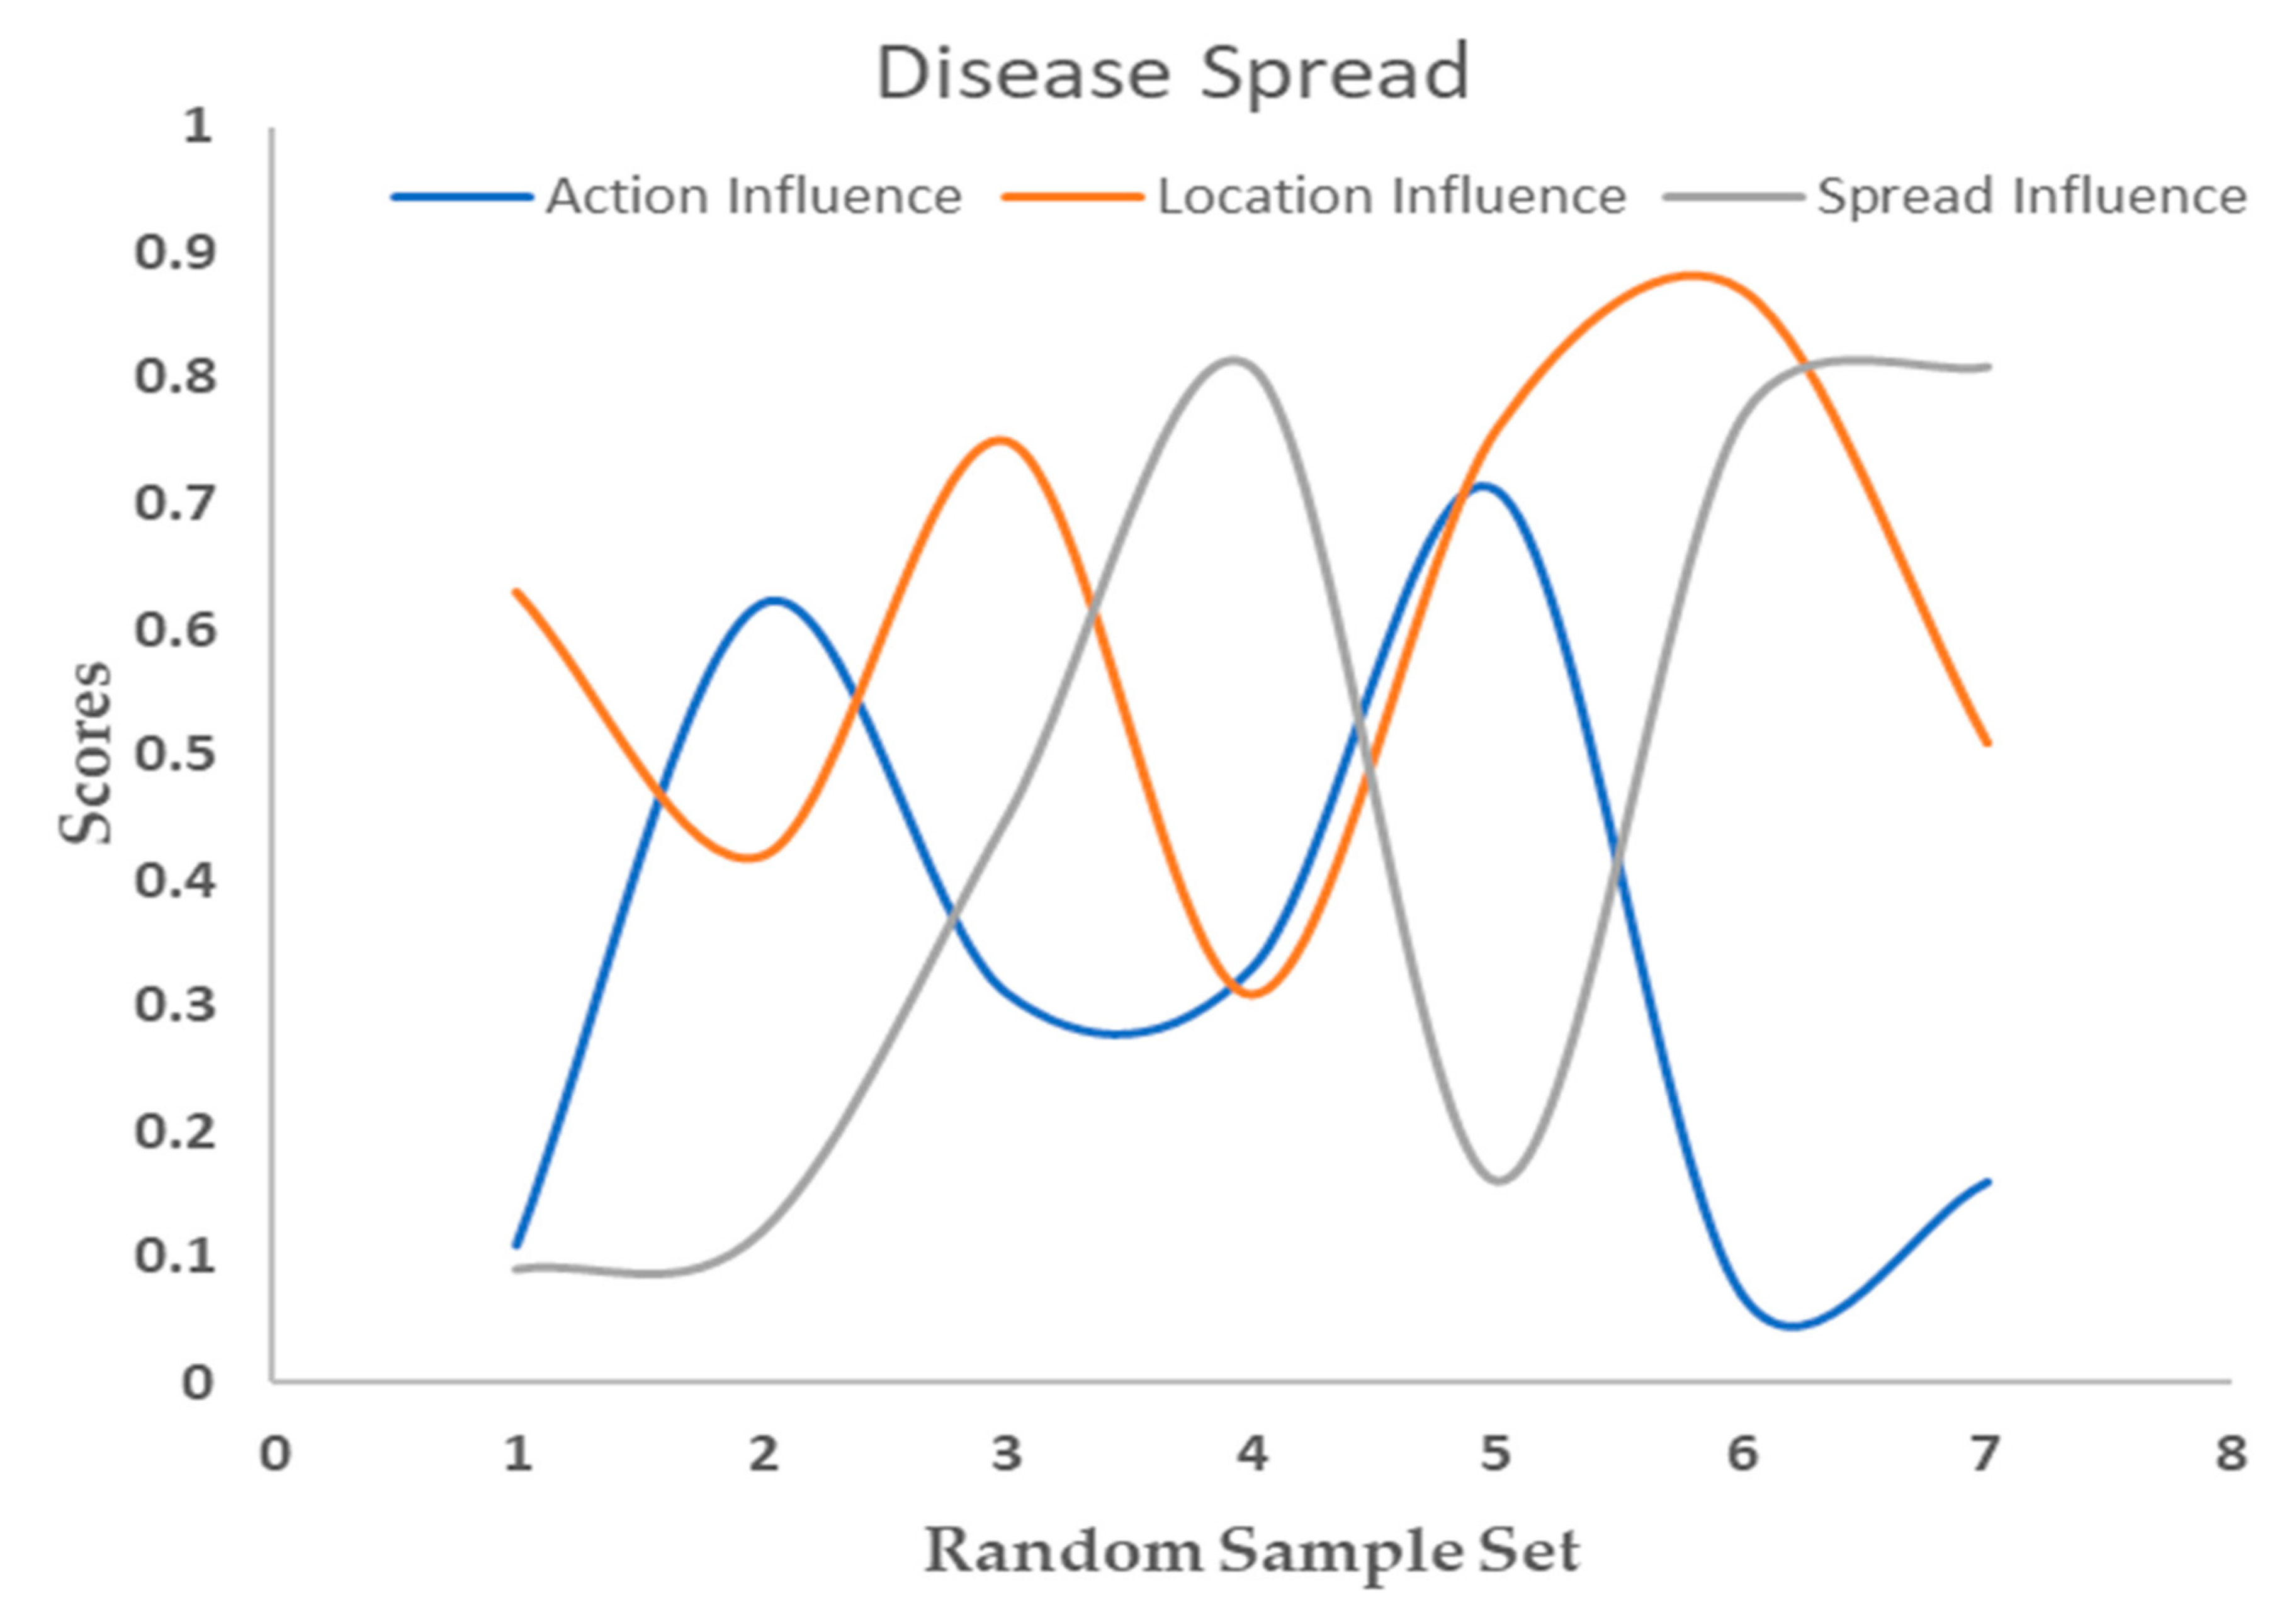
Figure 5 presents the effects of various factors on the spread for decision-making policies within a network. The figure demonstrates the analysis results obtained through a control algorithm for sampled space, action influence, location influence, and spread influence. Furthermore, social spread is observed by measuring behavior changes over time using location-based COVID-19 datasets from the US. This approach, adapted from previous work, focuses on data source changes rather than behavior frequencies. Figure 5 reveals a relationship between spread and action influence, as well as their cumulative effect. Influence spread is examined using influence space scores, and action space helps assess network cooperation and trust. It presents the adaptive algorithm results for a 49,999-node sample space, showing the influence scores, policy accumulation, and spread decision rates for seven nodes. Influence scores (0–1) indicate node impact, policy accumulation (0–2.56) refers to decision-making policy buildup, and spread decision rates (0.05–0.32) represent policy dissemination rates.
Nodes with higher influence scores have higher policy accumulation and spread decision rates, implying greater effectiveness in decision-making and policy dissemination. Higher spread decision rates correlate with higher policy accumulation, indicating that effective policy dissemination leads to greater policy accumulation. This information can identify key nodes and optimize the spread of policy decision-making. This knowledge can be applied to improve network resilience, particularly in situations where cooperative behavior is essential. By understanding the dynamics of social spread and focusing on influential nodes, it is possible to promote cooperation and trust within the network, leading to better decision-making and more effective policy implementation.
The sampled space represents the number of individuals in the network capable of making decisions and influencing others. Action influence measures the impact an individual’s actions have on the dissemination of decision-making policies within the network. As shown in Figure 5, the highest action influence value was 0.71, while the lowest was 0.07. Location influence quantifies the effect an individual’s location has on the propagation of decision-making policies throughout the network. In Figure 5, the highest location influence value is 0.87, and the lowest is 0.31.
The spread influence measures the collective impact of the network on the propagation of decision-making policies. This information reveals that the dissemination of decision-making policies within a network is affected by individual actions, location, and the overall influence of the network. Upon examining this data, it becomes evident that the spread of decision-making policies in a network is not exclusively reliant on a single factor; rather, it is shaped by a combination of various factors. This underscores the significance of taking into account both individual actions and network influences when assessing the distribution of decision-making policies in a network.

5. Analysis and Discussion

To analyze the data, nodes share rewards with other nodes in the network based on local observation [28,29,40]. We solved the model using a combination of influence data, policy optimization, Monte Carlo tree search (MCTS), and sampling for policy iteration.

5.1. Observation Model

The setup is designed for a cooperative setting with partial observability, characterized by a decentralized nature in which nodes share rewards with all other nodes concerning the reward function and transition model, except for the difference in neighbor bonds. Each node in the network has local observations for any state s , without reciprocity links to other agents and without maintaining a global belief vector. To solve this model, influence data are used to identify the observation points for all nodes, which are then optimized by defining policies using the influence data [5,40]. This process maps local observation histories to actions, determining the predicted spread. Monte Carlo tree search (MCTS) and sampling are used for policy iteration.
For multi-agent networks, MCTS actions are either predefined or set in a default offline state by defining the action space. However, our model employs a search process in which actions are repeated for flexible operation within a sampled hierarchical system. In this setup, user nodes simultaneously choose actions without knowing the future actions of other nodes, receiving immediate intermittent rewards for transitioning to another consecutive state. However, the transition states are dependent on each node’s actions. Each state agent aims to maximize cumulative rewards by following the optimal policy using the ε-greedy search algorithm [35],
π t i , j a i | s t = 1 ε + w m i n X , Y       i f   a = a r g m a x a ϵ A = Κ g ϵ p s p , t , I t i = ρ w m i n X , Y o t h e r w i s e
The search space for multi-node networks presents several key challenges, such as asynchronous decisions, flexibility, and extensive cooperation. Asynchronous decisions arise in a multi-node network due to varying link durations and asynchronous endpoints, leading to different reward accumulations. To address this, a strategy that enables decentralized synchronization is necessary, allowing each node to make independent macro decisions. Furthermore, a network’s policy should be designed to be learned and adapted, ensuring flexible adjustments in response to events or anomalies. Relying on predefined nodes may result in biased systems with limited actions. In addition, extensive cooperation is essential to maintaining system flexibility. The network should disregard primitive actions that are unsuitable for real-time changes in information (φ). An option policy is introduced based on the action space when π(s│a) = 1, and flexibility termination is 1, then φ→s.

5.2. Evaluation Points and Results

The evaluation of the proposed algorithm for multi-node networks focuses on learning nodes, quick convergence, and robust solutions for both cooperative and non-cooperative links with the key performance metrics. By cross-referencing the system state and selecting communication strategies based on random starting action links, the algorithm reduces computational costs. It learns from clustered social data on key sentiments and chooses macro actions, which enables efficient decision-making and policy implementation [5]. The algorithm makes decisions quickly to avoid action merging and implements a greedy policy to improve performance. Each scenario is indexed with an initial variable of 0 to a desired indexed γ d i s .
To ensure the smooth functioning of the algorithm, several assumptions are made, including the need for pre-existing data, the requirement for nodes to communicate effectively, and the selection of a cooperative strategy after message exchange. Additionally, a random selection of starting action links is assumed to reduce computational costs. The algorithm effectively generates macro actions by learning from various scenarios depicted by clustering nodes, as shown in Figure 6, in different stages of the spread of COVID-19. Figure 6 depicts the various stages of clustered nodes, including the initial affected, infected, and recovery stages. The figure demonstrates the spread of infection as the simulation progresses and the algorithm learns macro actions to control the spread. Monte Carlo tree search (MCTS), along with a cooperation factor, is employed to control the nodes, enabling effective management of the spread.
Decision convergence is crucial for the algorithm’s performance, as it replicates reward distribution and eliminates action merging cases for multiple nodes. Implementing a greedy policy improves performance while increasing the number of iterations. Policy accumulation plays a vital role in efficiently distributing spread decisions in the network. By utilizing decentralization for multi-node networks, the algorithm allows for asynchronous decision-making and unbiased policies. This approach improves the accuracy of the results and enables the optimal distribution of spread decisions in the network, providing valuable insights for researchers and policymakers in response to the COVID-19 pandemic.
The collected data consisted of 185,755 tweets with an average of 65 words per tweet, giving a word cloud of 76,781 words [44]. The physical data were analyzed using the SEIR model to define the rate of infection and map the accumulated location infection rate. In order to assess the results and policies of the algorithm, key metrics were used as critical performance indicators to evaluate the effectiveness of decision-making policies in controlling disease transmission in a social network. These metrics include infection state, policy decision convergence, and policy accumulation with influence. The optimal cooperative spread metric can be used to identify the most influential nodes in the network and optimize the spread of decision-making policies. These metrics can be measured using accuracy, precision, F1 score, and confusion matrix to ensure the validity of the results and can be seen in Figure 7a,b. Table 1 shows the location and key metrics to predict infection state in the US states of New York and Florida.
Figure 7a,b shows our evaluation assessing various performance metrics such as accuracy, precision, F1 score, and ROC AUC at different time points. In Figure 7a, our analysis showed that the decision convergence was generally high across all locations and time points, with an average convergence rate of 67%. We found that policy accumulation with influence played a significant role in determining the model’s performance metrics. A higher influence score was associated with better accuracy, precision, F1 score, and ROC AUC, indicating the importance of cooperation and attention-based analysis for optimal decision making. The model’s performance in New York was outstanding, with accuracy up to 0.95 and an F1 score up to 0.91 with an average of 0.69 for different sampled periods. In Florida, the model’s performance was relatively good, with accuracy and F1 scores ranging from 0.64 to 0.88. Our analysis has important implications, as it highlights the importance of incorporating policy accumulation with influence, cooperation, and attention-based analysis in decision-making models. These models can be effective at managing the spread of infectious diseases across different locations and infection states. Figure 7b depicts the results of the key metric analysis based on the physical data, where the average accuracy was found to be 87%. Notably, the figure reveals periodic dips in accuracy, which were caused by the accumulation of influence data in the algorithm policy-determination process.

6. Model Limitations and Challenges

The spread analysis presented in this study provides a thorough and objective account of using social data to evaluate the actual spread of disease. Every node in a network influences the potential outcomes, and this has been a key research area in reinforcement learning for making sequential judgments based on actions and information. The analysis is based on multi-agent cooperation. Game theory tools and complex optimization methods, which have been successfully applied in a variety of contexts and applications where cooperative learning is used, are needed for the multi-agent study. The study in this paper makes use of attention-based cooperative learning and a method that makes use of partially witnessed settings in order to utilize a variety of data sources. A stochastic game with a common reward is used to simulate the states and actions.
To discover the best information state with all feasible policies, generational steps must be taken. The challenge, however, is that nodes make their own observations and decentralized judgments, which causes a nesting problem and raises the computing cost of the research. In order to avoid the convergence result following the standard gradient strategy, some assumptions were established to confirm the link quality setting with regard to neighbor bonds. In addition, the proposed cooperative algorithm, cooperative learning, and dynamic variable demonstrated a direct correlation of disease spread.

7. Conclusions

In conclusion, the spread analysis described in this paper provides a comprehensive objectivity on the reliance of social data to understand the possible spread of a disease. The multi-agent analysis uses tools from game theory and non-trivial optimization techniques, and is based on cooperative learning to make sequential decisions based on actions and information. The proposed cooperative algorithm shows a direct correlation between the spread of information and the spread of the disease, with a correlation range of 45% to 81% depending on the policy accumulation.
The study provides an essential way to utilize diverse data sources to find cooperativeness in a network and demonstrates the potential of multi-node cooperative problems in solving location determination. However, the analysis faced some limitations, including the issue of nodes making their own observations and making decentralized decisions, leading to an increased computational cost and the need for further optimization.
In future work, we need to expand the objectives and include more data sources. This will require further optimization to tune the system parameters for an improved performance. The study highlights the importance of effectively utilizing social data and demonstrates the potential for using cooperative learning in understanding the spread of diseases. With further advancements and improvements, this analysis can contribute to the development of effective disease control and prevention strategies.

Author Contributions

Conceptualization, H.S. and R.S.; methodology, H.S.; software, H.S.; Validation, H.S. and R.S.; writing—original draft preparation, H.S. and R.S.; writing—review and editing H.S. and R.S. All authors have read and agreed to the published version of the manuscript.

Funding

This research received no external funding.

Institutional Review Board Statement

Not applicable.

Informed Consent Statement

Not applicable.

Data Availability Statement

Not applicable.

Conflicts of Interest

The authors declare no conflict of interest.

Appendix A

Table A1. List of notations used in the paper.
SymbolsDefinition
ρ s , ρ ,   s t ,   l i User nodes, threshold values of physical sensor data, state of the event at time t, and indicated variable for time-based sensor data, respectively
N , n Number of tweets considered for summarization (in the time window specified by user) and number variable, respectively
T , m , p , s p , t Total time, number of distinct content words and subevents included in the n tweets, and state of subevent at time t, respectively
msize Number of tweets containing distinct words
i , j , k , a Index for tweets, content of words, subevents, and classes, respectively
x i ,   y j ,   z k Indicator variable for tweet i or bonds, for content word j, and for subevent k, respectively
C T _ Score j Feature score of content word
S S k ,   ω The score of subevent k and trade-off factor, respectively
I m Importance/informative score of class a
C a t i ,   lat Class of tweet i and lateral averaged required data, respectively
τ ,   g ,   π Optimal joint cooperative policy, policy determination, and link reaction policy, respectively
λ 1 , λ 2 Tuning parameter—relative weight for the tweet content word and subevent score, respectively
C E , C t Set of categorized words and subevents present in tweets, respectively
a i ,   γ i ,   β Actions for i tweets, reward variable for i tweets, and reward function accumulator, respectively
h i Actions a i   history .
k 0 , k 1 Influence and de-influence constraints, respectively
x i t , G t ,   x t Neighbor bond, information graph, and information state, respectively
k 0 , i ,   λ 0.1 ,   x 0 . i t ,   Θ   Communication flow rate, rate of reaction coefficient, activation state of bond, and dynamic event change, respectively
k 0 , i π i Optimal accumulated strategy
ξ s ,   L t ,   η t   Spread of infection, cumulative infection location rate, and dynamic environment variable, respectively

Appendix B

Appendix B.1

Algorithm A1: Learning-Based Multi-Agent Cooperation Algorithm
  • Define variables
  • states = t actions = n
  • Define reward function for a single node
    • def node_reward(states, actions, node_number):
    • reward = 0 for n in range(actions):
    • for t in range(states):
    • reward += omega * gamma(states * actions, next_state) return reward
  • Define reward function for multiple nodes
    • def multi_node_reward(states, actions, nodes):
    • reward = 0 for i in nodes: reward += node_reward(states, actions, i)
    • return reward
  • Define policy function
    • def policy(actions, states):
    • policy = 1 for i in nodes: for j in nodes: for n in range(actions):
    • for t in range(states):
    • policy * = pi(actions, i, j, t)/states return policy
  • Define optimal reward function
    • def optimal_reward(policy, states, actions, nodes):
    • reward = 0 for i in nodes: for j in nodes:
    • reward += beta(policy, i, j, states) return reward
  • Define optimal joint policy function
    • def optimal_joint_policy(policy, states, actions, nodes):
    • joint_policy = 0 for i in nodes:
    • for j in nodes:
    • joint_policy += tau_policy(policy, states, actions, i, j)
    • return joint_policy

Appendix B.2

Algorithm A2: Cooperative Learning and Strategy Creation Algorithm
  • Initialize variables:
    •    t = 0 (time step)
    •    s_0 = initial state of the system
    •    N = number of nodes
    •    n = number of actions
    •    ω = trade-off factor (0 to 1)
    •    γ = reward
    •    π = link reaction policy
    •    h = actions history
  • Calculate reward for each node:
    β π i i , j s = E n > 1 t 0 ,   i , j 0 ω t γ i , n s t × a n , t ,   s t + 1 | a n , i j , t , x i t ~ π E v e n t | s t ,   s 0 = s
3.
Average reward to obtain global optima:
       n > 1 t 0 ω γ s t × a n , t ,   s t + 1 , = 0
4.
Create link reaction policy:
             π a | s i ϵ N , n > 1 , t 0 π i , j a n , i j , t s t
5.
Calculate optimal reward link:
       β π i i , j s = E n > 1 t 0 ,   i , j 0 ω t γ i , n s t × a n , t ,   s t + 1 | a n , i j , t , x i t ~ τ π t ,   s 0 = s
6.
Calculate optimal joint cooperative policy:
                π i , j : s t i , j Δ a n , t
7.
Update actions history:
              τ π t = h : h a h   π p h | s t
8.
Repeat steps 2 to 7 until terminal state is reached

Appendix B.3

Algorithm A3: Spread-Based Analysis for the Cooperative Learning Algorithm
 def spread_dynamic_variable(network, spread_rate, spread_time, spread_initial_nodes):
  spread_status = {}
  for node in network.nodes:
    spread_status[node] = 0
  for node in spread_initial_nodes:
    spread_status[node] = 1
  for t in range(spread_time):
    for node in network.nodes:
     if spread_status[node] == 1:
      for neighbor in network.neighbors(node):
       if random.uniform(0, 1) < spread_rate:
        spread_status[neighbor] = 1
 return spread_status

References

  1. Silva, V.S.; Freitas, A.; Handschuh, S. Building a knowledge graph from natural language definitions for interpretable text entailment recognition. arXiv 2018, arXiv:1806.07731. [Google Scholar]
  2. Auer, P.; Cesa-Bianchi, N.; Freund, Y.; Schapire, R.E. The non-stochastic multi-armed bandit problem. SIAM J. Comput. 2002, 32, 48–77. [Google Scholar] [CrossRef]
  3. Curry, A.C.; Hastie, H.; Rieser, V. A review of evaluation techniques for social dialogue systems. In Proceedings of the 1st ACM SIGCHI International Workshop on Investigating Social Interactions with Artificial Agents, New York, NY, USA, 13 November 2017; pp. 25–26. [Google Scholar]
  4. Bahdanau, D.; Cho, K.; Bengio, Y. Neural machine translation by jointly learning to align and translate. arXiv 2014, arXiv:1409.0473. [Google Scholar]
  5. Srivastava, H.; Sankar, R. Information dissemination from social network for extreme weather scenario. IEEE Trans. Comput. Soc. Syst. 2020, 7, 319–328. [Google Scholar] [CrossRef]
  6. Riou, M.; Jabaian, B.; Huet, S.; Lefèvre, F. Reinforcement adaptation of an attention-based neural natural language generator for spoken dialogue systems. Dialogue Discourse 2019, 10, 1–19. [Google Scholar] [CrossRef]
  7. Traag, V.A.; Van Dooren, P.; Nesterov, Y. Indirect reciprocity through gossiping can lead to cooperative clusters. In Proceedings of the 2011 IEEE Symposium on Artificial Life, Paris, France, 14 July 2011; pp. 154–161. [Google Scholar]
  8. Traag, V.A.; Van Dooren, P.; De Leenheer, P. Dynamical models explaining social balance and evolution of cooperation. PLoS ONE 2013, 8, e60063. [Google Scholar] [CrossRef]
  9. Javadi, S.H.S.; Gharani, P.; Khadivi, S. Detecting community structure in dynamic social networks using the concept of leadership. In Sustainable Interdependent Networks; Springer: Cham, Switzerland, 2018; pp. 97–118. [Google Scholar]
  10. Olson, S.H.; Benedum, C.M.; Mekaru, S.R.; Preston, N.D.; Mazet, J.A.K.; Joly, D.O.; Brownstein, J.S. Drivers of emerging infectious disease events as a framework for digital detection. Emerg. Infect. Dis. 2015, 21, 1285–1292. [Google Scholar] [CrossRef] [PubMed]
  11. Eason, B.N.; Sneddon, I.N. On certain integrals of Lipschitz-Hankel type involving products of Bessel functions. Philos. Trans. R. Soc. Lond. 1955, 247, 529–551. [Google Scholar]
  12. Bhattacharyya, S.; Reluga, T. Game dynamic model of social distancing while cost of infection varies with epidemic burden. IMA J. Appl. Math. 2019, 84, 23–43. [Google Scholar] [CrossRef]
  13. Lakshmanan, L.V.S.; Goyal, A.; Bonchi, F.; Venkatasubramanian, S. On minimizing budget and time in influence propagation over social networks. Soc. Netw. Anal. Min. 2013, 3, 179–192. [Google Scholar]
  14. Miller, G. Social scientists wade into the tweet stream. Science 2011, 333, 1814–1815. [Google Scholar] [CrossRef] [PubMed]
  15. Valente, T.W.; Pumpuang, P. Identifying opinion leaders to promote behavior change. Health Educ. Behav. 2007, 34, 881–896. [Google Scholar] [CrossRef] [PubMed]
  16. Banerjee, A.; Chandrasekhar, A.G.; Duflo, E.; Jackson, M.O. The diffusion of micro-finance. Science 2013, 341, 1236498. [Google Scholar] [CrossRef] [PubMed]
  17. Yadav, A.; Wilder, B.; Rice, E.; Petering, R.; Craddock, J.; Yoshioka-Maxwell, A.; Hemler, M.; Onasch-Vera, L.; Tambe, M.; Woo, D. Bridging the gap between theory and practice in influence maximization: Raising awareness about HIV among homeless youth. In Proceedings of the 27th International Joint Conference on Artificial Intelligence, Stockholm, Sweden, 13–19 July 2018; pp. 5399–5403. [Google Scholar]
  18. Wilder, B.; Onasch-Vera, L.; Hudson, J.; Luna, J.; Wilson, N.; Petering, R.; Woo, D.; Tambe, M.; Rice, E. End-to-end influence maximization in the field. In Proceedings of the 17th International Conference on Autonomous Agents and MultiAgent Systems, Stockholm, Sweden, 10–15 July 2018; International Foundation for Autonomous Agents and Multiagent Systems: Richland, SC, USA, 2018; pp. 1414–1422. [Google Scholar]
  19. Kempe, D.; Kleinberg, J.; Tardos, E. Influential nodes in a diffusion model for social networks. In International Colloquium on Automata, Languages, and Programming; Springer: Berlin/Heidelberg, Germany, 2005; pp. 1127–1138. [Google Scholar]
  20. Jung, K.; Heo, W.; Chen, W. Irie: Scalable and robust influence maximization in social networks. In Proceedings of the 2012 IEEE 12th International Conference on Data Mining, Washington, DC, USA, 10–13 December 2012; pp. 918–923. [Google Scholar]
  21. Chen, W.; Wang, C.; Wang, Y. Scalable influence maximization for prevalent viral marketing in large-scale social networks. In Proceedings of the 16th ACM SIGKDD International Conference on Knowledge Discovery and Data Mining, Washington, DC, USA, 25–28 July 2010; pp. 1029–1038. [Google Scholar]
  22. Li, Y.; Fan, J.; Wang, Y.; Tan, K.-L. Influence maximization on social graphs: A survey. IEEE Trans. Knowl. Data Eng. 2018, 30, 1852–1872. [Google Scholar] [CrossRef]
  23. Girvan, M.; Newman, M.E.J. Community structure in social and biological networks. Proc. Natl. Acad. Sci. USA 2002, 99, 7821–7826. [Google Scholar] [CrossRef] [PubMed]
  24. Merris, R. Laplacian matrices of graphs: A survey. Linear Algebra Its Appl. 1994, 197–198, 143–176. [Google Scholar] [CrossRef]
  25. Qian, G.; Sural, S.; Gu, Y.; Pramanik, S. Similarity between Euclidean and cosine angle distance for nearest neighbor queries. In Proceedings of the 2004 ACM symposium on Applied computing, Nicosia, Cyprus, 14–17 March 2004; pp. 1232–1237. [Google Scholar]
  26. Okada, I. A Review of Theoretical Studies on Indirect Reciprocity. Games 2020, 11, 27. [Google Scholar] [CrossRef]
  27. James, G.; Witten, D.; Hastie, T.; Tibshirani, R. An Introduction to Statistical Learning. In Fortunato, Community Detection in Graphs; Springer: New York, NY, USA, 2013; Volume 112. [Google Scholar]
  28. Fortunato, S. Community detection in graphs. Phys. Rep. 2010, 486, 75–174. [Google Scholar] [CrossRef]
  29. Zhang, Z.; Zhao, D.; Gao, J.; Wang, D.; Dai, Y. FMRQ—A multi-agent reinforcement learning algorithm for fully cooperative tasks. IEEE Trans. Cybern. 2016, 47, 1367–1379. [Google Scholar] [CrossRef] [PubMed]
  30. Blondel, V.D.; Guillaume, J.-L.; Lambiotte, R.; Lefebvre, E. Fast unfolding of communities in large networks. J. Stat. Mech. Theory Exp. 2008, 2008, P10008. [Google Scholar] [CrossRef]
  31. Dong, E.; Du, H.; Gardner, L. An interactive web-based dashboard to track COVID-19 in real time. Lancet Infect. Dis. 2020, 20, 533–534. [Google Scholar] [CrossRef] [PubMed]
  32. Tsitsiklis, J.; Bertsekas, D.; Athans, M. Distributed asynchronous deterministic and stochastic gradient optimization algorithms. IEEE Trans. Autom. Control 1986, 31, 803–812. [Google Scholar] [CrossRef]
  33. Colace, F.; Casaburi, L.; De Santo, M.; Greco, L. Sentiment detection in social networks and in collaborative learning environments. Comput. Hum. Behav. 2015, 51, 1061–1067. [Google Scholar] [CrossRef]
  34. Satsuma, J.; Willox, R.; Ramani, A.; Grammaticos, B.; Carstea, A.S. Extending the SIR epidemic model. Phys. A Stat. Mech. Its Appl. 2004, 336, 369–375. [Google Scholar] [CrossRef]
  35. Chickering, D.M. Optimal structure identification with greedy search. J. Mach. Learn. Res. 2002, 3, 507–554. [Google Scholar]
  36. Newman, M.; Girvan, M. Finding and evaluating community structure in networks. Phys. Rev. E 2004, 69, 026113. [Google Scholar] [CrossRef]
  37. Clauset, A.; Newman, M.; Moore, C. Finding community structure in very large networks. Phys. Rev. E 2004, 70, 066111. [Google Scholar] [CrossRef]
  38. Liu, X.; Murata, T. Advanced modularity-specialized label propagation algorithm for detecting communities in networks. Phys. A Stat. Mech. Its Appl. 2010, 389, 1493–1500. [Google Scholar] [CrossRef]
  39. Brandes, U.; Delling, D.; Gaertler, M.; Gorke, R.; Hoefer, M.; Nikoloski, Z.; Wagner, D. On Modularity Clustering. IEEE Trans. Knowl. Data Eng. 2008, 20, 172–188. [Google Scholar] [CrossRef]
  40. Center for Systems Science and Engineering (CSSE) at Johns Hopkins University. COVID-19 Global Cases. Available online: https://coronavirus.jhu.edu/map.html (accessed on 30 March 2023).
  41. Javadi, S.H.S.; Khadivi, S.; Shiri, M.E.; Xu, J. An ant colony optimization method to detect communities in social networks. In Proceedings of the 2014 IEEE/ACM International Conference on Advances in Social Networks Analysis and Mining (ASONAM 2014), Beijing, China, 17 August 2014; pp. 200–203. [Google Scholar]
  42. Clauset, A. Finding local community structure in networks. Phys. Rev. E 2005, 72, 026132. [Google Scholar] [CrossRef]
  43. Luo, F.; Wang, J.; Promislow, E. Exploring local community structures in large networks. In Proceedings of the 2006 IEEE/WIC/ACM International Conference on Web Intelligence (WI06), Hong Kong, China, 18–22 December 2006; pp. 233–239. [Google Scholar]
  44. Twitter Developer. (n.d.). Twitter Developer. Available online: https://developer.twitter.com (accessed on 30 March 2023).
Figure 1. Decision spread model block diagram.
Algorithms 16 00240 g001
Figure 2. Action and reward cooperation.
Algorithms 16 00240 g002
Figure 3. Adaptive algorithm for determining the spread of disease.
Algorithms 16 00240 g003
Figure 4. Link trusts evaluation after influence score.
Algorithms 16 00240 g004
Figure 5. The spread of disease with actionable analysis.
Algorithms 16 00240 g005
Figure 6. Clustered nodes in the network at different stages.
Algorithms 16 00240 g006
Figure 7. (a) Key metric of social data analysis. (b) Key metric of physical data analysis.
Algorithms 16 00240 g007
Table 1. Metric for action determination in states.
LocationInfection StateConfusion Matrix
New YorkLowTP: 42, FP: 3, FN: 8, TN: 447
New YorkMediumTP: 98, FP: 17, FN: 42, TN: 343
New YorkHighTP: 162, FP: 17, FN: 38, TN: 283
New YorkCriticalTP: 187, FP: 42, FN: 13, TN: 258
New YorkHighTP: 125, FP: 5, FN: 10, TN: 450
FloridaLowTP: 44, FP: 6, FN: 9, TN: 441
FloridaMediumTP: 121, FP: 68, FN: 19, TN: 259
FloridaHighTP: 67, FP: 129, FN: 23, TN: 128
FloridaCriticalTP: 46, FP: 164, FN: 9, TN: 108
FloridaHighTP: 89, FP: 31, FN: 38, TN: 266
TP: true positive, FP: false positive, FN: false negative, and TN: true negative.
Disclaimer/Publisher’s Note: The statements, opinions and data contained in all publications are solely those of the individual author(s) and contributor(s) and not of MDPI and/or the editor(s). MDPI and/or the editor(s) disclaim responsibility for any injury to people or property resulting from any ideas, methods, instructions or products referred to in the content.

