
Machine Learning-Based Approach for Predicting Diabetes Employing Socio-Demographic Characteristics

 ,
,  , , ,
, , ,  and
and 
Abstract
:1. Introduction
- Building an ML model that will predict diabetes using socio-demographic characteristics rather than clinical attributes. This is relevant because not all people, especially those from lower-income countries, have access to their clinical features.
- Revealing significant risk factors that indicate diabetes.
- Proposing a best fit and clinically usable framework to predict diabetes at an early stage.
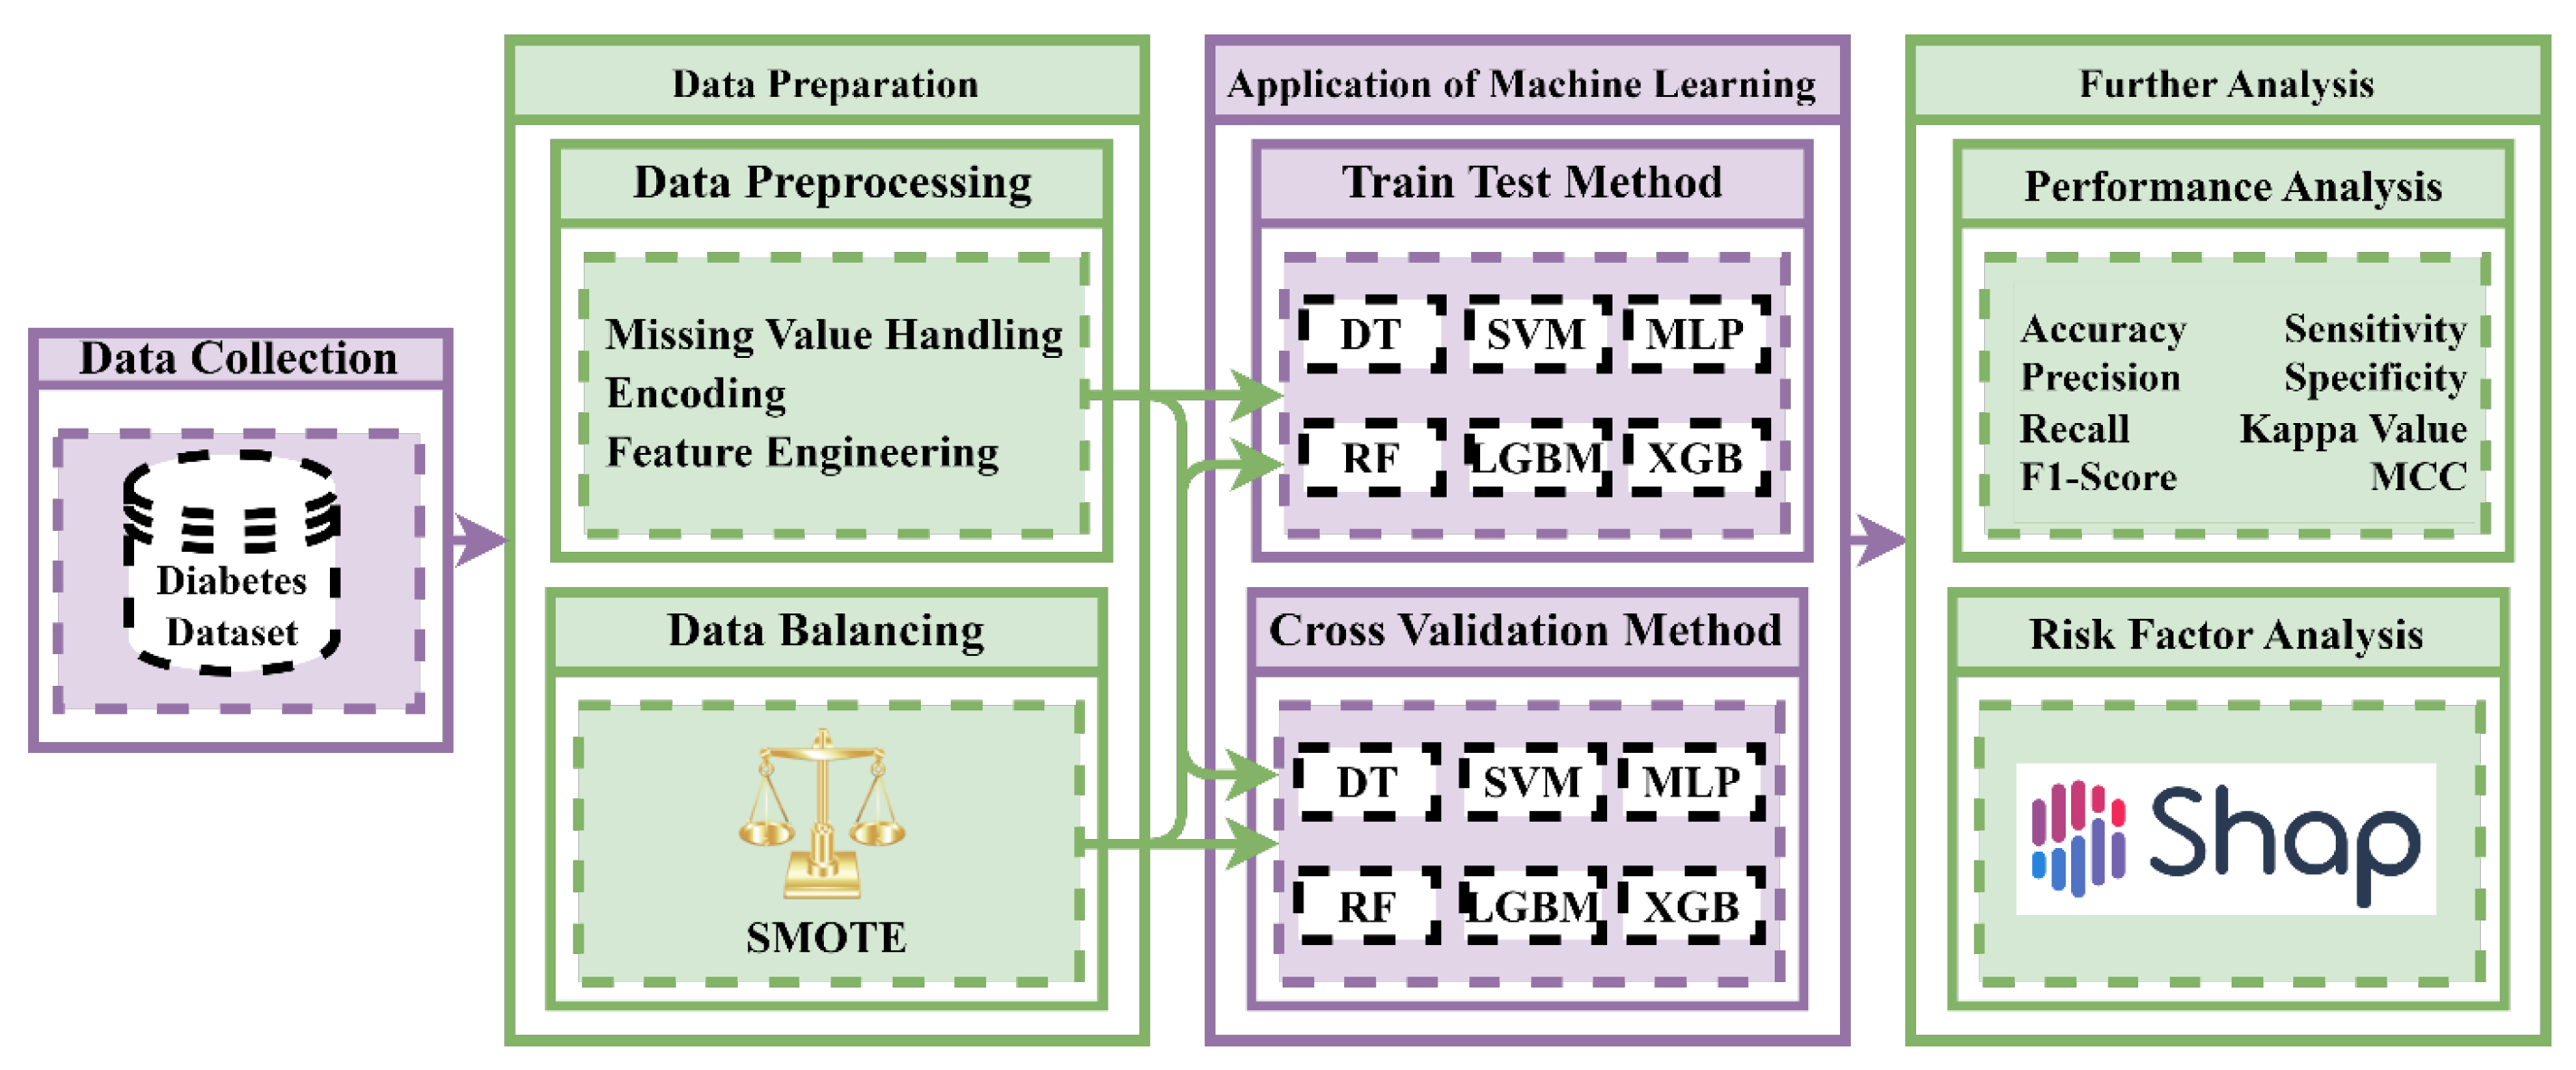
2. Materials and Methods
2.1. Dataset Description
2.2. Data Preprocessing
2.3. Data Balancing Techniques
2.4. Performance Evaluation Metrics
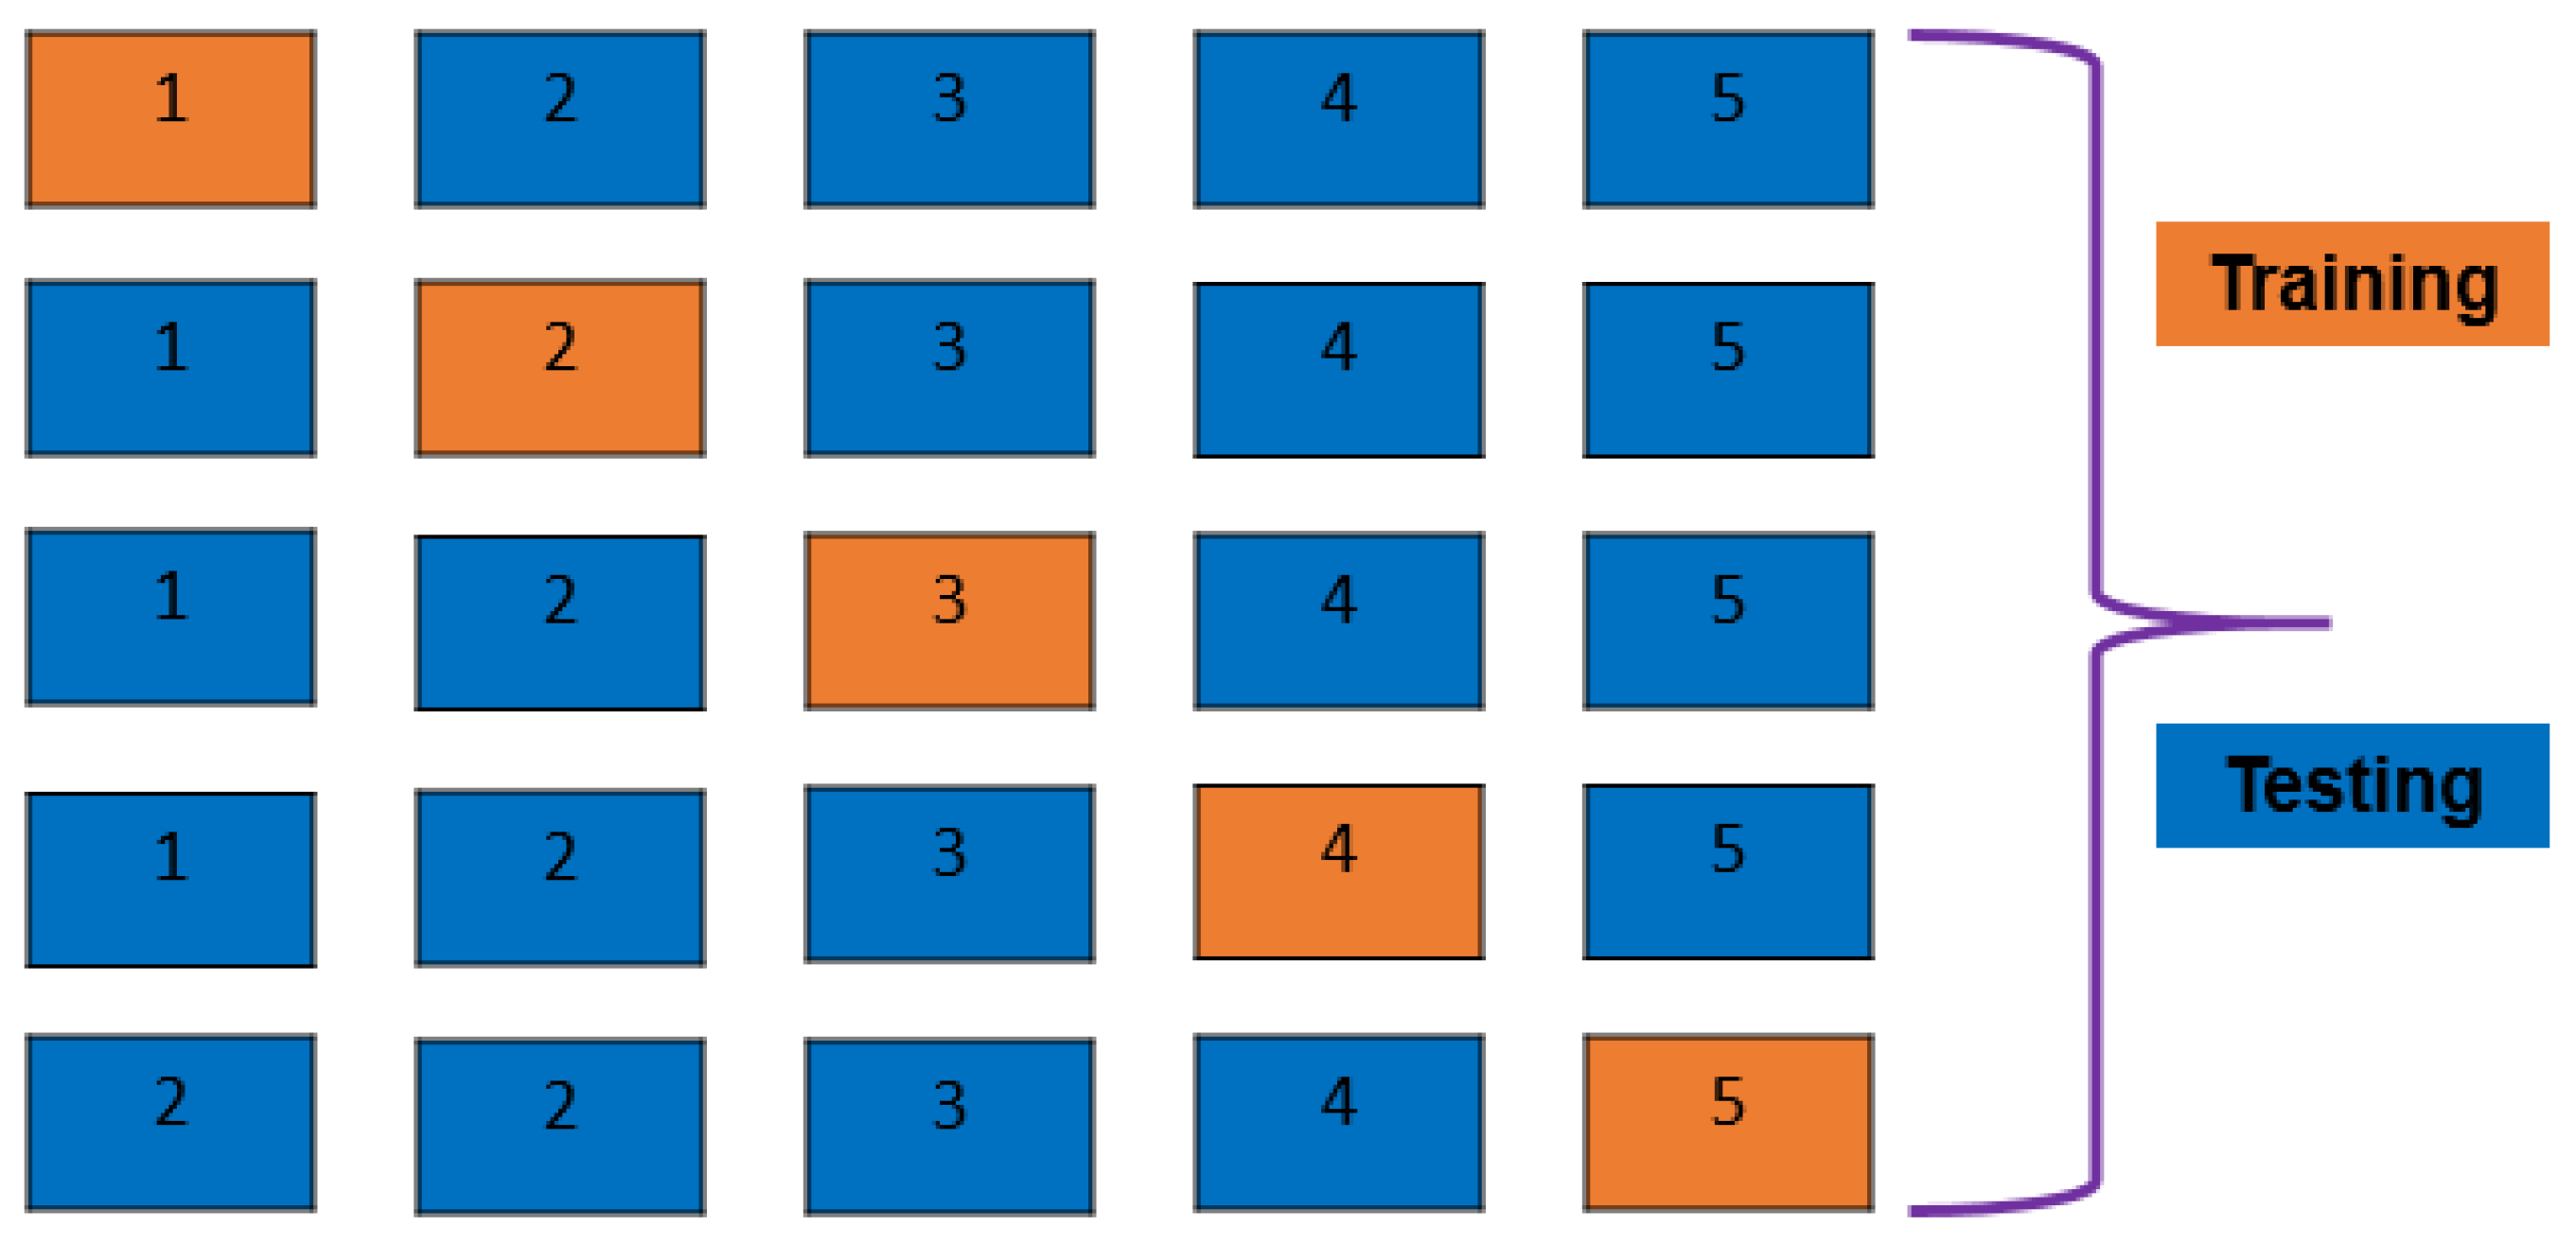
2.5. K-Fold Cross-Validation and Train–Test Split
2.6. Machine Learning Algorithms
2.6.1. Decision Tree Classifier
2.6.2. Random Forest Classifier
2.6.3. Support Vector Machine
2.6.4. XGBoost Classifier
2.6.5. LightGBM Classifier
2.6.6. Multi-Layer Perceptron
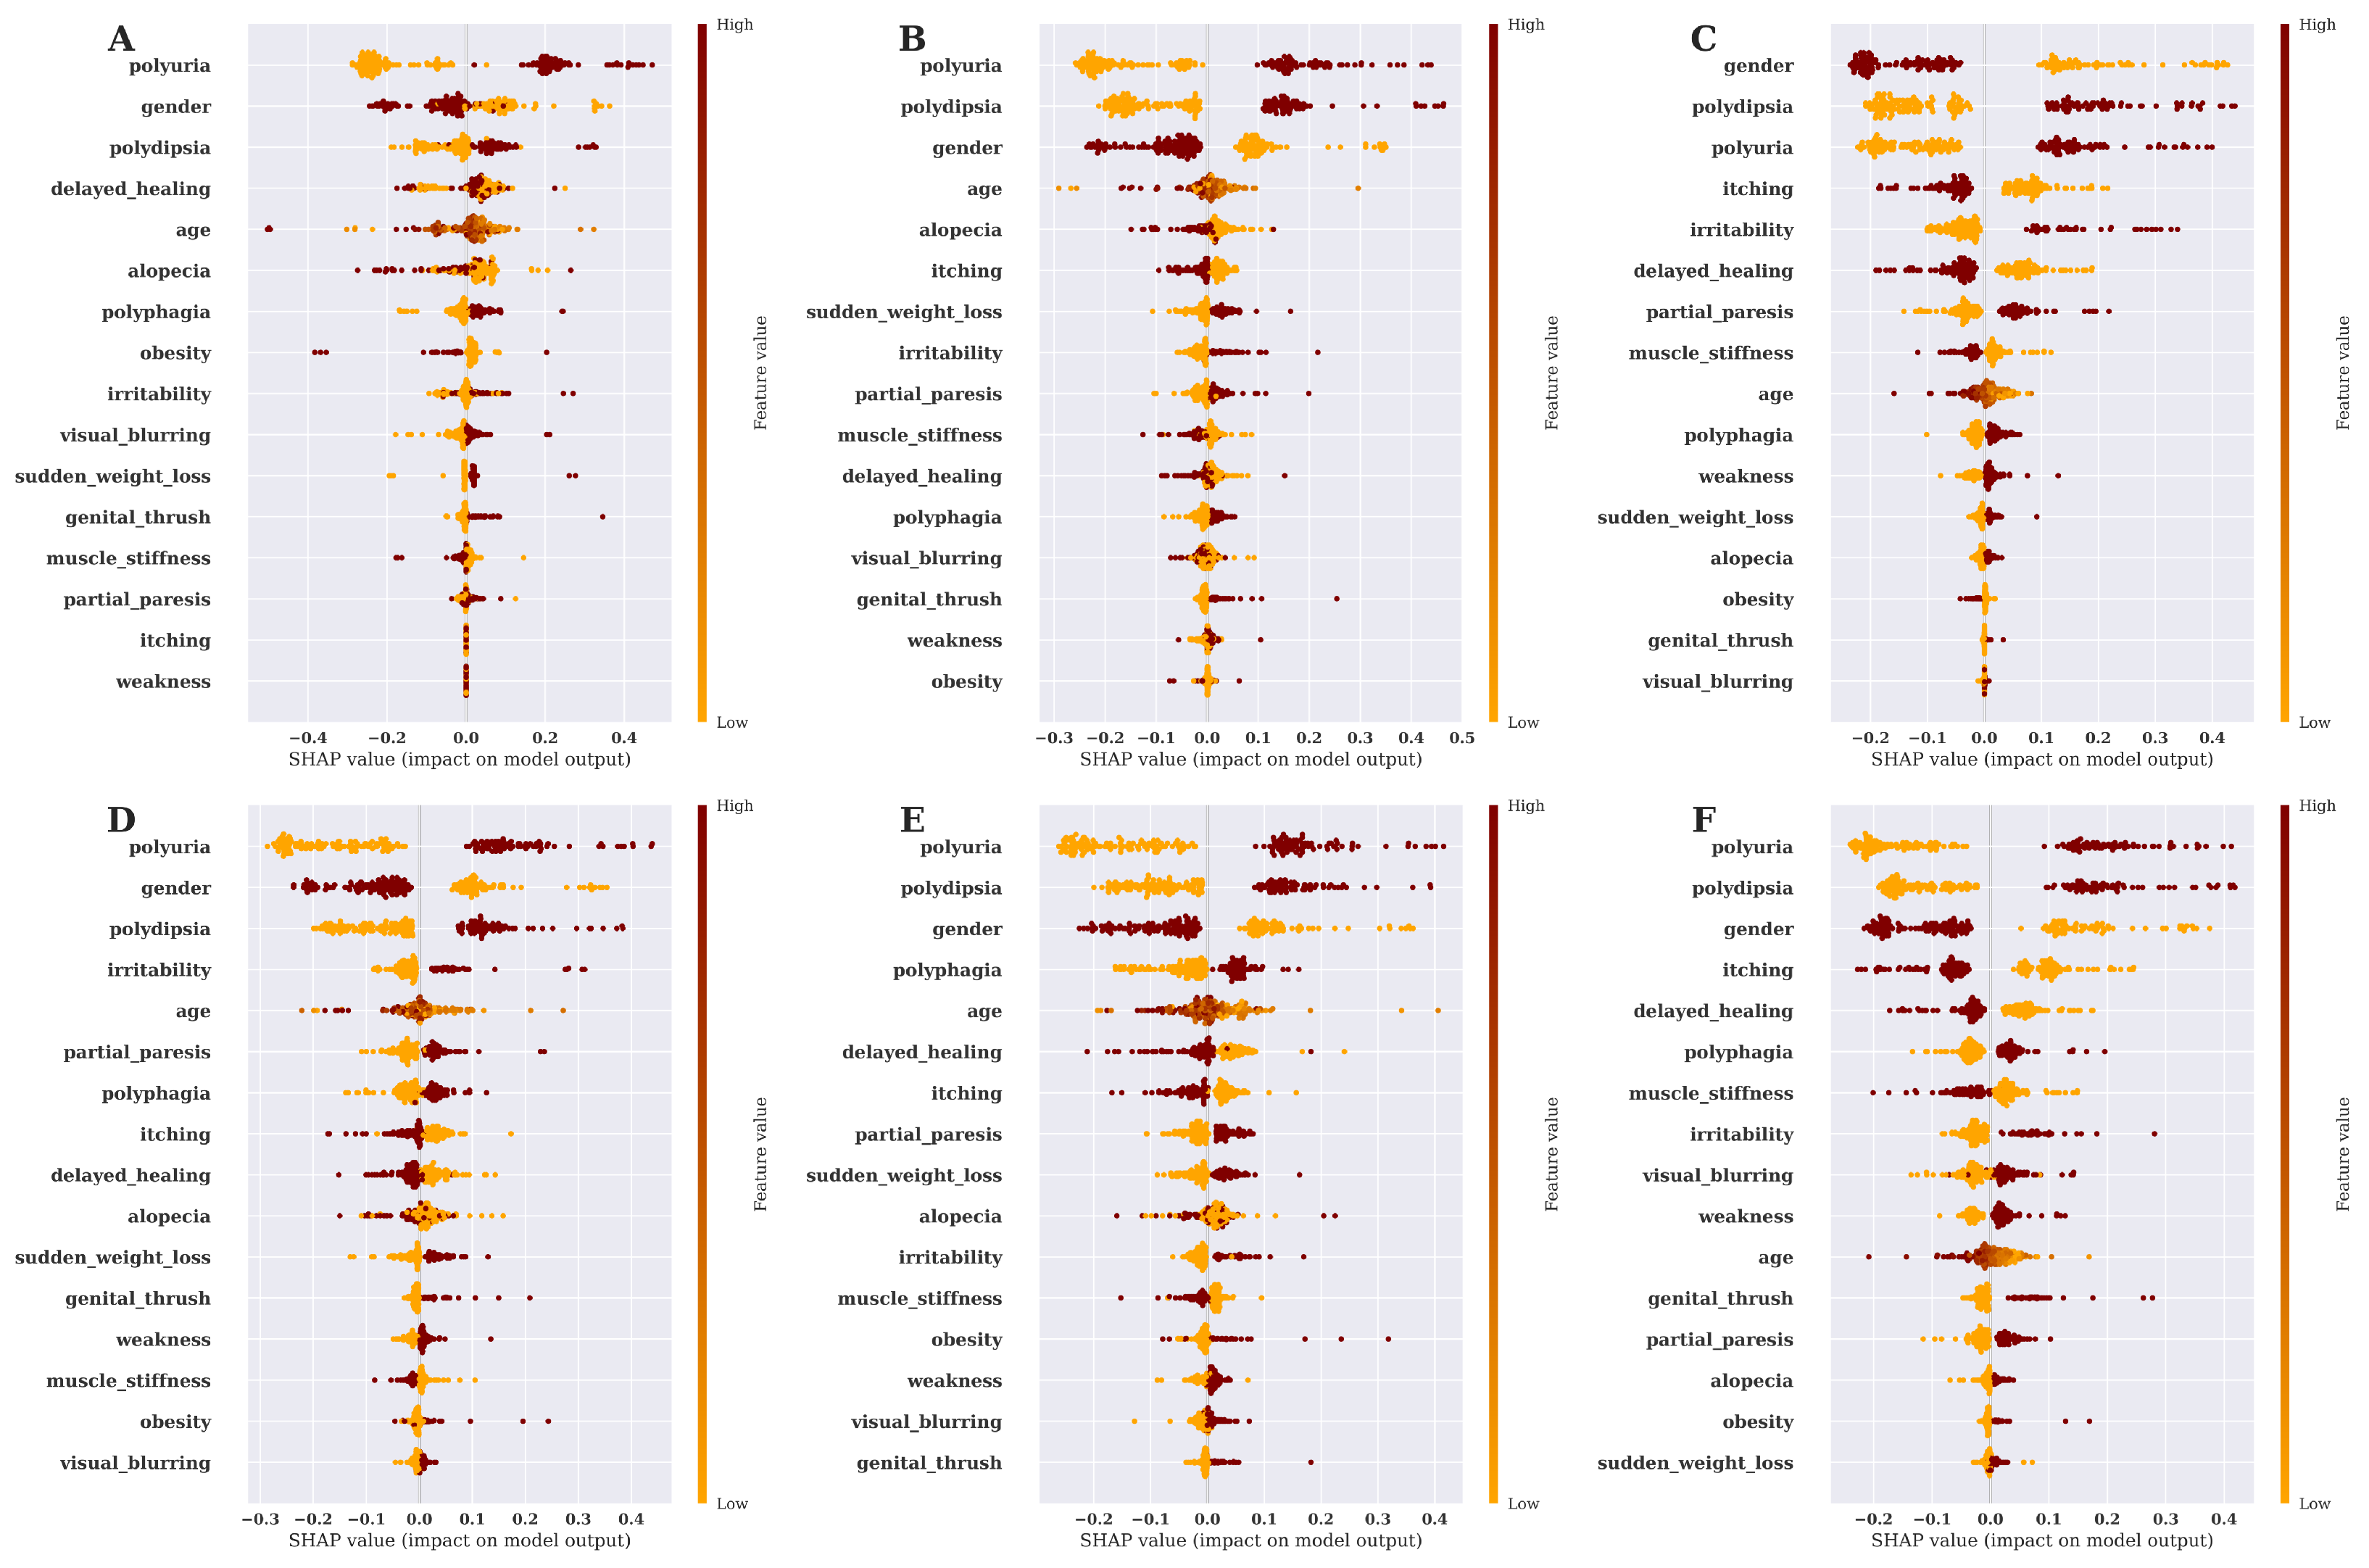
2.7. Feature Importance and Model Explanation
3. Result Analysis and Discussion
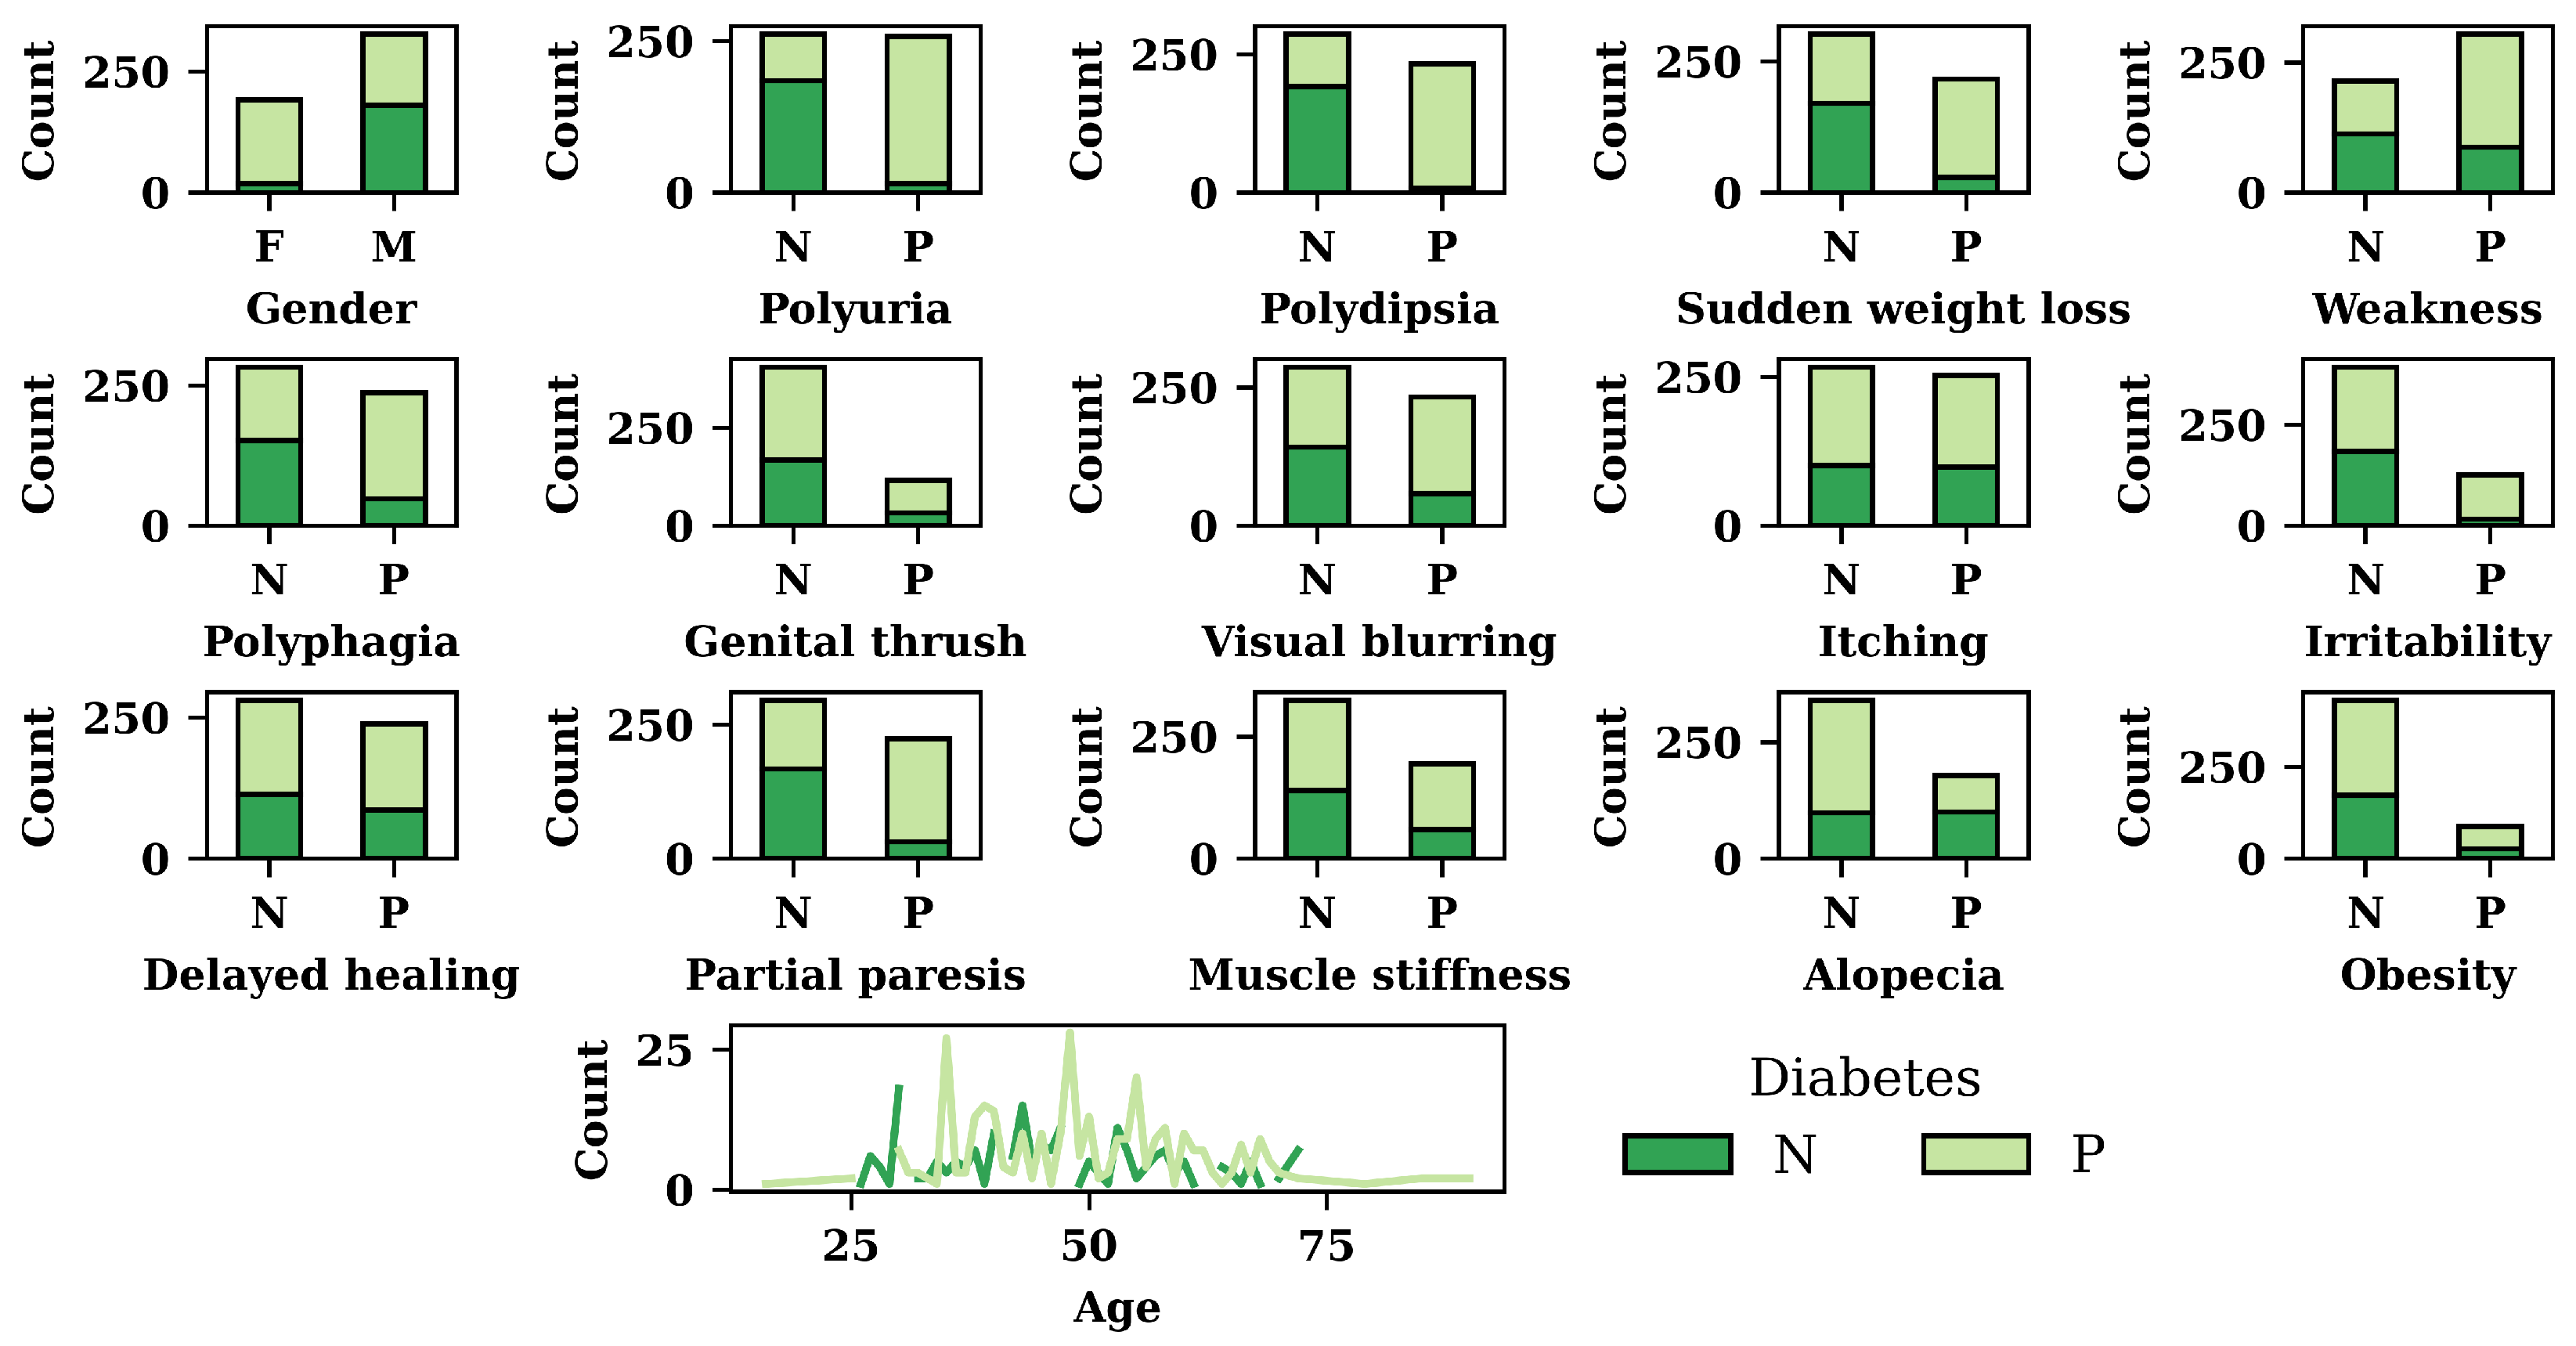
3.1. Exploratory Data Analysis (EDA) Result
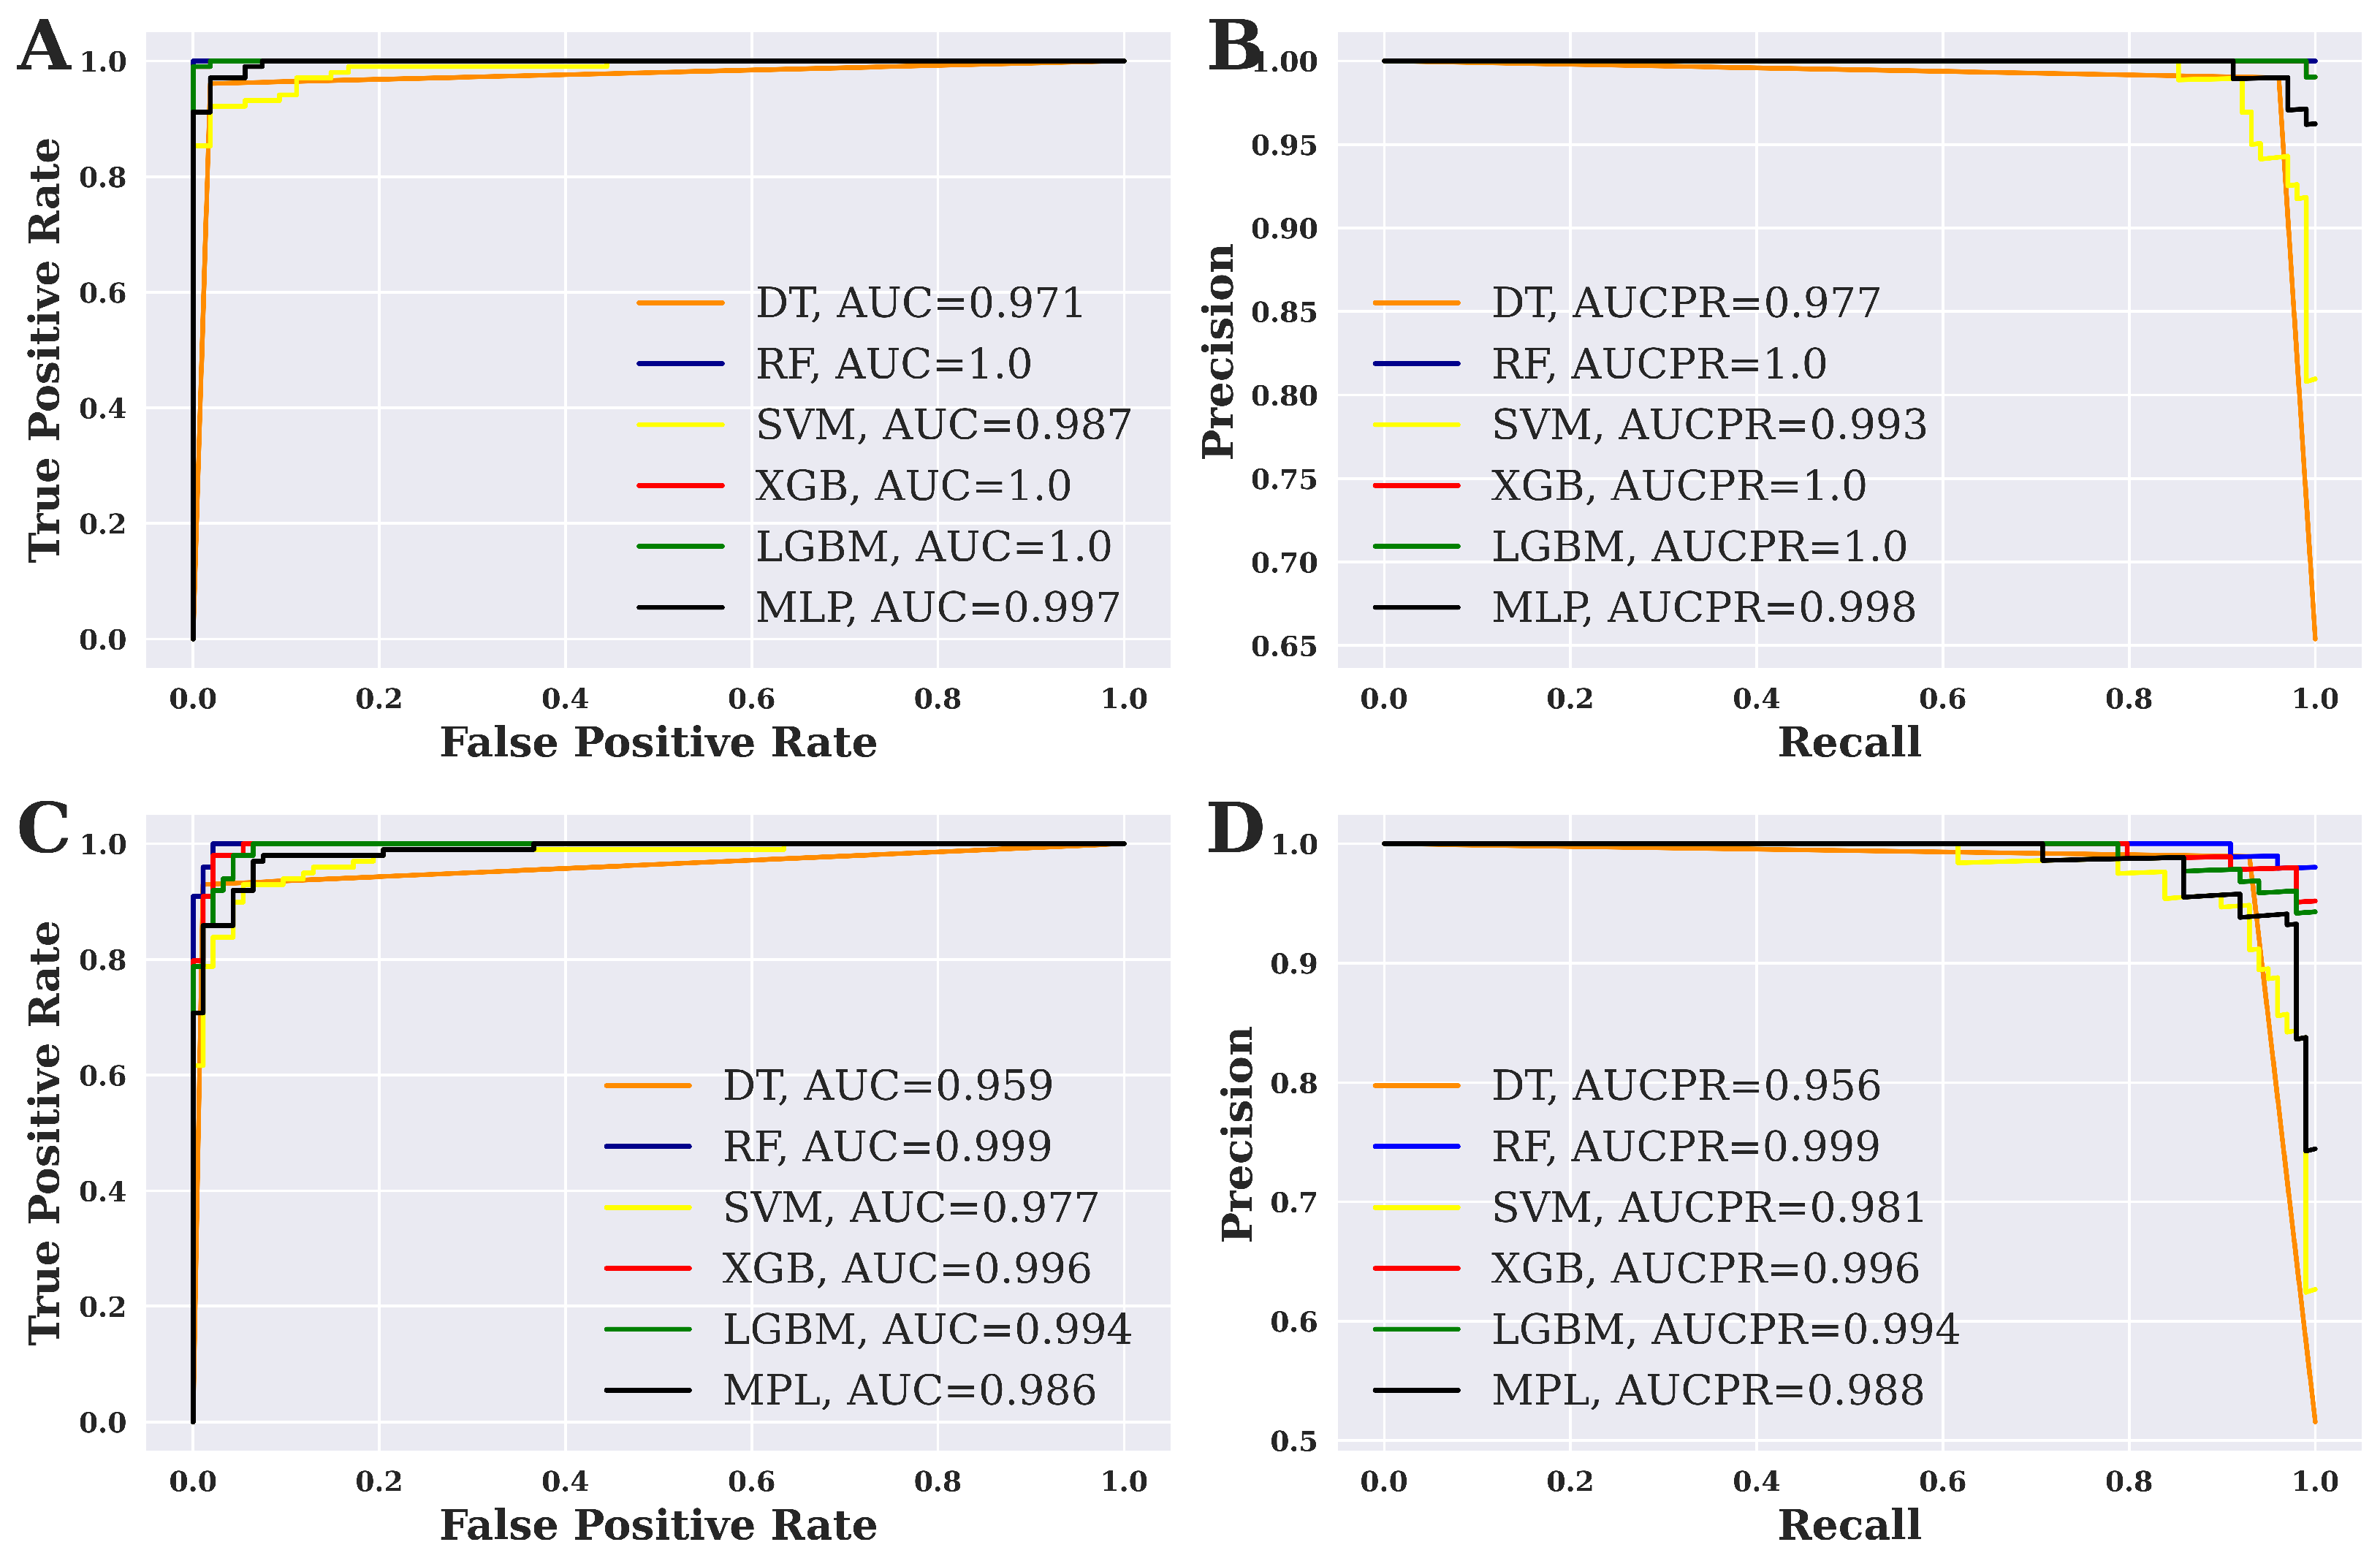
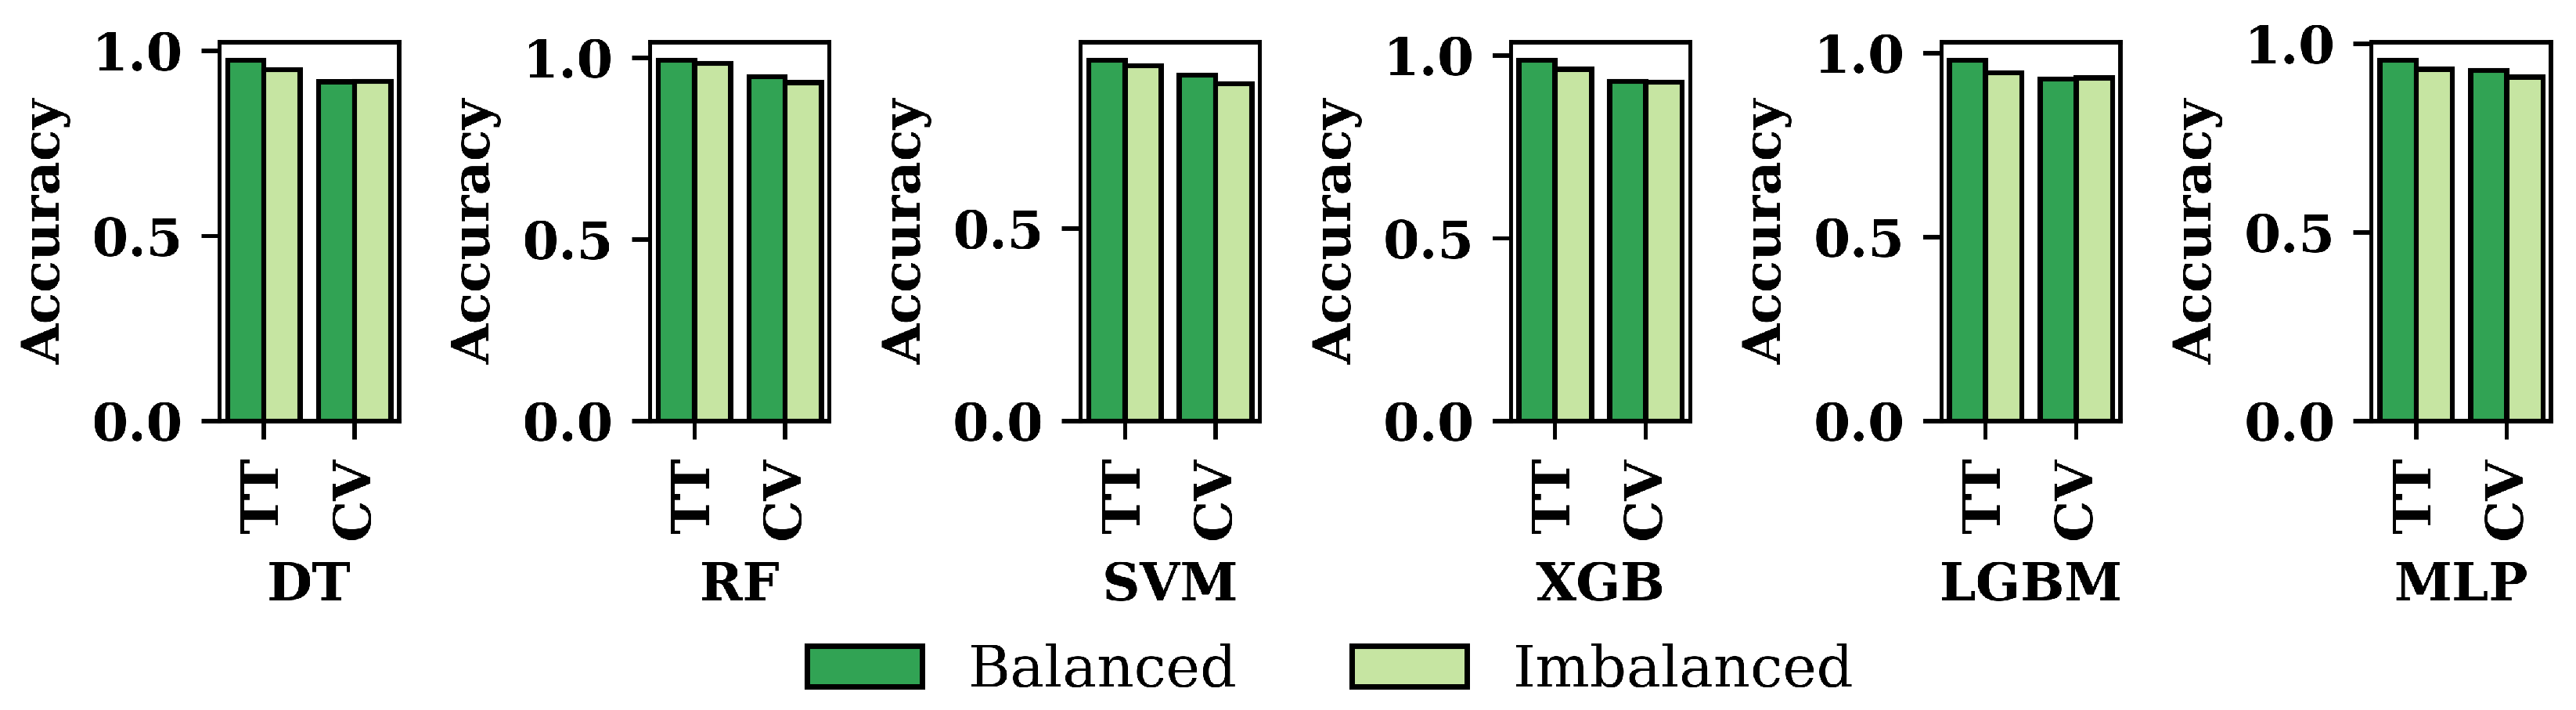
3.2. Performance Evaluation of ML Models
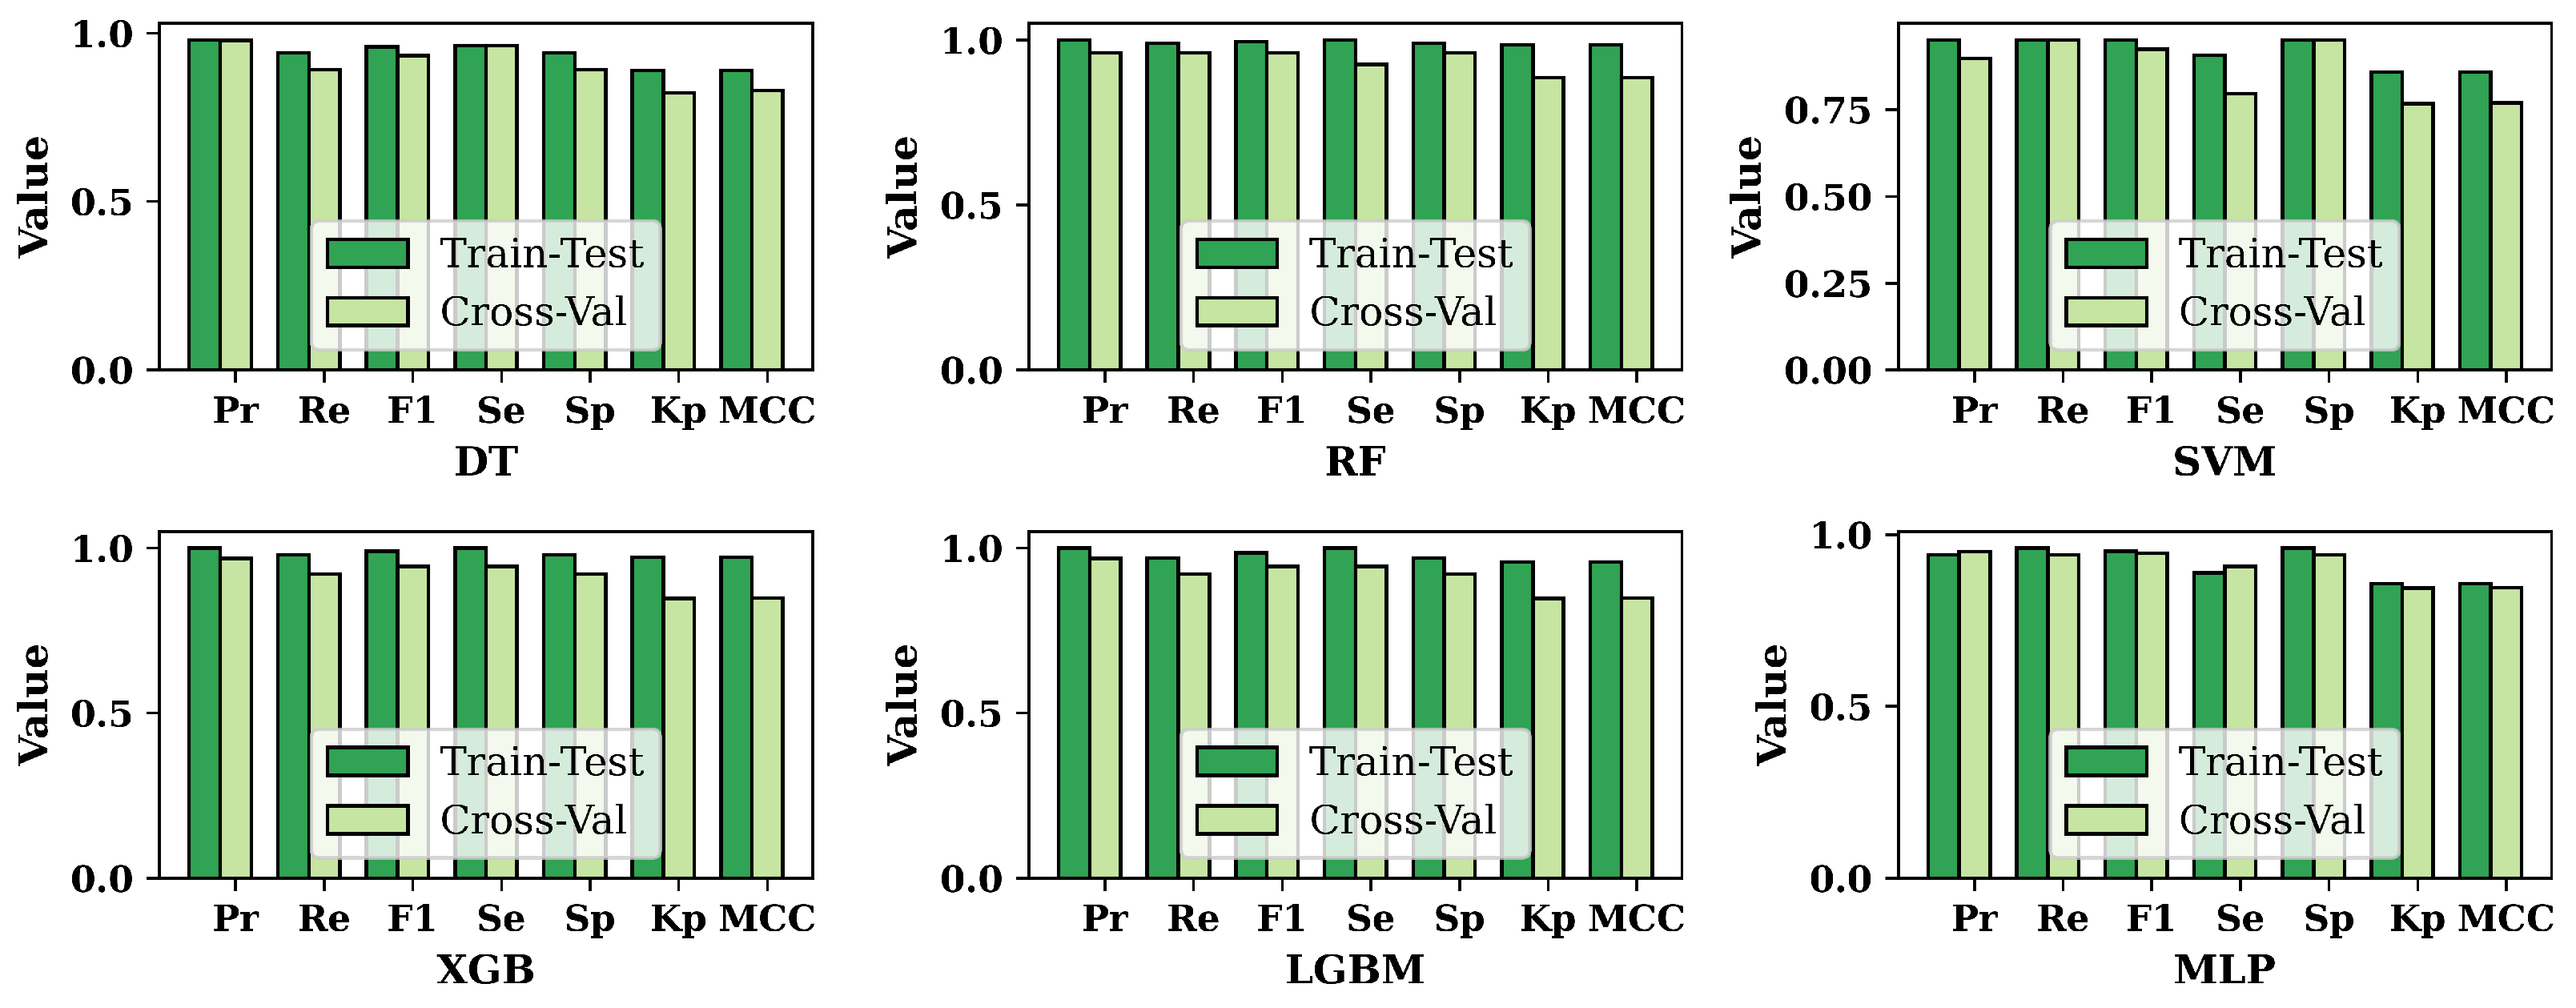
3.3. Overall Performance Evaluation for ML Methods
3.4. Risk Factor Analysis and Model Explanation Based on SHAP Value
3.5. Discussion
4. Conclusions
Author Contributions
Funding
Data Availability Statement
Conflicts of Interest
References
- Banerjee, A.T.; Shah, B.R. Differences in prevalence of diabetes among immigrants to Canada from South Asian countries. Diabet. Med. 2018, 35, 937–943. [Google Scholar] [CrossRef] [PubMed]
- Roglic, G. WHO Global report on diabetes: A summary. Int. J. Noncommun. Dis. 2016, 1, 3. [Google Scholar] [CrossRef]
- Zou, Q.; Qu, K.; Luo, Y.; Yin, D.; Ju, Y.; Tang, H. Predicting diabetes mellitus with machine learning techniques. Front. Genet. 2018, 9, 515. [Google Scholar] [CrossRef] [PubMed]
- Balfe, M.; Doyle, F.; Smith, D.; Sreenan, S.; Brugha, R.; Hevey, D.; Conroy, R. What’s distressing about having type 1 diabetes? A qualitative study of young adults’ perspectives. BMC Endocr. Disord. 2013, 13, 25. [Google Scholar] [CrossRef] [PubMed]
- Khanam; Jamal, J.; Foo, S.Y. A comparison of machine learning algorithms for diabetes prediction. ICT Express 2021, 7, 432–439. [Google Scholar] [CrossRef]
- Islam, M.M.F.; Ferdousi, R.; Rahman, S.; Bushra, H.Y. Likelihood prediction of diabetes at early stage using data mining techniques. In Computer Vision and Machine Intelligence in Medical Image Analysis; Springer: Singapore, 2020; pp. 113–125. [Google Scholar]
- Krishnamoorthi, R.; Joshi, S.; Almarzouki, H.Z.; Shukla, P.K.; Rizwan, A.; Kalpana, C.; Tiwari, B. A novel diabetes healthcare disease prediction framework using machine learning techniques. J. Healthc. Eng. 2022, 2022, 1684017. [Google Scholar] [CrossRef]
- Islam, M.S.; Qaraqe, M.K.; Belhaouari, S.B.; Abdul-Ghani, M.A. Advanced techniques for predicting the future progression of type 2 diabetes. IEEE Access 2020, 8, 120537–120547. [Google Scholar] [CrossRef]
- Hasan, M.K.; Alam, M.A.; Das, D.; Hossain, E.; Hasan, M. Diabetes prediction using ensembling of dif-ferent machine learning classifiers. IEEE Access 2020, 8, 76516–76531. [Google Scholar] [CrossRef]
- Fazakis, N.; Kocsis, O.; Dritsas, E.; Alexiou, S.; Fakotakis, N.; Moustakas, K. Machine learning tools for long-term type 2 diabetes risk prediction. IEEE Access 2021, 9, 103737–103757. [Google Scholar] [CrossRef]
- Ahmed, U.; Issa, G.F.; Khan, M.A.; Aftab, S.; Khan, M.F.; Said, R.A.T.; Ghazal, T.M.; Ahmad, M. Predic-tion of diabetes empowered with fused machine learning. IEEE Access 2022, 10, 8529–8538. [Google Scholar] [CrossRef]
- Maniruzzaman, M.; Rahman, M.J.; Ahammed, B.; Abedin, M.M. Classification and prediction of diabetes disease using machine learning paradigm. Health Inf. Sci. Syst. 2020, 8, 7. [Google Scholar] [CrossRef] [PubMed]
- Barakat, N.; Bradley, A.P.; Barakat, M.N.H. Intelligible support vector machines for diagnosis of diabetes mellitus. IEEE Trans. Inf. Technol. Biomed. 2010, 14, 1114–1120. [Google Scholar] [CrossRef] [PubMed]
- Dataset. Available online: https://www.kaggle.com/datasets/andrewmvd/early-diabetes-classification (accessed on 17 November 2022).
- Chawla, N.V.; Bowyer, K.W.; Hall, L.O.; Kegelmeyer, W.P. SMOTE: Synthetic minority over-sampling technique. J. Artif. Intell. Res. 2002, 16, 321–357. [Google Scholar] [CrossRef]
- Maulidevi, N.U.; Surendro, K. SMOTE-LOF for noise identification in imbalanced data classification. J. King Saud Univ.-Comput. Inf. Sci. 2022, 34, 3413–3423. [Google Scholar]
- Sanni, R.R.; Guruprasad, H.S. Analysis of performance metrics of heart failured patients using Python and machine learning algorithms. Glob. Transit. Proc. 2021, 2, 233–237. [Google Scholar] [CrossRef]
- Silva, F.R.; Vidotti, V.G.; Cremasco, F.; Dias, M.; Gomi, E.S.; Costa, V.P. Sensitivity and specificity of machine learning classifiers for glaucoma diagnosis using Spectral Domain OCT and standard automated perimetry. Arq. Bras. De Oftalmol. 2013, 76, 170–174. [Google Scholar] [CrossRef] [PubMed]
- Chicco, D.; Tötsch, N.; Jurman, G. The Matthews correlation coefficient (MCC) is more reliable than balanced accuracy, bookmaker informedness, and markedness in two-class confusion matrix evaluation. Bio-Data Min. 2021, 14, 13. [Google Scholar] [CrossRef]
- Chicco, D.; Jurman, G. The advantages of the Matthews correlation coefficient (MCC) over F1 score and accuracy in binary classification evaluation. BMC Genom. 2020, 21, 6. [Google Scholar] [CrossRef]
- Erickson, B.J.; Kitamura, F. Magician’s corner: 9. Performance metrics for machine learning models. Radiol. Artif. Intell. 2021, 3, E200126. [Google Scholar] [CrossRef]
- Mohamed, A.E. Comparative study of four supervised machine learning techniques for classification. Int. J. Appl. 2017, 7, 5–18. [Google Scholar]
- Tan, J.; Yang, J.; Wu, S.; Chen, G.; Zhao, J. A critical look at the current train/test split in machine learning. arXiv 2021, arXiv:2106.04525. [Google Scholar]
- Sheth, V.; Tripathi, U.; Sharm, A. Comparative analysis of decision tree classification algorithms. Int. J. Curr. Eng. Technol. 2013, 3, 334–337. [Google Scholar]
- Azar, A.T.; Elshazly, H.I.; Hassanien, A.E.; Elkorany, A.M. A random forest classifier for lymph diseases. Comput. Methods Programs Biomed. 2014, 113, 465–473. [Google Scholar] [CrossRef] [PubMed]
- Song, Y.Y.; Ying, L.U. Decision tree methods: Applications for classification and prediction. Shanghai Arch. Psychiatry 2015, 27, 130. [Google Scholar] [PubMed]
- Liaw, A.; Wiener, M. Classification and regression by randomForest. R News 2002, 2, 18–22. [Google Scholar]
- Zhang, Y. Support vector machine classification algorithm and its application. In Proceedings of the Information Computing and Applications: Third International Conference, ICICA 2012, Chengde, China, 14–16 September 2012; Proceedings, Part II 3. Springer: Berlin/Heidelberg, Germany, 2012. [Google Scholar]
- Santhanam, R.; Uzir, N.; Raman, S.; Banerjee, S. Experimenting XGBoost algorithm for prediction and classification of different datasets. Int. J. Control Theory Appl. 2016, 9, 651–662. [Google Scholar]
- XGBoost Documentation. Available online: https://xgboost.readthedocs.io/en/stable/ (accessed on 24 December 2022).
- Rufo, D.D.; Debelee, T.G.; Ibenthal, A.; Negera, W.G. Diagnosis of diabetes mellitus using gradient boosting machine (LightGBM). Diagnostics 2021, 11, 1714. [Google Scholar] [CrossRef] [PubMed]
- Abdurrahman, M.H.; Irawan, B.; Setianingsih, C. A review of light gradient boosting machine method for hate speech classification on twitter. In Proceedings of the 2020 2nd International Conference on Electrical, Control and Instrumentation Engineering (ICECIE), Kuala Lumpur, Malaysia, 28 November 2020. [Google Scholar]
- Desai, M.; Shah, M. An anatomization on breast cancer detection and diagnosis employing multi-layer perceptron neural network (MLP) and Convolutional neural network (CNN). Clin. Ehealth 2021, 4, 1–11. [Google Scholar] [CrossRef]
- Marcílio, W.E.; Eler, D.M. From explanations to feature selection: Assessing SHAP values as feature selection mechanism. In Proceedings of the 2020 33rd SIBGRAPI Conference on Graphics, Patterns and Images (SIBGRAPI), Porto de Galinhas, Brazil, 7–10 November 2020. [Google Scholar]
- Bowen, D.; Ungar, L. Generalized SHAP: Generating multiple types of explanations in machine learning. arXiv 2020, arXiv:2006.07155. [Google Scholar]


| Attributes | Data Type | Interpretation |
|---|---|---|
| age | numeric | Age of the patient |
| gender | nominal | Whether the patient is male/female |
| polyuria | nominal | Whether the patient experienced frequent urination |
| polydipsia | nominal | Whether the patient had excessive thirst/drinking |
| sudden_weight_loss | nominal | Whether the patient experienced a period of sudden reduced weight |
| weakness | nominal | Whether the patient experienced a moment of weakness |
| polyphagia | nominal | Whether the patient experienced extreme hunger |
| genital_thrush | nominal | Whether the patient had a yeast infection |
| visual_blurring | nominal | Whether the patient experienced unclear vision |
| itching | nominal | Whether the patient experienced itching |
| irritability | nominal | Whether the patient experienced irritability |
| delayed_healing | nominal | Whether the patient observed a delay in recovery after being injured |
| partial_paresis | nominal | Whether the patient experienced a period of muscle wasting or a group of failing muscles |
| muscle_stiffness | nominal | Whether the patient experienced muscle stiffness |
| alopecia | nominal | Whether the patient experienced hair loss |
| obesity | nominal | Considering their body mass index, determine whether the patient is obese |
| class | nominal | Presence of diabetes (positive/negative) |
| Algorithm | Accuracy | Precision | Recall | F1-Score | Sensitivity | Specificity | Kappa Statistics | MCC |
|---|---|---|---|---|---|---|---|---|
| SVM | 92.19% | 0.9117 | 0.9394 | 0.9254 | 0.9032 | 0.9394 | 0.8434 | 0.8438 |
| MLP | 93.23% | 0.9388 | 0.9293 | 0.934 | 0.9355 | 0.9293 | 0.8645 | 0.8645 |
| LGBM | 94.27% | 0.9782 | 0.9091 | 0.9424 | 0.9785 | 0.9091 | 0.8855 | 0.8879 |
| XGB | 96.35% | 0.9791 | 0.9495 | 0.9641 | 0.9785 | 0.9495 | 0.9271 | 0.9275 |
| DT | 97.39% | 0.9896 | 0.9596 | 0.9743 | 0.9892 | 0.9596 | 0.9479 | 0.9484 |
| RF | 98.44% | 0.98 | 0.9899 | 0.9849 | 0.9785 | 0.9899 | 0.9687 | 0.9687 |
| Algorithm | Accuracy | Precision | Recall | F1-Score | Sensitivity | Specificity | Kappa Statistics | MCC |
|---|---|---|---|---|---|---|---|---|
| MLP | 93.59% | 0.9423 | 0.9608 | 0.9514 | 0.8889 | 0.9608 | 0.8571 | 0.8575 |
| SVM | 93.59% | 0.951 | 0.951 | 0.951 | 0.9074 | 0.951 | 0.8584 | 0.8584 |
| DT | 94.87% | 0.9796 | 0.9412 | 0.96 | 0.9629 | 0.9412 | 0.8886 | 0.89 |
| LGBM | 98.08% | 1 | 0.9706 | 0.9851 | 1 | 0.9706 | 0.958 | 0.9589 |
| XGB | 98.72% | 1 | 0.9804 | 0.9901 | 1 | 0.9804 | 0.9719 | 0.9723 |
| RF | 99.37% | 1 | 0.9902 | 0.9951 | 1 | 0.9902 | 0.9859 | 0.986 |
| Algorithm | Accuracy | Precision | Recall | F1-Score | Sensitivity | Specificity | Kappa Statistics | MCC |
|---|---|---|---|---|---|---|---|---|
| DT | 91.61% | 0.9784 | 0.8921 | 0.9333 | 0.9629 | 0.8921 | 0.8228 | 0.8291 |
| SVM | 89.74% | 0.8981 | 0.9509 | 0.9238 | 0.7963 | 0.9509 | 0.7673 | 0.7703 |
| XGB | 92.95% | 0.9691 | 0.9216 | 0.9447 | 0.9444 | 0.9216 | 0.8475 | 0.8496 |
| LGBM | 92.95% | 0.9691 | 0.9216 | 0.9447 | 0.9444 | 0.9216 | 0.8475 | 0.8496 |
| MLP | 92.95% | 0.9505 | 0.9412 | 0.9458 | 0.9074 | 0.9412 | 0.8449 | 0.845 |
| RF | 94.87% | 0.9608 | 0.9608 | 0.9608 | 0.9259 | 0.9608 | 0.8867 | 0.8867 |
| Algorithm | Accuracy | Precision | Recall | F1-Score | Sensitivity | Specificity | Kappa Statistics | MCC |
|---|---|---|---|---|---|---|---|---|
| DT | 91.67% | 0.9278 | 0.9091 | 0.9184 | 0.9247 | 0.9091 | 0.8333 | 0.8334 |
| SVM | 87.50% | 0.8947 | 0.8586 | 0.8763 | 0.8925 | 0.8586 | 0.7501 | 0.7507 |
| XGB | 92.71% | 0.9474 | 0.9091 | 0.9278 | 0.9462 | 0.9091 | 0.8542 | 0.8549 |
| LGBM | 93.23% | 0.9574 | 0.9091 | 0.9326 | 0.957 | 0.9091 | 0.8647 | 0.8658 |
| MLP | 91.14% | 0.9271 | 0.8989 | 0.9128 | 0.9247 | 0.8989 | 0.8229 | 0.8233 |
| RF | 93.23% | 0.9574 | 0.9091 | 0.9326 | 0.957 | 0.9091 | 0.8647 | 0.8658 |
| Author | Accuracy | Precision | Recall | F1-Measure | Kappa | MCC |
|---|---|---|---|---|---|---|
| Krishnamoorthi et al. [7] | 83.00% | 0.7663 | 0.7193 | 0.7420 | - | - |
| Fazakis et al. [10] | 88.40% | 0.4490 | 0.8560 | - | - | - |
| Khanam et al. [5] | 88.60% | - | - | - | - | - |
| Hasan et al. [9] | 88.84% | 0.8420 | 0.7890 | 0.8146 | - | - |
| Barakat et al [13] | 94.00% | - | 0.9300 | - | - | - |
| Maniruzzaman et al. [12] | 94.25% | 0.9429 | 0.9954 | 0.9684 | - | - |
| Ahmed et al. [11] | 94.87% | 0.9593 | 0.9555 | 0.9574 | - | - |
| Islam et al. [8] | 95.94% | - | 100% | - | - | - |
| Islam M. M. et al. [6] | 99.00% | 0.990 | 0.990 | 0.980 | - | - |
| This study | 99.37% | 1.0000 | 0.9902 | 0.9951 | 0.9859 | 0.9860 |
Disclaimer/Publisher’s Note: The statements, opinions and data contained in all publications are solely those of the individual author(s) and contributor(s) and not of MDPI and/or the editor(s). MDPI and/or the editor(s) disclaim responsibility for any injury to people or property resulting from any ideas, methods, instructions or products referred to in the content. |
© 2023 by the authors. Licensee MDPI, Basel, Switzerland. This article is an open access article distributed under the terms and conditions of the Creative Commons Attribution (CC BY) license (https://creativecommons.org/licenses/by/4.0/).
Share and Cite
Rahman, M.A.; Abdulrazak, L.F.; Ali, M.M.; Mahmud, I.; Ahmed, K.; Bui, F.M. Machine Learning-Based Approach for Predicting Diabetes Employing Socio-Demographic Characteristics. Algorithms 2023, 16, 503. https://doi.org/10.3390/a16110503
Rahman MA, Abdulrazak LF, Ali MM, Mahmud I, Ahmed K, Bui FM. Machine Learning-Based Approach for Predicting Diabetes Employing Socio-Demographic Characteristics. Algorithms. 2023; 16(11):503. https://doi.org/10.3390/a16110503
Chicago/Turabian StyleRahman, Md. Ashikur, Lway Faisal Abdulrazak, Md. Mamun Ali, Imran Mahmud, Kawsar Ahmed, and Francis M. Bui. 2023. "Machine Learning-Based Approach for Predicting Diabetes Employing Socio-Demographic Characteristics" Algorithms 16, no. 11: 503. https://doi.org/10.3390/a16110503
APA StyleRahman, M. A., Abdulrazak, L. F., Ali, M. M., Mahmud, I., Ahmed, K., & Bui, F. M. (2023). Machine Learning-Based Approach for Predicting Diabetes Employing Socio-Demographic Characteristics. Algorithms, 16(11), 503. https://doi.org/10.3390/a16110503