
Heart Disease Prediction Using Concatenated Hybrid Ensemble Classifiers

 ,
,  ,
,  and
and
Abstract
:1. Introduction
2. Related Work
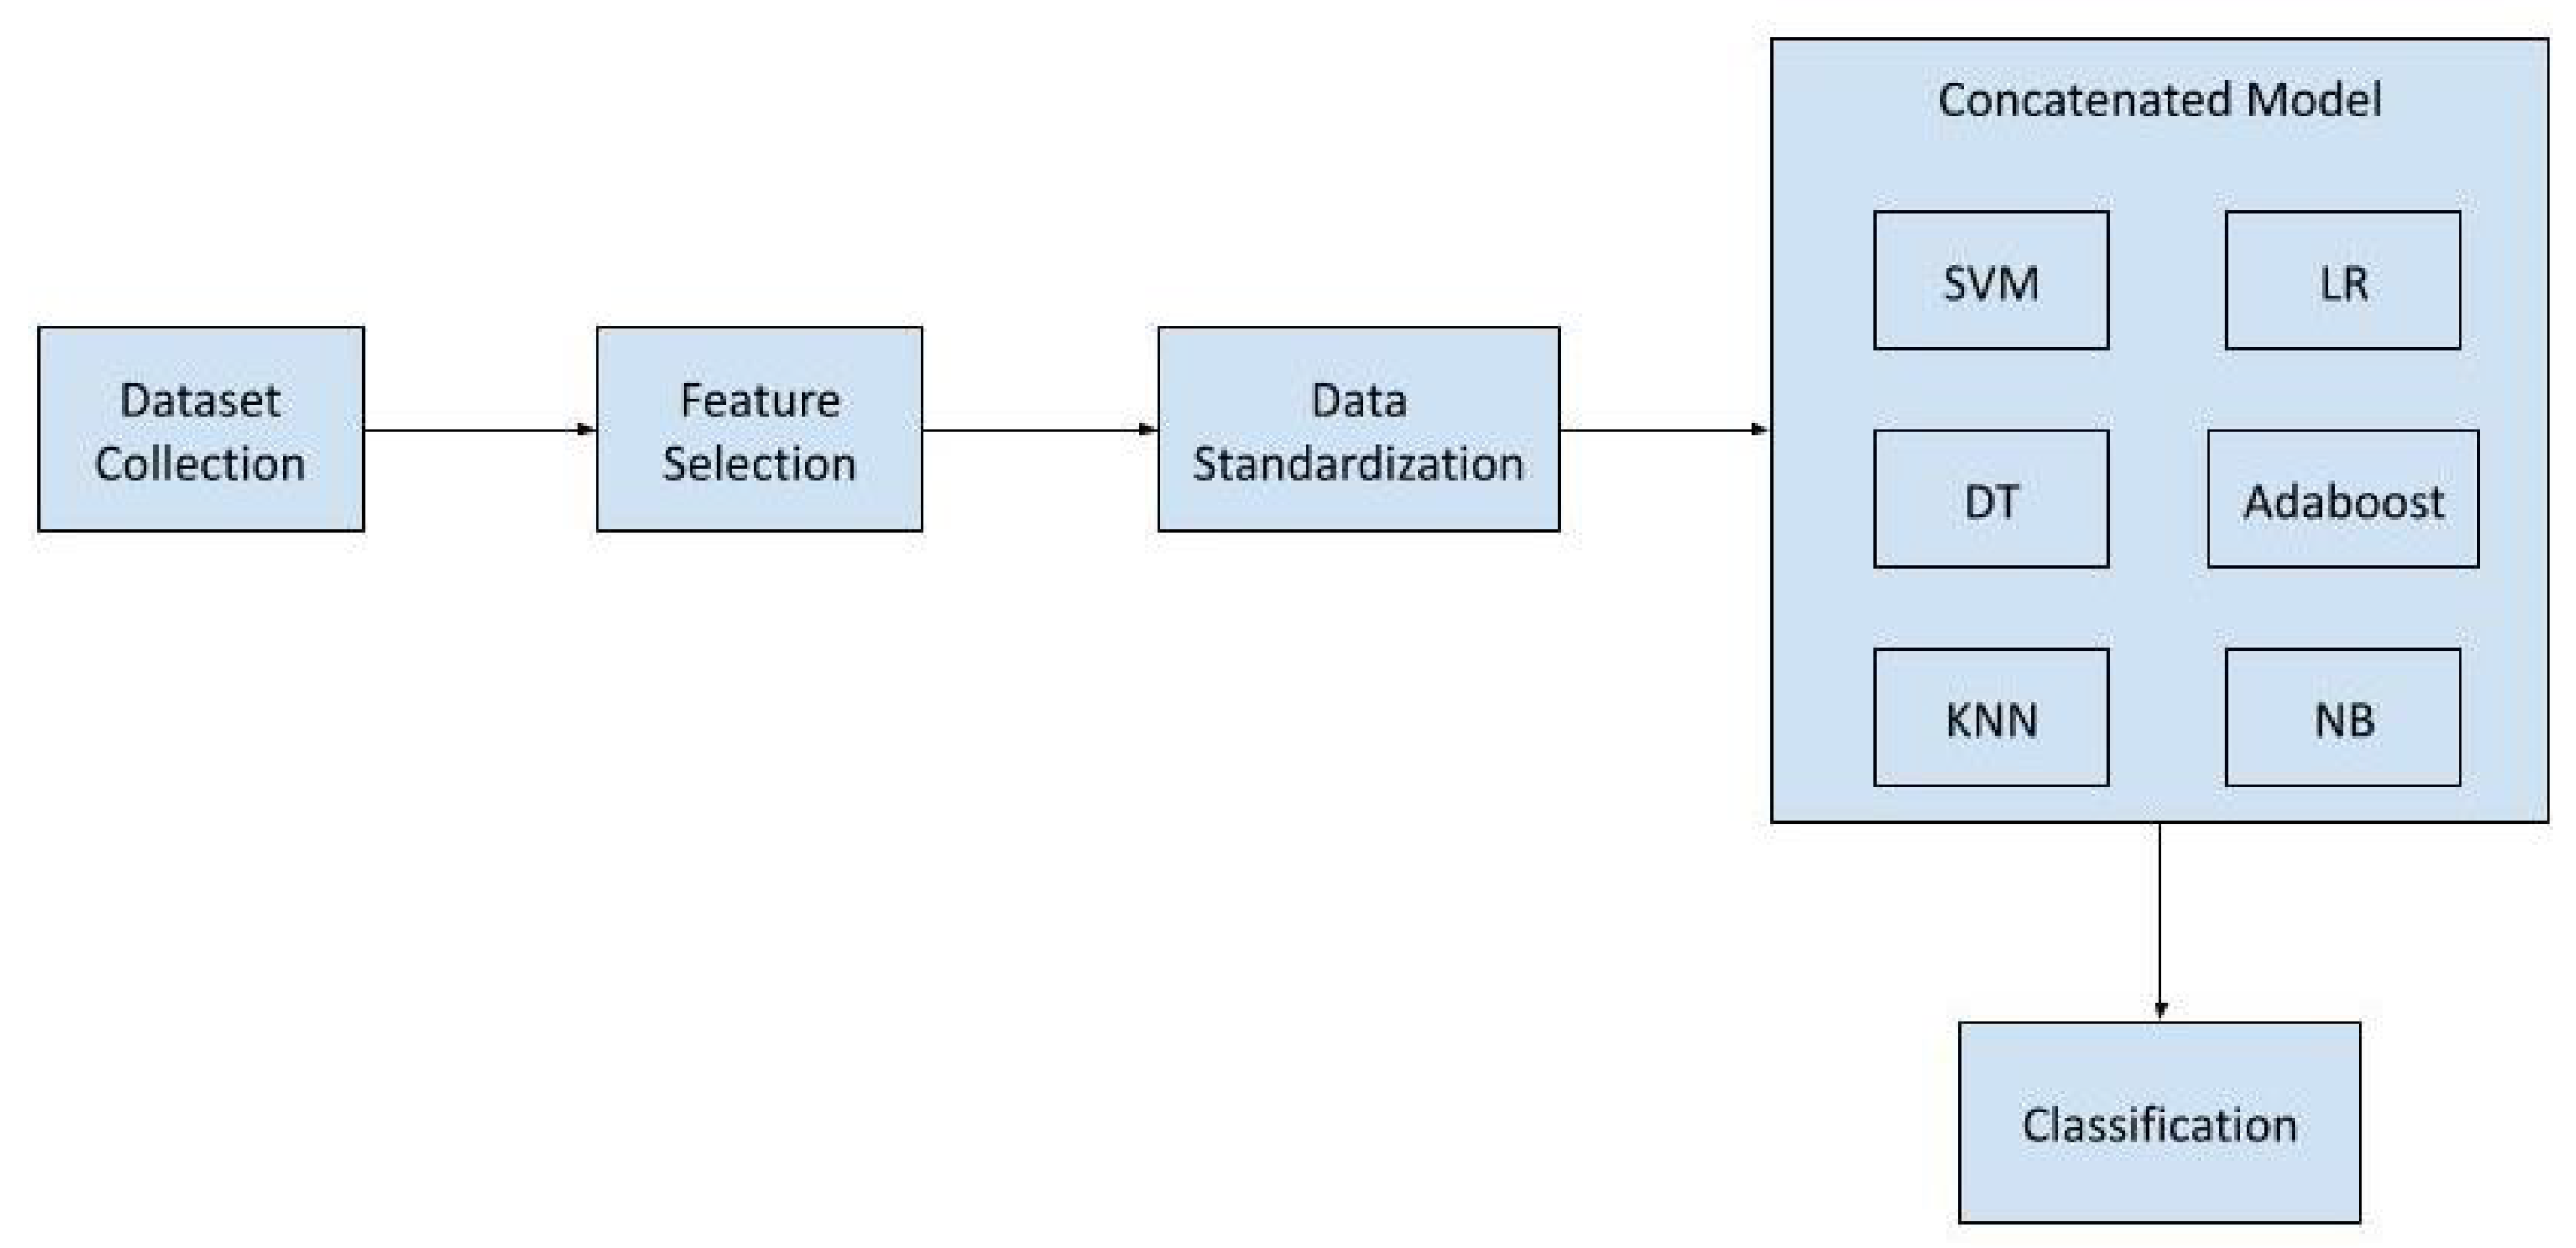
3. Proposed Model
3.1. Dataset
3.2. Data Cleaning
3.3. Feature Engineering
3.4. Data Standardization
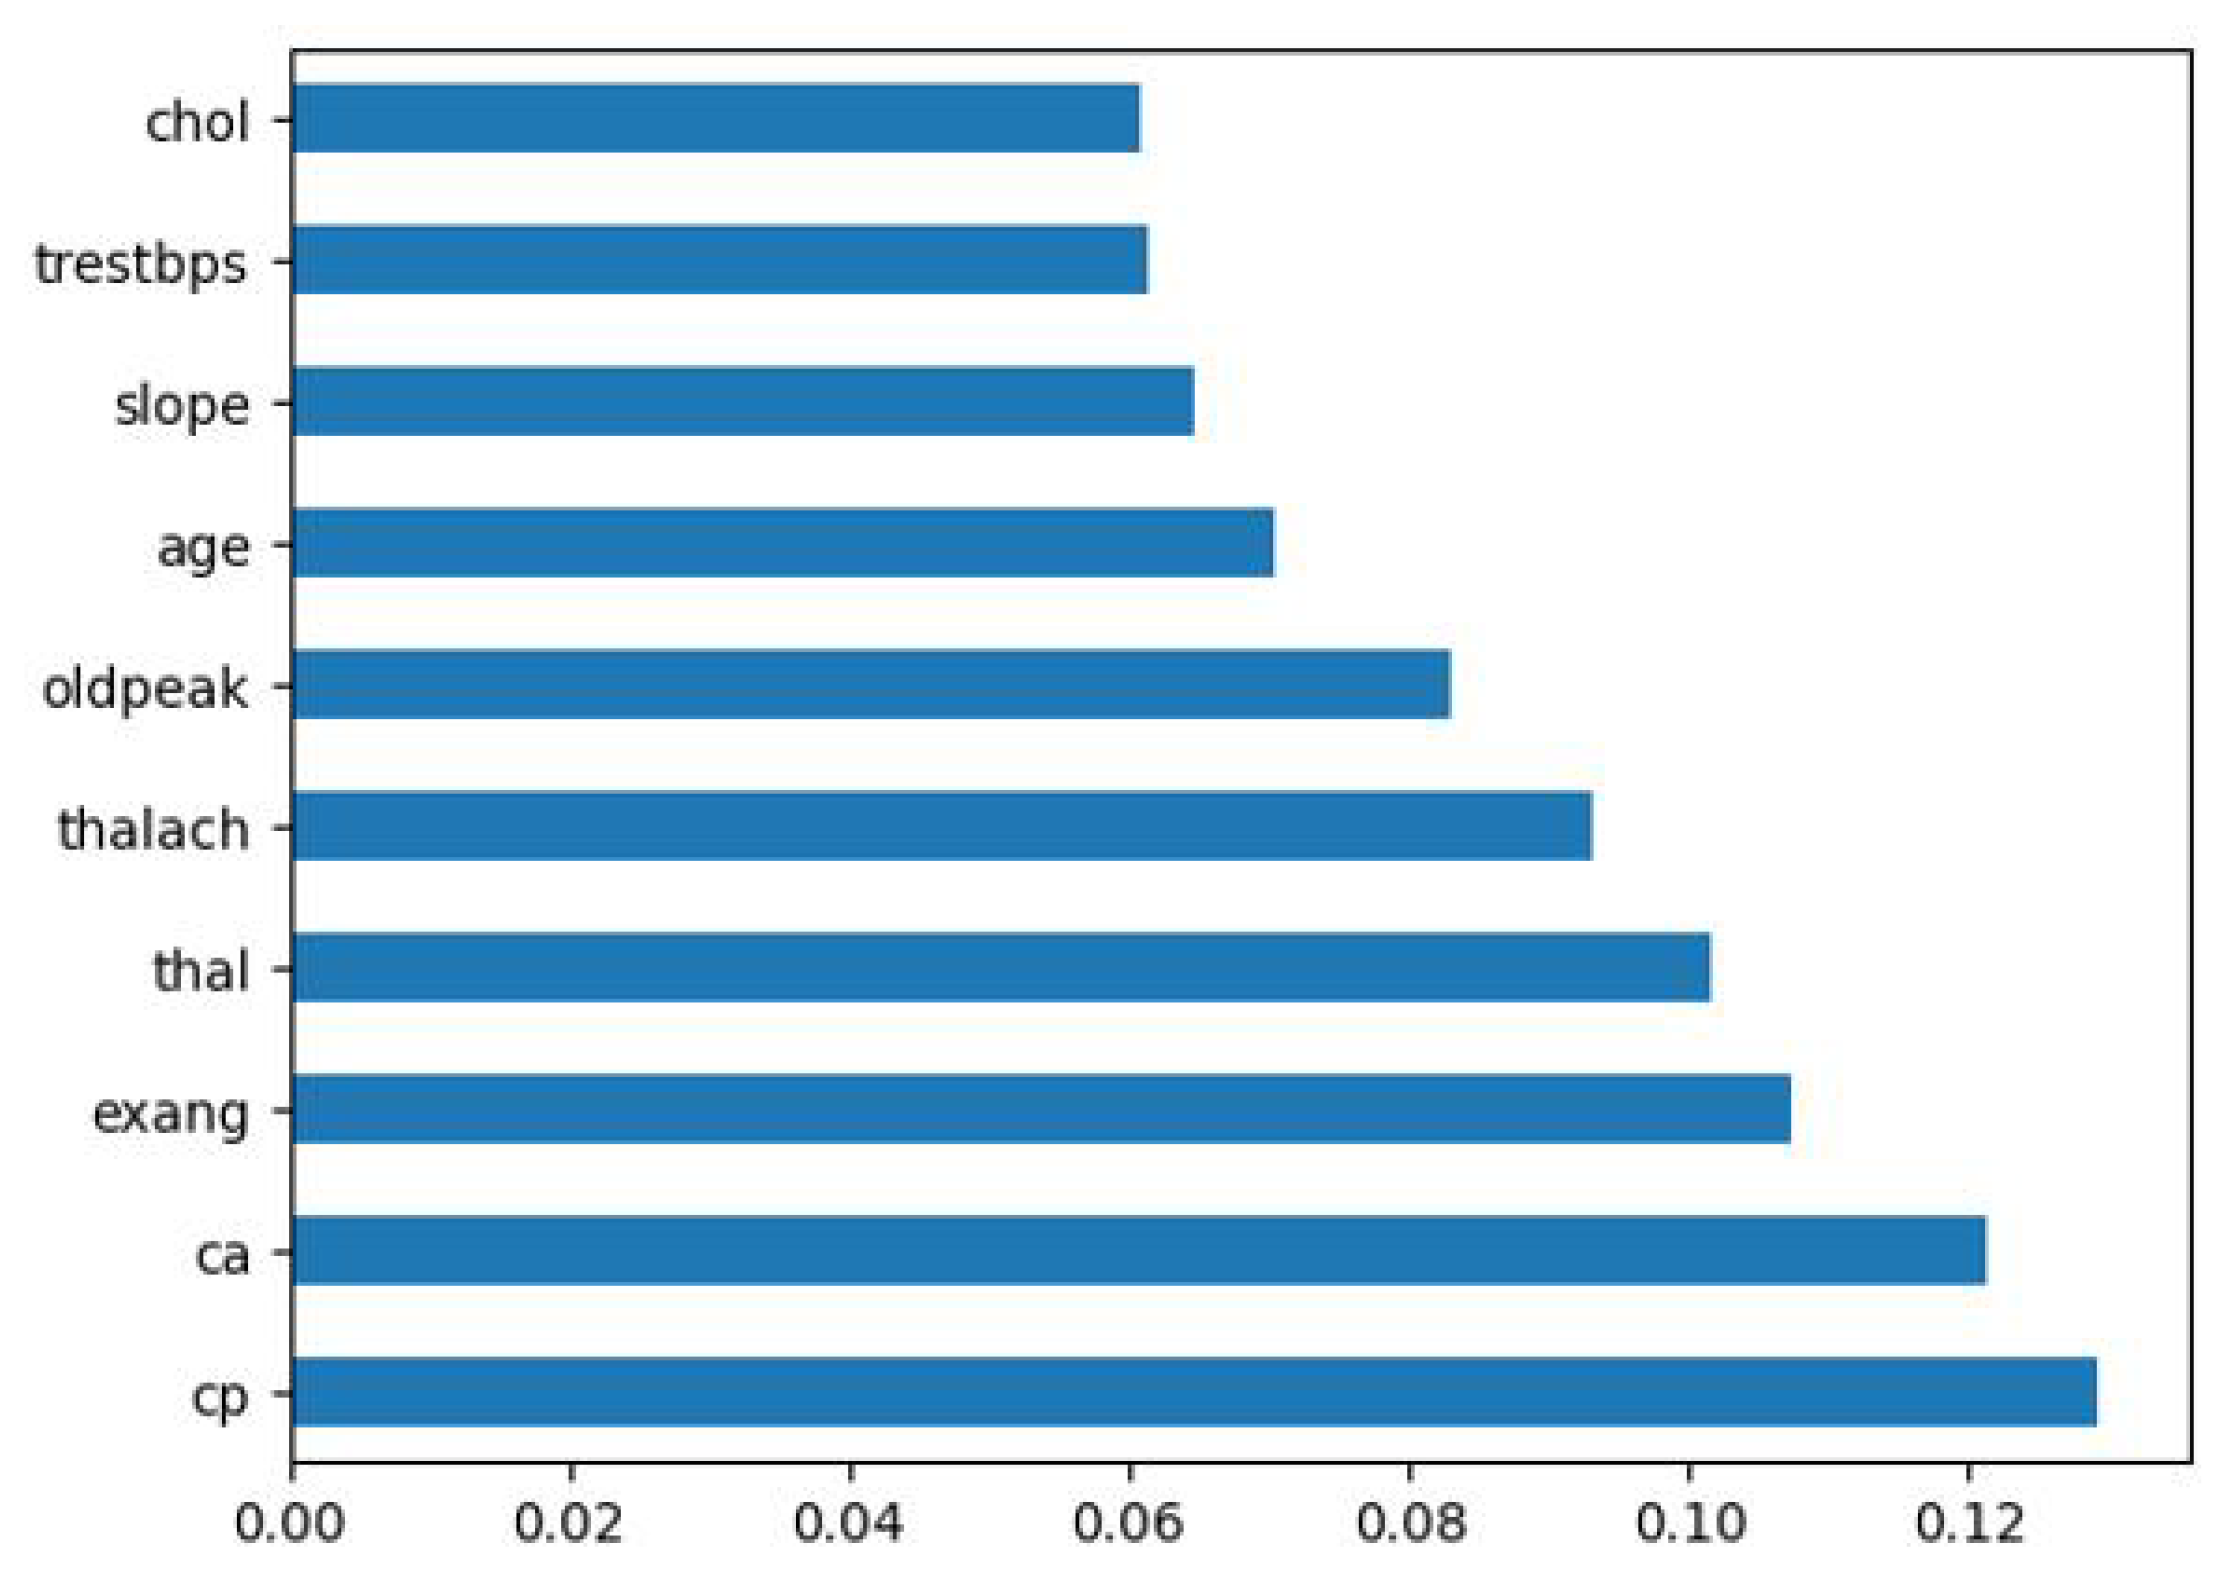
3.5. Feature Selection
3.6. Classifier Selection
- Support Vector Machine (SVM): SVM is an effective ML technique that is commonly employed for problems involving classification and regression [36,37]. The algorithm operates by identifying the hyperplane that achieves the highest degree of separation between distinct classes of data, while simultaneously increasing the margin between these classes. SVM exhibits notable efficacy in high-dimensional areas and possesses the ability to handle both linear and non-linear associations among data points. The technology in question is adaptable and extensively employed across diverse disciplines such as image recognition, text classification, and bioinformatics. Consequently, it holds significant value as an essential asset for data scientists and practitioners of ML.
- Decision Tree: The Decision Tree method is a fundamental ML technique that facilitates decision-making processes by organizing data into a hierarchical structure that resembles a tree [38]. The method is extensively employed for tasks involving classification and regression, offering a clear and comprehensible approach to generating predictions based on input data. Decision trees are frequently employed in sophisticated ensemble techniques, rendering them a valuable asset in the field of ML.
- K-Nearest Neighbor (KNN): KNN is a versatile classification and regression technique [39]. The ‘k’ nearest data points in the training set are used to produce predictions in KNN. In regression, the average neighbor value predicts the query point’s class label, while in classification, the majority class determines it. KNN works in many applications, since it does not make any assumptions about data distributions.
- Logistic Regression: Logistic Regression is a widely employed statistical and ML model utilized for binary classification assignments [40,41]. Contrary to its nomenclature, this method is not employed for regression purposes; rather, it is utilized to estimate the likelihood of an input being classified into one of two distinct categories. This process involves the utilization of a sigmoid function to model the data, resulting in a mapping of input properties to a probability score ranging from 0 to 1. Logistic Regression is characterized by its simplicity, interpretability, and computational efficiency, rendering it a valuable analytical technique across many fields such as medical diagnosis, spam detection, and credit scoring. The linear model possesses the capability to be expanded to accommodate multi-class categorization, rendering it highly adaptable in practical applications.
- Adaboost: AdaBoost, also known as Adaptive Boosting, is a ML ensemble method employed to enhance the efficacy of weak classifiers [42]. The algorithm operates by iteratively training a sequence of weak classifiers, assigning higher importance to the cases that were incorrectly identified by the preceding classifiers. This approach directs the succeeding classifiers towards the more difficult cases, resulting in a robust and precise model. AdaBoost’s adaptability allows it to handle various types of healthcare data, including clinical, genetic, or imaging data. Its feature selection capability can help prioritize important factors in disease diagnosis, and its reduced risk of overfitting ensures robust performance even in the presence of noisy or incomplete data. Overall, AdaBoost is a valuable tool for improving the accuracy and reliability of disease prediction models, which can have a significant impact on early diagnosis and treatment planning.
- Naive Bayes: The Naive Bayes algorithm is a widely utilized probabilistic classification technique that is known for its simplicity and effectiveness in the fields of ML and natural language processing [43]. The Naive Bayes classifier is derived from Bayes’ theorem and relies on the assumption of conditional independence of characteristics. Despite the adoption of this simplifying assumption, Naive Bayes consistently demonstrates an impressive performance in various tasks such as text categorization and spam detection. The calculation of the probability of a data point’s membership in a specific class renders it a handy instrument for decision-making and categorization purposes. The approach demonstrates computational efficiency and is particularly well-suited for the analysis of high-dimensional data, which may pose challenges for alternative algorithms.
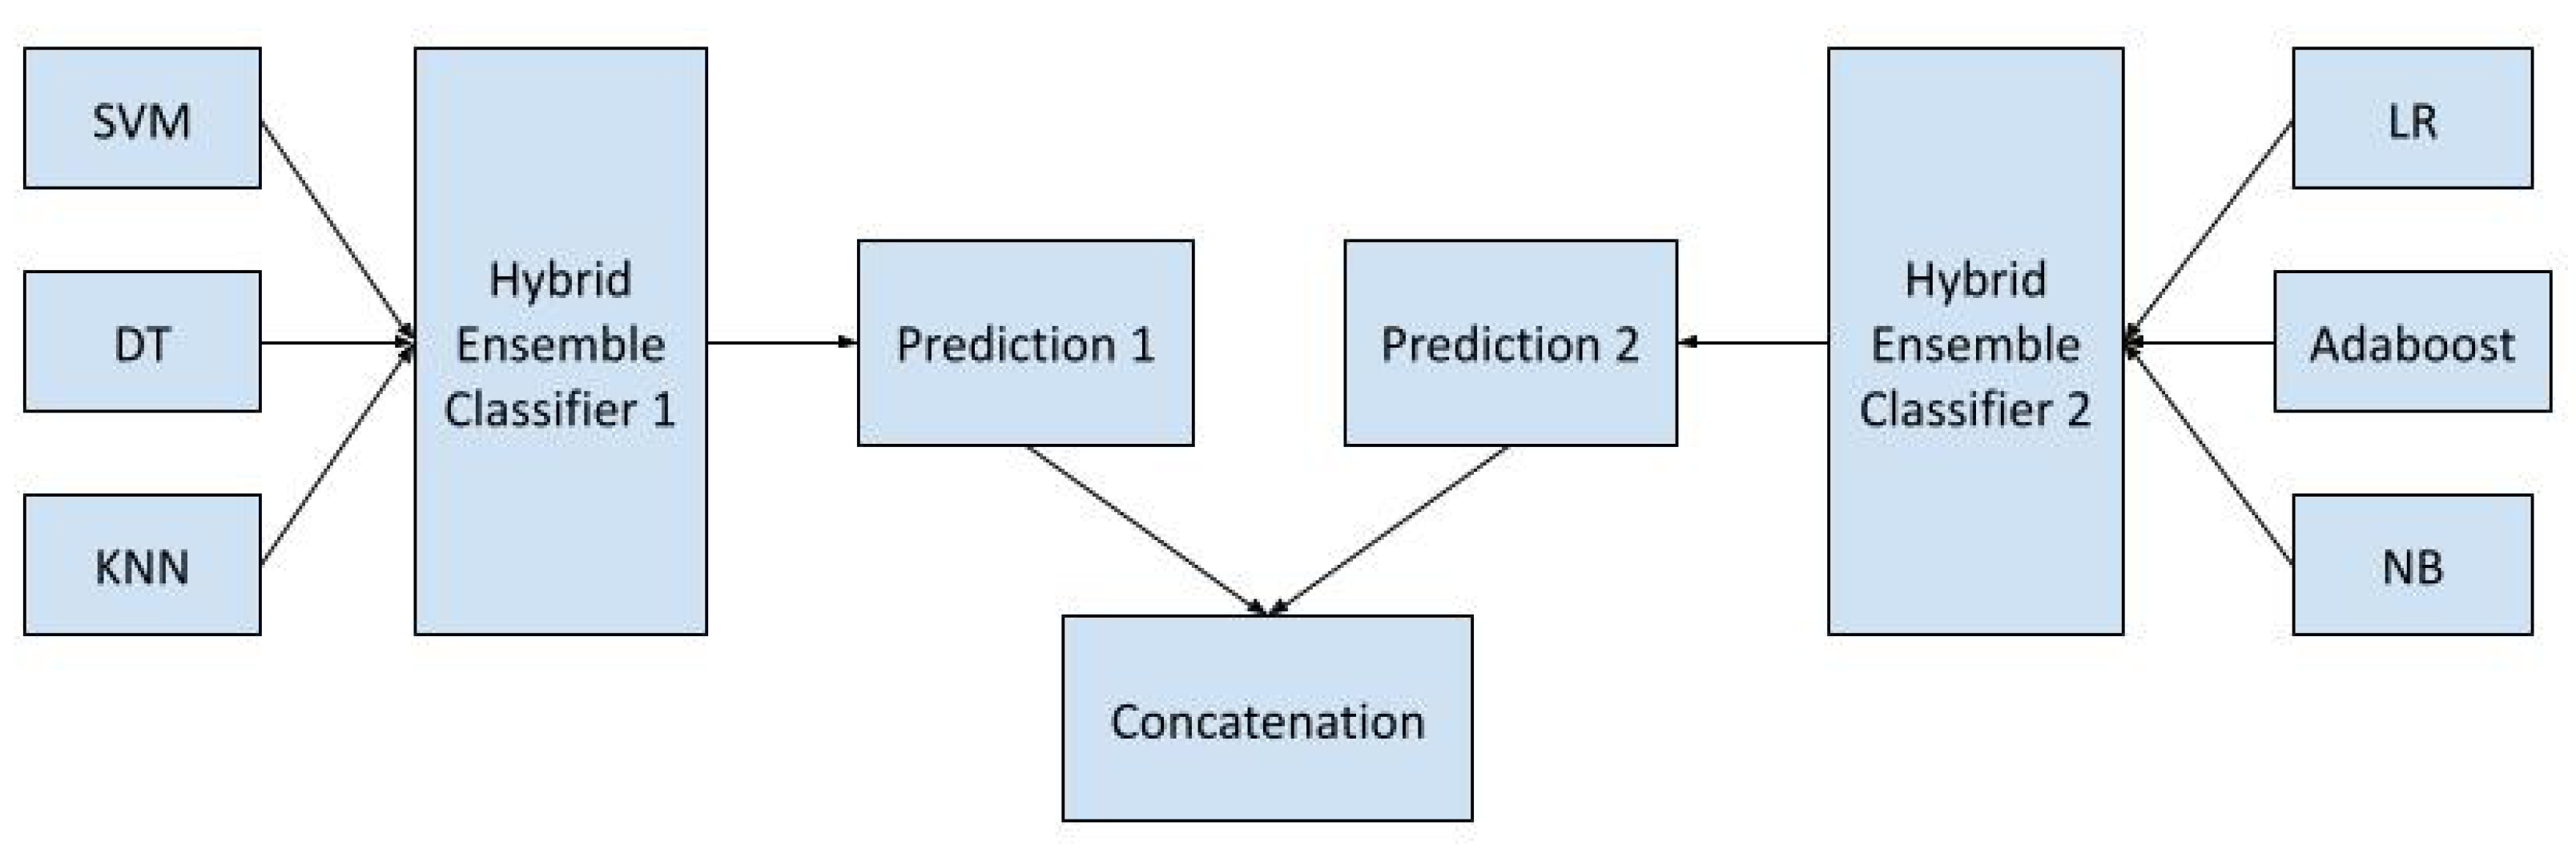
3.7. Ensemble Learning
- 1.
- Hybrid Ensemble 1: This ensemble consists of SVM, Decision Tree, and KNN classifiers. Each base classifier is trained on the preprocessed dataset independently.
- 2.
- Hybrid Ensemble 2: This ensemble includes Logistic Regression, Adaboost, and Naive Bayes classifiers, each trained on the same dataset as in Hybrid Ensemble 1.
- 1.
- SVM: Linear kernels were chosen for their simplicity and robustness to linearly separable data. SVMs are known for producing efficient decision boundaries.
- 2.
- Decision Tree: Selected for its ability to represent nonlinear relationships in the data and for its interpretability.
- 3.
- KNN: Employed for recognizing local patterns and adjusting to the structure of the data.
- 1.
- Logistic Regression: A straightforward yet powerful linear classifier suitable for binary classification tasks.
- 2.
- AdaBoost: An ensemble technique known for building a powerful classifier by combining weak ones, adapting to complex data.
- 3.
- Naive Bayes: A probabilistic classifier frequently used in various domains, particularly in text categorization.
3.8. Hyperparameter Settings and Optimization
- C: The regularization parameter managing the compromise between minimizing classification errors and optimizing the margin, with values equal to 0.1.
- gamma: The kernel coefficient in the SVM decision boundary that establishes the weight of a single training example, with values equal to ’scale’.
- max_depth: The maximum depth of the decision tree, limiting the complexity of the tree, with values equal to 5.
- min_samples_split: The minimum number of samples required to split an internal node in the tree, with values equal to 10.
- n_neighbors: The number of nearest neighbors considered for classification, with values equal to 7.
- weights: ‘Distance’ (weights inversely proportional to distance) and ‘Uniform’ (equal weights) are the alternatives for the weight function used in prediction, with values equal to ‘Uniform’.
- C: The regularization parameter managing the trade-off between avoiding overfitting and maximizing likelihood, with values equal to one.
- penalty: The type of regularization penalty applied, with options ‘l1’ (L1 regularization) and ‘l2’ (L2 regularization), with values equal to ‘l2’.
- learning_rate: A hyperparameter that scales the contribution of each weak learner. Smaller values may prevent overfitting, with values equal to 0.1.
- n_estimators: The number of weak learners (base classifiers) to combine in the ensemble, with values equal to 50.
- var_smoothing: A smoothing parameter that adds a small value to the variances of features. This helps stabilize the computation of conditional probabilities and prevents issues with zero variances, with values equal to 1 × .
4. Experimental Analysis
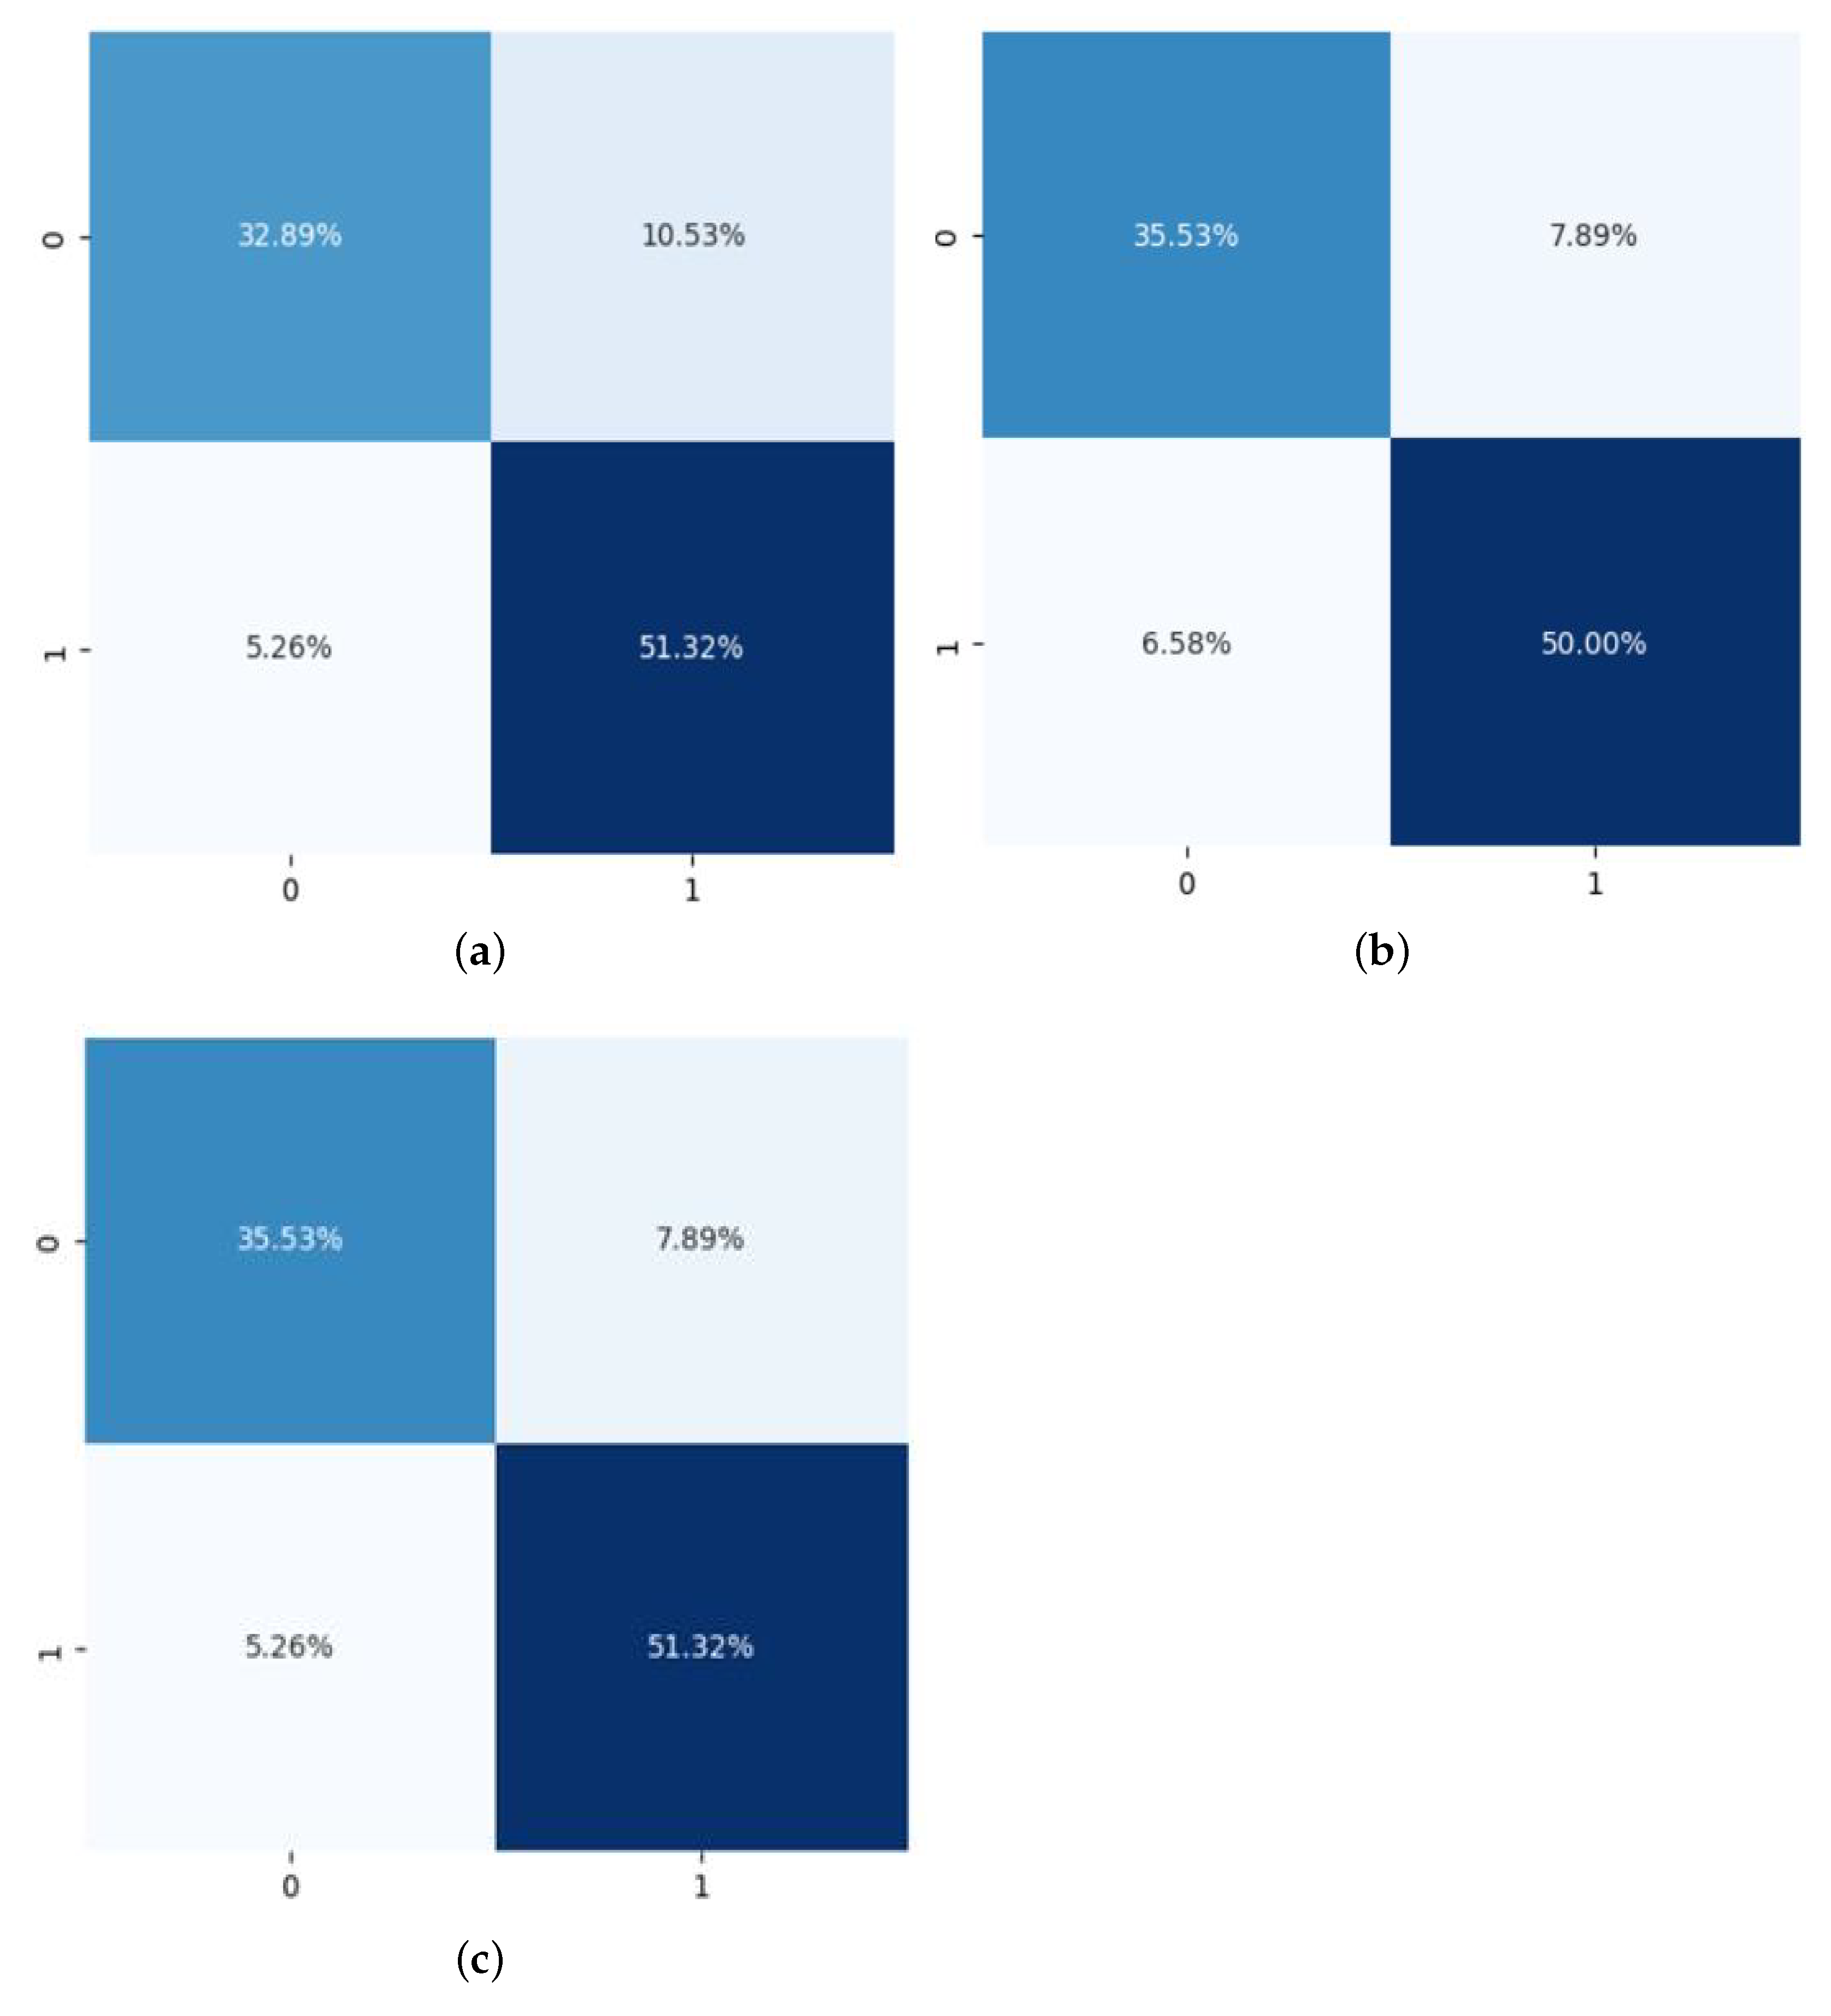
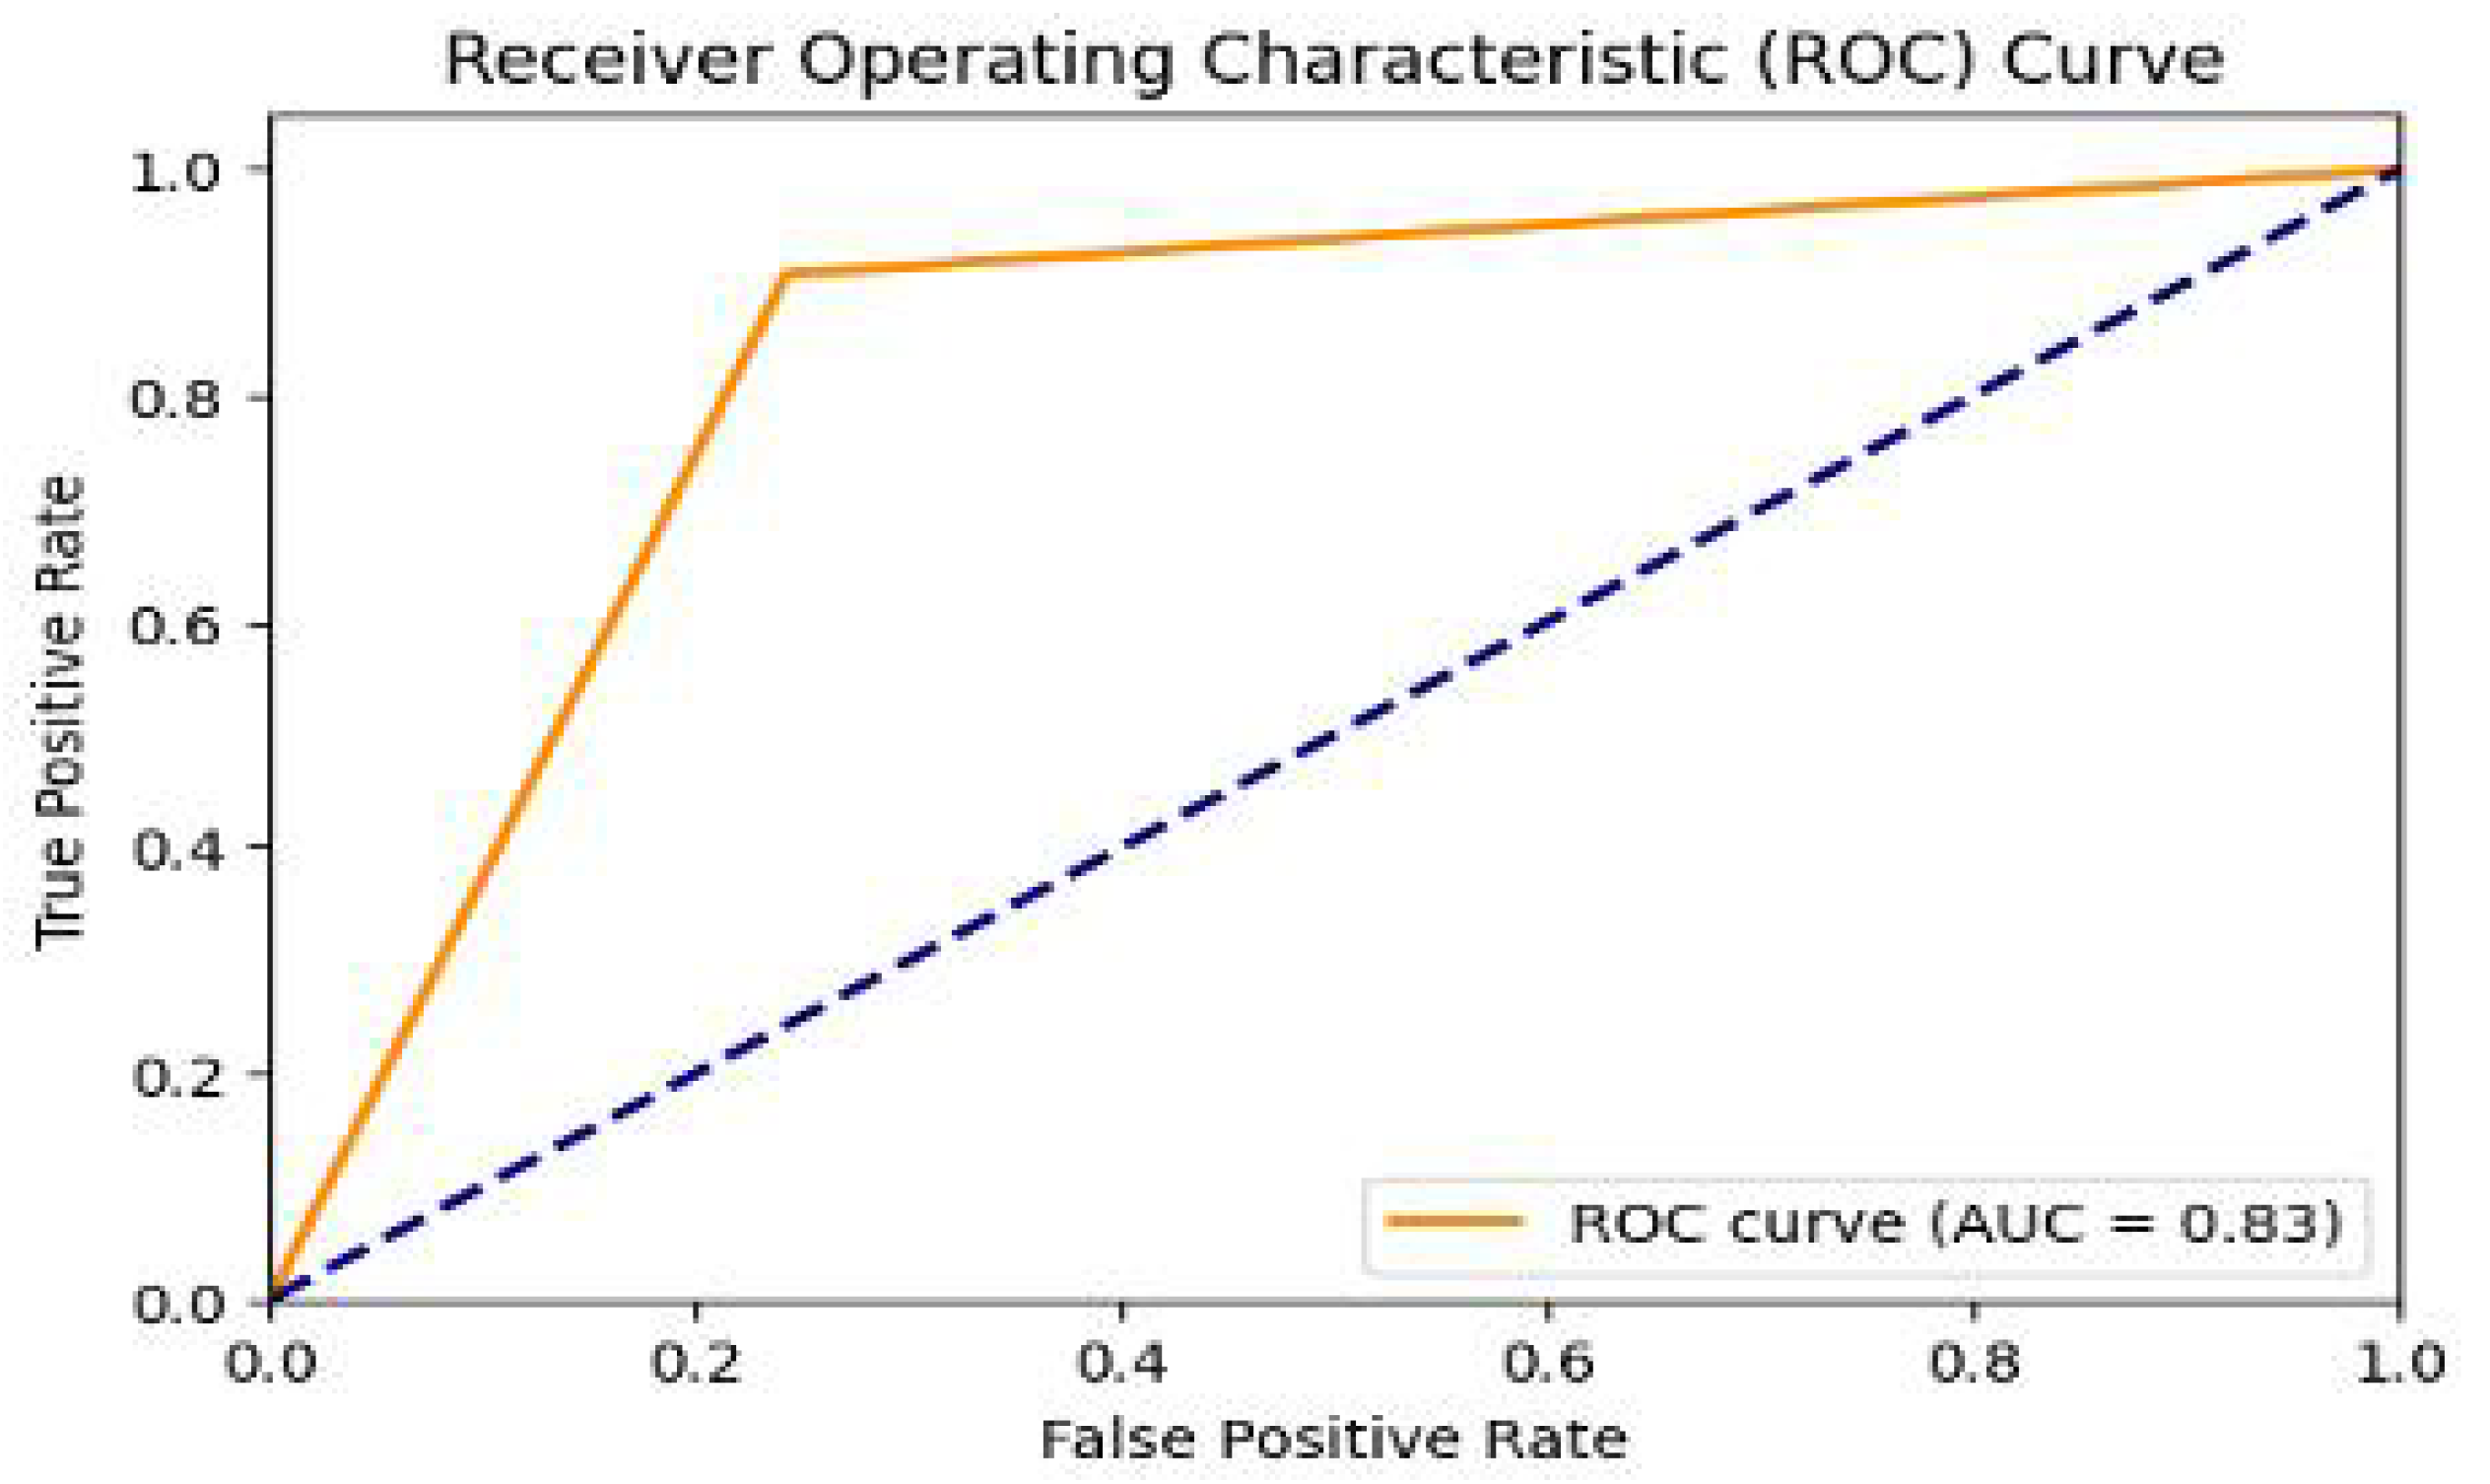
4.1. Performance Metrics
- True Positive (TP): Correctly predicted positive cases.
- False Positive (FP): Incorrectly predicted positive cases.
- True Negative (TN): Correctly predicted negative cases.
- False Negative (FN): Incorrectly predicted negative cases.
4.2. Comparison with Existing Works
4.3. Discussion
5. Conclusions and Future Work
Author Contributions
Funding
Data Availability Statement
Conflicts of Interest
References
- Celermajer, D.S.; Chow, C.K.; Marijon, E.; Anstey, N.M.; Woo, K.S. Cardiovascular Disease in the Developing World: Prevalences, Patterns, and the Potential of Early Disease Detection. J. Am. Coll. Cardiol. 2012, 60, 1207–1216. [Google Scholar] [CrossRef]
- Bakar, W.A.W.A.; Josdi, N.L.N.B.; Man, M.B.; Zuhairi, M.A.B. A Review: Heart Disease Prediction in Machine Learning &Deep Learning. In Proceedings of the 19th IEEE International Colloquium on Signal Processing & Its Applications (CSPA), Kedah, Malaysia, 3–4 March 2023; IEEE: Piscataway, NJ, USA, 2023; pp. 150–155. [Google Scholar]
- Bhatt, C.M.; Patel, P.; Ghetia, T.; Mazzeo, P.L. Effective Heart Disease Prediction Using Machine Learning Techniques. Algorithms 2023, 16, 88. [Google Scholar] [CrossRef]
- Cardiovascular Diseases (CVDs). Available online: https://www.who.int/news-room/fact-sheets/detail/cardiovascular-diseases-(cvds) (accessed on 10 November 2023).
- Jánosi, A.; Steinbrunn, W.; Pfisterer, M.; Detrano, R. Heart Disease. Uci Mach. Learn. Repos. 1988. [Google Scholar] [CrossRef]
- Désir, C.; Petitjean, C.; Heutte, L.; Salaün, M.; Thiberville, L. Classification of Endomicroscopic Images of the Lung Based on Random Subwindows and Extra-Trees. IEEE Trans. Biomed. Eng. 2012, 59, 2677–2683. [Google Scholar] [CrossRef] [PubMed]
- Raju, V.N.G.; Lakshmi, K.P.; Jain, V.M.; Kalidindi, A.; Padma, V. Study the Influence of Normalization/Transformation process on the Accuracy of Supervised Classification. In Proceedings of the 3rd International Conference on Smart Systems and Inventive Technology (ICSSIT), Tirunelveli, India, 20–22 August 2020; IEEE: Piscataway, NJ, USA, 2020; pp. 729–735. [Google Scholar]
- Dietterich, T.G. Ensemble Methods in Machine Learning. In Proceedings of the 1st International Workshop on Multiple Classifier Systems (MCS), Nanjing, China, 15–17 May 2000; Lecture Notes in Computer Science; Springer: Berlin/Heidelberg, Germany; Volume 1857, pp. 1–15.
- Rajdhan, A.; Agarwal, A.; Sai, M.; Ravi, D.; Ghuli, P. Heart Disease Prediction using Machine Learning. Int. J. Eng. Res. Technol. (IJERT) 2020, 9, 440–450. [Google Scholar]
- Shah, D.; Patel, S.; Bharti, S.K. Heart Disease Prediction using Machine Learning Techniques. SN Comput. Sci. 2020, 1, 345. [Google Scholar] [CrossRef]
- Haq, A.U.; Li, J.; Memon, M.H.; Nazir, S.; Sun, R. A Hybrid Intelligent System Framework for the Prediction of Heart Disease Using Machine Learning Algorithms. Mob. Inf. Syst. 2018, 2018, 3860146. [Google Scholar] [CrossRef]
- Swain, D.; Parmar, B.; Shah, H.; Gandhi, A.; Pradhan, M.R.; Kaur, H.; Acharya, B. Cardiovascular Disease Prediction using Various Machine Learning Algorithms. J. Comput. Sci. 2022, 18, 993–1004. [Google Scholar] [CrossRef]
- Mridha, K.; Kuri, A.C.; Saha, T.; Jadeja, N.; Shukla, M.; Acharya, B. Toward Explainable Cardiovascular Disease Diagnosis: A Machine Learning Approach. In Proceedings of the International Conference on Data Analytics and Insights (ICDAI), Kolkata, India, 11–13 May 2023; pp. 409–419. [Google Scholar]
- Triguero, I.; García, S.; Herrera, F. Self-labeled techniques for semi-supervised learning: Taxonomy, software and empirical study. Knowl. Inf. Syst. 2015, 42, 245–284. [Google Scholar] [CrossRef]
- Livieris, I.E.; Kanavos, A.; Tampakas, V.; Pintelas, P.E. An Auto-Adjustable Semi-Supervised Self-Training Algorithm. Algorithms 2018, 11, 139. [Google Scholar] [CrossRef]
- Boukhatem, C.; Youssef, H.Y.; Nassif, A.B. Heart Disease Prediction Using Machine Learning. In Proceedings of the Advances in Science and Engineering Technology International Conferences (ASET), Dubai, United Arab Emirates, 21–24 February 2022; IEEE: Piscataway, NJ, USA, 2022; pp. 1–6. [Google Scholar]
- Sharma, V.; Yadav, S.; Gupta, M. Heart Disease Prediction using Machine Learning Techniques. In Proceedings of the 2nd International Conference on Advances in Computing, Communication Control and Networking (ICACCCN), Greater Noida, India, 18–19 December 2020; IEEE: Piscataway, NJ, USA, 2020; pp. 177–181. [Google Scholar]
- Chang, V.; Bhavani, V.R.; Xu, A.Q.; Hossain, M. An Artificial Intelligence Model for Heart Disease Detection using Machine Learning Algorithms. Healthc. Anal. 2022, 2, 100016. [Google Scholar] [CrossRef]
- Patel, A.C.; Shameem, A.; Chaurasiya, S.; Mishra, M.; Saxena, A. Prediction of Heart Disease Using Machine Learning. Int. J. Sci. Dev. Res. 2019, 4, 354–357. [Google Scholar]
- Karthick, K.; Aruna, S.K.; Samikannu, R.; Kuppusamy, R.; Teekaraman, Y.; Thelkar, A.R. Implementation of a Heart Disease Risk Prediction Model Using Machine Learning. Comput. Math. Methods Med. 2022, 2022, 6517716. [Google Scholar] [CrossRef]
- Divya, K.; Sirohi, A.; Pande, S.; Malik, R. An IoMT Assisted Heart Disease Diagnostic System Using Machine Learning Techniques. In Cognitive Internet of Medical Things for Smart Healthcare; Springer: Berlin/Heidelberg, Germany, 2021; pp. 145–161. [Google Scholar]
- Mohan, S.; Thirumalai, C.; Srivastava, G. Effective Heart Disease Prediction Using Hybrid Machine Learning Techniques. IEEE Access 2019, 7, 81542–81554. [Google Scholar] [CrossRef]
- Ramprakash, P.; Sarumathi, R.; Mowriya, R.; Nithyavishnupriya, S. Heart Disease Prediction Using Deep Neural Network. In Proceedings of the International Conference on Inventive Computation Technologies (ICICT), Nepal, Lalitpur, India, 26–28 February 2020; IEEE: Piscataway, NJ, USA, 2020; pp. 666–670. [Google Scholar]
- Pasha, S.N.; Ramesh, D.; Mohmmad, S.; Harshavardhan, A.; Shabana. Cardiovascular disease prediction using deep learning techniques. In IOP Conference Series: Materials Science and Engineering; IOP Publishing: Bristol, UK, 2020; Volume 981, p. 022006. [Google Scholar]
- Grampurohit, S.; Sagarnal, C. Disease Prediction using Machine Learning Algorithms. In Proceedings of the International Conference for Emerging Technology (INCET), Belgaum, Karnataka India, 5–7 June 2020; IEEE: Piscataway, NJ, USA, 2020; pp. 1–7. [Google Scholar]
- Vanitha, G.; Shalini, K.; Shivani, C. Heart Disease Prediction Using Hybrid Technique. J. Interdiscip. Cycle Res. 2020, 6, 920–927. [Google Scholar]
- Majumder, A.B.; Gupta, S.; Singh, D. An Ensemble Heart Disease Prediction Model Bagged with Logistic Regression, Naïve Bayes and K Nearest Neighbour. In Journal of Physics: Conference Series; IOP Publishing: Bristol, UK, 2022; Volume 2286, p. 012017. [Google Scholar]
- Kumar, N.K.; Sindhu, G.S.; Prashanthi, D.K.; Sulthana, A.S. Analysis and Prediction of Cardio Vascular Disease using Machine Learning Classifiers. In Proceedings of the 6th International Conference on Advanced Computing and Communication Systems (ICACCS), Coimbatore, India, 6–7 March 2020; IEEE: Piscataway, NJ, USA, 2020; pp. 15–21. [Google Scholar]
- Kota, P.; Madenahalli, A.; Guturi, R.; Nukala, B.; Nagaraj, S.; Kota, S.; Neeli, P.C. Heart Disease Classification Comparison among Patients and Normal Subjects using Machine Learning and Artificial Neural Network Techniques. Int. J. Biosens. Bioelectron. 2021, 7. [Google Scholar] [CrossRef]
- Swarupa, A.N.V.K.; Sree, V.H.; Nookambika, S.; Kishore, Y.K.S.; Teja, U.R. Disease Prediction: Smart Disease Prediction System using Random Forest Algorithm. In Proceedings of the International Conference on Intelligent Systems, Smart and Green Technologies (ICISSGT), Visakhapatnam, India, 13–14 November 2021; IEEE: Piscataway, NJ, USA, 2021; pp. 48–51. [Google Scholar]
- Islam, S.; Jahan, N.; Khatun, M.E. Cardiovascular Disease Forecast using Machine Learning Paradigms. In Proceedings of the 4th International Conference on Computing Methodologies and Communication (ICCMC), Erode, India, 11–13 March 2020; IEEE: Piscataway, NJ, USA, 2020; pp. 487–490. [Google Scholar]
- Livieris, I.E.; Kanavos, A.; Tampakas, V.; Pintelas, P.E. An Ensemble SSL Algorithm for Efficient Chest X-ray Image Classification. J. Imaging 2018, 4, 95. [Google Scholar] [CrossRef]
- Livieris, I.E.; Kiriakidou, N.; Kanavos, A.; Tampakas, V.; Pintelas, P.E. On Ensemble SSL Algorithms for Credit Scoring Problem. Informatics 2018, 5, 40. [Google Scholar] [CrossRef]
- UCI Heart Disease Data. Available online: https://www.kaggle.com/datasets/redwankarimsony/heart-disease-data (accessed on 10 November 2023).
- Baeza-Yates, R.A.; Ribeiro-Neto, B.A. Modern Information Retrieval; ACM Press: New York, NY, USA; Addison-Wesley: Boston, MA, USA, 1999. [Google Scholar]
- Hearst, M.A.; Dumais, S.T.; Osuna, E.; Platt, J.; Scholkopf, B. Support Vector Machines. IEEE Intell. Syst. Their Appl. 1998, 13, 18–28. [Google Scholar] [CrossRef]
- Steinwart, I.; Christmann, A. Support Vector Machines; Springer Science & Business Media: Berlin/Heidelberg, Germany, 2008. [Google Scholar]
- Song, Y.Y.; Lu, Y. Decision Tree Methods: Applications for Classification and Prediction. Shanghai Arch. Psychiatry 2015, 27, 130. [Google Scholar]
- Peterson, L.E. K-Nearest Neighbor. Scholarpedia 2009, 4, 1883. [Google Scholar] [CrossRef]
- Hosmer, D.W.; Lemeshow, S. Applied Logistic Regression, 2nd ed.; Wiley: Hoboken, NJ, USA, 2000. [Google Scholar]
- Menard, S. Applied Logistic Regression Analysis; Number 106; Sage: Thousand Oaks, CA, USA, 2002. [Google Scholar]
- Schapire, R.E. Explaining AdaBoost. In Empirical Inference: Festschrift in Honor of Vladimir N. Vapnik; Springer: Berlin/Heidelberg, Germany, 2013; pp. 37–52. [Google Scholar]
- Rish, I. An Empirical Study of the Naive Bayes Classifier. In Proceedings of the IJCAI Workshop on Empirical Methods in Artificial Intelligence, Seattle, WA, USA, 4–6 August 2001; Volume 3, pp. 41–46. [Google Scholar]


| Chest Pain Distribution | Percentage |
|---|---|
| Asymptomatic with Heart Disease | 45.6% |
| Asymptomatic without Heart Disease | 17.1% |
| Angina with Heart Disease | 3.07% |
| Non-Angina without Heart Disease | 30.3% |
| Atypical Angina with Heart Disease | 3.05% |
| Blood Sugar Distribution | Percentage |
|---|---|
| High Blood Sugar with Heart Disease | 48.89% |
| High Blood Sugar without Heart Disease | 51.11% |
| Low Blood Sugar with Heart Disease | 44.96% |
| Low Blood Sugar without Heart Disease | 55.04% |
| Blood Sugar Distribution | Percentage |
|---|---|
| Feeling Angina during stress Test with Heart Disease | 76.77% |
| Feeling Angina during stress Test without Heart Disease | 23.23% |
| Not Feeling Angina during stress Test with Heart Disease | 30.39% |
| Not Feeling Angina during stress Test without Heart Disease | 69.61% |
| Name of Features before Feature Selection | Name of Features after Feature Selection |
|---|---|
| Independent Features: age, sex, cp, tresbps, chol, fbs, restecg, thalach, exang, oldpeak, slope, ca, thal | Independent Features: age, cp, thalach, exang, oldpeak, slope, ca, thal |
| Dependent Feature: Target | Dependent Feature: Target |
| Classifiers | Accuracy | Sensitivity | Specificity | Precision | F1 Score |
|---|---|---|---|---|---|
| 1st Ensemble | 84.21% | 86.2% | 83.0% | 75.5% | 80.6% |
| 2nd Ensemble | 85.87% | 84.36% | 86.39% | 81.85% | 83.09% |
| Concatenated Ensemble | 86.89% | 87.1% | 86.7% | 81.8% | 84.3% |
| Existing Works | Methodology | Highest Accuracy | Highest F1 Score |
|---|---|---|---|
| [9] | Logistic Regression, Naive Bayes, Random Forest, Decision Tree | Average Accuracy: 85% | N/A |
| [10] | Naive Bayes, Decision Tree, KNN, Random Forest | Average Accuracy: 84% | N/A |
| [13] | Logistic Regression | 84.53% | N/A |
| [15] | Semi-Supervised Self-Training | 81.89% | 87.14% |
| [20] | SVM, Gaussian Naive Bayes, Logistic Regression, LightGBM, XGBoost, Random Forest | Average Accuracy: 80% | N/A |
| [21] | Support Vector Machine, Decision Tree, Random Forest, Naive Bayes, Logistic Regression | N/A | N/A |
| [27] | Bagging Mechanism with KNN, Naive Bayes, Logistic Regression | Average Accuracy: 82% | N/A |
| [28] | Random Forest, Decision Tree, Logistic Regression, SVM, KNN | Average Accuracy: 75% | Highest AUC-ROC: 0.8675 |
| Proposed Model | Concatenated Hybrid Ensemble Classifier | 86.89% | 84.3% |
Disclaimer/Publisher’s Note: The statements, opinions and data contained in all publications are solely those of the individual author(s) and contributor(s) and not of MDPI and/or the editor(s). MDPI and/or the editor(s) disclaim responsibility for any injury to people or property resulting from any ideas, methods, instructions or products referred to in the content. |
© 2023 by the authors. Licensee MDPI, Basel, Switzerland. This article is an open access article distributed under the terms and conditions of the Creative Commons Attribution (CC BY) license (https://creativecommons.org/licenses/by/4.0/).
Share and Cite
Majumder, A.B.; Gupta, S.; Singh, D.; Acharya, B.; Gerogiannis, V.C.; Kanavos, A.; Pintelas, P. Heart Disease Prediction Using Concatenated Hybrid Ensemble Classifiers. Algorithms 2023, 16, 538. https://doi.org/10.3390/a16120538
Majumder AB, Gupta S, Singh D, Acharya B, Gerogiannis VC, Kanavos A, Pintelas P. Heart Disease Prediction Using Concatenated Hybrid Ensemble Classifiers. Algorithms. 2023; 16(12):538. https://doi.org/10.3390/a16120538
Chicago/Turabian StyleMajumder, Annwesha Banerjee, Somsubhra Gupta, Dharmpal Singh, Biswaranjan Acharya, Vassilis C. Gerogiannis, Andreas Kanavos, and Panagiotis Pintelas. 2023. "Heart Disease Prediction Using Concatenated Hybrid Ensemble Classifiers" Algorithms 16, no. 12: 538. https://doi.org/10.3390/a16120538
APA StyleMajumder, A. B., Gupta, S., Singh, D., Acharya, B., Gerogiannis, V. C., Kanavos, A., & Pintelas, P. (2023). Heart Disease Prediction Using Concatenated Hybrid Ensemble Classifiers. Algorithms, 16(12), 538. https://doi.org/10.3390/a16120538