2. Related Work
Mammography is one of the diagnostic imaging modalities for breast cancer. It is an effective screening tool for breast cancer diagnosis and is the only method proven to reduce breast cancer mortality [
4]. According to a recent report [
5], it is one of the most effective ways to detect breast cancer in its early stages. Mammography detects approximately 80% to 90% of breast cancer cases in asymptomatic women and has been reported to reduce breast cancer mortality by 38–48% among those screened [
6,
7]. This also has been reported [
8,
9,
10] in recent years to reduce mortality by 30% or mortality by 20%. Mammography is mainly used for qualitative diagnosis and to observe masses, focal asymmetric shadows, calcifications, and structural abnormalities. Calcification is a common finding in mammography. It is caused by the deposition of calcium oxalate and calcium phosphate in the breast tissue and appears as bright spots on mammography [
11,
12]. The distribution of calcification is useful for differentiating benign from malignant disease. Diffuse or scattered calcifications are generally benign, while zonal or linear calcifications are suspected to be malignant [
13]. Because clustered microcalcifications are found in 30–50% of cases of cancer diagnosed by mammography, the detection, evaluation, and classification of calcifications are important [
6,
7]. However, microcalcifications can be difficult to accurately detect and diagnose due to their size, shape, and heterogeneity in the surrounding tissue [
6].
Computer-aided diagnosis (CAD) systems have been used in mammography to assist in the reading of mammograms and were developed to detect abnormal breast tissue and reduce the number of false-negative results for breast cancer detected by radiologists [
14]. The sensitivity and specificity of CAD for all breast lesions have been reported to be 54% and 16%, respectively. CAD can easily misclassify parenchyma, connective tissue, and blood vessels as breast lesions, vascular calcifications, and axillae as microcalcifications. Because of its low specificity and high false-positive rate, CAD should not be used alone in mammography for breast examinations [
15].
Deep learning technologies, specifically convolutional neural networks (CNNs), have recently been used in a variety of fields, including medical imaging [
16,
17]. Deep learning techniques have a wide range of applications, including classification [
18,
19], object detection [
20,
21], semantic segmentation [
21,
22,
23], and regression [
24,
25,
26]. Deep learning techniques have also been applied to breast diagnostics. For MRI, studies have used U-Net for breast mass segmentation [
27] and ResNet18 pretrained on ImageNet for classification of benign and malignant breast tumors [
28]. These studies are limited due to the small number of available breast MRI data and often rely on transfer learning. Similarly, deep learning methods for breast ultrasound also typically use transfer learning and pretraining with ImageNet due to the small number of available breast ultrasound image training sets [
18]. Deep learning models in mammography have been used not only for the detection of potential malignancies but also for tasks like risk stratification, lesion classification, and prognostic evaluation based on mammographic patterns [
29,
30]. Researchers have also explored the potential of employing transfer learning to overcome challenges associated with the limited availability of supervised image training mammography data [
31].
5. Discussion
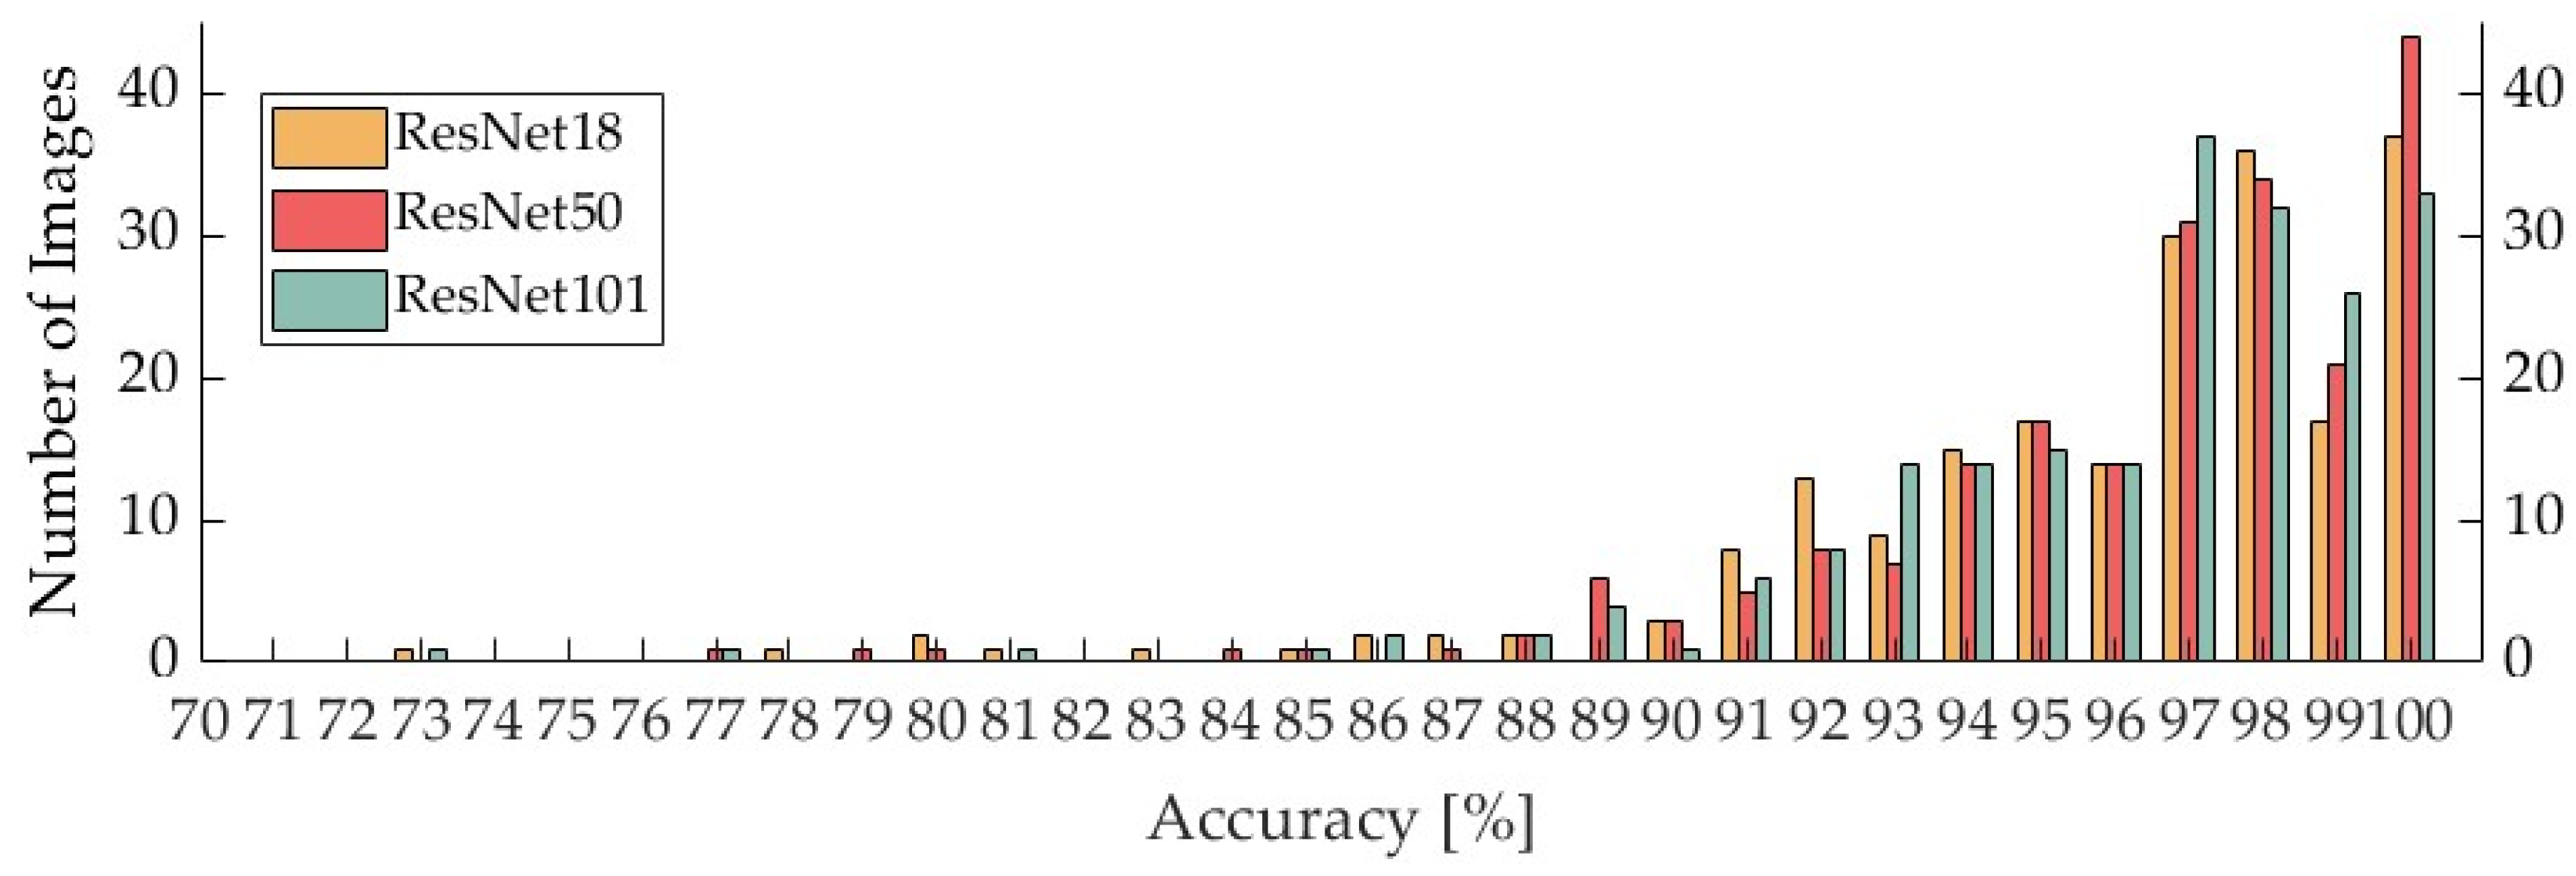
The results in
Section 4.1 demonstrate that the overall accuracy of the classifiers was 96.0% for the ResNet18 classifier, 96.4% for the ResNet50 classifier, and 96.3% for the ResNet101 classifier. The accuracy of the ResNet50 classifier was 96.4%, and that of the ResNet101 classifier was 96.3%. Alternatively, in a previous study of two-class classification of the presence or absence of calcification, the authors reported that the most accurate classifier was 96% [
33]. The findings obtained in the current study are comparable with those of the previous research. However, the ResNet18, ResNet50, and ResNet101 classifiers had sensitivities of 73.4%, 76.2%, and 75.6%, respectively, whereas the highest sensitivity in the previous study [
33] was 98%. Compared with the results of the prior report, the sensitivity obtained in our study was relatively lower. One of the reasons for this is that in previous studies, patches were extracted from mammographic images in such a way that there was slight overlap in the top, bottom, left, and right sides of the image, which was reported to reduce the FN rate (1—sensitivity) [
33,
34]. A recent study [
32] using the ResNet network showed that deep learning tools aid radiologists in mammogram-based breast cancer diagnosis. The study addressed class imbalance issues in training data by testing techniques like class weighting, over-sampling, under-sampling, and synthetic lesion generation. The results indicated a bias toward the majority class due to class imbalance, which was partially mitigated by standard techniques but did not significantly improve AUC-ROC. Synthetic lesion generation emerged as a superior method, particularly for out-of-distribution test sets. The morphology and distribution of the calcifications in the breast vary. Obvious benign calcifications include skin and vascular calcification, fibroadenoma calcification, calcification associated with ductal dilatation, round calcification, central translucent calcification, calcareous calcification, calcareous milk calcification, suture calcification, and heterotopic calcification. The morphology of calcification, which must be distinguished between good and bad, includes microcircular, pale and indistinct, pleomorphic, fine-linear and fine-branched, diffuse, scattered, regional, clustered, linear, and zonal distribution. Because of the variations in the morphology and distribution of calcifications, we assume that the diversity of features was not captured in this study, resulting in a low sensitivity. In addition, FN patches had a smaller area of calcification as compared with TP patches. Most coarse calcifications were correctly classified as calcified. Other calcifications were often judged as calcified when a patch contained many calcifications or slightly larger calcifications, but they were incorrectly classified as no calcified when a patch contained only a few small calcifications, such as one or two small calcifications (i.e., when the area of calcification in the patch was small). In addition, FN patches were often whiter than TP patches, especially when the entire patch was white and each patch contained only a few small calcifications (i.e., one or two). Conversely, FP patches included some patches with white patches. In addition, as with the FN patches, patches that were entirely white were often incorrectly classified as having calcification. These results suggest that calcification is often misjudged because it is difficult to distinguish between calcification and noncalcification when patches are whitish because calcification is depicted with high brightness. Therefore, we believe that the use of thresholding can improve the accuracy of the classifier by reducing the number of FN and FP patches via the extraction of areas of particularly high brightness. With regard to the point that a small area of calcification in a patch is often incorrectly classified as no calcification, in this study, we divided the mammography image into patches of 224 × 224 pixels to create the input image size for ResNet; however, it is possible to divide the mammography image into patches of a smaller matrix size and to use the generated patches as the input image size for ResNet. However, if the patches are divided into a smaller matrix size and the generated patches are enlarged to 224 × 224 pixels by resizing, the area of calcification in the patches will be larger and the accuracy may be improved.
We will next discuss the AUC of the created classifiers. The AUC of the classifiers created by all CNNs was greater than 0.95, a value that is considered to be very accurate and excellent. Regarding the processing time for classifying the presence or absence of calcification for the created classifiers, ResNet18, ResNet50, and ResNet101 took the shortest processing times, in that order. This is consistent with the fact that deeper CNN layers require more processing time to extract more advanced and complex features. The classifier trained on ResNet50, which had the highest accuracy and AUC, took 0.136 s to classify the patches generated from a single mammogram image according to the presence or absence of calcification, which means that seven mammogram images can be processed per second.
Next, we discuss the accuracy of the system for one mammogram at a time. The average accuracy for each mammogram was 95.3%. The interior of the breast is composed mainly of mammary glands and fat and is classified into four categories in accordance with the proportion of these components: fatty, scattered mammary, heterogeneous hyperintense, and extremely hyperintense. The percentage of mammary tissue is larger in the latter category. The two types of tissue, heterogeneous and extremely dense, are referred to as “dense breasts”. Densely concentrated breast has less fat and more mammary tissue, resulting in a whiter image and a lower rate of lesion detection [
35]. This makes it difficult to distinguish between calcification and noncalcification and is thought to reduce the accuracy of classifying the presence or absence of calcification. Because microcalcifications appear as localized areas of high brightness, the use of thresholding is expected to increase the accuracy of the classifier as a whole as well as the accuracy of each mammographic image.
The specificity of microcalcification detection in CAD, which has been conventionally used as a reading aid, is 45%, and the FP rate is reported to be high [
15]. The specificity of the classifiers used in this study was 97.8% for ResNet18, 98.1% for ResNet50, and 98.0% for ResNet101. A low false-positive rate and high NPV indicate its usefulness as a diagnostic aid that may reduce the burden on physicians.
One limitation of this study is that the dataset we used consisted of mammographic images from Europeans, Americans, and other foreign nationals. Japanese individuals generally have more dense breasts and a smaller breast size than Europeans and Americans. Therefore, it is necessary to use a dataset of Japanese mammographic images or to mix the data used in this study with Japanese mammographic images in the future. In addition, the training data used in this study contained more patches without calcification than patches with calcification, and the data were biased toward patches without calcification. Therefore, in the future, it will be necessary to take care to avoid bias in the training data.
In this study, the parameters were not changed in the training process, so changing the batch size or the number of epochs may improve the accuracy. In the previous study [
33], the number of epochs was set to 200, and thus, it will be necessary to study the optimal parameters in the future. We used ResNet for classification in this study; however, further improvement in accuracy can be achieved by changing the network model used. This study aimed to perform a comparison with the intention of serving as an indicator when utilizing the time taken for classification in a clinical setting. While ResNet is a relatively common network model in medical image classification [
18,
19], it is essential to compare different network models. However, because we believed that altering individual layers or comparison between network models with different characteristics might yield varying sensitivity due to the background information inherent in images, we sought to elucidate the extent to which accuracy and processing time differ with varying depths of the same CNN. To achieve this, we conducted training and comparison using three CNNs: ResNet18, ResNet50, and ResNet101. In the context of evaluating the validity of the three CNNs employed in this study, it is essential to discuss them in an objective manner, particularly when compared to the state of the art (SOTA) in image classification. Utilizing the effective optimization algorithm implemented in BASIC-L (Lion, fine-tuned) [
36], an accuracy of 76.45% was observed, which compares favorably to the 76.22% achieved using the original ResNet-50. Furthermore, in the case of using Vision Transformer (ViT-H/14) [
37] for transfer accuracy, the metric was higher at 88.08% compared to ResNet-50’s 77.54%. Additionally, in the assessment of test error rates using Sharpness-Aware Minimization (SAM) [
38], which seeks parameters that lie in neighborhoods with uniformly low loss, the SAM-augmented ResNet-50 yielded a rate of 22.5% against the original ResNet-50’s 22.9%. In a similar comparison using ResNet-101, SAM achieved a rate of 21.2% as opposed to the original ResNet-50’s 20.2%. Moreover, employing multitask learning [
39] showed classification accuracies of 88.22% when based on ResNet-18, which compares favorably with the reported SOTA figure of 87.82%. It is worth noting that ResNet serves as a foundational convolutional neural network (CNN) for classification and is consistently used for comparative evaluation against new algorithms and methods. However, in this study, optimization of the learning algorithm was not undertaken, highlighting an area for future research. Nonetheless, it is crucial to consider that the application of SOTA algorithms could potentially alter inference times. Therefore, future studies should integrate considerations for optimizing CNNs, taking into account references to existing SOTA systems.
There is another limitation to this study. There are several limitations in approaching the task of detecting calcification while maintaining the resolution of mammography images. In the application of deep layer training models, it can be difficult to directly evaluate the individual contributions of the different intermediate layers in capturing image features. This recognition requires a comprehensive understanding of how each component affects the overall performance of the model. Considering the limited use of annotated mammography datasets, there are limitations in generalizing our findings in this study, and the performance of the models we present may show variability when testing them on a broader and more diverse dataset. They should therefore be applied and evaluated on a broader set of external datasets. In addition, regarding the optimization of parameters during training, ResNet, a structurally similar network model differing only in its number of layers, was used for comparison. However, for the optimization of parameters in image training, it is necessary to evaluate true training accuracy; this is a limitation of the research in this study and will be an issue to consider in addition to its implementation in other network models in the future.
For future consideration, with the aim of increasing the sensitivity of calcification classification, there are several ways to improve the accuracy, such as training with different CNNs and parameters, as described above; using a large number of diverse training data with calcification; creating patches in which the top, bottom, left, and right sides slightly overlap; using threshold processing; and devising patch partitioning. In addition, by using a classifier trained on the shape and distribution of calcification in patches classified as having calcification, it is possible to develop a tool for determining whether calcification is benign or malignant or for determining the category of calcification. In addition, the development of such a tool could contribute to the early detection and diagnosis of breast cancer; thus, it is necessary to evaluate its usefulness in clinical practice.


 ,
, 

