Article

SmartBuild RecSys: A Recommendation System Based on the Smart Readiness Indicator for Energy Efficiency in Buildings

by
Muhammad Talha Siddique
1,
Paraskevas Koukaras
1,
Dimosthenis Ioannidis
2 and
Christos Tjortjis
1,*
1
School of Science and Technology, International Hellenic University, 57001 Thessaloniki, Greece
2
Information Technologies Institute, Centre for Research & Technology, 57001 Thessaloniki, Greece
*
Author to whom correspondence should be addressed.
Algorithms 2023, 16(10), 482; https://doi.org/10.3390/a16100482
Submission received: 6 September 2023 / Revised: 5 October 2023 / Accepted: 12 October 2023 / Published: 17 October 2023
(This article belongs to the Special Issue Self-Learning and Self-Adapting Algorithms in Machine Learning)

Abstract

:
The Smart Readiness Indicator (SRI) is a newly developed framework that measures a building’s technological readiness to improve its energy efficiency. The integration of data obtained from this framework with data derived from Building Information Modeling (BIM) has the potential to yield compelling results. This research proposes an algorithm for a Recommendation System (RS) that uses SRI and BIM data to advise on building energy-efficiency improvements. Following a modular programming approach, the proposed system is split into two algorithmic approaches linked with two distinct use cases. In the first use case, BIM data are utilized to provide thermal envelope enhancement recommendations. A hybrid Machine Learning (ML) (Random Forest–Decision Tree) algorithm is trained using an Industry Foundation Class (IFC) BIM model of CERTH’S nZEB Smart Home in Greece and Passive House database data. In the second use case, SRI data are utilized to develop an RS for Heating, Ventilation, and Air Conditioning (HVAC) system improvement, in which a process utilizes a filtering function and KNN algorithm to suggest automation levels for building service improvements. Considering the results from both use cases, this paper provides a solid framework that exploits more possibilities for coupling SRI with BIM data. It presents a novel algorithm that exploits these data to facilitate the development of an RS system for increasing building energy efficiency.

1. Introduction

Buildings play an important role in energy consumption in cities, including cities in the European Union (EU). Buildings are responsible for approximately 40% of EU energy consumption and 36% of the energy-related greenhouse gas emissions [1]. Heating, cooling, and domestic hot water account for 80% of the energy that citizens consume [1]. At present, about 35% of the EU’s buildings are over 50 years old, and almost 75% of the building stock is energy inefficient. In the US, buildings account for about 40% of all energy consumption and a similar proportion of greenhouse gas emissions [2]. Based on the 2018 Commercial Buildings Energy Consumption Survey (CBECS), the estimated 5.9 million U.S. commercial buildings consumed 6.8 quadrillion British thermal units of energy and spent 141 billion dollars on energy in 2018. These statistics underscore the significant impact that buildings have on energy usage and emphasize the urgent need for energy-saving measures.
The Energy Performance of Buildings Directive (EPBD) has been instrumental in drawing attention to the immense potential for energy savings through improvements in building design, construction, and operation. It catalyzes discussions and actions aimed at enhancing energy efficiency. Furthermore, recent geopolitical events have shed more light on the EU’s dependence on Russia for energy resources. This geopolitical situation has prompted increased discussions about energy security and the need for greater self-reliance in the EU. It has also fueled conversations about energy efficiency as a means to reduce dependence on external energy sources and ensure a more sustainable and resilient energy future. The recognition of energy efficiency as a critical aspect of sustainable building design, renovation [3] and operation has gained traction and is driving the demand for effective tools and strategies to optimize energy consumption [4], occupant comfort [5] and minimize the carbon footprint of buildings.
In response to the need to enhance energy efficiency in buildings, there has been a notable shift from conventional buildings to smart buildings [6]. To improve the smartness of buildings, it is necessary to incorporate digital components into the pre-existing technological infrastructure within these structures. These additions have a direct impact on the diverse range of services, such as heating, cooling, ventilation, and others, that collaborate to achieve optimal human comfort. In the context of improving building intelligence, the 2018 edition of the EPBD [7] introduced a novel framework called the Smart Readiness Indicator (SRI). This framework was designed to address the requirement of evaluating the degree of intelligence in contemporary buildings and to encourage the adoption of digitalization in the built environment.
For improving the energy efficiency of traditional buildings, research has been conducted on both active and passive methods. The idea of using Recommendation Systems (RSs) originated from companies like Amazon, Netflix, etc. with many other applications including products, movies, and content promotion [8]. It soon found its way into the buildings sector as researchers attempted to work on user behavior. RSs have emerged as valuable tools for improving energy efficiency in buildings. These systems leverage advanced technologies and data analysis algorithms to provide personalized suggestions and guidance to building managers and designers. By analyzing data from multiple sources, such as SRIs and Building Information Modeling (BIM), RSs can offer tailored recommendations that align with specific building characteristics and energy-efficiency goals.
The current shift from conventional buildings to smart buildings presents a notable research gap that necessitates attention. Specifically, there is a need to develop a robust RS that is tailored to the unique requirements of modern smart buildings. The primary focus of this paper is to develop a novel algorithmic approach for an RS that harnesses the potential of SRI and BIM data to suggest energy-efficiency improvements. By capitalizing on the newly introduced SRI framework and integrating it with BIM data, the developed RS algorithm aims to assist building managers and designers in optimizing energy performance through relevant suggestions. To ensure a streamlined development process and the effective utilization of data from SRI and BIM, the paper is structured around two distinct algorithms (one per use case), each leveraging a specific data source.
  • The first use case concentrates on the thermal envelope of the building and relies on BIM data. This includes essential information, such as the U-value of walls, roofs, and windows, as well as recommendations for insulation materials. By leveraging these data, the RS can provide valuable insights and recommendations for improving the thermal performance of buildings. These recommendations can guide designers and building managers in making informed decisions and implementing energy-efficient design strategies.
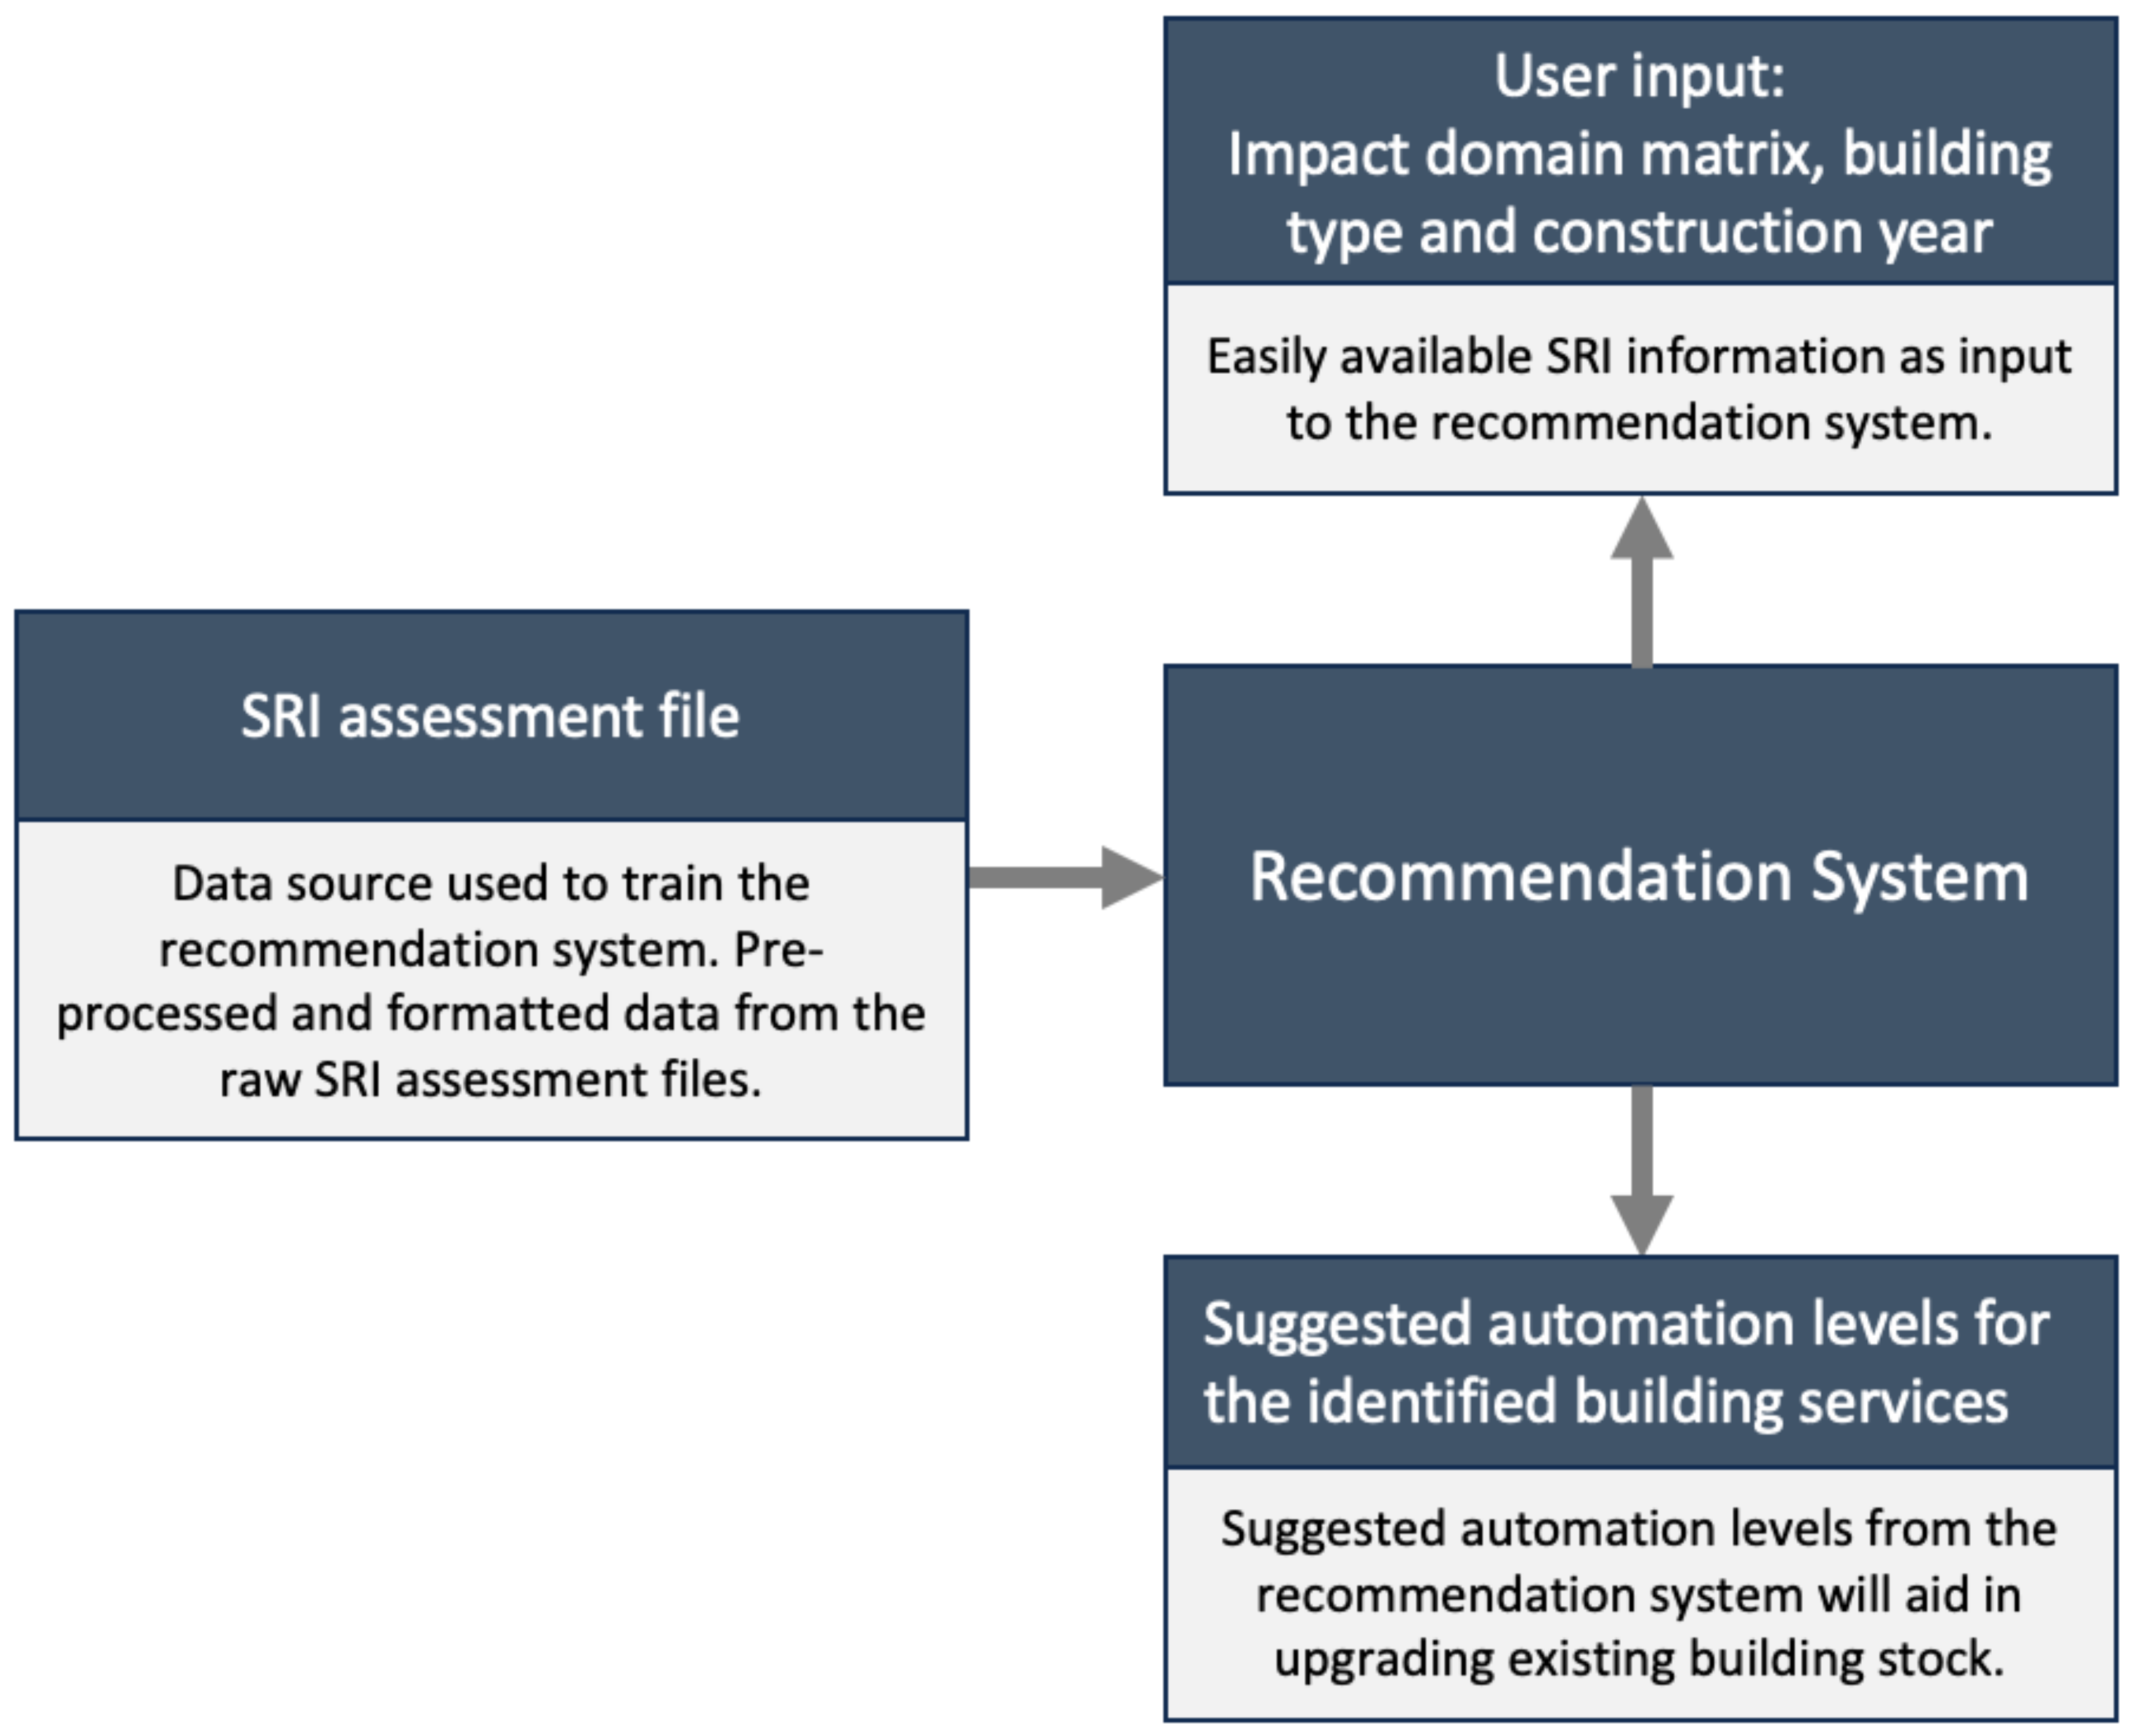
  • The second use case centers around the SRI data source, which provides information about a building’s readiness for smart services, including building automation systems, lighting control, heating, cooling, ventilation, and more. By analyzing these data, the RS can generate tailored recommendations for enhancing energy efficiency through the integration and implementation of smart technologies. It is important to note that while the recommendations do not guarantee an immediate increase in efficiency, they represent significant opportunities for improvement by adopting the suggested smart-ready services.
The archival value addition of the ‘use case’ approach used in this study lies in the combination of information that comes from two different sources. Furthermore, the study introduces a new approach to using BIM and SRI data, which is the main novelty of this work. However, it does not delve into the computational aspects of the proposed RS and instead focuses on the algorithmic aspects.
The rest of the paper is organized as follows. Section 2 presents a literature review on three main terms related to this study: namely, RS, SRI, and BIM. Section 3 details the methodology used to develop the algorithms for both use cases. Results are discussed in Section 4 of the paper with comparisons of alternative Machine Learning (ML) algorithms and their results. Section 5 discusses the results, implications of this work, challenges, and directions for future work. Finally, Section 6 summarizes the important aspects of this research while also providing the main takeaway message.

2. Background

To clearly demonstrate the relevant studies associated with the topic of this paper, the following subsections are presented to explore the key publications related to RSs, SRI, and BIM.

2.1. Recommendation Systems

As mentioned previously, the need for RSs was initially realized when platforms like Amazon and Netflix wanted to predict the interests of their users based on their historical data to make their platforms more attractive to their users as well as become more profitable. The development of these systems started in 2009. As discussed by [9] in a detailed article on the research trends on RSs, 2009–2012 was the stable period that saw the initial development of RSs. After the stable period, the rapid growth period started, which saw an increase in publications related to RSs. Next came the outbreak period (2016–2017), which was accompanied by the period where Artificial Intelligence (AI) came back into the spotlight. The increase in the popularity of AI can be considered a reason behind the outbreak period of RSs. From 2019 onward, studies related to RSs started to focus on energy efficiency in buildings.
Meanwhile, in the domain of energy efficiency, most studies focused on the technological aspect of energy saving through monitoring [10]. The shift toward focusing on user behavior became important when occupant participation and behavioral change was identified as an important factor [11] for improving energy efficiency in buildings. Context-aware RSs became a great option in this regard because they could take into consideration human behavior, AI, and human decision-making processes [12]. This resulted in the use of RSs and AU in the domain of energy efficiency and buildings.
As more and more work was conducted in the domain of RSs, various algorithms were used and found to produce results for varying scenarios. An extensive literature survey [13] presented a taxonomy of RSs that have been developed so far with classifications in terms of purpose, algorithms, and computing platforms. In terms of purpose, there are two main categories of RSs. One is strategy-based and the other is action-based. Strategy-based RSs provide an all-encompassing or general strategy toward a given challenge. The authors in [14] developed an RS for energy management in buildings which suggested reductions in energy based on previous cases for similar buildings. The suggested reduction in energy consumption could be used in developing a strategy for energy management in buildings. Action-based RSs are associated with the daily needs and life of the end user. Their objective was to give daily recommendations to end users based on past data as well as energy-efficiency principles. Finally, the authors in [15] developed an RS that gave suggestions for energy savings to its end user.
Moving toward algorithms, there are various algorithms found in the literature that are used to build an RS. Case-based RSs are one of the most common RSs. In common product-based applications of RSs, case-based RSs find similarities between distinct product features like color, price, and make. In the context of energy-efficiency RSs, these product features are replaced by the user behavior linked with the actions at certain time stamps that allow for energy saving. So, using past data [14], the algorithm suggests energy-saving measures. To identify similar behaviors at specific time stamps, the K-Nearest Neighbor (KNN) approach can be used. Similarly, pattern-mining algorithms [16] can also be used for creating appliance usage profiles that form a correlation with time stamps. This way, when a behavior that is different from one of the profiles is detected, a notification is provided to the user.
The second most popular is collaborative filtering. Collaborative filtering is different from content-based filtering in a way that it takes into account a group of users and does not specifically focus on the content. In the context of a movie RS, it works by focusing on similar movies watched by different people in a group and then recommends a movie to some people in the group who have already been observed by other people in the same group. Concerning energy efficiency, collaborative filtering can help in predicting the energy usage plans [17] and suitable consumption plans with adequate tariffs by first analyzing the consumption data of a household. Taking more things into account, context-based RSs are generally used for a longer period to give recommendations that are in line with the particular contextual circumstances of the end user. This concept can be used in storing historic energy consumption patterns with their underlying context in the knowledge base and then using it with rule-based (content-based) recommendations to achieve better results [18].
Moving onto a slightly different type of RSs, Rasch-based RSs help determine the probability that a user will act out the recommendation provided to them while taking into account the difficulty of the recommendation. In a practical scenario, these kinds of RSs can help in reducing the difficulty of tasks given to the occupants while promoting energy efficiency [19]. Different from content-based and collaborative filtering, probabilistic relational models use a relational database instead of a user-item preference. They deploy a Markov chain model to record the historical energy footprints in the workspace [20].
RSs that benefit from different kinds of data are termed fusion-based RSs. These use data such as energy consumption footprints, ambient conditions like temperature, and humidity [21]. Deep Learning (DL)-based RSs are becoming increasingly popular because of the overall popularity of DL. DL-based RSs help with solving the cold start problem, which is prevalent in collaboration filter-based RSs because of the lack of data at the beginning [22].

2.2. Smart Readiness Indicator

Smartness concerning a building can be referred to as a building’s ability to sense, interpret, communicate, and actively respond efficiently to ever-changing environments concerning three main aspects: technical operation of the building, external factors like grids and the building occupants [23].
Smart buildings are a result of digitalization efforts made toward how energy is generated, transmitted, and utilized with regard to buildings [24]. Smart buildings are part of the larger scheme which includes the synergies among the energy, Information, and Communication Technology (ICT) industries. This synergy has allowed for the development of smart grids being connected with smart buildings as well as with renewable energy generation sources. It has also allowed buildings to become better equipped with fluctuating demand while also becoming prosumers in cases of low demand. In this new paradigm, smart buildings need to perform at an optimum level to meet the demand and still be energy efficient. For this purpose, many indicators and metrics have been developed to judge a building’s performance from different aspects.
Many sustainability rating systems have been developed to judge a building’s performance. From a holistic point of view, there are three major categories of this type of rating system. Cumulative Energy Demand (CED) systems only focus on energy consumption criteria. A good example of CED is the Energy Performance Certificate (EPC), which is internationally standardized and was introduced under the European standard of EN 15217 [25].
The purpose of EPC is to standardize regulations and encourage people to improve the energy performance of buildings. In the EU, Finland uses EPC as a legally mandatory rating scheme for buildings. In EPC, the value for E is calculated by evaluating factors like outer walls, doors, windows, roofs, floors, heating systems, domestic water systems, ventilation systems, lighting, cooling systems, additional electrical heating systems, and other systems affecting building energy usage [26].
The second type of sustainability rating system is Life Cycle Analysis (LCA), which has a focus on environmental factors like emissions only [27]. Total Quality Assessment (TQA) is a multi-criteria system that focuses not only on the economic but also the environmental and social factors [28]. A good example of TQA is Green Public Procurement (GPP), which was introduced as a result of guidelines for TQA by the European Commission. GPP is not necessarily a rating system; rather, it gives sustainable and environment-friendly suggestions related to material procurement for buildings [29]. The GPP system is based on two versions: one is the core, which offers a much easier implementation of the methodology. And the comprehensive one offers an extensive implementation of the methodology. Another scheme under TQA is the Building Research Establishment Environmental Assessment Method (BREEAM), which was established in the UK. It is a certification scheme. BREEAM is based on extensive life-cycle sustainability performance criteria for buildings including land use, material use, and pollution [30]. The main objective of BREEAM is to reduce life-cycle impact, recognize environmental benefits, and encourage the demand and value of energy-efficient buildings.
Another example of a sustainable rating system is LCA, and the International Common Carbon Metric by the United Nations Environment Program’s Sustainable Buildings and Climate Initiative (UNEP-SBCI) is the most popular. It aims to assess emissions related to buildings. Moving forward from sustainability rating systems, there are various rating systems for buildings that do not just focus on one parameter and fall into multiple categories. The Smart Readiness Indicator (SRI) is one such rating system. The SRI primarily focuses on the technical aspects of a smart building. An SRI can be defined as a parameter that simply provides information on the readiness of any given building concerning the three aspects mentioned in the above definition of smartness: namely, the technical operation of the building, the external environment (communication with the grid), and the residents of the building. It was introduced in 2018 via the European Parliament where the main objective for SRI was set as “an indicator which should be able to measure a building’s capacity to use information and communication technologies electronic systems to adjust to occupant needs and the grid to improve energy efficiency and performance”. In the two years of its existence, there have been various studies implementing the SRI framework [1], and some common issues relating to the subjective nature of the framework have been pointed out.
The SRI was developed to create a framework that assesses a building’s technological readiness to interact with the occupants, energy grids, and its ability to be energy efficient in its operations through the use of ICT technologies. For this purpose, SRI focuses on three key areas: namely, occupant needs, interaction with the grid, and energy-efficient operation. To initiate the development of the SRI framework, a total of two technical studies were organized. The first technical study [23] came up with the actual definition and draft methodology for the framework. The SRI framework largely depends on an inventory of smart-ready services that could be present in a building and an inspection of functionalities these services can offer. There is a degree of ‘smartness’ to which these functionalities operate. This means from manual control to an automated system with a feedback loop.
Some important terminologies related to the SRI framework are domains, impacts, and functionalities. As previously stated, functionalities are the degrees of smartness. The services in any given building operate in certain domains and have an impact on certain areas. To include all the domains and the impact areas, a multi-criteria framework was developed in the first technical study. The total domains and impact areas are presented in Table 1.
The associated functionality levels vary for each domain. In some domains, there are a maximum of four functionality levels starting from zero. In some other domains, there are only three levels of functionality. The SRI assessment is flexible in a way in that its assessment can either be completed by an individual with a checklist (a brief assessment) or it can be completed by an expert (a detailed assessment).
For SRI assessment, the first step is to determine the building type and climate zone. After selecting the appropriate smart service catalogue, domains present in the building are identified, and their respective functionality levels are assessed. All the activities up to this point are manual and require user interaction. In the next step, actual domain scores are allotted as per services available in the building. These scores are expressed as a percentage of the actual rating and the highest possible rating. A sum of all the domains and impact areas is then taken. As per weightage, the average of the impact areas is taken to calculate the scores for three main impact areas (occupant needs, interaction with the grid, and energy-efficient operation). Lastly, a final average is taken to calculate the SRI score. The detailed step-by-step SRI assessment is presented in [31]. Multiple studies have been conducted ever since the introduction of the SRI framework in 2018.
The framework is still in the process of improvement, as the available literature suggests that it might be too subjective [32]. Additionally, it encourages the utilization of digital technologies and electronic systems in buildings, potentially leading to future fire hazards that necessitate attention and resolution [33]. However, for this paper, the focus will be on the type of data that can be taken from an SRI assessment file to develop the RS.

2.3. Building Information Modeling

BIM is a digital representation of the physical and functional characteristics of a building. It involves the creation and management of a virtual model that encompasses all aspects of a construction project, including design, construction, and operation. BIM has gained significant attention in the construction industry due to its potential to improve collaboration, efficiency, and decision-making throughout the project life cycle.
A systematic literature review on studies from 2004 to July 2019 was conducted to allow for a thorough synthesis of the existing BIM literature, innovation management, and information technology domains to identify BIM adoption and implementation enablers [34]. The review found that BIM adoption is influenced by various factors such as organizational culture, management support, and training. Another literature review was conducted to define the scope and terms of the field of renovation. It demonstrates the areas of interest for a BIM approach and highlights some gaps that should be filled with future works [35].
These comprehensive literature reviews have shown how the implementation of BIM has evolved over the years. The implementation of BIM with regard to the development of the RS is that it provides the thermal envelope data which will be useful for the first use case.
Overall, there are numerous ML algorithms available in the literature for the development of an RS. The primary focus of this research article is the creation of an algorithm for an RS utilizing the SRI and BIM data. The unique aspect of this study lies in the data processing and formatting procedures required for both sources, as to the best of authors’ knowledge, there is currently no available literature on this particular matter. Once the data are pre-processed and are in the right format, multiple ML algorithms can be applied/tested with some modifications for the development of the RS.

3. Methodology for Recommendation Systems

The methodology section of this paper is divided into two sections representing the conceived algorithms for the first and second use cases. The first use case uses BIM as a source of data to develop an RS for thermal envelope, while the second use case uses SRI data to develop an RS for HVAC systems.

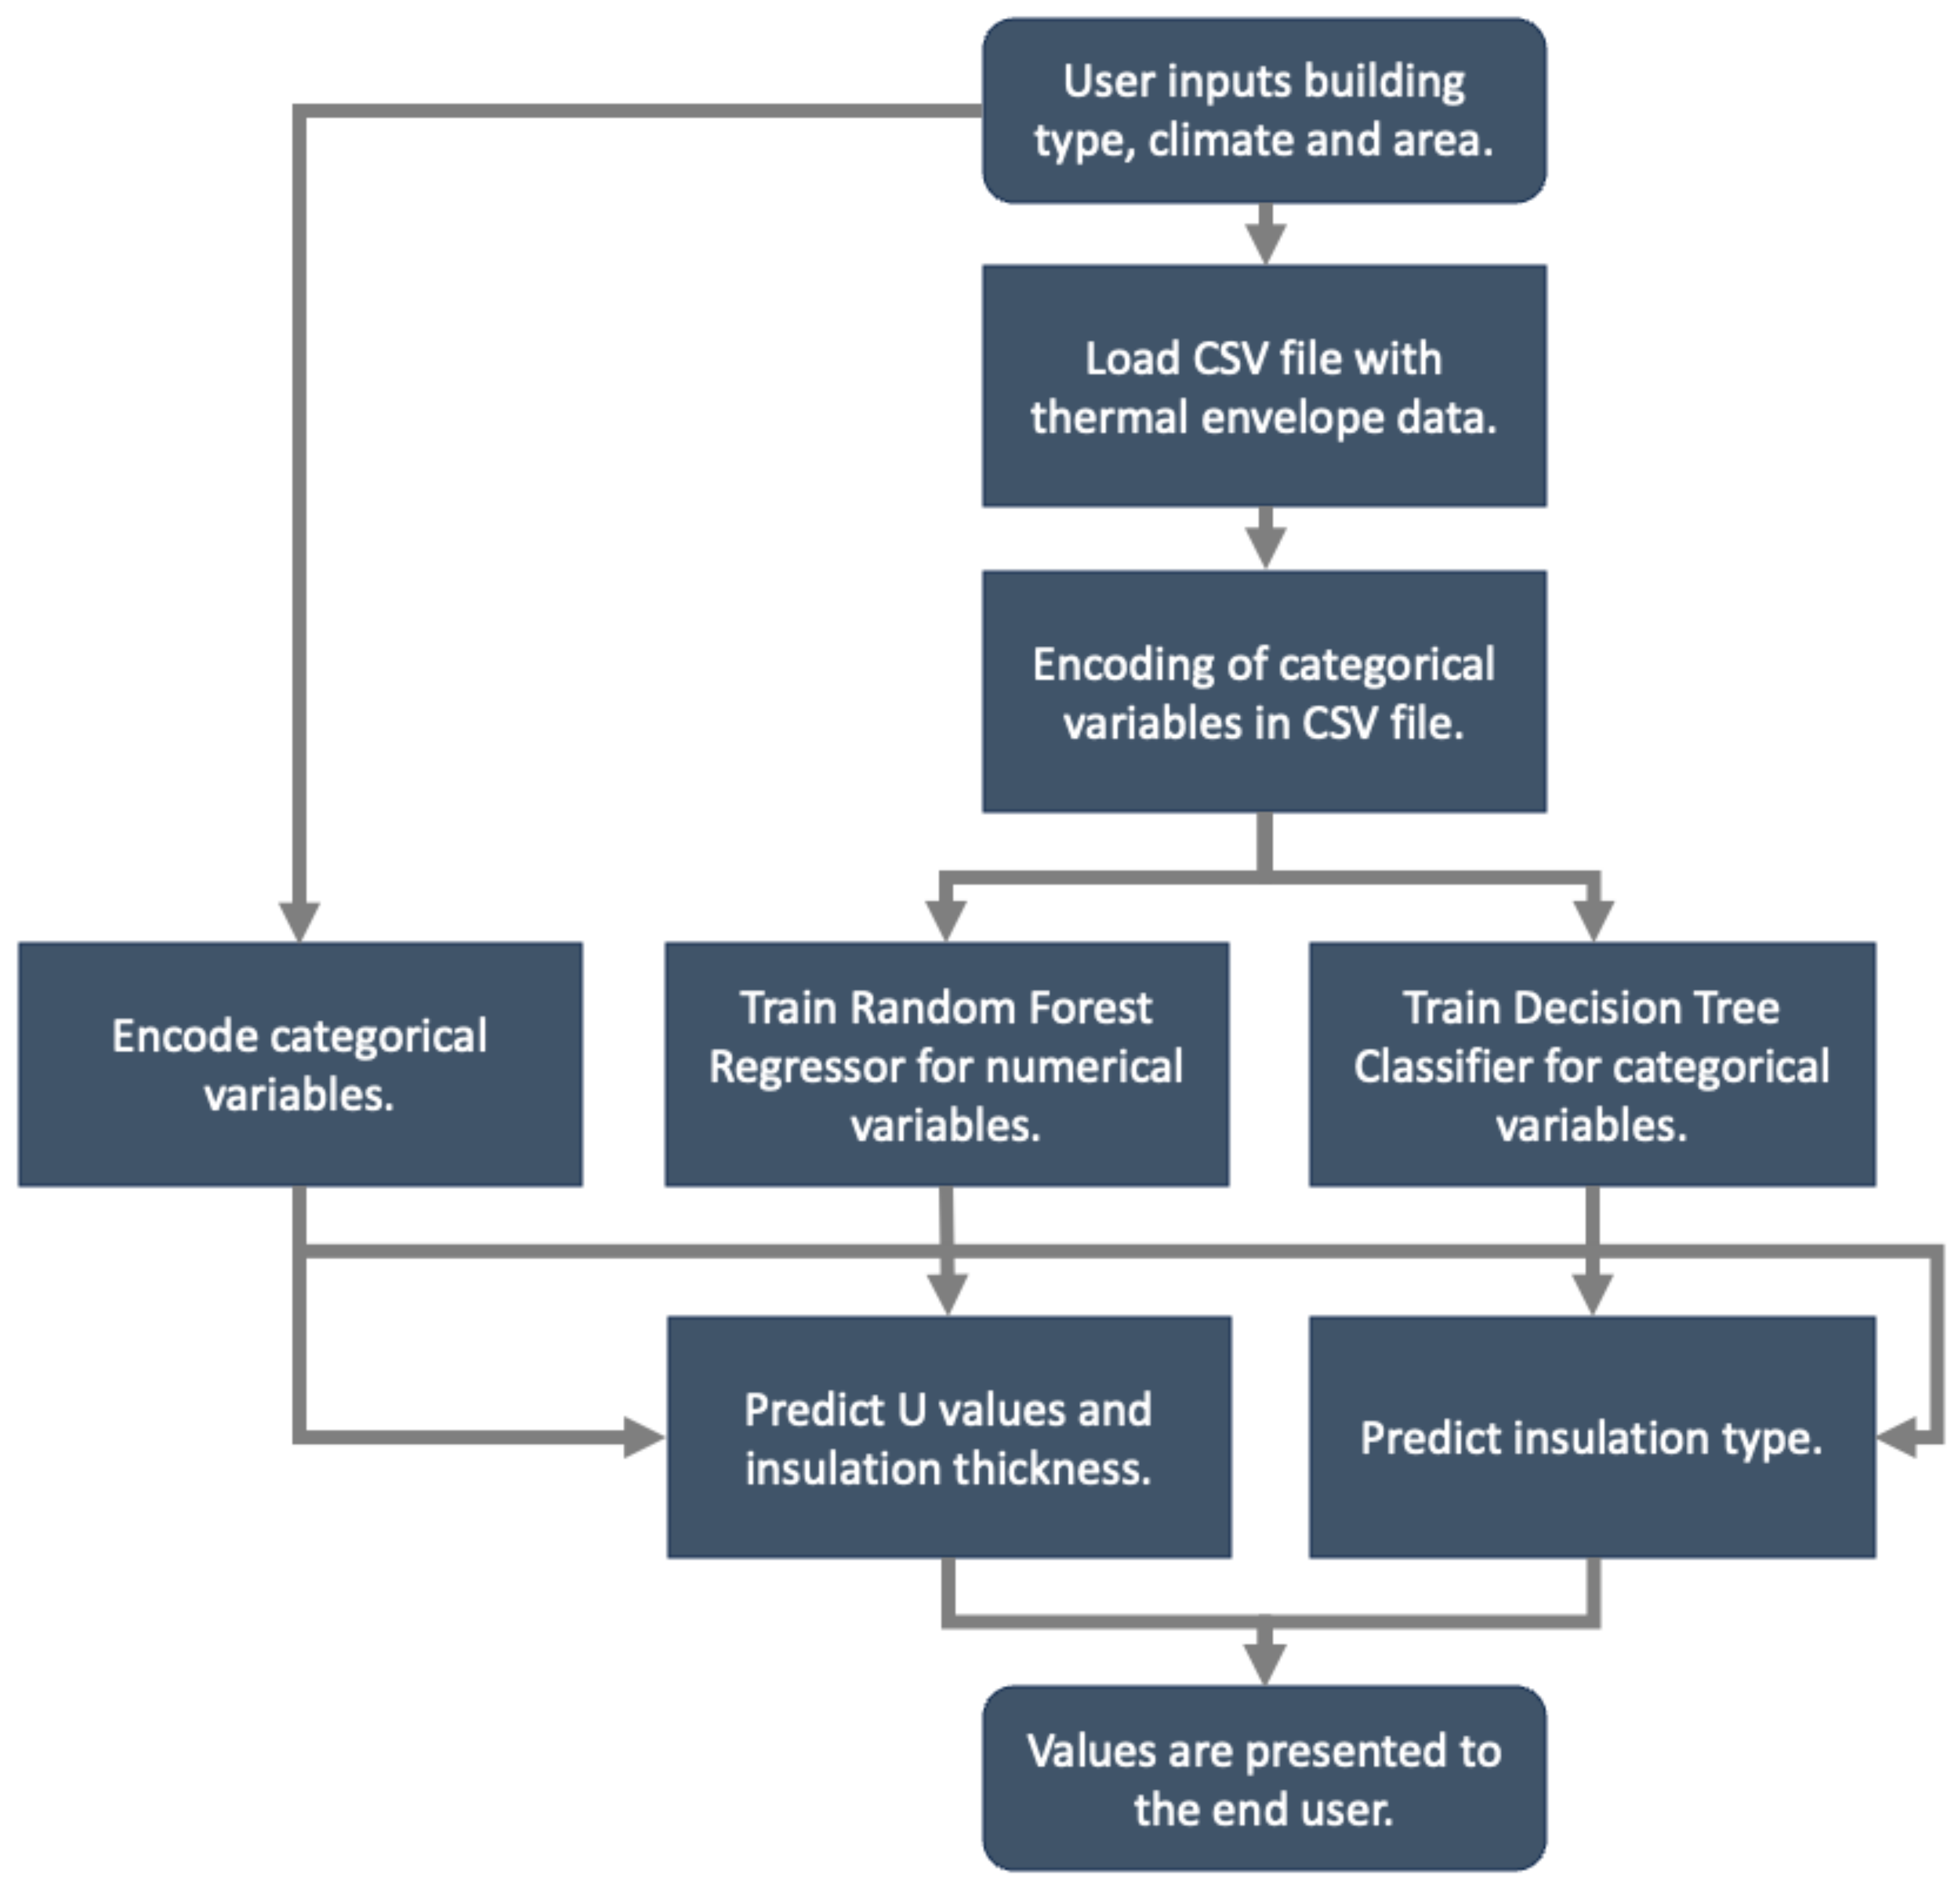
3.1. Thermal Envelope

The RS for the thermal envelope (first use case) uses data from BIM. To develop the basic framework upon which the RS works, it needs to be determined what kind of data can be taken from BIM, which will aid in giving suggestions related to energy efficiency in buildings.
The main elements of the envelope to be considered for the RS are walls, roofs, and windows. The properties associated with these elements will be the main output/suggestions of the RS. Concerning these suggestions, some input variables need to be decided for the RS. The thermal envelope design of a building largely depends on where it is located, the type of building, and the geometry of the building. Based on this knowledge, the inputs for the RS were decided, including the building area, the climate zone in which the building is located, and the building type.
Therefore, as depicted in Figure 1, the basic working framework is that the RS takes in information related to the building area, the climate zone in which the building is located, and the building type. Based on this, employing a hybrid-model-based approach, it makes predictions related to the characteristics of the thermal envelope of the building (specifically U values of the walls, roof, windows, type of insulation to use for walls/roof, and thickness for this insulation). These suggestions (wall, roof, and window U values) can help in optimizing Key Performance Indicators (KPIs) such as energy consumption for heating and cooling, indoor temperature stability, and environmental sustainability while also giving some important parameters to building designers aiding in the designing process. Knowing optimal U values and using the right insulation material will help prevent overheating by reducing solar heat gain. The designer can derive benefits from these suggestions during the design phase. The data collection, pre-processing, and algorithm selection details are discussed in the following subsections.

3.1.1. Data Collection and Pre-Processing

One of the main sources of data in this paper is the BIM data of the nearly zero Energy Building (nZEB) Smart Home of the Center for Research and Technology Hellas (CERTH) [36] located in Thessaloniki, Greece. However, since ML algorithms will be used to develop the RS, more data need to be collected for training the algorithm. For this purpose, the Passive House database [37] was used to obtain thermal envelope data. The database has an official website and has a search function that lets you search buildings according to their location. Upon expanding on the building information, the variables used for training the dataset in this study can be easily accessed. This database is selected for two reasons. First, it contains all the necessary information related to the characteristics and properties of the thermal envelope of buildings. Secondly, the Passive House database establishes a standard for ensuring high energy efficiency in buildings by improving the thermal envelope, which consequently reduces the energy requirements for heating and cooling. Therefore, it would be beneficial to train the algorithm utilizing data from this source.
The pre-processing consists of two main steps, which are discussed as follows:
  • Extracting thermal envelope characteristics from the IFC BIM file of the smart home. For this purpose, a separate code was utilized using the ‘IFCOPENSHELL’ library in Python to extract the relevant thermal envelope characteristics. For extracting the thermal transmittance values of the walls and roof, ‘IFCWALL’ and ‘IFCSLAB’ were used, respectively. To obtain detailed information about the insulation layers and respective thicknesses, ‘IFCMATERIALLAYERSETUSAGE’ was used.
  • Collecting data from the Passive House database and formatting of data. For this purpose, data were collected from the official database website. Data were collected manually and then manually formatted in a CSV file.

3.1.2. Machine Learning Algorithms

To train the ML model, the number of variables in the input and the output need to be considered as a first step. According to the literature, algorithms like KNN are very popular. This RS, however, uses a hybrid algorithm-based approach. This is used because of the complex nature of the data at hand. For both the input and output variables, there are categorical and numerical variables included. Therefore, for predicting the numerical variables, the scikit-learn [38] implementations of Random Forest (RF), Linear Regression, and KNN were used.
The RF algorithm can be effective in capturing complex interactions between item features and generating recommendations based on those features. It can handle both numerical and categorical features, and it can handle missing data. By considering the item features, it can recommend items that are similar in terms of their content or attributes to the items that a user has shown interest in. Thus, for predicting the categorical variables, the scikit-learn [38] implementations of the Decision Tree (DT) classifier and Logistic Regression were used (to draw a comparison between the two ML algorithms).
DTs are versatile algorithms commonly used for classification and regression tasks. They are capable of handling both categorical and continuous variables as input features. Further justifications for the usage of this hybrid algorithm approach are presented in the results section (Section 4), which will present the use of other ML algorithms for the RS (for 1st use case) as well as with the evaluation metrics. The user flow chart depicting the working of the RS is presented in Figure 2.

3.2. HVAC Systems

The conceived algorithm for the RS developed in the second use case utilizes the SRI data and is meant to give suggestions related to the HVAC systems of a building. One benefit of utilizing SRI data is that as the smart-ready services undergo enhancements, the SRI assessment files will also be informed, consequently impacting the RS suggestions. However, the main question to be answered when developing an RS utilizing SRI data is ‘how to use the SRI data’. This is because an SRI assessment is rich in information about building systems. As mentioned in the literature review portion of the SRI, the assessment is based on a smart service catalogue which contains a list of over 50 smart-ready services with their corresponding functionality levels (level of smartness). It is important to understand that while the final SRI score of a building depicts the level of smart readiness of a building, it does not give much useful information for the development of an RS. The crucial piece of information comes from the smart service catalogue, as it contains the list of all possible services. This can be used to train ML algorithms.
The main concept for the SRI-based algorithm for RS is depicted in Figure 3. The RS takes the impact-domain matrix from the SRI assessment along with some building information like building type and year of construction. The reason for using the impact-domain matrix from the SRI information is that it tells us about the area in the systems of the buildings that needs the most improvement. The lowest percentage in the impact-domain matrix is identified, and then the services contributing to this low percentage are listed.
These services are then fed to an algorithm that looks for buildings with similar construction years and types in the dataset. The services with their corresponding functionality levels belonging to buildings with similar construction years and types are then suggested to the user. The reason for selecting building construction year as an input variable to the ML algorithms is because [39] indicates that there is a relationship between the year of construction and the SRI score. The newer the building is, the higher the score.
The algorithm is designed to consider a possible link between buildings, specifically prioritizing newer structures with similar construction years in its dataset. Consequently, it may suggest smart-ready services implemented in these buildings to the user. The SRI data currently come in an Excel file. Thus, the data require pre-processing before being used for the ML algorithm. The data collection, pre-processing, and ML algorithms are discussed in the following subsections.

3.2.1. Data Collection and Pre-Processing

Collecting data for developing the RS for the second use case required information present in the SRI assessment file, which is usually distributed in an Excel format. SRI assessment has already been performed on the CERTH’s smart home in Thessaloniki. This was used for developing the RS. However, SRI data of more than one building are required for training the ML algorithm. Acquiring these SRI data was challenging for the second use case since the SRI is still a relatively new framework and there are no databases or online repositories with SRI assessments of different buildings.
Therefore, literature containing data for an SRI assessment of buildings was investigated. The majority of the investigated SRI literature lacks usefulness in the development of a robust RS since it reports just the final SRI score. The work presented in [39] provided the complete list of smart-ready services and their corresponding functionality levels for 10 buildings. Table 2 indicatively shows a few columns of how the data from the literature were formatted manually into a CSV file.
As shown in Table 2, the building types and construction years are in the vertical orientation, whereas the 52 smart-ready services are mentioned in the horizontal orientation. The numbers under the smart-ready services suggest their functionality level.
The pre-processing of SRI data requires understanding the information present in an SRI assessment file. The SRI assessment file contains the following in separate sheets stored in a single Excel workbook file.
From the above information, the last two contain the data required to develop the RS; however, the data still need to be converted from Excel to a CSV file to make it easy to extract the data from files and use it for training the ML algorithm. The impact domain matrix was copied manually from the results sheet and made into a separate CSV file to serve as an input to the RS. The separate sheets of each domain from the SRI file are meant to help identify the smart services that contribute toward the low score in the impact domain matrix. For this reason, each domain sheet in the SRI file needs to be converted into a CSV file as well. This was completed manually along with some formatting to make the CSV file easily readable using Python code.

3.2.2. Machine Learning Algorithms

After having worked on all the needed CSV files, the data need to be filtered out in a way that can be fed to the ML algorithms. The scikit-learn [38] implementations of DT and KNN were used (to compare the two ML algorithms). A dynamic code needs to be developed for this which takes in the impact-domain matrix (Table 3), identifies the lowest percentage in the matrix, accesses the identified domain, filters out the impact that has a bearing on the identified domain, and then prints out the services. To achieve this, the following steps were followed:
1.
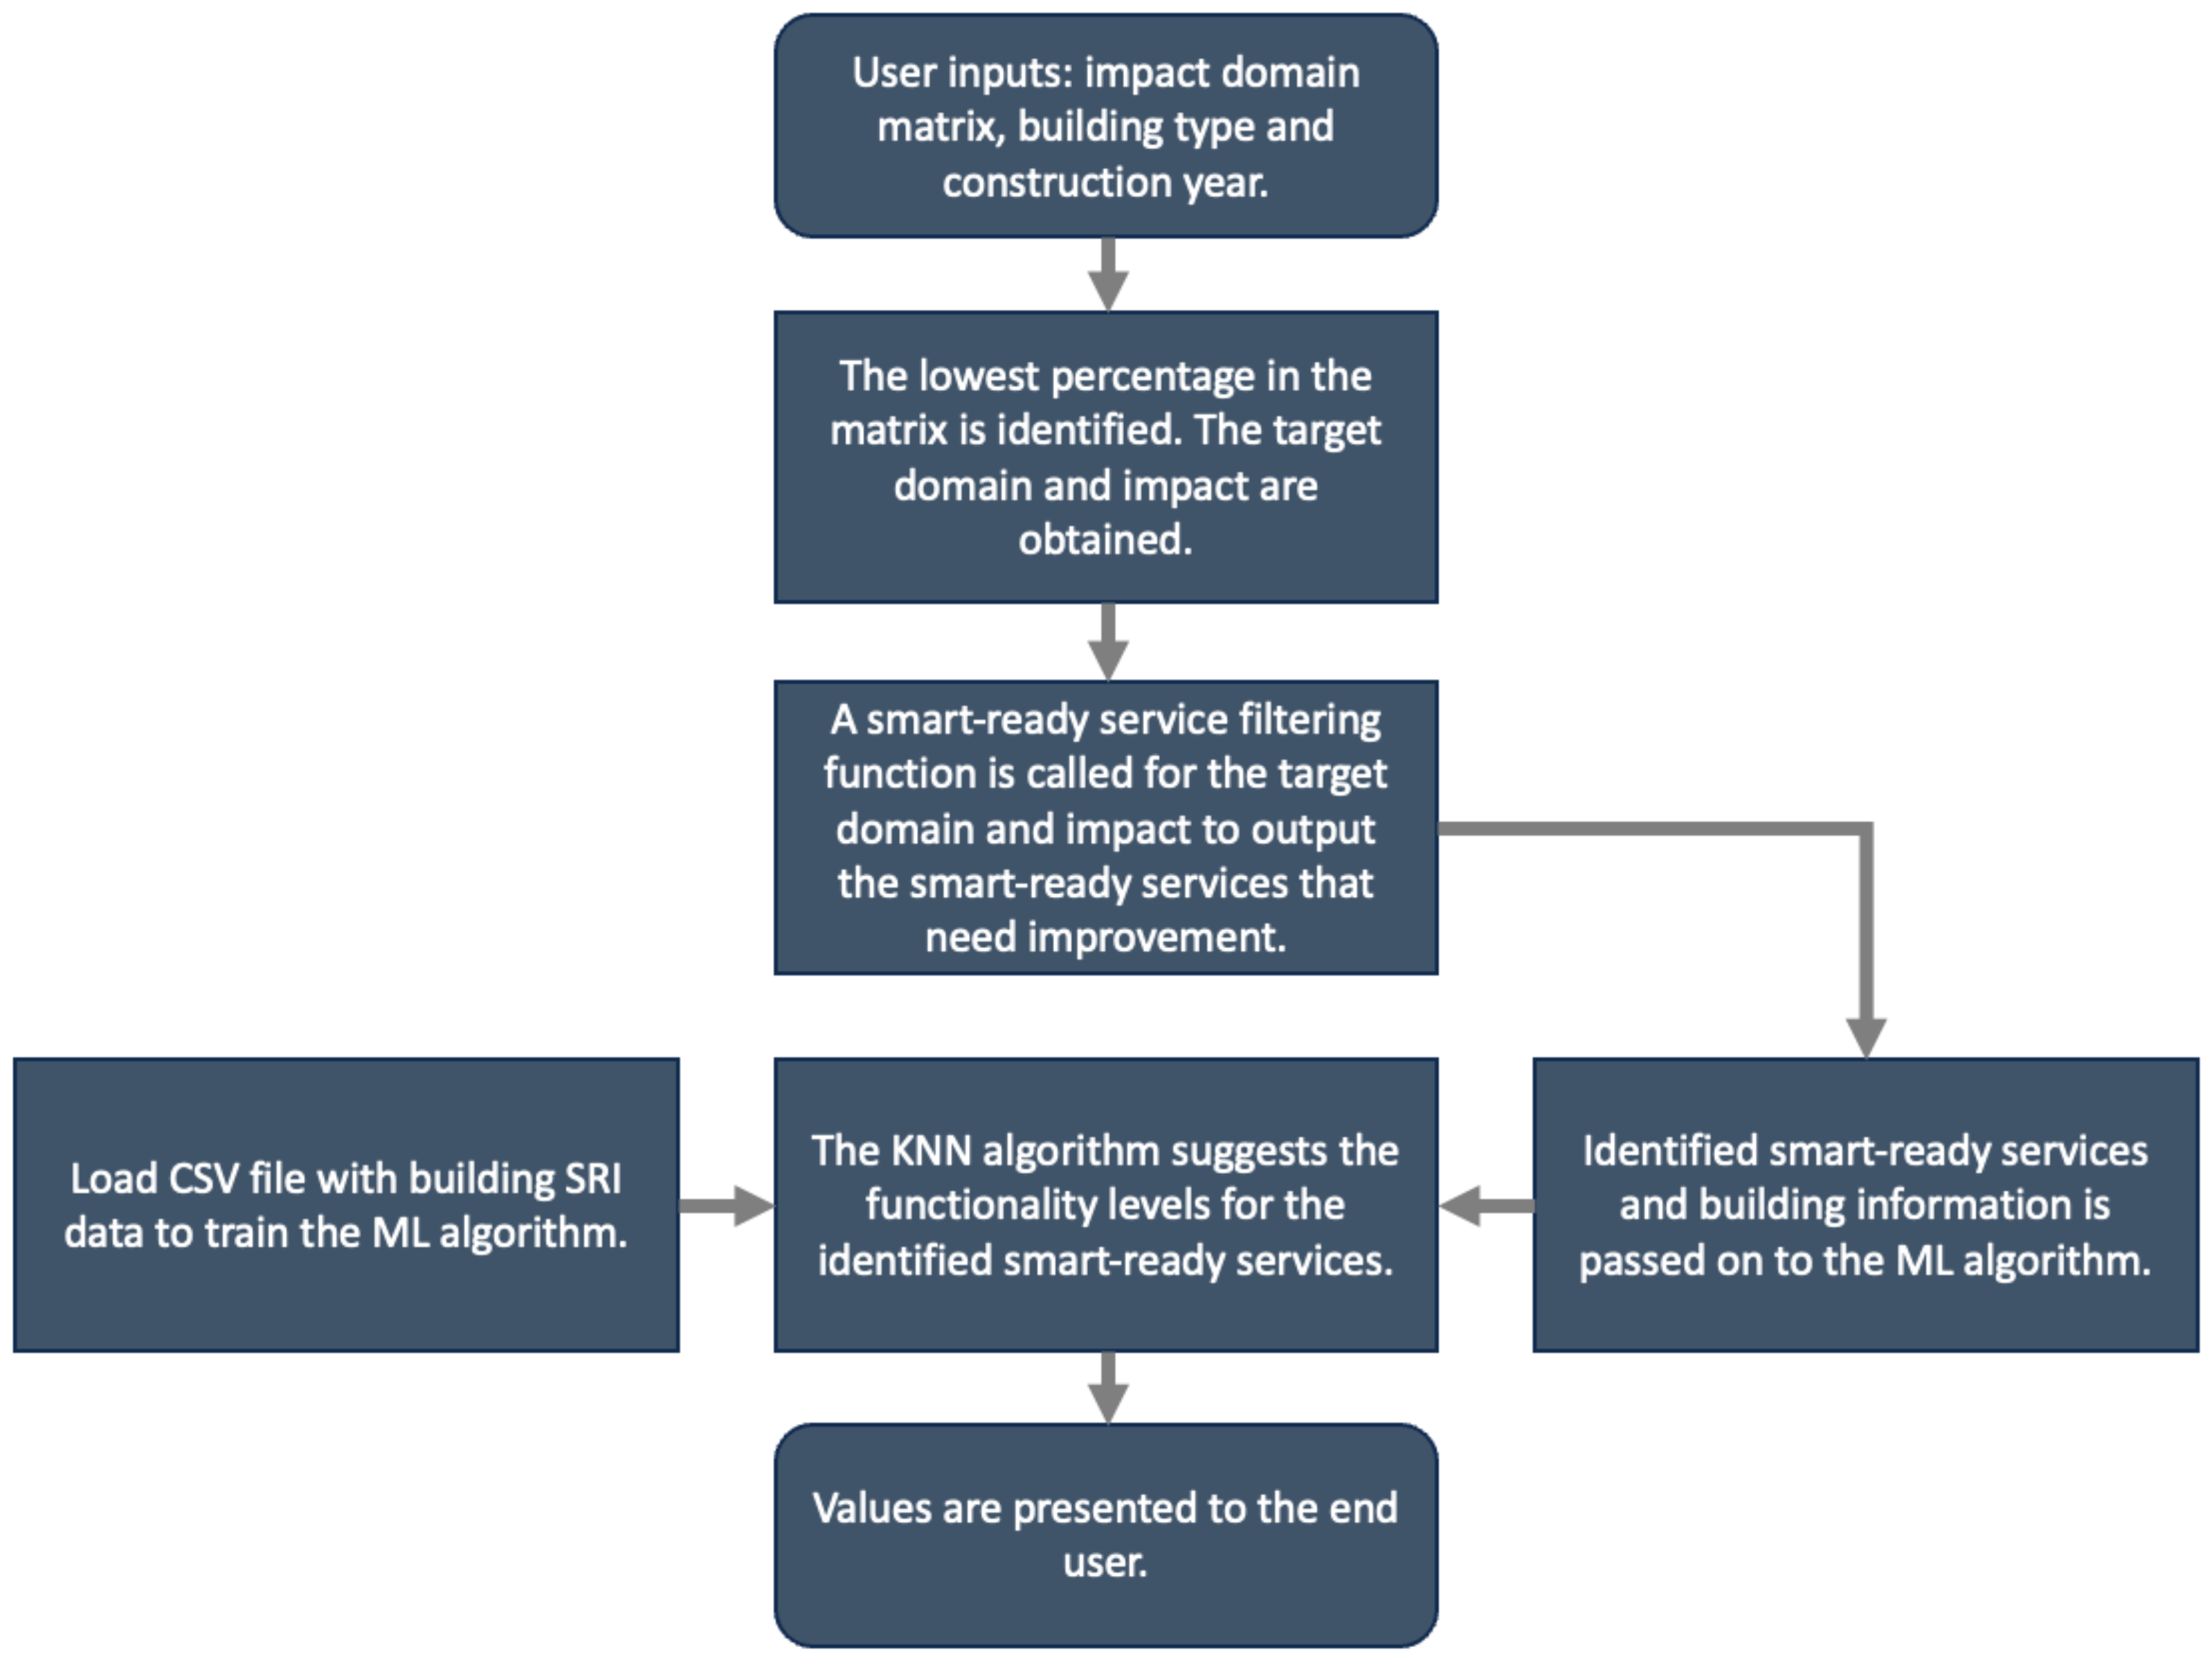
Once the lowest percentage is identified, the domain and the impact are noted (Lighting and energy efficiency in case of Table 3).
2.
Next, for the domain ‘lighting’, the separate CSV file named lighting (extracted from the SRI Excel file in the data collection phase) is used to filter out all instances where ‘energy efficiency’ has an impact value of above zero. All such instances are then traced back to the service name under which they happen. For example, in the lighting domain, there are only two services (Occupancy control of indoor lighting, L-1a, and Control artificial lighting based on outdoor daylight levels, L-2) and in both these services, for at least one functionality level, the impact of energy efficiency is above zero.
3.
Since the RS must be capable of accepting any kind of impact-domain matrix, the code developed for performing the steps described above must be dynamic. This requires, for the identified domain, making a separate code file that contains a function that performs the filtering of smart-ready services based on non-zero values under the identified impact area.
4.
Once the separate code files containing the smart service filter function are in place, they can be called based on the lowest percentage in the impact domain matrix. The output will be identified smart services, which will then be fed to the ML algorithms.
5.
After acquiring the smart-ready services, along with the building type and the construction year, the KNN algorithm using scikit-learn’s K Neighbors Regressor with a single neighbor as parameter (n_neighbors = 1) and the DT algorithm (with the parameters criterion = ‘mse’, splitter = ‘best’, min_samples_split = 2, min_samples_leaf = 1, min_impurity_decrease = 0.0, min_impurity_split = None and presort = ‘deprecated’) was employed to suggest the functionality level for the smart-ready service identified earlier. This is completed based on the similarity of the building information (type and construction year) entered by the user compared to those present in the data used to train the algorithms.
A user flow chart is depicted in Figure 4 to better explain the above-mentioned steps.

4. Results and Evaluation

To verify the accuracy and reliability of the proposed approach, a systematic approach was employed to validate the results of each component of the proposed RS. The first use case comprises two distinct components: the numerical and the categorical. To assess the numerical component, the validation process utilizes the MAE and the RMSE metrics. Both metrics were employed based on the criterion that their values should not exceed 10% of the expected values derived from the standard principles of Passive House construction. The criterion for evaluating these values is that they should be equal to or lower than 10% of the anticipated range of values for these variables. The establishment of these ranges is as follows in Table 4.
In the categorical component, the validation process involved assessing the accuracy of the proposed RS by utilizing a confusion matrix to calculate the number of correct predictions. The accuracy of the proposed RS was determined by examining the frequency of accurate predictions made. To discuss the results of RSs from both use cases, this section is divided into two major portions for the two use cases. In this section, results along with evaluation metrics are discussed, and also, justifications for the selection of the ML algorithms were made.

4.1. Recommendation System for Thermal Envelope

For the RS HVAC systems use case, the evaluation of results was completed in two parts, as the outcome from the RS included categorical and numerical variables. The evaluation and algorithm selection for these two parts are presented in the following subsections.

4.1.1. Numerical Evaluation

The evaluation metrics used for the numerical variables are Mean Absolute Error (MAE) and Root Mean Square Error (RMSE).
The calculation of MAE is a simple process, as described by Equation (1). It involves summing the absolute values of the errors, which represent the differences between the actual and predicted values, and then dividing this sum by the total number of instances. In contrast to alternative statistical methodologies, MAE assigns equal weight to all errors when evaluating performance.
M A E = 1 N i = 1 N | y i f i |
where y i is the real, f i is the predicted value, and N is the amount of observations.
RMSE (Equation (3)) is defined as the square root of the mean squared distance between the actual and predicted values, which is equivalent to the square root of the Mean Squared Error (MSE) (Equation (2)). While the computations for these two metrics are quite similar (Equations (2) and (3)), the RMSE is commonly preferred due to its ability to be represented in the same units as the goal parameter in the given scenario. RMSE, as per its technical definition, assigns higher significance to larger errors, since the impact of each error on the overall sum is determined by its square rather than its magnitude.
M S E = 1 N i = 1 N ( y i f i ) 2
R M S E = 1 N i = 1 N ( y i f i ) 2
where y i is the real, f i is the predicted value, and N is the number of observations.
After executing the code, the following evaluation metric values were obtained (Table 5).
The accuracy of the algorithm is acceptable in terms of MAE values; however, there are some values of RMSE that are outside the ranges stated in Table 4.
To make a clear decision, other algorithms were also used to see how they perform in terms of these statistical measures. Table 6 presents these results.
Based on Table 6, the RF algorithm generally performs better with lower MAE and RMSE values compared to the other algorithms for most of the target variables.

4.1.2. Categorical Evaluation

The evaluation of the metric used for the categorical variables is the confusion matrix reporting accuracy values. The accuracy of the produced model was measured to check how many times it predicted the categorical variable correctly. After executing the code, the following results were obtained:
  • Accuracy for Wall insulation 60%.
  • Accuracy for roof insulation 57%.
It is to be noted here that the percentage accuracy is not very high, so other algorithms were used to compare. Results from other algorithms are presented in Table 7.

4.2. Recommendation System for HVAC Systems

For the second use case, the evaluation was much simpler compared to the first use case, as the target variable of this RS is a numerical value (functionality level of a smart-ready service). After running the code, the following results were obtained, which are presented in Table 8.
The resulting MAE is 0.33 and the RMSE is 0.57. In this case, it is important to note that the MAE and RMSE values do not fully depict the accuracy of the produced model, since there are three instances in the test set and the algorithm predicts correctly two times for the instances in the test set. To make a sound decision on this, and to find out if the above-mentioned results are acceptable or not, a DT algorithm was also used, yielding the results presented in Table 9.
Based on the presented results, it becomes apparent that the DT algorithm exhibits limitations in providing accurate predictions. Furthermore, it appears to predict values dynamically. Something like that may not be desirable, as the target variable represents the functional level of a smart service and cannot take on decimal values. Therefore, it is much more suitable to use the KNN algorithm, as it predicts values based on similarity rather than dynamically calculating them.

5. Discussion

The findings derived from the result analysis of the two use cases can be interpreted in the following manner.
  • First use case
    The results of the numerical variable in the first use case are deemed acceptable. The predicted U value for roofs was 0.1. The thickness value for wall insulation was found to be 0.25. The predicted value for roof insulation was 0.3. Lastly, the U value for windows was measured to be 0.55. These values are within the acceptable ranges mentioned in Table 4. However, the results for the categorical variables are inferior, since the obtained accuracy values range between 50% and 60%. This can be attributed to the limited quantity of building data that were taken into account. To train the ML algorithms, data were taken from the Passive House database in addition to the IFC BIM file of CERTH’s smart home. Since the data were collected manually from the database, data of only 30 buildings were considered in the database. It is also noted that when data were generated artificially, accuracy decreased even further. The utilization of larger datasets has the potential to result in increased accuracy when dealing with categorical variables.
    In addition to conducting a quantitative evaluation of the outcomes of the proposed RS, a qualitative evaluation was also implemented to assess the coherence and validity of the results. For that purpose, different sets of input variables were tested to observe the thickness of insulation and the corresponding U values of the wall and roof. It was observed that when there is an increase in the thickness of the wall and roof insulation, the U values tend to drop. This is in line with the concepts of thermal resistance. An increase in insulation thickness would increase thermal resistance and therefore decrease the U values because the two are inversely proportional. Thus, it was determined that the results obtained from the proposed RS make sense from a domain-knowledge point of view.
  • Second use case
    The challenging part about developing an algorithm for an RS using SRI data was the difficulty in finding complete data. As mentioned in previous sections, the SRI data for training the ML algorithm were taken from the available published literature. However, this was only data for 11 buildings, and the results as such would not be very good for a wide range of buildings when using such a small dataset. As a result, out of every three input instances in the RS, two values were predicted correctly.
    From a qualitative perspective, there is a favorable relationship between the year of construction and the SRI score. This means that for a given smart-ready service, the functionality level should be higher if the construction year input by the user is more recent. If the building is old, then it should be lower. This test was performed, and the RS produced the expected results, suggesting a higher functionality level for the same smart-ready service if the building is new; but if it is old, lower functionality levels are suggested.

5.1. Challenges

The methodology employed in this study for developing the proposed RS yielded satisfactory outcomes at a small scale. However, some challenges necessitate attention and resolution.
  • The utilization of datasets for training ML algorithms is characterized by a notable limitation in terms of size. In contrast, RSs usually rely on larger datasets, typically consisting of no less than one thousand data points. As a result, the scalability of the proposed RS has not been adequately tested.
  • The utilization of the Passive House database was necessary due to the limited availability of BIM data for buildings. Hence, the accessibility of BIM data has the potential to enhance automation and reduce the reliance on manual efforts in the data preparation process.
  • The dataset was manually prepared for the first use case due to the absence of a feature in the Passive House database that allows for data retrieval in a tabular format. From a practical point of view, this could potentially present a challenge for developers who intend to create this kind of RS.
  • The Passive House database encompasses a comprehensive range of climatic conditions across Europe. Yet, it is less widely adopted outside Europe, resulting in limited availability of climate-specific construction details for regions beyond Europe. This database constraint directly influences the proposed RS.
  • Using the Passive House database for training ML algorithms yields recommendations for constructing energy-efficient building envelopes. Moreover, it is important to note that passive house constructions tend to incur higher costs, which may pose a potential challenge despite their high energy efficiency.
  • The current SRI framework is characterized by subjectivity, which consequently impacts the recommendations provided by the proposed or any RS. Nevertheless, it is imperative to acknowledge that this issue cannot be ignored unless certain modifications are made to the official SRI framework.
The significance of this study lies in the development of a novel algorithm for the proposed RS as well as its demonstration of the potential benefits of integrating SRI and BIM data. The combination of BIM data with data from the Passive House database allows for covering a wide variety of building types and climates within the EU. This integration can provide highly individualized and comprehensive recommendations for improving the energy efficiency of buildings. The use of SRI data in this study can assist researchers with devising innovative algorithms and investigating the potential for creating more valuable solutions targeted at enhancing building energy efficiency. Moreover, this study highlights the necessary steps for leveraging the SRI framework to relevant stakeholders through the creation of a valuable tool that may be upgraded by increasing the SRI data accessibility.

5.2. Future Work

The area for future work for both use cases is discussed in the following points:
  • The algorithmic results for the RSs in both use cases can be enhanced with the incorporation of a cost feature. In the first use case (thermal envelope RS), it is possible to incorporate the cost of insulating materials as a factor. This would enable users to specify their budgetary constraints, hence allowing for personalized suggestions that align with their financial preferences. Similarly, the second use case (HVAC Systems RS) involves including the expenses associated with each building service. This enables the user to make informed decisions on their desired level of automation for a certain building service based on their allocated budget.
  • For the first use case, a safety element can be added. Insulation materials are not just selected for the lower U value but also for their resistance to fire in certain climates. This is not considered in this work. Adding this feature would make the RS more practical.
  • For the first use case, the EU building stock observatory [40] can also be used as a source of data, as it contains most of the variables included in the dataset prepared for this work, and it does not require any manual form of data entry, as the data are available in CSV files.
  • For the first use case, external factors like local regulations with regard to the insulation can also be added to the existing RS.
  • The SRI data are quite difficult to collect. Therefore, a central database at the national level would be very helpful for future researchers in the SRI domain.
  • With larger datasets for both SRI and BIM, the scalability of the RS can be better tested.
  • The subjectivity of the SRI framework needs to be addressed by adding quantitative elements to it.
Finally, given the collective potential of the algorithms developed in both use cases, by using larger datasets, it is possible to integrate this tool with existing BIM software packages. BIM software packages like Revit [41] offer certain options and suggestions for the improvement of energy efficiency in the building model developed by the user; however, the level of personalization of these suggestions is still not very high. By integrating the tool proposed in this paper, this can be significantly improved.

6. Conclusions

This work introduces a novel algorithmic approach for an RS that leverages BIM and SRI data. To optimize the utilization of these data, the methodology was segmented into two algorithms, which were each related to one of two use cases.
In the first use case, BIM data were employed to offer recommendations for improving the thermal envelope. A hybrid ML algorithm, following a mixed Random Forest–Decision Tree approach, was trained using the BIM model of CERTH’S nZEB Smart Home in Greece, which is based on the IFC standard, along with data from the Passive House database. The second use case involved the utilization of SRI data to develop an RS for suggesting improvements for HVAC systems. This process incorporates a filtering function and the KNN algorithm to propose appropriate levels of automation for improving building services. Therefore, to achieve optimal outcomes, a range of algorithms was employed and tested, including KNN, RF, DT, Linear Regression, and Logistic Regression, to assess and determine the optimal outcomes.
It is noteworthy that the inputs to the proposed RS exhibit a predominantly static nature over extended periods. These inputs include variables, such as building type, climate, area, SRI impact domain matrix, and construction year. Thus, real-world modifications to buildings would have no impact on the suggestions provided by the RS.
Statistical analysis of the findings indicated that although the numerical values exhibit higher levels of predictive accuracy, the categorical variables are significantly influenced by the quality of the obtained data. Furthermore, the qualitative assessment indicated that the results obtained from the RS are aligned with the concepts of building physics and the SRI.
Finally, this paper presented an RS that investigates the potential synergies between SRI and BIM data as evidenced by the results obtained from both use cases. It introduced an innovative algorithmic approach that leverages the available data to support the creation of an RS aimed at enhancing building energy efficiency.

Author Contributions

Conceptualization, M.T.S. and D.I.; methodology, M.T.S. and P.K.; software, M.T.S.; validation, M.T.S. and P.K.; formal analysis, M.T.S.; investigation, M.T.S., P.K., D.I. and C.T.; resources, D.I.; data curation, M.T.S.; writing—original draft preparation, M.T.S. and P.K.; writing—review and editing, M.T.S., P.K. and C.T.; visualization, M.T.S.; supervision, P.K. and D.I.; project administration, P.K. and C.T.; funding acquisition, C.T. All authors have read and agreed to the published version of the manuscript.

Funding

This research is co-financed by Greece and the European Union (European Social Fund-SF) through the Operational Programme “Human Resources Development, Education and Lifelong Learning 2014-2020” in the context of the project “Support for International Actions of the International Hellenic University”, (MIS 5154651).

Institutional Review Board Statement

Not applicable.

Informed Consent Statement

Not applicable.

Data Availability Statement

The data presented in this study are available upon request from the authors. The data are not publicly available due to working on more research analyses.

Conflicts of Interest

Researchers in Information Technologies Institute, Centre of Research & Technology or School of Science and Technology, International Hellenic University.

Abbreviations

The following abbreviations are used in this manuscript:
AIArtificial Intelligence
BIMBuilding Information Modeling
BREEAMBuilding Research Establishment Environmental Assessment Method
CBECSCommercial Buildings Energy Consumption Survey
CERTHCenter for Research and Technology Hellas
CEDCumulative Energy Demand
DLDeep Learning
DTDecision Tree
EPBDEnergy Performance of Buildings Directive
EPCEnergy Performance Certificate
EUEuropean Union
GPPGreen Public Procurement
HVACHeating, Ventilation and Air Conditioning
ICTInformation and Communication Technology
IFCIndustry Foundation Classes
KNNK-Nearest Neighbor
KPIKey Performance Indicator
LCALife Cycle Analysis
MAEMean Absolute Error
MLMachine Learning
MSEMean Squared Error
nZEBnearly Zero Energy Building
RMSERoot Mean Square Error
RSRecommendation System
SRISmart Readiness Indicator
TQATotal Quality Assessment
U valueThermal Transmittance
UNEP-SBCIUnited Nations Environment Program’s Sustainable Buildings and Climate Initiative

References

  1. Janhunen, E.; Pulkka, L.; Säynäjoki, A.; Junnila, S. Applicability of the smart readiness indicator for cold climate countries. Buildings 2019, 9, 102. [Google Scholar] [CrossRef]
  2. Buildings—ase.org. Available online: https://www.ase.org/buildings (accessed on 28 June 2023).
  3. Koukaras, P.; Krinidis, S.; Ioannidis, D.; Tjortjis, C.; Tzovaras, D. Big Data and Analytics in the Deep Renovation Life Cycle. In Disrupting Buildings: Digitalization and the Transformation of Deep Renovation; Springer International Publishing: Cham, Switzerland, 2023; pp. 69–81. [Google Scholar] [CrossRef]
  4. Koukaras, P.; Bezas, N.; Gkaidatzis, P.; Ioannidis, D.; Tzovaras, D.; Tjortjis, C. Introducing a novel approach in one-step ahead energy load forecasting. Sustain. Comput. Inform. Syst. 2021, 32, 100616. [Google Scholar] [CrossRef]
  5. Koukaras, P.; Gkaidatzis, P.; Bezas, N.; Bragatto, T.; Carere, F.; Santori, F.; Antal, M.; Tjortjis, C.; Tzovaras, D. A Tri-Layer Optimization Framework for Day-Ahead Energy Scheduling Based on Cost and Discomfort Minimization. Energies 2021, 14, 3599. [Google Scholar] [CrossRef]
  6. Latifah, A.; Supangkat, S.H.; Ramelan, A. Smart Building: A Literature Review. In Proceedings of the 2020 International Conference on ICT for Smart Society (ICISS), Bandung, Indonesia, 19–20 November 2020; pp. 1–6. [Google Scholar] [CrossRef]
  7. EPBD. Directive (EU) 2018/844 of the European Parliament and of the Council of 30 May 2018 Amending Directive 2010/31/EU on the Energy Performance of Buildings and DIRECTIVE 2012/27/EU on Energy Efficiency. Available online: https://eur-lex.europa.eu/legal-content/EN/TXT/?uri=uriserv (accessed on 26 September 2023).
  8. Schoinas, I.; Tjortjis, C. MuSIF: A Product Recommendation System Based on Multi-Source Implicit Feedback. In Proceedings of the Artificial Intelligence Applications and Innovations, Crete, Greece, 24–26 May 2019; MacIntyre, J., Maglogiannis, I., Iliadis, L., Pimenidis, E., Eds.; Springer International Publishing: Cham, Switzerland, 2019; pp. 660–672. [Google Scholar]
  9. Shao, B.; Li, X.; Bian, G. A survey of research hotspots and frontier trends of recommendation systems from the perspective of knowledge graph. Expert Syst. Appl. 2021, 165, 113764. [Google Scholar] [CrossRef]
  10. Himeur, Y.; Alsalemi, A.; Bensaali, F.; Amira, A.; Sardianos, C.; Varlamis, I.; Dimitrakopoulos, G. On the applicability of 2d local binary patterns for identifying electrical appliances in non-intrusive load monitoring. In Proceedings of the SAI Intelligent Systems Conference, London, UK, 3–4 September 2020; Springer: Berlin/Heidelberg, Germany, 2020; pp. 188–205. [Google Scholar]
  11. Sardianos, C.; Varlamis, I.; Chronis, C.; Dimitrakopoulos, G.; Alsalemi, A.; Himeur, Y.; Bensaali, F.; Amira, A. Reshaping consumption habits by exploiting energy-related micro-moment recommendations: A case study. In Proceedings of the International Conference on Smart Cities and Green ICT Systems, Crete, Greece, 3–5 May 2019; Springer: Berlin/Heidelberg, Germany, 2019; pp. 65–84. [Google Scholar]
  12. Ashouri, M.; Haghighat, F.; Fung, B.C.; Lazrak, A.; Yoshino, H. Development of building energy saving advisory: A data mining approach. Energy Build. 2018, 172, 139–151. [Google Scholar] [CrossRef]
  13. Himeur, Y.; Alsalemi, A.; Al-Kababji, A.; Bensaali, F.; Amira, A.; Sardianos, C.; Dimitrakopoulos, G.; Varlamis, I. A survey of recommender systems for energy efficiency in buildings: Principles, challenges and prospects. Inf. Fusion 2021, 72, 1–21. [Google Scholar] [CrossRef]
  14. Pinto, T.; Faia, R.; Navarro-Caceres, M.; Santos, G.; Corchado, J.M.; Vale, Z. Multi-agent-based CBR recommender system for intelligent energy management in buildings. IEEE Syst. J. 2018, 13, 1084–1095. [Google Scholar] [CrossRef]
  15. Cuffaro, G.; Paganelli, F.; Mylonas, G. A Resource-based Rule Engine for energy savings recommendations in Educational Buildings. In Proceedings of the 2017 Global Internet of Things Summit (GIoTS), Geneva, Switzerland, 6–9 June 2017; IEEE: Piscataway, NJ, USA, 2017; pp. 1–6. [Google Scholar]
  16. Dahihande, J.; Jaiswal, A.; Pagar, A.A.; Thakare, A.; Eirinaki, M.; Varlamis, I. Reducing energy waste in households through real-time recommendations. In Proceedings of the 14th ACM Conference on Recommender Systems, Virtual, 22–26 September 2020; pp. 545–550. [Google Scholar]
  17. Zhang, Y.; Meng, K.; Kong, W.; Dong, Z.Y. Collaborative filtering-based electricity plan recommender system. IEEE Trans. Ind. Inform. 2018, 15, 1393–1404. [Google Scholar] [CrossRef]
  18. Raza, S.; Ding, C. Progress in context-aware recommender systems—An overview. Comput. Sci. Rev. 2019, 31, 84–97. [Google Scholar] [CrossRef]
  19. Starke, A.; Willemsen, M.C.; Snijders, C. Saving Energy in 1-D: Tailoring Energy-saving Advice Using a Rasch-based Energy Recommender System. In Proceedings of the DMRS, Bolzano, Italy, 22–23 October 2015; pp. 5–8. [Google Scholar]
  20. Kung, L.; Wang, H.F. A recommender system for the optimal combination of energy resources with cost-benefit analysis. In Proceedings of the 2015 International Conference on Industrial Engineering and Operations Management (IEOM), Dubai, United Arab Emirates, 3–5 March 2015; IEEE: Piscataway, NJ, USA, 2015; pp. 1–10. [Google Scholar]
  21. Wróblewska, A.; Dąbrowski, J.; Pastuszak, M.; Michałowski, A.; Daniluk, M.; Rychalska, B.; Wieczorek, M.; Sysko-Romańczuk, S. Designing Multi-Modal Embedding Fusion-Based Recommender. Electronics 2022, 11, 1391. [Google Scholar] [CrossRef]
  22. Kiran, R.; Kumar, P.; Bhasker, B. DNNRec: A novel deep learning based hybrid recommender system. Expert Syst. Appl. 2020, 144, 113054. [Google Scholar]
  23. Verbeke, S.; Aerts, D.; Reynders, G.; Ma, Y.; Waide, P. Final Report on the Technical Support to the Development of a Smart Readiness Indicator for Buildings; European Commission: Brussels, Belgium, 2020. [Google Scholar]
  24. Froufe, M.M.; Chinelli, C.K.; Guedes, A.L.A.; Haddad, A.N.; Hammad, A.W.; Soares, C.A.P. Smart buildings: Systems and drivers. Buildings 2020, 10, 153. [Google Scholar] [CrossRef]
  25. Kolesnik, E.; Splavska, V.; Farenyuk, E.; Farenyuk, G.; Deshko, V.; Strelkova, G.G.; Sukhodub, I.; Shevchenko, O.; Ageeva, G.M.; Ageeva, G.N.; et al. DSTU B EN 15217: 2013 Energy Efficiency of Life. Methods for Presenting Energy Performance and Energy Certification Life; Technical Report; Ministry of Ukraine: Kyiv, Ukraine, 2014.
  26. Li, Y.; Kubicki, S.; Guerriero, A.; Rezgui, Y. Review of building energy performance certification schemes towards future improvement. Renew. Sustain. Energy Rev. 2019, 113, 109244. [Google Scholar] [CrossRef]
  27. Bragança, L.; Mateus, R. Life-Cycle Analysis of Buildings: Envirnonmental Impact of Building Elements; Associacao iiSBE Portugal: Guimaraes, Portugal, 2012. [Google Scholar]
  28. Berardi, U. Sustainability assessment in the construction sector: Rating systems and rated buildings. Sustain. Dev. 2012, 20, 411–424. [Google Scholar] [CrossRef]
  29. Chersan, I.C.; Dumitru, V.F.; Gorgan, C.; Gorgan, V. Green public procurement in the academic literature. Amfiteatru Econ. 2020, 22, 82–101. [Google Scholar] [CrossRef]
  30. Kubba, S. Handbook of Green Building Design and Construction: LEED, BREEAM, and Green Globes; Butterworth-Heinemann: Oxford, UK, 2012. [Google Scholar]
  31. Apostolopoulos, V.; Giourka, P.; Martinopoulos, G.; Angelakoglou, K.; Kourtzanidis, K.; Nikolopoulos, N. Smart readiness indicator evaluation and cost estimation of smart retrofitting scenarios—A comparative case-study in European residential buildings. Sustain. Cities Soc. 2022, 82, 103921. [Google Scholar] [CrossRef]
  32. Plienaitis, G.; Daukšys, M.; Demetriou, E.; Ioannou, B.; Fokaides, P.A.; Seduikyte, L. Evaluation of the Smart Readiness Indicator for Educational Buildings. Buildings 2023, 13, 888. [Google Scholar] [CrossRef]
  33. Glasgo, B.; Azevedo, I.L.; Hendrickson, C. Expert assessments on the future of direct current in buildings. Environ. Res. Lett. 2018, 13, 074004. [Google Scholar] [CrossRef]
  34. Abbasnejad, B.; Nepal, M.P.; Ahankoob, A.; Nasirian, A.; Drogemuller, R. Building Information Modelling (BIM) adoption and implementation enablers in AEC firms: A systematic literature review. Archit. Eng. Des. Manag. 2021, 17, 411–433. [Google Scholar] [CrossRef]
  35. Joblot, L.; Paviot, T.; Deneux, D.; Lamouri, S. Literature review of Building Information Modeling (BIM) intended for the purpose of renovation projects. IFAC-PapersOnLine 2017, 50, 10518–10525. [Google Scholar] [CrossRef]
  36. ITI-CERTH. ITI Smart Home, a Digital Innovation Hub Powered by ITI/CERTH. Available online: https://smarthome.iti.gr (accessed on 15 September 2023).
  37. Passive-House-Institute. Passive House Database. Available online: https://passivehouse-database.org (accessed on 28 September 2023).
  38. Pedregosa, F.; Varoquaux, G.; Gramfort, A.; Michel, V.; Thirion, B.; Grisel, O.; Blondel, M.; Prettenhofer, P.; Weiss, R.; Dubourg, V.; et al. Scikit-learn: Machine Learning in Python. J. Mach. Learn. Res. 2011, 12, 2825–2830. [Google Scholar]
  39. Eloranta, V. Applicability Evaluation of Smart Readiness Indicator for Buildings. Diploma Thesis, LUT University, Lappeenranta, Finland, 2020. [Google Scholar]
  40. EU-Building-Stock-Observatory. Web Tool to Monitor the Energy Performance of Buildings across Europe. Available online: https://energy.ec.europa.eu/topics/energy-efficiency/energy-efficient-buildings/eu-building-stock-observatory_en (accessed on 22 September 2023).
  41. Autodesk. Autodesk Revit: BIM Software to Design and Make Anything. Available online: https://www.autodesk.com/products/revit/ (accessed on 24 September 2023).
Figure 1. Working concept of recommendation system (first use case).
Algorithms 16 00482 g001
Figure 2. User flow (first use case).
Algorithms 16 00482 g002
Figure 3. Working concept of recommendation system (second use case).
Algorithms 16 00482 g003
Figure 4. User flow (second use case).
Algorithms 16 00482 g004
Table 1. Domains and impact areas in SRI framework.
DomainImpact Areas
HeatingEnergy savings
CoolingMaintenance and fault prediction
Domestic hot waterComfort
VentilationConvenience
LightingInformation to occupant
Dynamic building envelopeHealth and well-being
Electricity generationEnergy demand flexibility
Electric vehicles charging
Monitoring and controlling
Table 2. Data format of the training dataset.
Building TypeConstruction YearHeat Emission Control (H-1a)Emission Control for TABS
(Heating Mode)(H-1b)
Single-family house20183NA
Educational building201723
Educational building20153NA
Educational building19882NA
Educational building19942NA
Educational building200023
Educational building20002NA
Educational building20043NA
Educational building201733
Educational building19732NA
Educational building19943NA
Table 3. Impact-domain matrix.
Technical
Domains
Energy
Efficiency
Energy
Flexibility
ComfortConvenienceHealth and
Well-Being
MaintenanceInformation
to Occupants
Heating80177563675067
Domestic hot water0000000
Cooling85172563675067
Ventilation00260435067
Lighting102013000
Dynamic building envelope2002017000
Electricity80560250067
Electric vehicle charging0250250067
Monitoring and control50676759506478
Table 4. Acceptable ranges for selected building envelope elements.
Building Envelope ElementsAcceptable Range
Wall U value0.1–0.25
Roof U value0.07–0.2
Wall insulation thickness0.2–0.3
Roof insulation thickness0.025–0.035
Window U value0.5–0.6
Table 5. Random Forest model results.
Building Envelope ComponentMAERMSE
Wall U value0.03260.0423
Roof U value0.03490.0430
Wall insulation thickness0.02630.0329
Roof insulation thickness0.02380.0316
Window U value0.04710.0647
Table 6. Numeral evaluation results for different algorithms.
AlgorithmWall U ValueRoof U ValueWall Insulation
Thickness
Roof Insulation
Thickness
Window U Value
Random ForestMAE = 0.0326MAE = 0.0349MAE = 0.0263MAE = 0.0238MAE = 0.0471
RMSE = 0.0423RMSE = 0.0430RMSE = 0.0329RMSE = 0.0316RMSE = 0.0647
Linear RegressionMAE = 0.0370MAE = 0.0331MAE = 0.0251MAE = 0.0305MAE = 0.0459
RMSE = 0.0449RMSE = 0.0387RMSE = 0.0300RMSE = 0.0455RMSE = 0.0554
K-Nearest NeighborMAE = 0.0374MAE = 0.0349MAE= 0.0234MAE = 0.0291MAE = 0.0512
RMSE = 0.0464RMSE = 0.0436RMSE = 0.0294RMSE = 0.0393RMSE = 0.0723
Table 7. Categorical evaluation results for different algorithms.
AlgorithmWall InsulationRoof Insulation
Linear Regression30.340.4
Logistic Regression16.6713.3
Decision Tree Classifier6057
K-Nearest Neighbor110
Table 8. KNN algorithm performance.
Actual Functionality LevelPredicted Functionality Level
22
32
22
Table 9. Decision tree algorithm performance.
Actual Functionality LevelPredicted Functionality Level
10
01.5
11
Disclaimer/Publisher’s Note: The statements, opinions and data contained in all publications are solely those of the individual author(s) and contributor(s) and not of MDPI and/or the editor(s). MDPI and/or the editor(s) disclaim responsibility for any injury to people or property resulting from any ideas, methods, instructions or products referred to in the content.

