
Automatic Myocardium Segmentation in Delayed-Enhancement MRI with Pathology-Specific Data Augmentation and Deep Learning Architectures

 ,
,  and
and
Abstract
:1. Introduction
2. Materials and Methods
2.1. Datasets
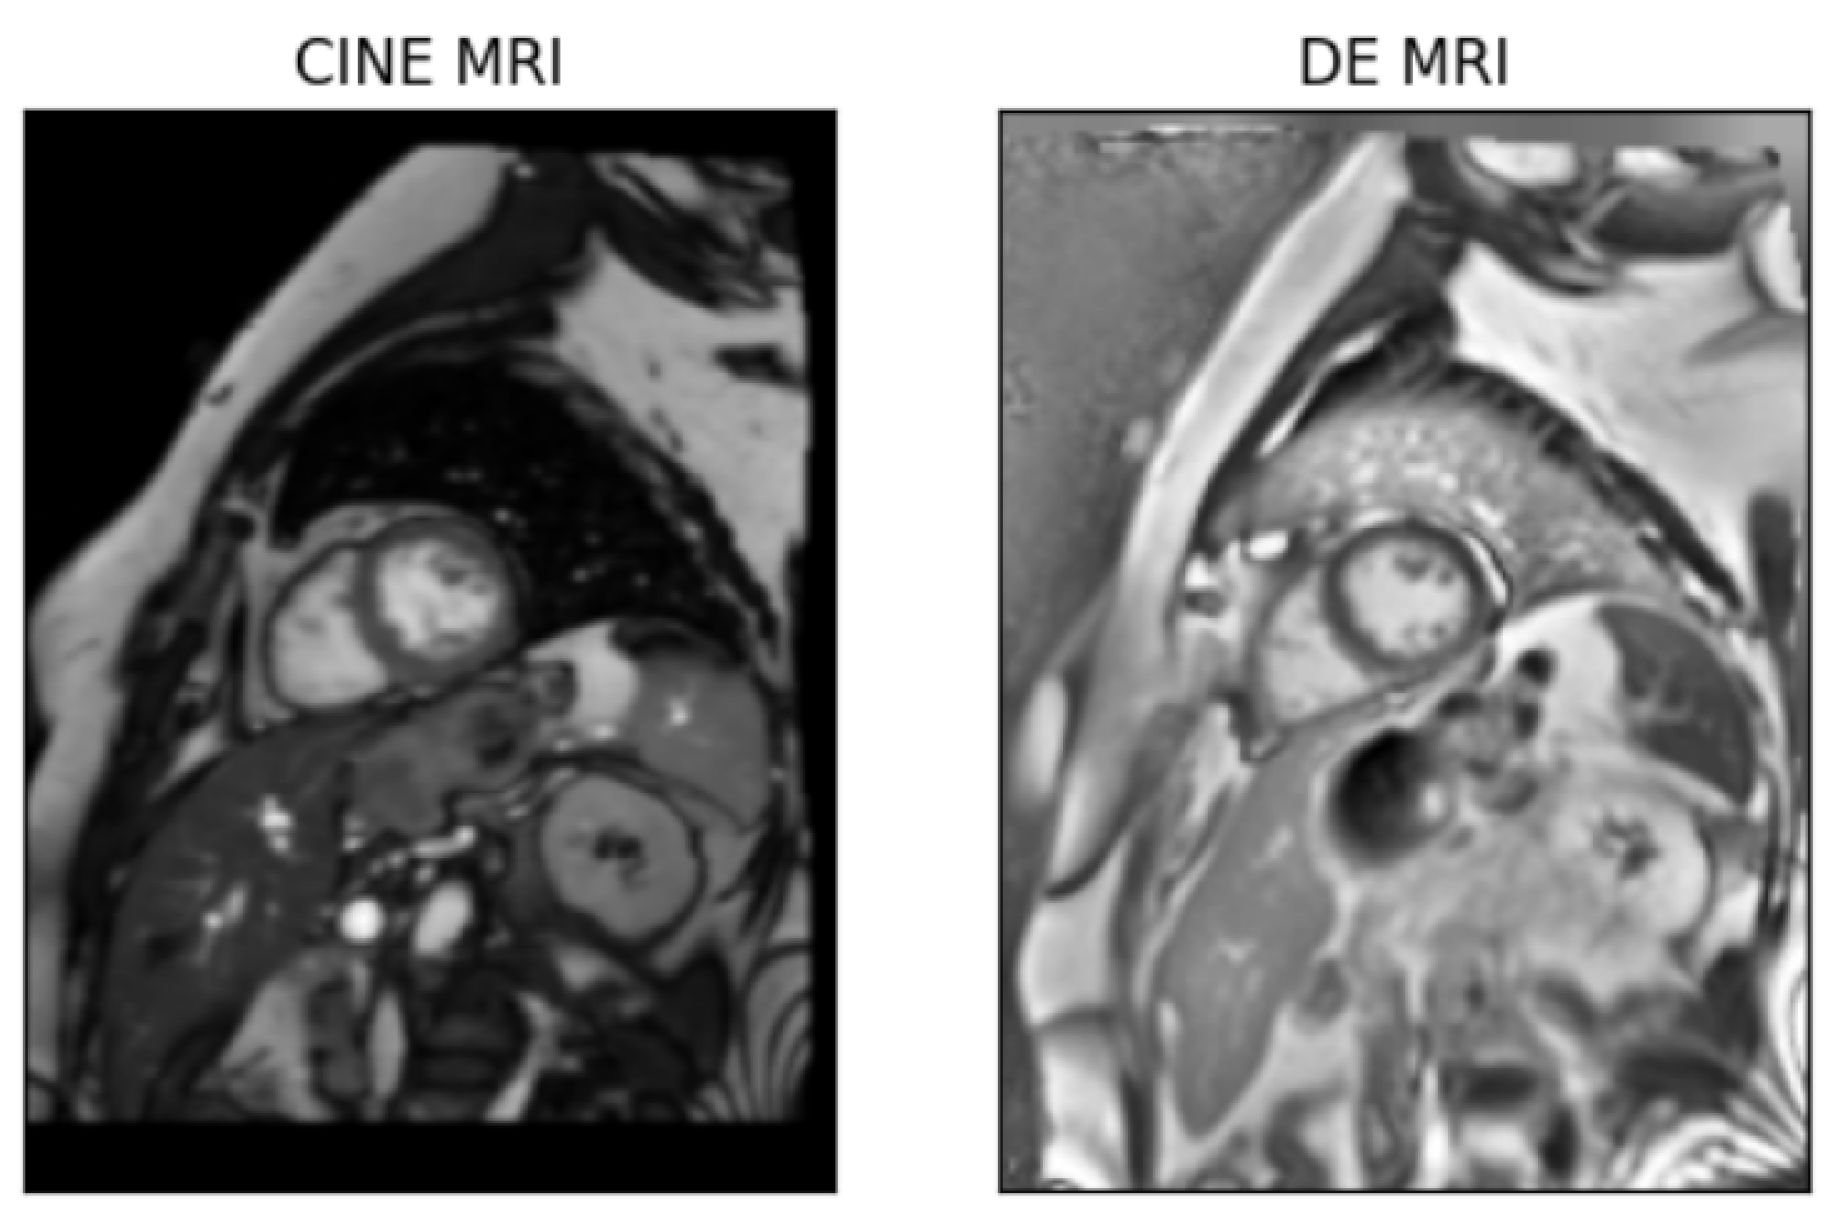
2.1.1. CINEDE Dataset
2.1.2. EMIDEC Dataset
2.2. Method
2.2.1. Data Pre-Processing
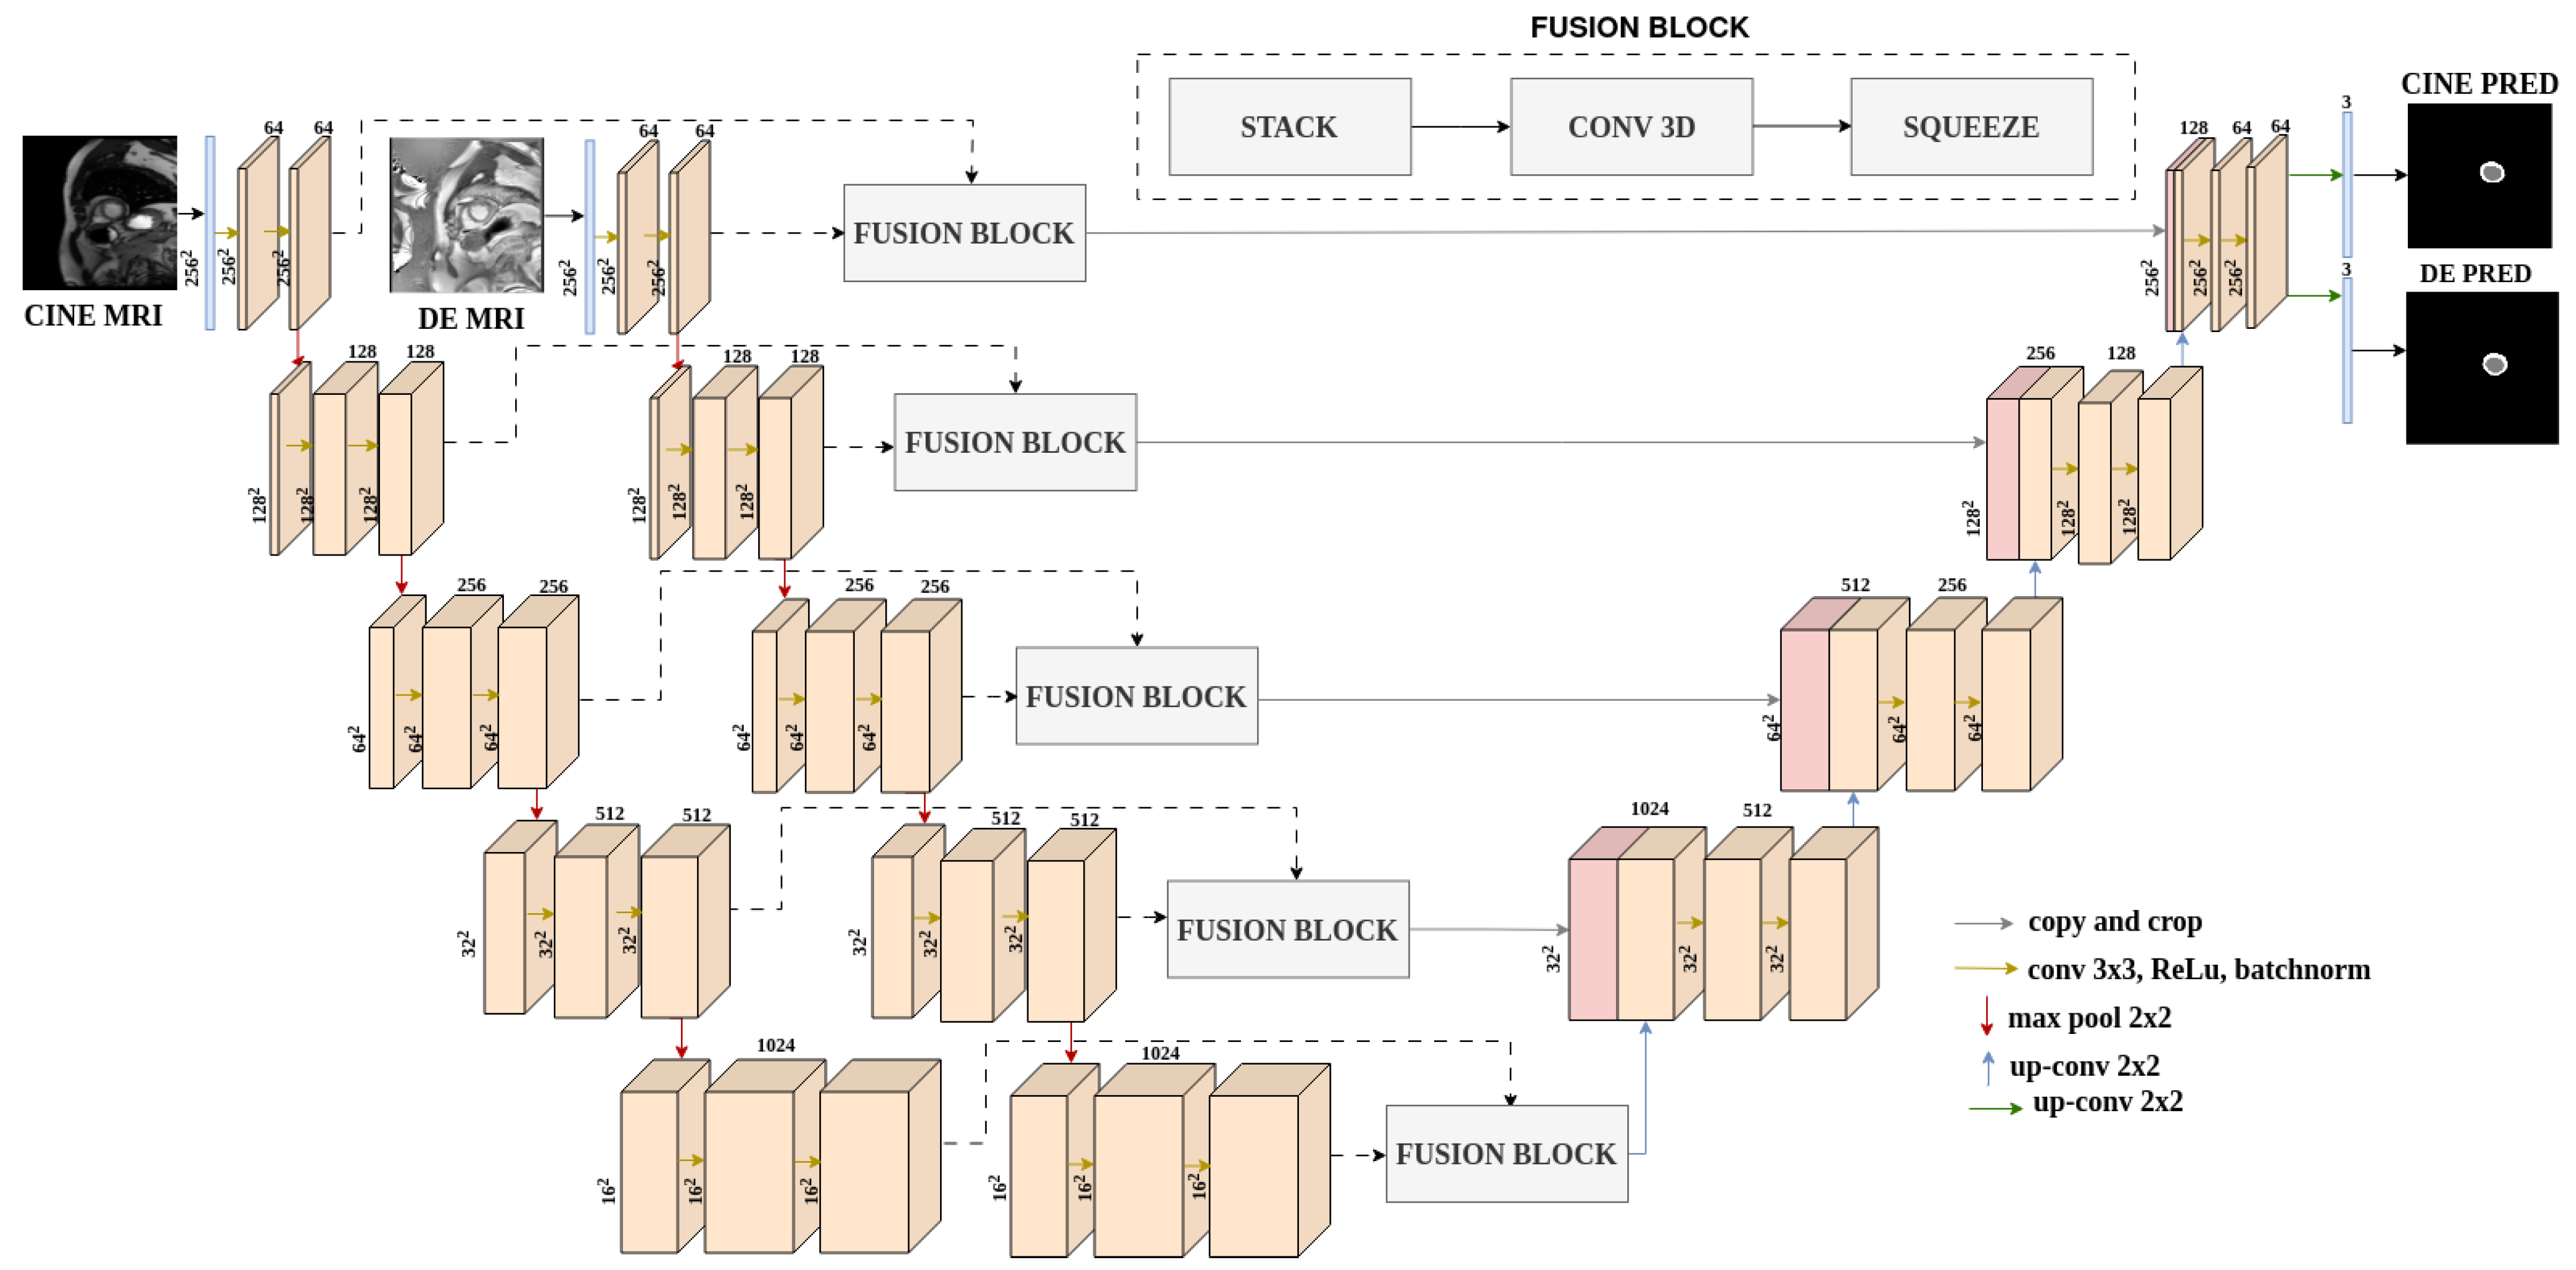
2.2.2. Segmentation Architectures
2.2.3. Extraction of Prior Information from EMIDEC Dataset
2.2.4. Data Augmentation Approach
2.3. Experiments
- Single modality baseline, which corresponds to training the modified UNet for the target task.
- Multi-modality baseline, which corresponds to training the DualUNet for the target task.
- Evaluation of the proposed data augmentation algorithm, which refers to measuring the impact of applying the data augmentation under two different scenarios: random and adaptive, which are explained in detail in the next section.
2.4. Network Training Details
2.4.1. 5-Fold Cross Validation
2.4.2. Application of the Proposed Augmentation Algorithm
2.4.3. Auxiliary Data Augmentation Techniques
2.4.4. Optimization
2.4.5. Post-Processing
2.5. Evaluation
3. Results
3.1. Single Modality
3.2. Multi Modality
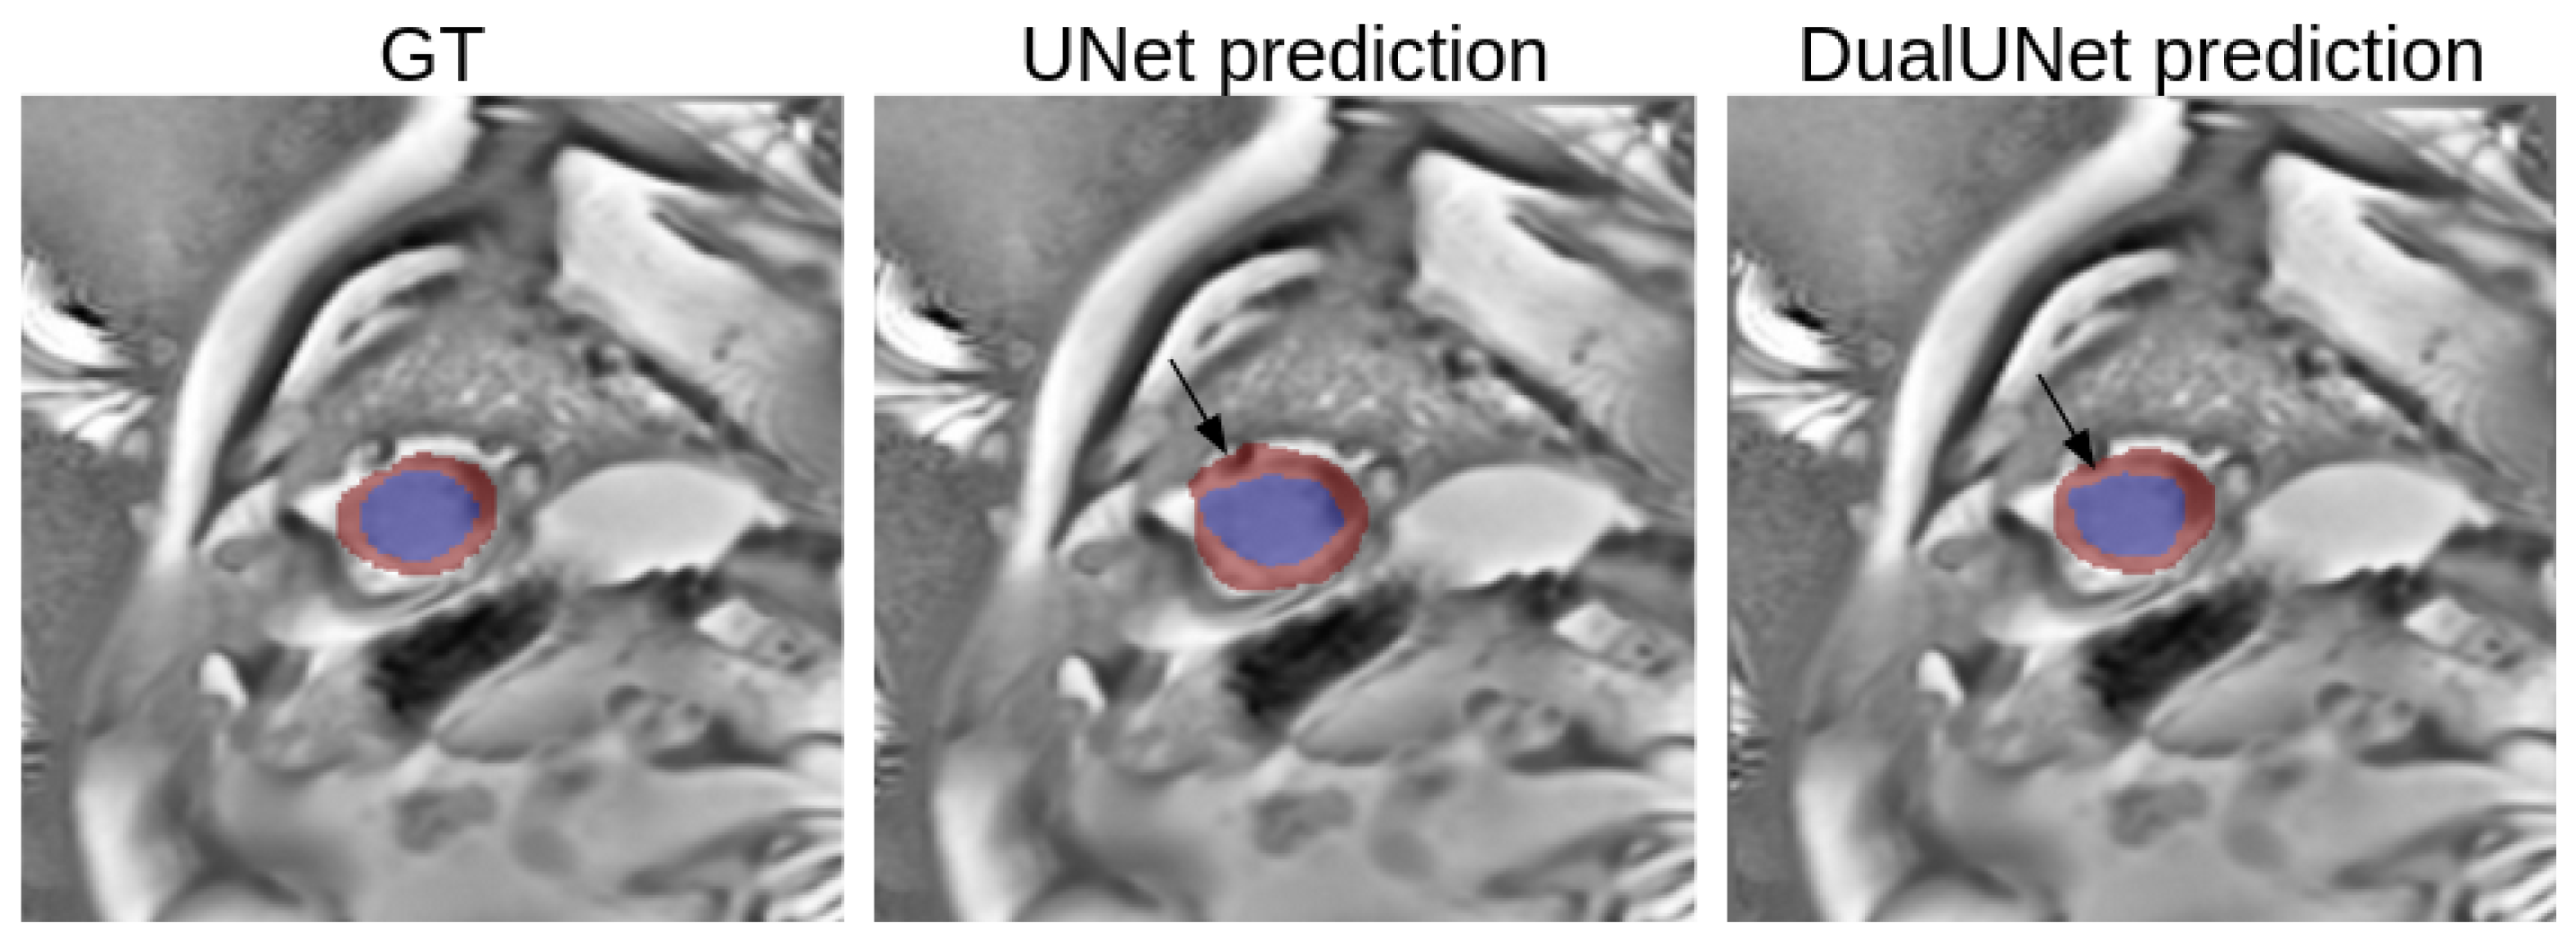
3.3. Single vs. Multi-Modality
3.4. Best Model Further Results
4. Discussion
5. Conclusions
Author Contributions
Funding
Data Availability Statement
Conflicts of Interest
Abbreviations
| Cine MRI | kinetic MRI |
| DE MRI | delayed-enhancement MRI |
| MI | myocardial infarction |
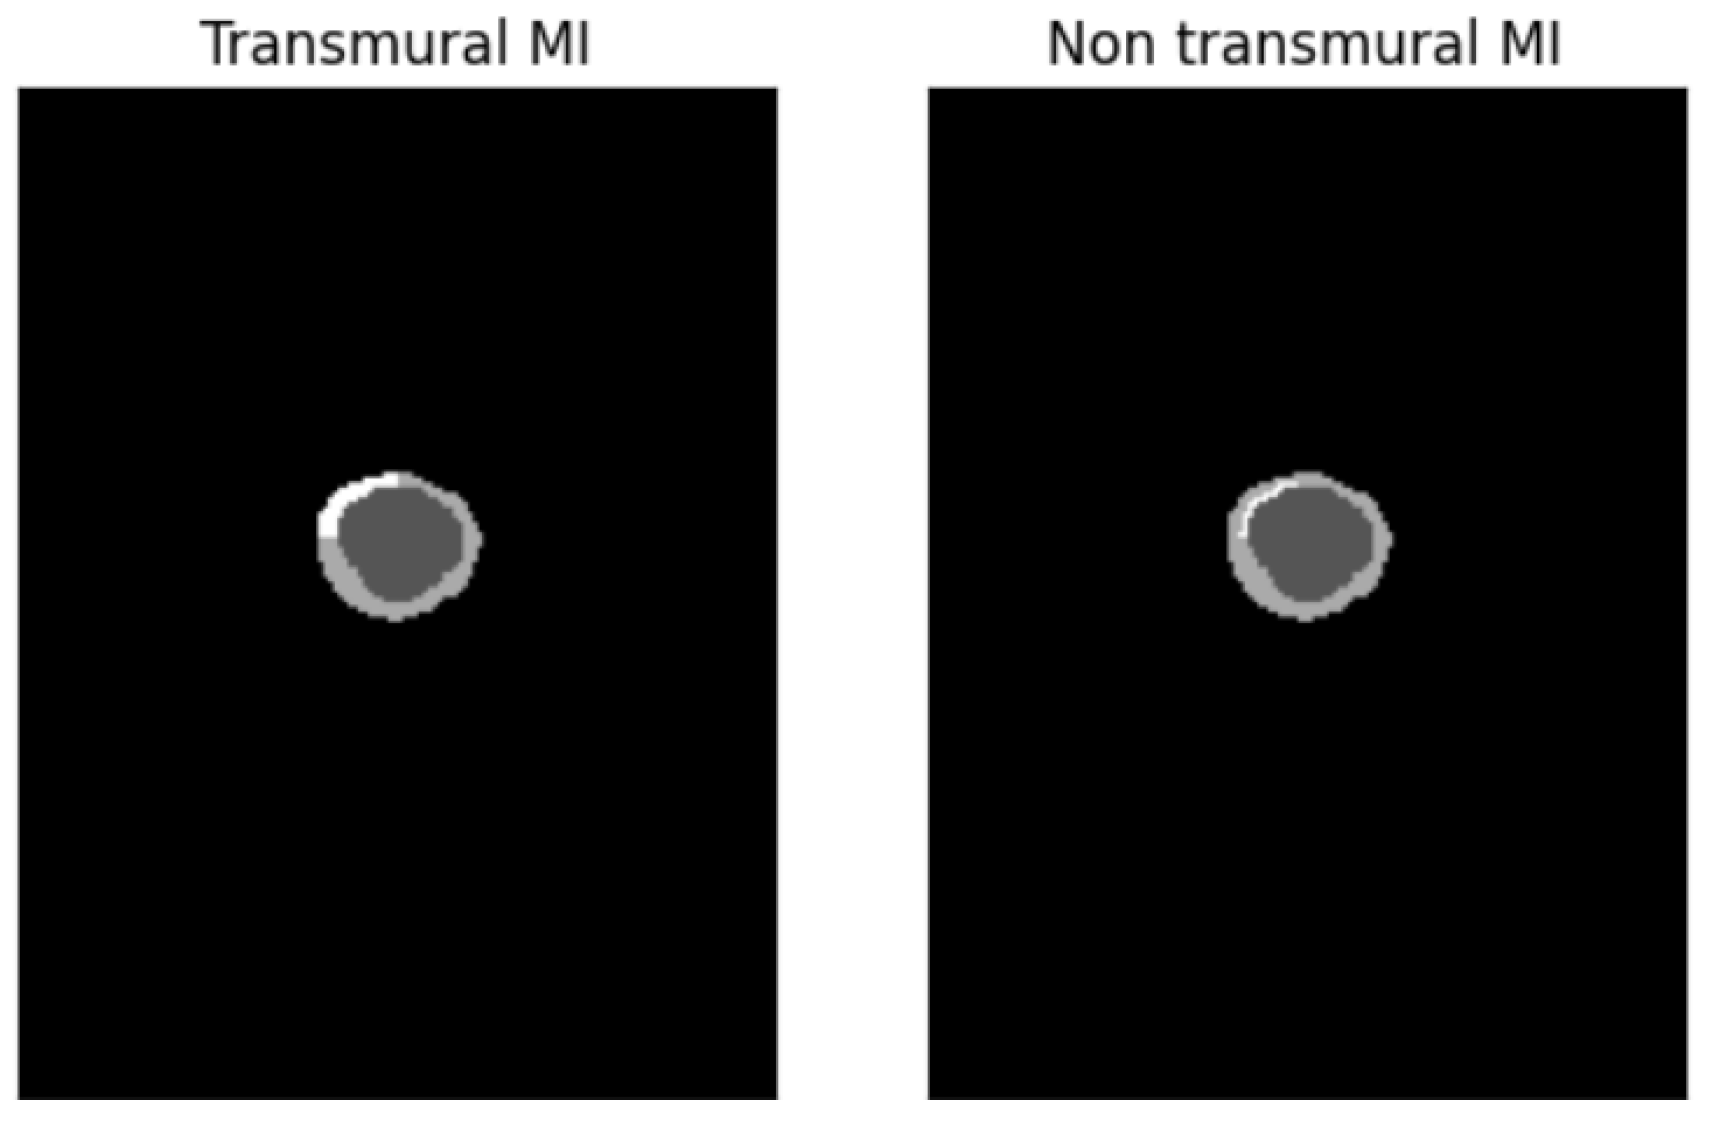
| TMI | transmural myocardial infarction |
| NTMI | non-transmural myocardial infarction |
| BFS | breadth first search |
| CLAHE | contrast-limited adaptive histogram equalization |
| MVO | microvascular obstruction |
| HD | Hausdorff distance |
| DSC | Dice score coefficient |
| CV | left ventricle cavity |
| MYO | myocardium |
| CVD | cardiovascular disease |
| CHD | coronary heart disease |
References
- Mendis, S.; Thygesen, K.; Kuulasmaa, K.; Giampaoli, S.; Mähönen, M.; Ngu Blackett, K.; Lisheng, L.; Writing group on behalf of the participating experts of the WHO consultation for revision of WHO definition of myocardial infarction. World Health Organization definition of myocardial infarction: 2008–09 revision. Int. J. Epidemiol. 2011, 40, 139–146. [Google Scholar] [CrossRef] [PubMed]
- Thygesen, K.; Alpert, J.S.; Jaffe, A.S.; Simoons, M.L.; Chaitman, B.R.; White, H.D. Third universal definition of myocardial infarction. Circulation 2012, 126, 2020–2035. [Google Scholar] [CrossRef] [PubMed]
- Lalande, A.; Chen, Z.; Decourselle, T.; Qayyum, A.; Pommier, T.; Lorgis, L.; de la Rosa, E.; Cochet, A.; Cottin, Y.; Ginhac, D.; et al. Emidec: A database usable for the automatic evaluation of myocardial infarction from delayed-enhancement cardiac MRI. Data 2020, 5, 89. [Google Scholar] [CrossRef]
- Lalande, A.; Chen, Z.; Pommier, T.; Decourselle, T.; Qayyum, A.; Salomon, M.; Ginhac, D.; Skandarani, Y.; Boucher, A.; Brahim, K.; et al. Deep learning methods for automatic evaluation of delayed enhancement-MRI. The results of the EMIDEC challenge. Med. Image Anal. 2022, 79, 102428. [Google Scholar] [CrossRef] [PubMed]
- Thomson, L.E.; Kim, R.J.; Judd, R.M. Magnetic resonance imaging for the assessment of myocardial viability. J. Magn. Reson. Imaging Off. J. Int. Soc. Magn. Reson. Med. 2004, 19, 771–788. [Google Scholar] [CrossRef]
- Dikici, E.; O’Donnell, T.; Setser, R.; White, R.D. Quantification of delayed enhancement MR images. In Medical Image Computing and Computer-Assisted Intervention–MICCAI 2004: 7th International Conference, Saint-Malo, France, September 26–29, 2004. Proceedings, Part I 7; Springer International Publishing: Cham, Switzerland, 2004; pp. 250–257. [Google Scholar]
- Ciofolo, C.; Fradkin, M.; Mory, B.; Hautvast, G.; Breeuwer, M. Automatic myocardium segmentation in late-enhancement MRI. In Proceedings of the 2008 5th IEEE International Symposium on Biomedical Imaging: From Nano to Macro, Paris, France, 14–17 May 2008; pp. 225–228. [Google Scholar]
- Huellebrand, M.; Ivantsits, M.; Zhang, H.; Kohlmann, P.; Kuhnigk, J.M.; Kuehne, T.; Schönberg, S.; Hennemuth, A. Comparison of a hybrid mixture model and a cnn for the segmentation of myocardial pathologies in delayed enhancement MRI. In Statistical Atlases and Computational Models of the Heart. M&Ms and EMIDEC Challenges: 11th International Workshop, STACOM 2020, Held in Conjunction with MICCAI 2020, Lima, Peru, October 4, 2020, Revised Selected Papers 11; Springer International Publishing: Cham, Switzerland, 2021; pp. 319–327. [Google Scholar]
- Zhou, T.; Ruan, S.; Canu, S. A review: Deep learning for medical image segmentation using multi-modality fusion. Array 2019, 3, 100004. [Google Scholar] [CrossRef]
- Ouadah, C.; Hadadi, A.; Lalande, A.; Leclerc, S. Comparison of CNN Fusion Strategies for Left Ventricle Segmentation from Multi-modal MRI. In International Conference on Functional Imaging and Modeling of the Heart; Springer Nature: Cham, Switzerland, 2023; pp. 265–273. [Google Scholar]
- Xue, Y.; Farhat, F.G.; Boukrina, O.; Barrett, A.; Binder, J.R.; Roshan, U.W.; Graves, W.W. A multi-path 2.5 dimensional convolutional neural network system for segmenting stroke lesions in brain MRI images. Neuroimage Clin. 2020, 25, 102118. [Google Scholar] [CrossRef]
- Chen, C.; Qin, C.; Ouyang, C.; Li, Z.; Wang, S.; Qiu, H.; Chen, L.; Tarroni, G.; Bai, W.; Rueckert, D. Enhancing MR image segmentation with realistic adversarial data augmentation. Med. Image Anal. 2022, 82, 102597. [Google Scholar] [CrossRef] [PubMed]
- Lin, A.; Wu, J.; Yang, X. A data augmentation approach to train fully convolutional networks for left ventricle segmentation. Magn. Reson. Imaging 2020, 66, 152–164. [Google Scholar] [CrossRef] [PubMed]
- Skandarani, Y.; Painchaud, N.; Jodoin, P.M.; Lalande, A. On the effectiveness of GAN generated cardiac MRIs for segmentation. In Proceedings of the Medical Imaging with Deep Learning Conference, Montreal, QC, Canada, 6–8 July 2020. [Google Scholar]
- Goodfellow, I.; Pouget-Abadie, J.; Mirza, M.; Xu, B.; Warde-Farley, D.; Ozair, S.; Courville, A.; Bengio, Y. Generative adversarial networks. Commun. ACM 2020, 63, 139–144. [Google Scholar] [CrossRef]
- Ronneberger, O.; Fischer, P.; Brox, T. U-net: Convolutional networks for biomedical image segmentation. In Medical Image Computing and Computer-Assisted Intervention–MICCAI 2015: 18th International Conference, Munich, Germany, October 5–9, 2015, Proceedings, Part III 18; Springer International Publishing: Cham, Switzerland, 2015; pp. 234–241. [Google Scholar]
- Rukundo, O. Effects of image size on deep learning. Electronics 2023, 12, 985. [Google Scholar] [CrossRef]
- American Heart Association Writing Group on Myocardial Segmentation and Registration for Cardiac Imaging; Cerqueira, M.D.; Weissman, N.J.; Dilsizian, V.; Jacobs, A.K.; Kaul, S.; Laskey, W.K.; Pennell, D.J.; Rumberger, J.A.; Ryan, T.; et al. Standardized myocardial segmentation and nomenclature for tomographic imaging of the heart: A statement for healthcare professionals from the Cardiac Imaging Committee of the Council on Clinical Cardiology of the American Heart Association. Circulation 2002, 105, 539–542. [Google Scholar]
- Bresenham, J.E. Algorithm for computer control of a digital plotter. IBM Syst. J. 1965, 4, 25–30. [Google Scholar] [CrossRef]
- Cormen, T.H.; Leiserson, C.E.; Rivest, R.L.; Stein, C. Introduction to Algorithms; MIT Press: Cambridge, MA, USA, 2022; Chapter 20; pp. 554–562. [Google Scholar]
- Pizer, S.M.; Amburn, E.P.; Austin, J.D.; Cromartie, R.; Geselowitz, A.; Greer, T.; ter Haar Romeny, B.; Zimmerman, J.B.; Zuiderveld, K. Adaptive histogram equalization and its variations. Comput. Vision, Graph. Image Process. 1987, 39, 355–368. [Google Scholar] [CrossRef]
- Kingma, D.P.; Ba, J. Adam: A method for stochastic optimization. arXiv 2014, arXiv:1412.6980. [Google Scholar]
- Wilcoxon, F. Individual Comparisons by Ranking Methods; Springer: Berlin/Heidelberg, Germany, 1992; pp. 191–195. [Google Scholar]


| UNet | UNet-50% DA | UNet-100% DA | UNet-200% DA | UNet-ADA |
|---|---|---|---|---|
| 0.834 ± 0.056 | 0.838 ± 0.065 | 0.844 ± 0.058 | 0.845 ± 0.052 | 0.843 ± 0.051 |
| DualUNet | DualUNet-50% DA | DualUNet-100% DA | DualUNet-200% DA | DualUNet-ADA |
|---|---|---|---|---|
| 0.845 ± 0.044 | 0.847 ± 0.046 | 0.856 ± 0.040 | 0.852 ± 0.042 | 0.853 ± 0.039 |
| DualUNet DSC | DualUNet (100% DA) DSC | DualUNet HD (mm) | DualUNet (100% DA) HD (mm) | ||
|---|---|---|---|---|---|
| 0.845 ± 0.044 | 0.856 ± 0.040 | Endocardium | 5.73 ± 2.12 | Endocardium | 5.77 ± 2.23 |
| Epicardium | 6.08 ± 1.75 | Epicardium | 5.90 ± 1.93 | ||
Disclaimer/Publisher’s Note: The statements, opinions and data contained in all publications are solely those of the individual author(s) and contributor(s) and not of MDPI and/or the editor(s). MDPI and/or the editor(s) disclaim responsibility for any injury to people or property resulting from any ideas, methods, instructions or products referred to in the content. |
© 2023 by the authors. Licensee MDPI, Basel, Switzerland. This article is an open access article distributed under the terms and conditions of the Creative Commons Attribution (CC BY) license (https://creativecommons.org/licenses/by/4.0/).
Share and Cite
Mosquera-Rojas, G.E.; Ouadah, C.; Hadadi, A.; Lalande, A.; Leclerc, S. Automatic Myocardium Segmentation in Delayed-Enhancement MRI with Pathology-Specific Data Augmentation and Deep Learning Architectures. Algorithms 2023, 16, 488. https://doi.org/10.3390/a16100488
Mosquera-Rojas GE, Ouadah C, Hadadi A, Lalande A, Leclerc S. Automatic Myocardium Segmentation in Delayed-Enhancement MRI with Pathology-Specific Data Augmentation and Deep Learning Architectures. Algorithms. 2023; 16(10):488. https://doi.org/10.3390/a16100488
Chicago/Turabian StyleMosquera-Rojas, Gonzalo E., Cylia Ouadah, Azadeh Hadadi, Alain Lalande, and Sarah Leclerc. 2023. "Automatic Myocardium Segmentation in Delayed-Enhancement MRI with Pathology-Specific Data Augmentation and Deep Learning Architectures" Algorithms 16, no. 10: 488. https://doi.org/10.3390/a16100488
APA StyleMosquera-Rojas, G. E., Ouadah, C., Hadadi, A., Lalande, A., & Leclerc, S. (2023). Automatic Myocardium Segmentation in Delayed-Enhancement MRI with Pathology-Specific Data Augmentation and Deep Learning Architectures. Algorithms, 16(10), 488. https://doi.org/10.3390/a16100488