1. Introduction
Primary hyperparathyroidism (pHPT) is a common calcium metabolism disorder mainly affecting middle-aged females. It usually presents as a sporadic disease, while hereditary forms are much less common [
1]. A hyper-functioning solitary parathyroid adenoma accounts for 80–85% of pHPT, while multiple abnormally functioning parathyroid glands (multiglandular disease) are responsible for the rest of the cases [
2]. The diagnosis of pHPT is established biochemically by documenting increased serum calcium and parathyroid hormone levels and excluding causes of secondary HPT [
3]. Despite using calcimimetic drugs to lower serum calcium and parathyroid hormone levels, the surgical excision of abnormal parathyroid glands (PGs) is currently the irreplaceable remedy for HPT [
4]. Severe secondary HPT is caused primarily by end-stage renal failure. In this situation, all PGs are enlarged, each to a different degree.
Pre-operative localisation of abnormal PGs is highly desired to assist surgery [
5,
6]. Neck ultrasound, parathyroid scintigraphy, dynamic contrast-enhanced computerised tomography (CT), 4-D CT, and magnetic resonance imaging (MRI) are the imaging modalities for this task [
7]. Employing neck ultrasound and scintigraphy as the first diagnostic approach is common. The other imaging methods are usually reserved for negative or ambiguous results [
8].
Parathyroid scintigraphy is performed with the intravenous injection of the radioactive tracer
99mTc-Sestamibi (MIBI) [
9]. Two scintigraphic techniques are usually employed, dual-phase and thyroid subtraction [
10]. The dual-phase technique includes acquiring early (10 min post-MIBI administration) and late (2 h post-injection) images of the neck and the mediastinum. MIBI uptake by the thyroid gland challenges the identification of an underlying parathyroid adenoma in early images. However, prolonged tracer retention by most abnormal PGs facilitates their detection in late images because MIBI clears more rapidly from the normal thyroid [
11].
Nevertheless, quick tracer washout from some PGs is a usual cause of false negative findings [
11]. To address this issue, doctors use the thyroid subtraction technique, which involves the administration of a second radioactive tracer (
123I or
99mTc-pertechnetate) to depict the thyroid gland [
12]. The thyroid image is digitally removed from early MIBI images. This helps avoid false-positive results caused by MIBI uptake in thyroid nodules. The techniques can be used separately or together. Single-photon emission computerised tomography (SPECT) or SPECT/CT imaging is also employed to enhance sensitivity and obtain precise location information in three-dimensional space [
9].
Medical experts examine all the produced images. However, the findings are often not prominent or well visualised. As a result, composing the diagnostic report is a time-consuming procedure. Recent progress in artificial intelligence (AI), and more specifically in the subset entitled deep learning (DL) [
13], has demonstrated pioneering methods for classifying and identifying findings of medical importance in medical images of various modalities.
However, due to the absence of human assistance and supervision, DL suffers from the issue of explainability [
14,
15,
16]. The decisions of the algorithms are neither transparent nor interpretable. The latter catalysed the research for explainable methods that combine the capabilities of deep models with the transparency of more traditional approaches. Recently, post hoc explainability algorithms have been proposed to improve the explainability of deep models [
14,
17,
18]. The most intuitive paradigm is that of the gradient-weighted class activation mapping (Grad-CAM) algorithm [
17]. Moreover, the local interpretable model-agnostic explanations (LIME) [
19] algorithm has recently gained attention as well.
The present study proposes a DL approach for identifying abnormal PGs in scintigraphic images. First, an innovative modification of the well-known Virtual Geometry Group (VGG19) convolutional neural network (CNN) network [
20] is proposed to classify scintigraphic images into normal and abnormal classes. The Grad-CAM++ algorithm [
21] is then applied to the trained model to highlight the crucial regions suggested by the model. As a result, the user can understand where the model bases its predictions.
This study is based on previous works by the author team ([
22,
23]). The latter showed that DL could localise abnormal PGs from parathyroid scintigraphy images by implementing the Grad-CAM algorithm. In [
23], a patient-level accuracy of 94.8% in distinguishing between healthy and diseased subjects was observed. However, on a PG-level basis, the model yielded many false-positive findings, resulting in a PG-detection accuracy of 76.5%.
The current study proposes two methods for reducing false-positive findings. Firstly, an innovative modification of ParaNet [
23], ParaNet+, allows more local feature extraction by introducing a dense fusion of extracted features by multiple layers. Secondly, the study employs an improvement of the vanilla Grad-CAM algorithm, which yields more precise results in localising abnormal PGs. Finally, the study performs extensive evaluations of ParaNet+ to assess its stability, parameters, and hyperparameters.
2. Materials and Methods
2.1. Research Methodology
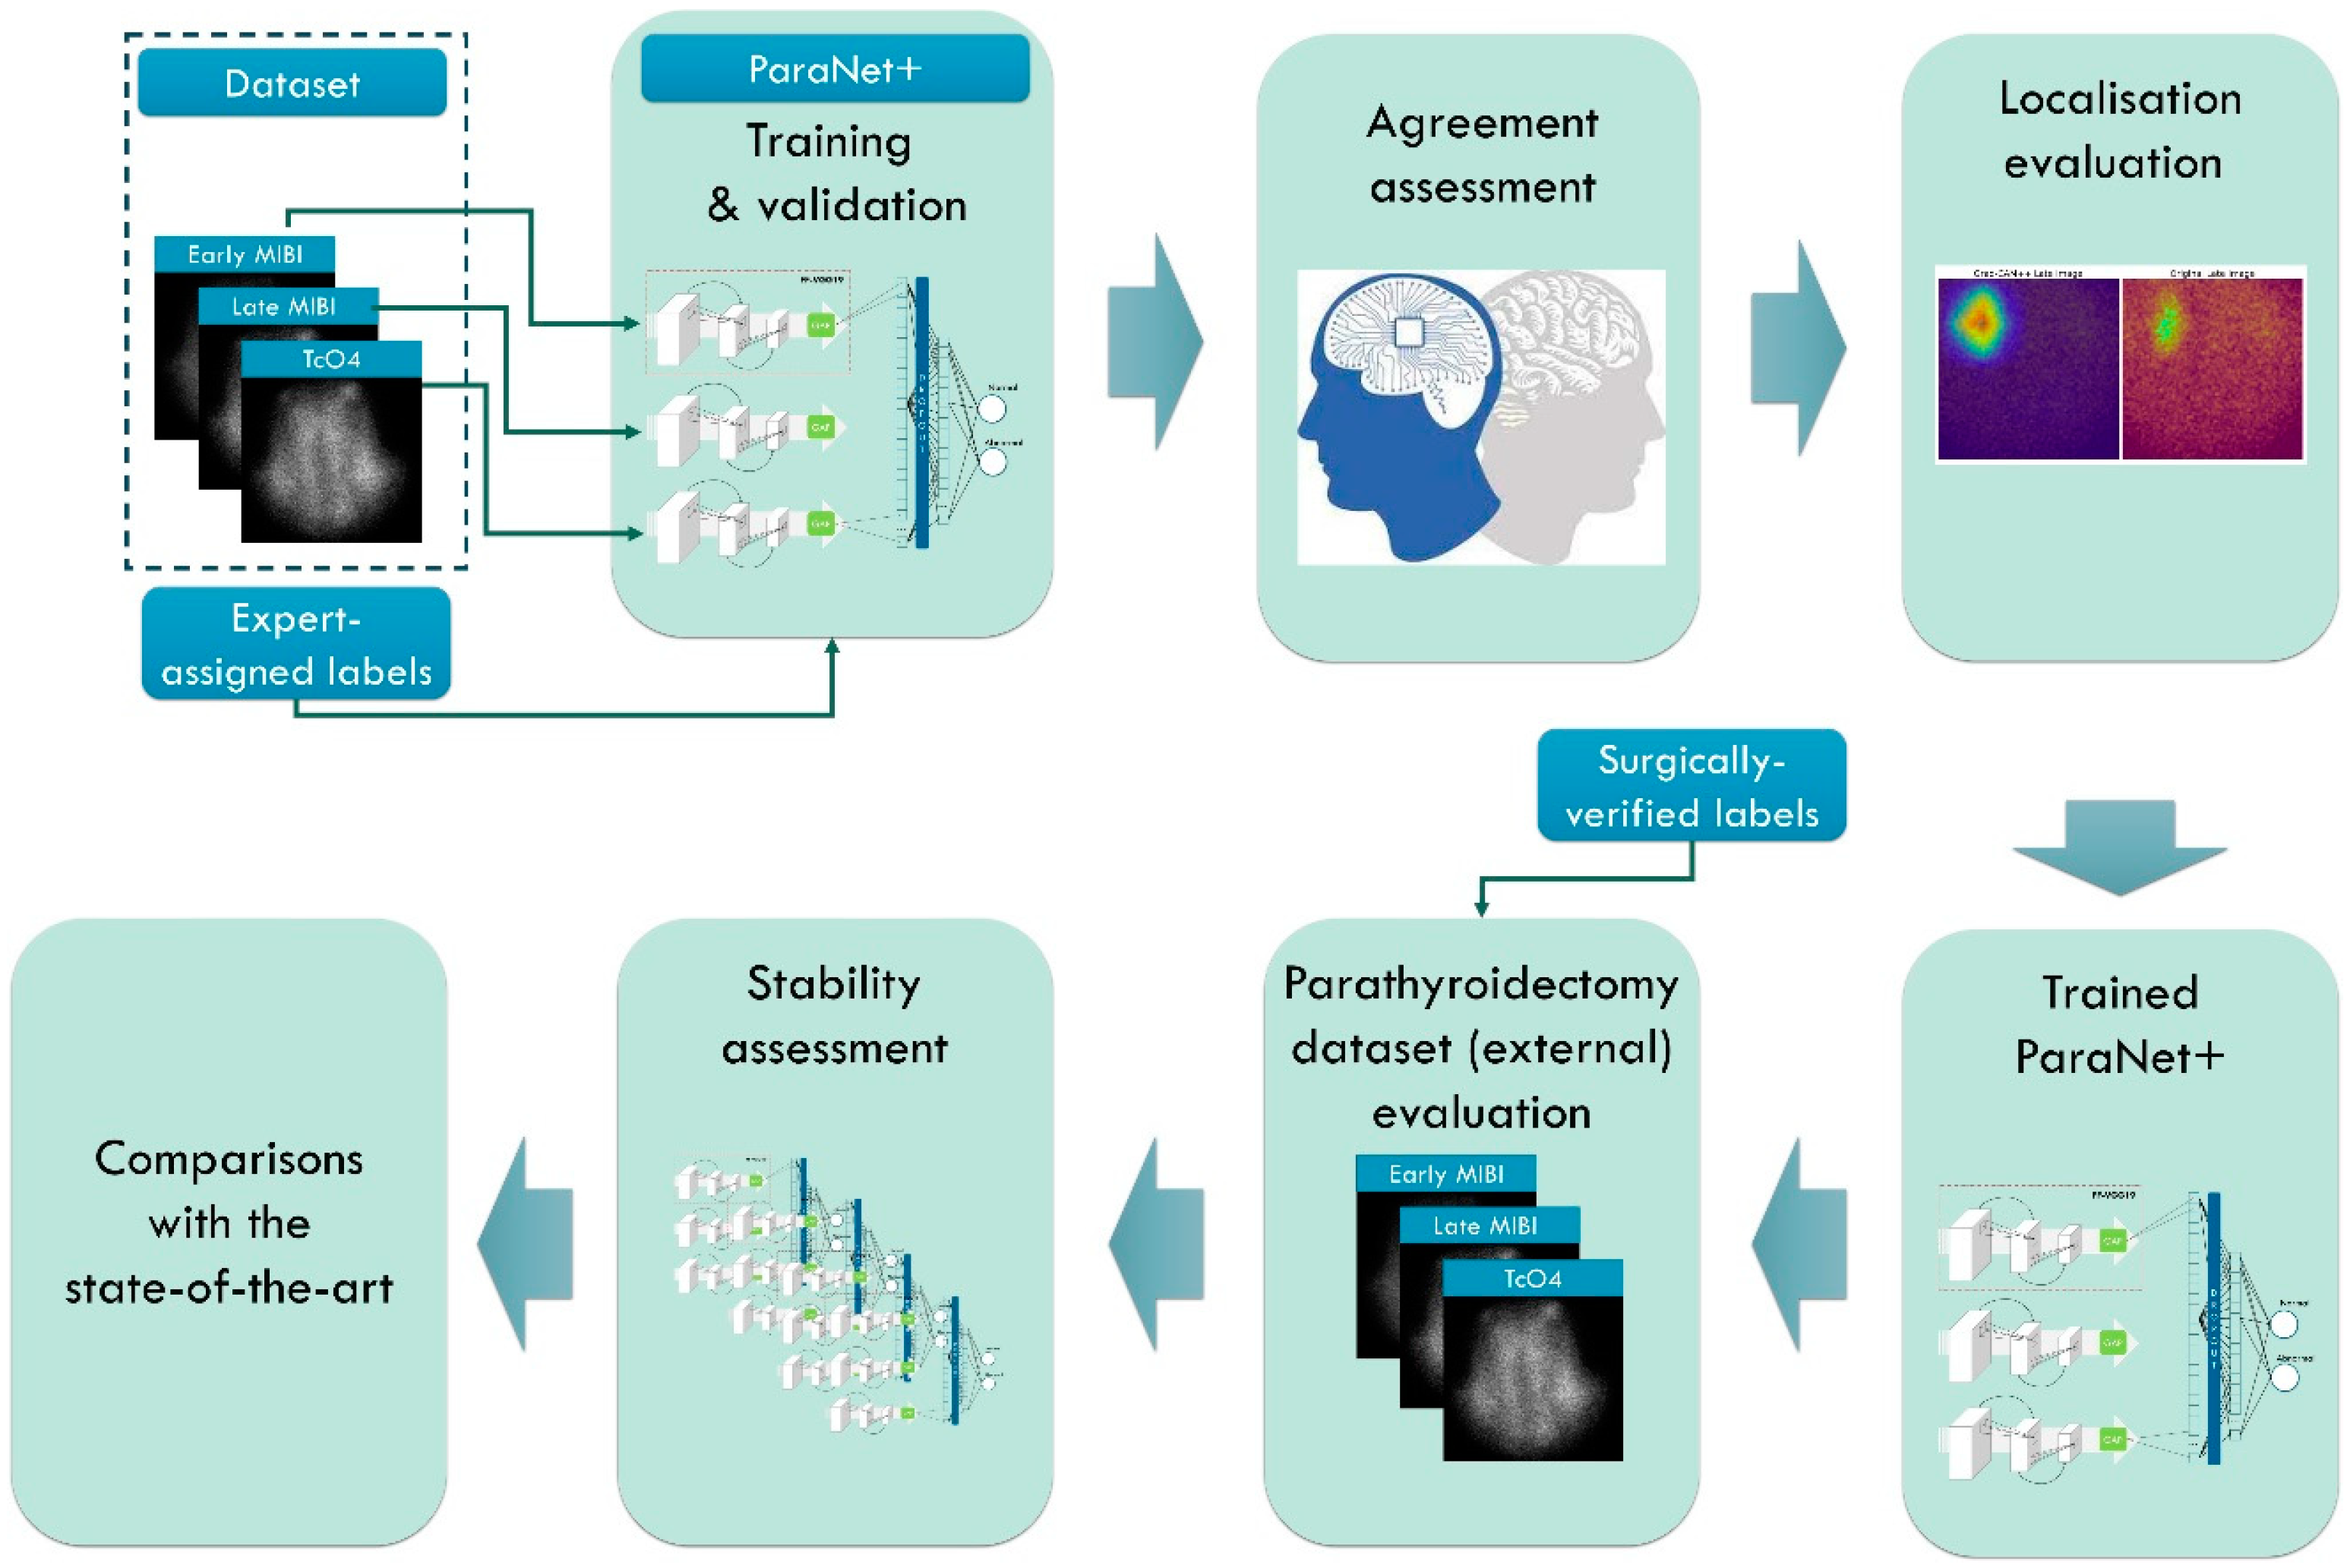
The study’s focal point is the detection of abnormal PGs using the MIBI-early, MIBI-late, and TcO4 images (thyroid scan) accompanying the scintigraphic outcome. Medical experts perform localisation in the everyday routine, compare the three images, and determine positive findings identified on the MIBI-late image. The study involves seven methodological steps, as presented in
Table 1 and
Figure 1.
The first stage involves the necessary data pre-processing to create the study’s dataset. This stage includes region of interest (ROI) reduction and image normalisation. In the second stage, ParaNet+ is deployed to identify normal and abnormal scintigraphic images. Per-patient agreement with the experts is recorded and discussed. The Grad-CAM++ algorithm visualises the essential CNN-suggested features on the MIBI-late image. Medical experts perform a visual assessment during the fourth stage.
The fifth stage involves external testing using patient data from the year 2022. Patient data included 100 surgically verified cases. The assessment is on a patient-level and PG-level basis. The sixth and seventh stages include stability tests and comparisons with state-of-the-art approaches and previous works by the author group.
2.2. Dataset and Imaging Techniques
Patras is the third-biggest city in Greece, accounting for approximately 200,000 inhabitants. Medical services of our institution expand to a broader geographical area, including a population of almost 1,000,000. The retrospective study involves 648 confirmed participants with pHPT, 535 females and 113 males, aged 58.1 ± 12.5 years, who underwent parathyroid scintigraphy in the Department of Nuclear Medicine of the University Hospital of Patras, Greece. The period of the study ranges from January 2010 to December 2020. The planar dual-phase technique with 99mTc-Sestamibi was used in all participants.
Moreover, whenever judged necessary by medical experts, the thyroid subtraction technique was also used. The latter refers to 529 cases. 99mTc-pertechnetate (TcO4) for thyroid delineation was administered either after the conclusion of the dual-phase study or on another day.
The prospective external data set comprised 100 consecutive patients (87 females and 13 males), who also underwent scintigraphy in our department. This set differs from the retrospective group because the patients were subsequently subjected to parathyroidectomy in 2021–2022 in our or other surgical units. The results were available for the evaluation of the model on this external dataset.
Table 2 summarises the dataset’s characteristics.
We used a pinhole collimator for planar imaging and placed it 10 cm over the neck. A SPECT/CT imaging session focused on the neck and the mediastinum using a high-sensitivity parallel-hole collimator took place approximately 30 min post-tracer injection. However, only planar imaging data have been included in the present study. Regarding the acquisition device technology, planar and SPECT/CT imaging were performed by the Hawkeye-4 system (General Electric Healthcare, Chicago, IL, USA).
The planar scintigraphic studies were evaluated retrospectively by three experienced Nuclear Medicine physicians (D.J.A, more than 20 years; N.D.P, more than 8 years; and T.I.S., more than 15 years). In a few ambiguous cases, the final decision was reached by consensus.
2.3. Data Pre-Processing and Augmentation
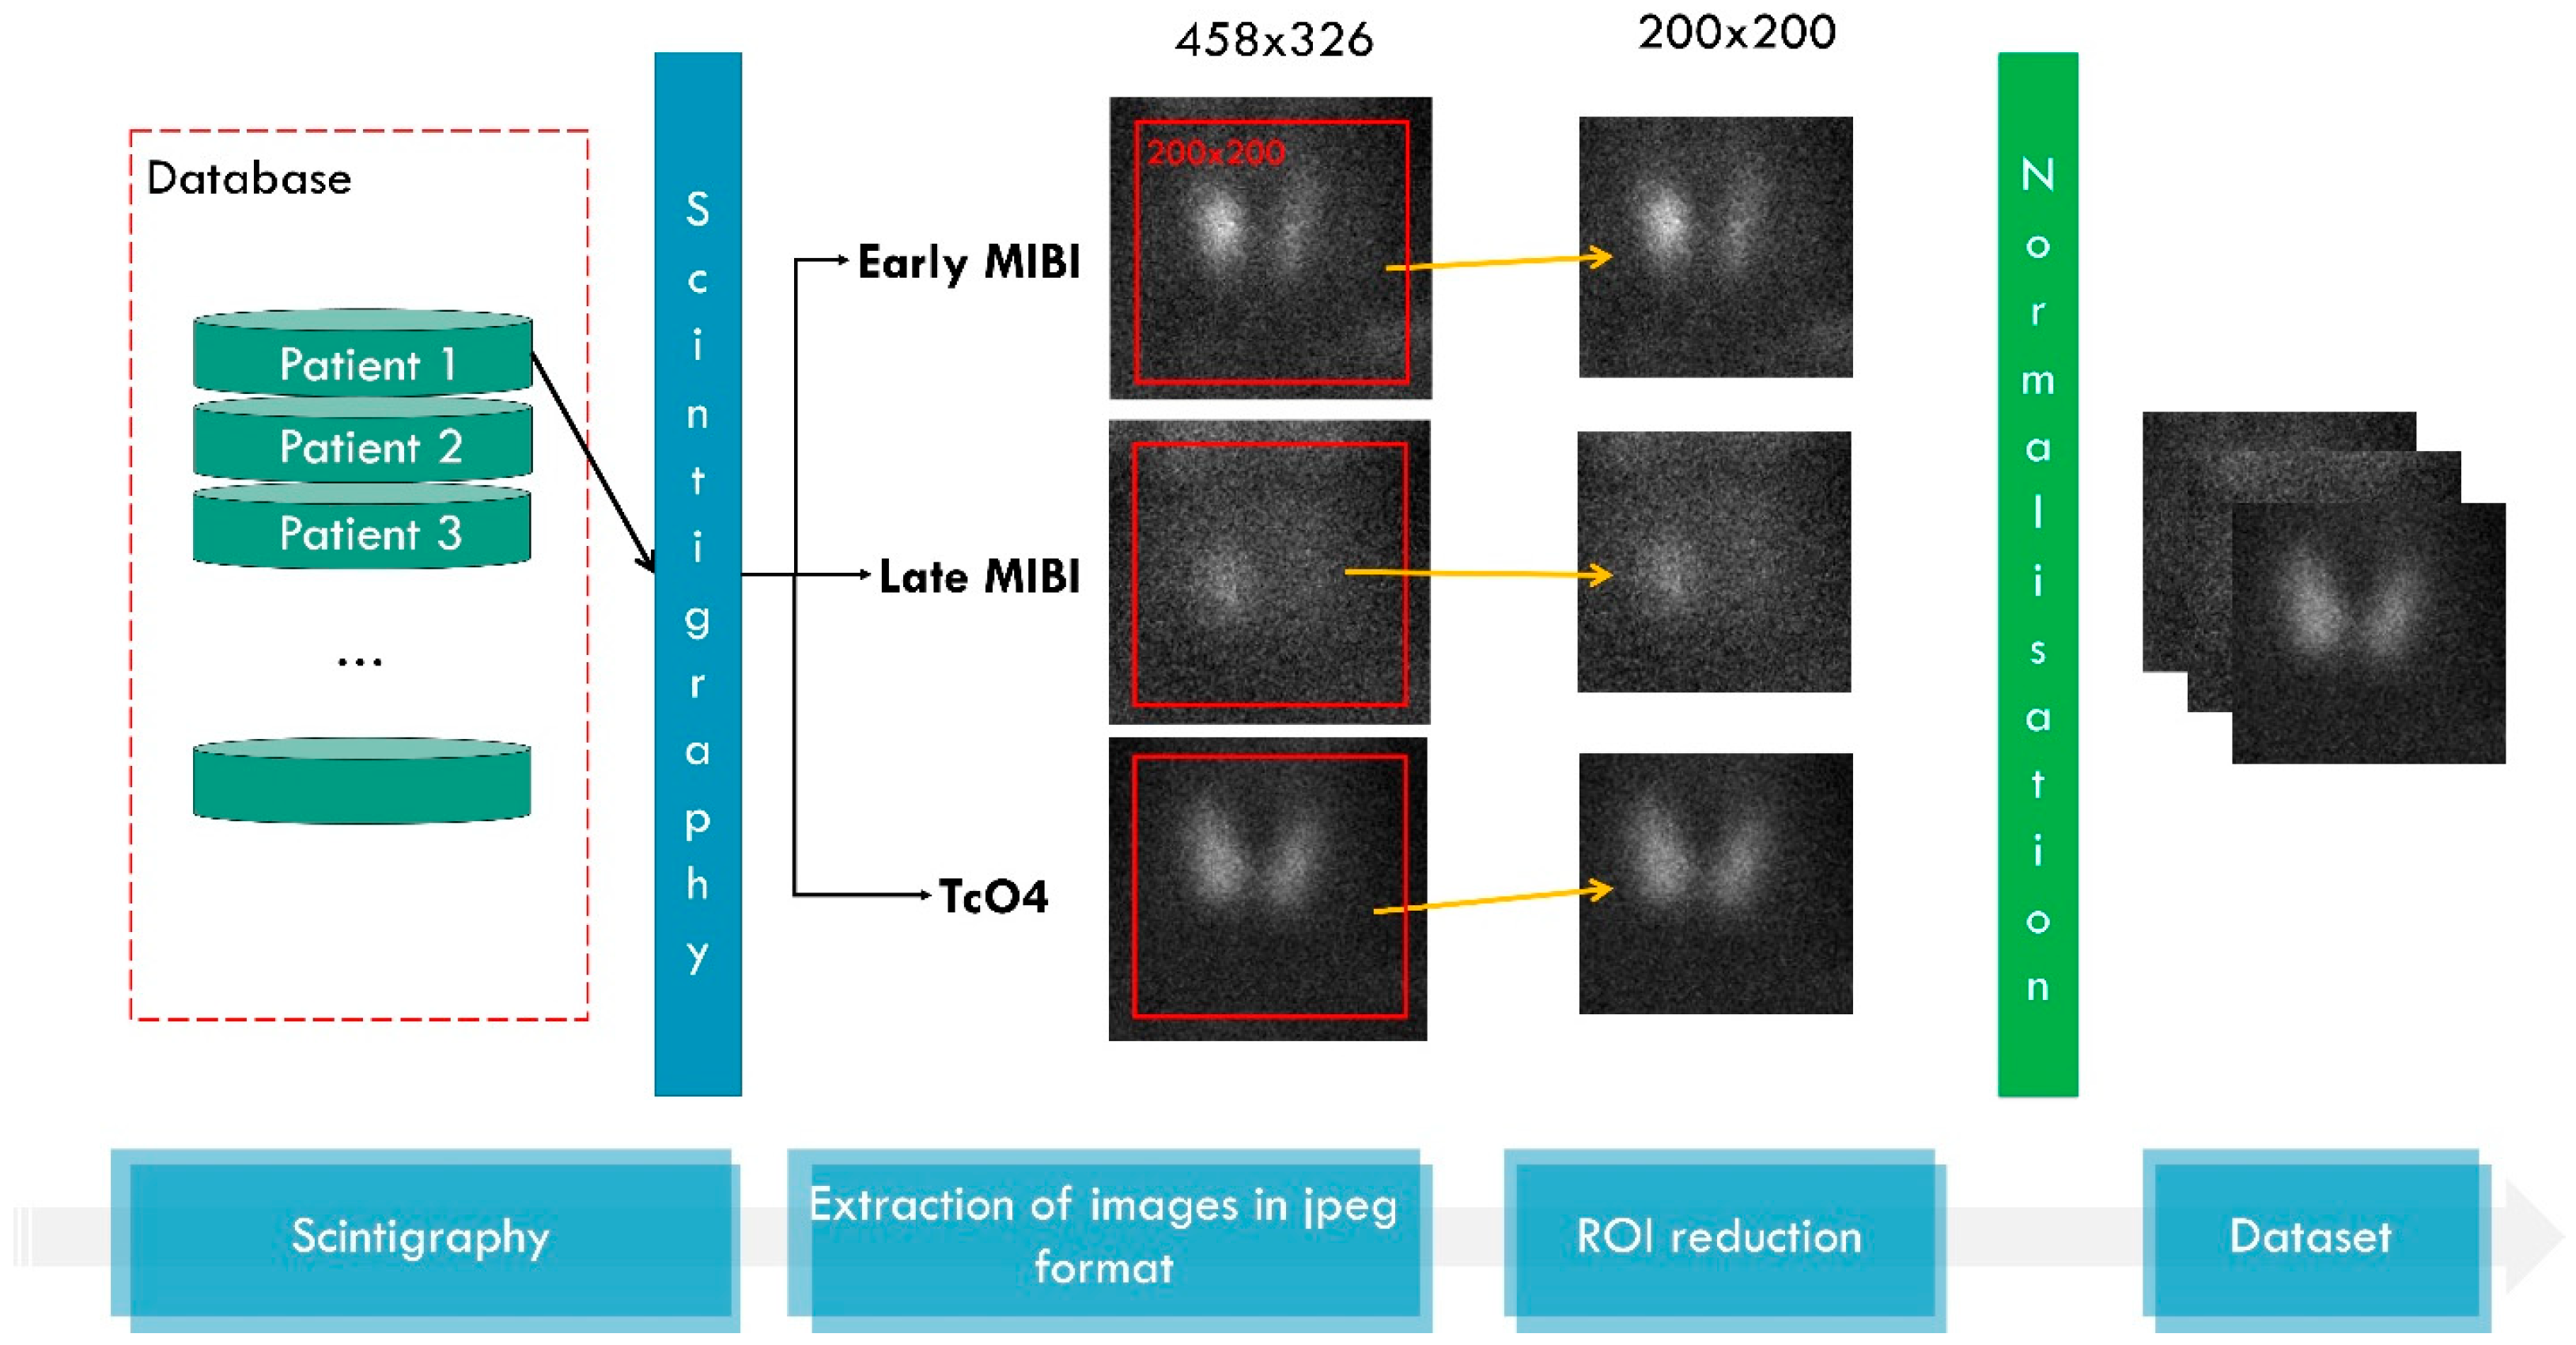
The data pre-processing and dataset creation is illustrated in
Figure 2. The initial scintigraphic images contain artefacts embedded by the image acquisition technology. The reduction of focal regions is, therefore, mandatory. Moreover, the actual ROI is located at the centre of the image, surrounded by a black background, where no information of medical importance exists. Therefore, each image is cropped to 200 × 200 (width, height). Inspection of the images revealed that this area is adequate to fit the complete thyroid without leaving out any area of clinical interest. Normalisation refers to transforming the pixel values, which range from 0 to 255, to the space [0, 1], which is preferable for machine learning (ML) and DL networks and speeds up the training process.
During network training, data augmentation is performed to increase the training images. Data augmentation is essential and benefits the network because it provides multiple versions of the same findings [
24]. In the augmented images, slight geometrical transformations take place. These transformations do not distort the actual finding in the image but introduce variation and help the network focus on the region of interest. Therefore, the network learns to ignore redundant features, such as the orientation of a PG or other irrelevant spatial characteristics. The study proposes slight data augmentations, including rotations by ±5°, width and height shifts by ±10 pixels, and horizontal flips. The image’s distortion and the generation of unrealistic PGs are avoided using these geometric transformations.
2.4. Deep Learning Model
The core of our idea is that a classification DL (ParaNet+) model can learn to identify abnormal PGs in the images and classify new images from the test set or an external set as normal or abnormal. To achieve this, the model should operate with three images as input and one output (the class). However, DL models do not provide explanations for their decisions. Hence, we used the Grad-CAM++ algorithm, which tracks back the decision of the model regarding the class of the image and tries to uncover the important areas of the image, where meaningful image features were found. In this way, we can understand if the model based the decision on the abnormal class based on an actual abnormal PG in the image or not.
2.4.1. ParaNet+
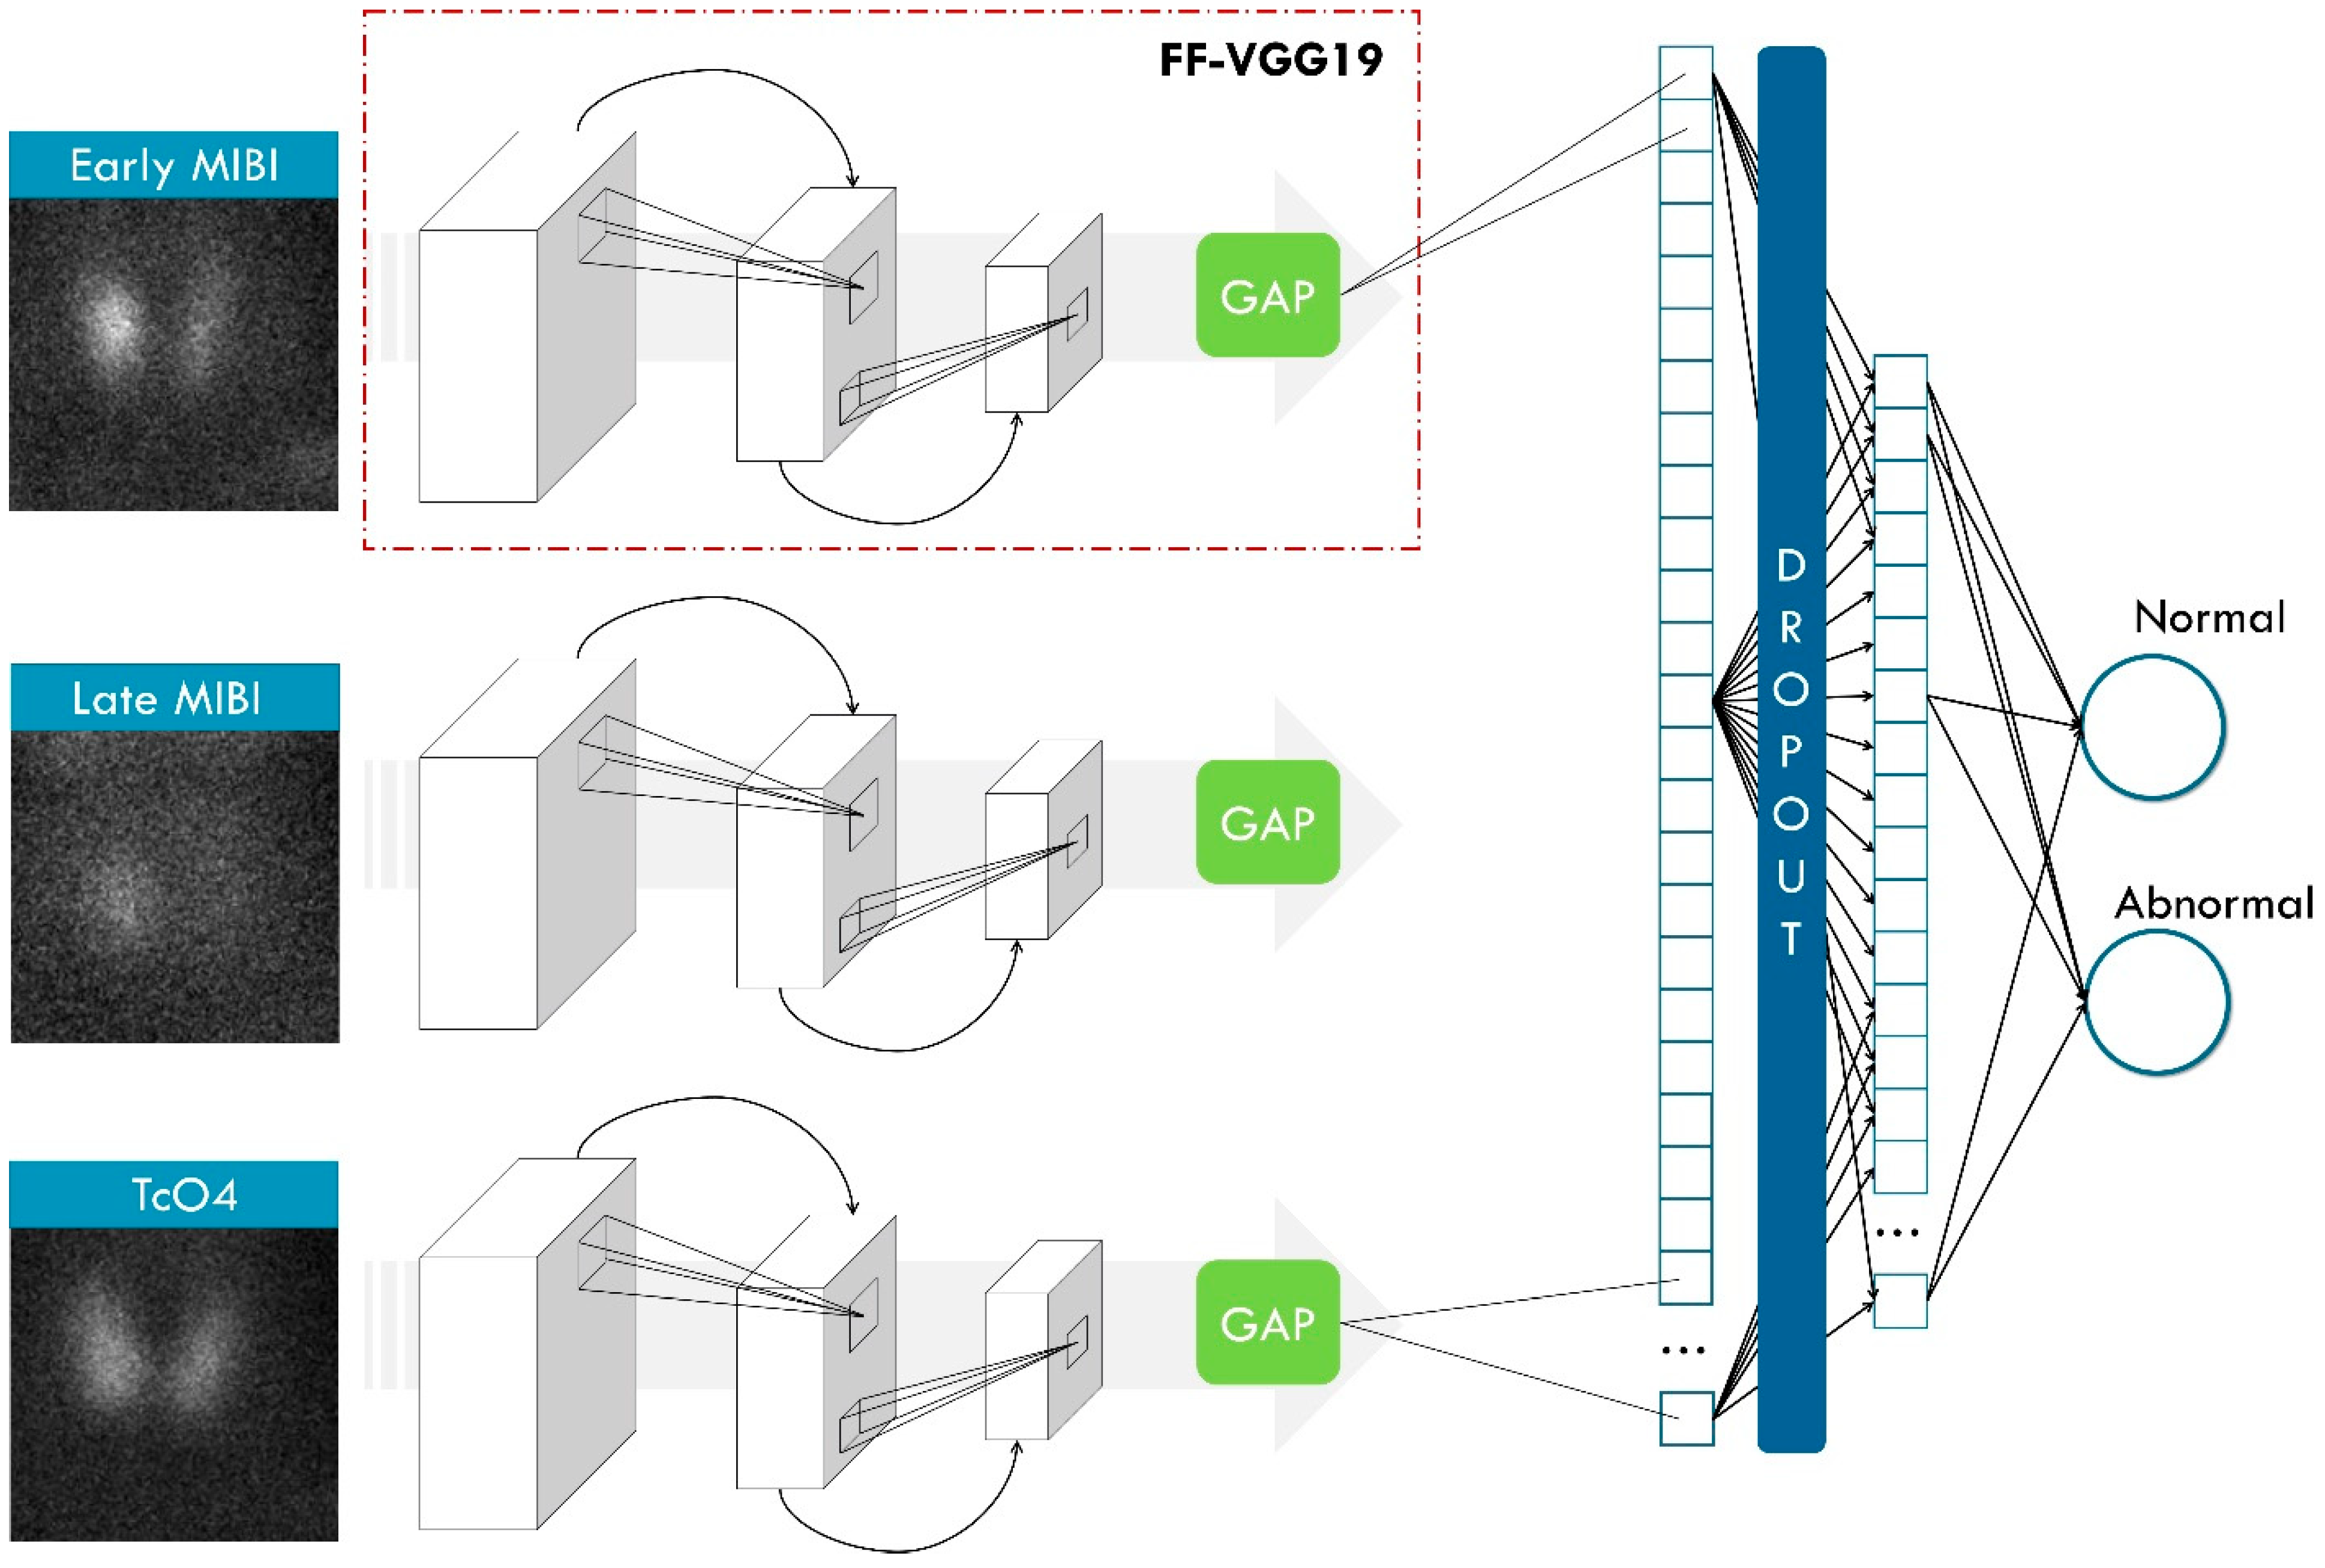
ParaNet+ is a multi-input framework consisting of three CNN components that process the inputs independently. The ParaNet+ version is an improved topology of ParaNet [
23], which utilises the Feature-Fusion VGG19 (FF-VGG19) network [
25] instead of the baseline VGG19.
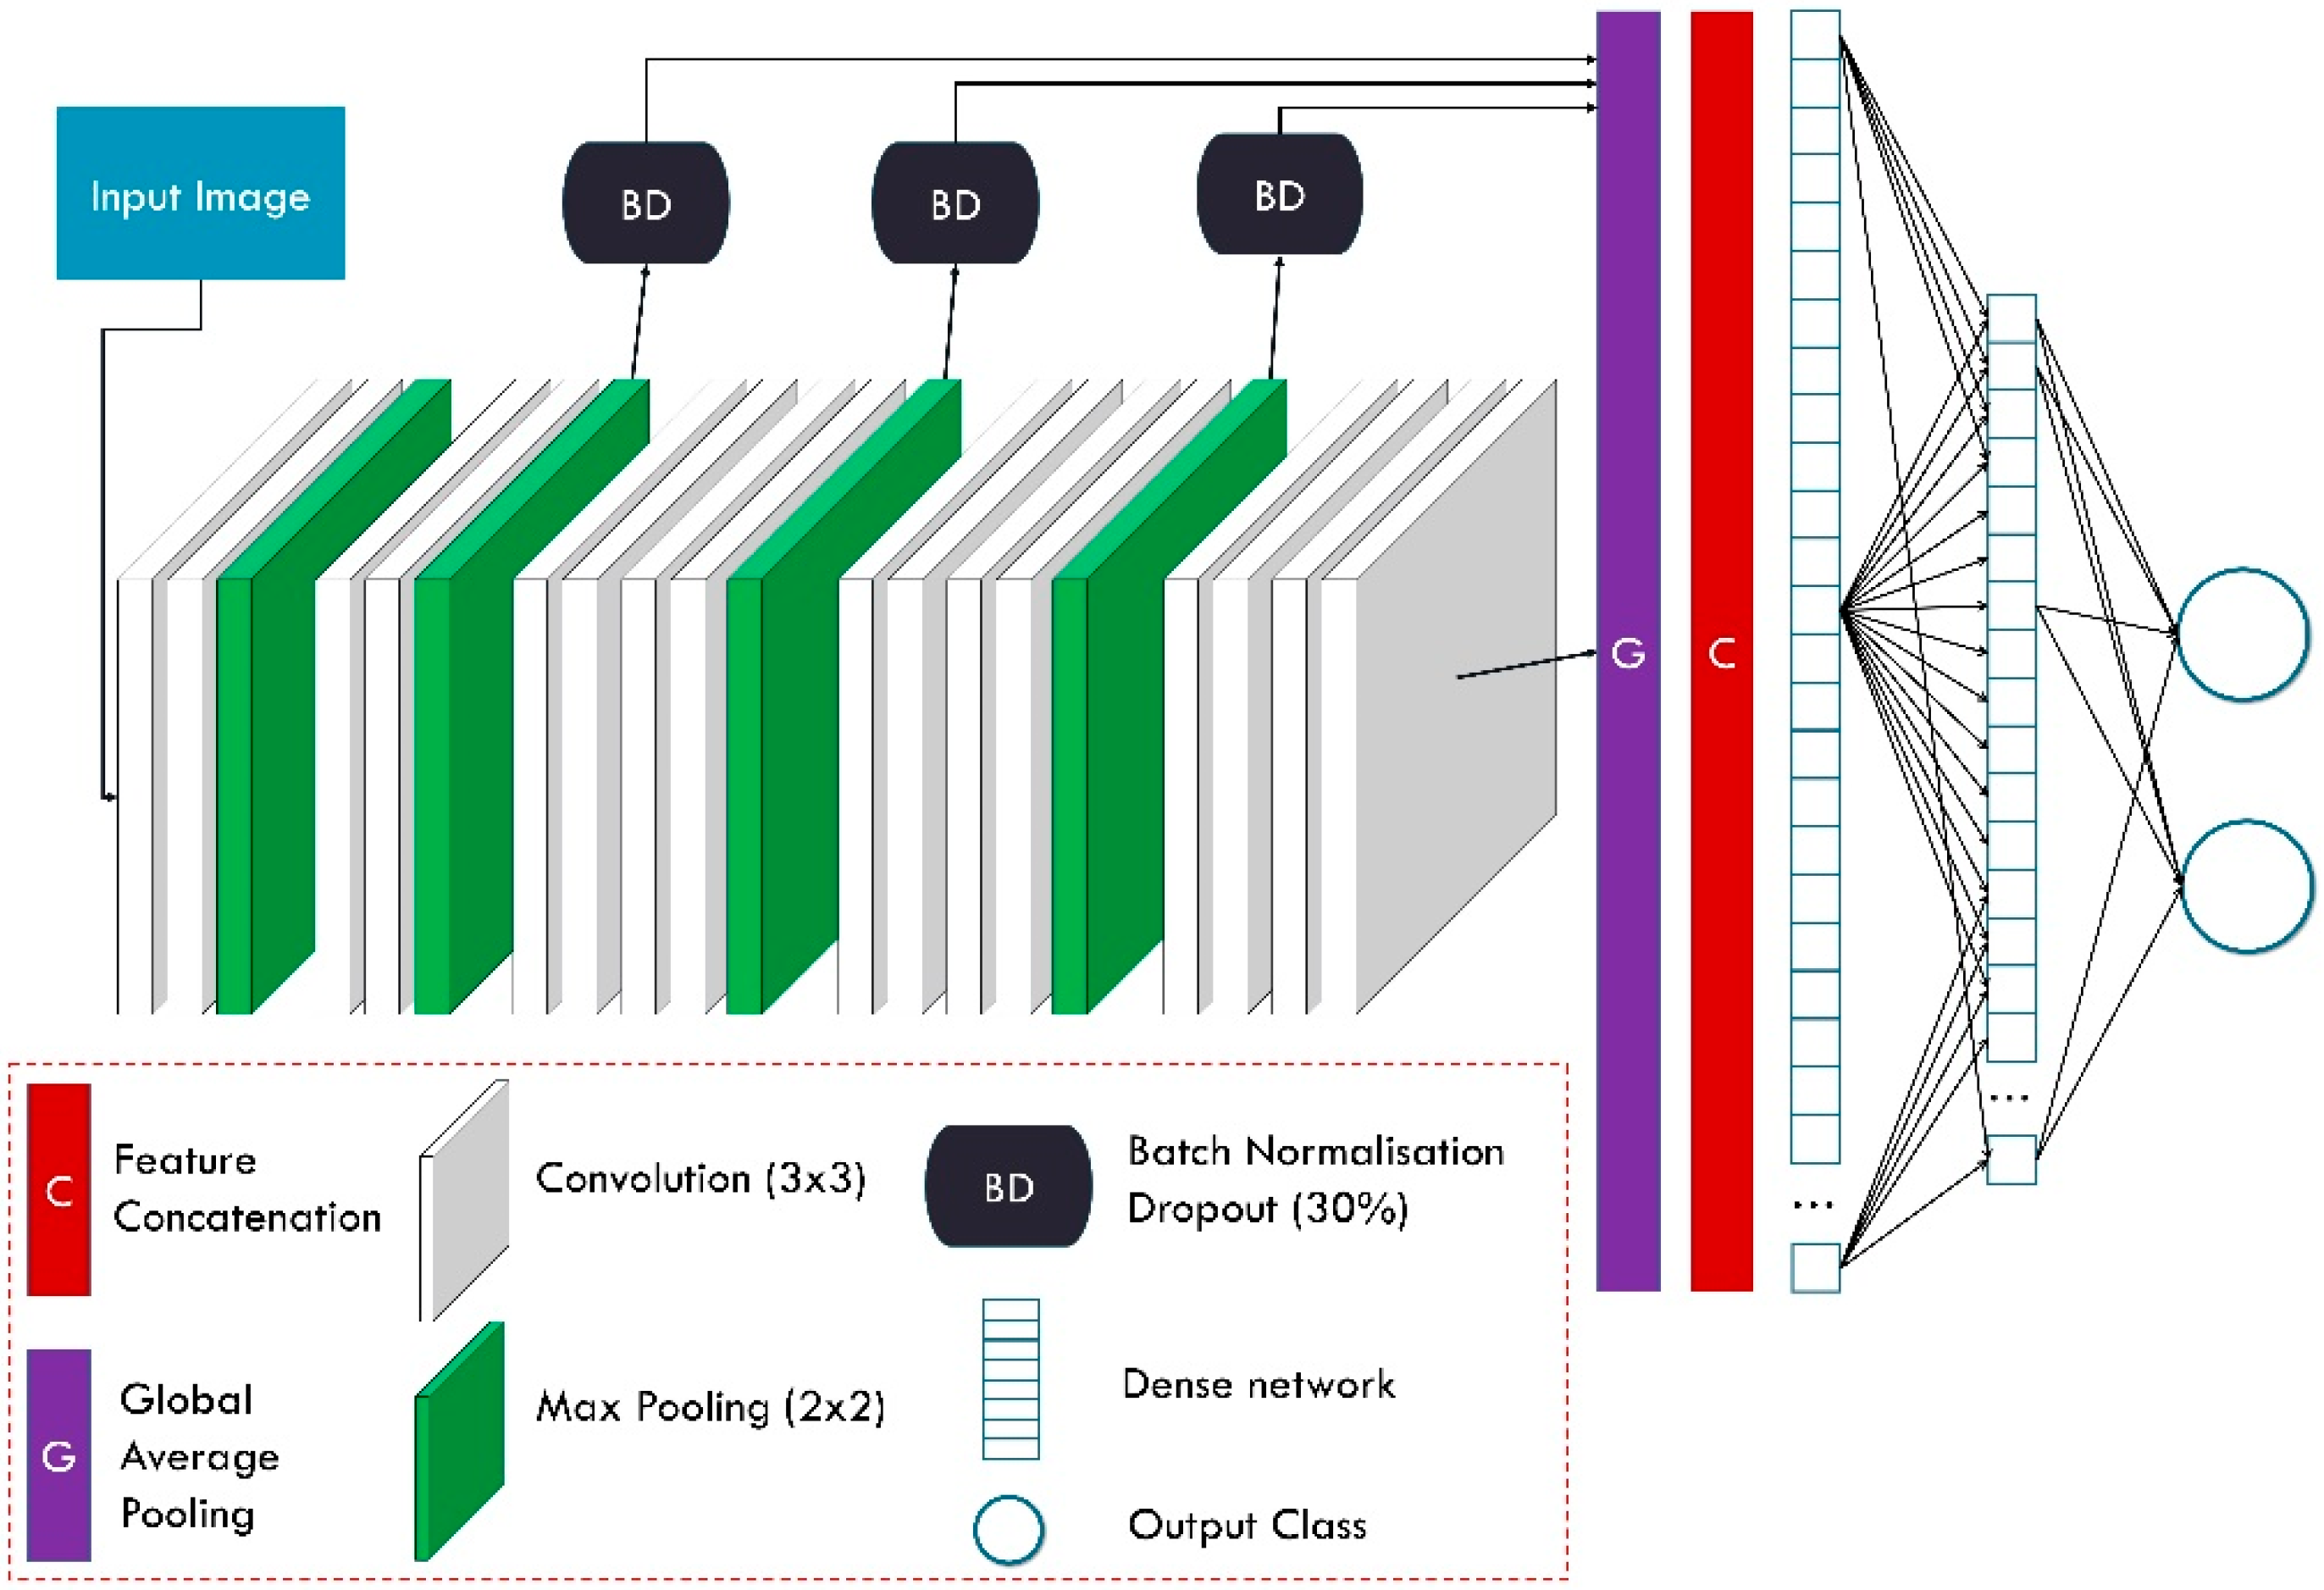
Feature-Fusion VGG19 (FF-VGG19) is the modified version of the well-documented and successful VGG19 network. VGG19 has been employed several times for related tasks. The conception of FF-VGG19 is analytically presented in [
20]. It is a uniform network of 19 layers, which include convolutional and max-pooling operations. The input image is incrementally filtered and hierarchically reduced in size. As a result, thousands of image features are extracted.
FF-VGG19 establishes a direct connection between each convolutional group and the classification layers. Eventually, the classification is based on more features than the baseline VGG19. The utilisation of global pooling layers enables this conception.
Figure 3 illustrates the modified VGG19 component, and
Figure 4 shows the entire ParaNet+ topology. The parameters and hyperparameters are presented in
Table 3.
2.4.2. Gradient-Weighted Class Activation Mapping (Grad-CAM++)
Gradient-based explanation or interpretation constitutes one of the most efficient and lightweight methods for explaining deep networks’ decisions. These methods use gradients to understand how a slight change in the input would affect the output. For example, in CNNs for image classification, local areas of the image are inspected to determine their significance based on the latter conception.
The Grad-CAM algorithm is a technique used for visualising the regions of an image that contribute most to the output of a neural network. The Grad-CAM algorithm generates a class activation map, highlighting the regions of an image that are most relevant for predicting a particular class. First, the network’s output gradients for the final convolutional layer are calculated to create this map. These gradients are then global-average-pooled to obtain the importance weights for each feature map in the last convolutional layer. Finally, the feature maps are weighted by their corresponding importance weights and summed to obtain the class activation map.
The Grad-CAM++ algorithm [
21] is an improved version of Grad-CAM [
17] that improves the localisation of the object of interest in the image. It achieves this by incorporating the second-order gradients of the output for the final convolutional layer, which is done using a Taylor series approximation to estimate the second-order gradients and is then used to refine the importance weights obtained in the first step of the Grad-CAM algorithm.
2.5. Experiment Setup and Evaluation Metrics
The experiments are performed on an NVidia RTX 380 GPU computer with 64 GB of RAM and an Intel Core i9 processor. In addition, the Tensorflow-gpu library has been employed in a Python 3.8 environment.
We considered the 10-fold cross-validation methodology for evaluating the agreement between the experts and the model, using images labelled by the human experts. The performance is assessed based on the total number of true positives (TP), true negatives (TN), false positives (FP), and false negatives (FN). These scores are used to calculate the accuracy, sensitivity, specificity, and positive and negative predictive values (PPV and NPV, respectively). Moreover, the F1 and AUC scores are reported. The F1 score is a commonly used metric in machine learning to evaluate the performance of a classification model. It measures the model’s accuracy, considering both precision and recall. Precision is the ratio of true positive predictions to the total number of positive predictions. At the same time, recall is the ratio of true positive predictions to the total number of actual positive instances. The F1 score is the harmonic mean of precision and recall.
3. Results
3.1. Agreement with the Experts on a Patient-Level and PG-Level Basis in the 2010–2020 Group
According to experts’ diagnosis, the 2010–2020 dataset consisted of 198 subjects with no abnormal findings and 450 with at least one abnormal finding. The experts identified 504 abnormal PGs in the 450 abnormal scintigraphic scans. These findings were the ground truth for estimating the model’s performance.
Table 4 presents the results.
On a patient-level basis, the model attains an accuracy of 0.9861, a sensitivity of 0. 9889, and a specificity of 0.9798. The PPV and NPV values are 0.9911 and 0.9749, respectively. The high F1 score (0.99) indicates that the model is not biased towards the majority class despite the class imbalance issue. The number of false positives was four, and the number of false negatives was five on a patient-level basis. The reader should note that the reported metrics are computed based on human-reader labelling. Therefore, the current experiment measures the agreement between the model and the experts’ verdict.
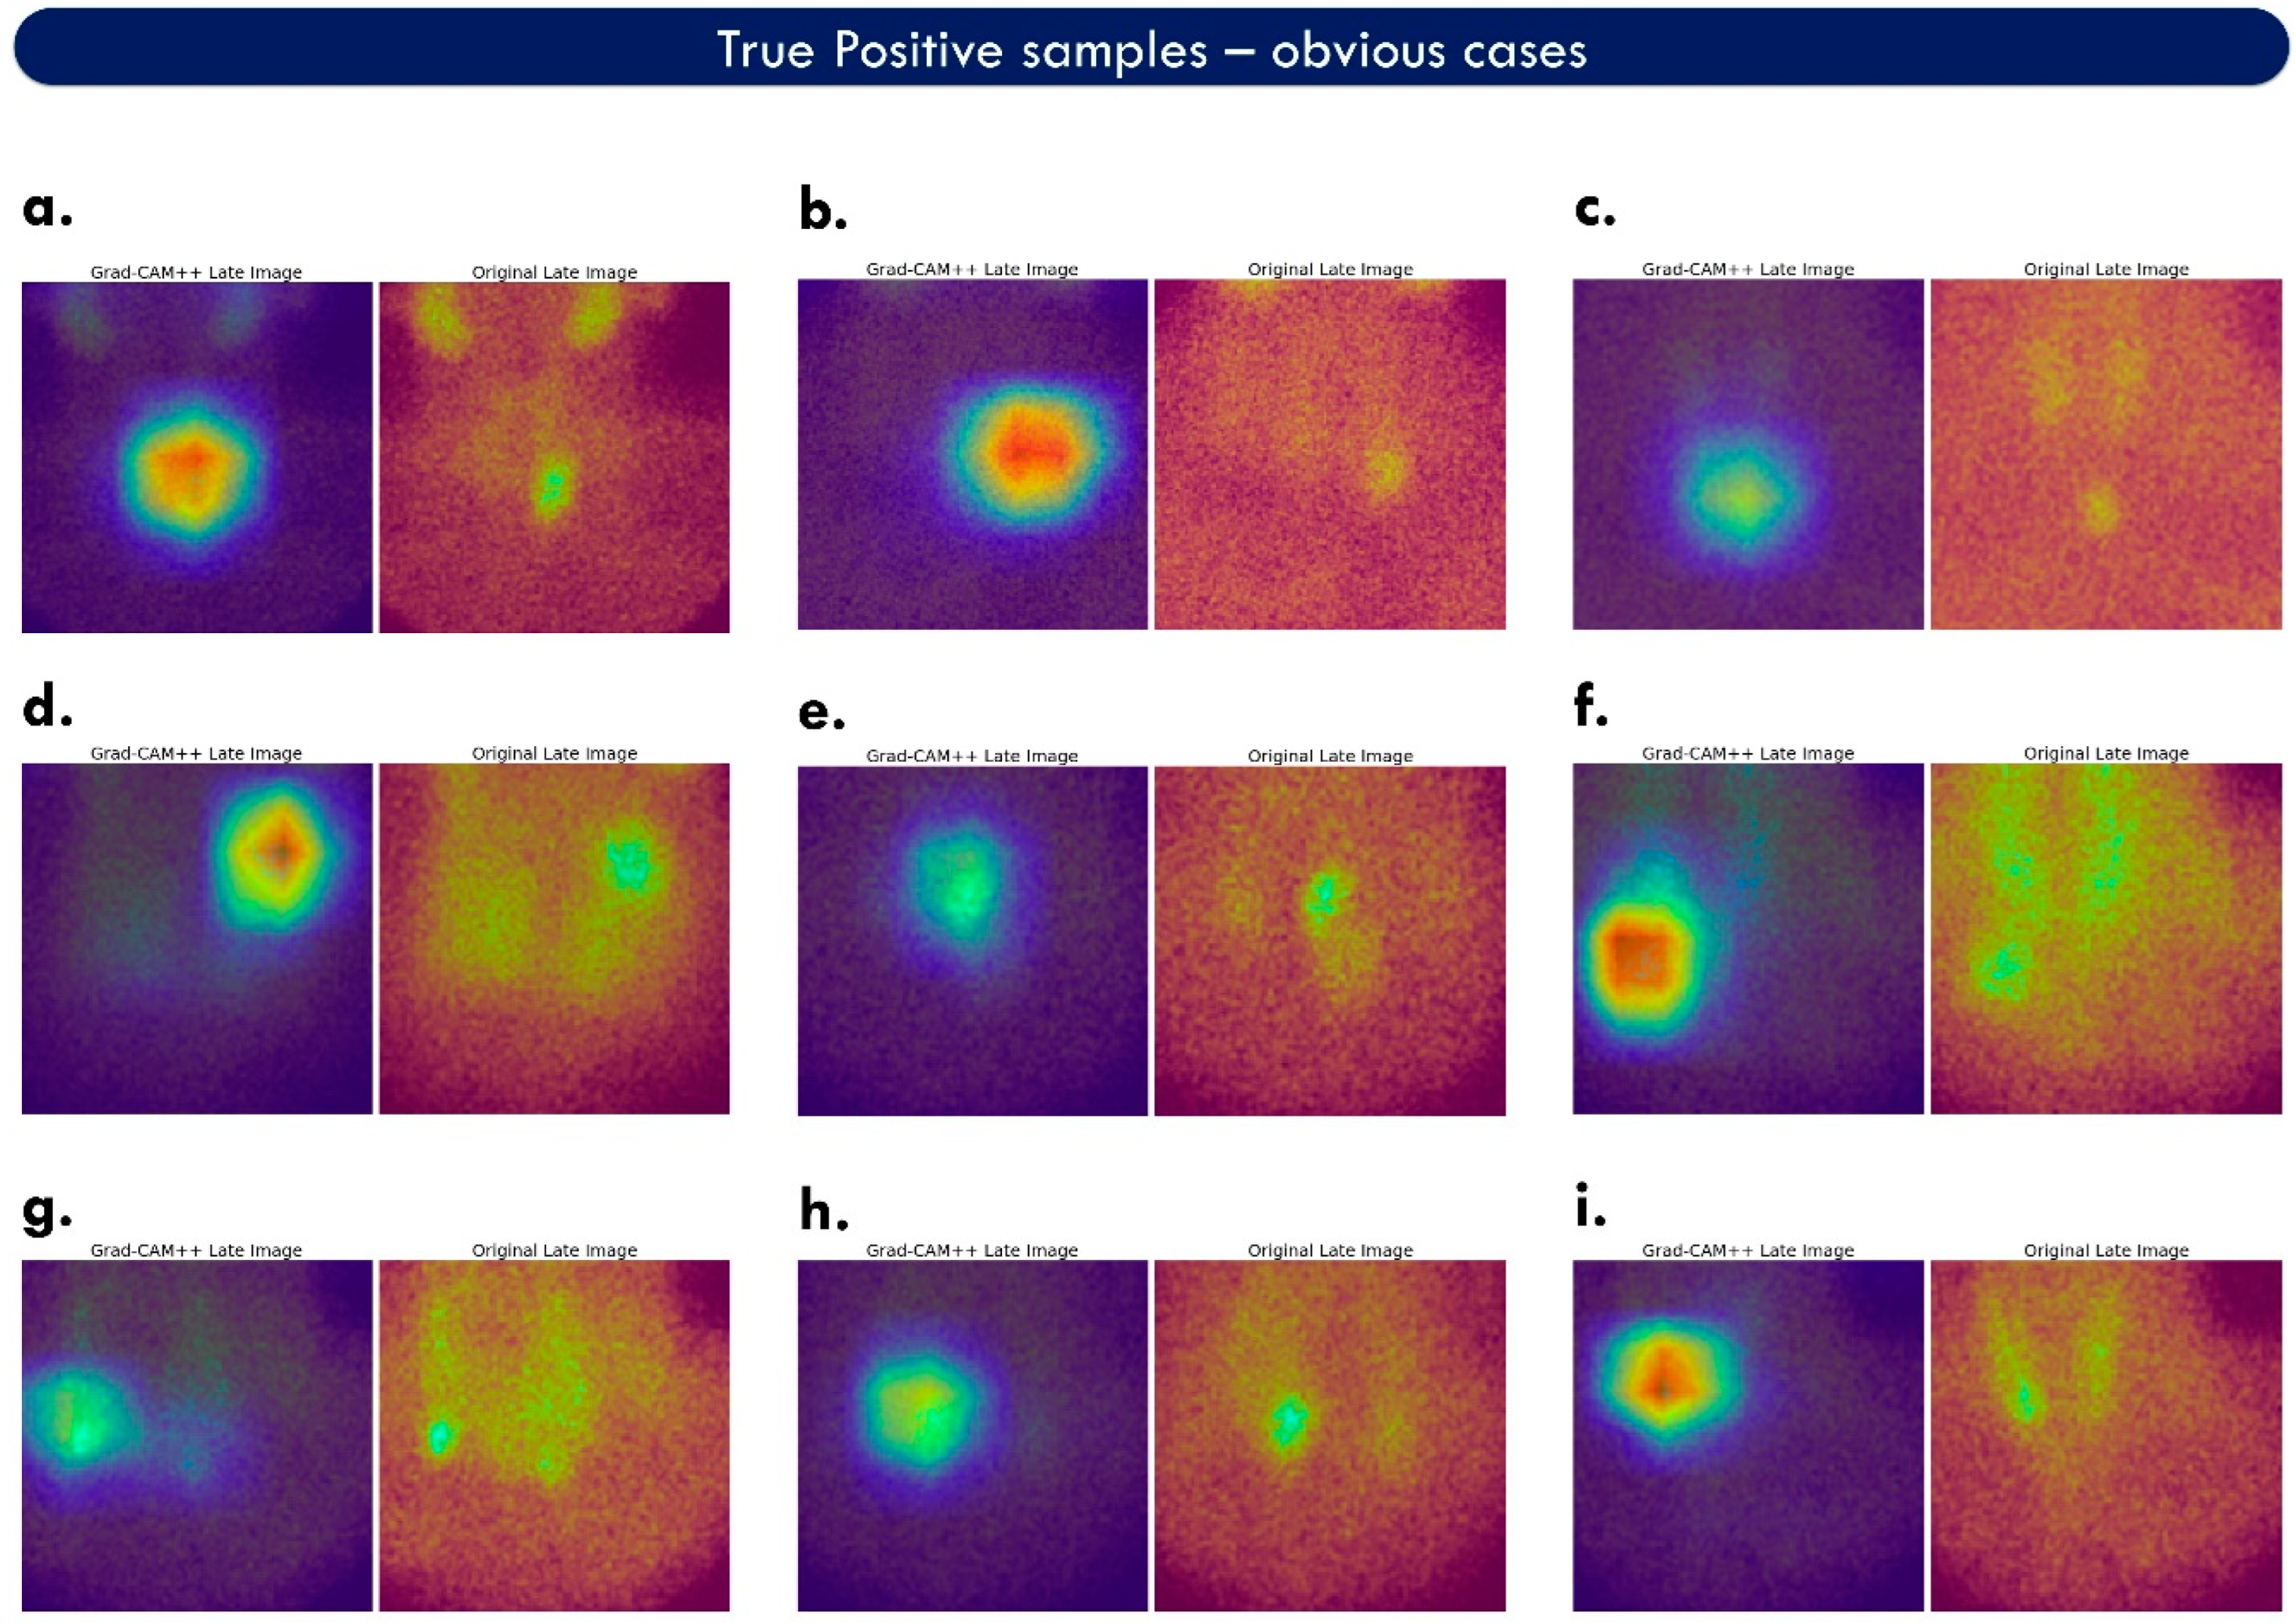
There is a decline in accuracy when inspecting the PG-level performance of the model. The latter inspection was performed with the aid of the Grad-CAM++ algorithm. Examples of the outputs are shown in
Figure 5 and
Figure 6. Specifically, the model identified 462 of the 504 PGs. Eventually, 195 PGs were correctly identified as normal (true negatives). Subsequently, the model achieved an accuracy of 0.8831 (
Table 4), 0.9167 sensitivity, and 0.8125 specificity. The positive predictive value was 0.9112, and the negative predictive value was 0.8228. The false-positive findings were 45, and the false-negative findings (abnormal PGs that the model ignored) were 42.
3.2. Grad-CAM++
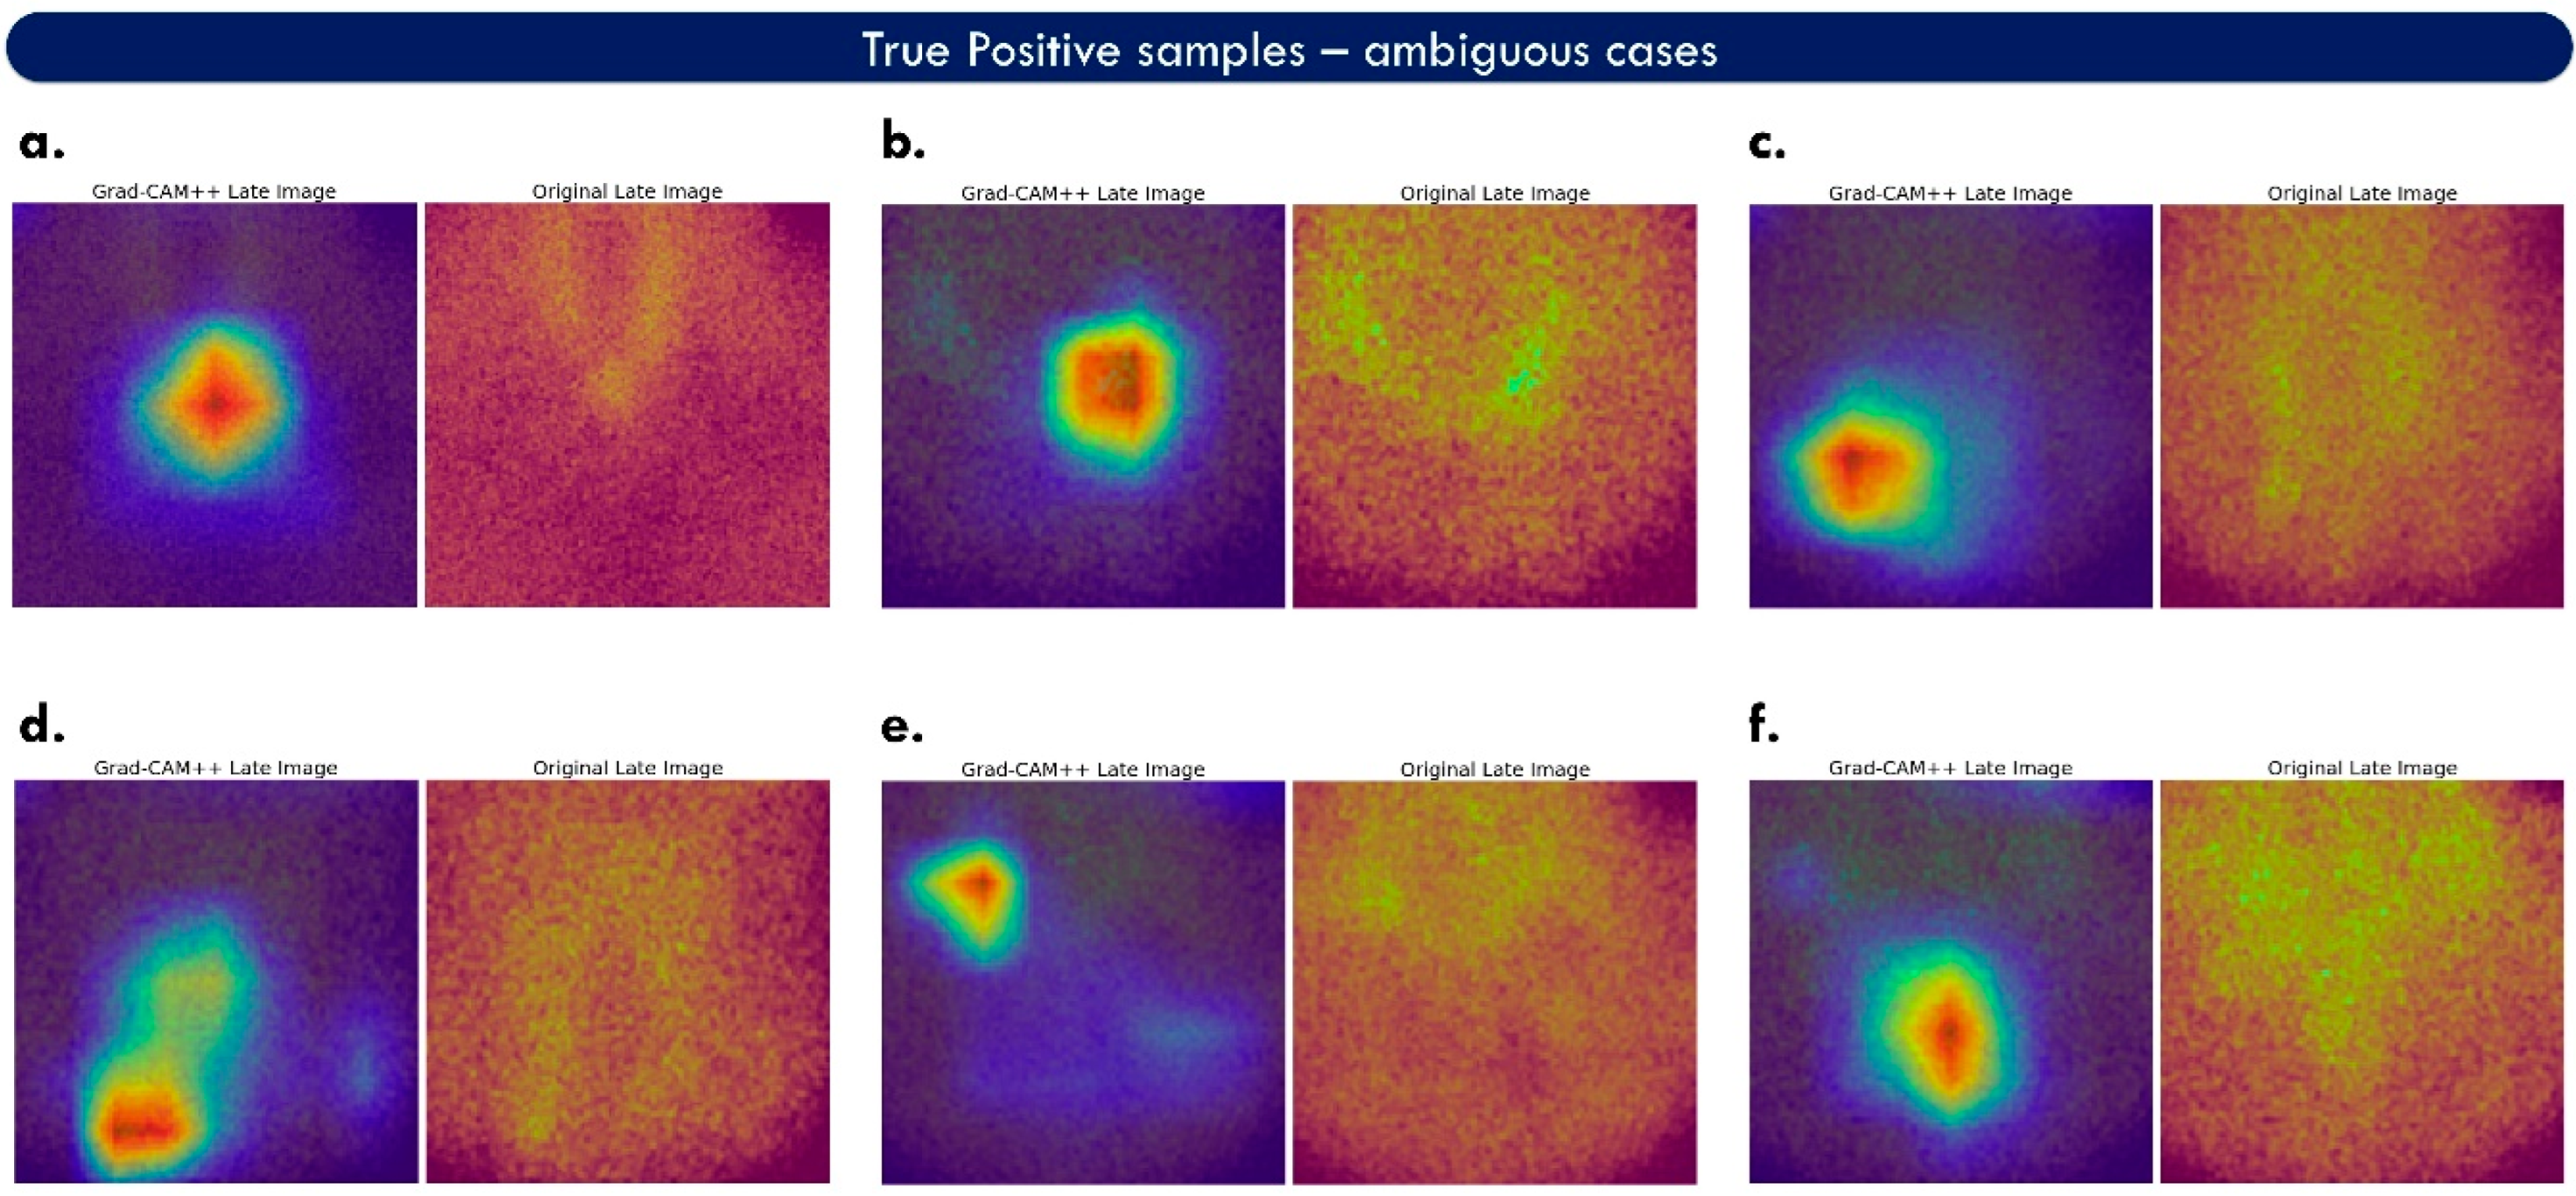
Figure 5 shows cases with true positive examples containing prominent findings. Two images accompany each case. The right is the original late MIBI image, and the left is the fused feature map. The red colour is added by Grad-CAM++ and highlights the features that hold an essential role in the predicted class. Green areas correspond to medium importance, and the blue regions to minor importance. The model correctly localises the abnormal PGs of these cases. However, considering red and green areas as important, the suggested area union is larger than the actual finding. This may confuse a human reader when trying to understand what the model considers a finding. It is also observed that the factual finding is not always located where the red areas appear, but very close by, which may be an inherent drawback of Grad-CAM++ and would require further investigation. Heat maps containing no red areas imply ambiguous decisions and can be considered suspicious for false-positive findings.
Figure 6 illustrates more challenging true-positive cases.
ParaNet+ performs well on inconclusive images, such as case f of
Figure 6. However, the model is also confused in cases such as case d of the same figure, where the suggested areas are ill-defined. The upper part of the heat map of case d is considered a false positive. In contrast, the lower area is a true-positive example.
3.3. Ablation Study
External data were used to inspect how ParaNet+ performs on surgically verified samples. The external dataset consists of 100 participants. All participants had at least one abnormal finding on surgery. Therefore, there are no subjects populating the normal class. Consequently, only sensitivity and false-positive rates are assessed in this group. On surgery, 118 abnormal PGs were identified and excised, 86 corresponding to solitary adenomas (in 86 patients), and 32 to multiglandular disease (in 14 patients).
The experts identified 93/100 abnormal cases on the patient level and 99/118 PGs. Eleven findings of the human reader were false positives on the PG level.
ParaNet++ identified 99/100 cases on a patient basis and 103/118 on a PG basis. There were 13 false-positive PG findings. On both patient and PG bases, the model yielded somewhat higher sensitivity than the human reader (99.0% vs. 93.0% and 87.3% vs. 83.9%, respectively) with comparable FPRs (11.2% vs. 10.0%, respectively). The results are also summarised in
Table 5.
The model successfully detected solitary adenomas (97.7% sensitivity). However, it performed sub-optimally in cases with multiglandular disease (59.4% sensitivity). It is worth noticing that the human readers performed better than the model for the latter case, yielding a sensitivity of 65.6%. On the other hand, some false positives from the model, judged with reference to experts’ diagnoses, proved to be true positives based on the surgical findings.
3.4. Parametrisation
3.4.1. Freedom of Learning
The FF-VGG19 components of ParaNet+ can be employed under three scenarios, as follows: (i) pre-trained (with their weights determined by their initial training in the ImageNet challenge database [
27]); (ii) trained from scratch, wherein all the learning layers are trainable; (iii) fine-tuned, wherein some of the learning layers retain the parameters of their initial training, and some other are made trainable. The exact number of trainable and untrainable layers can be defined by extensive experiments.
Freedom of learning plays a significant role in transfer learning [
28]. Training a model entirely from scratch is ideal when the available datasets are adequate to learn from and would require large-scale sets because deep CNNs involve millions of trainable parameters. On the other hand, training a deep CNN from scratch may result in underfitting, as observed in
Table 6, wherein ParaNet+ obtains 0.6790 accuracy.
Borrowing the weights obtained by training on the ImageNet dataset was ineffective (0.629 accuracy). The latter performance was expected since the initial training had been performed on irrelevant images. Progressively allowing some training improved the performance of the model. It is observed that two-layer freedom yields the best accuracy of 0.9861.
3.4.2. Optimisation
This experiment determines the suitable optimiser of ParaNet+. The right optimiser can affect the learning capabilities of the model because it is responsible for how the weights are updated to reduce the losses. Additionally, different optimisers may increase or decrease the training times and the training stability.
Table 7 presents the performance metrics of ParaNet+ under other optimisation methods.
Adam and RMSprop stand out, obtaining 0.9861 and 0.9074 accuracy, respectively. In addition, Adam speeds up training compared to the rest of the algorithms, achieving complete dataset training in 869 s.
3.4.3. Data Augmentation
Data augmentation holds a notable role in CNN training for classification tasks. It provides CNNs with augmented data to increase their performance. CNNs benefit from data augmentation because they can learn to ignore geometrical and positional features that introduce variations among objects of the same class. In addition, CNNs learn to ignore noisy representations and focus on discovering significant features.
Strong augmenting in medical imaging is avoided because it generates unrealistic representations, which may cause underfitting. In the experiment, width shift, height shift, rotation, shear, and horizontal flip are applied incrementally.
Table 8 summarises the performance of ParaNet+ under different data augmentation settings.
It is observed that the best accuracy is obtained when combining width and height shifts, rotations, and horizontal flips.
3.4.4. Batch Size, Early Stopping
This experiment evaluates different batch sizes and early training-stopping settings. Small batch sizes generally go with small learning rates [
29]. On large-scale, the suggested batch sizes range from 8 to 64 or more [
29].
Early stopping is a method to avoid overfitting and unnecessary training. During each training epoch, training will stop if a specific criterion is met, and the model will be returned to its most effective condition until this event is triggered. The criterion in the particular setup is the validation accuracy computed after each epoch.
Table 9 presents the performance of ParaNet+ under various batch sizes and early stopping settings.
The optimal batch size is observed to be 16. However, further increasing the batch size was not allowed due to computational resource limitations. The model exhibited its best accuracy when early stopping was triggered at a 0.98 validation accuracy.
3.5. Reproducibility
The experiment was conducted 40 times to validate the stability of the model in reproducing the results. A T-test was performed to investigate the statistical significance of the discrepancy (
Table 10). The experiment showed that, at the 0.05 level, the population mean (0.9859) is not significantly different from the test mean (0.9861).
3.6. Train, Test, and Visualisation Times
The training, evaluation, and visualisation time is an essential aspect of each DL model intended for everyday practice in real environments. Ideally, the time taken for a trained model to predict the class and the PGs of a scintigraphic image has to be negligible, enabling such models to be deployed in real time.
Table 11 showcases the time it took the model to complete a full training, a 10-fold cross-validation procedure, a single prediction, and the generation of the accompanying visualisation.
Though training times depend heavily on the computational infrastructure, it is observed that an ordinary personal computer can complete an entire dataset training in less than 900 s. In addition, the trained model took less than a second to process a new image and produce the prediction class and the Grad-CAM++ output. The latter times highlight that the model is suited to hospital workstations or personal computers.
4. Discussion
Previous studies by the author group established DL methods for identifying and localising abnormal PG in scintigraphic images [
22,
23]. The conception of these methods was based on recent literature reviews [
30]. However, despite the remarkable performance metrics in distinguishing between normal and abnormal patient cases, previous approaches yielded many false-positive PGs, which were revealed by investigating the sensitivity maps produced by Grad-CAM.
The present study improves the algorithm for false-positive reduction and more precise localisation. Based on the conception that an abnormal PG can be identified using low-level features, usually extracted by the first convolutional layers of a CNN, the study proposes modifications in the baseline ParaNet to allow for more local feature extraction. Local, low-level, and high-level features are now extracted in a non-sequential manner and are fused. The study employed a post hoc explainability method (Grad-CAM++) to localise the DL-suggested abnormal PGs. Grad-CAM++ produced the sensitivity maps, highlighting the areas of the image where the model grounded its predictions. As a result, ParaNet++ showed better classification accuracy, obtaining 0.9868 on a patient basis and when using the expert’s diagnostic yield as the reference. Scrutiny on a PG-level basis revealed an 88.31% agreement between the model and the experts. Hence, the latter classification accuracy measured the agreement between DL and the physicians. In addition, there was a significant reduction in false positives compared to our previous work [
22].
The proposed network performs well on external testing involving surgically verified samples. Though the network’s training and initial validation had been performed using human interpretation as the reference, its generalisation capability is adequate to classify 99% of the parathyroidectomy-labelled images correctly, which is considered among the main strengths of the framework. On a PG-level basis, the model showed 87.3% sensitivity in detecting abnormal PGs versus 83.9% by the experts.
Direct comparisons with related works may be inconclusive due to variations in the test data, the image acquisition devices, and the data sizes. Nevertheless, the available comparisons populate
Table 12.
The superiority of ParaNet+ compared to the baseline ParaNet is verified. ParaNet achieved an accuracy of 0.948 on a patient-level basis, while ParaNet+ reached 0.98681. The research’s results are also consistent with the literature [
22,
32,
33,
34].
Limitations
We must underline that the model showed suboptimal performance in patients with multiple abnormal PGs in both the retrospective and the prospective data set. This shortcoming should be addressed with better tuning of the Grad-CAM++ algorithm and more data containing multiple findings. The false-positive findings of the model (FPR = 11.2%) were comparable to those of the human reader (10.0%) and were mainly attributed to thyroid nodules. This level of FPR is instead an inherent drawback of MIBI scintigraphy, particularly in geographic areas with a high prevalence of thyroid nodularity, such as Greece, than a flaw of the model.
Future studies must involve further external testing using more surgical and histological verification cases. However, to achieve better results in parathyroidectomy cases, the training datasets must be populated with surgically verified samples. The absence of such cases in the training set of the current study is a limitation.
In addition, the network’s robustness to image acquisition device variation is currently questionable. Clinical and demographic information integration may improve precision and offer a more holistic approach. However, the actual influence of clinical and demographic factors is ambiguous. These factors are not expected to improve the localisation precision. However, they can improve the per-patient classification, distinguishing between normal and abnormal incidents.
Finally, the scarcity of related works available for comparison is an unavoidable limitation of the current study. The limited number of studies focusing on the same research area reduces the opportunity for direct comparison of findings and validation of results. Furthermore, the existing studies often employ different datasets, lacking a global standard dataset, which makes it challenging to establish a fair and consistent benchmark. Additionally, variations in image acquisition techniques and devices utilised in these studies introduce further complexity in drawing accurate comparisons. Consequently, the absence of a standardised dataset and consistent imaging devices hinders the ability to perform a comprehensive and unbiased evaluation across different methodologies. Therefore, caution should be exercised when interpreting the results of this study in the broader context of the field, and further research with a more extensive and standardised dataset is warranted to facilitate a more fair and reliable comparison among different approaches.


 ,
, 


