
Evaluation of Bonding Shear Performance of Ultra-High-Performance Concrete with Increase in Delay in Formation of Cold Joints


Abstract
:1. Introduction
2. Experimental Plan
2.1. Overview of Experiment
2.2. Materials and Mix Ratio
2.3. Experimental Methods
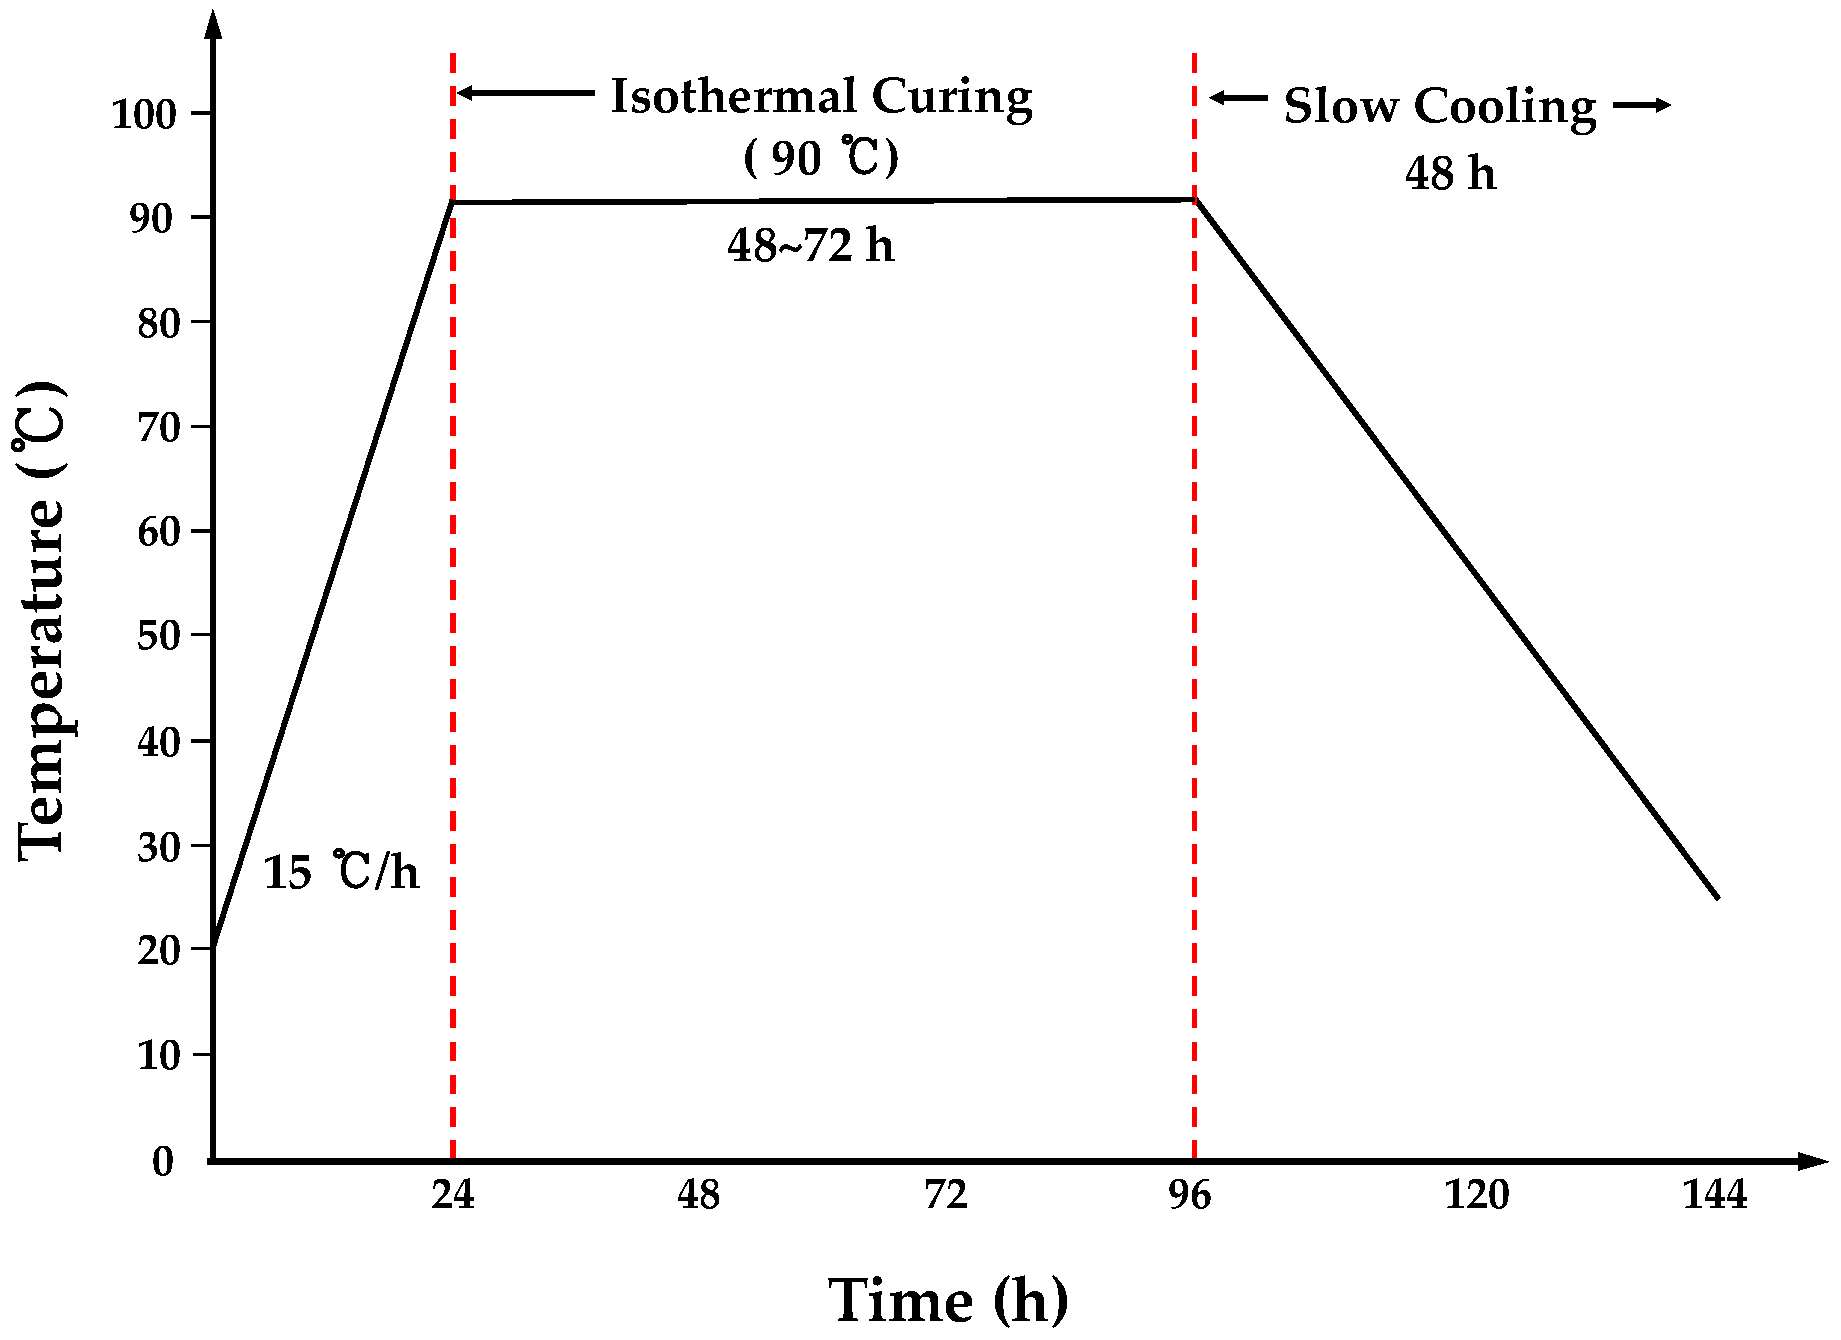
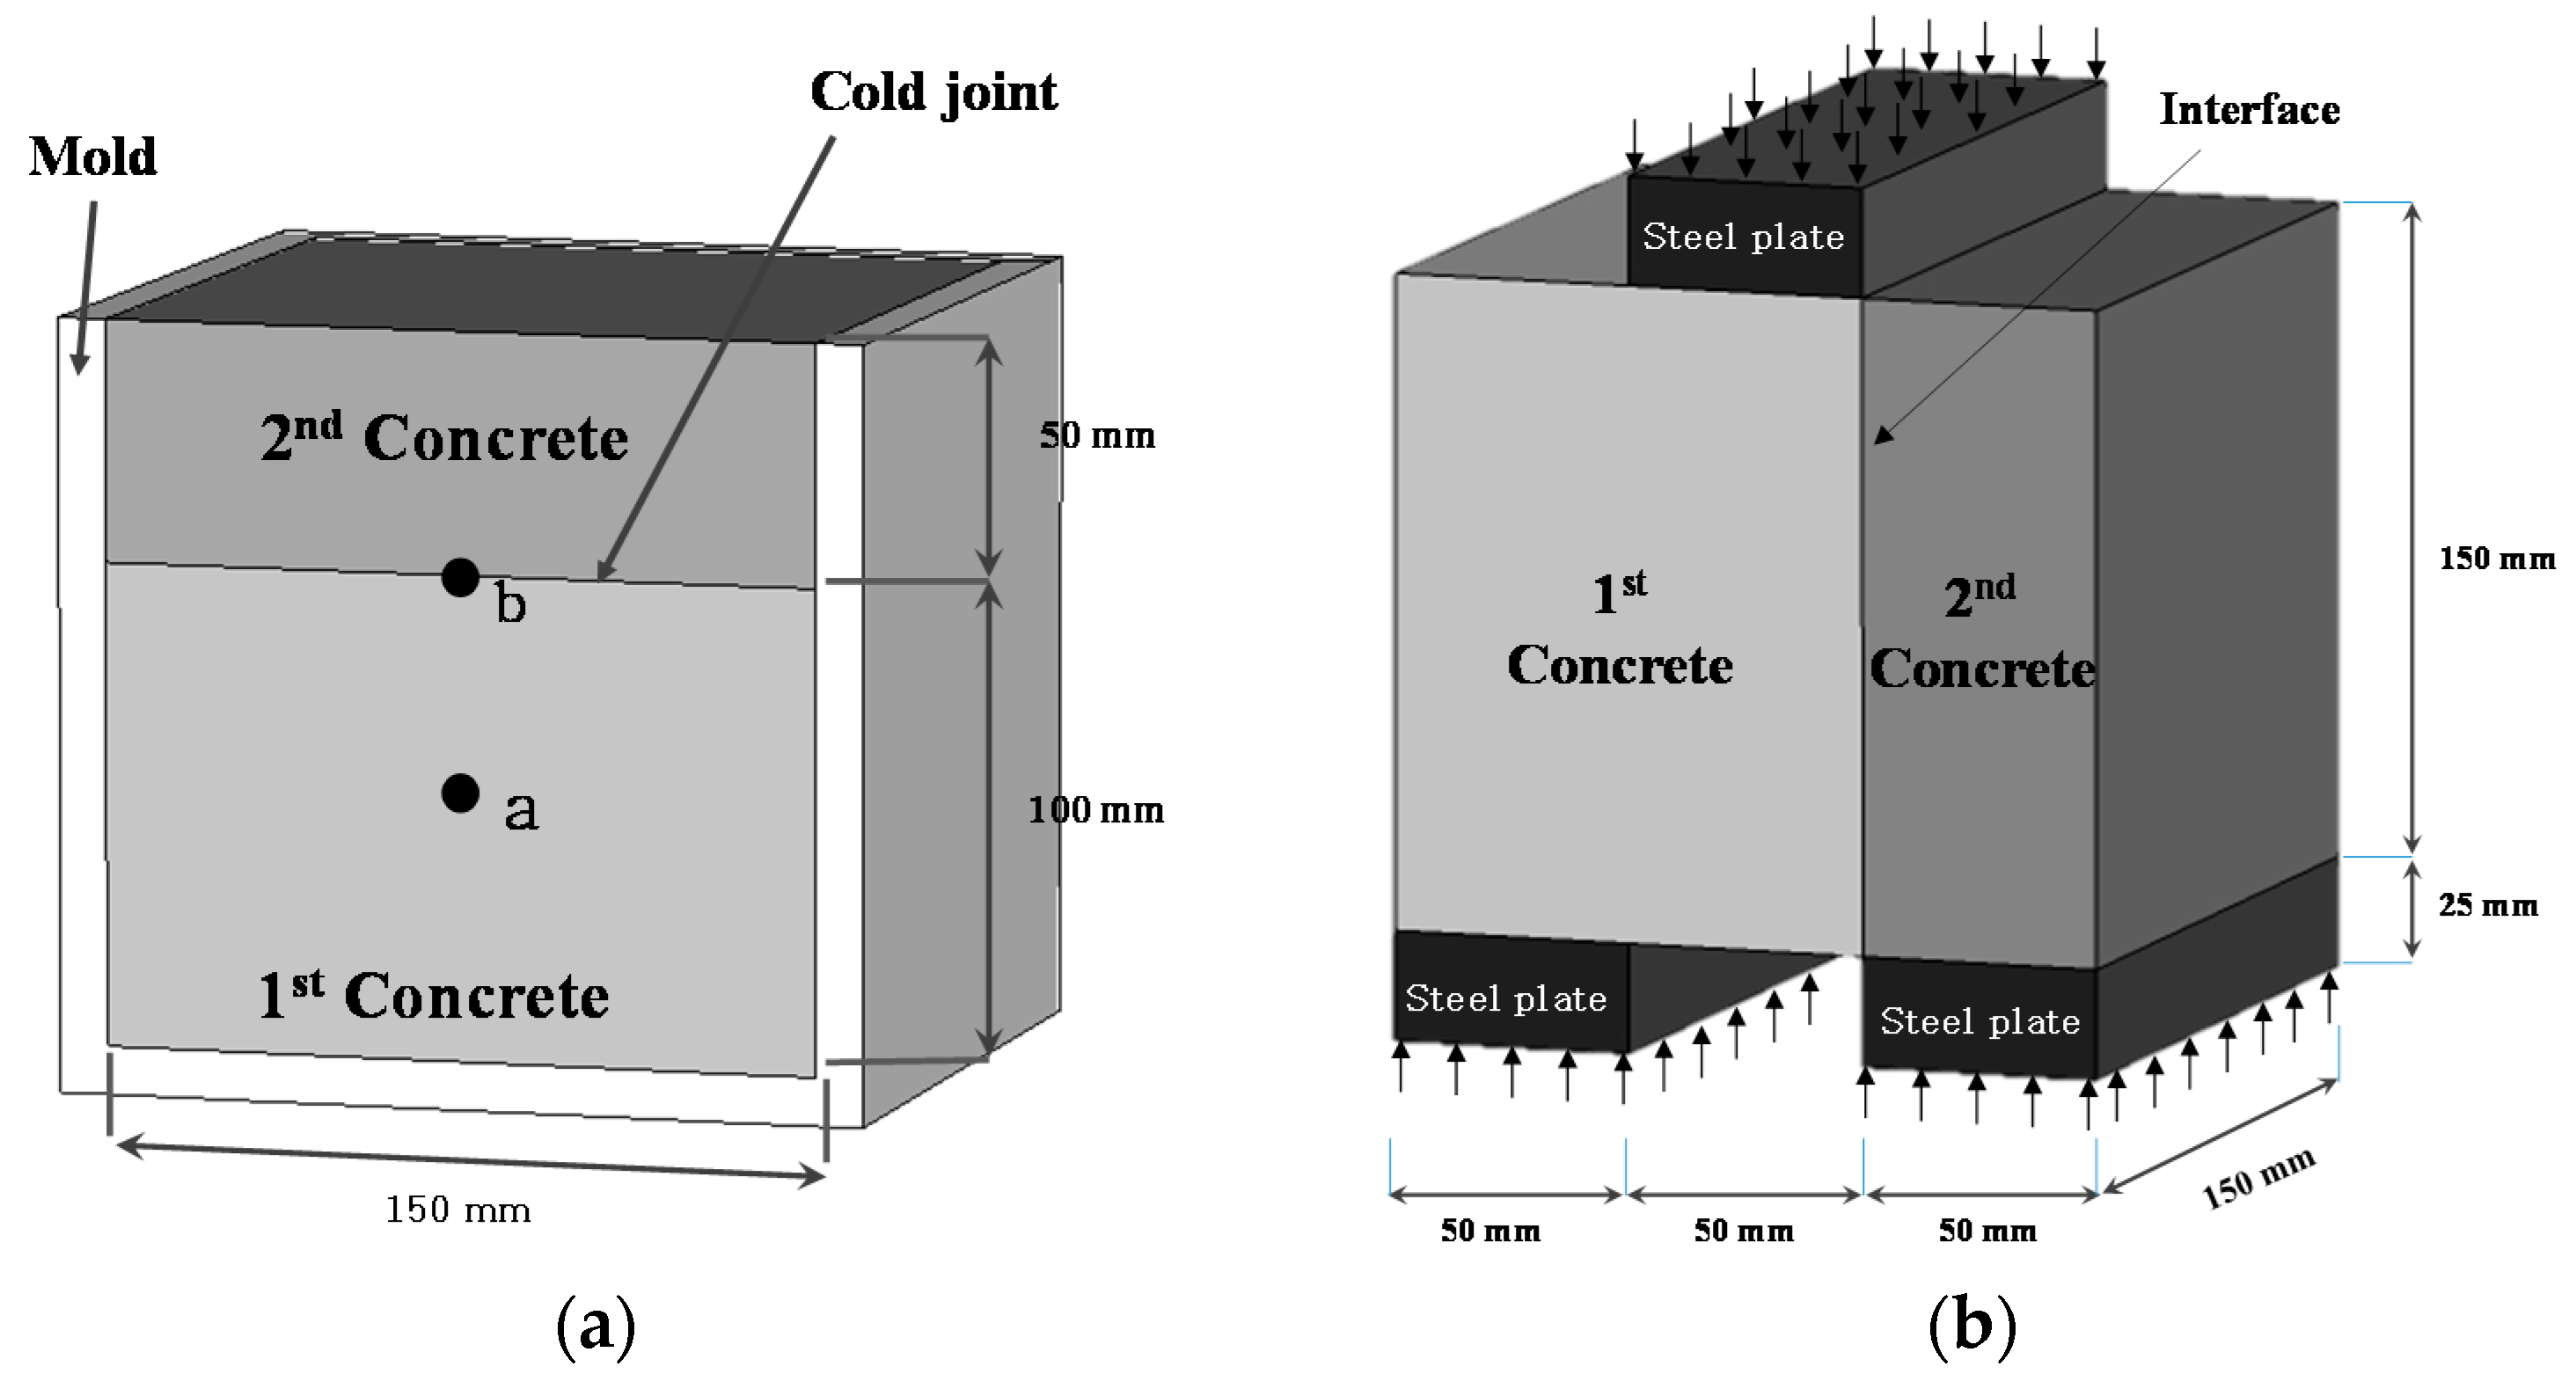
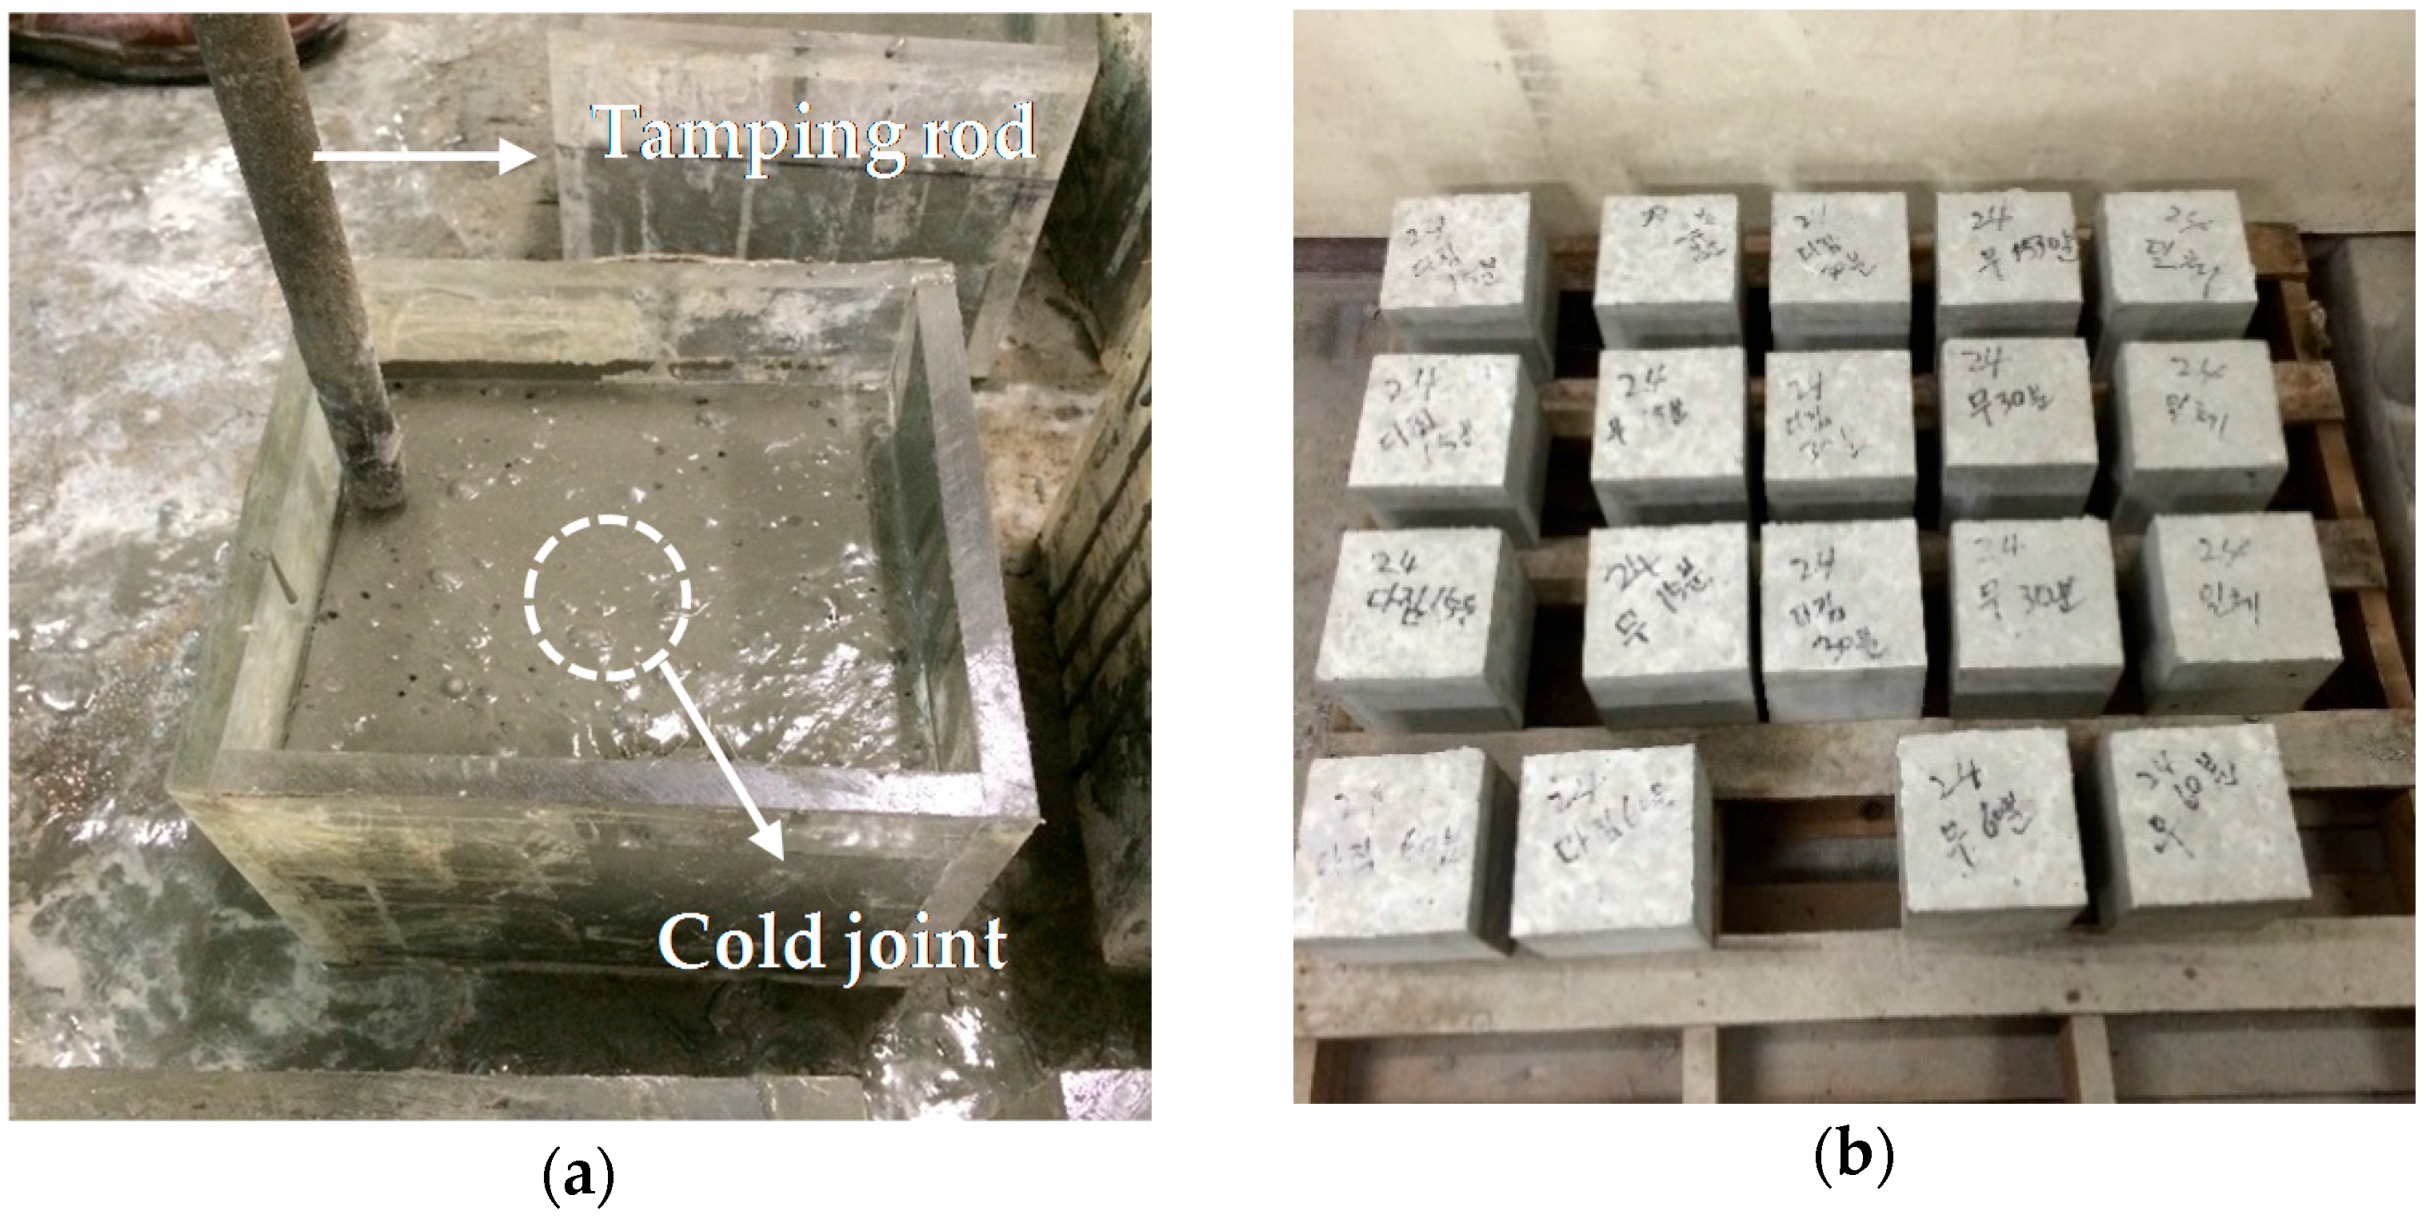
2.3.1. Manufacturing of the Specimens
2.3.2. Material Characteristics of Concrete
2.3.3. Direct Shear Test
2.3.4. Analysis Using Scanning Electron Microscopy (SEM)
2.3.5. X-ray Diffraction (XRD) Composition Analysis
3. Experimental Results and Analysis
3.1. Material Characteristics of Concrete
3.2. Evaluation of Bonding Shear Performance with Variations in Delay of Cold Joint Occurrence
3.2.1. Change in Bonding Shear Strength with Tamping and Delay
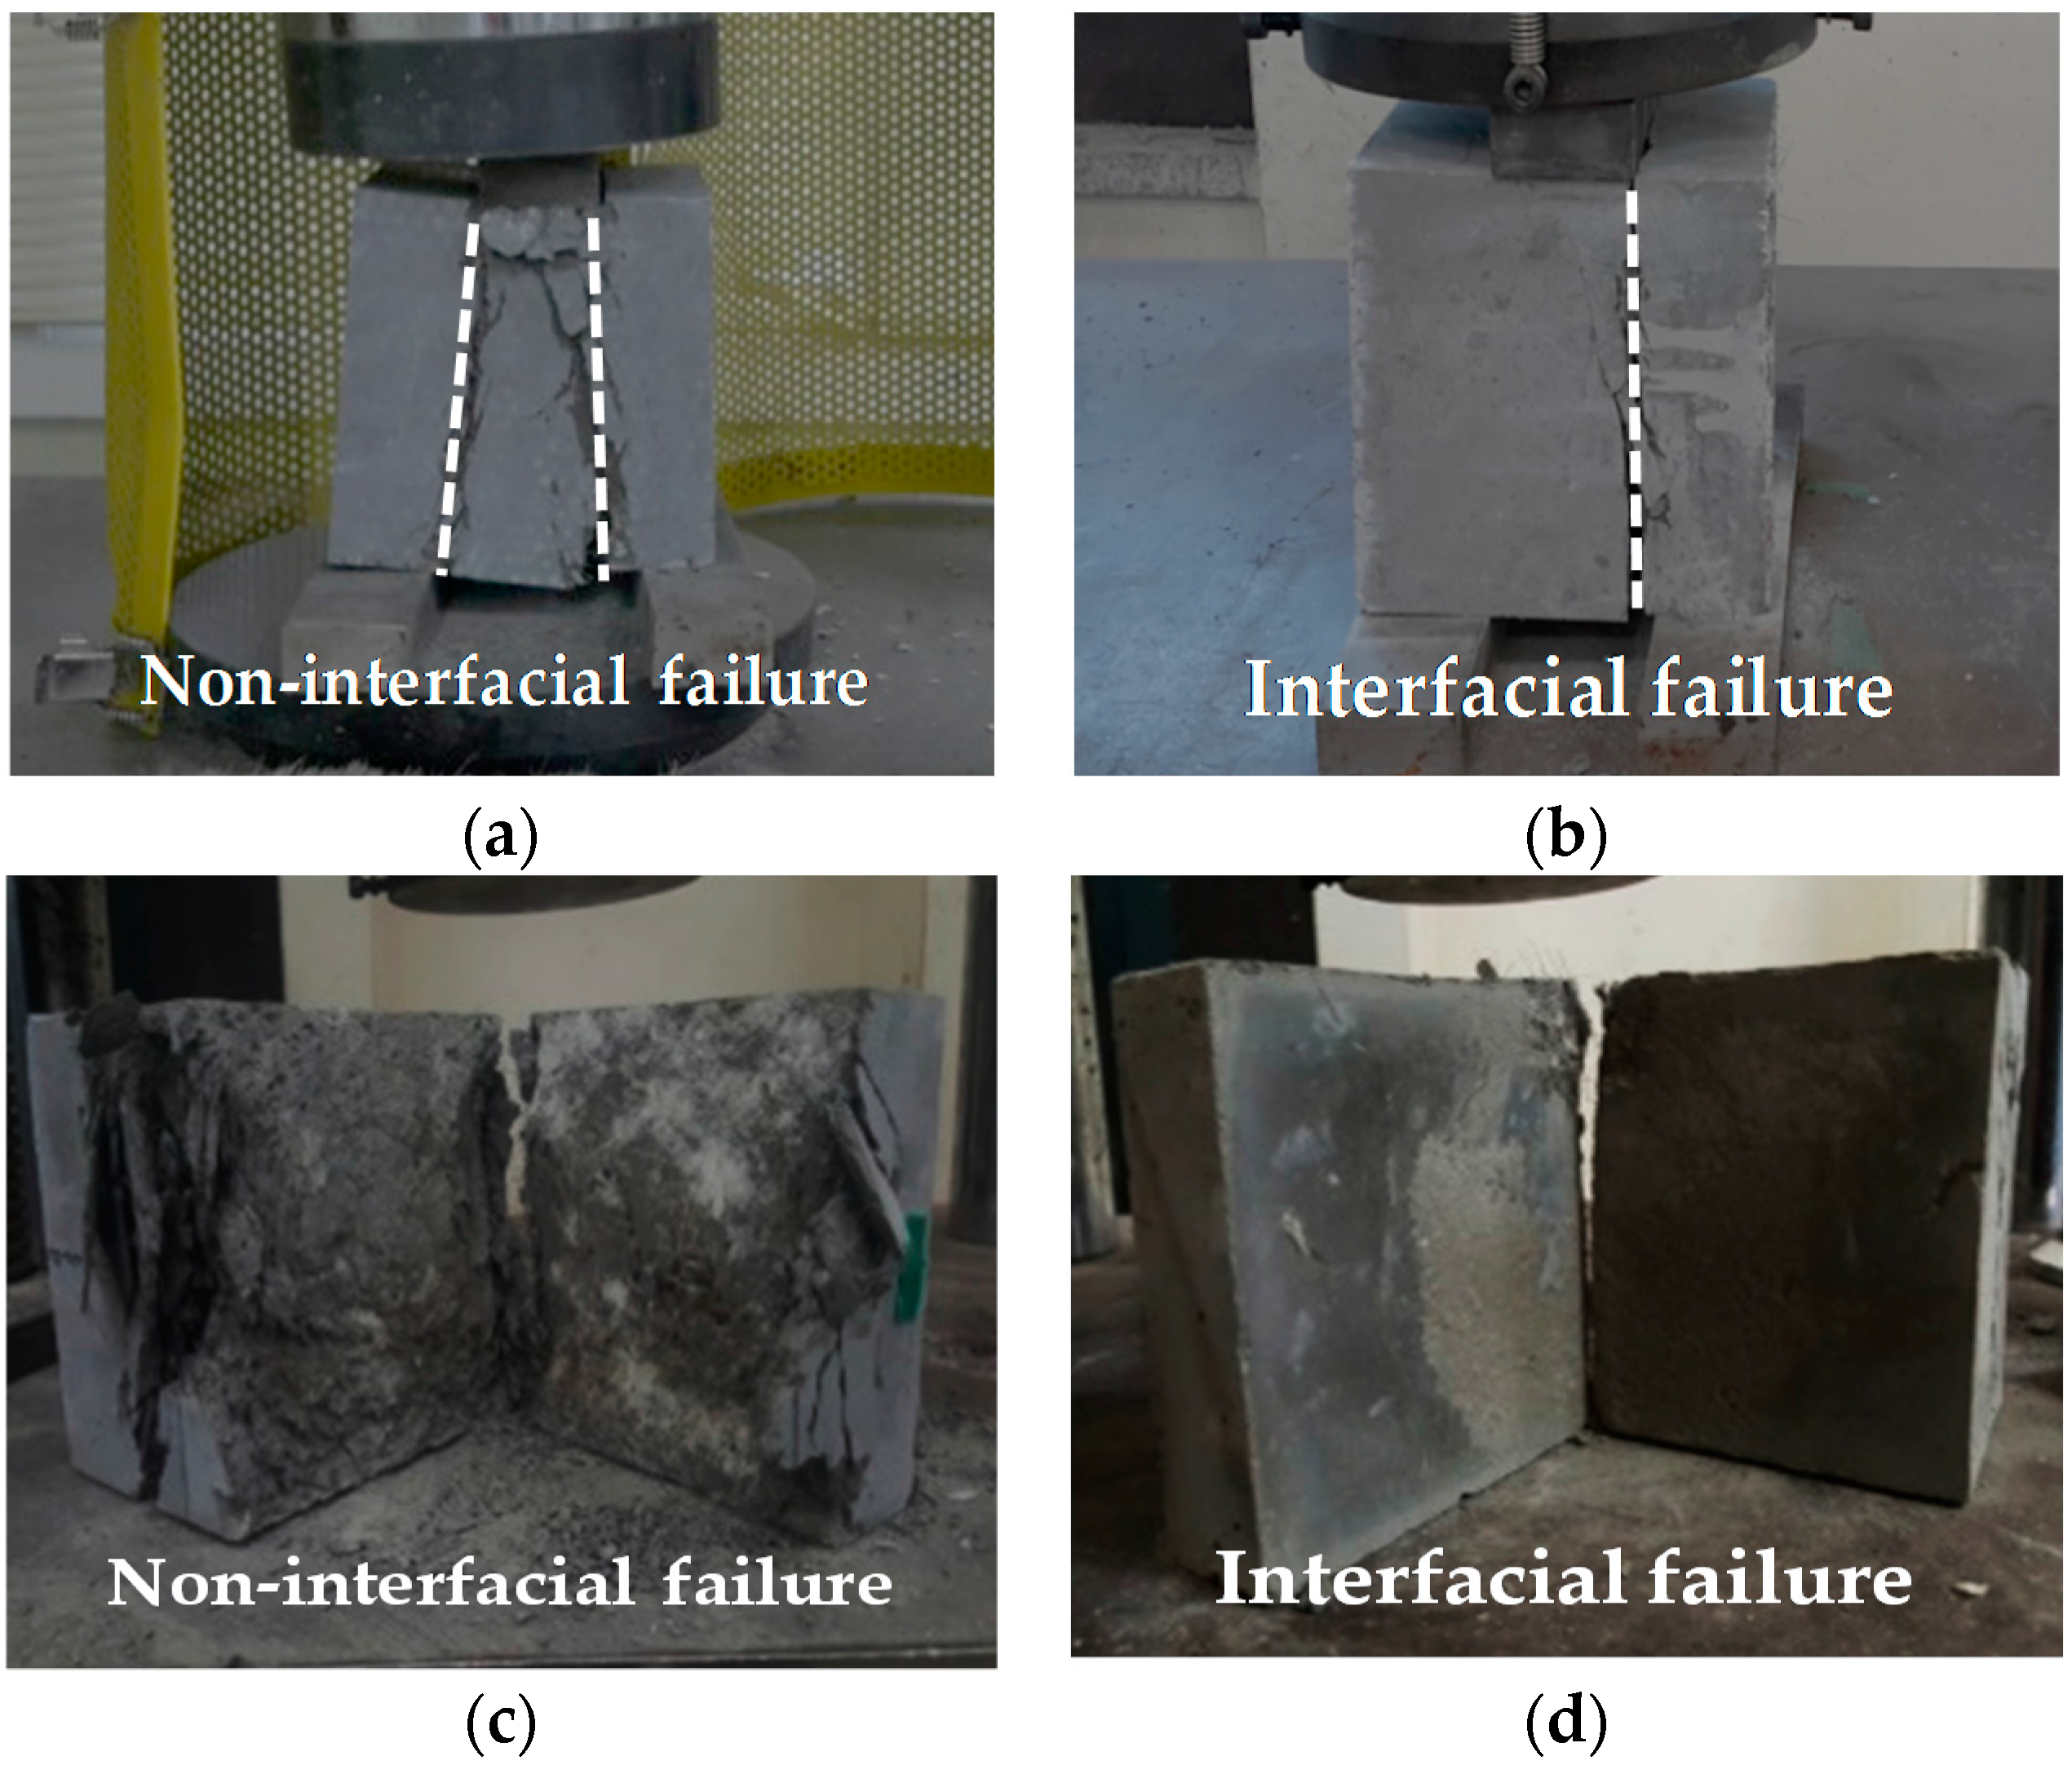
3.2.2. Failure Modes
3.3. Microstructure Analysis of NSC and UHPC
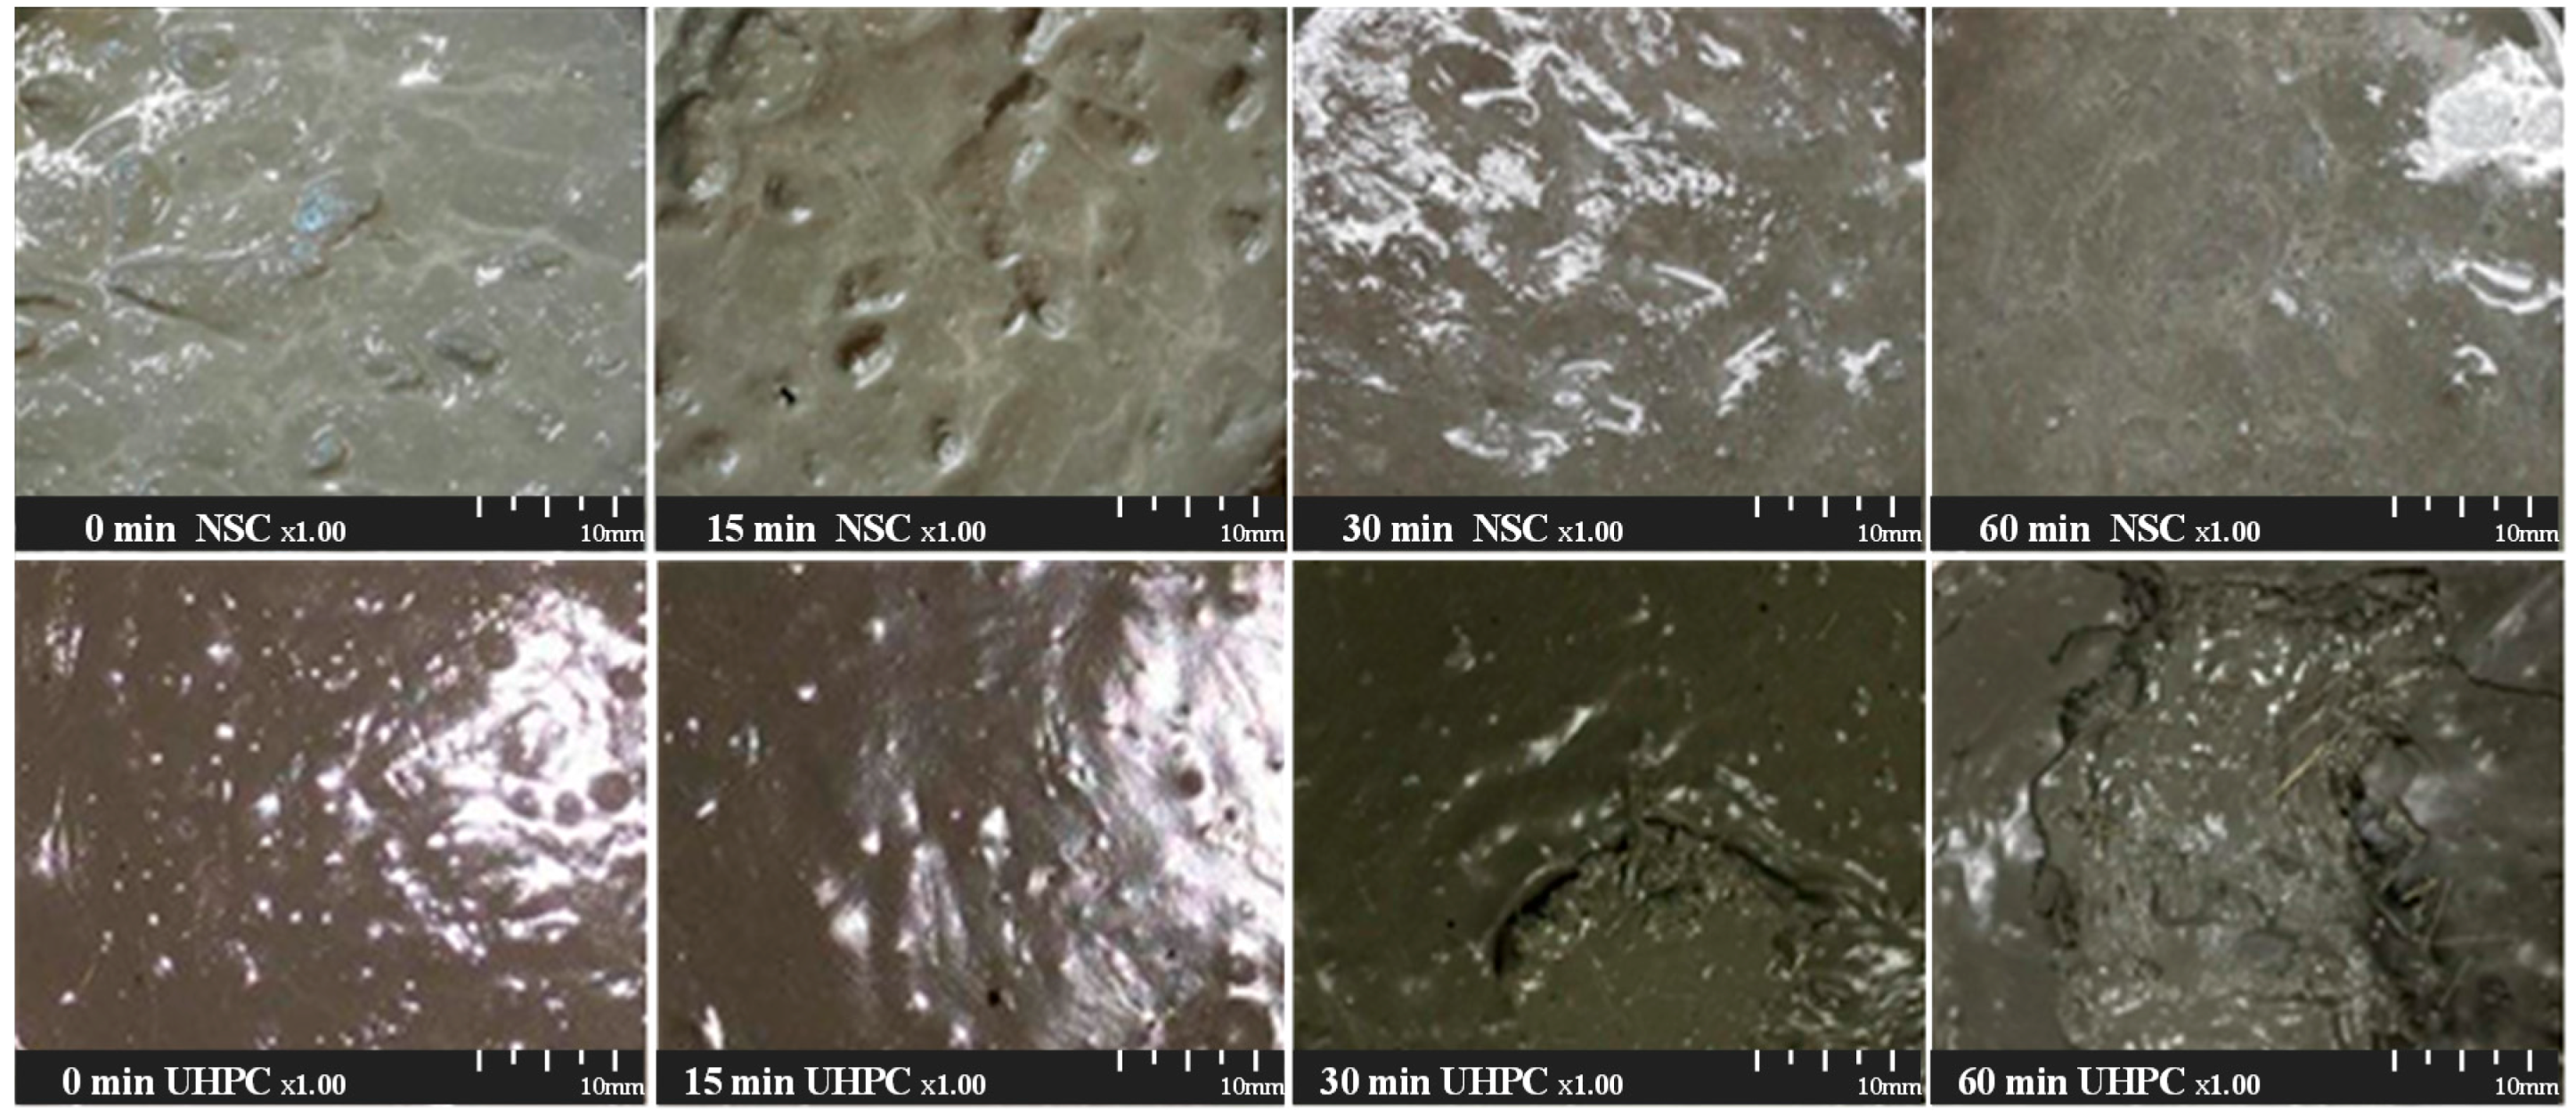
3.3.1. Temporal Changes in the Surface of Cold Joint Region with Delay
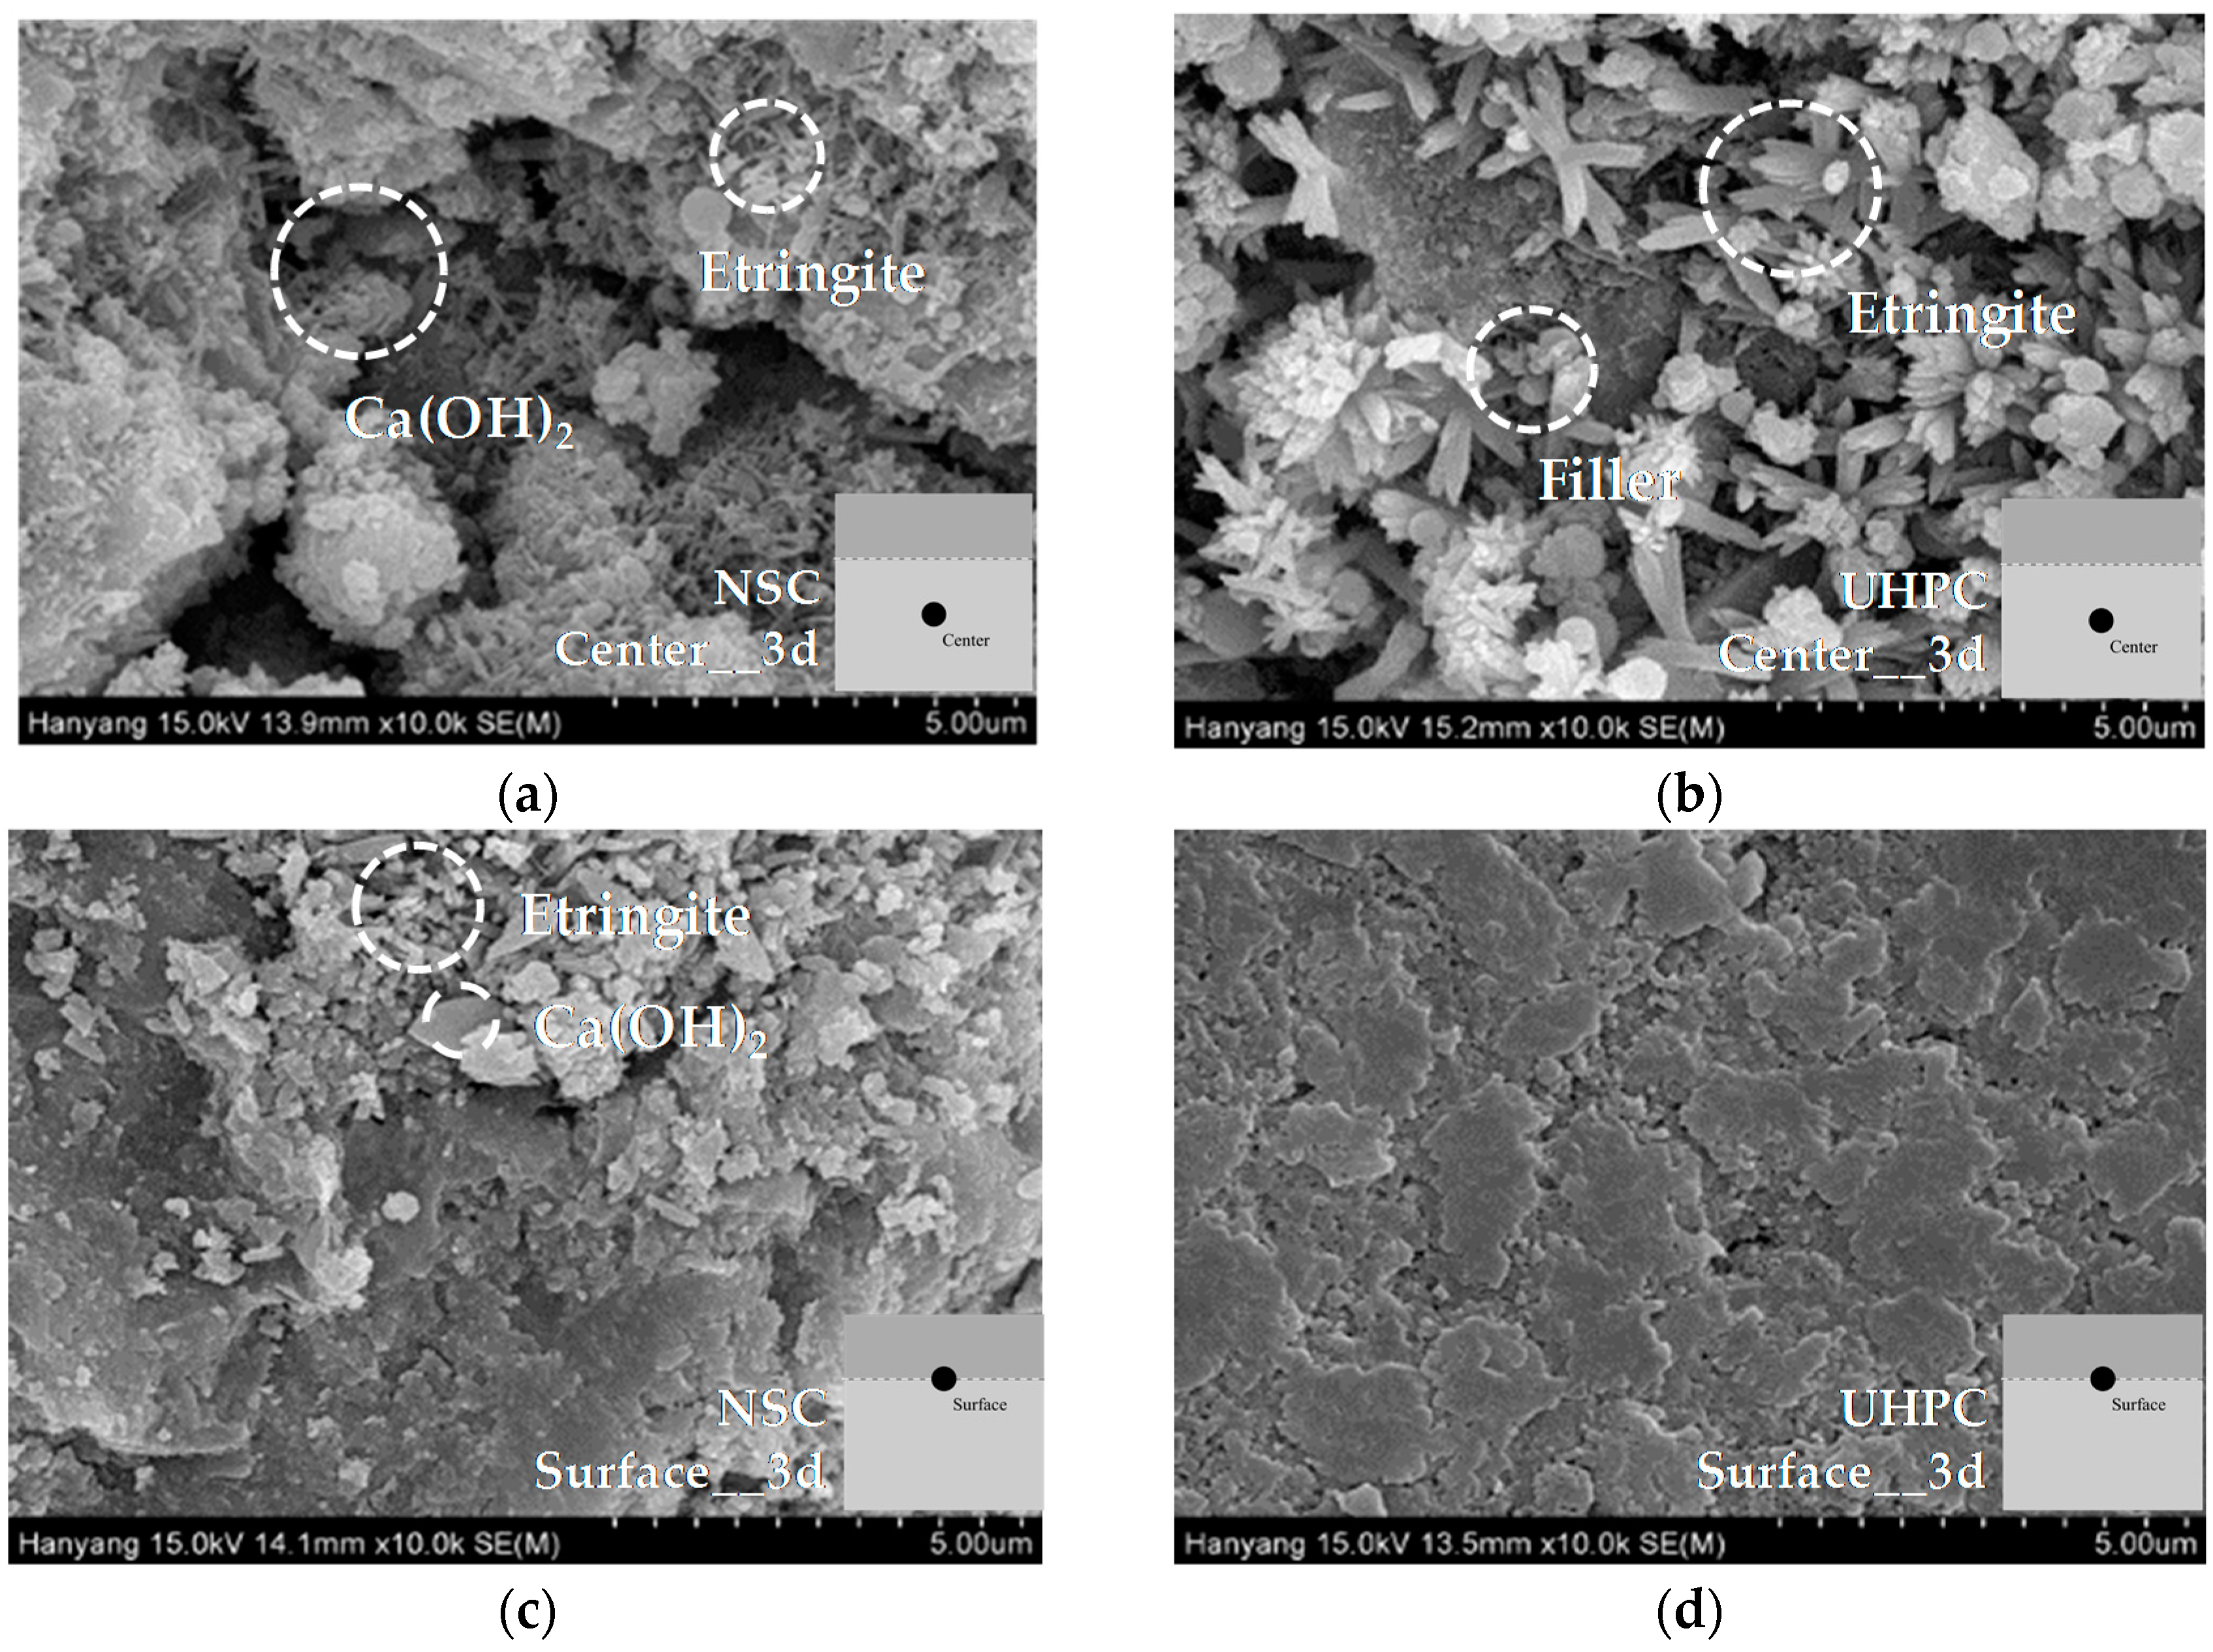
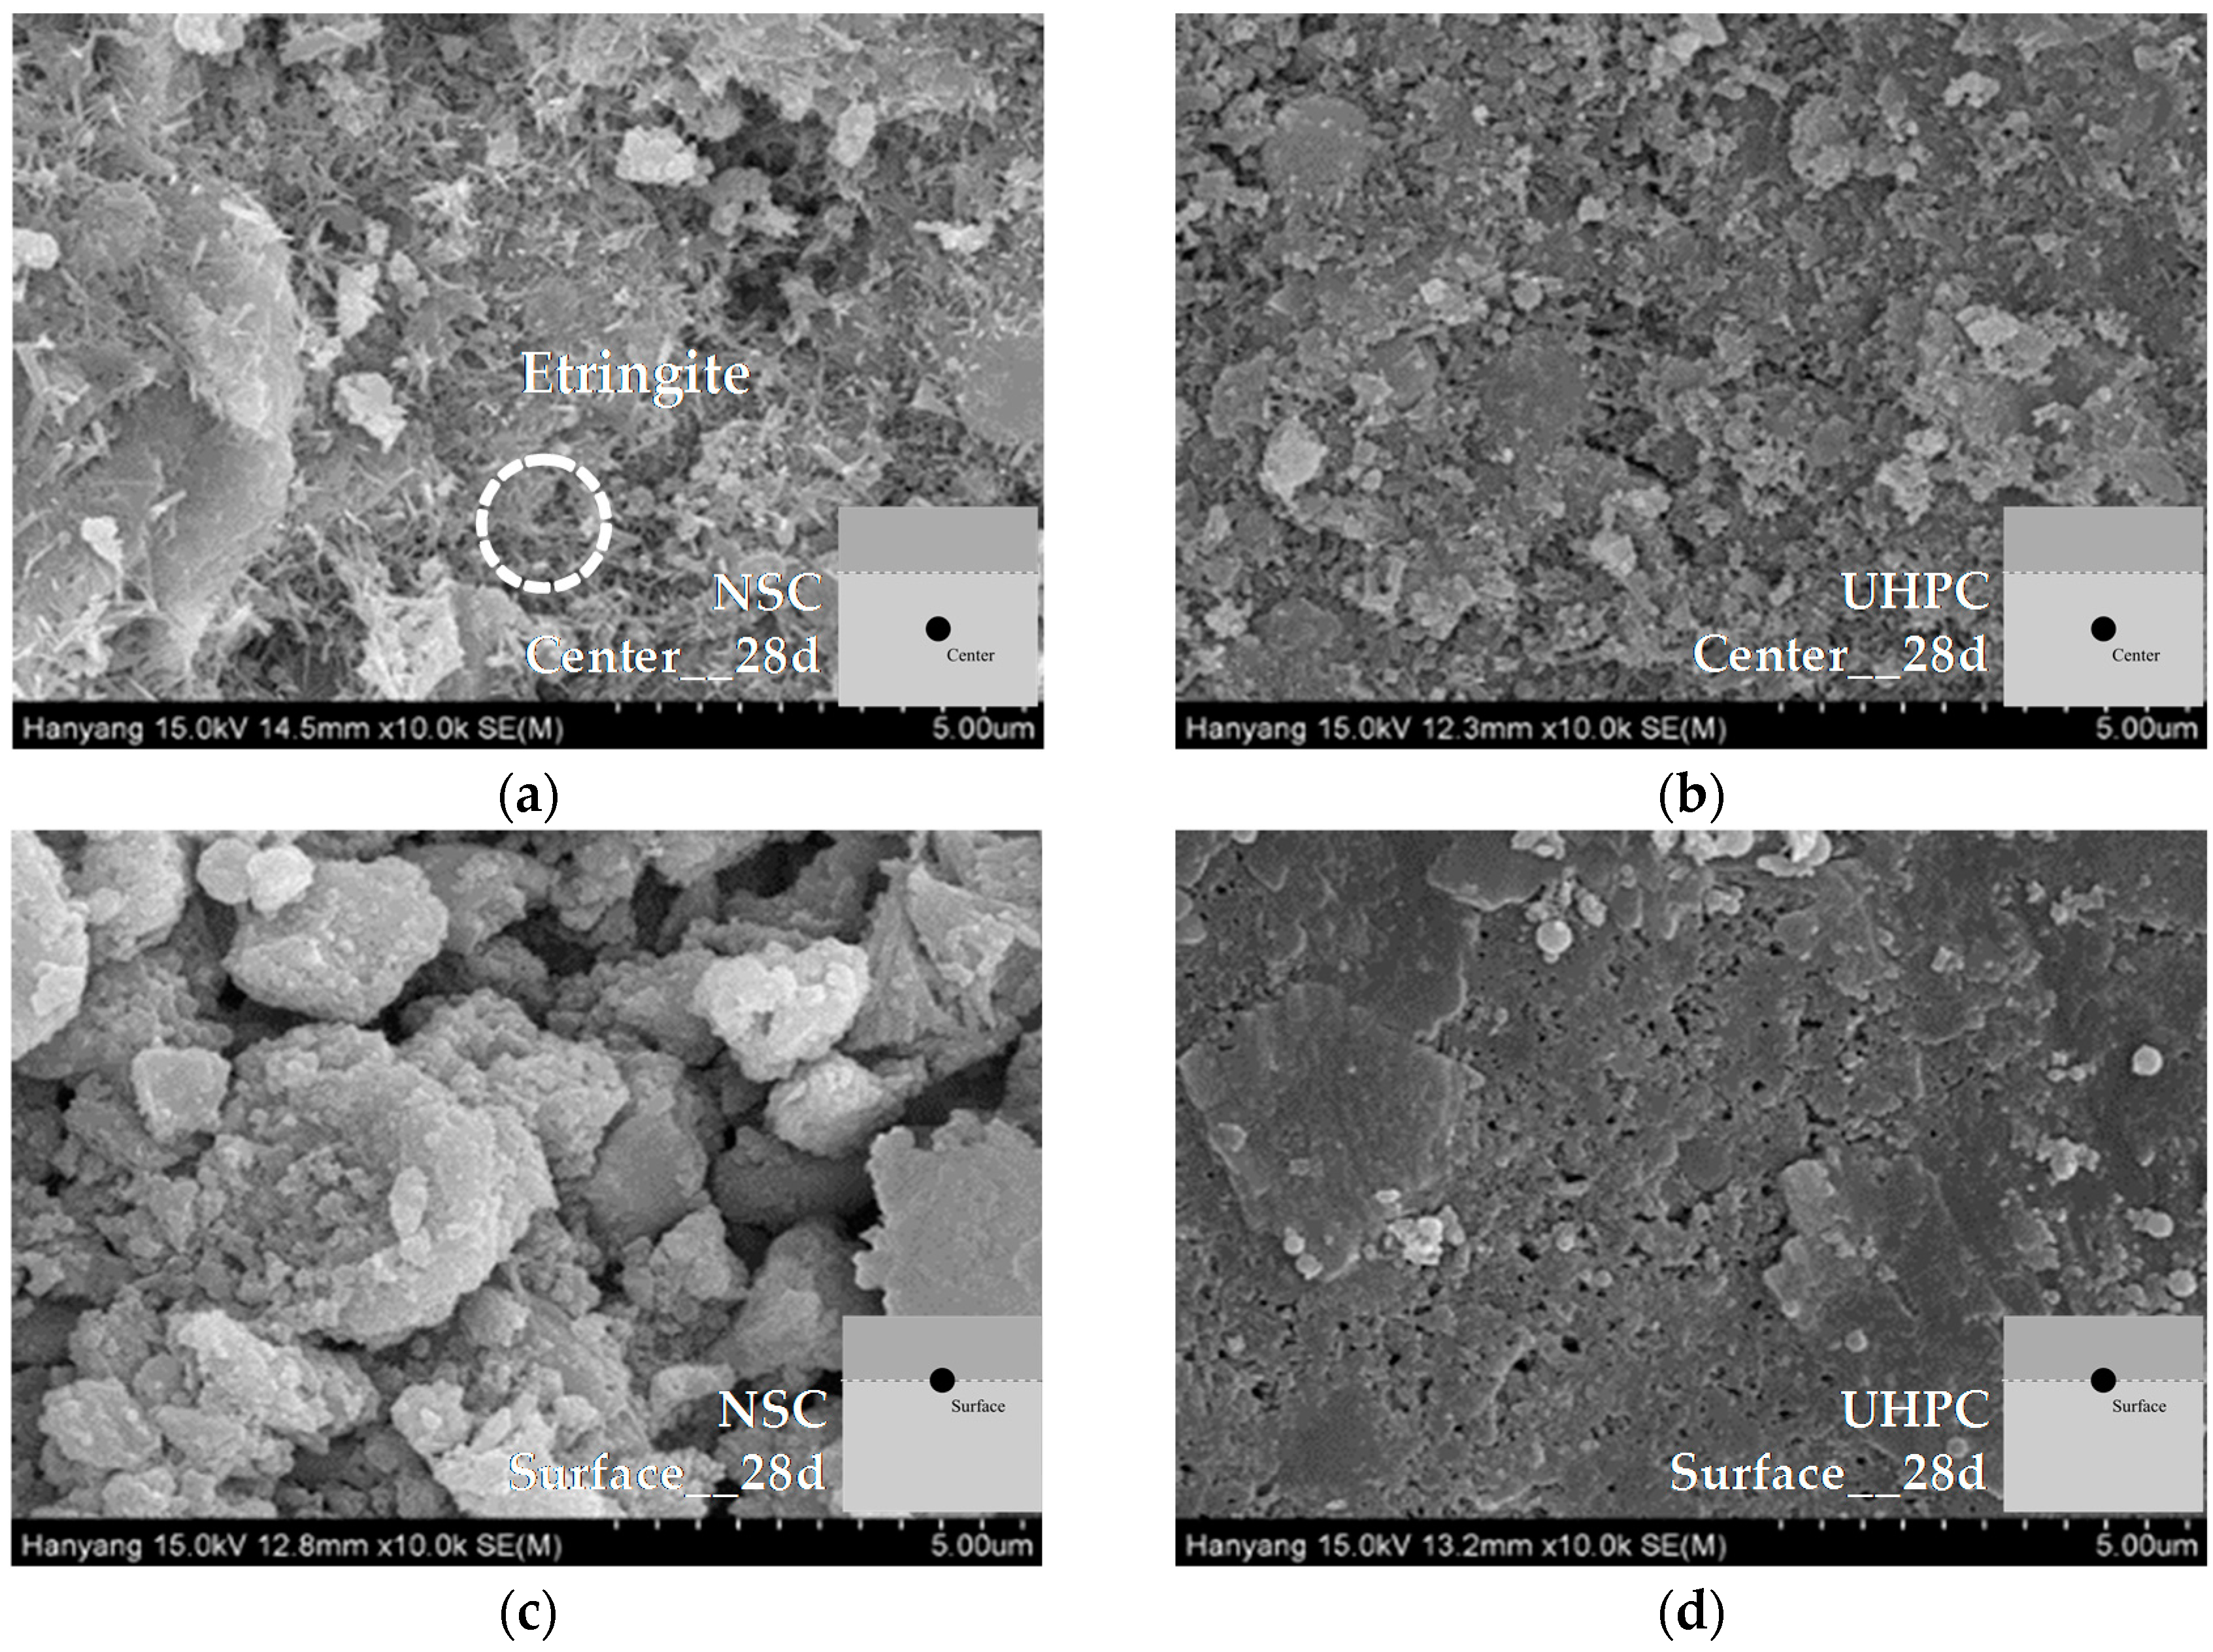
3.3.2. SEM Image Analysis of NSC and UHPC
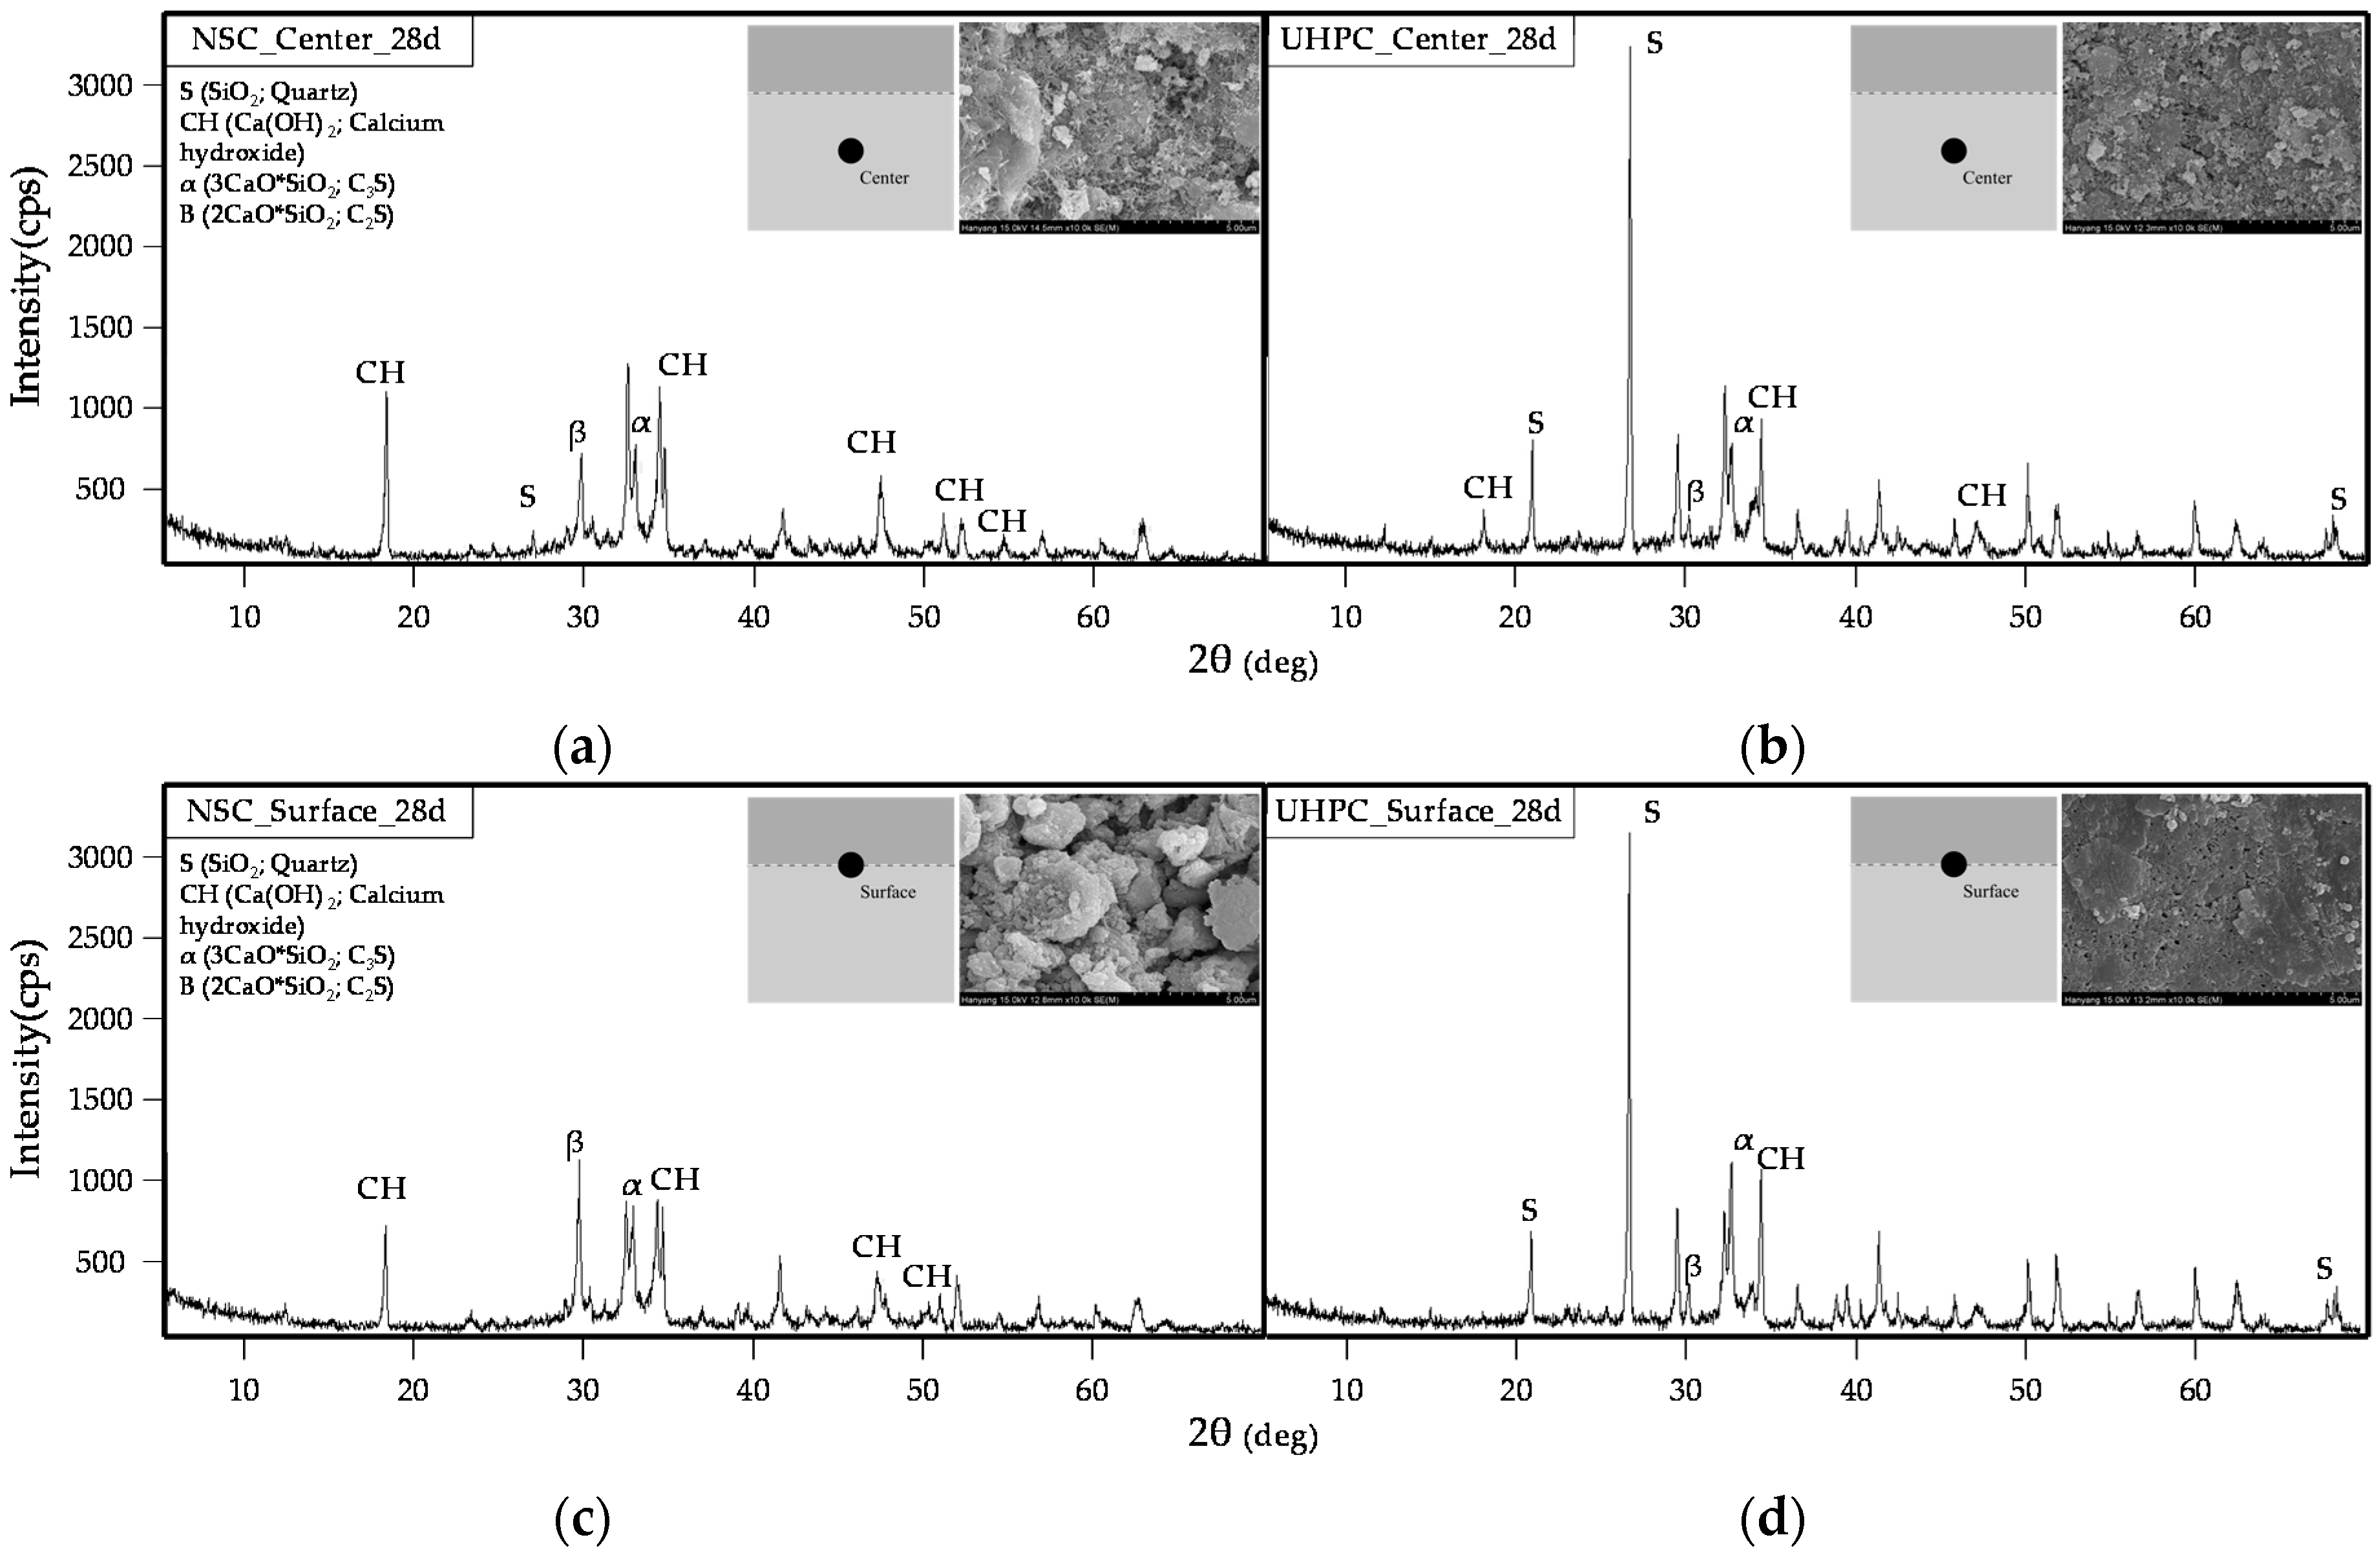
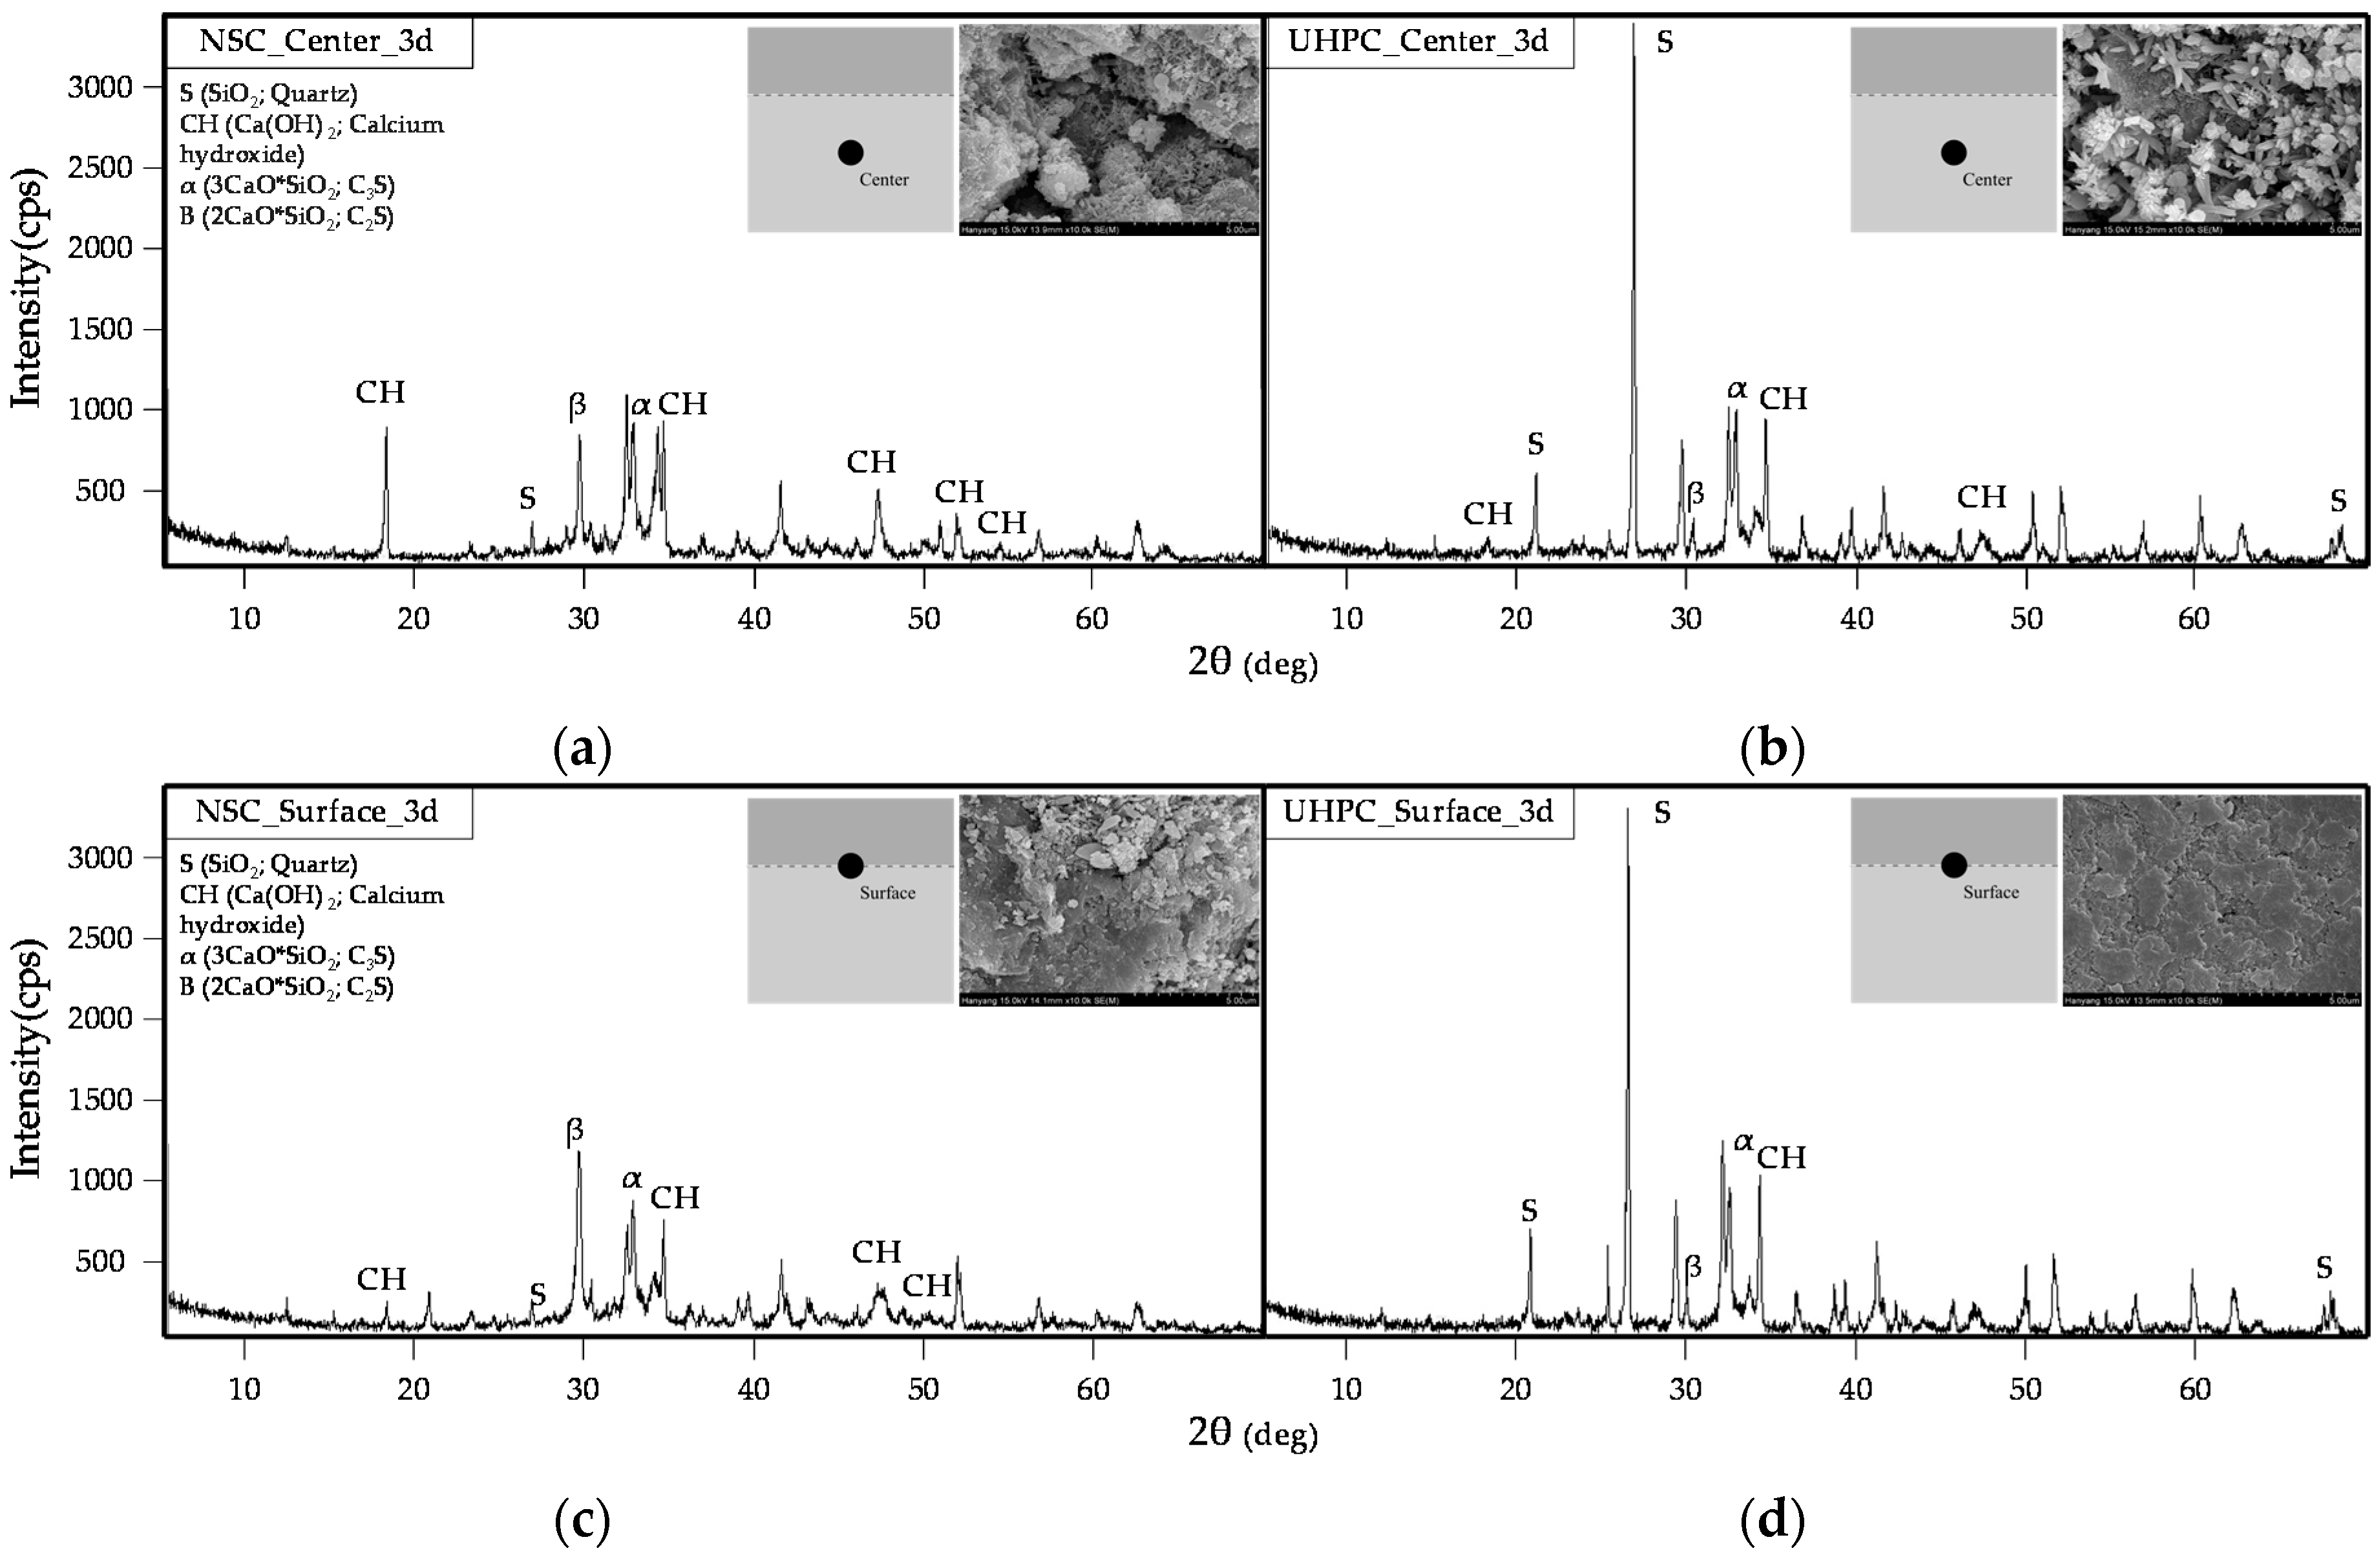
3.3.3. XRD Analysis of NSC and UHPC
4. Conclusions
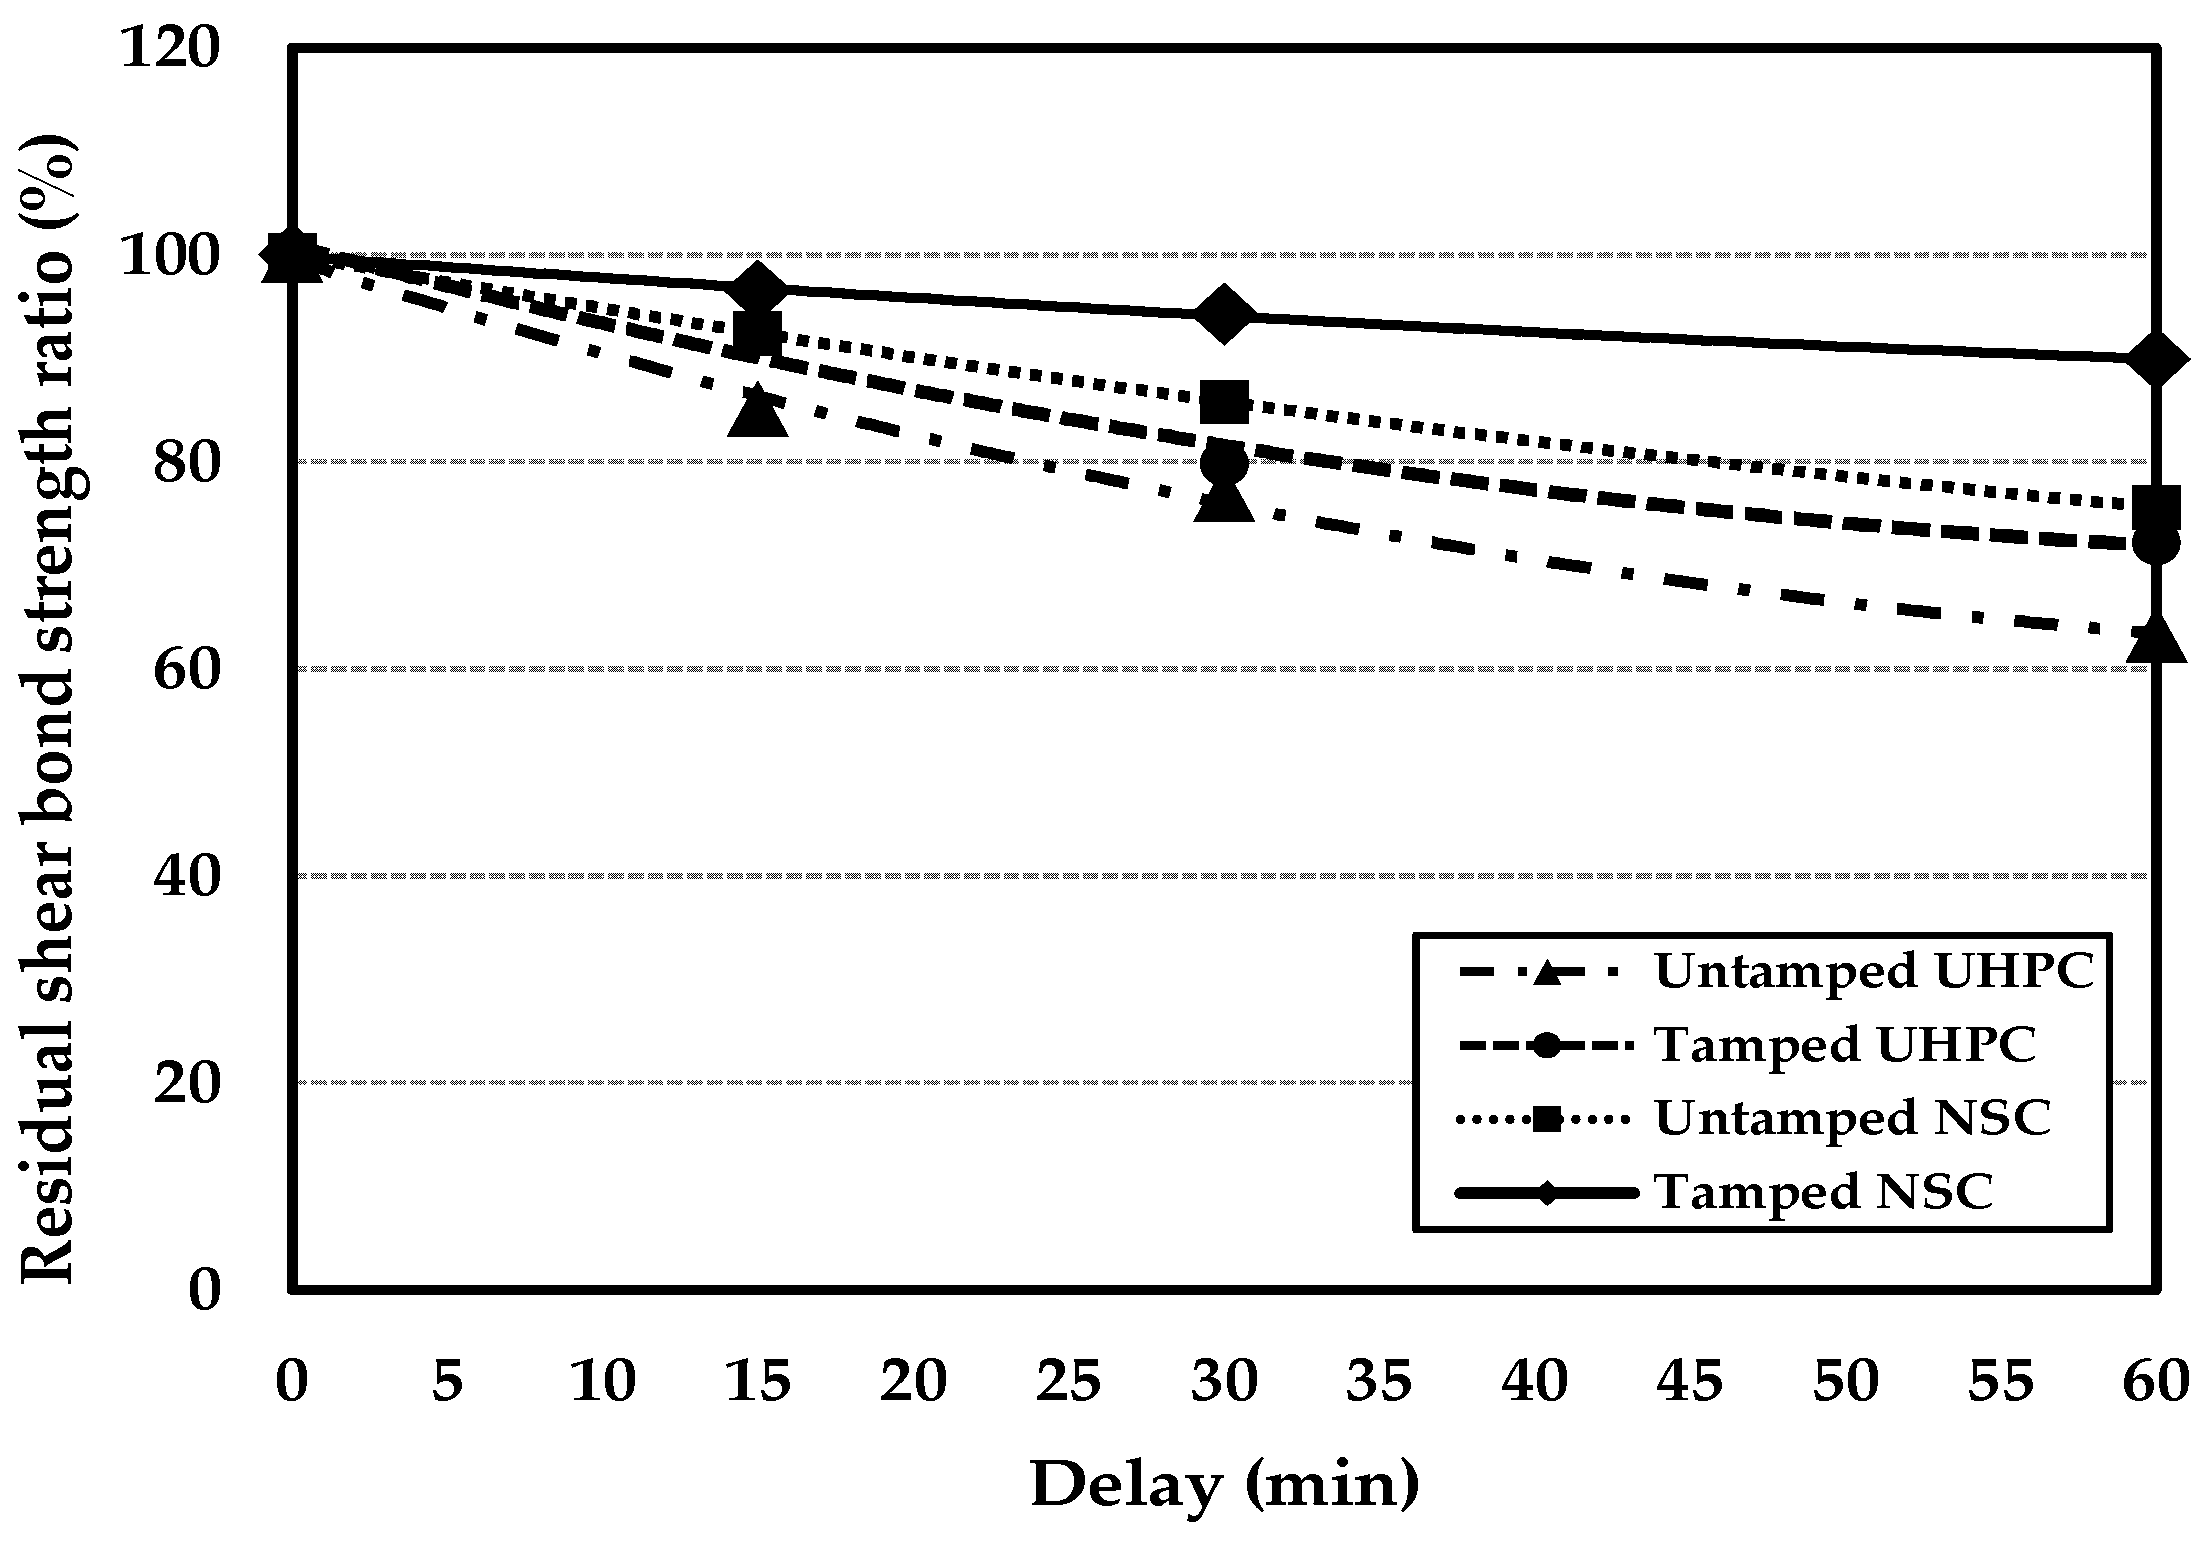
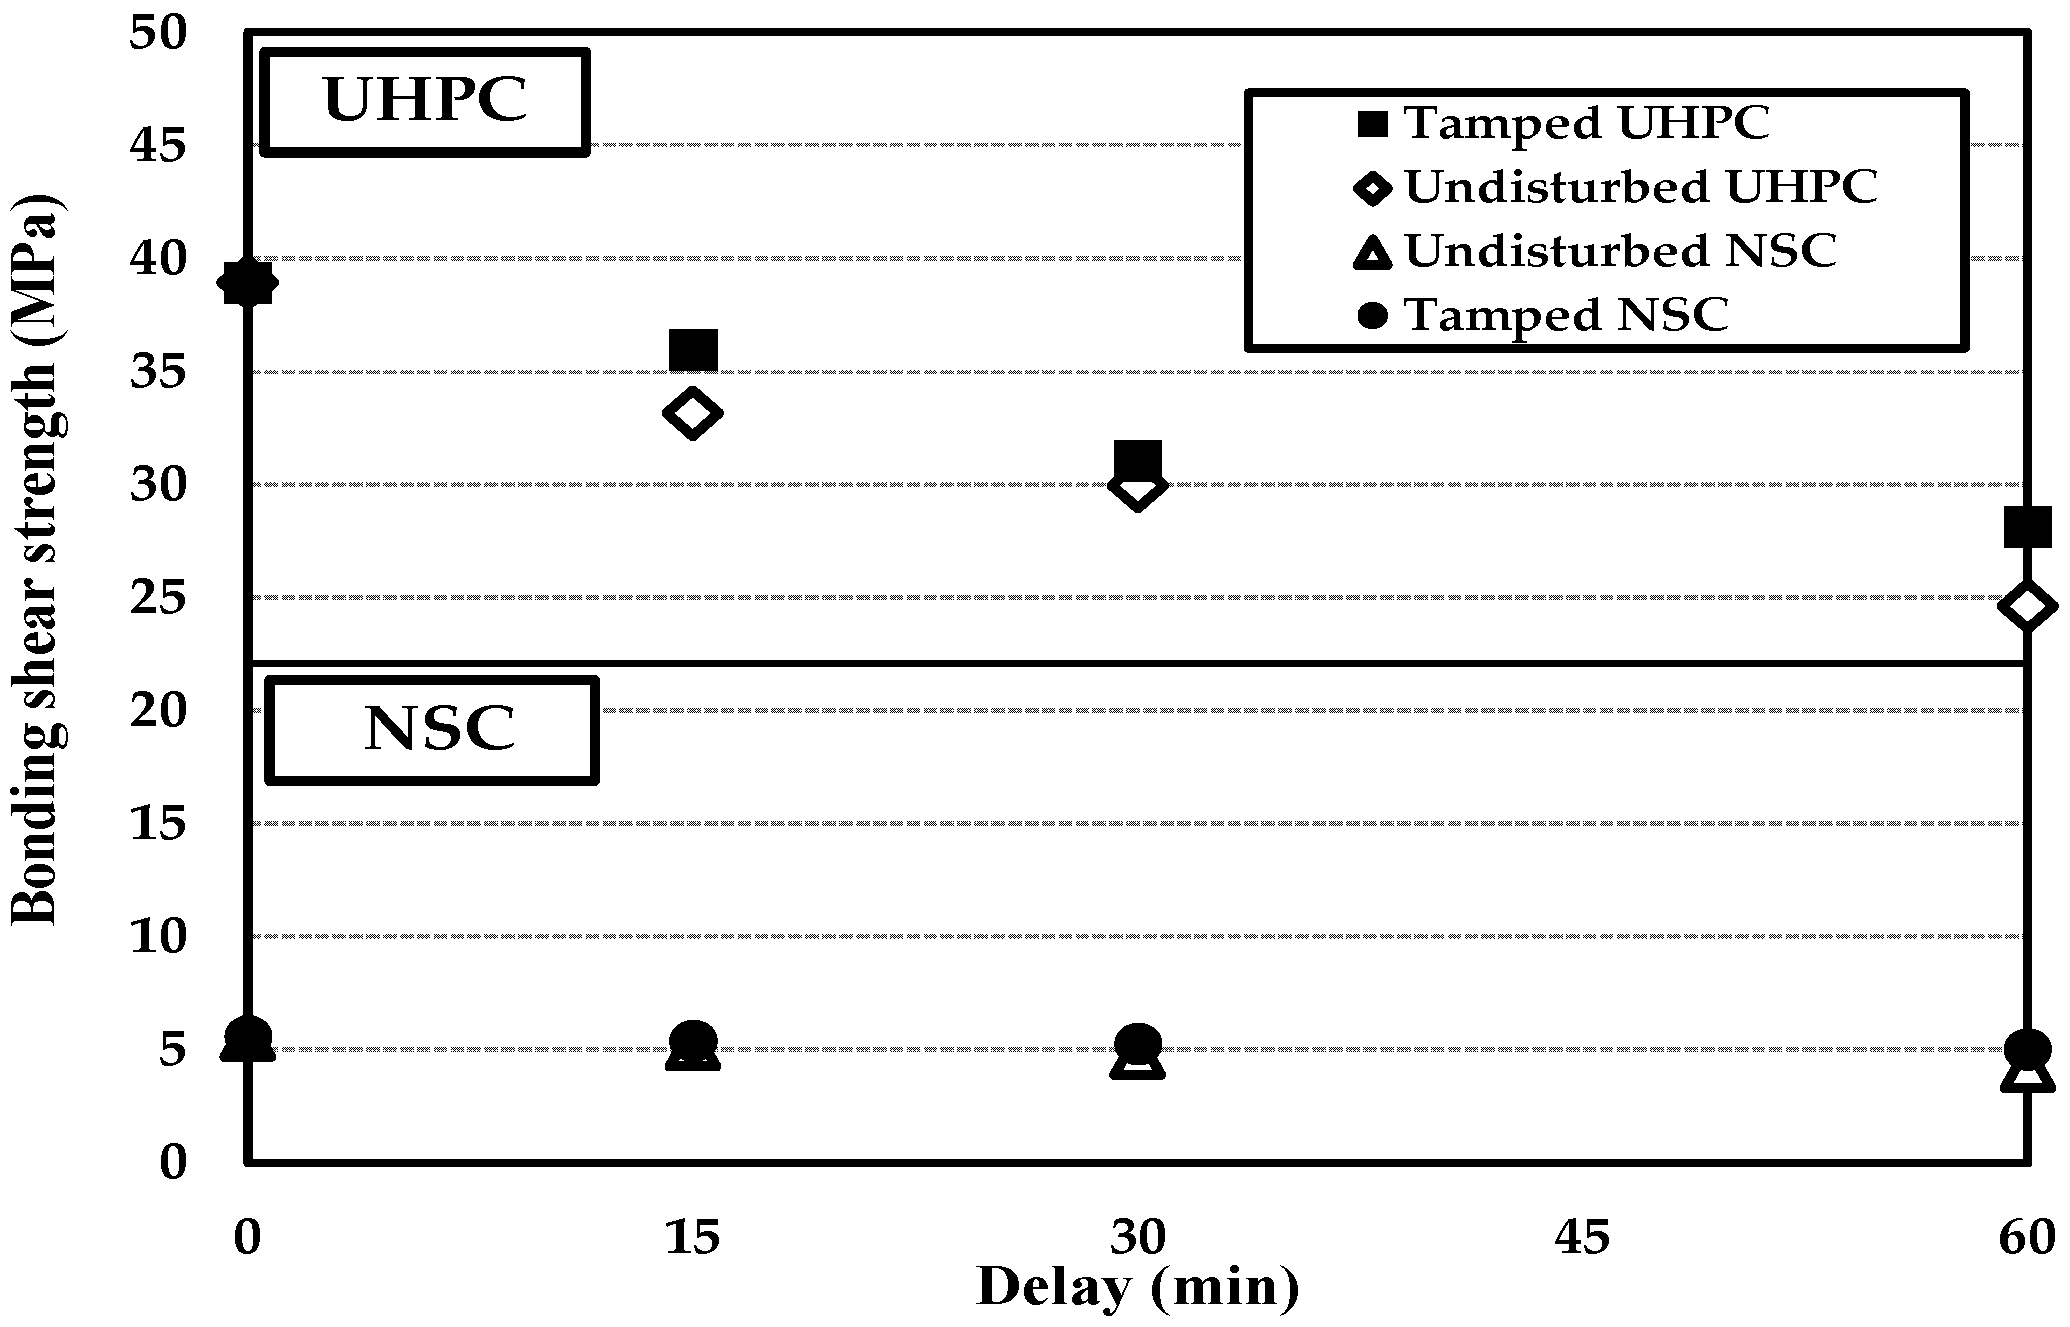
- Tamped NSC shows around a 5% increase in the bonding shear strength relative to the non-tamped NSC, and around a 5% decrease in the bonding shear strength with a delay of up to 60 min. As such, it is believed that tamping can lead to more than 95% monolithicity provided the cold joint is formed within 60 min.
- The bonding shear strength of UHPC showed a tendency to gradually decrease as the delay until the cold joint formed increased, regardless of whether tamping was performed. Tamping resulted in an enhancement of the bonding shear performance of about 7%. Moreover, a delay of 15 min resulted in a decrease in the bonding shear strength of about 8%, corresponding to indicating the best bonding shear performance.
- An analysis of the failure mode after direct shear tests revealed that the interfacial and non-interfacial failure modes could be distinguished upon a reduction in the normalized bonding shear strength of around 10%. As such, the optimal cold joint delay was found to be 60 min for tamped NSC, and 15 min for tamped UHPC. Moreover, for non-tamped cases, the optimal condition was 15 min for NSC, and it is believed that physical or chemical interfacial treatment of the bonding surface is necessary for UHPC upon the occurrence of any delay.
- From a visual observation of the poured surface of UHPC with respect to the delay of the cold joint, it was found that a thin film forms at the surface once the delay reaches 15 min, with the surface film becoming thicker once the delay reaches 60 min. Therefore, it is believed that the degradation of the bonding shear performance is due to the formation of the film at the surface.
- A SEM analysis of the middle sections and cold joint surfaces of the specimens revealed that the film of the layer structure was observed in the cold joint surface of UHPC after aging for three days, and no initial hydration products were observed. Moreover, no significant change was observed in the cold joint surface of a specimen that had been aged for 28 days, compared to that which had been aged for three days.
Acknowledgments
Author Contributions
Conflicts of Interest
References
- Zhao, S.; Sun, W. Nano-mechanical behavior of a green ultra-high-performance concrete. Constr. Build. Mater. 2014, 63, 150–160. [Google Scholar] [CrossRef]
- Shi, C.J.; Wu, Z.M.; Xiao, J.F.; Wang, D.H.; Huang, Z.Y.; Fang, Z. A review on ultra high performance concrete: Part I. Raw materials and mixture design. Constr. Build. Mater. 2015, 101, 741–751. [Google Scholar] [CrossRef]
- Wang, X.Y. Properties prediction of ultra high performance concrete using blended cement hydration model. Constr. Build. Mater. 2014, 64, 1–10. [Google Scholar] [CrossRef]
- Graybeal, B.; Tanesi, J. Durability of an ultrahigh-performance concrete. Mater. Civ. Eng. 2007, 19, 848–854. [Google Scholar] [CrossRef]
- De Larrard, F. Concrete Mixture Proportioning: A Scientific Approach; CRC Press: New York, NY, USA, 1999. [Google Scholar]
- Iravani, S. Mechanical properties of high-performance concrete. ACI Mater. J. 1996, 93, 416–426. [Google Scholar]
- Magureanu, C.; Sosa, I.; Negrutiu, C.; Heghes, B. Mechanical Properties and Durability of Ultra-High-Performance Concrete. ACI Mater. J. 2012, 109, 177–183. [Google Scholar]
- Bragov, A.M.; Petrov, Y.V.; Karihaloo, B.L.; Konstantinov, A.Y.; Lamzin, D.A.; Lomunov, A.K.; Smirnov, I.V. Dynamic strengths and toughness of an ultra high performance fiber reinforced concrete. Eng. Fract. Mech. 2013, 110, 477–488. [Google Scholar] [CrossRef]
- Beushausen, H.D. Long-Term Performance of Bonded Overlays Subjected to Differential Shrinkage. Ph.D. Thesis, University of Cape Town, Cape Town, South Africa, 2005. [Google Scholar]
- Ay, L. Curing tests on ultra high strength plain and steel fibrous cement based composites. In Proceedings of International Symposium on Ultra High Performance Concrete, Kassel, Germany, 13–15 September 2004; pp. 695–701.
- Rathi, V.R.; Kolase, P.K. Effect of cold joint on strength of concrete. Int. J. Innov. Res. Sci. Eng. Technol. 2013, 2, 4671–4679. [Google Scholar]
- Xiao, J.; Sun, C.; Lange, D.A. Effect of joint interface conditions on shear transfer behavior of recycled aggregate concrete. Constr. Build. Mater. 2016, 105, 343–355. [Google Scholar] [CrossRef]
- Martin, F.A.; Rivard, P. Effects of freezing and thawing cycles on the shear resistance of concrete lift joints. Can. J. Civ. Eng. 2012, 39, 1089–1099. [Google Scholar] [CrossRef]
- Korean Standard KS L 5201. Portland Cement; Korean Agency for Technology and Standards (KATS): Seoul, Korea, 2013.
- Korean Standard KS F 2594. Method of Test for Slump Flow of Fresh Concrete; Korean Agency for Technology and Standards (KATS): Seoul, Korea, 2015.
- Korean Standard KS F 2403. Standard Test Method for Making and Curing Concrete Specimens; Korean Agency for Technology and Standards (KATS): Seoul, Korea, 2014.
- Korean Standard KS F 2405. Standard Test Method for Compressive Strength of Concrete; Korean Agency for Technology and Standards (KATS): Seoul, Korea, 2010.
- Abu-Tair, A.I.; Rigden, S.R.; Burley, E. Testing the bond between repair materials and concrete substrate. ACI Mater. J. 1996, 93, 553–558. [Google Scholar]
- British Standard BS 6319-4. Method for Measurement of Bond Strength (Slant-Shear Method); British Standard Institute (BSI): London, UK, 1984. [Google Scholar]
- Austin, S.; Robins, P.; Pan, Y.G. Shear bond testing of concrete repairs. Cem. Concr. Res. 1999, 29, 1067–1076. [Google Scholar] [CrossRef]
- Santos, D.S.; Santos, P.M.D.; Dias-da-Costa, D. Effect of surface preparation and bonding agent on the concrete-to-concrete interface strength. Constr. Build. Mater. 2012, 37, 102–110. [Google Scholar] [CrossRef]
- Momayeza, A.; Ehsani, M.R.; Ramezanianpoura, A.A.; Rajaiea, H. Comparison of methods for evaluating bond strength between concrete substrate and repair materials. Cem. Concr. Res. 2005, 35, 748–757. [Google Scholar] [CrossRef]
- Bissonnette, B.; Vaysburd, A.M.; von Fay, K.F. Best Practices for Preparing Concrete Surfaces Prior to Repairs and Overlays; Transportation Research Board of the National Academies (TRB): Washington, DC, USA, 2012. [Google Scholar]
- Reda, M.M.; Shrive, N.G.; Gillott, J.E. Microstructural investigation of innovative UHPC. Cem. Concr. Res. 1999, 29, 323–329. [Google Scholar] [CrossRef]


| Experimental Factor | Levels | Number of Levels |
|---|---|---|
| Strength of Concrete (Proportioning Strength) | NSC 1 (30 MPa), UHPC (180 MPa) | 2 |
| Tamping Condition | Tamping, Non-tamping | 2 |
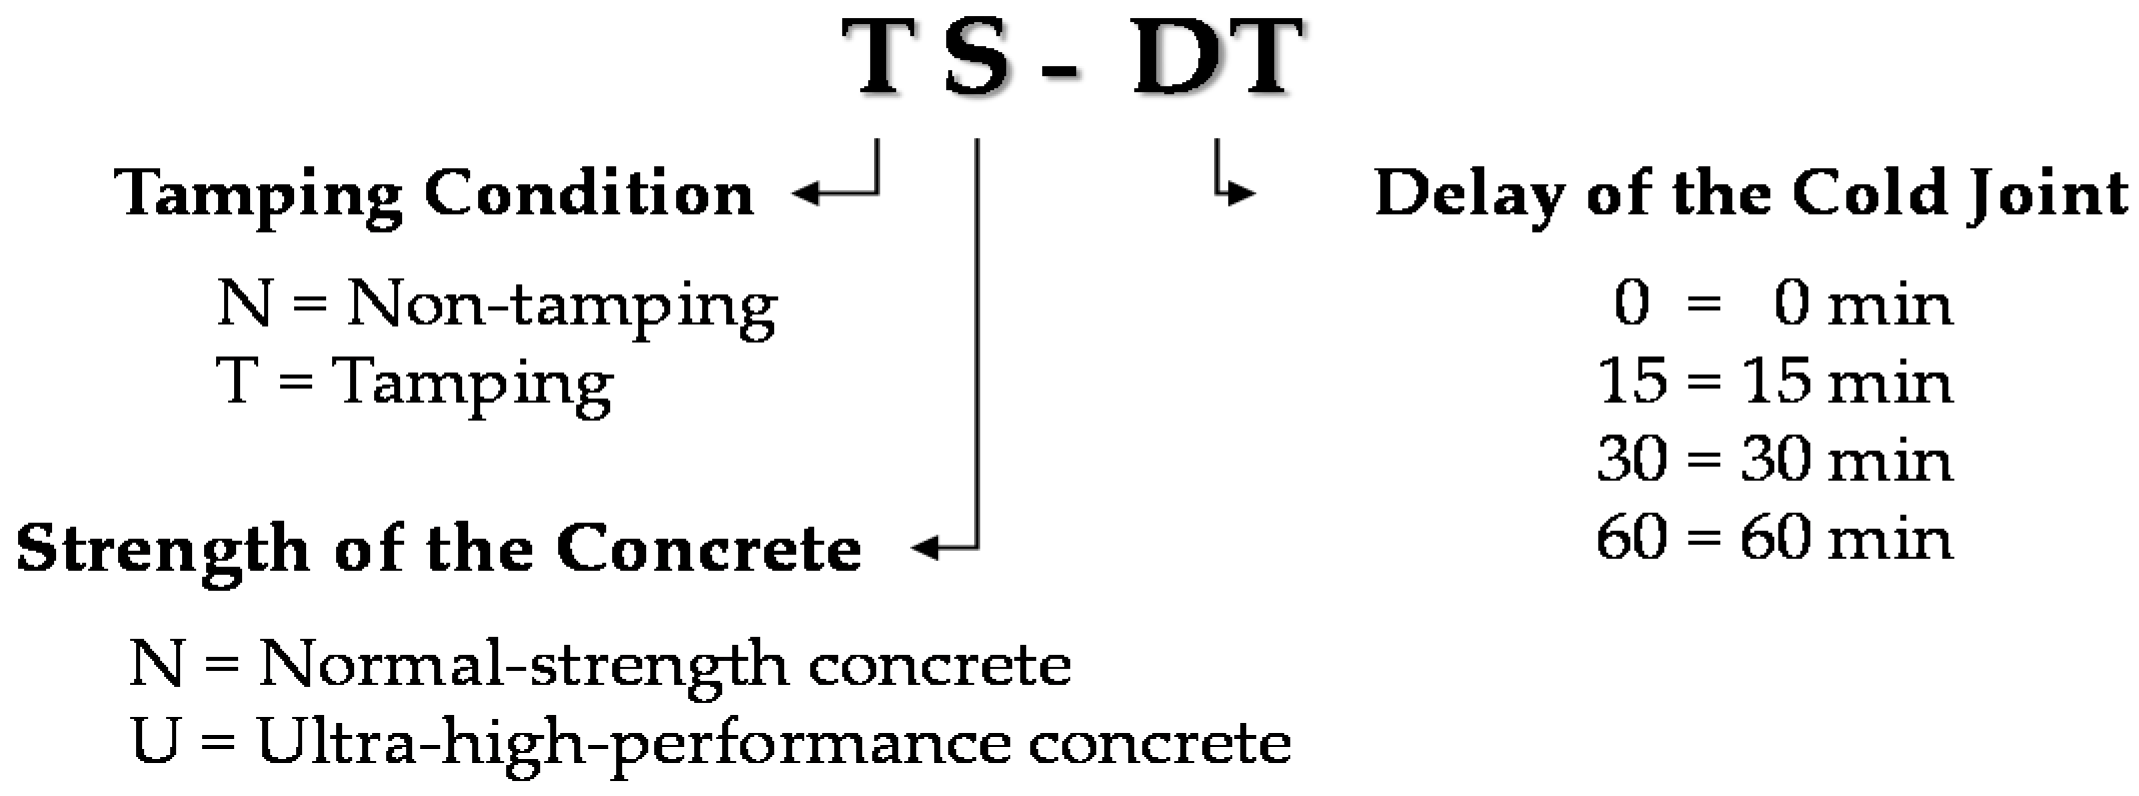
| Delay of the Cold Joint | 0, 15, 30, and 60 min | 4 |
| No. | Specimen Name | 1st Con’c | 2nd Con’c | Tamping Condition | Delay |
|---|---|---|---|---|---|
| 1 | NN-0 | 30 | - | - | 0 |
| 2 | NN-15 | 30 | 30 | × | 15 |
| 3 | NN-30 | 30 | 30 | × | 30 |
| 4 | NN-60 | 30 | 30 | × | 60 |
| 5 | TN-15 | 30 | 30 | ○ | 15 |
| 6 | TN-30 | 30 | 30 | ○ | 30 |
| 7 | TN-60 | 30 | 30 | ○ | 60 |
| 8 | NU-0 | 180 | - | - | 0 |
| 9 | NU-15 | 180 | 180 | × | 15 |
| 10 | NU-30 | 180 | 180 | × | 30 |
| 11 | NU-60 | 180 | 180 | × | 60 |
| 12 | TU-15 | 180 | 180 | ○ | 15 |
| 13 | TU-30 | 180 | 180 | ○ | 30 |
| 14 | TU-60 | 180 | 180 | ○ | 60 |
| Division | SiO2 (%) | Al2O3 (%) | MgO (%) | TiO2 (%) | SO3 (%) | CaO (%) | Fe2O3 (%) | Na2O (%) | K2O (%) | f-CaO (%) | etc. (%) | Ig.loss (%) |
|---|---|---|---|---|---|---|---|---|---|---|---|---|
| OPC | 19.47 | 5.24 | 3.72 | - | 2.49 | 61.8 | 2.69 | 0.18 | 0.87 | - | 0.94 | 2.6 |
| F 1 | 99.47 | 0.4 | 0.009 | 0.04 | - | 0.01 | 0.5 | 0.008 | 0.006 | - | - | - |
| EA 2 | 1.00 | 16.1 | - | - | 27.5 | 52.8 | 0.8 | - | - | 49.8 | - | - |
| Zr 3 | 96.00 | 0.25 | 0.1 | - | - | 0.38 | 0.12 | - | - | - | - | - |
| SRA 4 | 29.42 | 0.17 | 0.06 | - | - | 1.39 | 0.10 | - | 0.03 | - | - | - |
| Division | Fineness Modulus | Density (g/cm3) | Ratio of Absolute Volume (%) | Water Absorption Ratio (%) | Unit Volume Weight (kg/m3) |
|---|---|---|---|---|---|
| Sand | 3.04 | 2.59 | 54.3 | 0.81 | 1406 |
| Gravel | 6.88 | 2.60 | 58.5 | 0.63 | 1521 |
| Division | Density (g/cm3) | pH | Alkali Content (%) | Chloride Content (%) | Appearance |
|---|---|---|---|---|---|
| AE 1 | 1.05 | 6.5 ± 2.0 | 0.81 | below 0.01 | Light brown liquid |
| Division | W/B | Unit weight (kg/m3 ) | AD 6 (kg) | AF 7 (kg) | |||||||||
|---|---|---|---|---|---|---|---|---|---|---|---|---|---|
| W | C | F | EA | SRA | Zr | Steel Fibers 1 | Steel Fibers 2 | S 3 (Q) 4 | G 5 | ||||
| NSC | 0.4 | 188 | 467 | - | - | - | - | - | - | 746 | 907 | 0.09 | - |
| UHPC | 0.14 | 178 | 783 | 235 | 59 | 8 | 196 | 39 | 78 | (862) | - | 26.1 | 0.78 |
| Division | Flowability (mm) | Curing | Compressive Strength (MPa) | Average Compressive Strength (MPa) | |||
|---|---|---|---|---|---|---|---|
| Condition | Period (day) | 1 (min) | 2 | 3 (max) | |||
| NSC | Slump 163 ± 10 | Steam curing 1 | 7 | 25.8 | 26.1 | 26.7 | 26.2 |
| Air 2 | 7 | 13.3 | 13.8 | 14.1 | 13.7 | ||
| 28 | 24.8 | 25.3 | 25.9 | 25.3 | |||
| UHPC | Slump flow 680 ± 50 | Steam curing | 7 | 170.1 | 175.8 | 177.1 | 174.3 |
| Air | 7 | 103.4 | 105.7 | 109.8 | 106.3 | ||
| 28 | 126.5 | 127.5 | 128.3 | 127.4 | |||
| No. | Specimen Name | Delay | Maximum Load (kN) | Average Maximum Load (kN) | Shear Bond Strength (MPa) | Residual Shear Bond Strength Ratio (%) | ||
|---|---|---|---|---|---|---|---|---|
| 1 | 2 | 3 | ||||||
| 1 | NN-0 | 0 | 250.3 | 262.3 | 241.1 | 251.2 | 5.6 | 100 |
| 2 | NN-15 | 15 | 228.9 | 229.9 | 239.3 | 232.7 | 5.2 | 92.4 |
| 3 | NN-30 | 30 | 212.3 | 210.3 | 224.3 | 215.6 | 4.8 | 85.8 |
| 4 | NN-60 | 60 | 198.1 | 194.9 | 176.5 | 189.8 | 4.2 | 75.6 |
| 5 | TN-15 | 15 | 237.3 | 236.3 | 253.7 | 242.4 | 5.4 | 96.5 |
| 6 | TN-30 | 30 | 240.8 | 233.8 | 236.2 | 236.9 | 5.3 | 94.3 |
| 7 | TN-60 | 60 | 233.1 | 227.5 | 217.0 | 225.9 | 5.0 | 89.9 |
| 8 | NU-0 | 0 | 1786.3 | 1708.7 | 1759.3 | 1751.4 | 38.9 | 100 |
| 9 | NU-15 | 15 | 1504.1 | 1523.3 | 1445.8 | 1491.1 | 33.1 | 85.1 |
| 10 | NU-30 | 30 | 1294.2 | 1386.1 | 1361.4 | 1347.2 | 29.9 | 76.9 |
| 11 | NU-60 | 60 | 1026.0 | 1165.3 | 1132.3 | 1107.9 | 24.6 | 63.3 |
| 12 | TU-15 | 15 | 1687.7 | 1664.5 | 1502.9 | 1618.4 | 36.0 | 92.4 |
| 13 | TU-30 | 30 | 1418.5 | 1455.9 | 1319.9 | 1398.1 | 31.1 | 79.8 |
| 14 | TU-60 | 60 | 1222.0 | 1263.7 | 1310.0 | 1265.2 | 28.1 | 72.2 |
| Division | Tamping Condition | Failure Modes of Specimens | |||
|---|---|---|---|---|---|
| 0 min | 15 min | 30 min | 60 min | ||
| NSC | Non-tamping | N 1 | N | I | I 2 |
| Tamping | N | N | N | N | |
| UHPC | Non-tamping | N | I | I | I |
| Tamping | N | N | I | I | |
© 2016 by the authors; licensee MDPI, Basel, Switzerland. This article is an open access article distributed under the terms and conditions of the Creative Commons Attribution (CC-BY) license (http://creativecommons.org/licenses/by/4.0/).
Share and Cite
Lee, H.-S.; Jang, H.-O.; Cho, K.-H. Evaluation of Bonding Shear Performance of Ultra-High-Performance Concrete with Increase in Delay in Formation of Cold Joints. Materials 2016, 9, 362. https://doi.org/10.3390/ma9050362
Lee H-S, Jang H-O, Cho K-H. Evaluation of Bonding Shear Performance of Ultra-High-Performance Concrete with Increase in Delay in Formation of Cold Joints. Materials. 2016; 9(5):362. https://doi.org/10.3390/ma9050362
Chicago/Turabian StyleLee, Han-Seung, Hyun-O Jang, and Keun-Hee Cho. 2016. "Evaluation of Bonding Shear Performance of Ultra-High-Performance Concrete with Increase in Delay in Formation of Cold Joints" Materials 9, no. 5: 362. https://doi.org/10.3390/ma9050362
APA StyleLee, H.-S., Jang, H.-O., & Cho, K.-H. (2016). Evaluation of Bonding Shear Performance of Ultra-High-Performance Concrete with Increase in Delay in Formation of Cold Joints. Materials, 9(5), 362. https://doi.org/10.3390/ma9050362