3.1. Laser Cladding Process for the Cu-Ni-10(W,Si) Bottom Layer
The optimization of the preparation process parameters for the bottom layer mainly focused on three factors: laser power (P), scanning speed (V), and scanning step (H). The prepared samples were labeled 1
# to 9
#, and the areal energy density (E) corresponding to each set of process parameters is presented in
Table 2. The factor and variable levels for the bottom layer laser cladding were as follows: laser power P (4000 W, 4500 W, and 5000 W), scanning speed V (30 mm/s, 60 mm/s, and 120 mm/s), and scanning step H (1 mm, 2 mm, and 3 mm). In this experiment, the laser spot diameter was set to 5 mm, and the Cu-Ni-10(W,Si) coating powder was used for cladding. Using the surface dye penetrant inspection results, cross-sectional microstructure quality, and microhardness as optimization criteria, the range analysis method was employed to evaluate the primary and secondary relationships between the laser cladding process parameters and the forming quality, and to obtain the optimal process parameters for the bottom layer preparation.
According to the experimental parameters designed in
Table 2, coatings with different process parameters (samples 1
# to 9
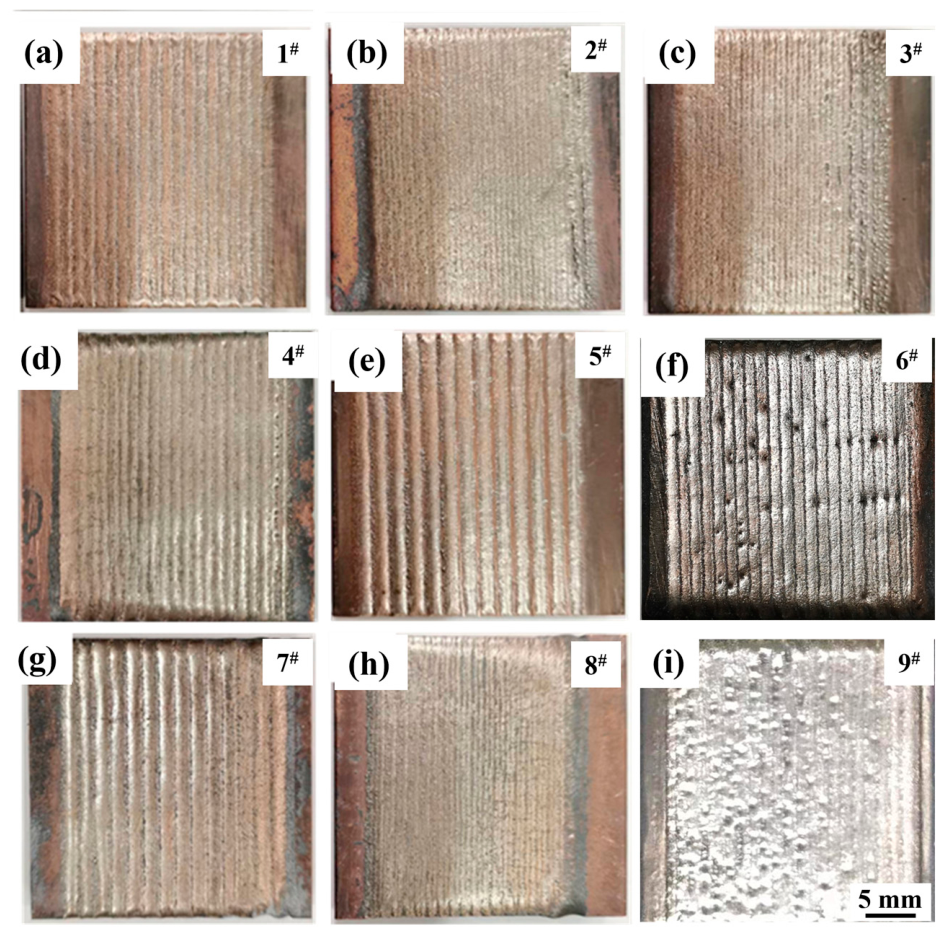
#) were cladded on the Cu-Cr-Zr alloy surface. Their macroscopic morphologies are shown in
Figure 3. All samples prepared under process parameters 1
# to 9
# exhibited good metallic luster on the surface. Except for samples 6
# and 8
#, no obvious macroscopic cracks were observed on the coating surfaces. Sample 6
# exhibited numerous cladding discontinuities on the surface, which could easily become crack initiation sites for local cracking. For sample 8
#, due to the high energy density of the laser beam, the temperature gradient during cooling was the largest, leading to a high tendency for crack formation. Overly wide overlapping between cladding tracks was clearly observed on the surfaces of samples 1
#, 5
#, and 7
#. Because the overlap ratio between adjacent cladding tracks was too low, the molten metal could not be discharged in time after cladding, potentially leading to internal cracks and poor metallurgical bonding between cladding tracks. Samples 2
# and 3
# exhibited local discontinuities of cladding tracks at the initial stage of cladding on their surfaces, along with the presence of fine metal balls around the discontinuous tracks. For samples 2
# and 3
#, at the initial cladding stage, the substrate surface temperature was low, resulting in poor wettability between the molten metal and the melt pool, making uniform spreading difficult. When the molten metal could not spread uniformly, it tends to solidify and contract on the surface into spheroidized balls of varying sizes, ultimately forming local discontinuities. Additionally, when the laser beam impinges on the melt pool, the kinetic energy of the laser beam is converted into surface energy of the fine balls, generating fine metal balls around the discontinuous tracks. As cladding proceeded further, heat accumulated on the surface, improving the wettability of the molten metal in the melt pool, ultimately resulting in relatively flat overlaps in the later stage of cladding. In
Figure 3i, sample 9
# exhibited obvious pores on the surface. Because the areal energy density of the laser beam under the 9
# process was the lowest, the interaction between the laser beam and the powder/substrate was weak, resulting in poor wettability of the coating, deteriorated melt spreadability and fluidity, and ultimately the formation of pores. Comparing the above eight specimens, sample 4
# in
Figure 3d exhibited good overlap between cladding tracks with high flatness on the surface, and no obvious macroscopic cracks or cladding track discontinuities were observed.
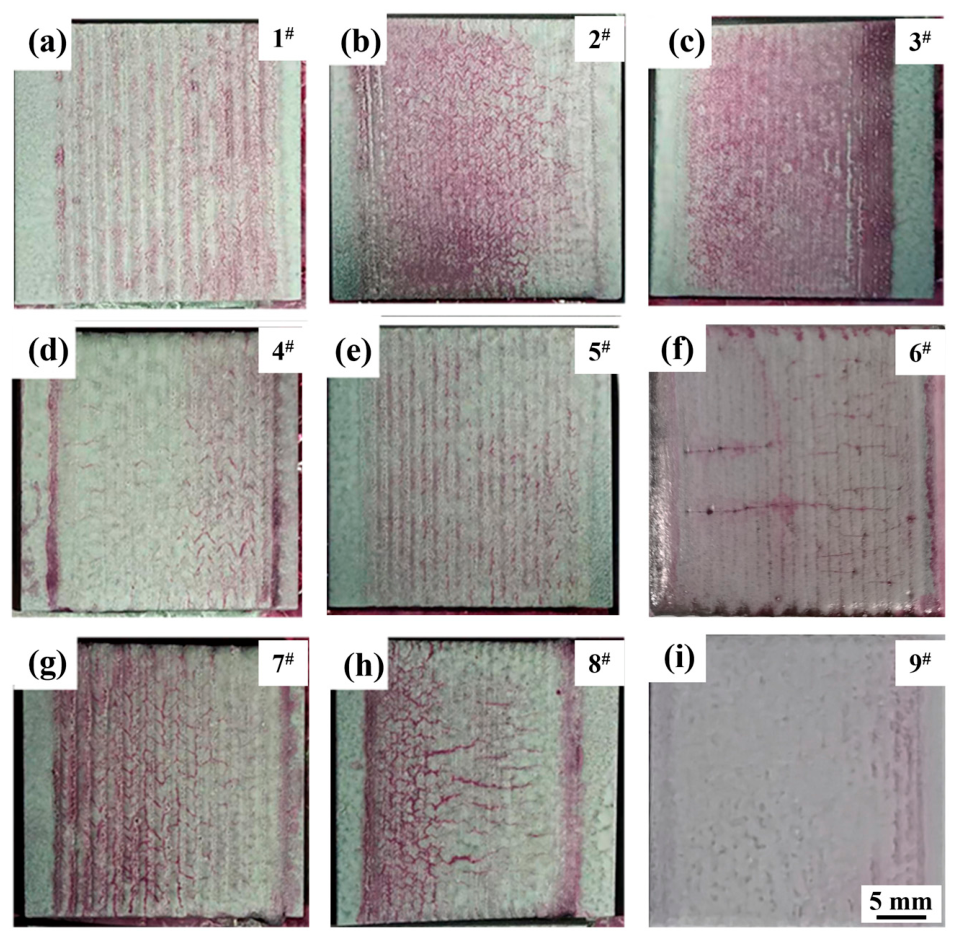
The coating surface may contain not only macroscopic cracks but also microscopic cracks. Macroscopic cracks can be directly observed on the sample surface, whereas microscopic cracks can only be identified using dye penetrant inspection.
Figure 4 presents the dye penetrant inspection results of coatings prepared under different process parameters (samples 1
# to 9
#), in which the continuous red areas indicate fine cracks. Samples 2
#, 3
#, 4
#, 6
#, 7
#, and 8
# exhibit pronounced interlacing cracks, with samples 6# and 8# showing obvious longitudinal cracks. Owing to the rapid heating and rapid cooling characteristics of the laser cladding process, a large temperature gradient exists during melting and solidification, and the solidification time is short. Consequently, the cladded coatings are predominantly characterized by cold cracks [
34,
35]. Furthermore, copper alloys possess high thermal conductivity, which further increases the temperature gradient between the coating and the substrate. The thermal stress generated by this temperature gradient during cooling and solidification cannot be released in time and ultimately remains as residual stress within the coating [
36]. When the residual stress exceeds a critical value, cracks initiate. Defects within the cladding layer are subjected to significant stress due to rapid heating and cooling, and pores act as stress concentration sites, becoming the first locations to crack [
37]. Samples 2
# and 3
# do not exhibit continuous cracks at the initial stage of cladding; however, cracks appear in the coating during the later stage of cladding. Compared with the above seven specimens, samples 4
#, 5
#, and 9
# exhibit lower crack content on the surface. For sample 5
#, due to excessive overlap, cracks are only present on the surface of the cladding tracks. In contrast, sample 9
#, which has a low areal energy density, exhibits poor wettability on the surface, resulting in numerous discontinuities and pores. Sample 4
#, subjected to a high laser beam energy density combined with the high thermal conductivity of the substrate, experiences significant stress, which ultimately leads to forming fine cracks on the coating surface.
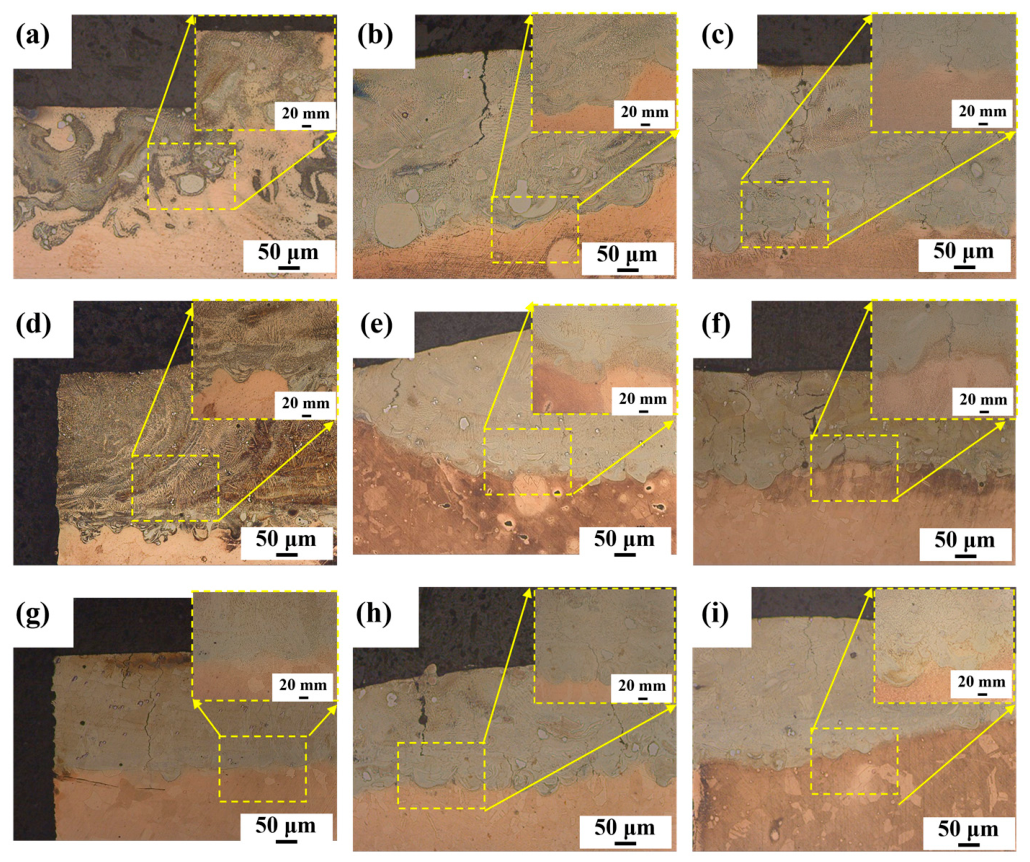
To further determine whether the surface cracks on the coatings extend into the interior, whether a bottom coating of good quality can be obtained after grinding, and whether a well-bonded interface is formed between the coating and the substrate, the cross-sectional microstructures of samples 1
# to 9
# were analyzed, and the resulting metallographic structures of the coating cross-sections are shown in
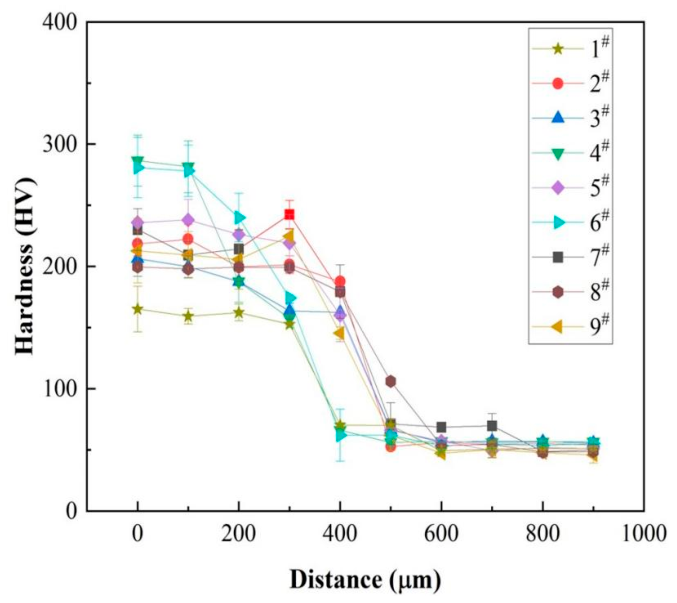
Figure 5. Microhardness tests were conducted on samples 1
# to 9
#, and the resulting microhardness curves of the coatings are presented in
Figure 6. The average surface microhardness values of samples 1
# to 9
# are 165.1 HV, 218.4 HV, 206.4 HV, 286.5 HV, 235.8 HV, 280.8 HV, 230.1 HV, 199.7 HV, and 212.8 HV, respectively. Among these, samples 4
# and 6
# exhibit higher surface hardness (286.5 HV and 280.8 HV, respectively), while sample 1
# exhibits the lowest hardness (162.2 HV), with the hardness of the remaining samples falling between these values. From the microstructures shown in
Figure 5, it can be seen that for samples 4
# and 6
#, the higher energy density leads to an increased melting rate of W particles in the coating, forming more fine and dispersed phases. These dispersed phases hinder grain growth, thereby promoting grain refinement and enhancing the effect of fine-grain strengthening. In contrast, for sample 1
#, due to the combination of low laser beam energy and a low overlap ratio, the excessively rapid cooling rate causes Marangoni forces within the melt pool to affect fluid flow [
38], and the resulting segregation reduces the hardness of the coating.
The microhardness results from the orthogonal experiments were processed using range analysis, and the obtained analysis results are presented in
Table 3. The bottom layer of the coating requires a certain degree of deformation resistance. Meanwhile, considering that fewer cracks on the surface and cross-section lead to higher stability, the primary and secondary order of factors and the optimal levels vary for each evaluation criterion. The main factors influencing microhardness are scanning step (H) and laser power (P), with the optimal level combination being P2V3H2. By comprehensively analyzing the surface macroscopic morphology, dye penetrant inspection results, and cross-sectional microstructure of the coatings, it was found that scanning speed (V) is the most sensitive factor affecting crack formation in the coating and has the least influence on microhardness. Consequently, P2V1H2 was determined as the optimal laser cladding process combination. Therefore, the optimized process parameters for the bottom layer are a laser power (P) of 4500 W, a scanning speed (V) of 30 mm/s, and a scanning step (H) of 2 mm.
3.2. Laser Cladding Process for the Cu-Ni-20(W,Si) Top Layer
During the preparation of the bottom layer, due to the high reflectivity of Cu to the laser beam, the actual energy incident on the substrate surface is much lower than the energy emitted by the laser. If the process parameters used for cladding the bottom layer were to be directly applied, the laser energy acting on the powder and the bottom layer would be too high, causing significant dilution of the bottom layer and increasing the tendency for segregation and cracking within the coating [
39]. Therefore, when preparing the top layer on top of the bottom layer, the process parameters for the top layer need to be re-optimized to achieve the optimal energy density for laser–powder interaction and to produce a top layer with high cladding quality. After the optimal overlap step distance was determined, the laser power and scanning speed were subsequently optimized. The optimization parameters are listed in
Table 4, and the prepared samples are labeled 1
# to 6
#. The other cladding parameters were as follows: scanning step of 2 mm, laser spot diameter of 5 mm. The compositions of the bottom layer and the top layer were Cu-Ni-10(W,Si) and Cu-Ni-20(W,Si) coating powders, respectively.
According to the experimental parameters designed in
Table 4, Cu-Ni-20(W,Si) top layers with different process parameters (samples 1
# to 6
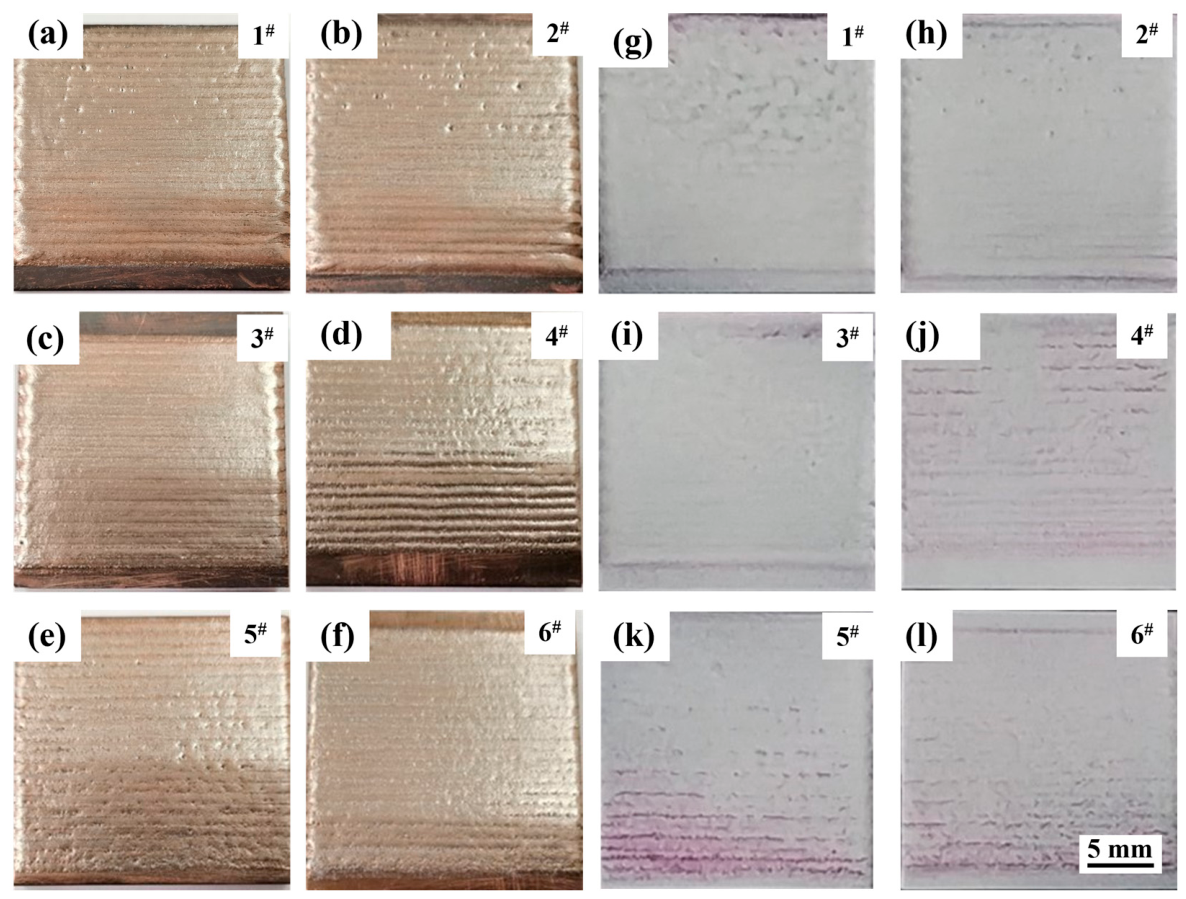
#) were cladded onto the surface of the Cu-Ni-10(W,Si) bottom layer. The top layer samples are shown in
Figure 7a–f. It can be observed that all samples 1
# to 6
# exhibit good metallic luster on the surface, with no obvious macroscopic cracks on the gradient coating surface. In
Figure 7d, sample 4
# exhibits local overlapping discontinuity on the surface. Comparing
Figure 7a,b with
Figure 7d,e, samples 1
#, 2
#, 4
#, and 5
# exhibit small pits on the surface, while samples 3
# and 6
# in
Figure 7c,f show smooth surfaces without pits. The formation of such pits and discontinuities is mainly attributed to the poor wettability of the powder, which prevents it from spreading uniformly on the surface. As the energy density of the laser beam increases, the molten metal gains better wettability and spreads more easily [
40]. Dye penetrant inspection was further employed to evaluate the quality of the cladded surface and to ensure the stability of the bottom layer. The dye penetrant inspection results are shown in
Figure 7g–l. As presented in
Figure 7g–i, the gradient coating surfaces prepared under processes 1
#, 2
#, and 3
# exhibit no obvious cracks. However, in
Figure 7j–l, local cracks appear in the initial cladding region of the gradient coating. Compared with the optimal preparation parameters for the bottom layer, the cladding process for the second layer significantly reduces the cracking tendency of the coating.
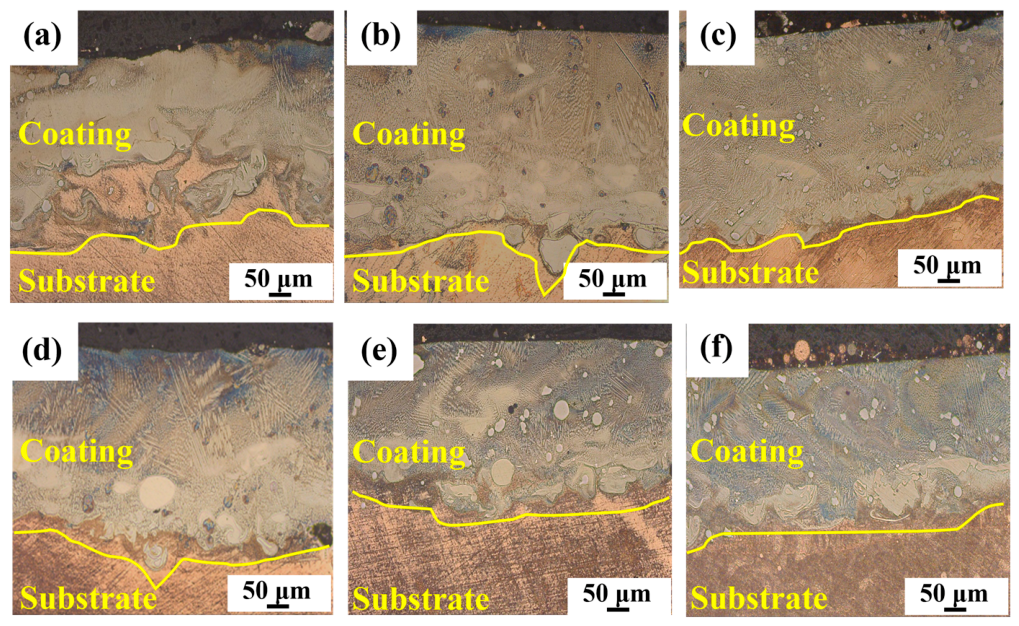
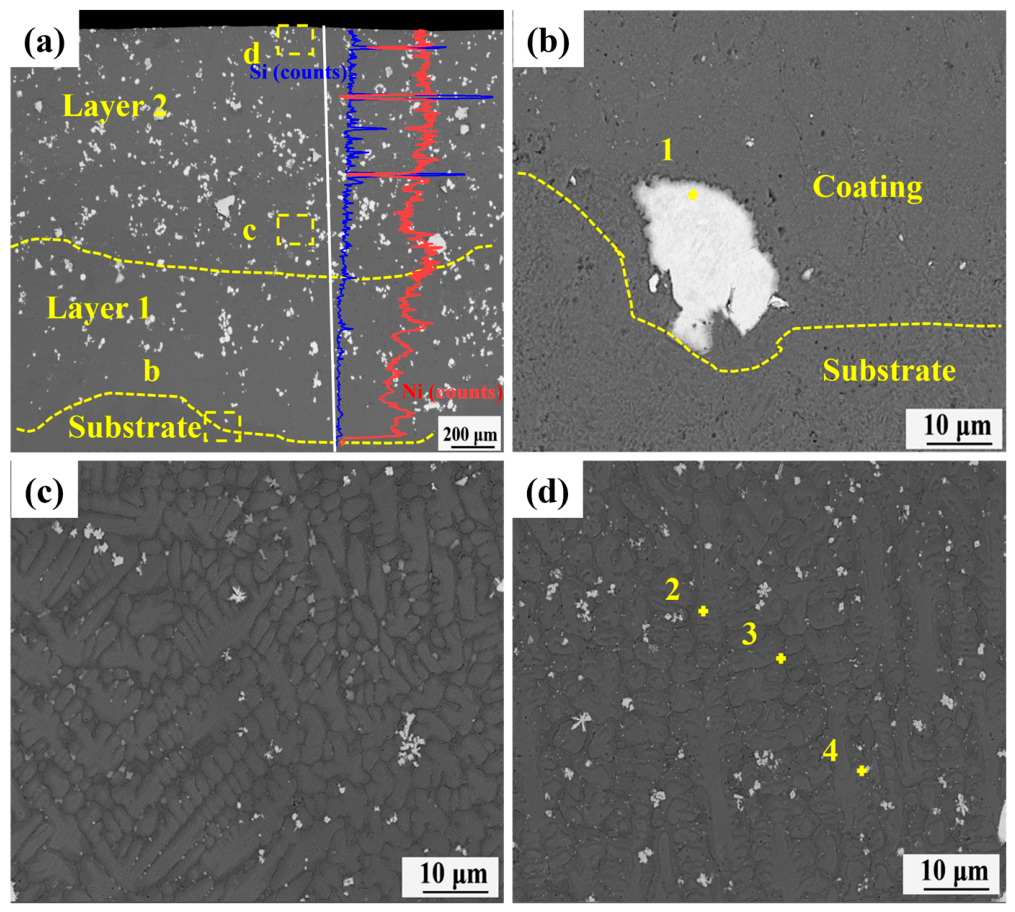
The denser the cross-sectional microstructure of the top layer coating, the better the forming quality of the top layer and the lower the cracking tendency. To obtain the metallographic structure of the gradient coating cross-section, the resulting microstructure is shown in
Figure 8. The coating cross-sectional microstructures shown in
Figure 8 are dense, with no cracks or pores observed. Before cladding the top layer, the oxide layer on the bottom layer surface must be removed by grinding. Consequently, when irradiated by a high-energy laser beam, downward dilution of the melt pool ultimately leads to a reduction in the thickness of the bottom layer. White particles are present in the cross-sectional microstructures of all top layers, being most pronounced in
Figure 8d–f, while in
Figure 8b,c, the white particles are fine and diffusely distributed, exhibiting a higher degree of grain refinement.
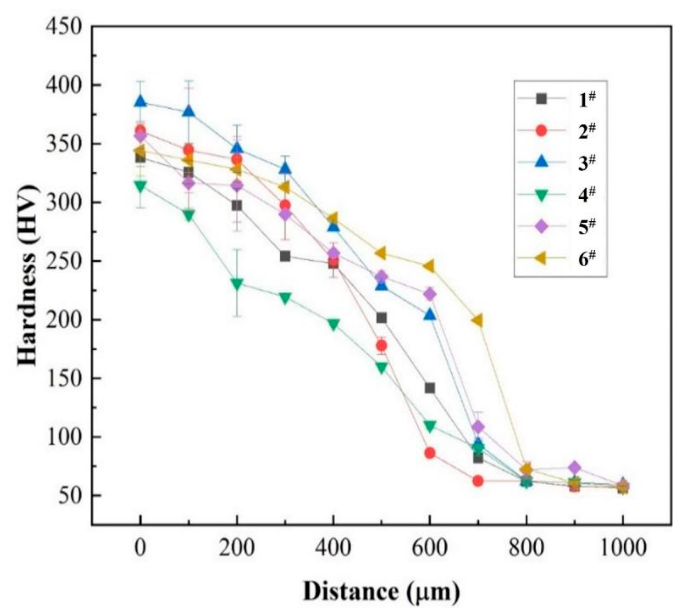
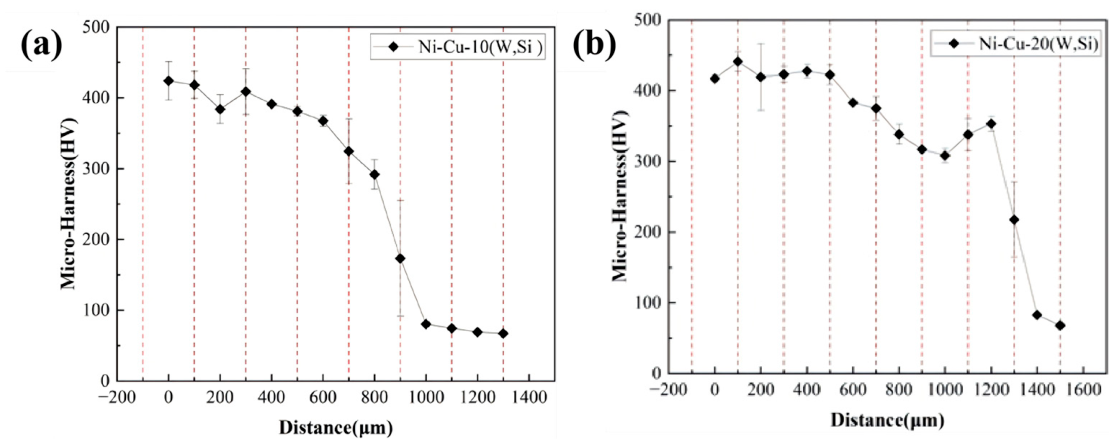
Figure 9 presents the cross-sectional hardness distribution of the top layer under processes 1
# to 6
# and the cross-sectional hardness indentation of sample 3
#. The coating hardness exhibits a gradient distribution. The surface hardness values of the top layer under processes 1
# to 6
# are 345.6 HV, 361.0 HV, 385.6 HV, 320.2 HV, 356.7 HV, and 347.2 HV, respectively. Owing to the low areal energy density of the laser beam and the uneven distribution of internal precipitates, sample 4
# exhibits the weakest resistance to plastic deformation and the lowest hardness. Sample 3
# exhibits the highest surface hardness. Although the dilution effect from the substrate is relatively strong, the significant fine-grain strengthening effect counteracts the softening influence caused by substrate dilution. The more uniformly the precipitates are distributed, the more pronounced their effect on grain nucleation and growth, resulting in finer grain sizes and a more significant fine-grain strengthening effect.
The evaluation results from the orthogonal experiments on the gradient layer were processed using range analysis, and the obtained analysis results are presented in
Table 5. Among the microhardness indicators, laser power (P) was identified as the primary influencing factor, and the optimal level combination was determined to be P3V1. This corresponds to the following process parameters: a laser power (P) of 5000 W, a scanning speed (V) of 60 mm/s, and a scanning step (H) of 2 mm.