3.1. Green Tea Leaf Extract
Green tea leaves,
Figure 1a represent a well-established biological system for the green synthesis of metal nanoparticles due to their chemically active and complex composition. They are rich in polyphenolic compounds, particularly catechins such as epigallocatechin gallate (EGCG), epicatechin, and epicatechin gallate, which exhibit strong redox properties. In addition, green tea extracts contain flavonoids, amino acids (notably L-theanine), proteins, polysaccharides, and organic acids. These components collectively enable both the reduction of metal ions and the stabilization of the formed nanoparticles [
19]. The high density of hydroxyl groups in catechins facilitates electron donation, thereby reducing Au
3+ ions to metallic Au
0. At the same time, these molecules adsorb onto the nanoparticle surface, acting as capping agents and preventing aggregation.
The involvement of functional groups in this process has been extensively characterized by Fourier-transform infrared spectroscopy (FTIR) [
19,
20,
21]. Literature FTIR data indicate the presence of absorption bands corresponding to O–H stretching (3200–3500 cm
−1), C=O stretching of carbonyl or amide groups (1600–1700 cm
−1), and C–O or C–N vibrations (1000–1400 cm
−1) [
19,
20,
21]. The well-defined chemical composition and abundance of functional groups make green tea extract a highly effective, reproducible, and environmentally friendly system for the controlled biosynthesis of gold nanoparticles with tunable physicochemical properties.
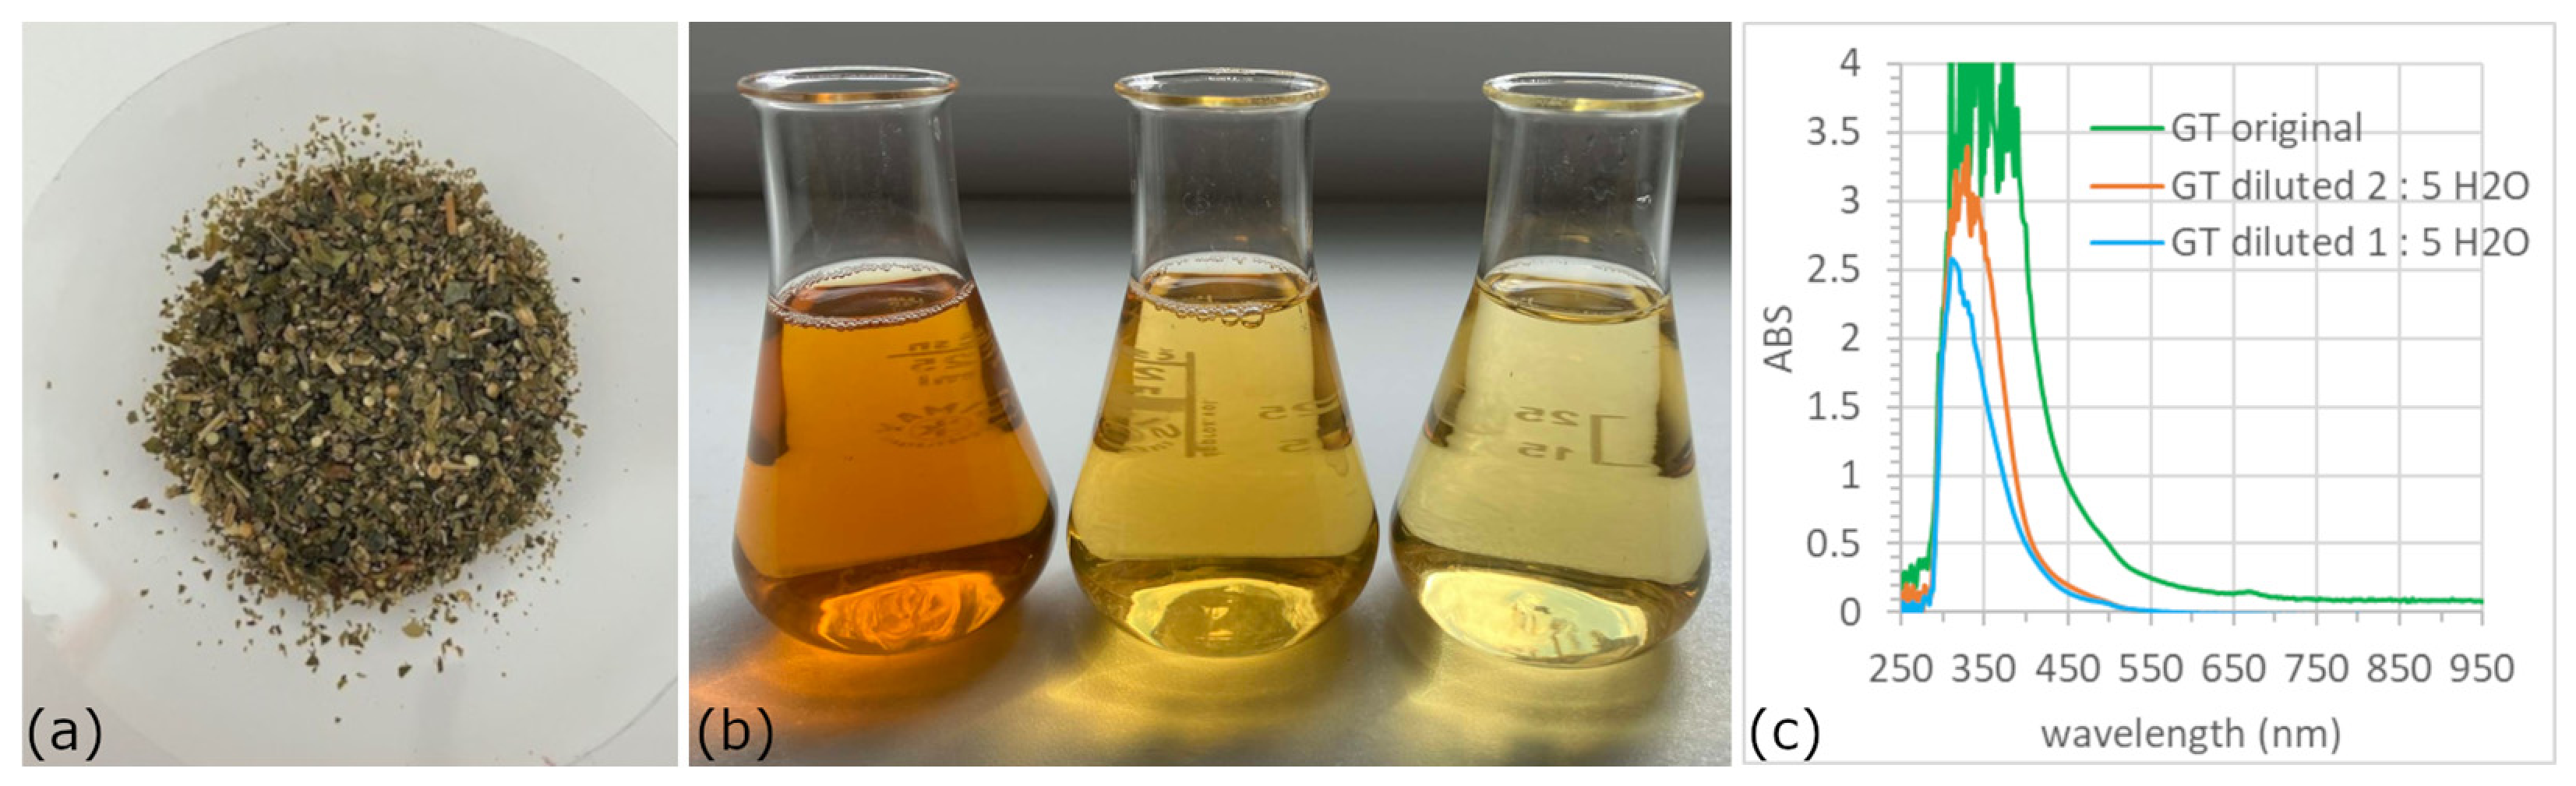
The dilution of green tea extracts visibly affected their color intensity,
Figure 1b. The undiluted extract exhibited a deep yellow color, whereas the 2:5 and 1:5 diluted extracts appeared progressively lighter, indicating a lower concentration of chromophoric compounds. This observation was confirmed by UV–Vis spectroscopy,
Figure 1c, which showed a gradual decrease in absorbance intensity with increasing dilution, while the position (λ
max) of the absorption maximum (ABS
max) remained nearly unchanged.
The pronounced absorption band observed in the UV region (~270–350 nm) is primarily attributed to polyphenolic compounds in green tea, particularly catechins such as epigallocatechin gallate (EGCG). These compounds contain aromatic rings and conjugated systems, which are responsible for strong electronic transitions (π → π* and n → π*) in this spectral region [
20,
21]. The high intensity of this band reflects the high concentration of these bioactive molecules, which act as key reducing and stabilizing agents in the synthesis process. Since these compounds are responsible for both the reduction of Au
3+ ions and the stabilization of the resulting nanoparticles, their decreased concentration may reduce the extract’s reducing capacity and consequently affect the efficiency of AuNP synthesis.
3.2. AuNPs Colloids
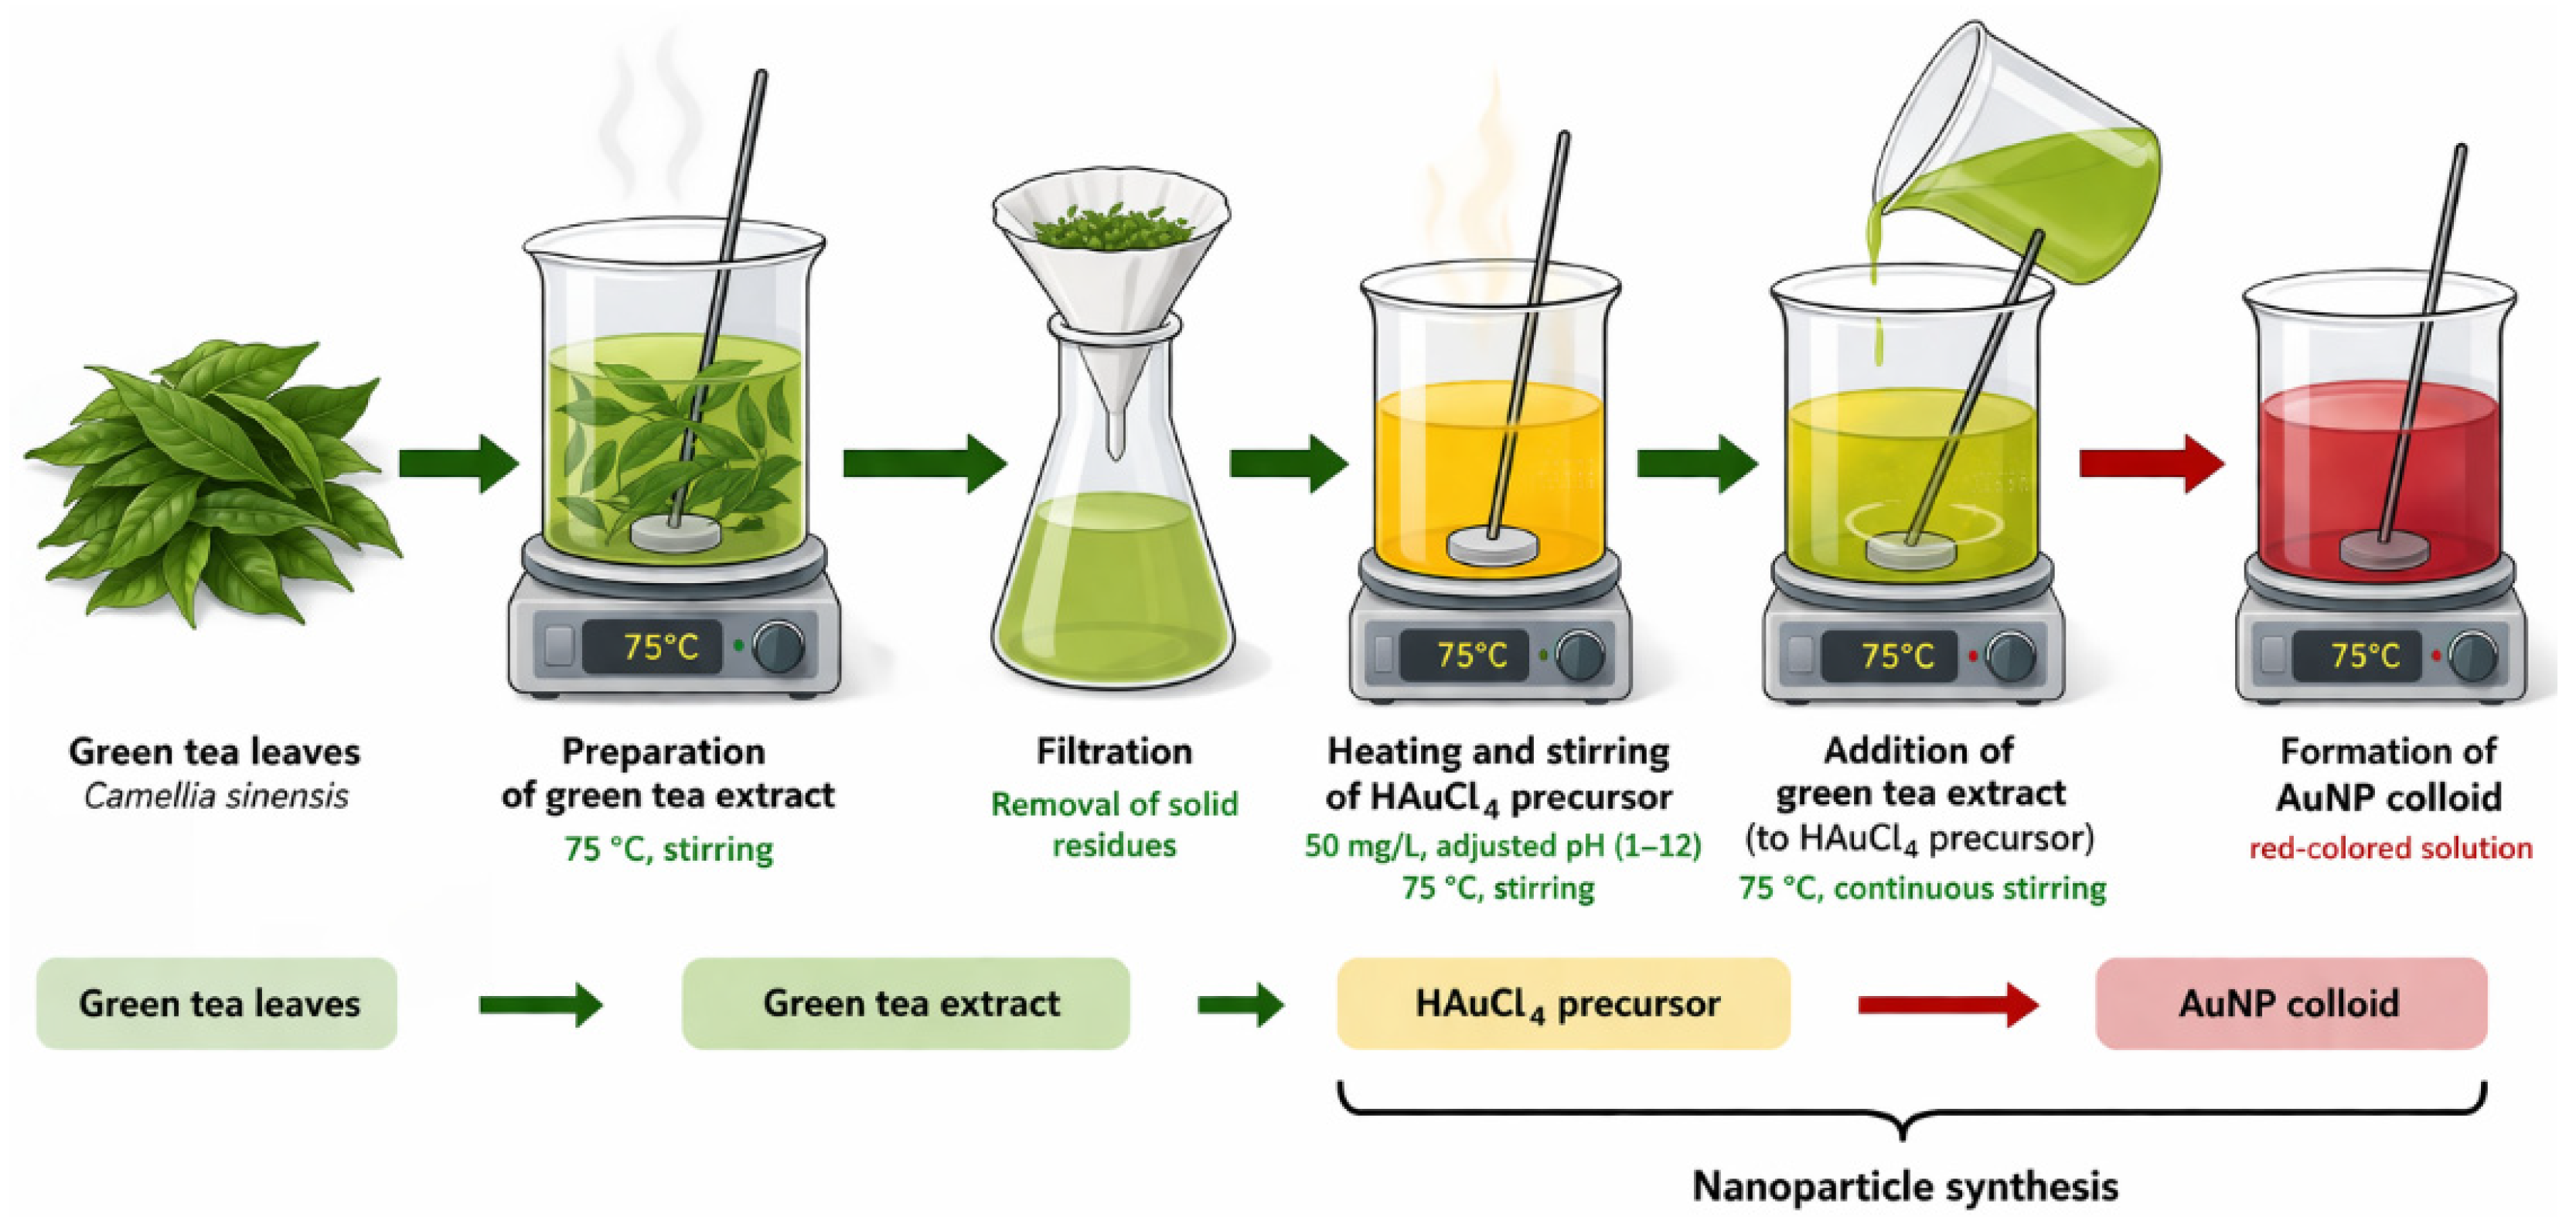
Gold nanoparticle (AuNP) colloids were synthesized by adjusting the pH of a HAuCl4 precursor solution (50 mg·L−1). The initial pH of the HAuCl4 precursor solution was 1.19, and subsequent samples were prepared by gradual alkalization from 1.19 to 12 by the addition of 10% NaOH solution.
Green tea extracts of different concentrations (undiluted, 2:5, and 1:5 dilutions) were subsequently added, and nanoparticle formation was monitored. The scheme of AuNPs colloid preparation is shown in
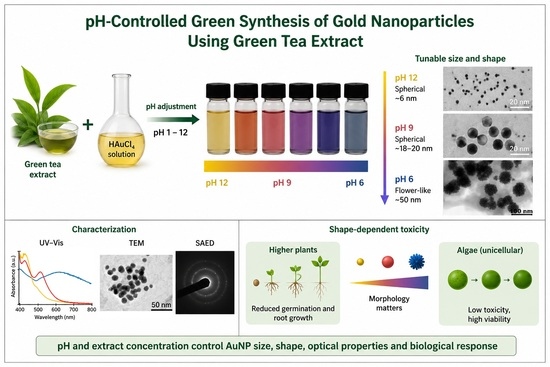
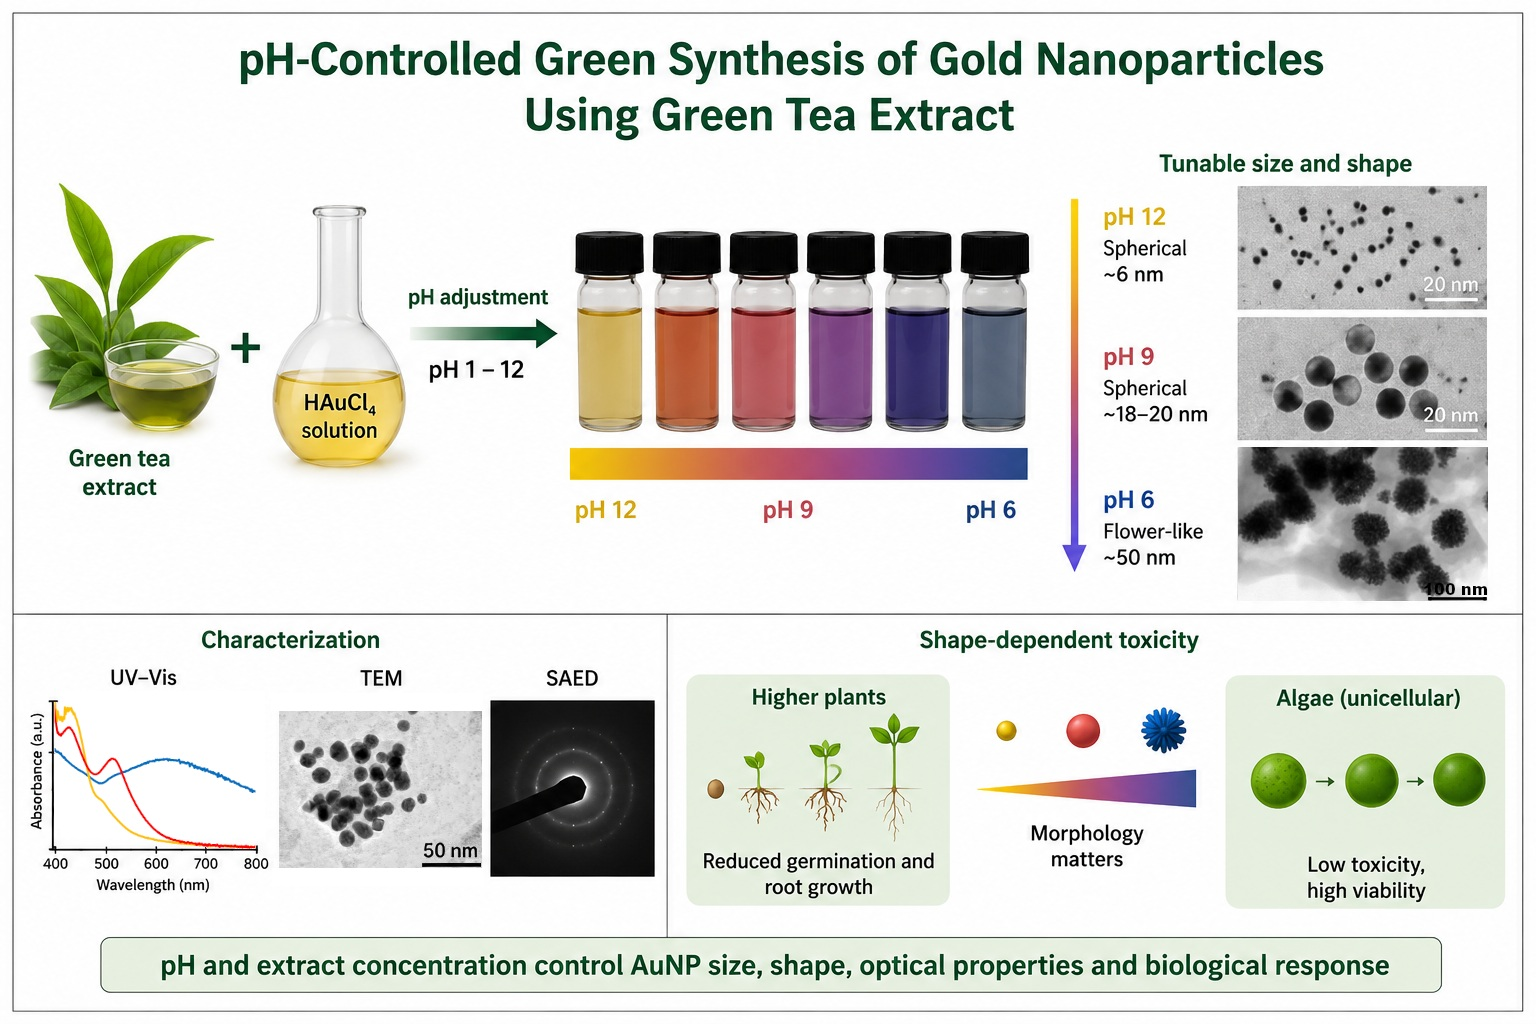
Figure 2. AuNP colloids synthesized under different pH conditions were characterized by UV–Vis spectroscopy, TEM, and biological assays to evaluate the influence of synthesis parameters on nanoparticle properties.
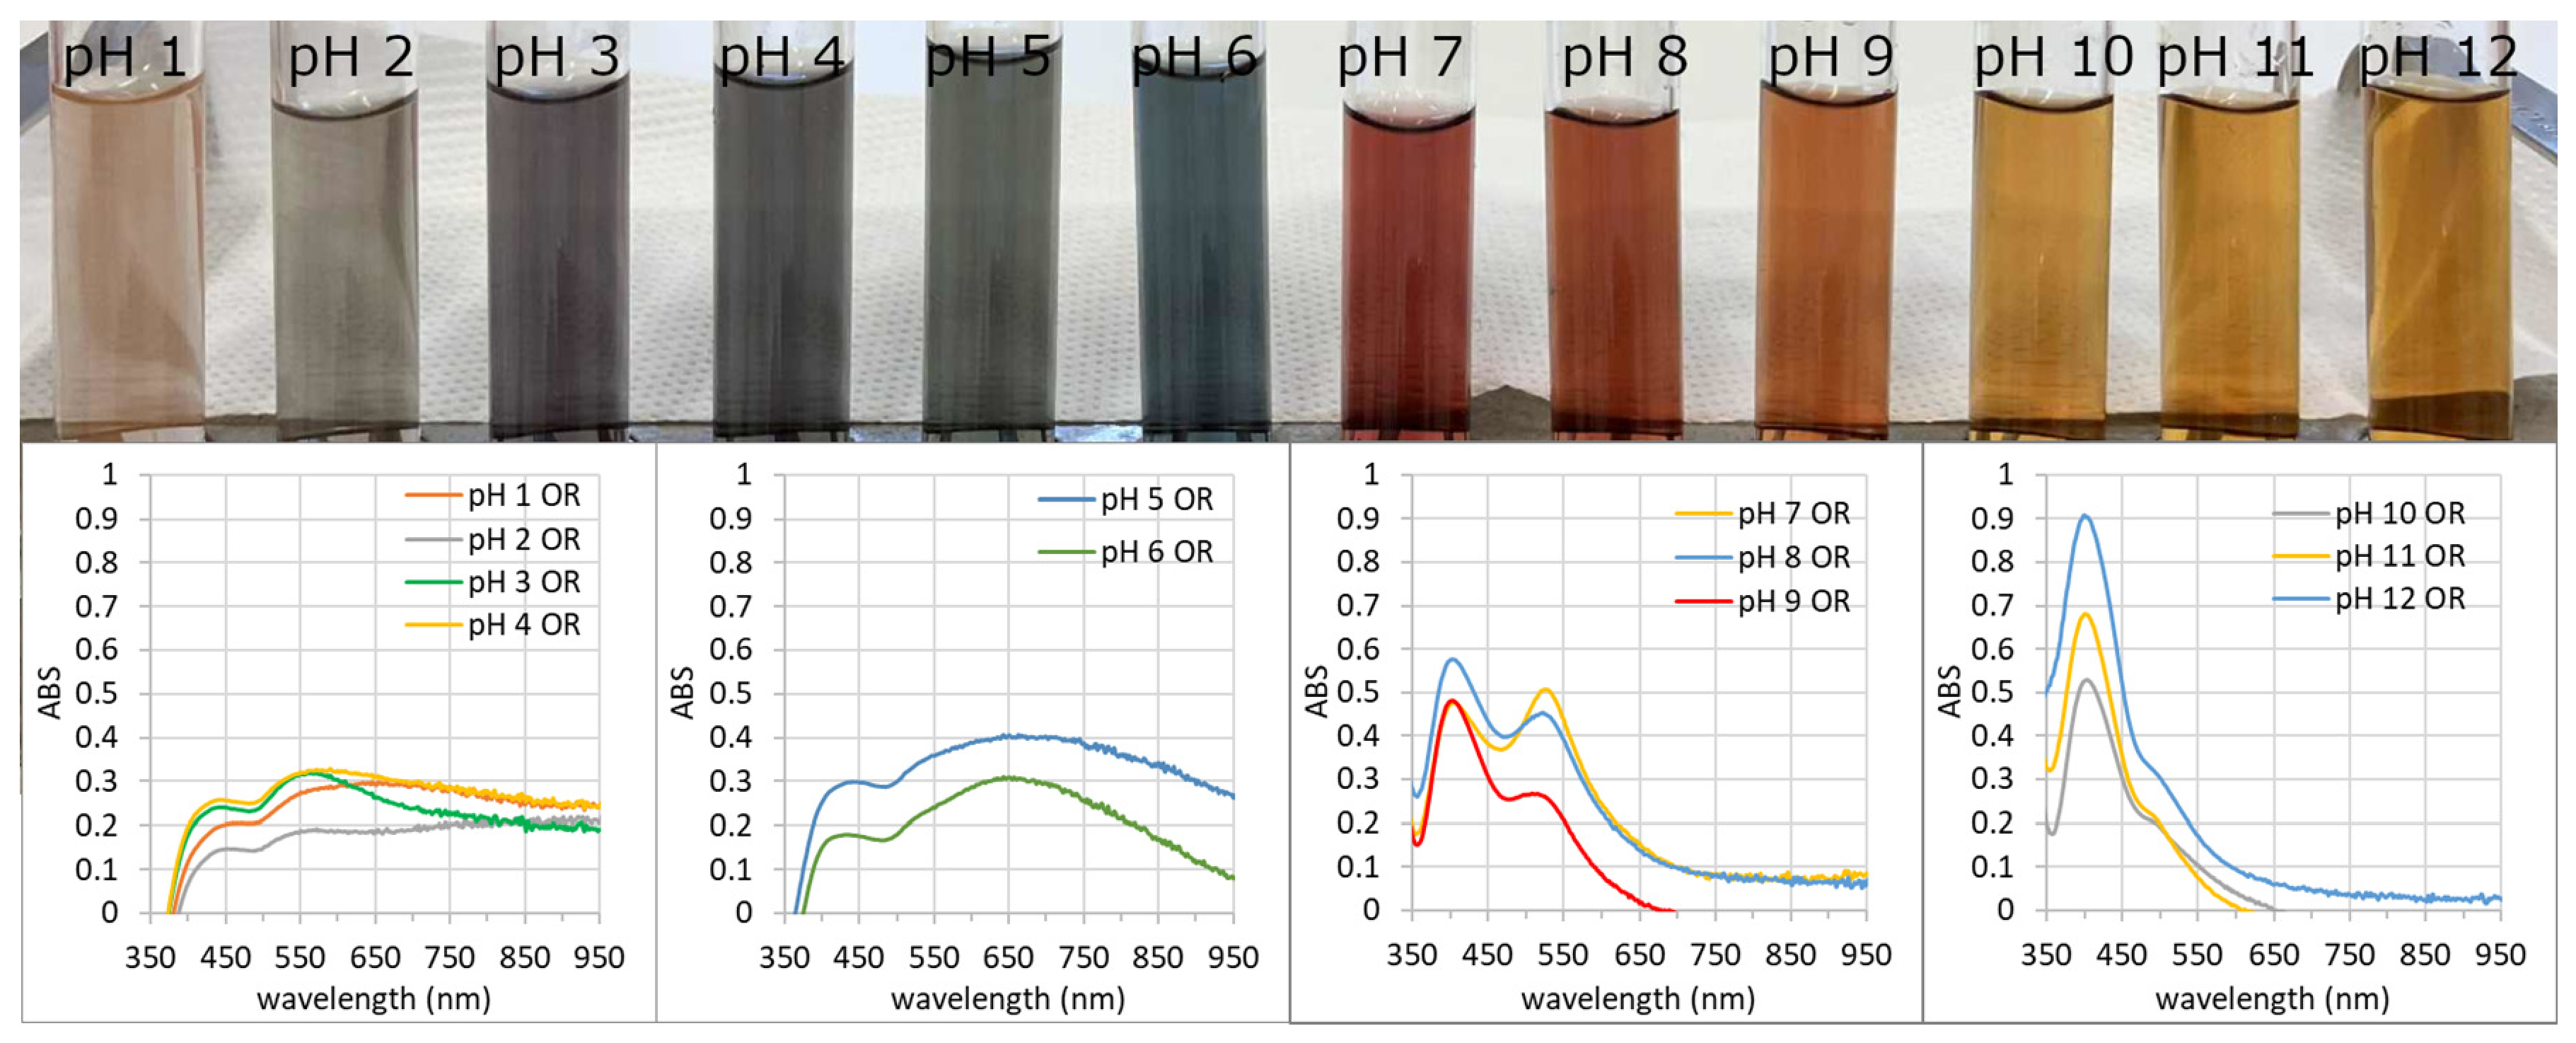
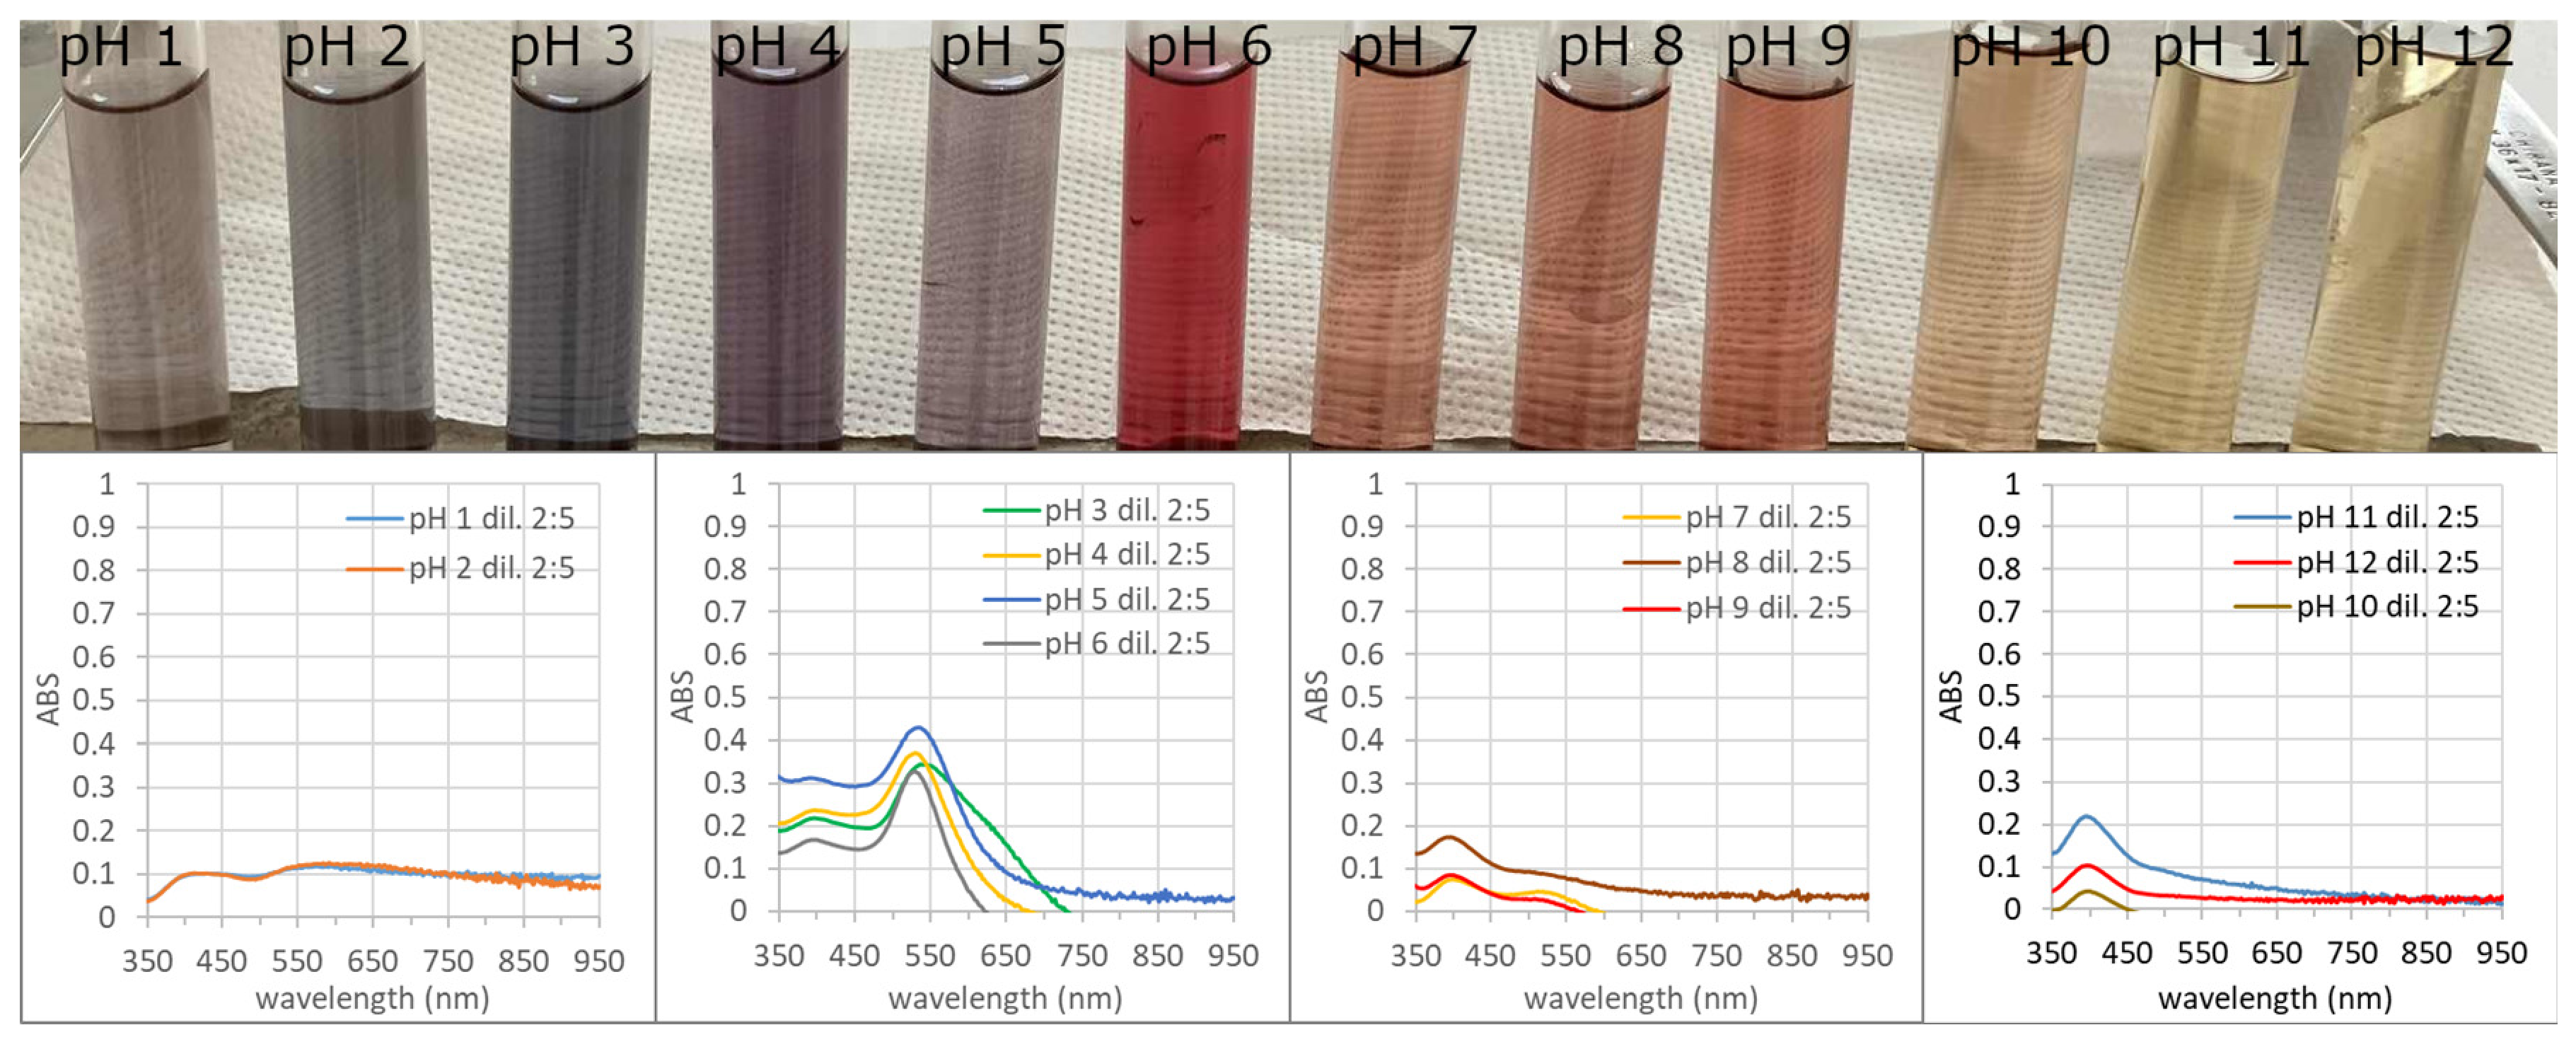
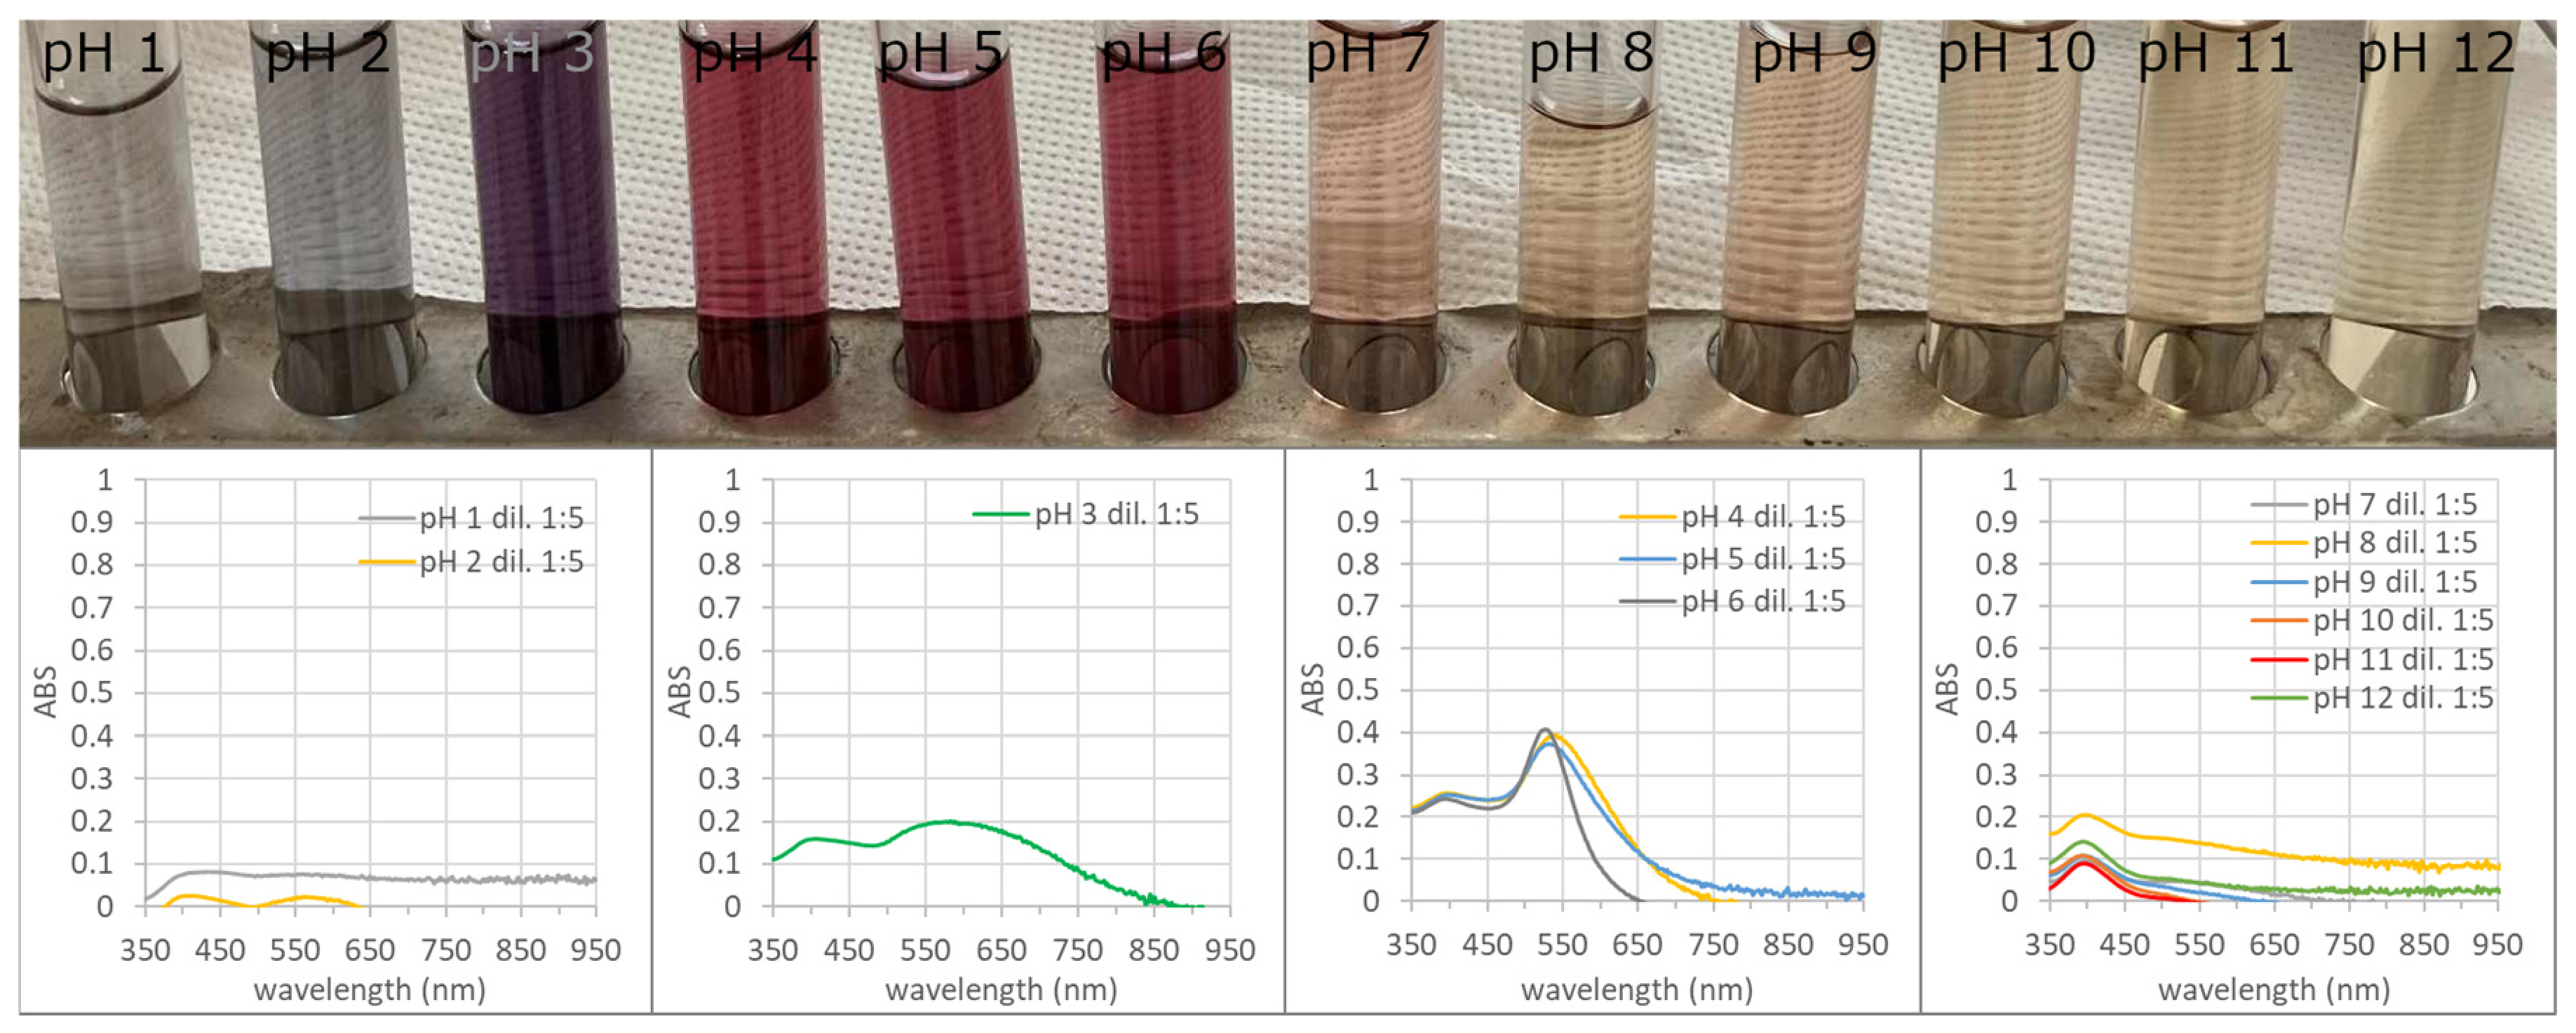
Following the addition, a visible color change occurred within approximately 5 min, indicating AuNP formation,
Figure 3,
Figure 4 and
Figure 5. Depending on pH and extract concentration, the colloids can be classified into four groups: beige, gray, red, and yellow. These differences were reflected in the UV–Vis spectra, which showed substantial variations in absorption maxima, band width, and spectral shape.
For diluted extracts (2:5 and 1:5), nanoparticle formation was strongly suppressed at low pH (1–2) and high pH (≥7), particularly for the 1:5 dilution. The corresponding UV–Vis spectra exhibited low absorbance intensity, indicating insufficient reduction of Au
3+ ions due to the lower concentration of active biomolecules responsible for reduction and stabilization,
Figure 4 and
Figure 5.
The strongest effect of extract dilution was observed in the pH range 4–6. Compared with the undiluted extract, dilution resulted in pronounced changes in the colloids’ color and UV–Vis spectra. At pH 4 and 5, the colloids changed from gray to violet, whereas at pH 6, a raspberry-red coloration was obtained. At pH 4, 5, and 6, the undiluted system exhibited a broad absorption profile, and ABSmax was localized at λmax ~650 nm. Upon dilution, a blue shift of the absorption maximum, together with a narrowing of the absorption band, was observed. These spectral changes not only indicate modifications in the optical properties of the colloidal system but also suggest differences in other characteristics (size and shape) of the formed nanoparticles.
These findings confirm that pH and extract concentration are key parameters governing the green synthesis of AuNPs and provide an effective means for tuning their optical and morphological properties.
3.2.1. Analysis of Selected Colloids
Since AuNPs are widely utilized in optical applications, the ability to prepare stable colloids with tunable optical properties was considered a key factor in the selection of synthesis conditions. Experimental conditions for further analysis were therefore selected based on the optical properties of the prepared colloids, as the colloids’ color directly reflects the size, shape, and aggregation state of nanoparticles. The selected colloidal conditions included:
pH 3 and 4 prepared using the 1:5 diluted extract;
pH 6 prepared using the 2:5 diluted extract;
pH 6, 9, and 12 prepared using undiluted extract (OR).
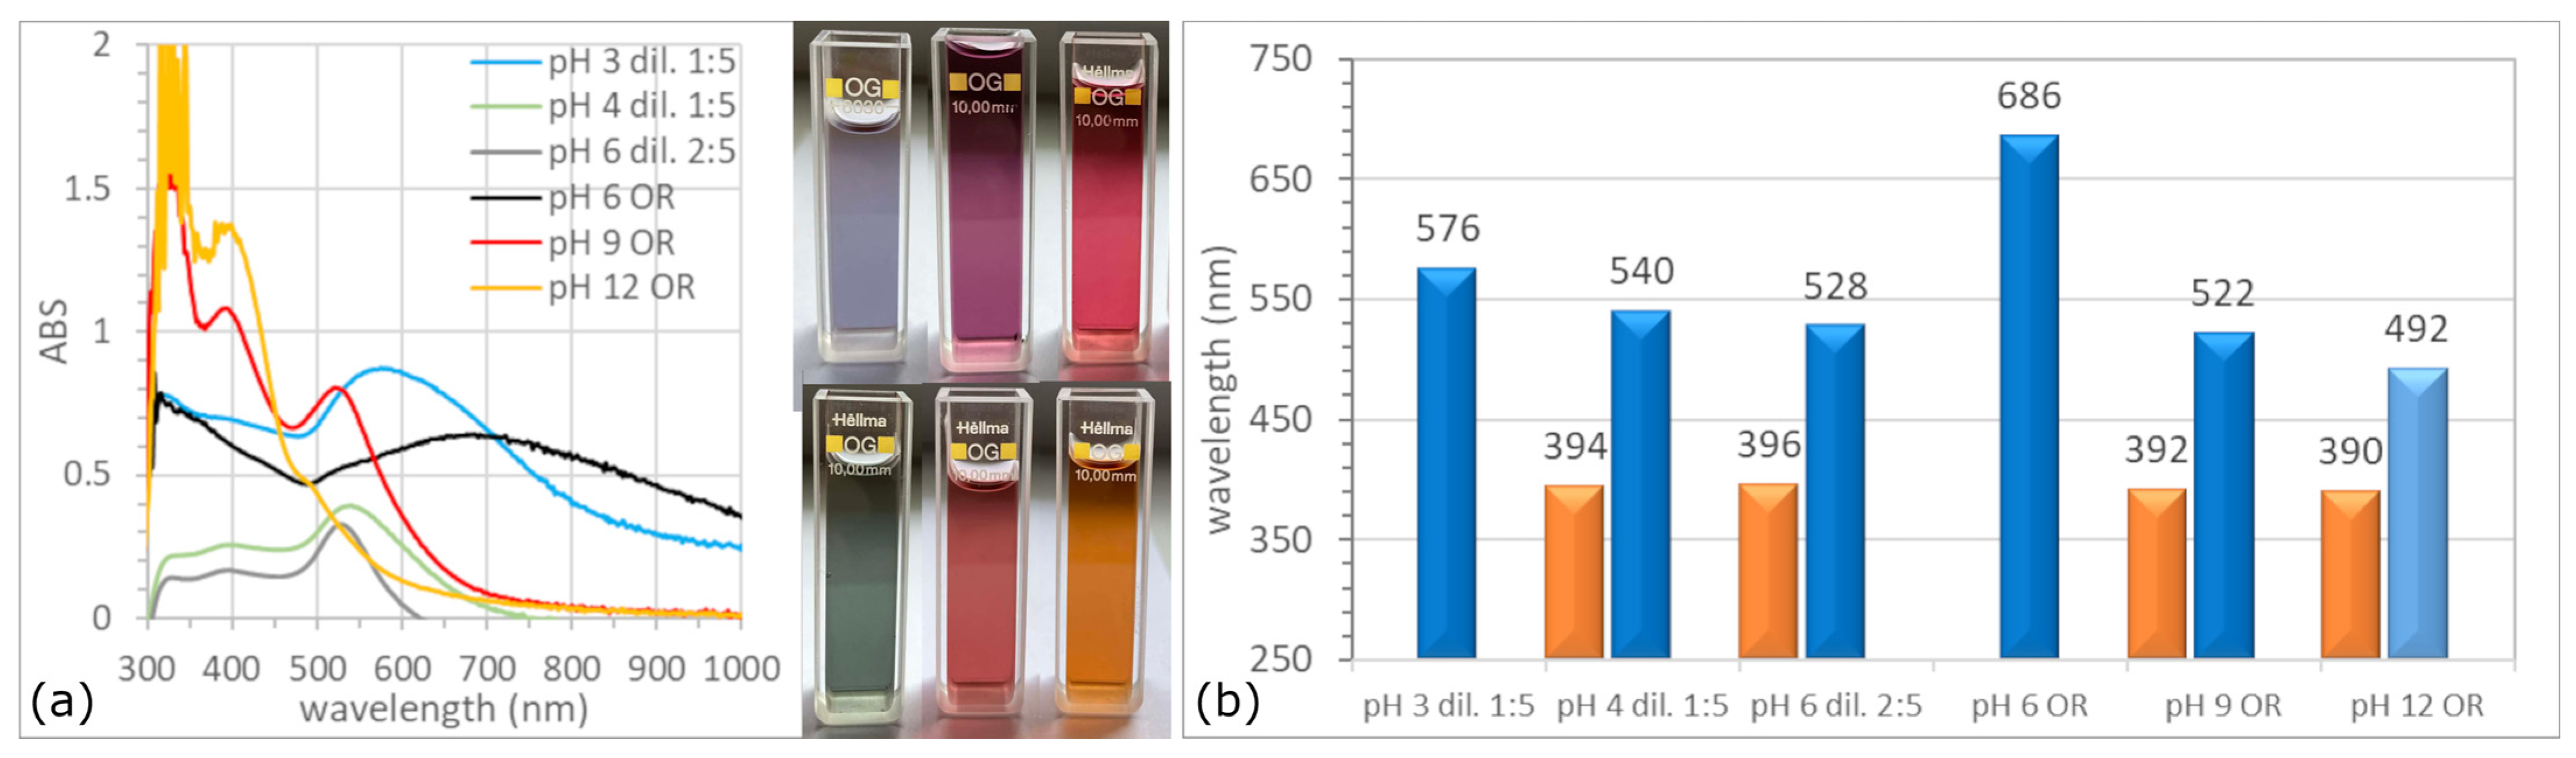
The corresponding UV–Vis spectra,
Figure 6a, show pronounced differences in peak position, number, and spectral width. Normalized UV–Vis spectra of the selected representative samples are provided in the
Supplementary Materials (Figure S1) to facilitate comparison of spectral shape and peak position.
Although appropriate blank correction was applied during UV–Vis measurements, absorption bands in the 300–350 nm region were consistently observed (mainly at higher pH). These originate from non-plasmonic contributions, including transformed polyphenols and metal–organic complexes formed during synthesis, as the reaction mixture differs chemically from the reference solution. As a result, the 300–350 nm region may exhibit significant absorbance that is not directly associated with the plasmonic properties of AuNPs. Consequently, the evaluation of nanoparticle formation and comparison of optical properties were focused primarily on wavelengths above 350 nm, where the localized surface plasmon resonance of AuNPs dominates and provides more direct insight into nanoparticle size, morphology, and dispersion.
At pH 12 (OR), the spectrum is dominated by a narrow peak at ~390 nm with a weak shoulder at ~490 nm,
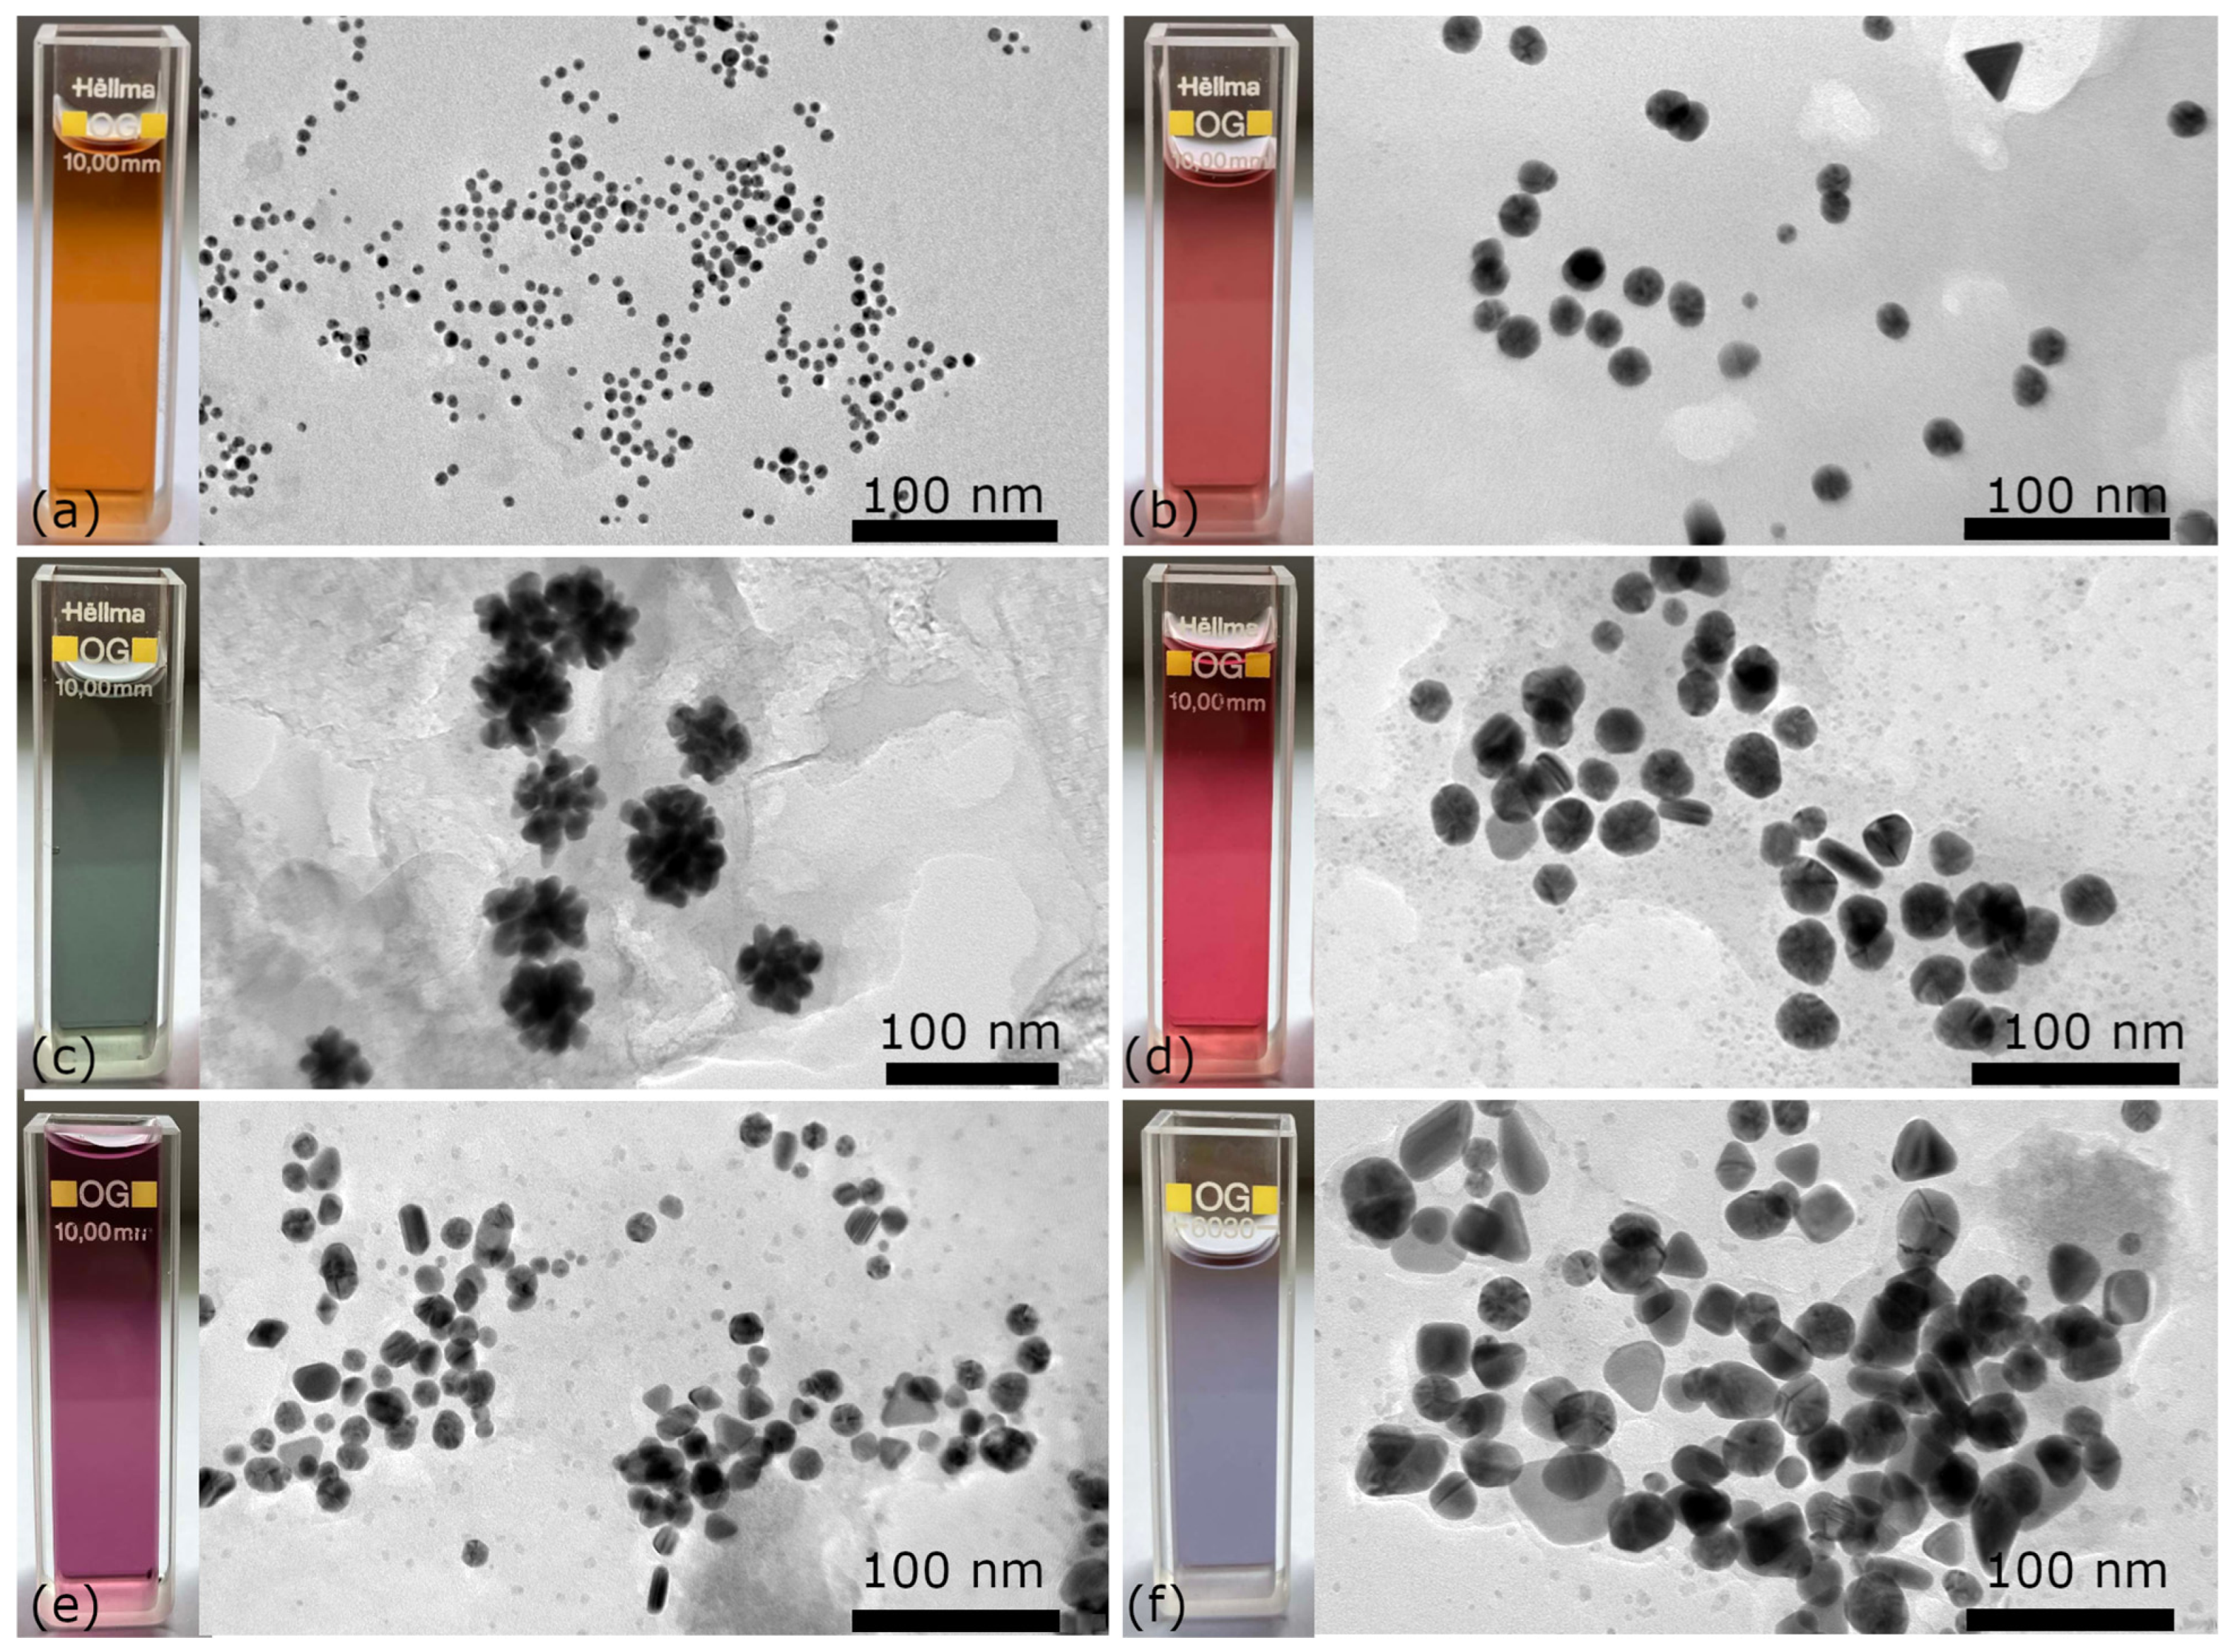
Figure 6a,b, indicating a uniform population of very small, spherical nanoparticles. This is consistent with the yellow coloration and TEM results,
Figure 7a, which confirm monodisperse spherical particles with a mean size of 6 ± 1 nm,
Table 1. Detailed particle size distribution histograms obtained from TEM analysis for all samples are presented in the
Supplementary Materials (Figures S2–S5). These data were used to calculate the mean particle diameter, standard deviation, and other statistical parameters discussed in the manuscript.
In contrast, the spectrum at pH 9 (OR) exhibits multiple features,
Figure 6a, including a pronounced SPR band at 528 nm and an additional band near 400 nm,
Figure 6b, corresponding to predominantly spherical nanoparticles (18 ± 3 nm) with minor contributions from anisotropic shapes (4%),
Table 1, as confirmed by TEM,
Figure 7b. Results from other authors confirmed that spherical gold nanoparticles of this size exhibit a red colloidal coloration, which is typically associated with a surface plasmon resonance (SPR) band in the wavelength range of approximately 500–550 nm [
16,
22], which correlates with our results for samples with pH 9.
A markedly different SPR band is observed at pH 6 (OR), where the spectrum is significantly broadened (ABS
max at λ
max 686 nm),
Figure 6a,b, indicating high polydispersity and anisotropic structures; in this case, green-gray coloration of the colloid was observed. This is consistent with the TEM results showing larger (53 ± 8 nm), irregular, and flower-like nanoparticles,
Figure 7c.
Upon dilution (pH 6, (2:5)), the spectrum becomes narrower with a defined mean peak at ~528 nm,
Figure 6b, reflecting a shift toward more uniform, predominantly spherical nanoparticles (23 ± 4 nm, 94%),
Figure 7d, although minor fractions of rods, polygonal nanoparticles with pentagonal and hexagonal symmetry, and triangular prisms are still present,
Table 1. The resulting solution exhibited a raspberry-red coloration.
For diluted systems at lower pH, the spectra further confirm increased heterogeneity. At pH 4 (1:5), a broad absorption band with a maximum at 540 nm,
Figure 6a,b indicates a polydisperse system dominated by spherical and quasi-spherical nanoparticles (13 ± 5 nm, 81%), with additional anisotropic shapes such as triangular nanoprisms, nanorods, and faceted polyhedral structures (19%), as was confirmed by TEM,
Figure 7e. At pH 3 (1:5), a single broad and red-shifted peak (~576 nm) reflects a highly heterogeneous system with mixed morphologies and larger particles, including spherical and quasi-spherical (23 ± 7 nm, 59%), triangular nanoprisms, nanorods, and faceted polyhedral structures (41%),
Figure 7f.
Table 1 summarizes the data on the size, shape, and percentage of nanoparticles in colloids.
TEM analysis confirmed the presence of non-spherical nanoparticles, including polyhedral, rod-like, and triangular structures, particularly in samples synthesized at pH 6 (2:5), pH 3 (1:5), and pH 4 (1:5). Although these particles constitute a minority of the population, their presence is important because anisotropic AuNPs exhibit significantly different plasmonic responses compared to spherical nanoparticles. Although present in smaller amounts, these particles influenced the coloration of the colloidal suspensions. For instance, the comparison of the pH 6 (2:5) and pH 3 (1:5) samples (both systems contain spherical nanoparticles with a similar average size of approximately 23 nm) shows that the colloids display markedly different colors and UV–Vis spectra. Since particle size alone cannot explain these differences, the observed optical response is attributed to the presence and proportion of anisotropic nanoparticles in the particle population. Therefore, while spherical nanoparticles dominate the samples, the contribution of less abundant anisotropic structures remains significant for the resulting optical properties.
3.2.2. Composition of Nanoparticles
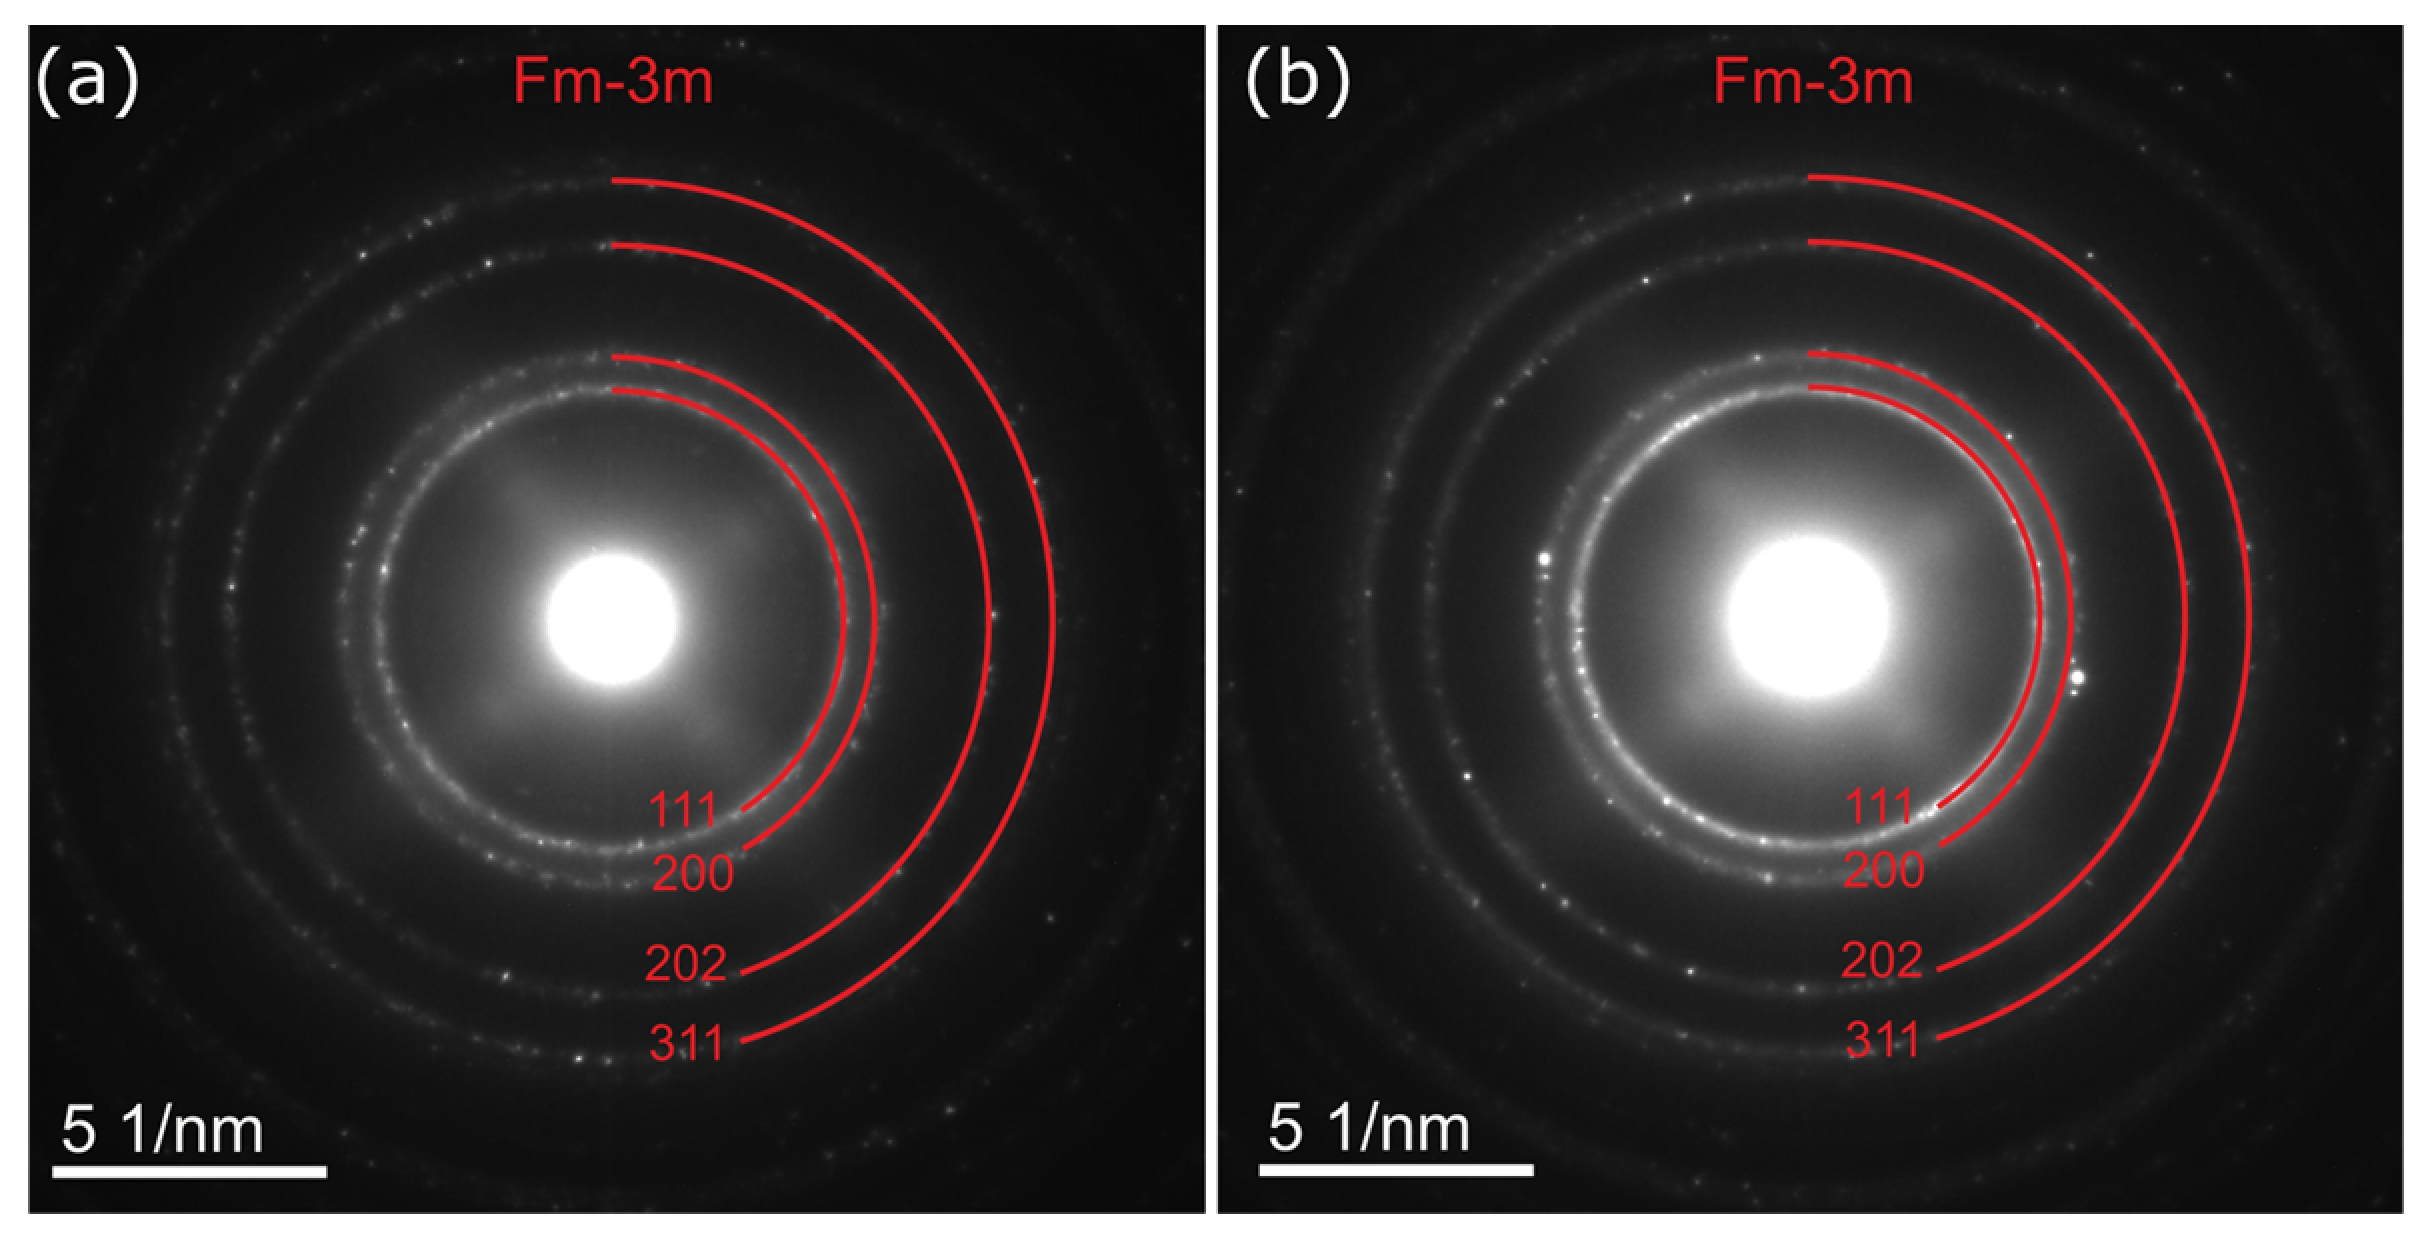
Selected area electron diffraction (SAED) analysis was performed for all prepared samples. However, representative patterns are shown for pH 4,
Figure 8a, and pH 9,
Figure 8b. The pH 4 sample was selected due to the presence of nanoparticles with diverse morphologies, whereas the pH 9 sample represents a system composed predominantly of spherical nanoparticles.
The SAED pattern of AuNPs synthesized at pH 4 confirms the crystalline nature of the nanoparticles. The diffraction pattern exhibits well-defined concentric rings, indicative of a polycrystalline structure composed of randomly oriented nanocrystals. The rings can be indexed to the face-centered cubic (fcc) structure of gold (space group Fm–3m), with reflections corresponding to the (111), (200), (202), and (311) crystallographic planes. The (111) reflection is the most intense, consistent with the preferential stability of this plane in AuNPs.
Similar diffraction features were observed for all analyzed samples, confirming that gold nanoparticles were successfully formed under all experimental conditions. The agreement between SAED, UV–Vis, and TEM analyses further supports the formation of crystalline AuNPs with morphology dependent on synthesis parameters.
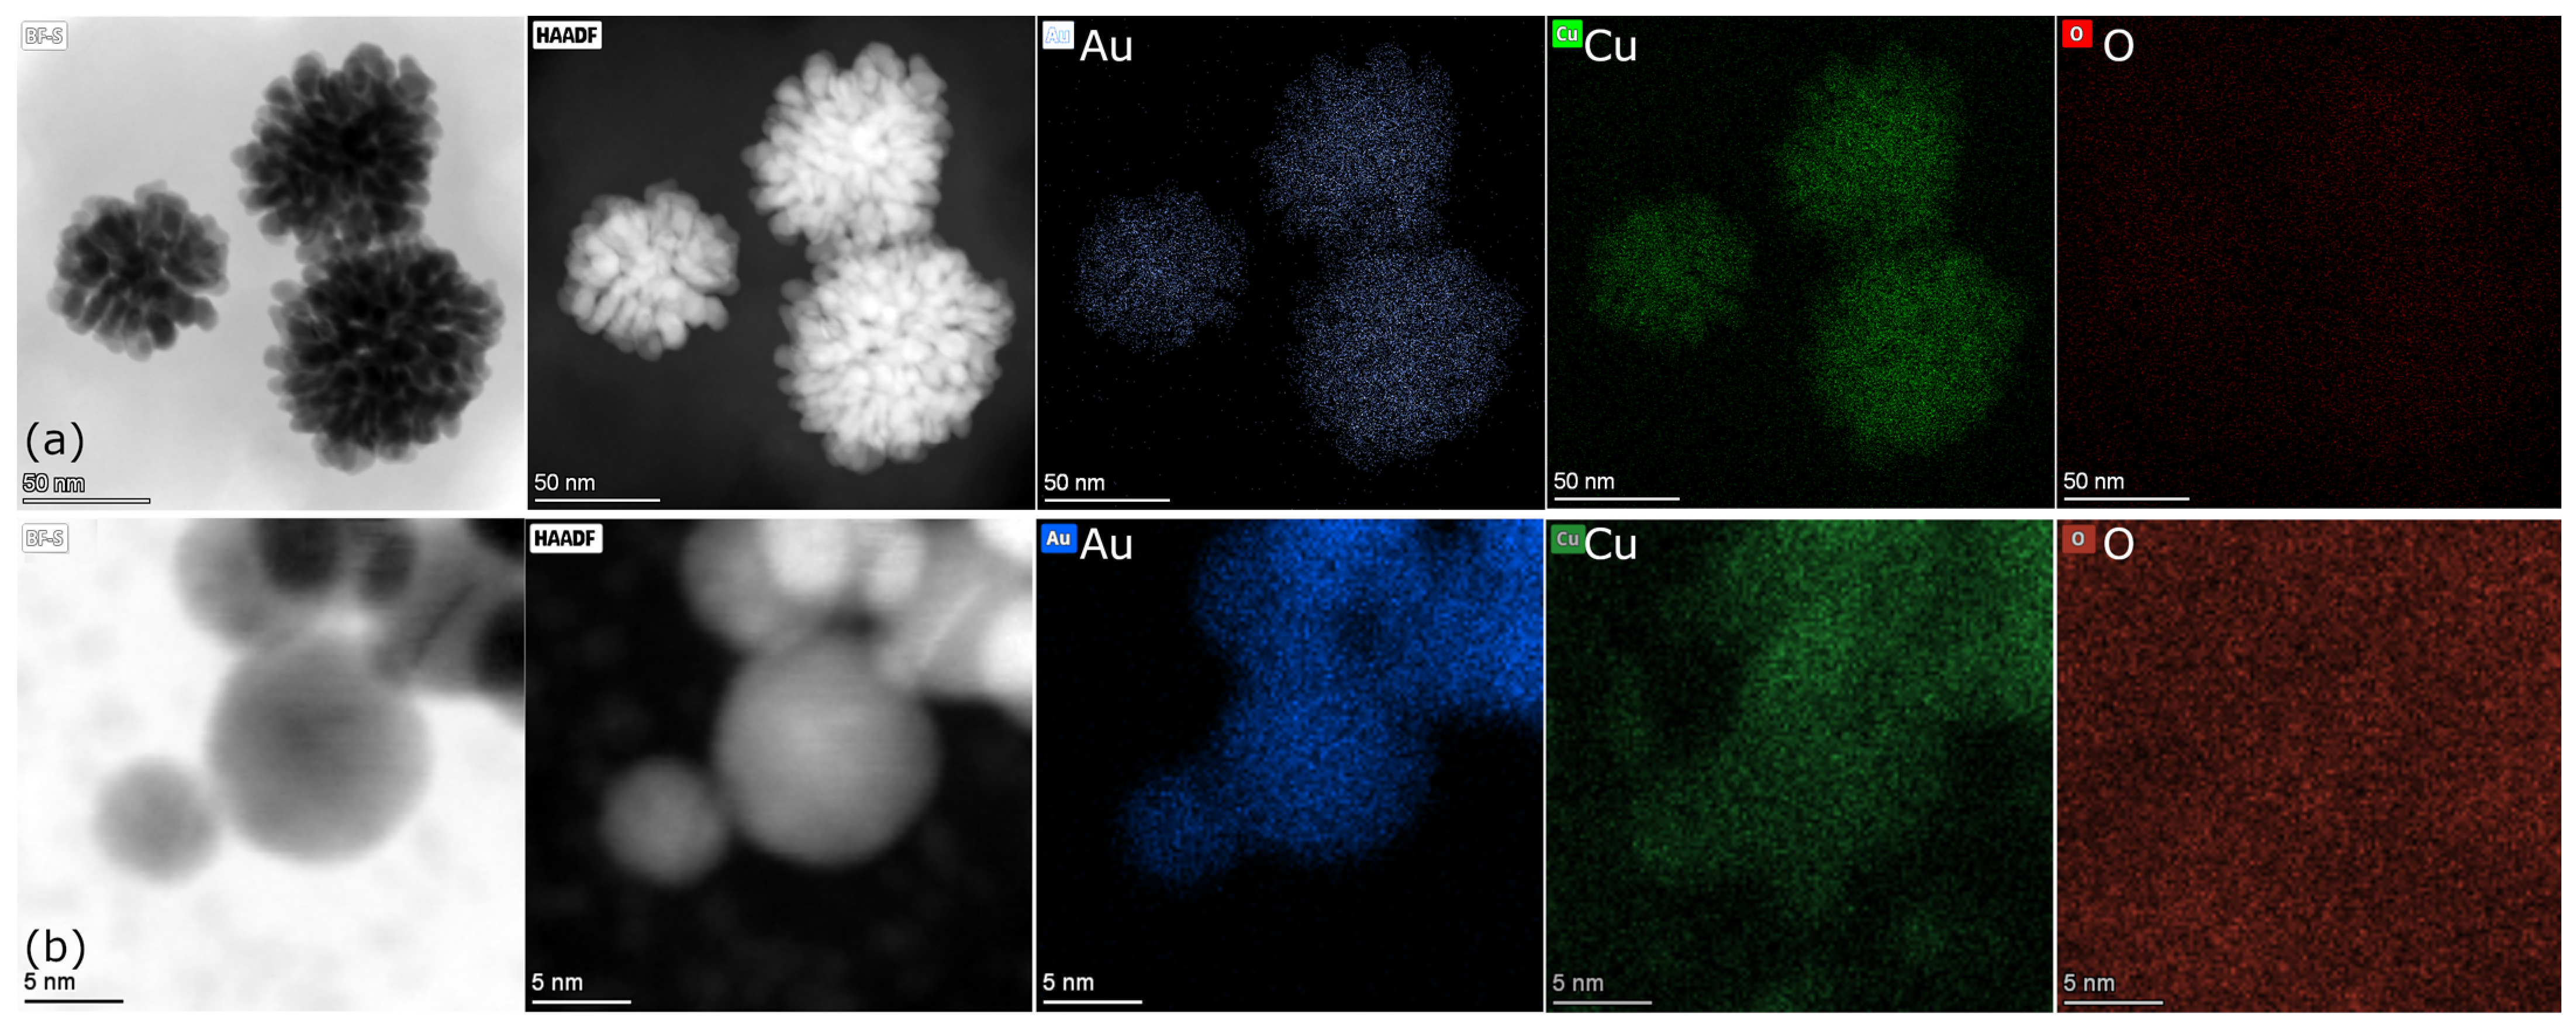
In addition to SAED analysis, the presence of gold was confirmed by elemental mapping. Bright-field Scanning Transmission Electron Microscopy (BF-STEM) and High-Angle Annular Dark-Field (HAADF-STEM) imaging were employed to characterize the morphology and composition of the synthesized AuNPs. Although all samples were analyzed, only those prepared at pH 6 and 12 are presented, as they are representative of the detected elemental composition.
BF-STEM imaging mode,
Figure 9a, highlights the overall morphology of the particles, clearly revealing the presence of irregular, flower-like structures. The HAADF images confirm that the observed structures correspond to gold-rich regions, consistent with the elemental mapping results. Elemental mapping of the synthesized AuNPs confirmed the presence of Au, Cl, Cu, and O,
Figure 9a,b. The Au signal is localized within the nanoparticle regions, confirming that the observed structures are composed of gold. The presence of chlorine (Cl) can be attributed to residual precursor species originating from HAuCl
4, such as AuCl
4− or partially reduced gold-chloride complexes, which may remain adsorbed on the nanoparticle surface or in the surrounding matrix. This is consistent with incomplete ligand removal during synthesis and indicates that chloride ions can persist as surface-bound species even after nanoparticle formation.
The detected Cu signal originates from the copper TEM grid used as the sample support. The presence of Cu in the elemental maps is not evidence of copper incorporation into the nanoparticles. The apparent overlap between Cu and Au signals is attributed to contributions from the underlying Cu grid and the limited spatial resolution of the EDS mapping technique. The oxygen (O) signal is likely associated with organic compounds from the green tea extract and with possible oxidation products or adsorbed species on the nanoparticle surface. The presence of oxygen peaks in biological AuNPs was also identified by Kalantari et al., who attributed it to organic molecules that probably form the cap on nanoparticles [
23].
In addition to Au, Cu, and O,
Figure 9b, minor signals of Cl, Na, and Si were also detected in the elemental mapping. The Na signal can be attributed to residual sodium ions originating from NaOH used for pH adjustment, which may remain adsorbed in the sample matrix after drying. The Si signal is most likely associated with trace contamination from sample handling, glassware, dust particles, or background contributions during EDS analysis rather than with the nanoparticles themselves. Since neither Na nor Si is expected to form the core of the synthesized particles, these signals should be regarded as secondary contributions from the preparation and measurement environment.
3.2.3. Toxicity of AuNPs
The potential toxicity of the synthesized gold nanoparticles was evaluated using two biological model systems representing different levels of biological complexity. The first model involved the green microalga Ch. kessleri, which is commonly used for assessing nanoparticle effects in aquatic environments. The second model consisted of higher plant assays based on Sinapis alba root growth inhibition. This combined approach allows for a comprehensive evaluation of nanoparticle toxicity, considering both unicellular and multicellular organisms, as well as different exposure pathways.
The toxicity assessment performed using
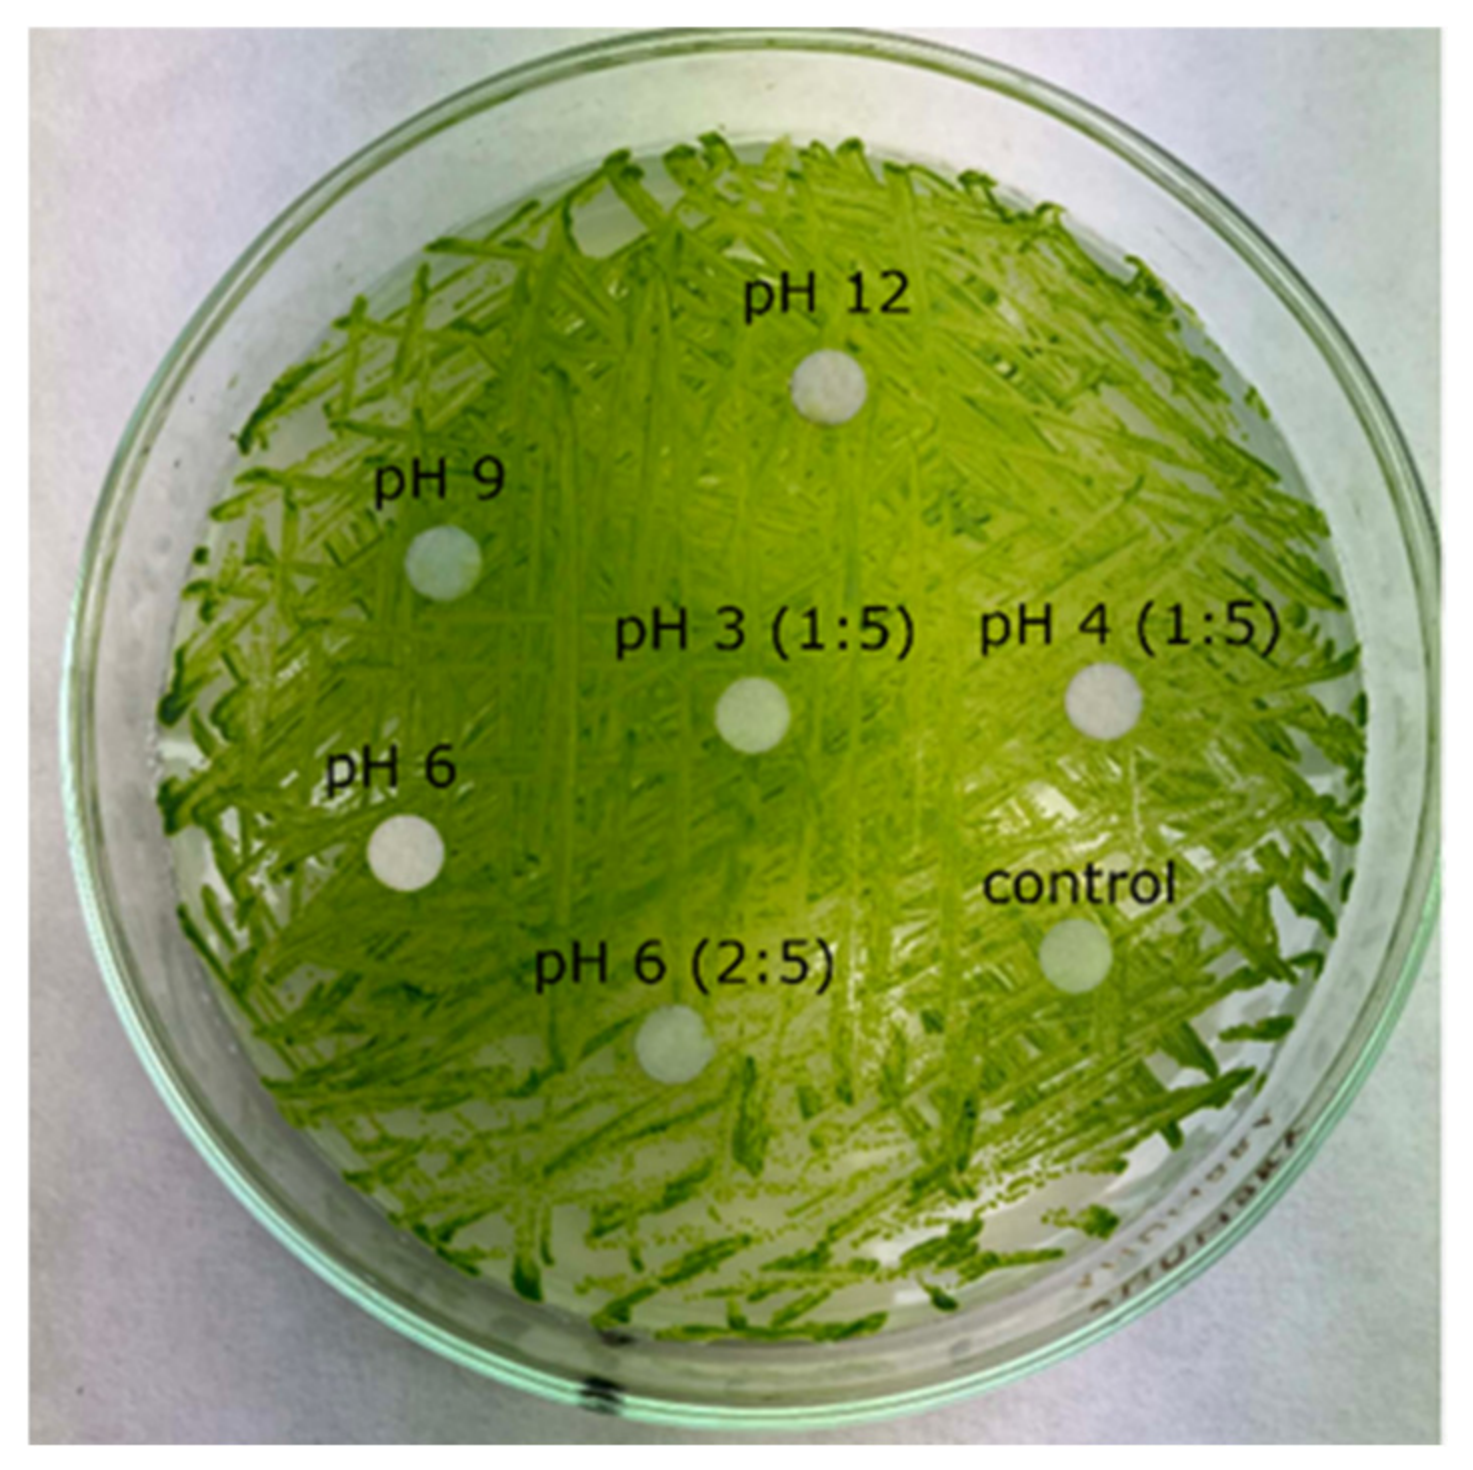
Ch. kessleri demonstrated that none of the synthesized AuNP samples and controls (H
2O) induced growth inhibition, regardless of pH conditions or nanoparticle morphology,
Figure 10. No inhibitory zones or reduction in algal proliferation were observed, indicating that the prepared gold nanoparticles exhibit negligible toxicity under the tested conditions.
These findings are consistent with previously reported studies highlighting the low toxicity of gold nanoparticles in aquatic and photosynthetic systems. Behra et al. [
24] showed that AuNPs exhibit limited toxicity toward Chlamydomonas reinhardtii, with observed effects strongly dependent on colloidal stability and particle concentration rather than the presence of gold itself. Similarly, Ostroumov et al. [
25] reported that gold nanoparticles do not significantly inhibit plant growth in aquatic systems, supporting their relatively inert behavior. The work of Glenn et al. [
26] further demonstrated that interactions of AuNPs with aquatic plants are size- and species-dependent, with no universal toxic effect observed. In addition, Contini et al. [
27] emphasized that interactions of AuNPs with biological systems are governed primarily by particle size and surface properties, which influence their interaction with biological membranes rather than inducing direct toxicity.
Taken together, these studies support the conclusion that gold nanoparticles, particularly those synthesized via green methods and stabilized by biomolecules, exhibit low intrinsic toxicity. The absence of inhibitory effects observed in this study is therefore in good agreement with the literature and suggests that the prepared AuNPs are biocompatible within the tested experimental conditions.
In contrast to the algal toxicity test, inhibition of root growth was observed in higher plants (Sinapis alba), indicating increased sensitivity of plant systems to the tested samples. This behavior is consistent with literature reports showing that gold nanoparticles can affect plant growth, particularly root development, depending on particle size, concentration, and plant species.
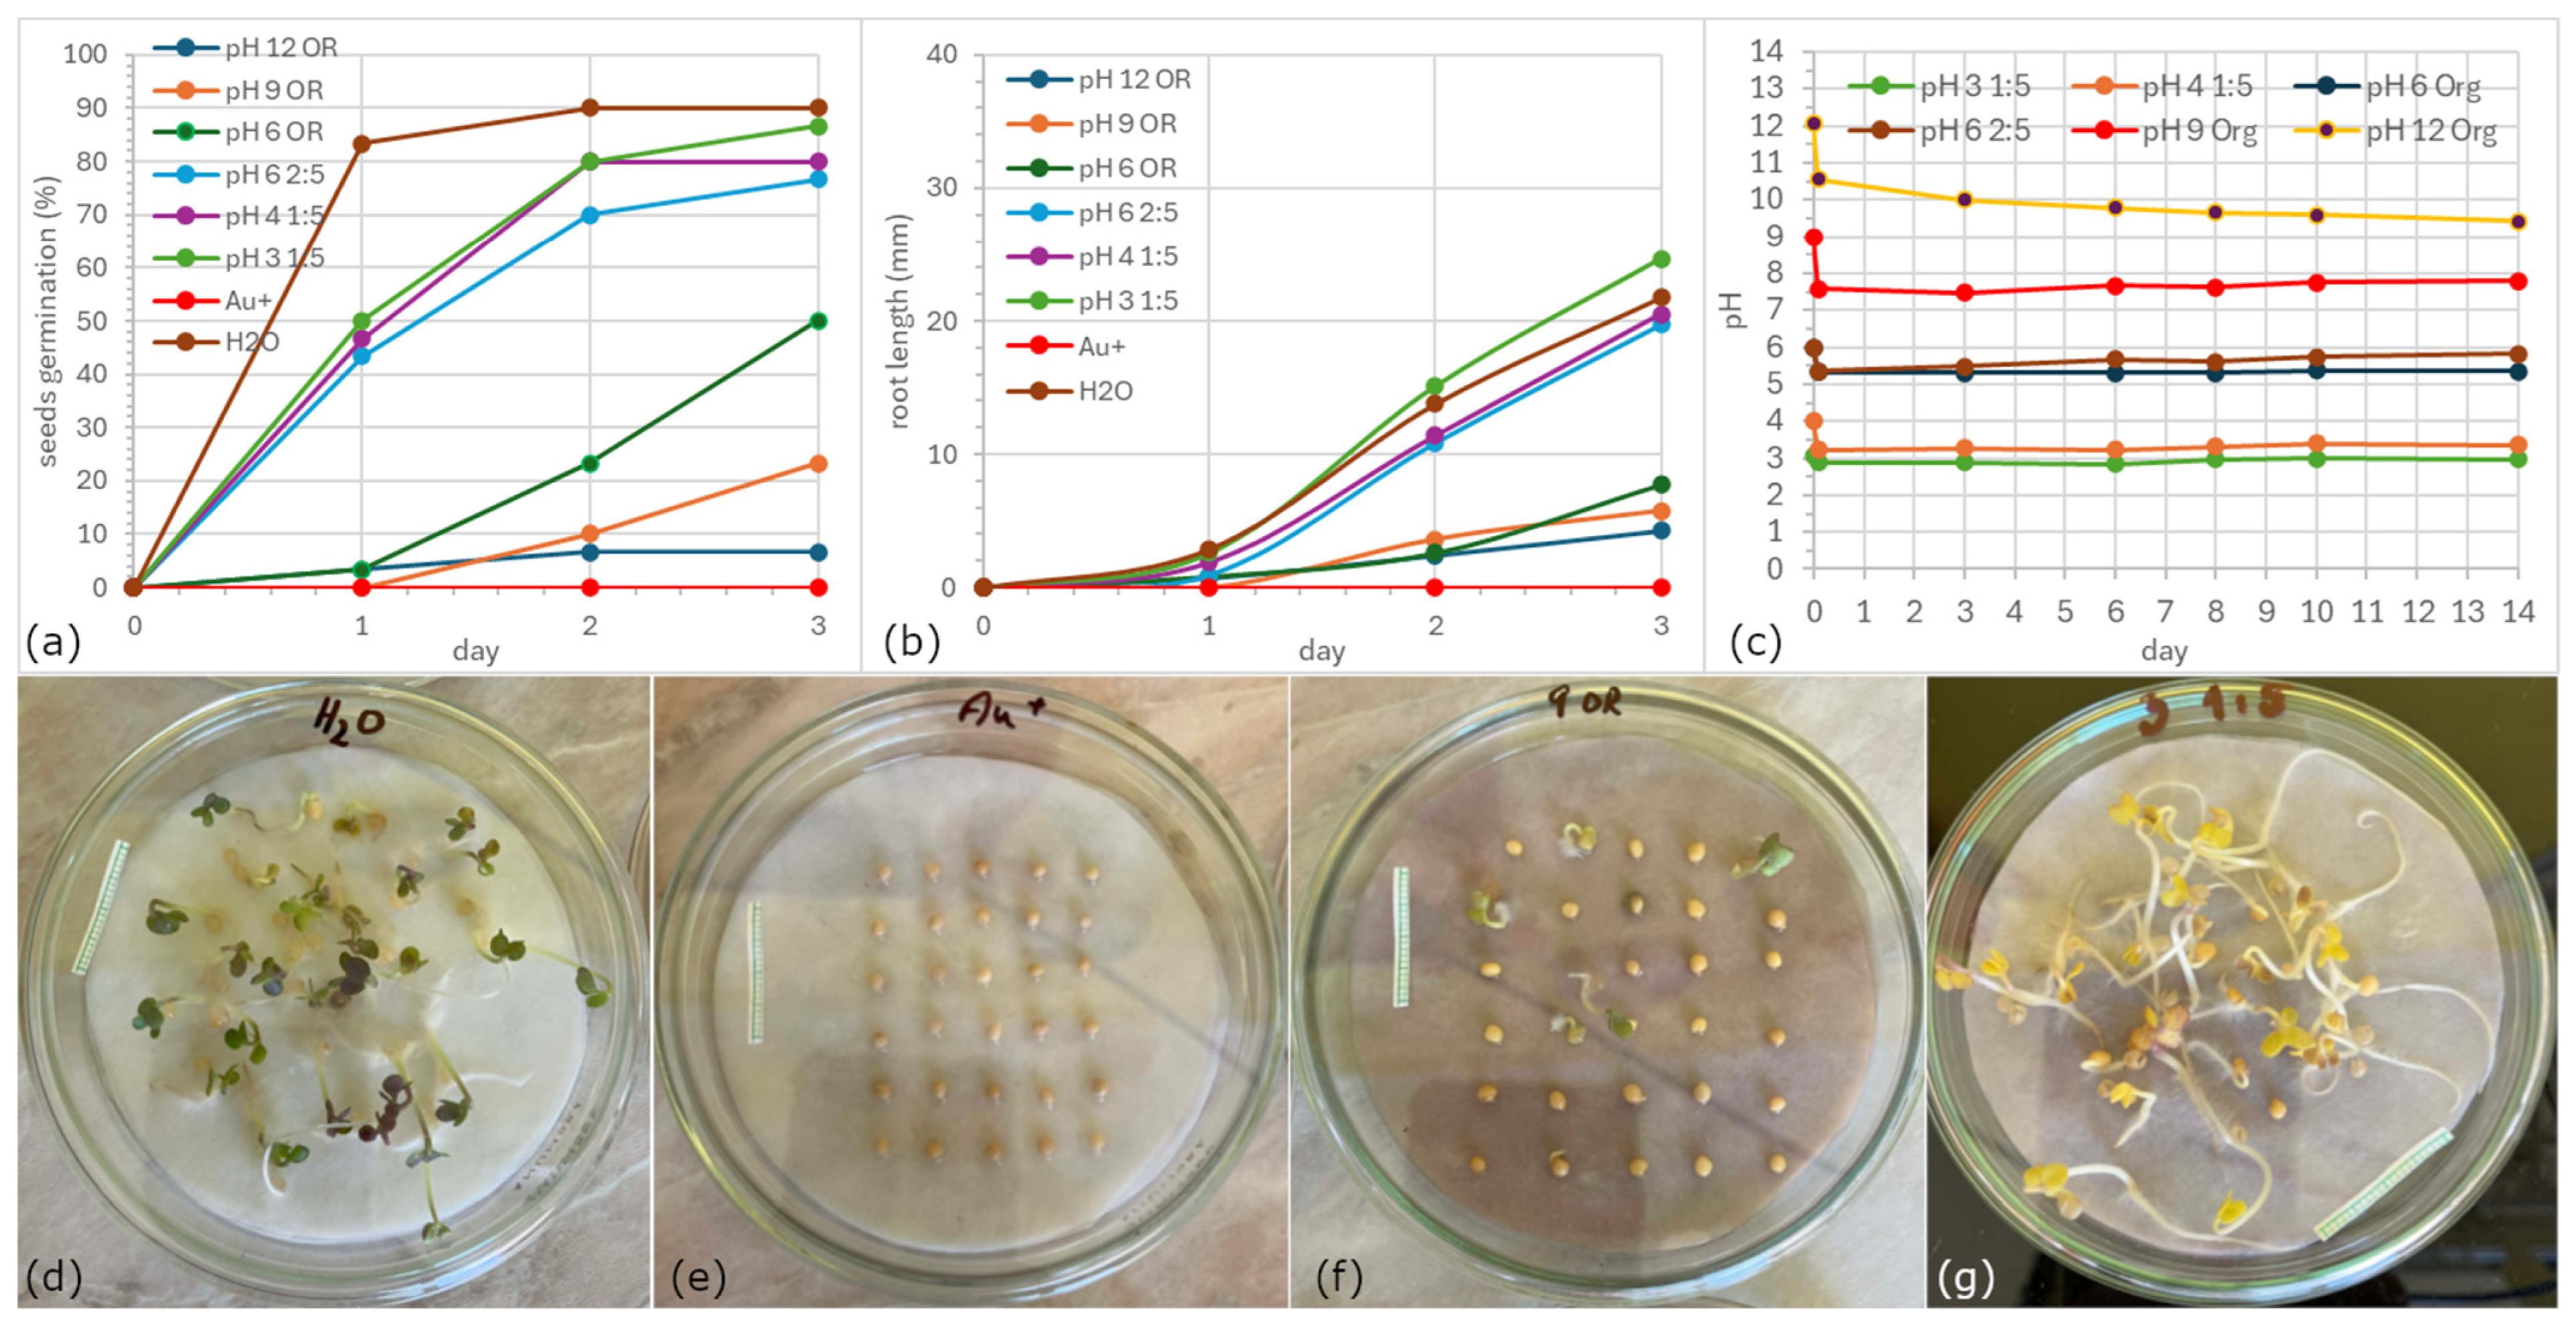
The obtained results indicate that smaller AuNPs exert a stronger inhibitory effect on root germination and elongation. AuNPs with sizes ranging from approximately 5 to 20 nm (samples prepared at pH 12 and 9) exhibited low germination rates, not exceeding 30%,
Figure 11a,f. These samples also showed the shortest root lengths, reaching only up to ~8 mm on the third day of the experiment,
Figure 11b,g.
In contrast, nanoparticles prepared at lower pH values, characterized by mixed morphologies and average sizes more than 25 nm, exhibited significantly lower phytotoxicity. Their germination rates and root growth were considerably closer to the positive control (H
2O), where approximately 90% germination was achieved, and green leaves were already visible by the third day of cultivation,
Figure 11d. Complete inhibition of root growth was observed only for the negative control containing ionic gold solution (Au
3+),
Figure 11a,e. This observation confirmed that free ionic gold species were not significantly present in the prepared colloidal systems and that the reduction of Au
3+ to Au
0 during synthesis was highly efficient. Detailed germination and root elongation results, including mean values and standard deviations obtained from three independent experiments, are provided in the
Supplementary Materials (Tables S1 and S2). The low variability between replicates confirms the good reproducibility of the bioassays and supports the observed differences among the tested samples. Complete inhibition of root growth was observed for the Au
+ control, whereas AuNP suspensions synthesized at pH 3 (1:5) and pH 4 (1:5) promoted root development comparable to, or even slightly exceeding, that of the water control.
The temporal evolution of pH values over 10 days is shown in
Figure 11c. No significant pH changes were observed after synthesis, confirming both the stability of the colloidal systems and the rapid establishment of equilibrium following nanoparticle formation.
However, the observed phytotoxic effects cannot be attributed solely to nanoparticle size. Previous studies have shown that the toxicity of gold-based systems may also be influenced by environmental conditions, including pH. Nevertheless, in the present study, inhibitory effects were also observed for the sample prepared at pH 6, where highly branched flower-like nanoparticles were formed. Since this pH range itself is generally suitable for root growth, the results suggest that nanoparticle morphology also plays an important role in determining biological response. It should be noted that residual phytochemicals originating from the green tea extract may also contribute to the observed biological responses. Green tea extracts are rich in catechins and polyphenolic compounds with well-documented antioxidant properties and generally low toxicity. However, the same extract was used for all synthesis conditions, whereas the toxicity varied considerably among the individual AuNP samples. Furthermore, the Au+ control completely inhibited seed germination and root growth, while the synthesized AuNPs exhibited markedly different biological effects depending on their size and morphology. These findings indicate that residual extract components or dissolved gold species were not the primary factors responsible for the observed phytotoxicity. Instead, nanoparticle characteristics, particularly size and shape, appear to play a dominant role in determining their interaction with higher plants.
The synthesized AuNPs exhibited negligible toxicity toward algae; their effects on higher plants were more complex, clearly demonstrating that nanoparticle size and morphology significantly influence plant viability and development.