

Multicriteria Decision Analysis of the Influence of Natural Fibers on the Flexibility of Renewable Polyurethane Composites


Abstract
1. Introduction
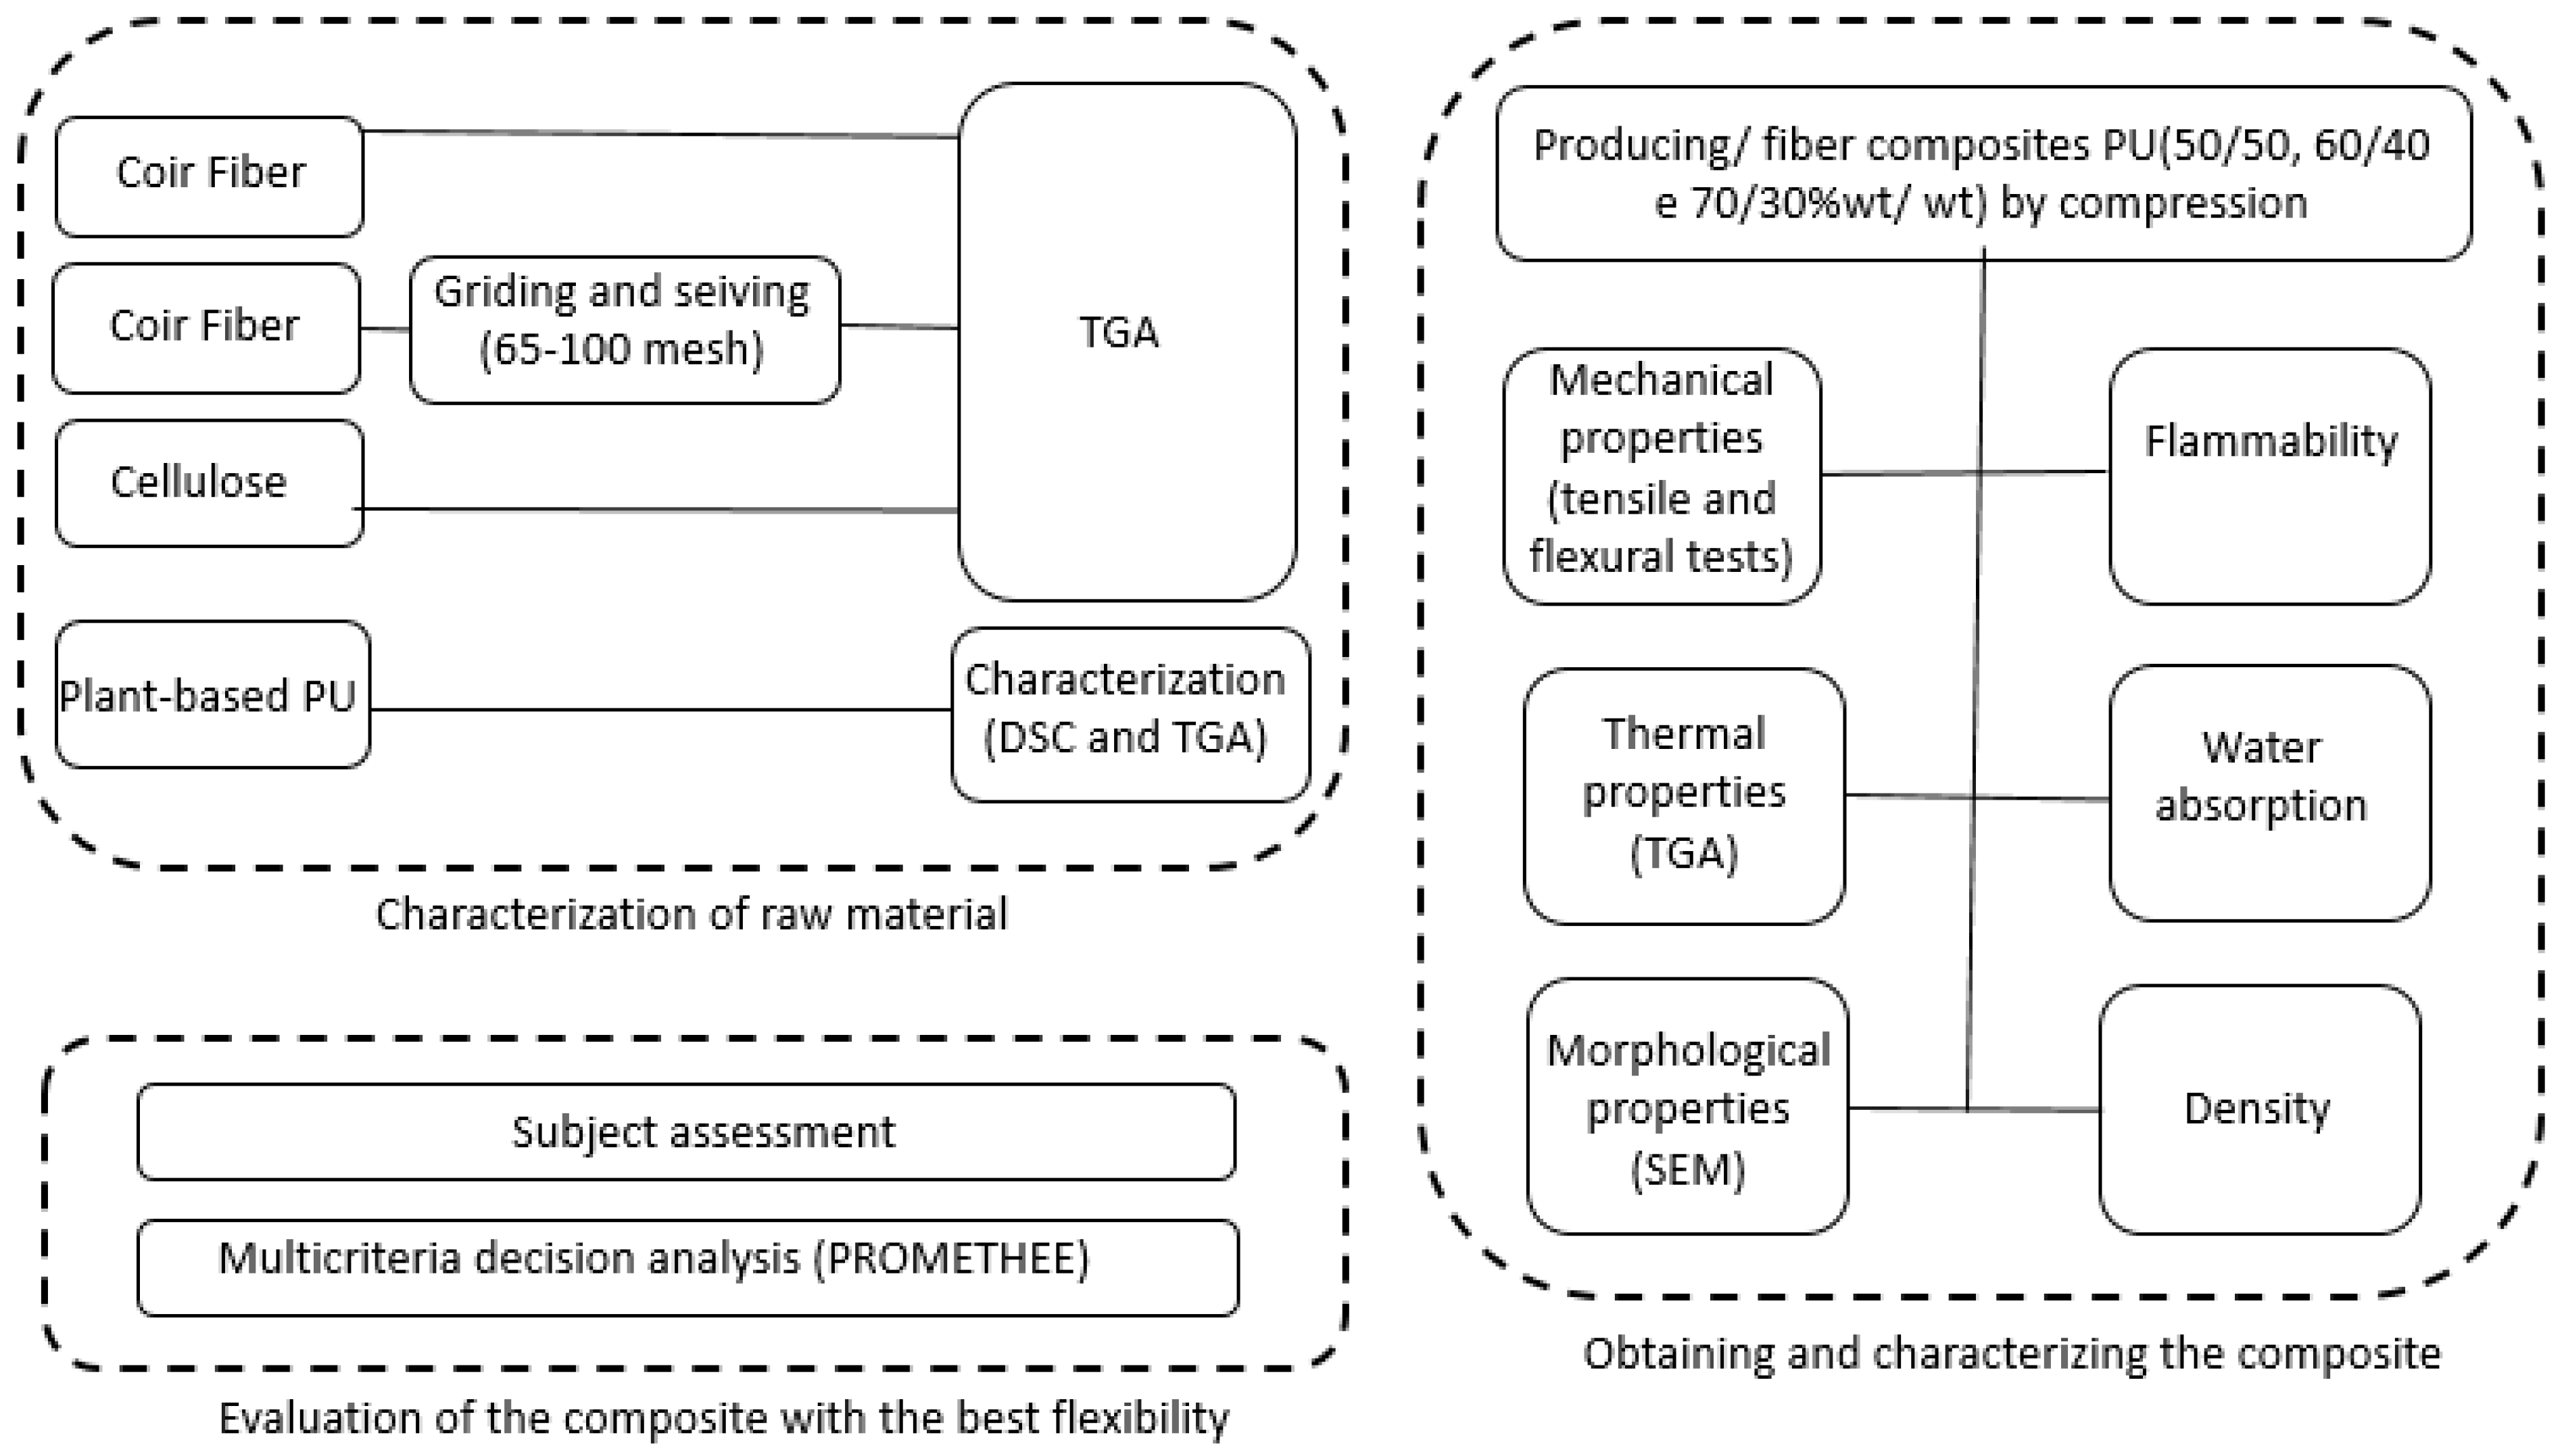
2. Materials and Methods
2.1. Materials
- IMPERVEG RM 122® resin (PU) acquired from IMPERVEG, Aguaí, São Paulo state, Brazil. This two-component PU contains a polyol (component A) and a pre-polymer (component B). The polyol was synthesized from castor oil and the pre-polymer from methylene diphenylmethane diisocyanate (MDI), which was pre-polymerized with polyol, also derived from castor oil [44].
- Coir fiber from Bahia state was kindly donated by Projeto Coco Verde (in English: Green Coconut Project), Rio de Janeiro, Brazil. Two coir fiber sizes were used: long (LCF, long coir fiber) and ground (GCF, ground coir fiber).
- 99% pure commercial cellulose fiber (CF) (Fluff Pulp ECF (CAS No.: 9004-34-6)) was obtained from Pinus taeda trees and provided by Arauco Brazil.
2.2. Chemical Composition of the Natural Fibers
2.2.1. Holocellulose Content
2.2.2. Hemicellulose and α-Cellulose Content
2.2.3. Acid-Insoluble Lignin Content
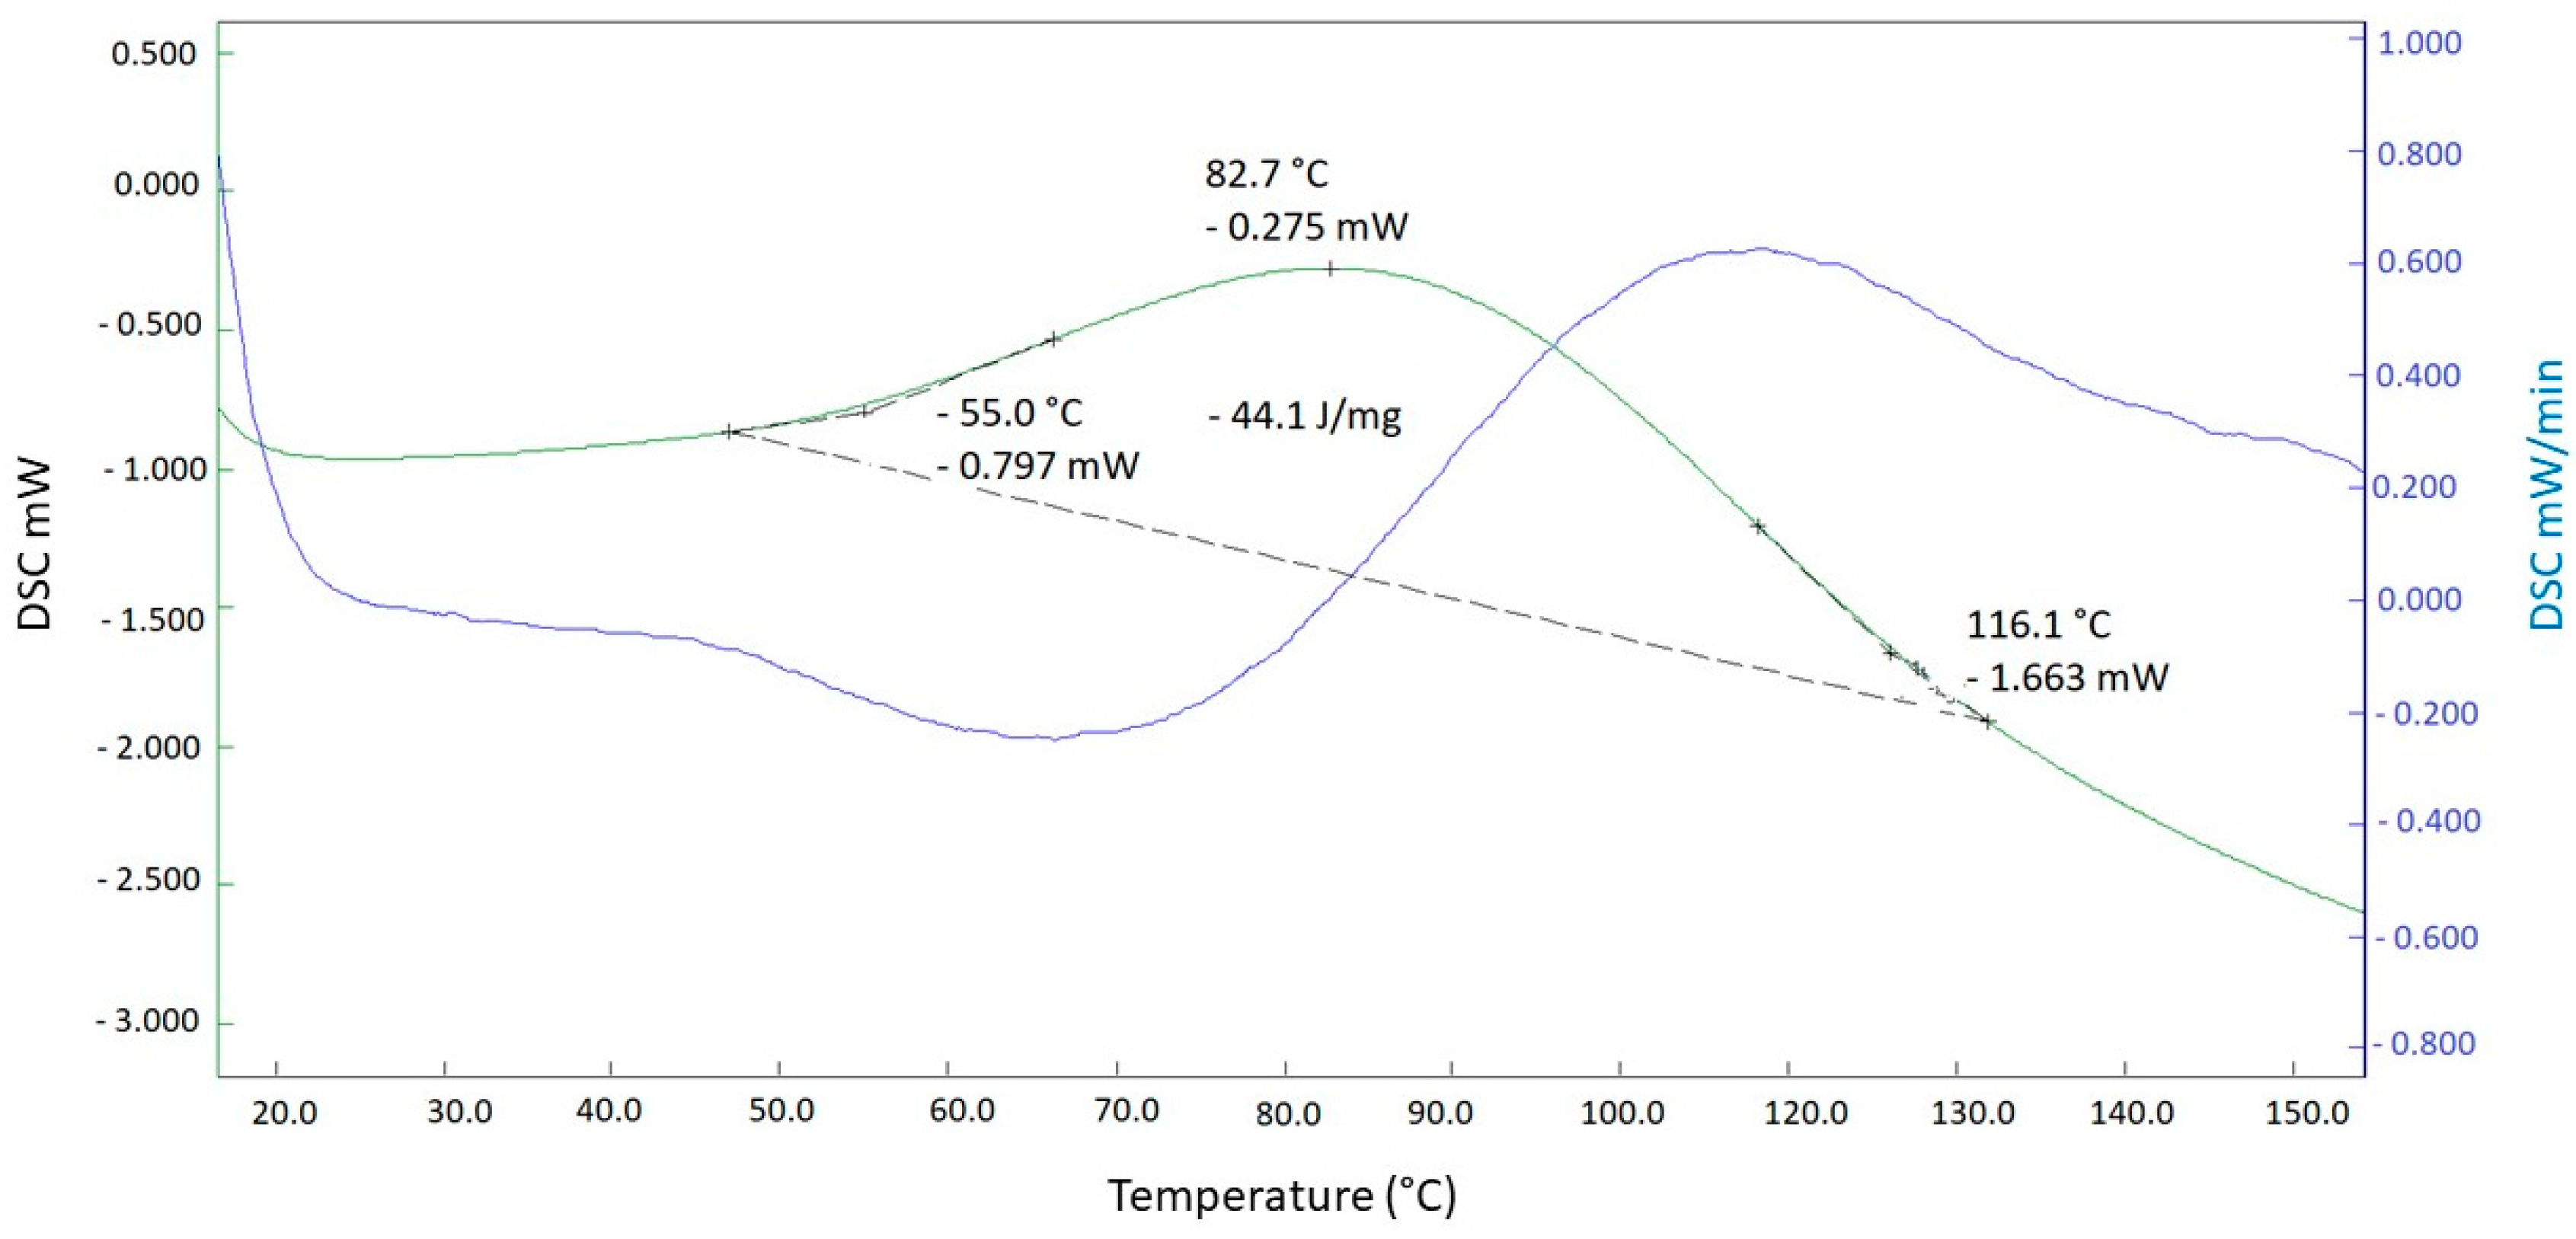
2.3. PU Curing Assessment
2.4. Obtaining the Composites
2.5. Thermogravimetric Analysis
2.6. Mechanical Properties
2.6.1. Tensile Test
2.6.2. Flexural Test
2.7. Morphological Properties
2.8. Density
2.9. Water Absorption
2.10. Flammability
2.11. Analysis of Composite Properties with an Emphasis on Flexibility
2.11.1. Subjective Analysis
- ✓
- More positive—those most beneficial to the property, shown in green for better visualization.
- ✓
- Less positive—those least beneficial to the property, shown in red.
- ✓
- Median—values between the most or least positive (mean values), shown in blue.
- ✓
- ✓
- Properties with an importance value of 2: Related to flexibility (toughness, flexural strength and flexural modulus), classified as median or mean, considered (+).
- ✓
- Other properties studied with an importance value of 2: Tonset in TGA, tensile modulus, presence of bubbles in SEM, density, water absorption, burning time and burn rate in flammability tests, the values of which were more (+) or less positive (−).
- ✓
- Other properties with an importance value of 1: Tonset in TGA, tensile modulus, presence of bubbles in SEM, density, water absorption, burning time and burn rate in flammability tests, the values of which were classified as median or mean, considered (+).
2.11.2. Multicriteria Decision Analysis
- Assessment framework:
- Preference functions:
- ✓
- Description: The simplest function, whereby any positive difference between the alternatives is considered a global preference.
- ✓
- Application: Used when the difference between assessments of the alternatives is significant.
- ✓
- Formula: P (d) = 0 if d ≤ 0; P (d) = 1 if d > 0.
- Weights of the properties:
3. Results
3.1. Assessment of Curing Time by Differential Scanning Calorimetry
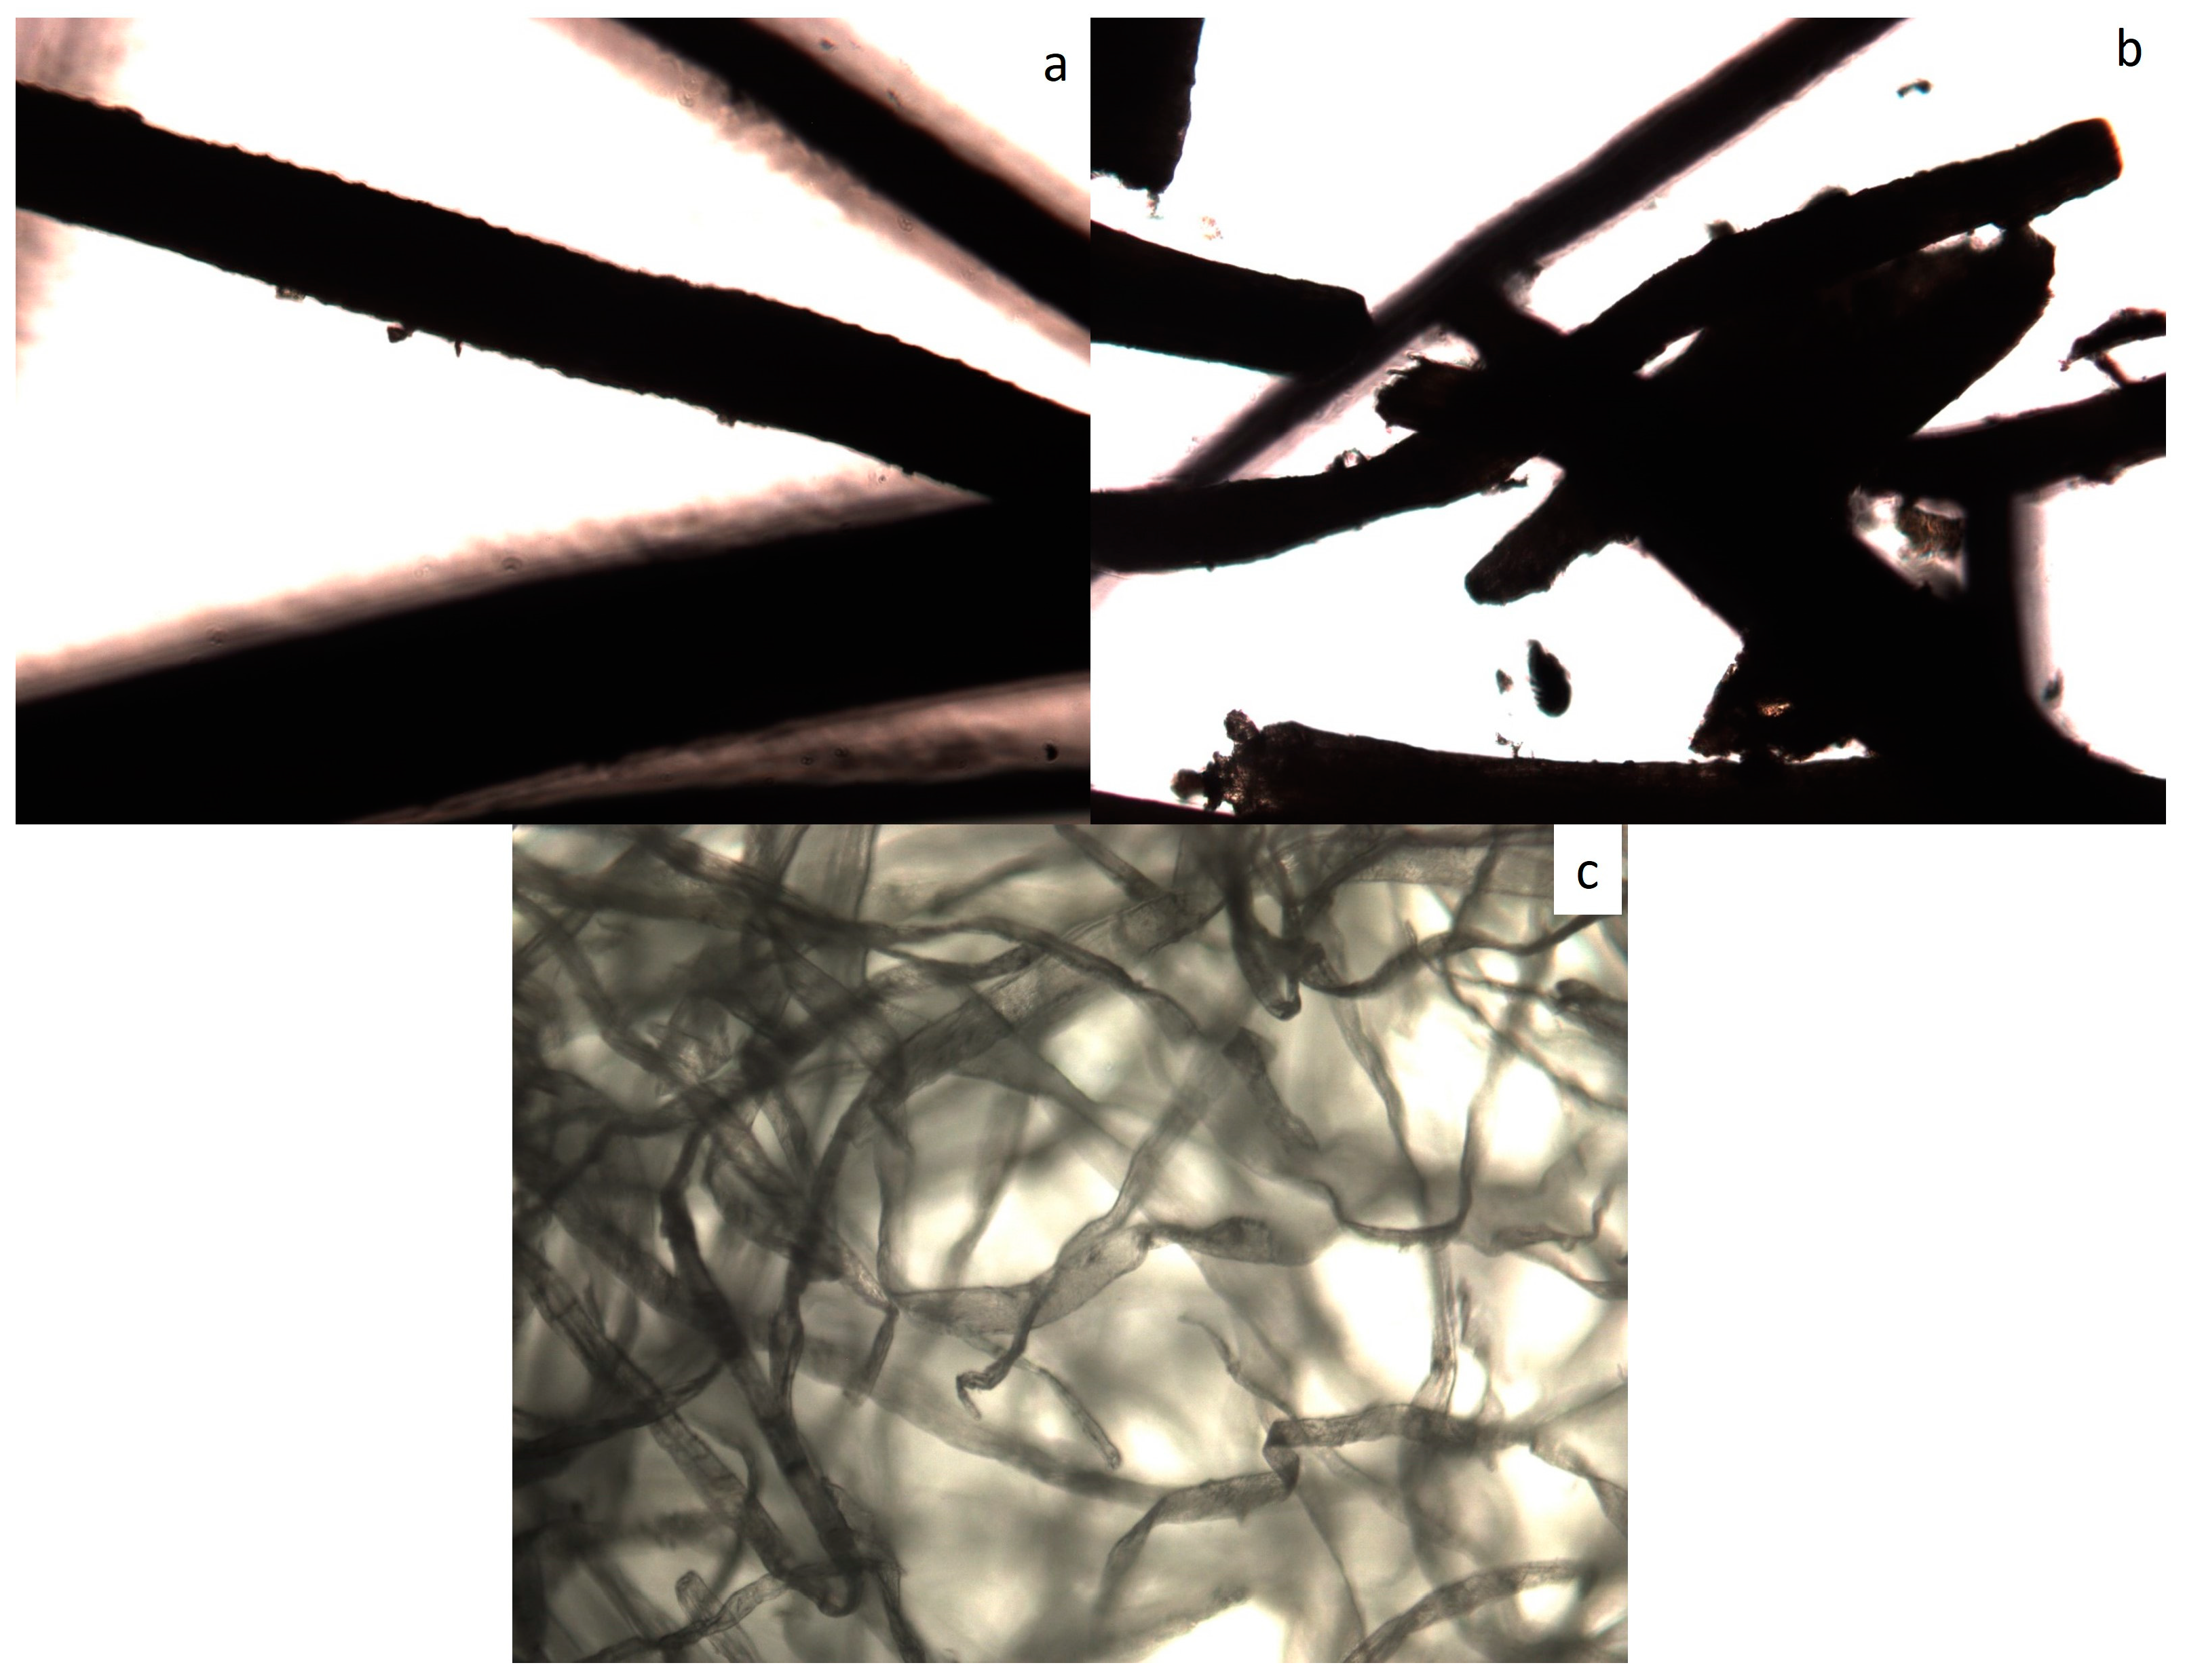
3.2. Chemical Characterization of the Lignocellulosic Fibers
3.3. Obtaining the Composites
3.4. Composite Characterization
3.4.1. Thermal Properties of the Composites
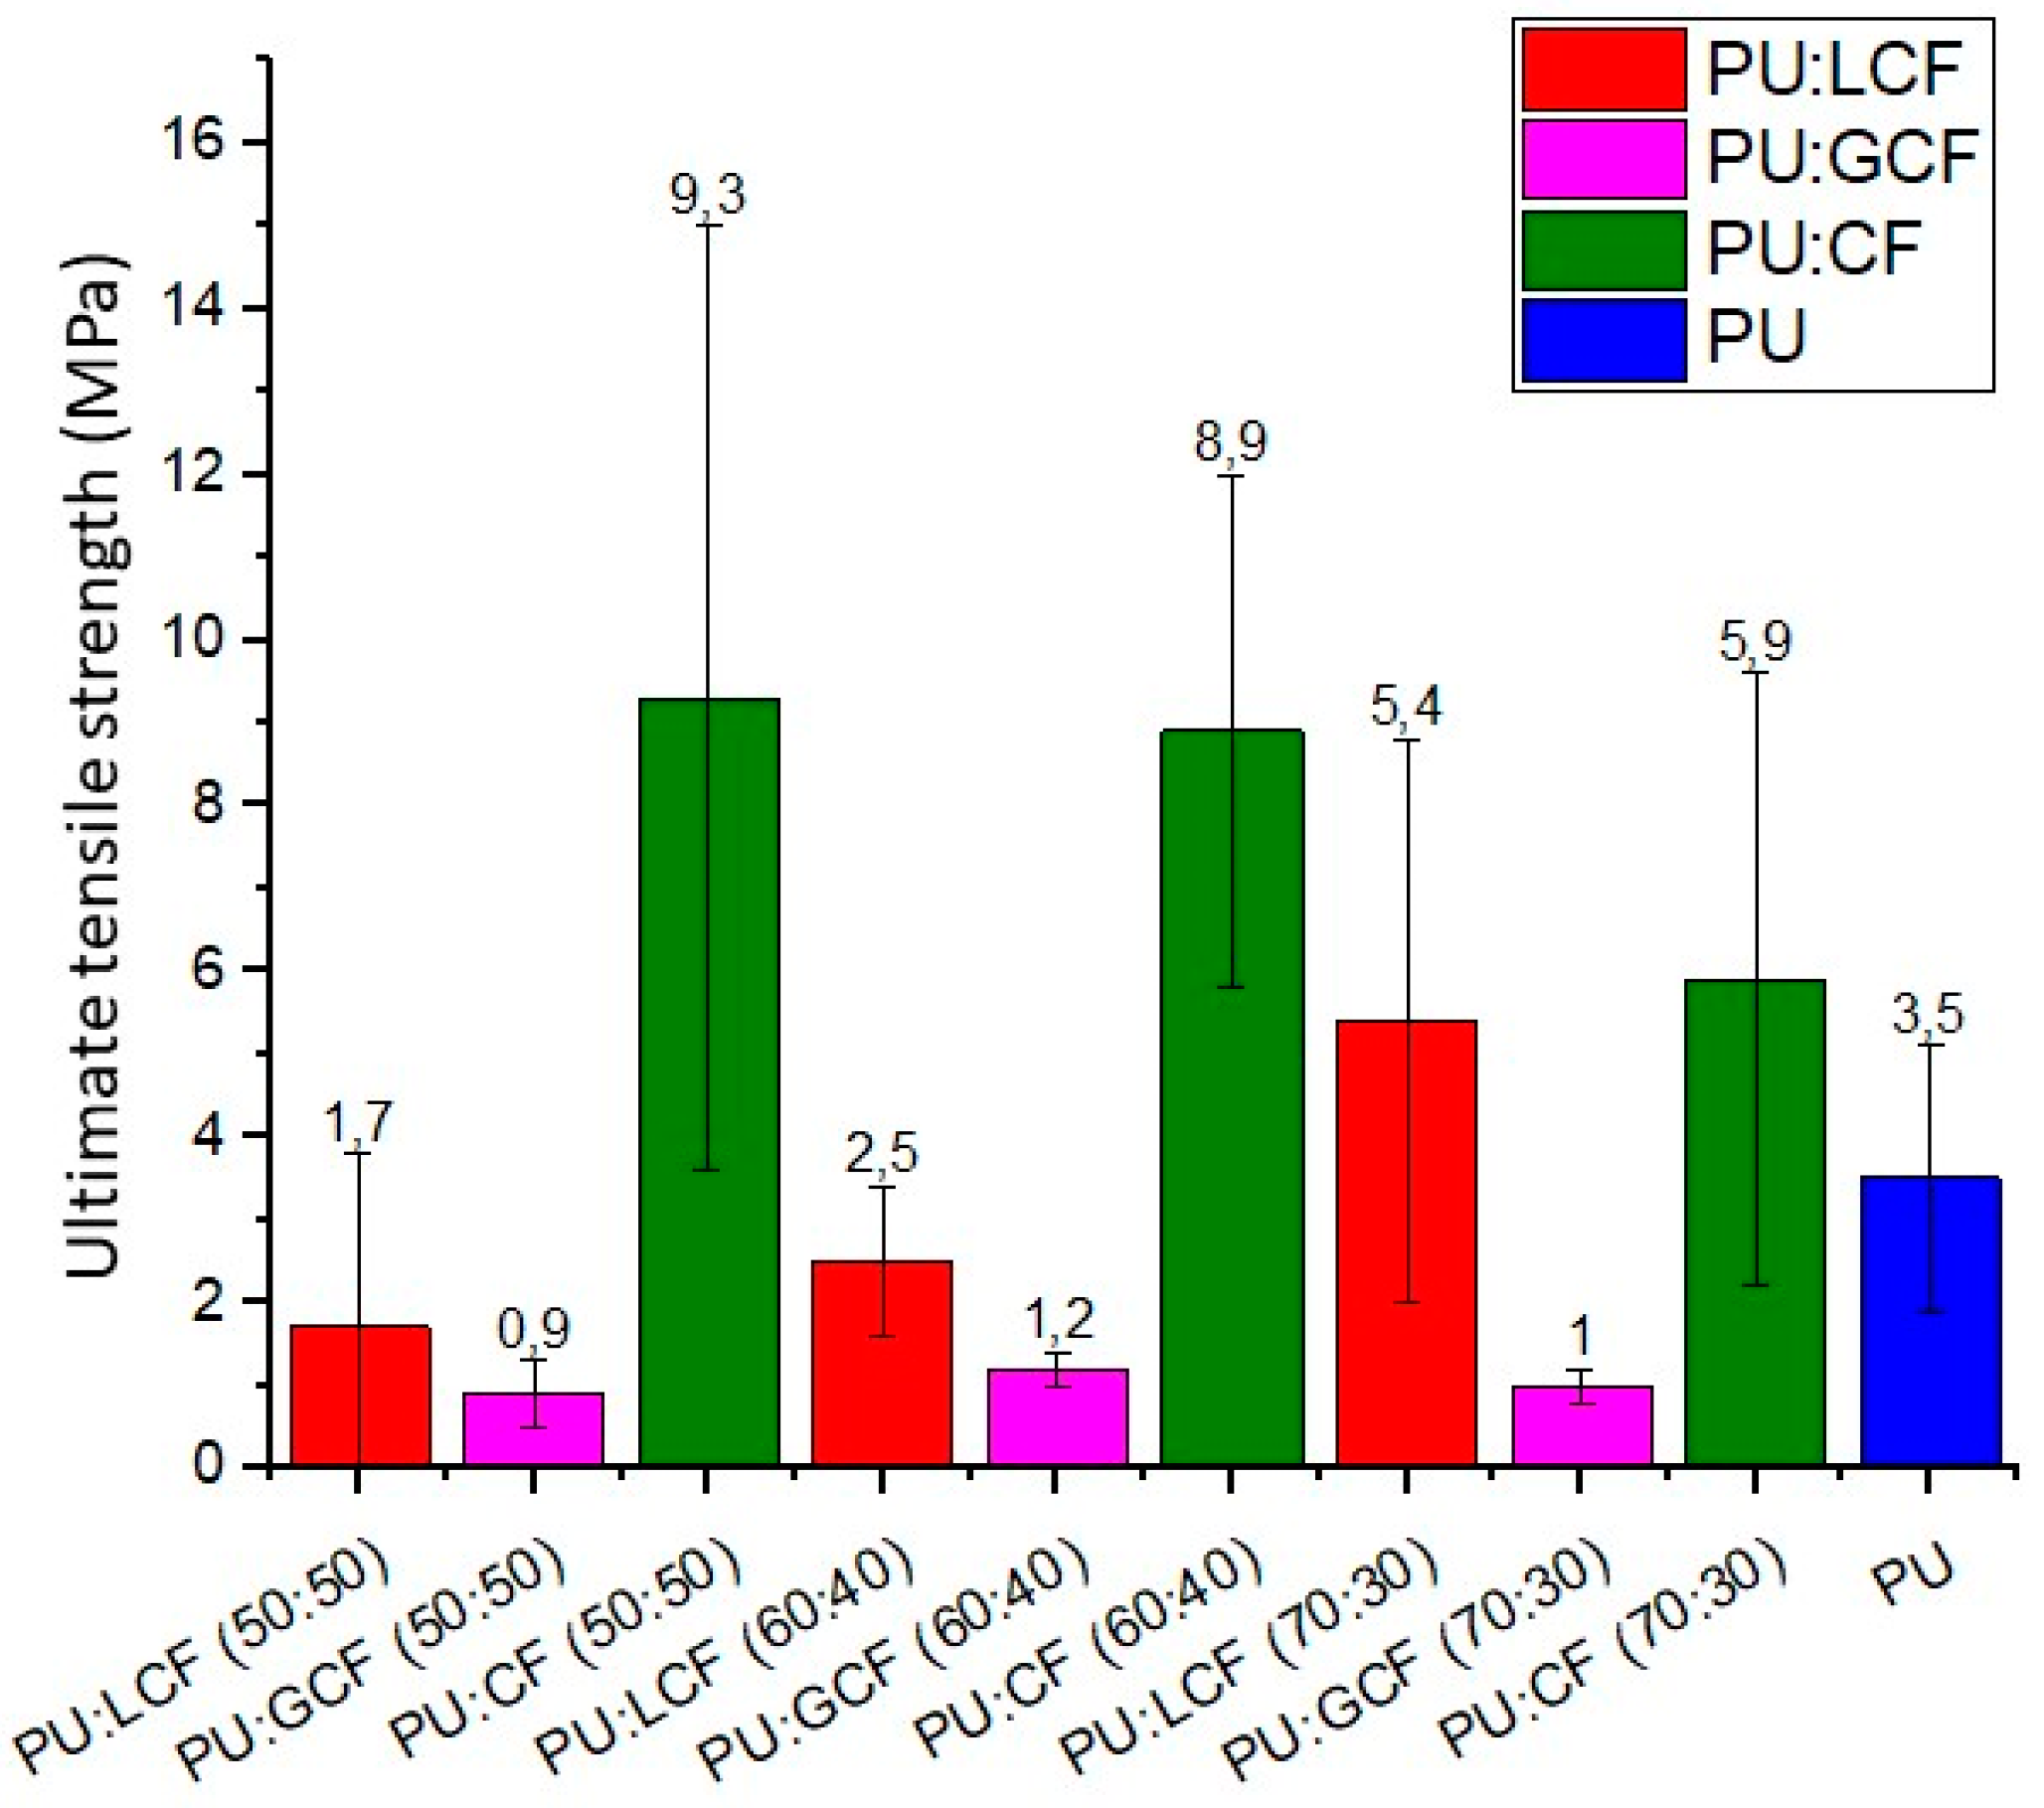
3.4.2. Mechanical Properties
- (a)
- Tensile tests
- Ultimate Tensile Strength
- Toughness
- Tensile Modulus
- (b)
- Flexural tests
- Flexural strength
- Flexural Modulus
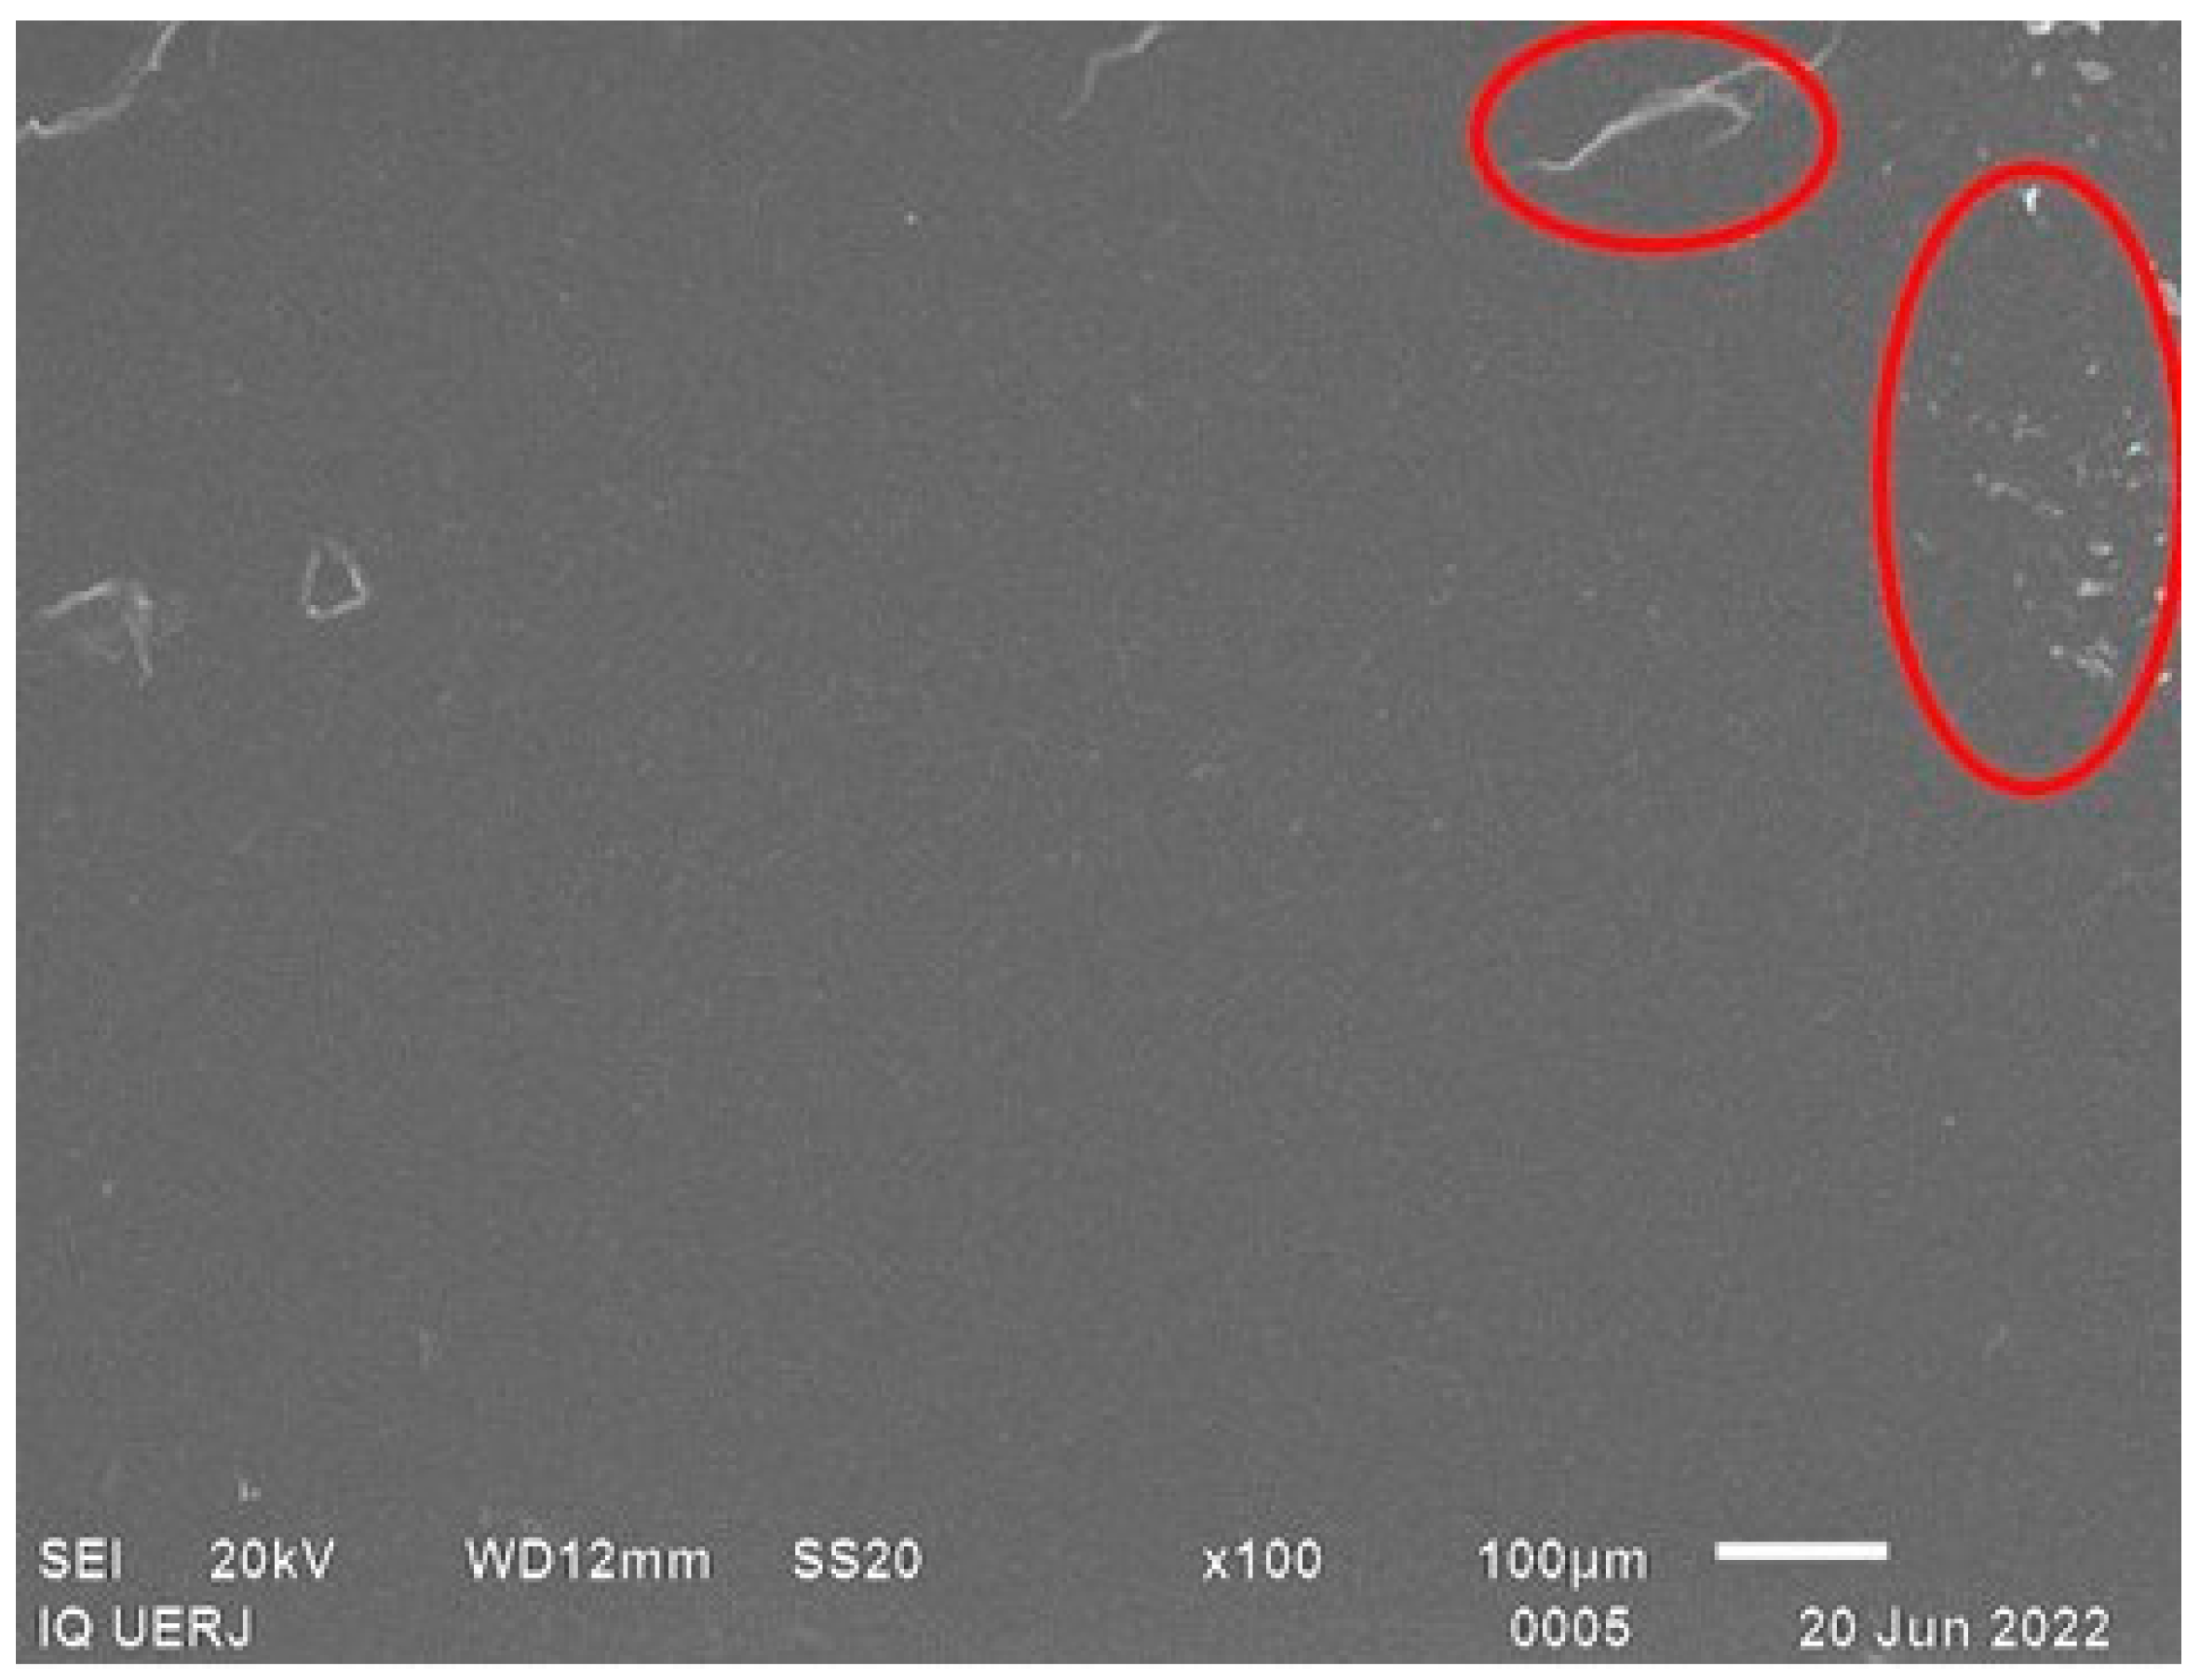
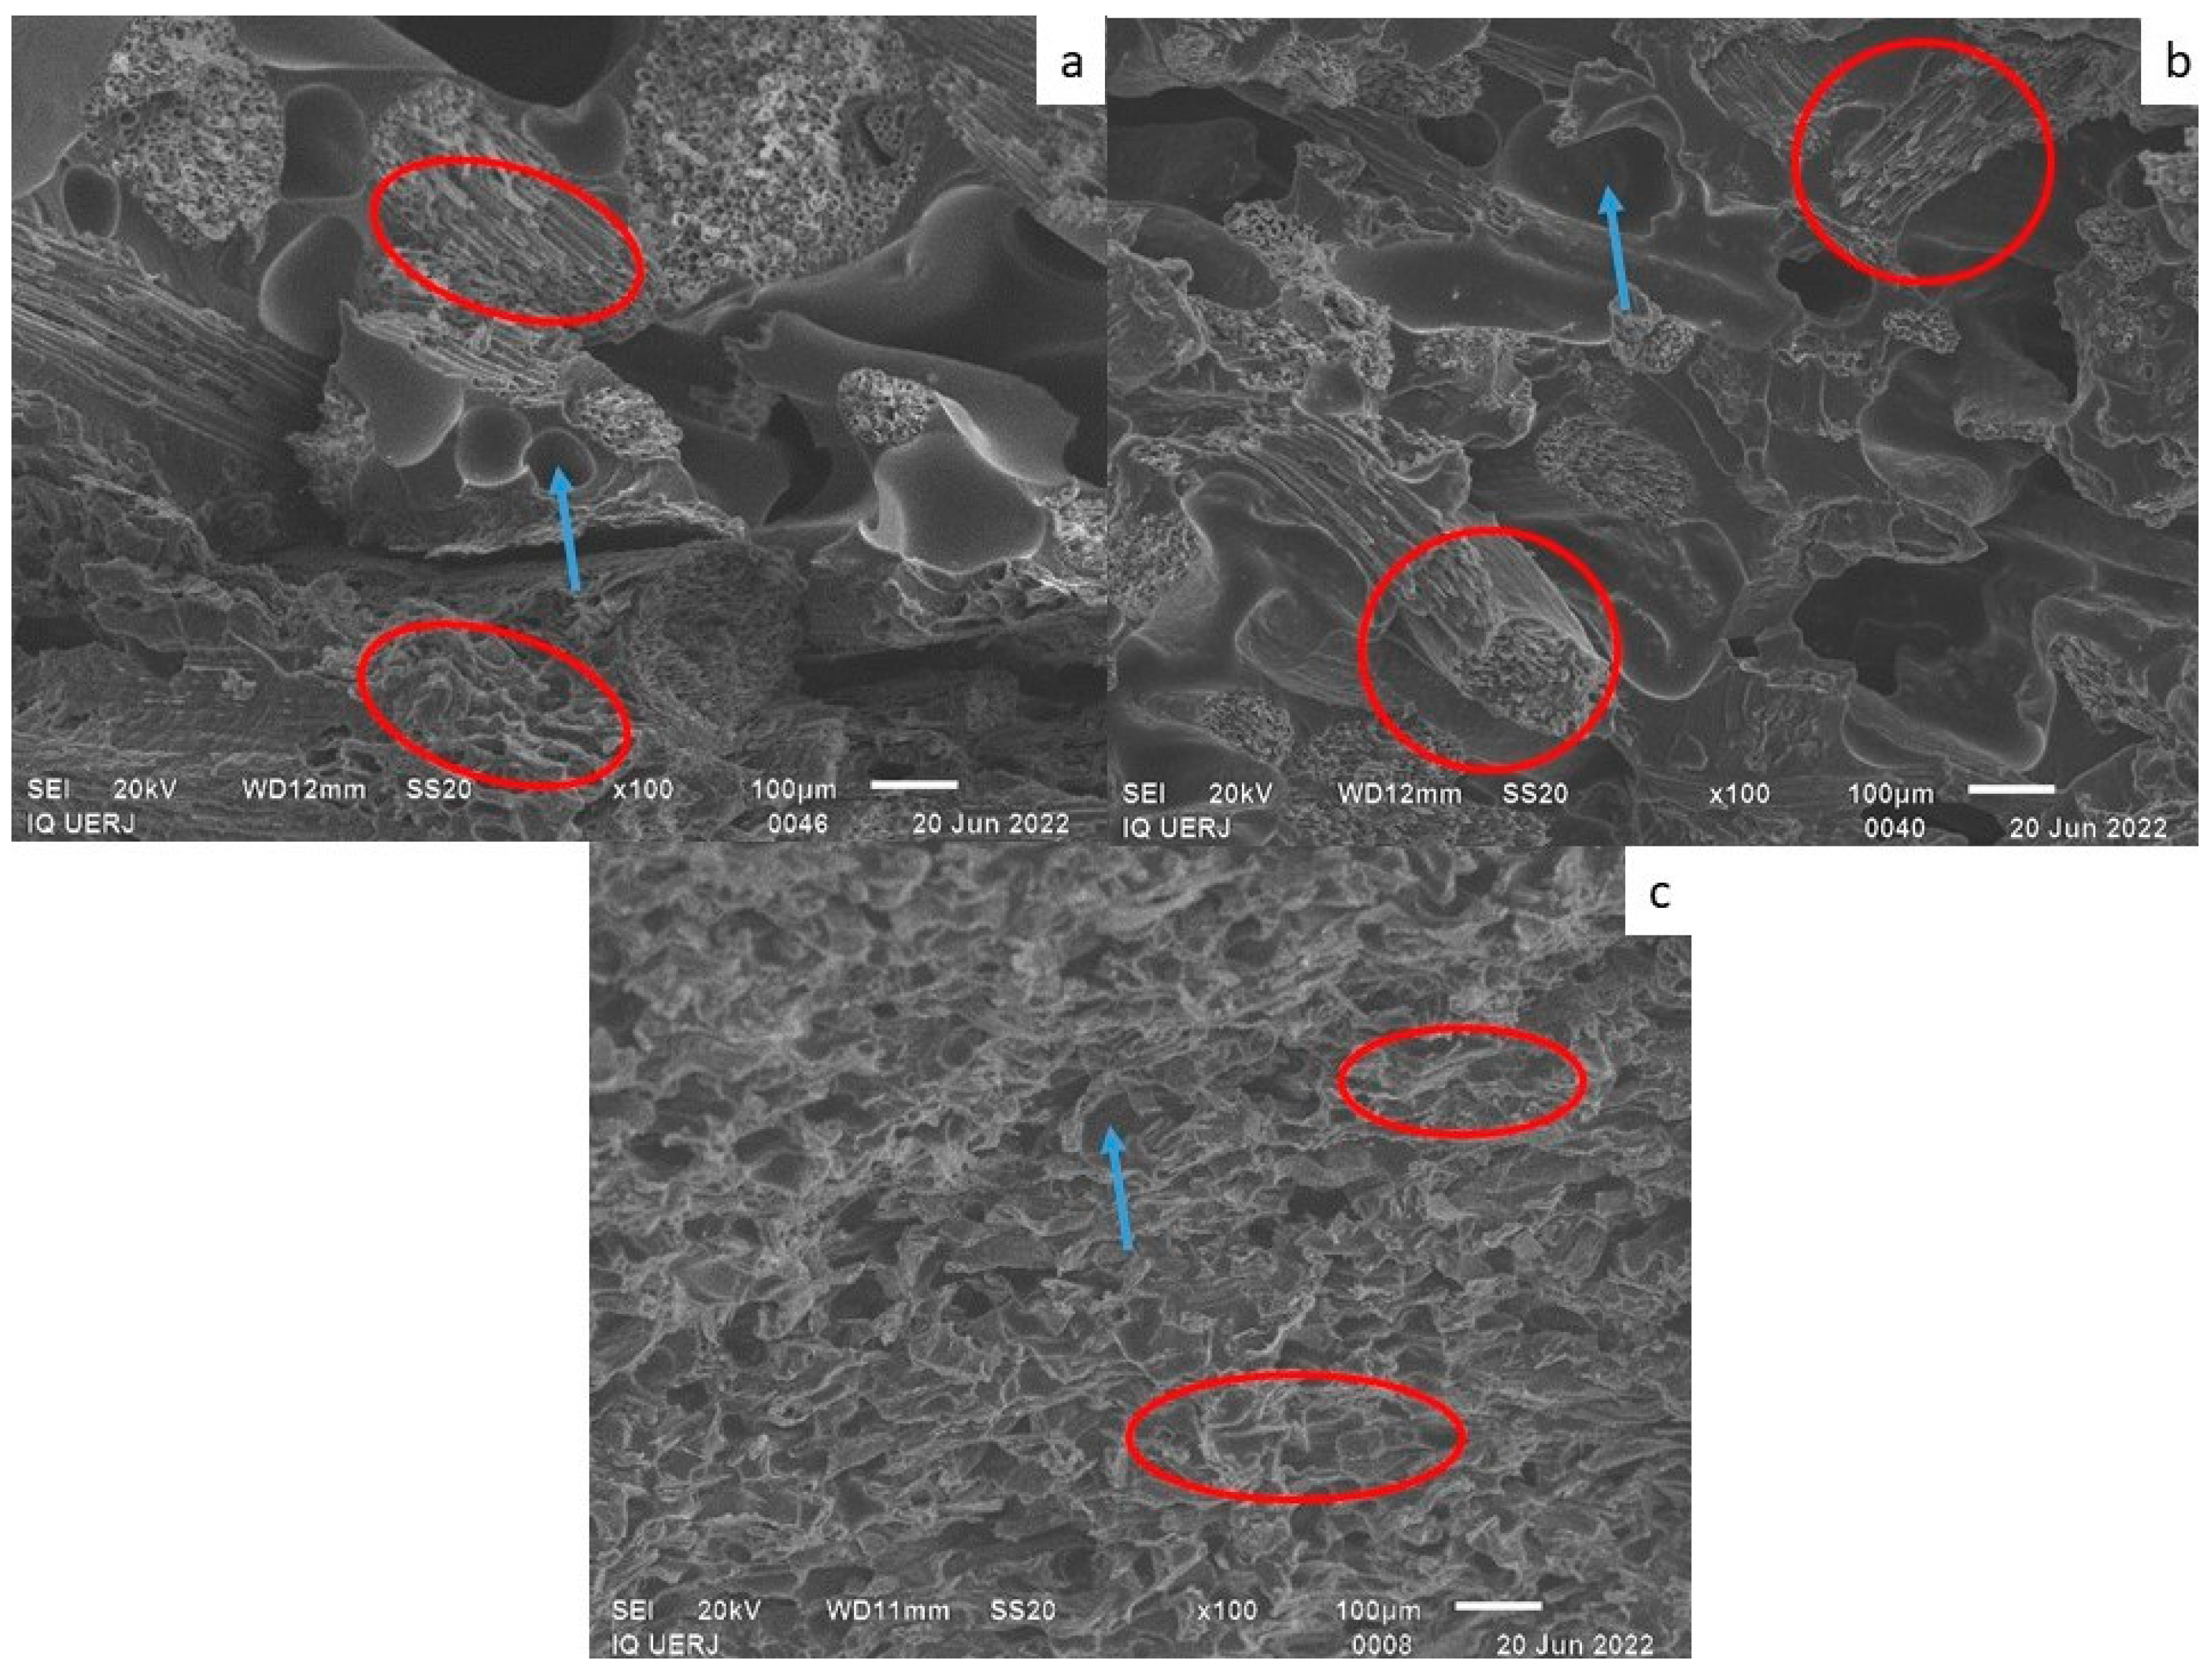
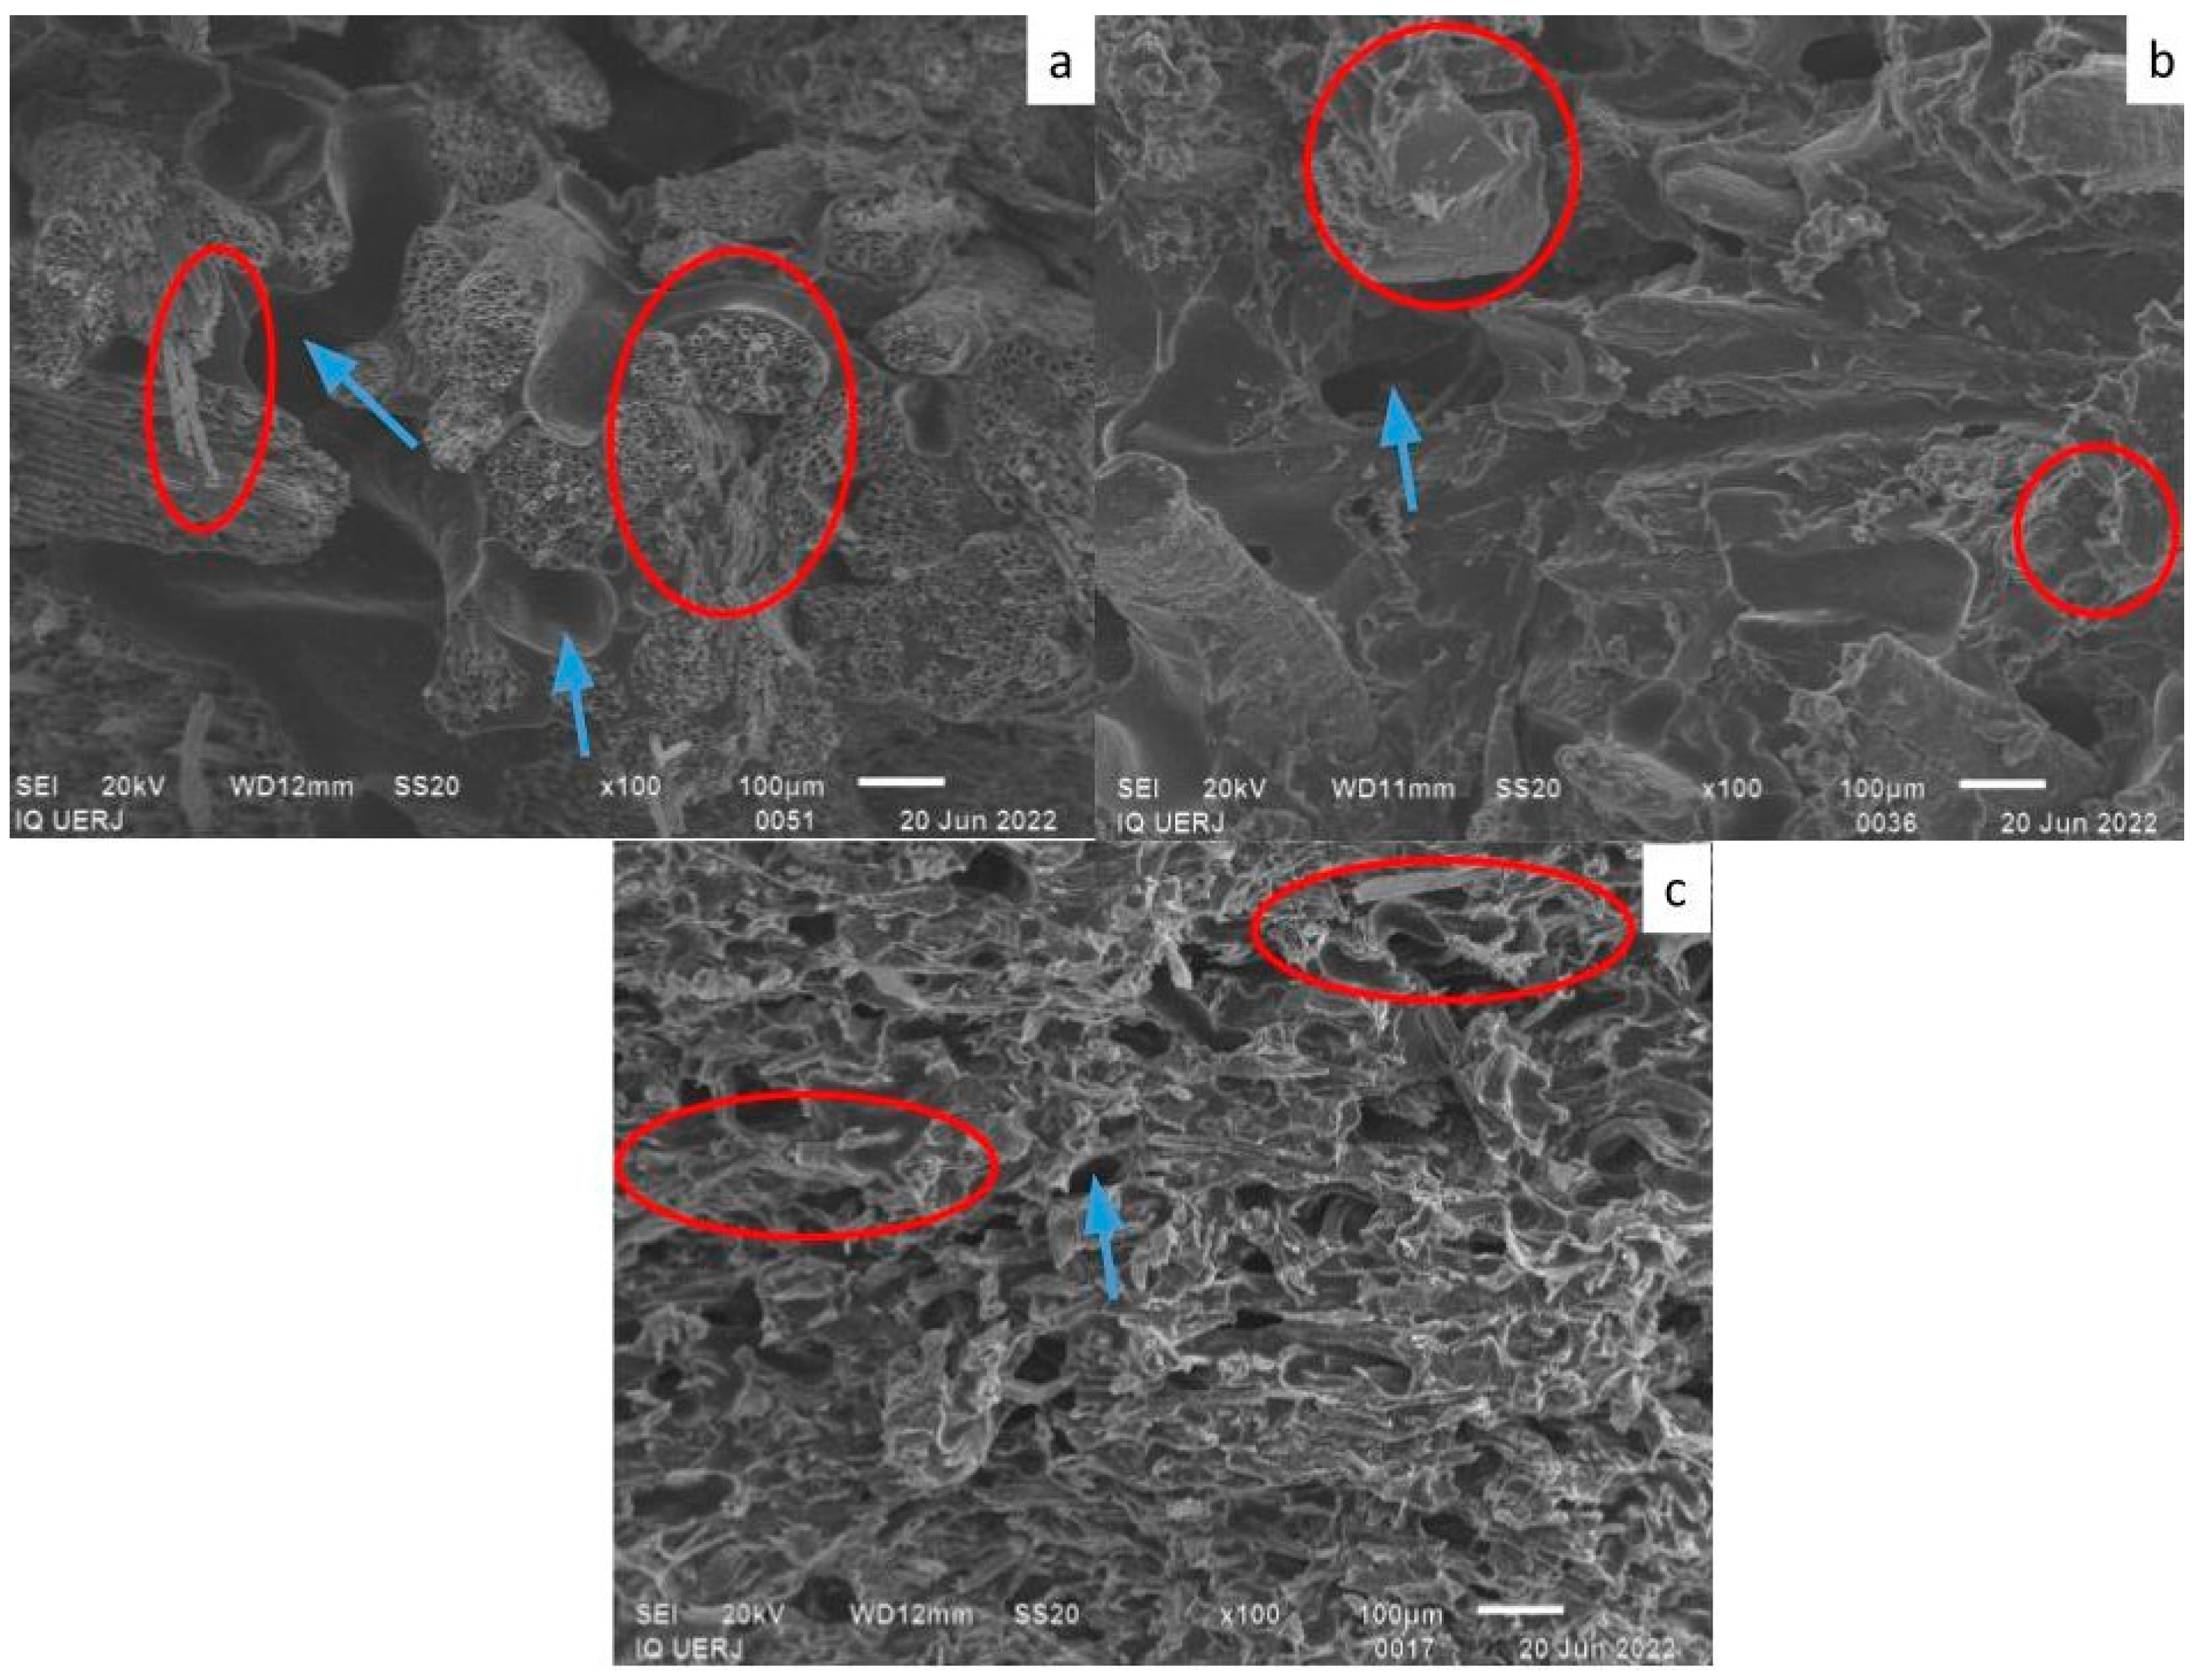
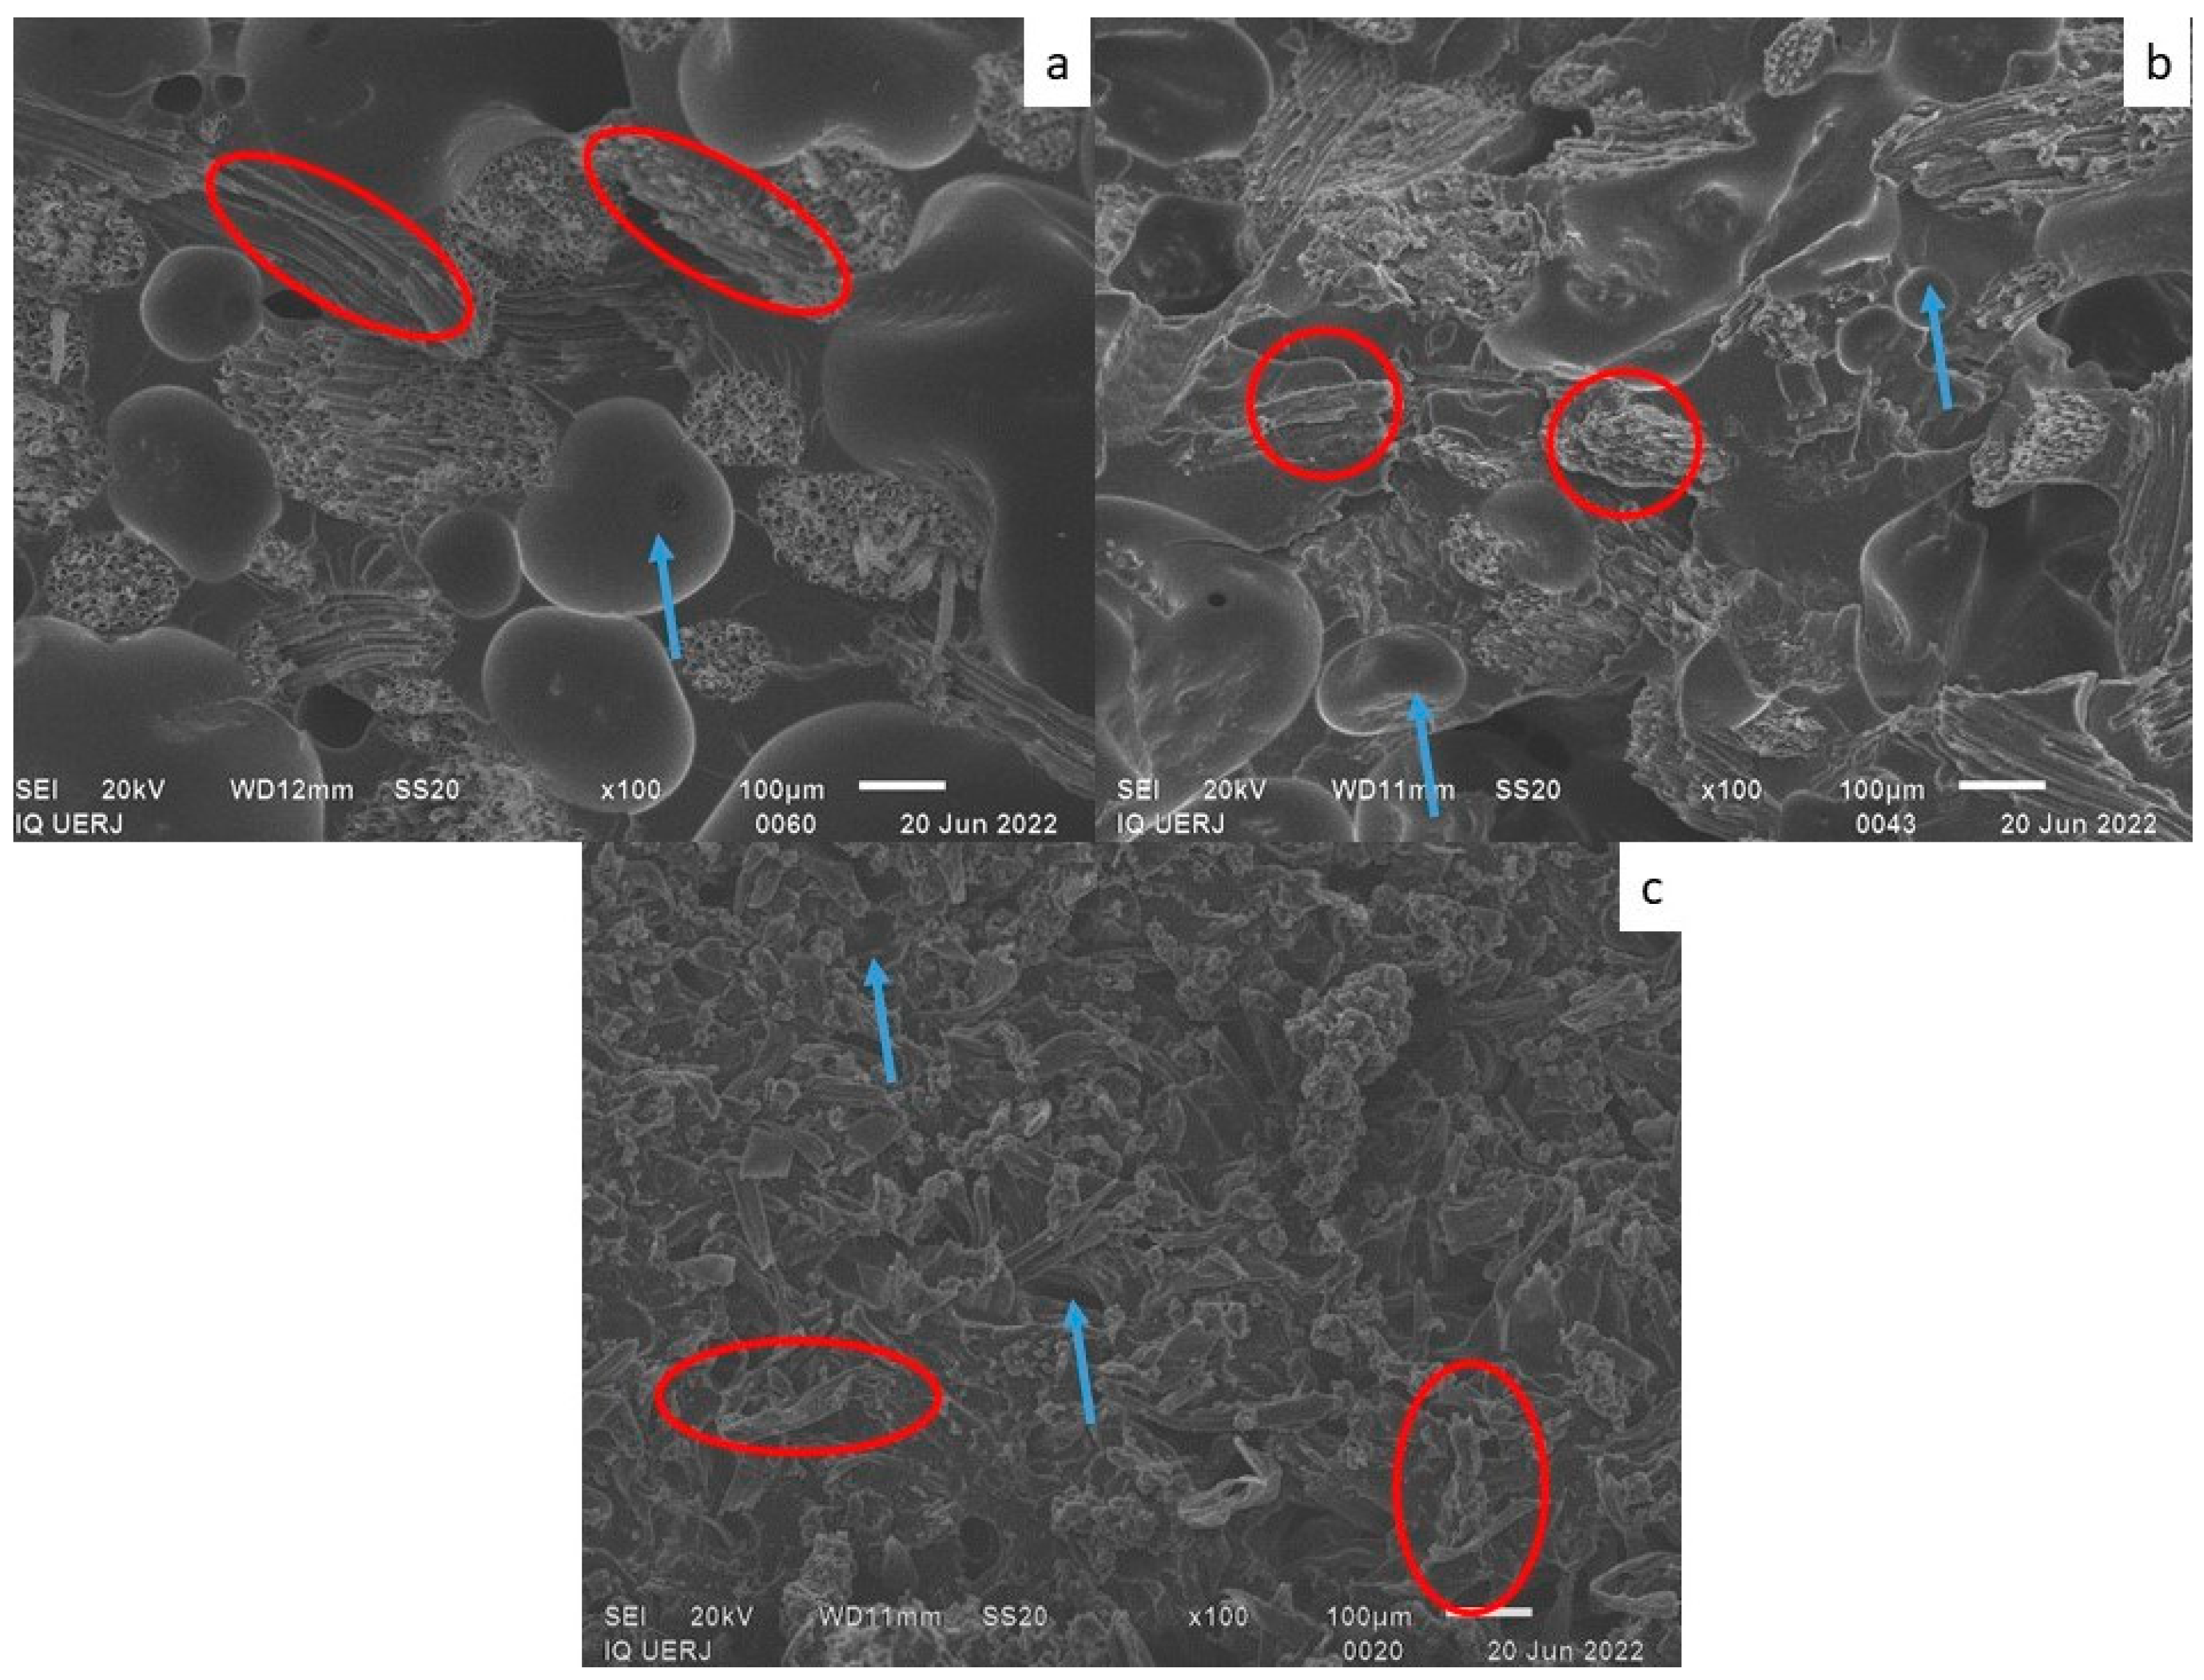
3.4.3. Morphological Analysis of the Composites
3.4.4. Density
3.4.5. Water Absorption
3.4.6. Flammability
- Average Burning Times
- Burn Rate
4. Subjective Flexibility Analysis of the Composites
5. Multicriteria Decision Analysis of the Properties
- ✓
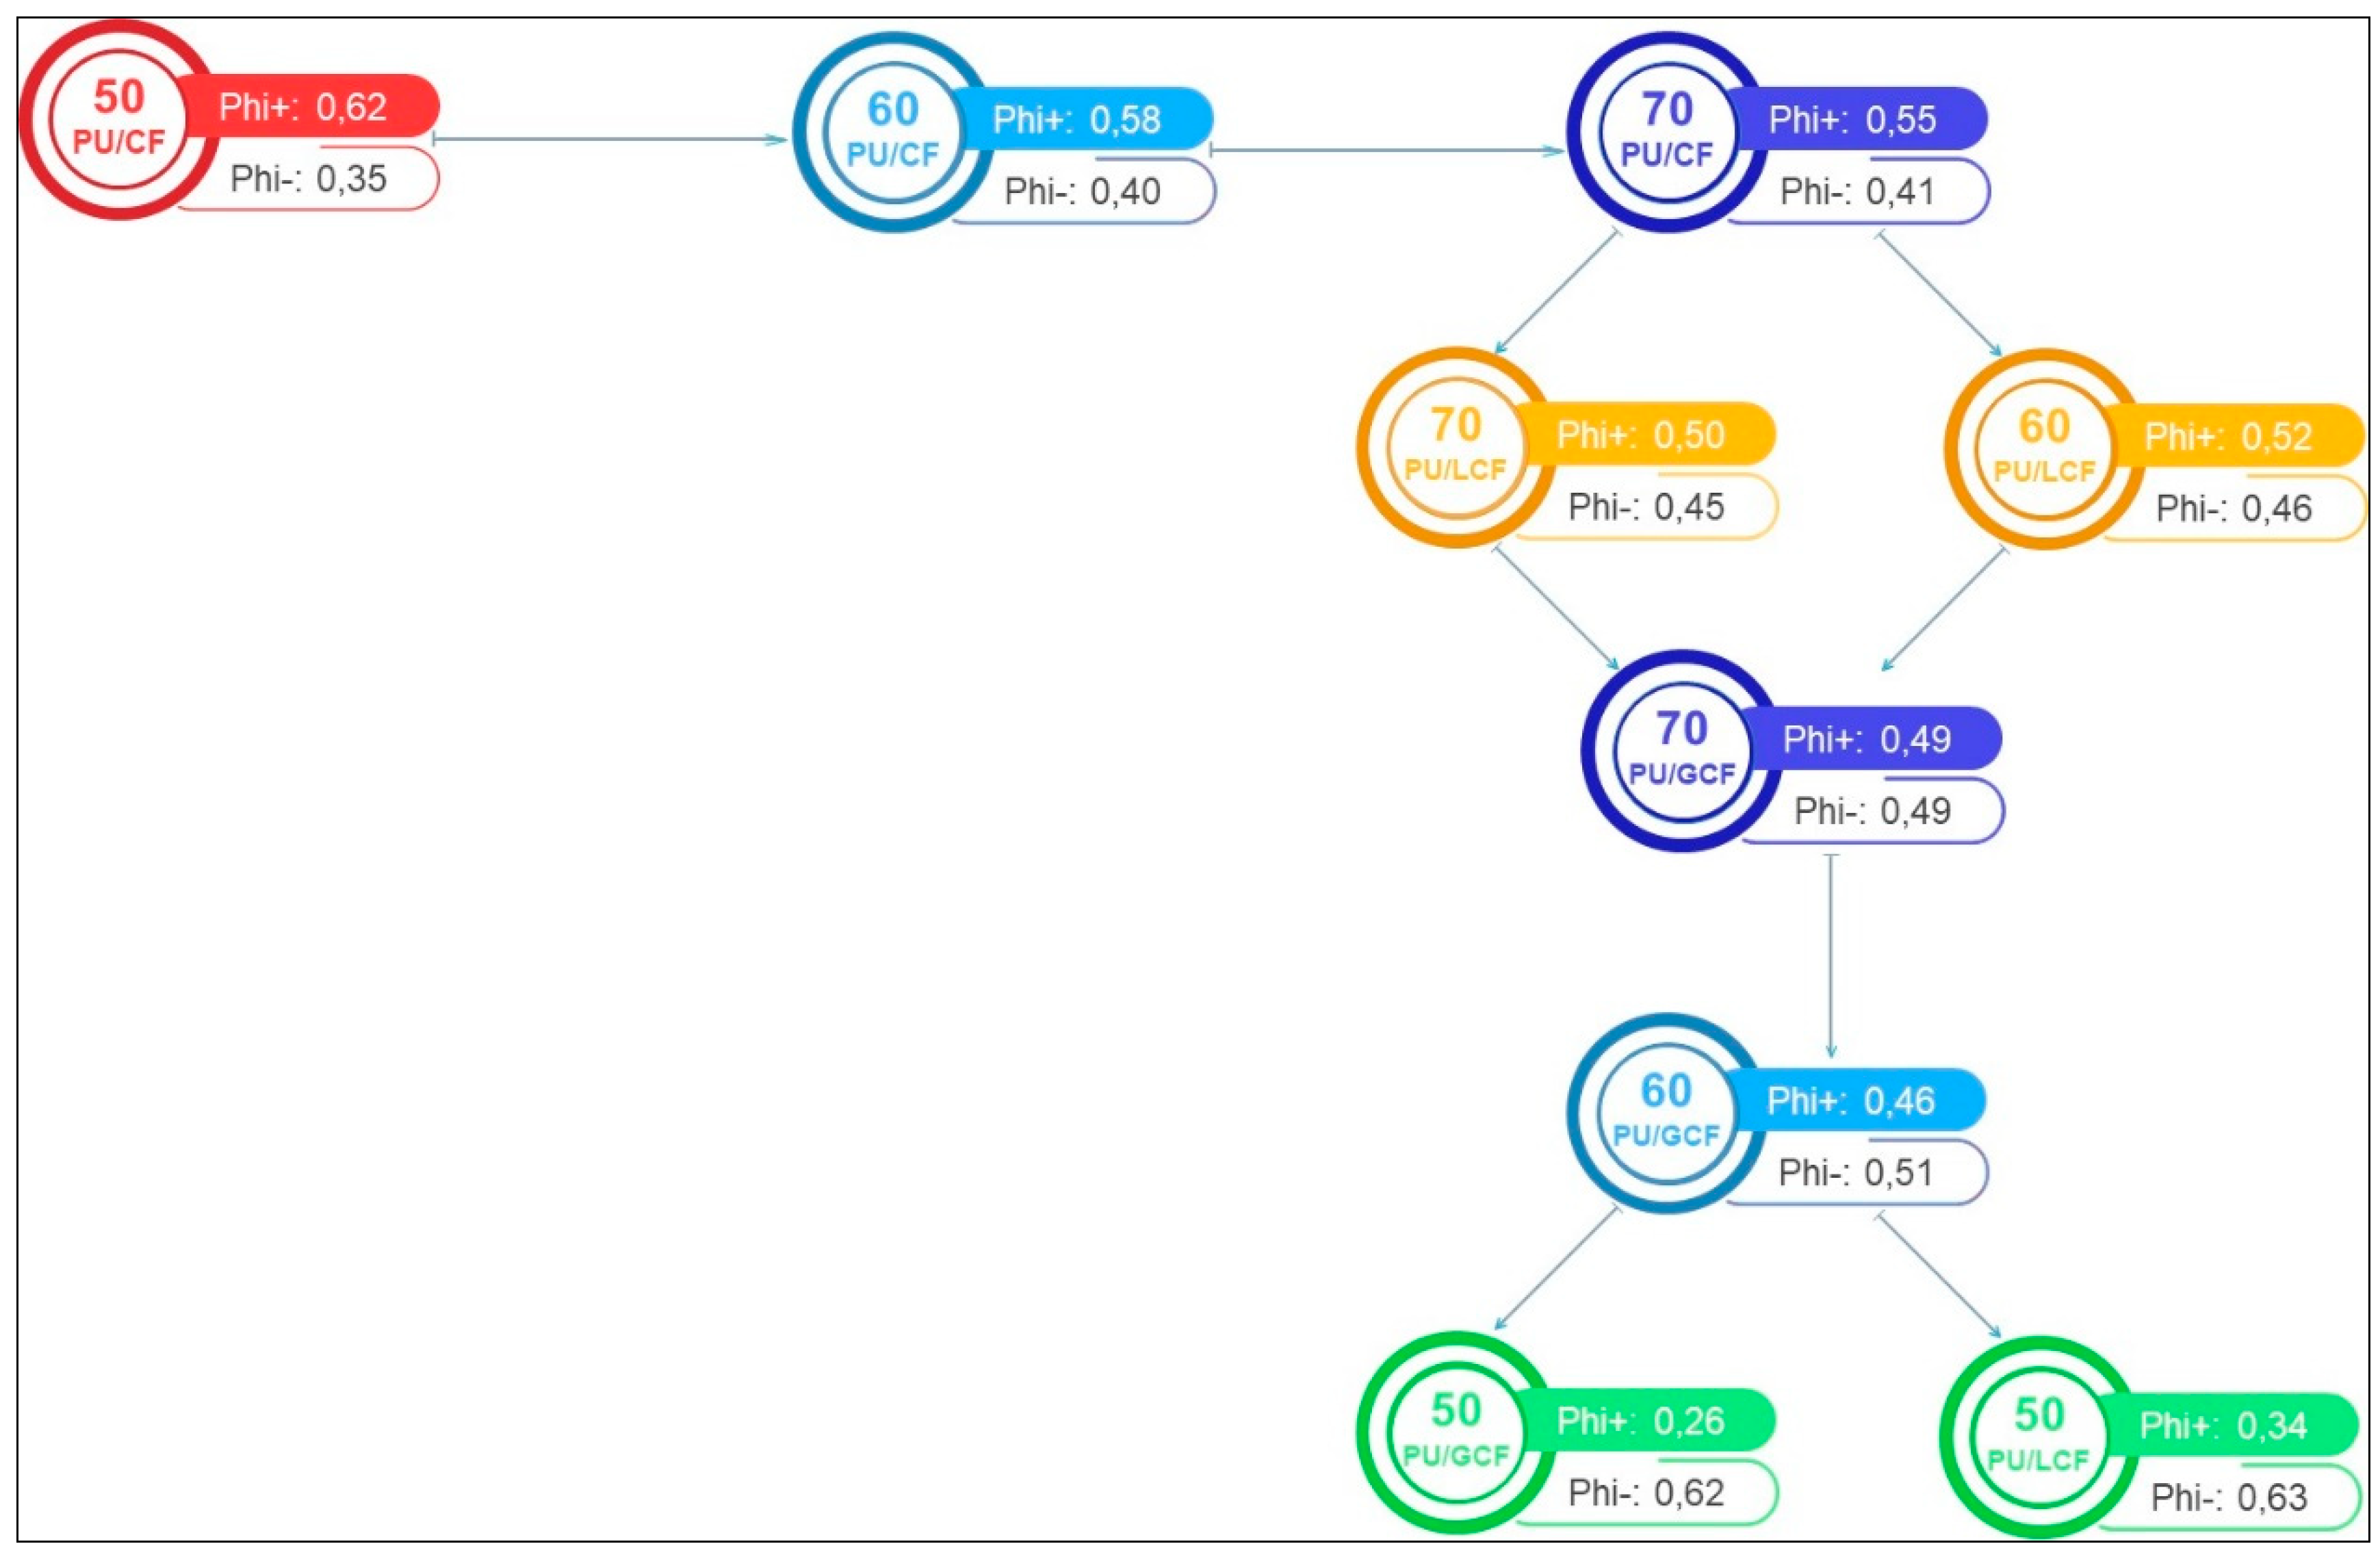
- Positive outranking flow (ϕ+): How one alternative outranks all the others.
- ✓
- Negative outranking flow (ϕ−): How one alternative is outranked by all the others.
- ✓
- Net outranking flow (ϕ): Difference between the positive and negative flows, used for final classification of the alternatives.
- ✓
- PU/CF systems (cellulose fiber composites) show the best overall performance:
- ○
- The PU/CF 50/50, 60/40 and 70/30 wt/wt% composites achieved the highest net outranking flows, indicating superior flexibility, toughness and thermal stability.
- ○
- These composites exhibit greater tensile modulus, toughness and thermal stability values (higher TGA Tonset values).
- ○
- Their lower flammability (longer burning time) further reinforces their suitability for flexible applications in interior design.
- ✓
- PU/LCF systems (long coir fiber composites) exhibit moderate performance:
- ○
- PU/LCF 60/40 and 70/30 wt/wt% rank just below the PU/CF composites.
- ○
- These composites have good mechanical properties (tensile strength, toughness and flexural modulus) but higher water absorption and slightly lower thermal stability than PU/CF.
- ○
- Their color and texture resemble natural wood, making them appealing for esthetic applications.
- ✓
- PU/GCF systems (ground coir fiber composites) are more flexible but fragile:
- ○
- PU/GCF 50/50 and 60/40 wt/wt% rank the lowest, with net outranking flows of 0.26 and 0.34, respectively.
- ○
- These composites display greater flexibility (lower flexural strength and modulus) but also the lowest toughness and tensile modulus values, making them more fragile and less structurally reliable.
- ○
- Their low density and high water absorption may limit their use in structural applications but may be suitable for non-load-bearing products such as handcrafted goods.
6. Conclusions
Author Contributions
Funding
Institutional Review Board Statement
Informed Consent Statement
Data Availability Statement
Acknowledgments
Conflicts of Interest
References
- Sanjay, M.R.; Madhu, P.; Jawaid, M.; Senthamaraikannan, P.; Senthil, S.; Pradeep, S. Characterization and properties of natural fiber polymer composites: A comprehensive review. J. Clean. Prod. 2018, 172, 566–581. [Google Scholar] [CrossRef]
- Karthi, N.; Kumaresan, K.; Sathish, S.; Gokulkumar, S.; Prabhu, L.; Vigneshkumar, N. An overview: Natural fiber reinforced hybrid composites, chemical treatments and application areas. Mater. Today Proc. 2020, 27, 2828–2834. [Google Scholar] [CrossRef]
- Karimah, A.; Ridho, M.R.; Munawar, S.S.; Adi, D.S.; Ismadi; Damayanti, R.; Subiyanto, B.; Fatriasari, W.; Fudholi, A. A review on natural fibers for development of eco-friendly bio-composite: Characteristics, and utilizations. J. Mater. Res. Technol. 2021, 13, 2442–2458. [Google Scholar] [CrossRef]
- Elfaleh, I.; Abbassi, F.; Habibi, M.; Ahmad, F.; Guedri, M.; Nasri, M.; Garnier, C. A comprehensive review of natural fibers and their composites: An eco-friendly alternative to conventional materials. Results Eng. 2023, 19, 101271. [Google Scholar] [CrossRef]
- Väisänen, T.; Haapala, A.; Lappalainen, R.; Tomppo, L. Utilization of agricultural and forest industry waste and residues in natural fiber-polymer composites: A review. Waste Manag. 2016, 54, 62–73. [Google Scholar] [CrossRef]
- Väisänen, T.; Das, O.; Tomppo, L. A review on new bio-based constituents for natural fiber-polymer composites. J. Clean. Prod. 2017, 149, 582–596. [Google Scholar] [CrossRef]
- Karimah, A.; Ridho, M.R.; Munawar, S.S.; Ismadi; Amin, Y.; Damayanti, R.; Lubis, M.A.R.; Wulandari, A.P.; Nurindah, I.A.H.; Fudholi, A.; et al. A Comprehensive Review on Natural Fibers: Technological and Socio-Economical Aspects. Polymers 2021, 13, 4280. [Google Scholar] [CrossRef]
- Cicconi, P. Eco-design and Eco-materials: An interactive and collaborative approach. Sustain. Mater. Technol. 2020, 23, e00135. [Google Scholar] [CrossRef]
- Kaur, R.; Singh, P.; Tanwar, S.; Varshney, G.; Yadav, S. Assessment of bio-based polyurethanes: Perspective on applications and biodegradation. Macromol 2022, 2, 284–314. [Google Scholar] [CrossRef]
- Atigah, A.; Mastura, B.A.; Ali, A.; Jawasai, M.; Sapuan, S.M. A review on Polyurethane and its Polymer Composites. Curr. Org. Synth. 2017, 14, 233–248. [Google Scholar] [CrossRef]
- Lopes, M.D.M.; Padua, M.S.; Carvalho, J.P.R.G.; Simonassi, N.T.; Lopez, F.P.D.; Colorado, H.A.; Vieira, C.M.F. Natural based polyurethane matrix composites reinforced with bamboo fiber waste for use as oriented strand board. J. Mater. Res. Technol. 2021, 12, 2317–2324. [Google Scholar] [CrossRef]
- Temer, B.C.; D’Almeida, J.R.M. Development and Characterization of Agglomerated Panels Using Residues from the Sustainable Production of Heart of Palm from Pejibaye (Bactris gasipaes) Palms. Polym. Renew. Resour. 2015, 6, 43–54. [Google Scholar] [CrossRef]
- Bhaskaran, S.K.; Boga, K.; Arukula, R.; Gaddam, S.K. Natural fibre reinforced vegetable-oil based polyurethane composites: A review. J. Polym. Res. 2023, 30, 325. [Google Scholar] [CrossRef]
- Pinto, E.R.P.; Barud, H.S.; Silva, R.R.; Palmieri, M.; Polito, W.L.; Calil, V.L.; Cremona, M.; Ribeiro, S.J.L.; Messaddeq, Y. Transparent composites prepared from bacterial cellulose and castor oil based polyurethane as substrates for flexible OLEDs. J. Mater. Chem. C 2015, 3, 11581–11588. [Google Scholar] [CrossRef]
- Zhao, Z.; Li, B.; Ma, P. Advances in mechanical properties of flexible textile composites. Compos. Struct. 2023, 303, 116350. [Google Scholar] [CrossRef]
- Canevarolo, S.V., Jr. Ciência dos Polímeros. Um Texto Básico Para Tecnólogos e engenheiros (In English: Polymer Science. A Basic Text for Technologists and Engineers), 2nd ed.; Artliber: São Paulo, Brazil, 2002; ISBN 85-88098-10-5. [Google Scholar]
- Liu, W.; Xie, T.; Qiu, R. Styrene-free unsaturated for hemp fiber composite. Compos. Sci. Technol. 2015, 120, 66–72. [Google Scholar] [CrossRef]
- Liu, W.; Xie, T.; Qiu, R. Biobased thermosets prepared from rigid isosorbide and flexible soybean oil derivates. ACS Sustain. Chem. Eng. 2016, 5, 774–783. [Google Scholar] [CrossRef]
- Hammed, N.; Salim, N.V.; Walsh, T.R.; Wiggins, J.S.; Ajayan, P.M.; Fox, B.L. Ductile thermoset polymers by controlling network flexibility. Chem. Comm. 2015, 51, 9903–9906. [Google Scholar]
- Merlini, C.; Soldi, V.; Barra, G.M.O. Influence of fiber surface treatment and length on physio-chemical properties of short random banana fiber-reinforced castor oil polyurethane composite. Polym. Test. 2011, 30, 833–840. [Google Scholar] [CrossRef]
- Liu, W.; Chen, T.; Fei, M.; Qiu, R.; Yu, D.; Fu, T.; Qiu, J. Properties of natural fiber-reinforced bio based thermoset biocomposites: Effects of fiber type and resin composition. Compos. B Eng. 2019, 171, 87–95. [Google Scholar] [CrossRef]
- Marinho, N.P.; Nascimento, E.M.; Nisgoski, S.; Magalhães, W.L.E.; Neto, S.C.; Azevedo, E.C. Physical and thermal characterization of polyurethane based on castor oil composite with bamboo particles. Polímeros 2013, 23, 201–205. [Google Scholar] [CrossRef]
- Sánchez, M.L.; Morales, L.Y.; Caicedo, J.D. Physical and mechanical properties of agglomerated panels made from bamboo fiber and vegetable resin. Constr. Build. Mater. 2017, 156, 330–339. [Google Scholar] [CrossRef]
- Sánchez, M.L.; Capote, G.; Carrillo, J. Composites reinforced with Guadua fibers: Physical and mechanical Properties. Constr. Build. Mater. 2019, 228, 116749. [Google Scholar] [CrossRef]
- Mothé, C.G.; Araujo, C.R. Thermal and mechanical caracterization of polyuretane composites with Curaua fibers. Polímeros 2004, 14, 274–278. [Google Scholar] [CrossRef]
- Mothé, C.G.; Araujo, C.R.; Wang, S.H. Thermal and mechanical characteristics of polyurethane/curaua fiber composites. J. Therm. Anal. Calorim. 2009, 95, 181–185. Available online: https://link.springer.com/content/pdf/10.1007/s10973-008-9091-2.pdf (accessed on 16 March 2024).
- Guimarães, J.L.; Frollini, E.; Silva, C.G.; Wypych, F.; Satyanarayanac, K.G. Characterization of banana, sugarcane bagasse and sponge gourd fibers of Brazil. Ind. Crops Prod. 2009, 30, 407–415. [Google Scholar] [CrossRef]
- Chen, Y.-H.; Wu, C.-H.; Chen, Y.-C. Optimized condition for eco-friendly wood composites manufactured from castor oil-based polyurethane. Constr. Build. Mater. 2021, 306, 124789. [Google Scholar] [CrossRef]
- Oliveira, J.N., Jr.; Lopes, F.P.D.; Simonassi, N.T.; Souza, D.; Monteiro, S.N.; Vieira, C.M.F. Evaluation of the physical properties of composite panels with eucalyptus sawdust waste and castor oil-based polyurethane. J. Mater. Res. Technol. 2023, 23, 1084–1093. [Google Scholar] [CrossRef]
- Faria, D.L.; Mesquita, L., Jr.; Resende, A.A.; Lopes, D.E.; Mendes, L.M.; Martins, M.A.; Marconcini, J.M.; Guimarães, J.B., Jr. Physical and mechanical properties of polyurethane thermoset matrices reinforced with green coconut fibers. J. Compos. Mater. 2020, 54, 4841–4852. [Google Scholar] [CrossRef]
- Hasan, K.M.F.; Horváth, P.G.; Bak, M.; Alpár, T. A state-of-the-art review on coir fiber-reinforced biocomposites. RSC Adv. 2021, 11, 10548–10571. [Google Scholar] [CrossRef]
- Glowinska, E.; Datta, J.; Parcheta, P. Effect of sisal fiber filler on thermal properties of bio-based polyurethane composites. J. Therm. Anal. Calorim. 2017, 130, 113–122. [Google Scholar] [CrossRef]
- AL-Oqla, F.M.; Sapuan, S.M.; Ishak, M.R. Nuraini AA. A decision-making model for selecting the most appropriate natural fiber—Polypropylene-based composites for automotive applications. J. Compos. Mater. 2016, 50, 543–556. [Google Scholar] [CrossRef]
- Al-Shamary, K.J.; Yas, Q.M.; Badr, A.M.; Shalabi, R.A.; Aldulaimi, S.H. Multi Criteria Decision Making Technique for Evaluation and Selection performance Large Scale Data of Composite Materials. In Proceedings of the ASU International Conference in Emerging Technologies for Sustainability and Intelligent Systems (ICETSIS), Manama, Bahrain, 22–23 June 2022; pp. 96–103. [Google Scholar] [CrossRef]
- Kumar, D.; Marchi, M.; Alam, S.B.; Kavka, C.; Koutsawa, Y.; Rauchs, G.; Belouettar, S. Multi-criteria decision making under uncertainties in composite materials selection and design. Compos. Struct. 2022, 279, 114680. [Google Scholar] [CrossRef]
- Noryani, M.; Sapuan, S.; Mastura, M.T. Multi-criteria decision-making tools for material selection of natural fibre composites: A review. J. Mech. Eng. Sci. 2018, 12, 3330–3353. [Google Scholar] [CrossRef]
- Milani, A.; Eskicioglu, C.; Robles, K.; Bujun, K.; Hosseini-Nasab, H. Multiple criteria decision making with life cycle assessment for material selection of composites. Express Polym. Lett. 2010, 5, 1062–1074. [Google Scholar] [CrossRef]
- Alaaeddin, M.H.; Sapuan, S.M.; Zuhri, M.Y.M.; Zainudin, E.S.; AL-Oqla, F.M. Polymer matrix materials selection for short sugar palm composites using integrated multi criteria evaluation method. Compos. B Eng. 2019, 176, 107342. [Google Scholar] [CrossRef]
- Singh, T.; Fekete, I.; Jakab, S.; Lendvai, L. Selection of straw waste reinforced sustainable polymer composite using a multi-criteria decision-making approach. Biomass Convers. Biorefin. 2023, 14, 21007–21017. [Google Scholar] [CrossRef]
- Kelleci, O.; Aydemir, D.; Altuntas, E.; Kurt, R.; Oztel, A.; Yorur, H.; Istek, A. Wood Flour-Reinforced Green Composites: Parameter Optimization via Multi-criteria Decision-Making Methods. J. Polym. Environ. 2022, 30, 3091–3106. [Google Scholar] [CrossRef]
- Brans, J.-P.; Mareschal, B. PROMETHEE Methods. In Multiple Criteria Decision Analysis: State of the Art Surveys; Figueira, J., Greco, S., Ehrgott, M., Eds.; Springer Science+Business Media: New York, NY, USA, 2005; Chapter 5; pp. 163–196. Available online: https://link.springer.com/book/10.1007/b100605 (accessed on 16 March 2024).
- Roy, B. Multicriteria Methodology for Decision Aiding; Springer Science + Business Media: Berlin/Heidelberg, Germany, 1996; Available online: https://link.springer.com/book/10.1007/978-1-4757-2500-1 (accessed on 16 March 2024).
- Dias, L.; Mousseau, V. IRIS—Interactive Robustness Analysis and Parameter’s Inference for Multiple Criteria Sorting Problems (Version 2.0)—User Manual. Document of INESC Coimbra, 1. 2003. Available online: https://hal.science/hal-00004145 (accessed on 16 March 2024).
- Imperveg. Technical Sheet of Resin from Vegetal IMPERVEG RM 122®. Available online: www.imperveg.com.br (accessed on 16 March 2022).
- Escócio, V.A.; Pacheco, E.B.A.V.P.; Souza, A.M.F.; Brígida, M.A.C.S.; Soares, A.G.; Visconte, L.L.Y. Study of natural fibers from waste from sponge gourd, peach palm tree and papaya pseudstem. Int. J. Environ. Agric. Res. 2017, 3, 11–24. [Google Scholar]
- Acha, B.A.; Carlsson, L.A. Evaluation of cure state of vinylester resins. J. Appl. Polym. Sci. 2013, 127, 4777–4784. [Google Scholar] [CrossRef]
- Oh, G. A simplified toughness estimation method based on standard tensile data. Int. J. Press. Vessels Pip. 2022, 199, 104733. [Google Scholar] [CrossRef]
- Hasan, K.M.; Horváth, P.G.; Kóczán, Z.; Alpár, T. Thermo-mechanical properties of pretreat coir fiber and fibrous chips reinforced multilayered composites. Sci. Rep. 2021, 11, 3618. [Google Scholar] [CrossRef]
- Marinelli, A.L.; Monteiro, M.R.; Ambrósio, J.D.; Branciforti, M.C.; Kobayashi, M.; Nobre, A.D. Development of Polymeric Composites with Natural Fibers: A Contribution to the Sustainability of Amazon. Polimeros 2008, 18, 92–99. [Google Scholar] [CrossRef]
- Duinker, P.N.; Greig, L.A. Scenario analysis in environmental impact assessment: Improving explorations of the future. Environ. Impact Assess. Rev. 2007, 27, 206–219. [Google Scholar] [CrossRef]
- Morris, P.; Therivel, P. Methods of Environmental Impact Assessments, 2nd ed.; Spon Press: London, UK; New York, NY, USA, 2001; Available online: http://ndl.ethernet.edu.et/bitstream/123456789/28730/1/1.pdf (accessed on 16 March 2024).
- Tukker, A. Life cycle assessment as a tool in environmental impact assessments. Environ. Impact Assess. Rev. 2000, 20, 435–456. [Google Scholar] [CrossRef]
- Keller, H.R.M.; Massart, D.L.; Brans, J.-P. Multicriteria decision making: A case study. Chemom. Intell. Lab. Syst. 1991, 11, 175–189. [Google Scholar] [CrossRef]
- Bhatia, S.K.; Smith, J.L. Bridging the Gap Between Engineering and the Global Word—A case study of the coconut (coir) fiber industry in Kerala, India. Synth. Lec. Eng. Technol. Soc. 2008, 3, 1–58. [Google Scholar] [CrossRef]
- Corradini, E.; Rosa, M.F.; Macedo, B.P.; Paladin, P.D.; Mattoso, L.H.C. Chemical composition, thermal and mechanical properties for cultivars of immature coconut fibers. Rev. Bras. Frutic. 2009, 31, 837–846. [Google Scholar] [CrossRef]
- Ishizaki, M.H.; Visconte, L.L.Y.; Furtado, C.R.G.; Leite, M.C.A.M.; Leblanc, J.L. Mechanical and morphological characterization of polypropylene and green coconut fiber composites: Influence of fiber content and mixture conditions. Polimeros 2006, 16, 182–186. [Google Scholar] [CrossRef]
- Chopra, L.; Manikanika. Extraction of cellulosic fibers from the natural resources: A short review. Mater. Today Proc. 2022, 48 Pt 5, 1265–1270. [Google Scholar] [CrossRef]
- Zhang, H.; Fu, S.; Chen, Y. Basic understanding of the color distinction of lignin and the proper selection of lignin in color-depended utilizations. Int. J. Biol. Macromol. 2020, 147, 607–615. [Google Scholar] [CrossRef] [PubMed]
- Moshi, A.A.M.; Ravindran, D.; Bharathi, S.R.S.; Padma, S.R.; Indran, S.; Divya, D. Characterization of natural cellulosic fiber extracted from Grewia damine flowering plant’s stem. Int. J. Biol. Macromol. 2020, 164, 1246–1255. [Google Scholar] [CrossRef]
- Balasubramanian, B.; Raja, K.; Kumar, V.V.; Ganeshan, P. Characterization study of Holoptelea Integrifolia tree bark fibers reinforced epoxy composites. Nat. Prod. Res. 2024, 38, 1197–1206. [Google Scholar] [CrossRef]
- Lazzari, L.K.; Neves, R.M.; Vanzetto, A.B.; Zattera, A.J.; Santana, R.M.C. Thermal degradation kinetics and lifetime prediction of cellulose biomass cryogels reinforced by its pyrolysis waste. Mater. Res. 2022, 25, e20210455. [Google Scholar] [CrossRef]
- Hadjadj, A.; Jbara, O.; Tara, A.; Gilliot, M.; Malek, F.; Maafi, E.M.; Tighzert, L. Effects of cellulose fiber content on physical properties of polyurethane based composites. Compos. Struct. 2016, 135, 217–223. [Google Scholar] [CrossRef]
- Singh, M.; Singh, P.; Brar, G.S. Review on natural fiber reinforced Polyurethane composite. Int. J. Emerg. Technol. Innov. Res. 2019, 6, 396–399. [Google Scholar]
- Visakh, P.M.; Semkin, A.O.; Rezaev, I.A.; Fateev, A.V. Review on soft polyurethane flame retardant. Constr. Build. Mater. 2019, 227, 116673. [Google Scholar] [CrossRef]
- Thakur, V.K.; Thakur, M.K. Processing and characterization of natural cellulose fibers/thermoset polymer composites. Carbohydr. Polym. 2014, 109, 102–117. [Google Scholar] [CrossRef]


| Fiber | Length (mm) | Width (µm) |
|---|---|---|
| Long coir fiber | 16.8 ± 3.9 | 16.7 ± 7.3 |
| Ground coir fiber | 0.2 ± 0.0 | 14.9 ± 3.8 |
| Cellulose fiber | 0.8 ± 0.1 | 3.3 ± 1.4 |
| Raw Material | Amount of Raw Material (g) | ||
|---|---|---|---|
| 50/50 wt/wt% PU/Fiber | 60/40 wt/wt% PU/Fiber | 70/30 wt/wt% PU/Fiber | |
| Component A (polyol) | 6.68 | 8.00 | 9.34 |
| Component B (pre-polymer) | 3.34 | 4.00 | 4.66 |
| Total amount of PU | 10.00 | 12.00 | 14.00 |
| Lignocellulosic fiber | 10.00 | 8.00 | 6.00 |
| Total amount of raw material | 20.00 | 20.00 | 20.00 |
| Property | Weight |
|---|---|
| Toughness | 4 |
| Flexural strength | 4 |
| Flexural modulus | 4 |
| TGA (Tonset) | 1 |
| Tensile modulus | 1 |
| Presence of bubbles by SEM | 1 |
| Density | 1 |
| Water absorption | 1 |
| Burning time in flammability | 1 |
| Natural Fiber | Holocellulose (%) | α-Cellulose (%) | Hemicellulose (%) | Acid-Insoluble Lignin (%) |
|---|---|---|---|---|
| Coir fiber | 80.5 ± 3.5 | 52.0 ± 8.5 | 28.5 ± 8.5 | 39.0 ± 5.7 |
| Cellulose fiber | 93.0 ± 0.1 | 82.0 ± 5.7 | 11.0 ± 5.7 | 2.0 ± 1.4 |
| Composition (wt/wt%) | PU/Fiber Composite | ||
|---|---|---|---|
| Long Coir Fiber—LCF | Ground Coir Fiber—GCF | Cellulose Fiber—CF | |
| 50/50 |  |  |  |
| 60/40 |  | 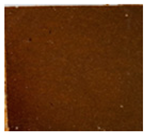 | 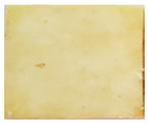 |
| 70/30 |  | 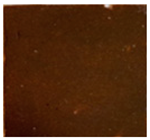 |  |
| PU/Fiber Ratio (wt/wt%) | Raw Material | Tonset (°C) | Residue at 800 °C (%) |
|---|---|---|---|
| 0/100 | LCF | 289.2 | 25.8 |
| GCF | 274.2 | 24.1 | |
| CF | 321.6 | 9.2 | |
| 100/0 | PU | 294.7 | 2.3 |
| 50/50 | PU/LCF | 294.6 | 16.1 |
| PU/GCF | 288.8 | 19.8 | |
| PU/CF | 325.6 | 9.2 | |
| 60/40 | PU/LCF | 304.3 | 12.6 |
| PU/GCF | 292.1 | 16.8 | |
| PU/CF | 317.8 | 7.8 | |
| 70/30 | PU/LCF | 291.4 | 15.5 |
| PU/GCF | 298.9 | 15.9 | |
| PU/CF | 324.9 | 8.7 |
| PU/Fiber (wt/wt%) | Raw Material | Toughness (N/mm3) | Tensile Modulus (MPa) |
|---|---|---|---|
| 50/50 | PU/LCF | 19.6 ± 14.9 | 53.1 ± 21.5 |
| PU/GCF | 6.1 ± 2.9 | - | |
| PU/CF | 94.7 ± 85.1 | 248.1 ± 225.4 | |
| 60/40 | PU/LCF | 39.5 ± 27.1 | 76.0 ± 47.5 |
| PU/GCF | 9.9 ± 2.5 | 9.5 ± 2.1 | |
| PU/CF | 84.7 ± 41.1 | 220.9 ± 83.3 | |
| 70/30 | PU/LCF | 62.7 ± 58.5 | 211.3 ± 174.2 |
| PU/GCF | 5.3 ± 4.8 | 11.5 ± 2.2 | |
| PU/CF | 49.9 ± 44.2 | 80.5 ± 46.7 | |
| PU | 200.9 ± 61.1 | 3.7 ± 0.2 | |
| PU/Fiber (wt/wt%) | Raw Material | Flexural Strength (MPa) | Flexural Modulus (MPa) |
|---|---|---|---|
| 50/50 | PU/LCF | 16.4 ± 7.9 | 243.6 ± 108.9 |
| PU/GCF | 4.6 ± 3.2 | 81.2 ± 47.8 | |
| PU/CF | 25.2 ± 5.4 | 330.9 ± 272.6 | |
| 60/40 | PU/LCF | 11.4 ± 6.1 | 86.3 ± 91.8 |
| PU/GCF | 2.2 ± 0.7 | 37.8 ± 12.9 | |
| PU/CF | 18.2 ± 3.5 | 248.5 ± 49.5 | |
| 70/30 | PU/LCF | 10.0 ± 5.3 | 81.2 ± 45.0 |
| PU/GCF | 4.4 ± 0.5 | 71.7 ± 37.2 | |
| PU/CF | 11.6 ± 1.8 | 163.0 ± 42.1 |
| PU/Fiber (wt/wt%) | Raw Material | Density (g/cm3) | Theoretical Density (g/cm3) |
|---|---|---|---|
| 50/50 | PU/LCF | 0.8 ± 0.1 | 1.2 |
| PU/GCF | 1.0 ± 0.0 | 1.2 | |
| PU/CF | 1.0 ± 0.1 | 1.3 | |
| 60/40 | PU/LCF | 0.8 ± 0.1 | 1.2 |
| PU/GCF | 1.0 ± 0.0 | 1.2 | |
| PU/CF | 1.0 ± 0.0 | 1.3 | |
| 70/30 | PU/LCF | 0.8 ± 0.0 | 1.2 |
| PU/GCF | 0.9 ± 0.1 | 1.2 | |
| PU/CF | 1.0 ± 0.0 | 1.2 | |
| PU | 1.1 ± 0.0 |
| PU/Fiber (wt/wt%) | Raw Material | Water Absorption (%) |
|---|---|---|
| 50/50 | PU/LCF | 45.4 ± 0.5 |
| PU/GCF | 30.0 ± 0.2 | |
| PU/CF | 17.4 ± 1.1 | |
| 60/40 | PU/LCF | 37.7 ± 0.1 |
| PU/GCF | 7.5 ± 0.1 | |
| PU/CF | 20.3 ± 2.9 | |
| 70/30 | PU/LCF | 21.5 ± 4.9 |
| PU/GCF | 6.3 ± 0.7 | |
| PU/CF | 21.1 ± 1.5 | |
| PU | 0.7 ± 0.1 |
| PU/Fiber (wt/wt%) | Raw Material | Average Buring Time (s) | Average Burn Rate (mm/s) |
|---|---|---|---|
| 50/50 | PU/LCF | 111.8 ± 21.4 | 53.7 ± 11.1 |
| PU/GCF | 98.3 ± 42.2 | 32.4 ± 6.8 | |
| PU/CF | 197.3 ± 21.1 | 30.4 ± 3.2 | |
| 60/40 | PU/LCF | 123.6 ± 9.2 | 42.7 ± 13.9 |
| PU/GCF | 76.8 ± 47.9 | 25.8 ± 8.7 | |
| PU/CF | 165.9 ± 20.4 | 36.2 ± 4.3 | |
| 70/30 | PU/LCF | 90.8 ± 17.5 | 75.9 ± 66.1 |
| PU/GCF | 91.9 ± 42.4 | 41.1 ± 13.6 | |
| PU/CF | 146.7 ± 53.7 | 40.9 ± 8.1 |
| PU/Fiber (wt/wt%) | Burning Time | ||
|---|---|---|---|
| t = 30 s | t = 60 s | t = 90 s | |
| PU/GCF (60/40) |  | 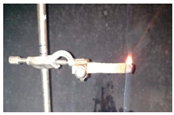 | 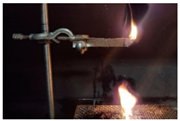 |
| PU/CF (70/30) | 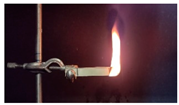 |  | 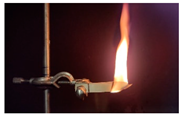 |
| Property | PU/LCF (wt/wt%) | PU/GCF (wt/wt%) | PU/CF(wt/wt%) | Mean | ||||||
|---|---|---|---|---|---|---|---|---|---|---|
| 50/50 | 60/40 | 70/30 | 50/50 | 60/40 | 70/30 | 50/50 | 60/40 | 70/30 | ||
| Toughness (N/mm3) | 20 | 40 | 63 | 6 | 10 | 5 | 95 | 85 | 50 | 41 |
| Flexural strength (MPa) | 16 | 11 | 10 | 5 | 3 | 4 | 25 | 18 | 12 | 12 |
| Flexural modulus (MPa) | 244 | 86 | 82 | 82 | 38 | 72 | 331 | 249 | 163 | 149 |
| TGA (Tonset in °C) | 295 | 304 | 292 | 289 | 292 | 299 | 326 | 318 | 325 | 304 |
| Tensile modulus (MPa) | 53 | 76 | 211 | − | 10 | 12 | 248 | 221 | 81 | 101 |
| Presence of bubbles in SEM | −1 | −1 | −1 | −1 | −1 | −1 | +1 | +1 | +1 | |
| Density (g/cm3) | 0.8 | 0.8 | 0.8 | 1.0 | 1.0 | 0.9 | 1.0 | 0.9 | 1.0 | 0.9 |
| Water absorption (%) | 45 | 38 | 22 | 30 | 8 | 6.3 | 17 | 20 | 21 | 23 |
| Burning time in flammability (s) | 112 | 124 | 91 | 98 | 77 | 92 | 197 | 166 | 147 | 123 |
| Number of properties (p.) with more positive, negative or median values according to the mean for each property | ||||||||||
| Number of positive properties for flexibility (×3) | 1p. = +3 | 1p. = +3 | 2p. = + 6 | 2p. = +6 | 2p. = +6 | 2p. = +6 | 1p. = +3 | 2p. = +6 | 0p. = 0 | |
| Number of negative properties for flexibility (×3) | 2p. = −6 | 0p. = 0 | 0p. = 0 | 1p. = −3 | 1p. = −3 | 1p. = −3 | 2p. = −6 | 1p. = −3 | 0p. = 0 | |
| Number of properties with median value for flexibility (×2) | 0p. = 0 | 2p. = + 4 | 1p. = +2 | 0p. = 0 | 0p. = 0 | 0p. = 0 | 0p. = 0 | 0p. = 0 | 3p. = +6 | |
| Number of other positive properties (×2) | 1p. = +2 | 1p. = + 2 | 2p. = +4 | 0p. = 0 | 1p. = +2 | 1p. = +2 | 4p. = +8 | 4p. = +8 | 3p. = +6 | |
| Number of other negative properties (×2) | 3p. =−6 | 2p. = −4 | 3p. = −6 | 4p. = −8 | 5p. = −10 | 3p. = −6 | 1p. = −2 | 0p. = 0 | 1p. = −2 | |
| Number of other properties with median value (×1) | 2p. = + 2 | 3p. = + 3 | 1p. = +1 | 1p. = +1 | 0p. = +0 | 2p. = +2 | 1p. = +1 | 2p. = +2 | 2p. = +2 | |
| Sum of the values | −5 | +8 | +7 | −4 | −5 | +1 | +4 | +13 | +12 | |
| Classification in descending order of the set of properties in subjective analysis | More positive results More negative results | Classification in descending order of the set of properties in multicriteria analysis |
| 5. PU/CF: 50/50 | |
| 1. PU/CF: 60/40 | |
| 2. PU/CF: 70/30 | |
| 3. PU/LCF: 60/40 | |
| 4. PU/LCF: 70/30 | |
| 6. PU/GCF: 70/30 | |
| 8. PU/GCF: 60/40 | |
| 9. PU/LCF: 50/50 | |
| 7. PU/GCF: 50/50 |
Disclaimer/Publisher’s Note: The statements, opinions and data contained in all publications are solely those of the individual author(s) and contributor(s) and not of MDPI and/or the editor(s). MDPI and/or the editor(s) disclaim responsibility for any injury to people or property resulting from any ideas, methods, instructions or products referred to in the content. |
© 2025 by the authors. Licensee MDPI, Basel, Switzerland. This article is an open access article distributed under the terms and conditions of the Creative Commons Attribution (CC BY) license (https://creativecommons.org/licenses/by/4.0/).
Share and Cite
Cardoso, E.; Escócio, V.; Infante, C.; Pacheco, E. Multicriteria Decision Analysis of the Influence of Natural Fibers on the Flexibility of Renewable Polyurethane Composites. Materials 2025, 18, 1610. https://doi.org/10.3390/ma18071610
Cardoso E, Escócio V, Infante C, Pacheco E. Multicriteria Decision Analysis of the Influence of Natural Fibers on the Flexibility of Renewable Polyurethane Composites. Materials. 2025; 18(7):1610. https://doi.org/10.3390/ma18071610
Chicago/Turabian StyleCardoso, Edivane, Viviane Escócio, Carlos Infante, and Elen Pacheco. 2025. "Multicriteria Decision Analysis of the Influence of Natural Fibers on the Flexibility of Renewable Polyurethane Composites" Materials 18, no. 7: 1610. https://doi.org/10.3390/ma18071610
APA StyleCardoso, E., Escócio, V., Infante, C., & Pacheco, E. (2025). Multicriteria Decision Analysis of the Influence of Natural Fibers on the Flexibility of Renewable Polyurethane Composites. Materials, 18(7), 1610. https://doi.org/10.3390/ma18071610