
Shear Energy Evolution and Fracture Behavior of Rock–Concrete Interfaces Under Different Stress-Level Conditions


Abstract
1. Introduction
2. Energy Methodology and Test Program
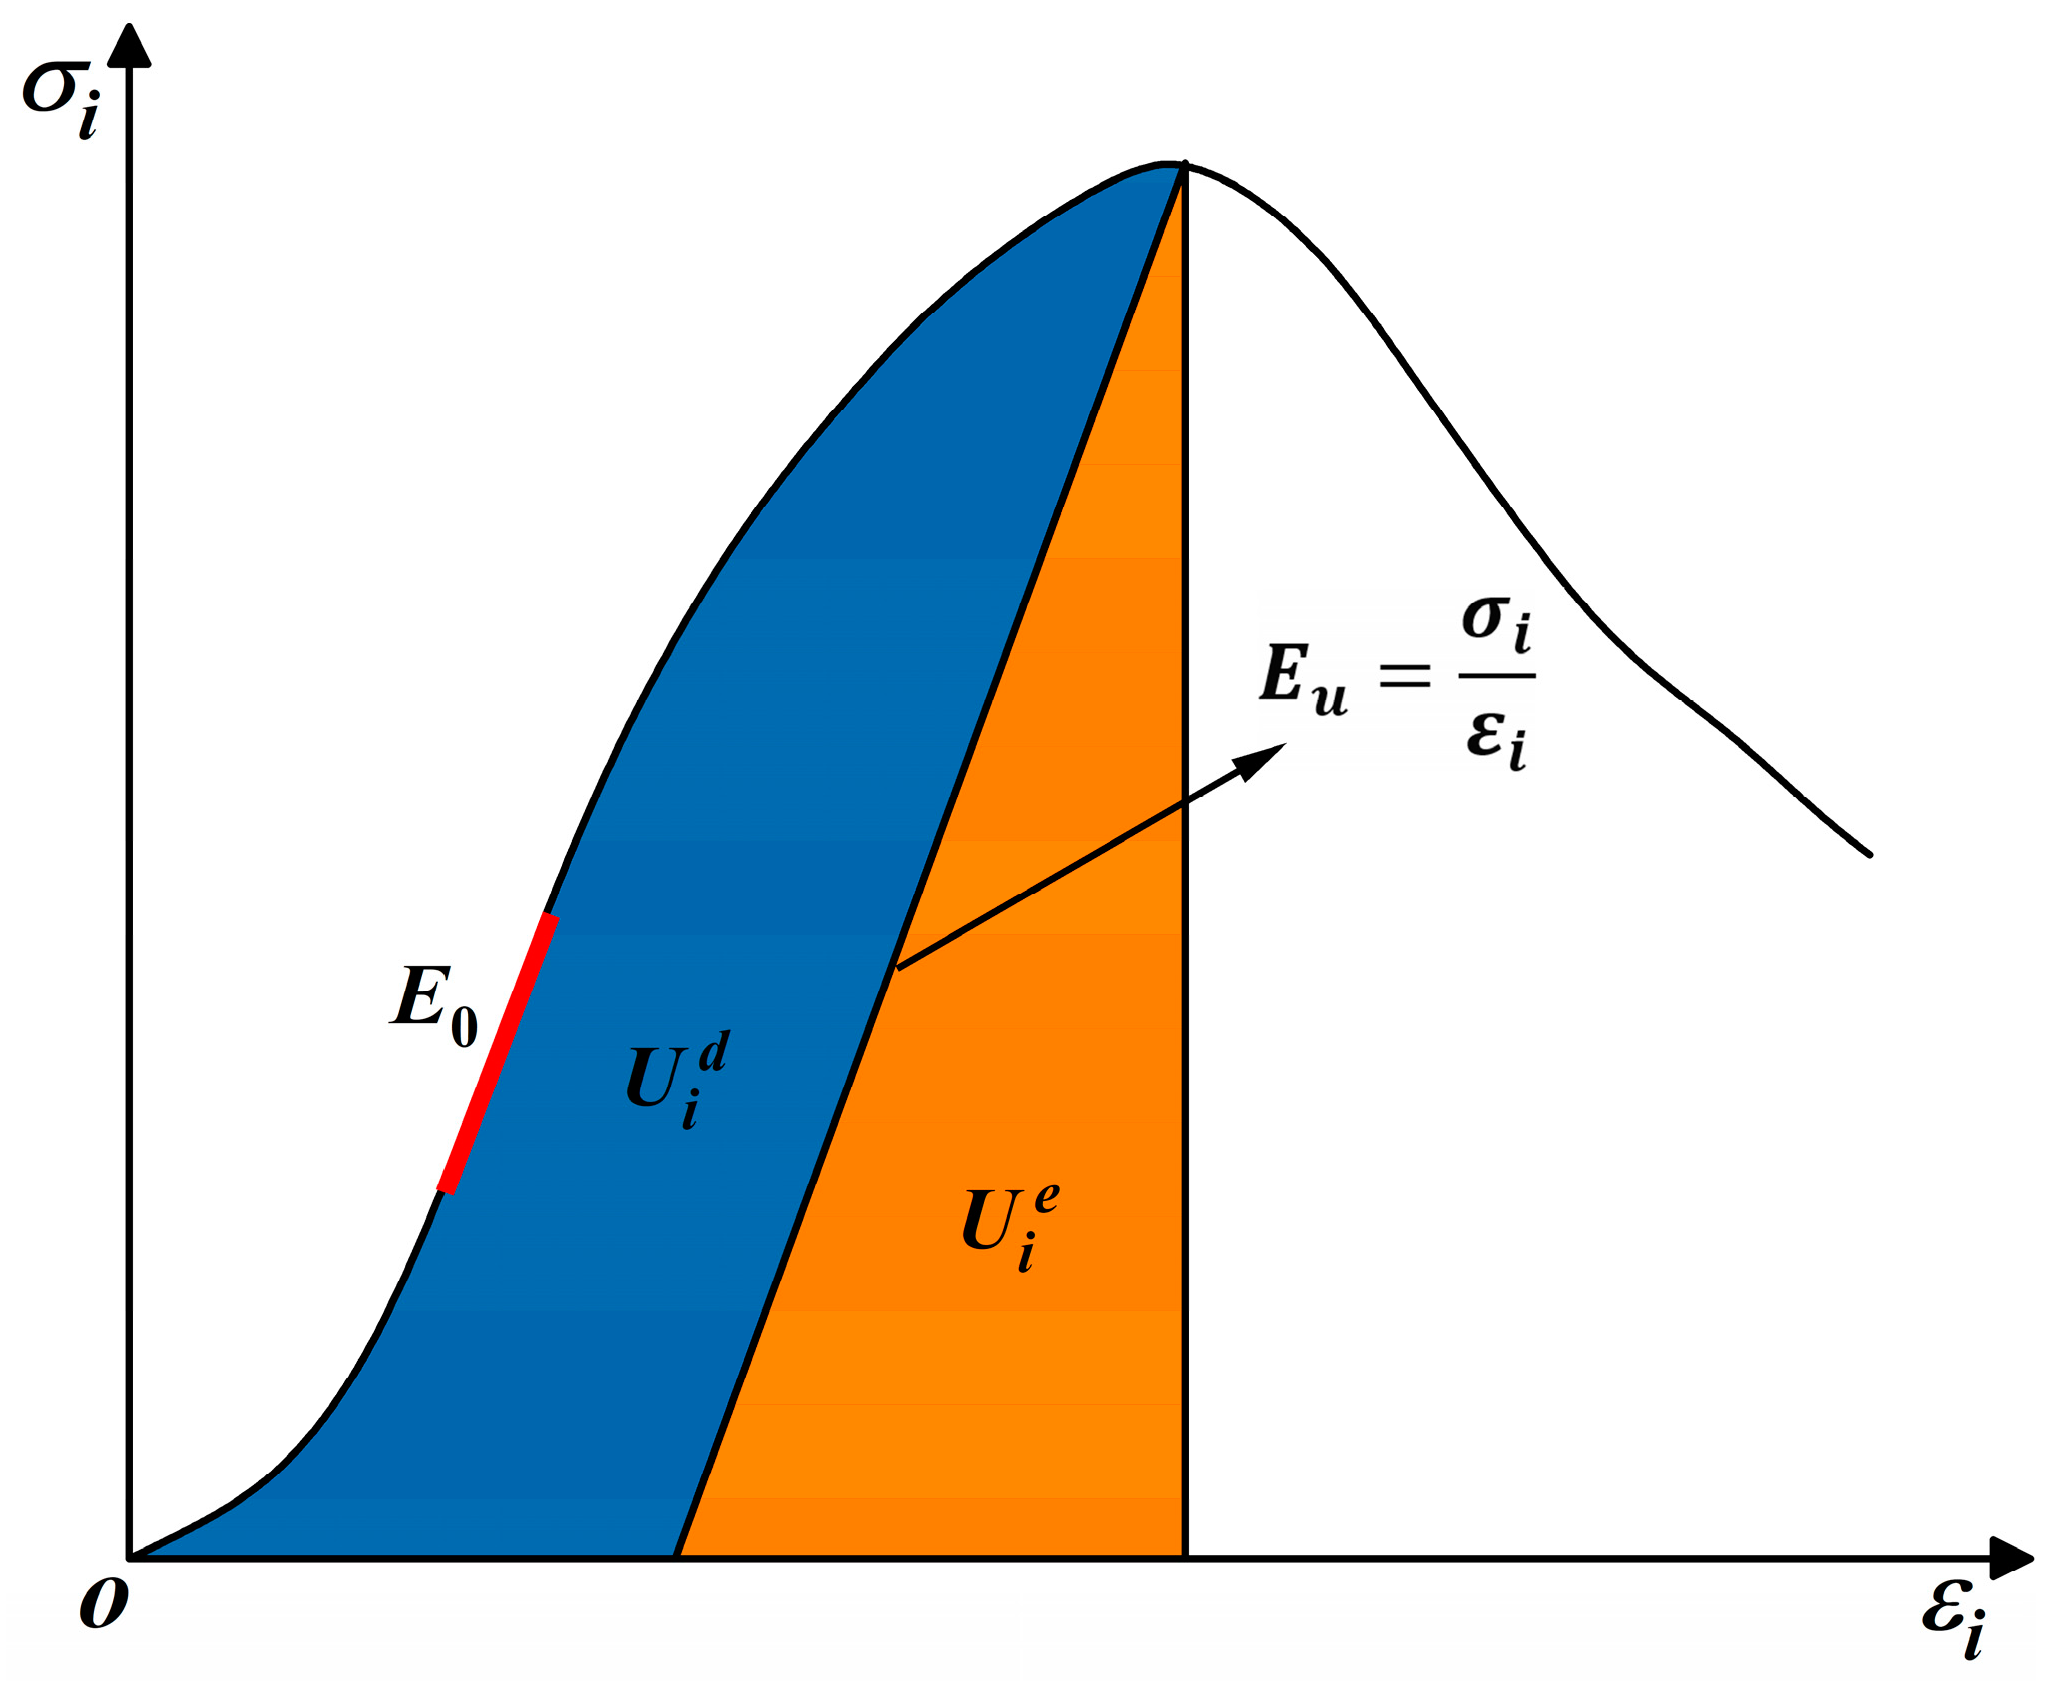
2.1. Energy Calculation Methods
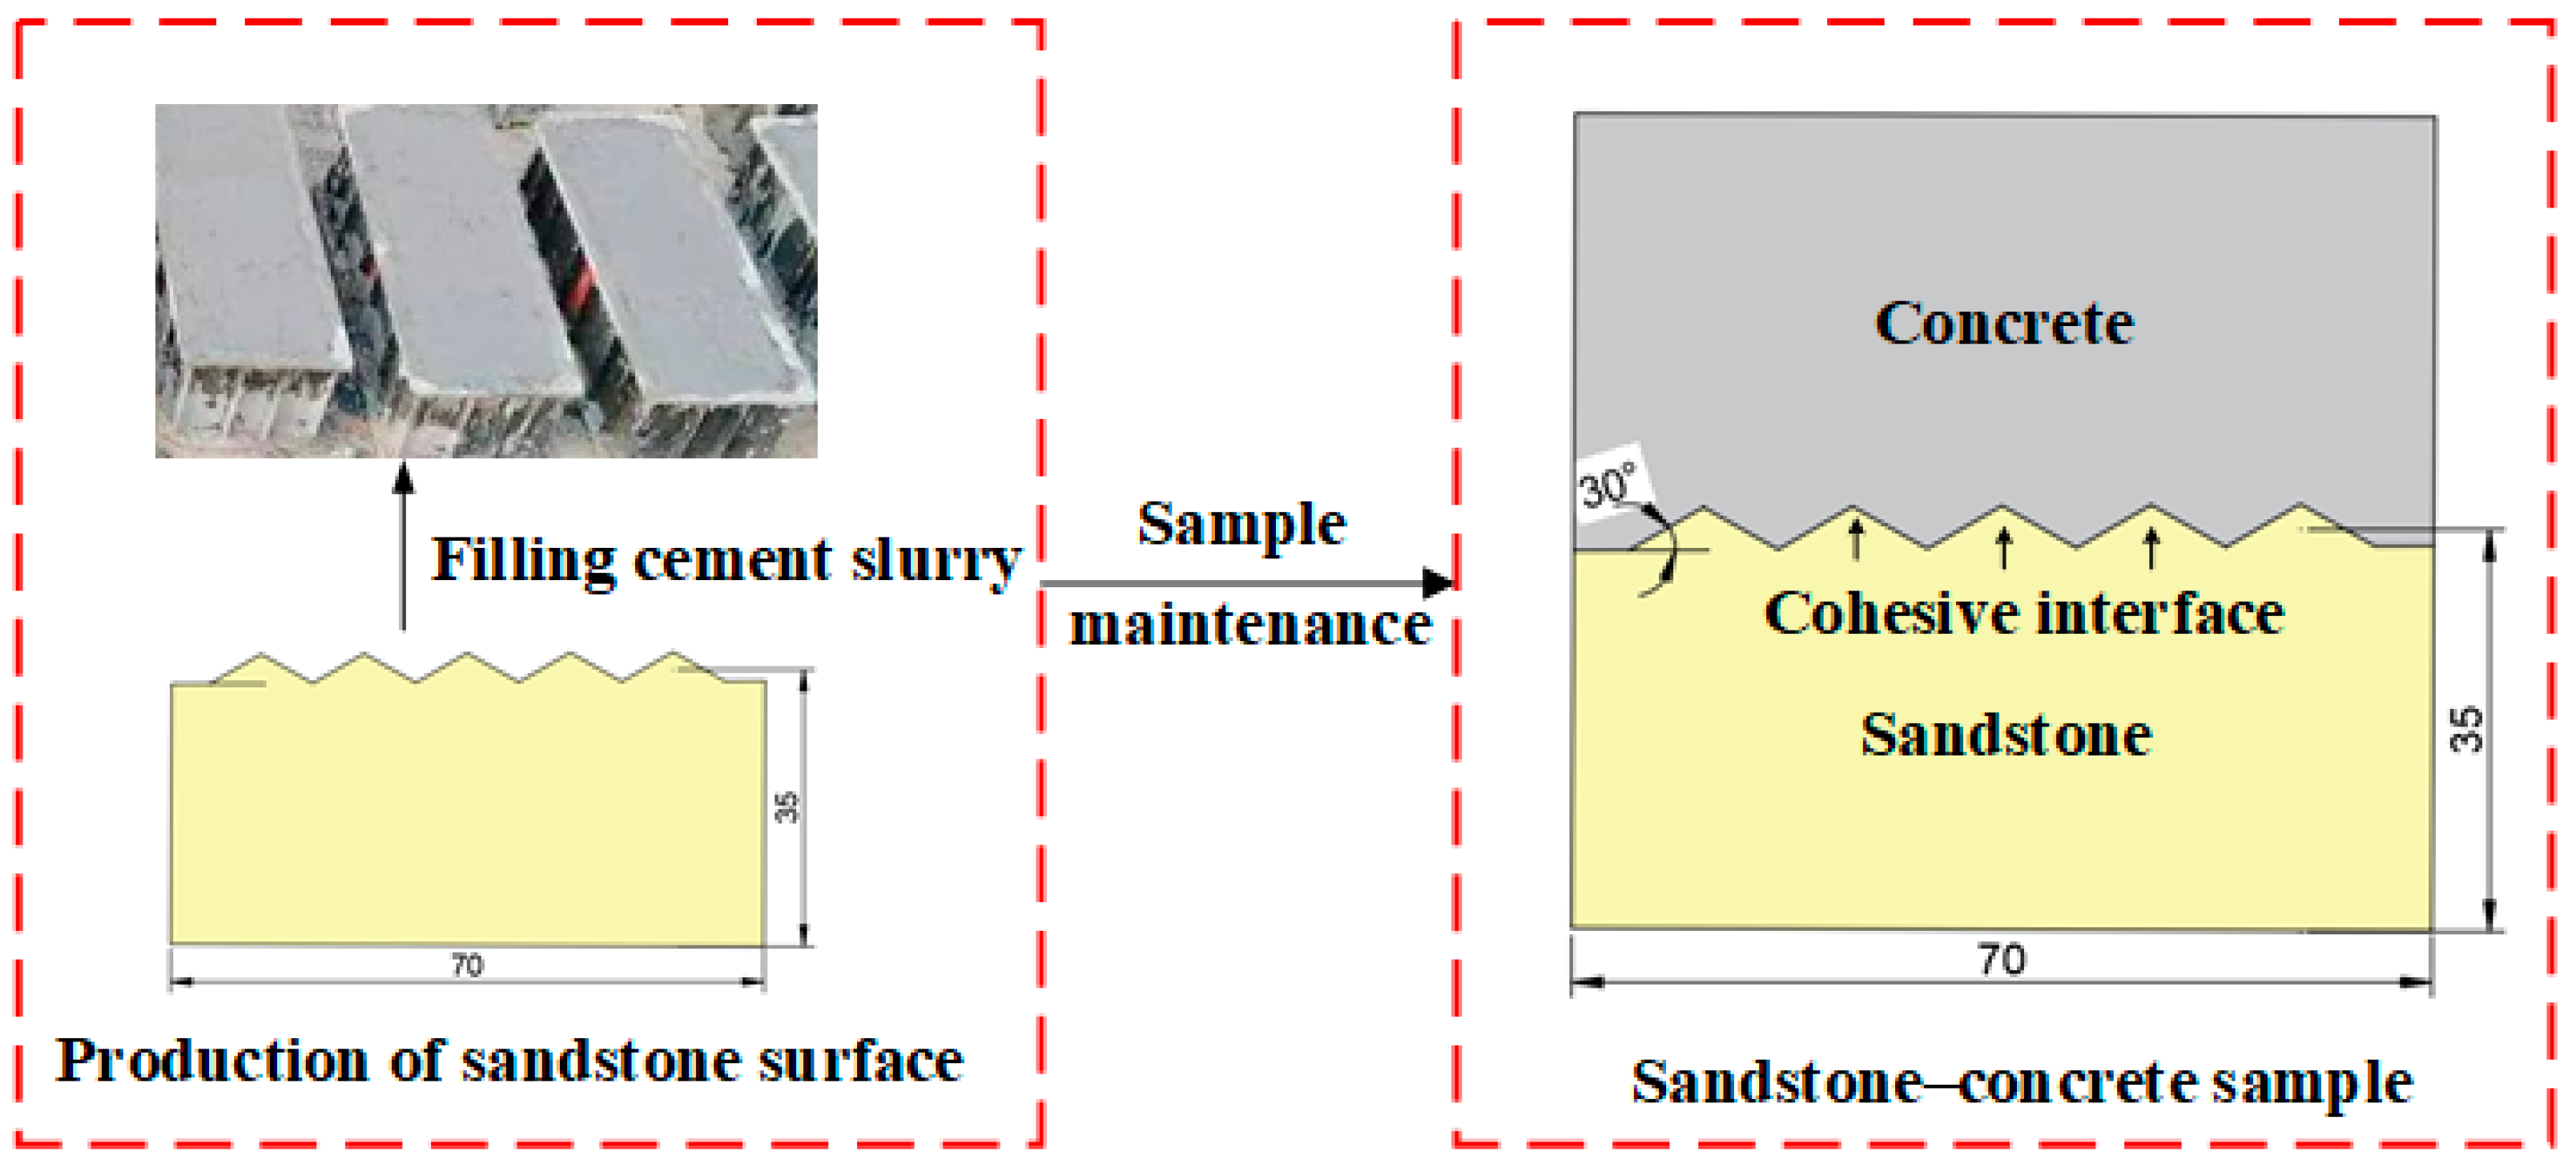
2.2. Test Materials and Sample Preparation
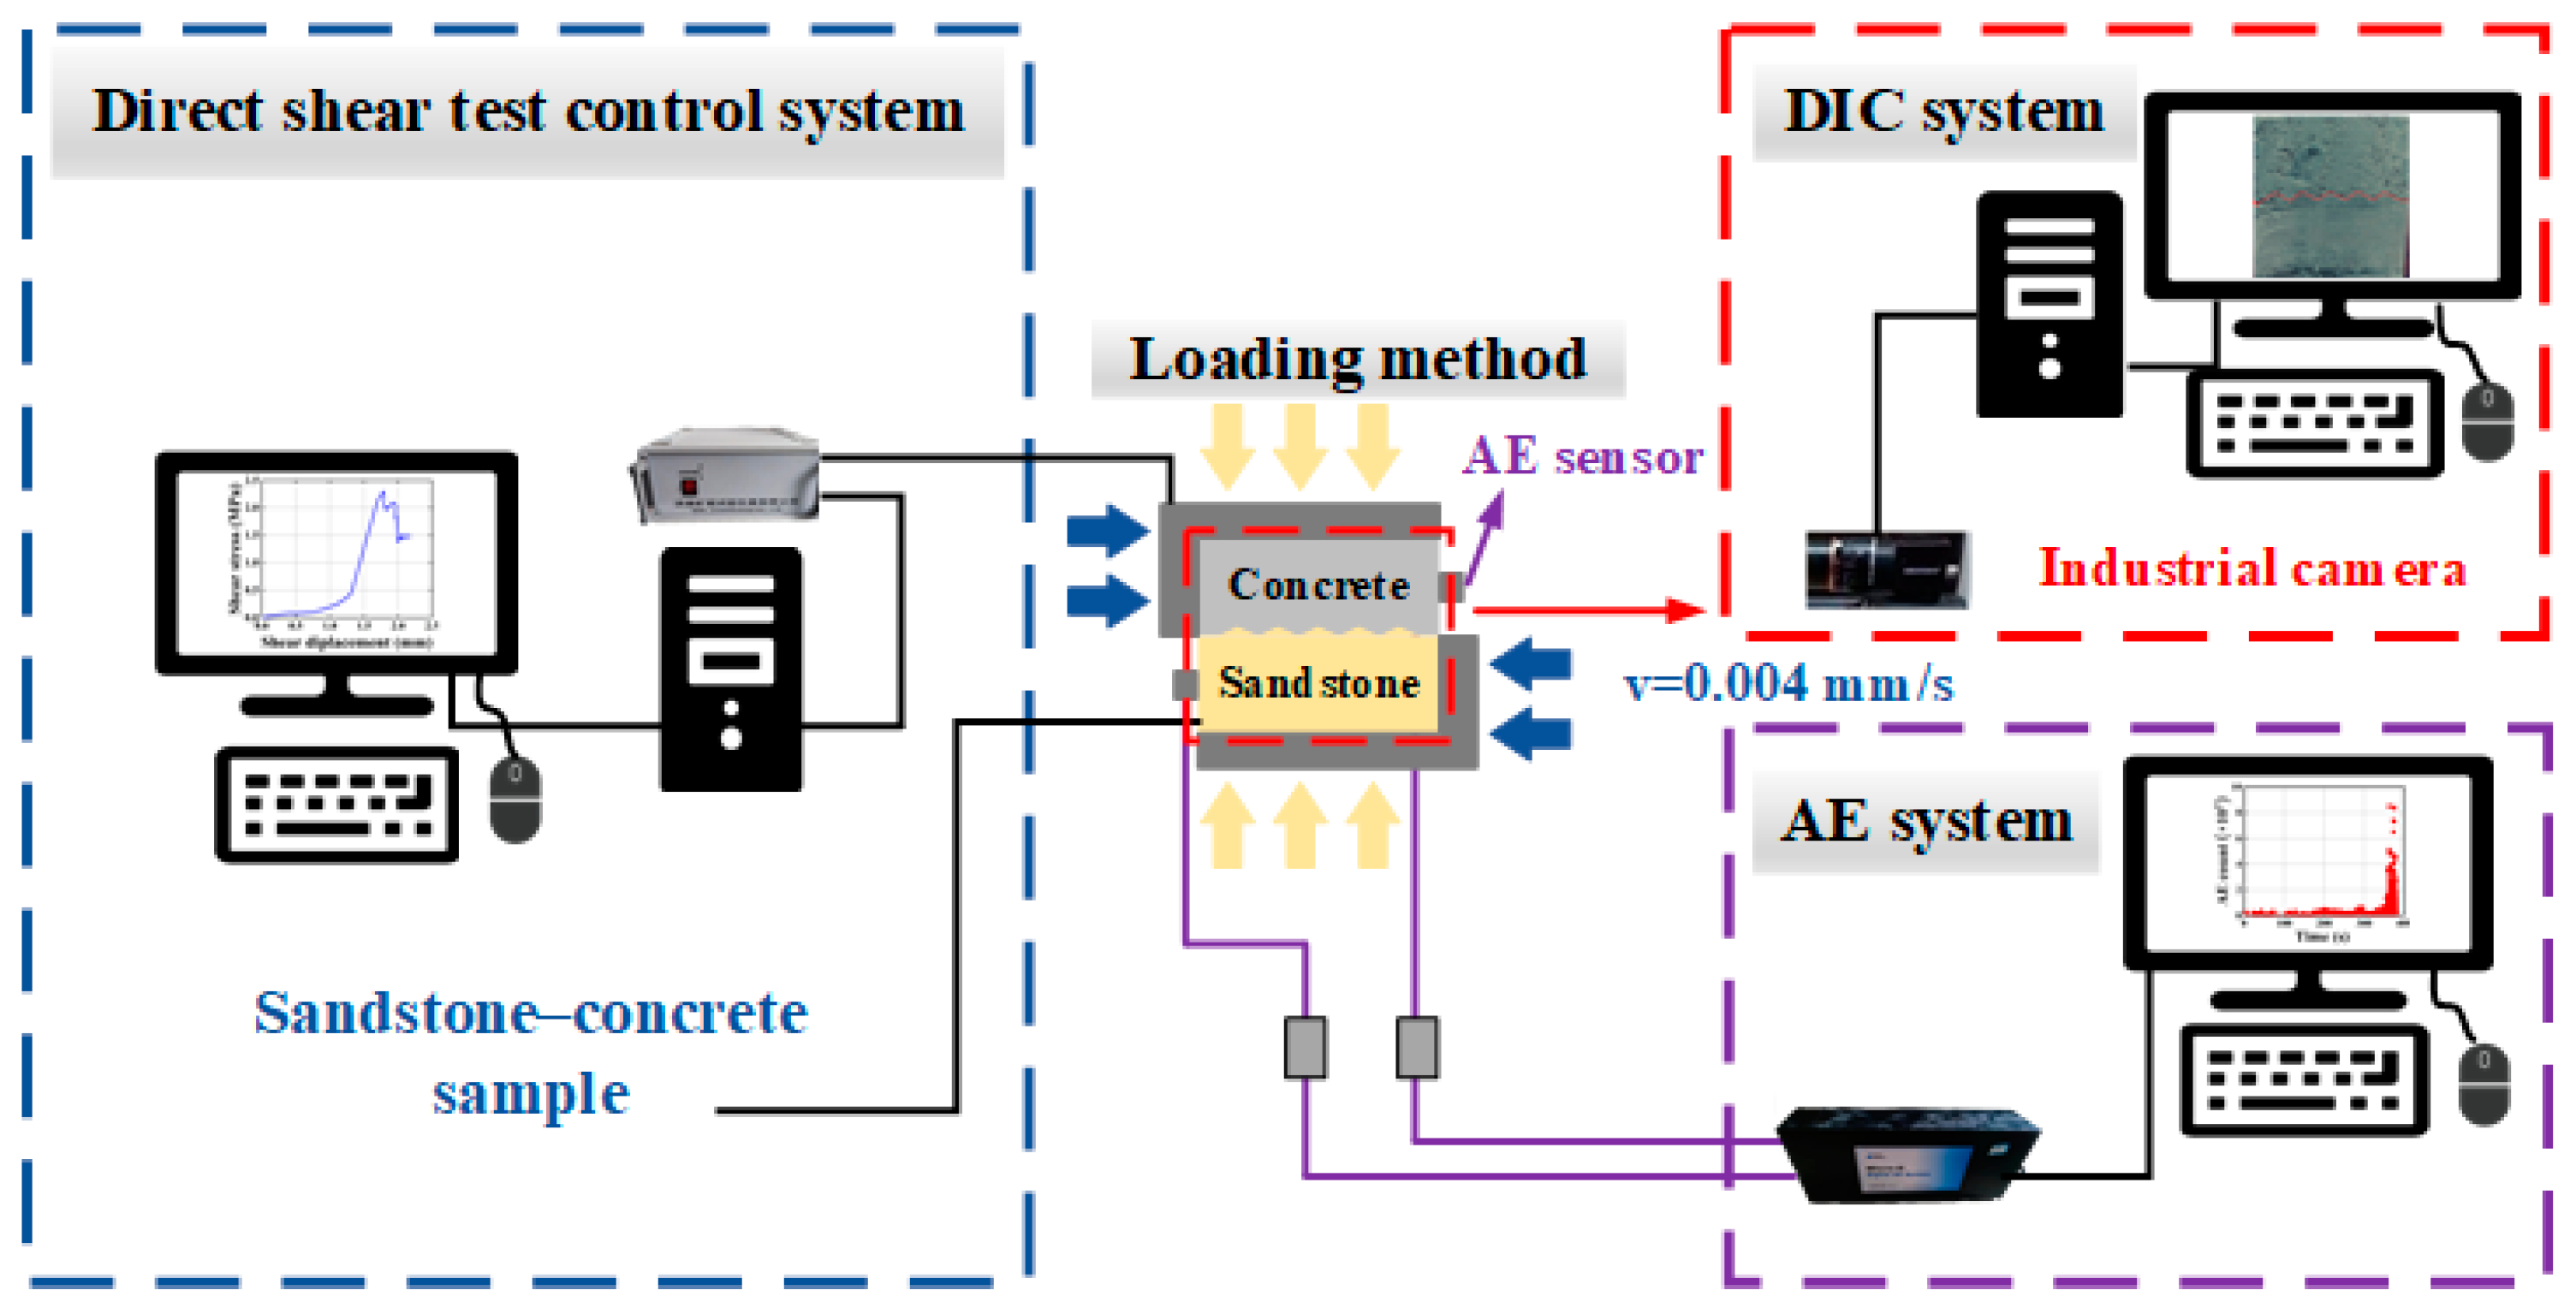
2.3. Test Systetm and Test Procedure
3. Analysis of Test Results
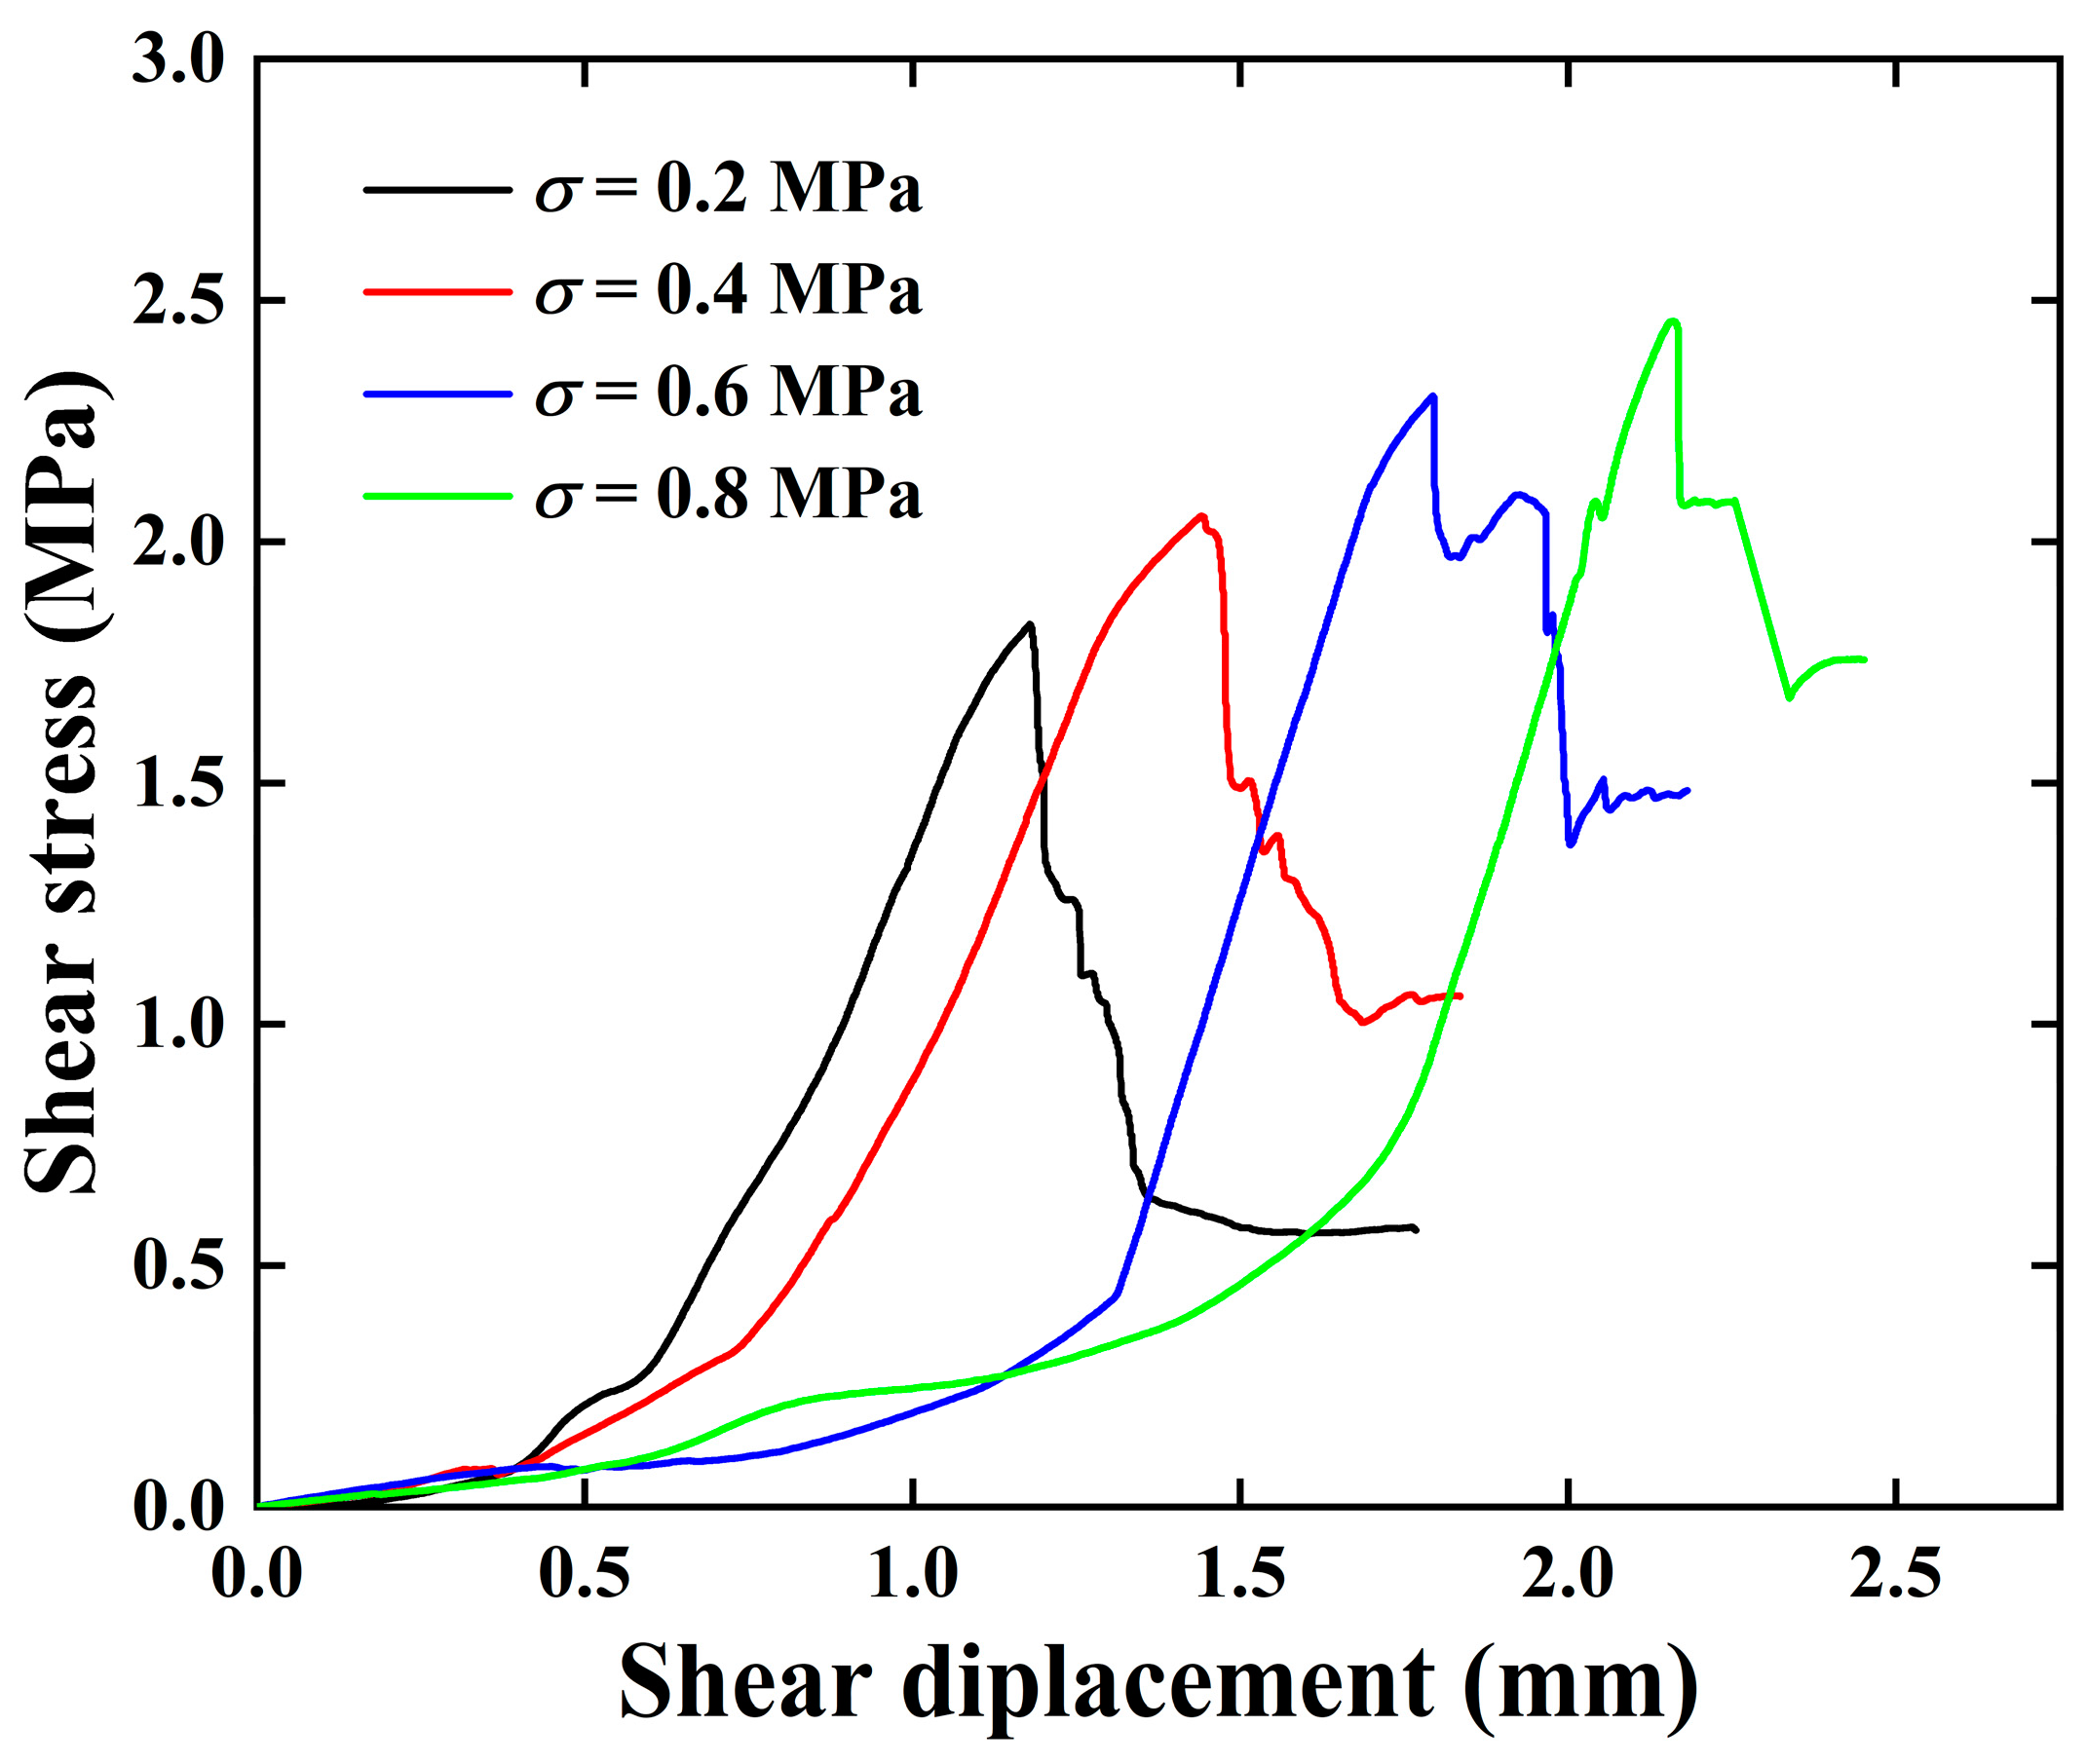
3.1. Characteristics of Shear Displacement–Shear Stress Variation
3.2. Energy Evolution Characteristics
3.2.1. Complete Energy Evolution Process Under Different Normal Stresses
- (1)
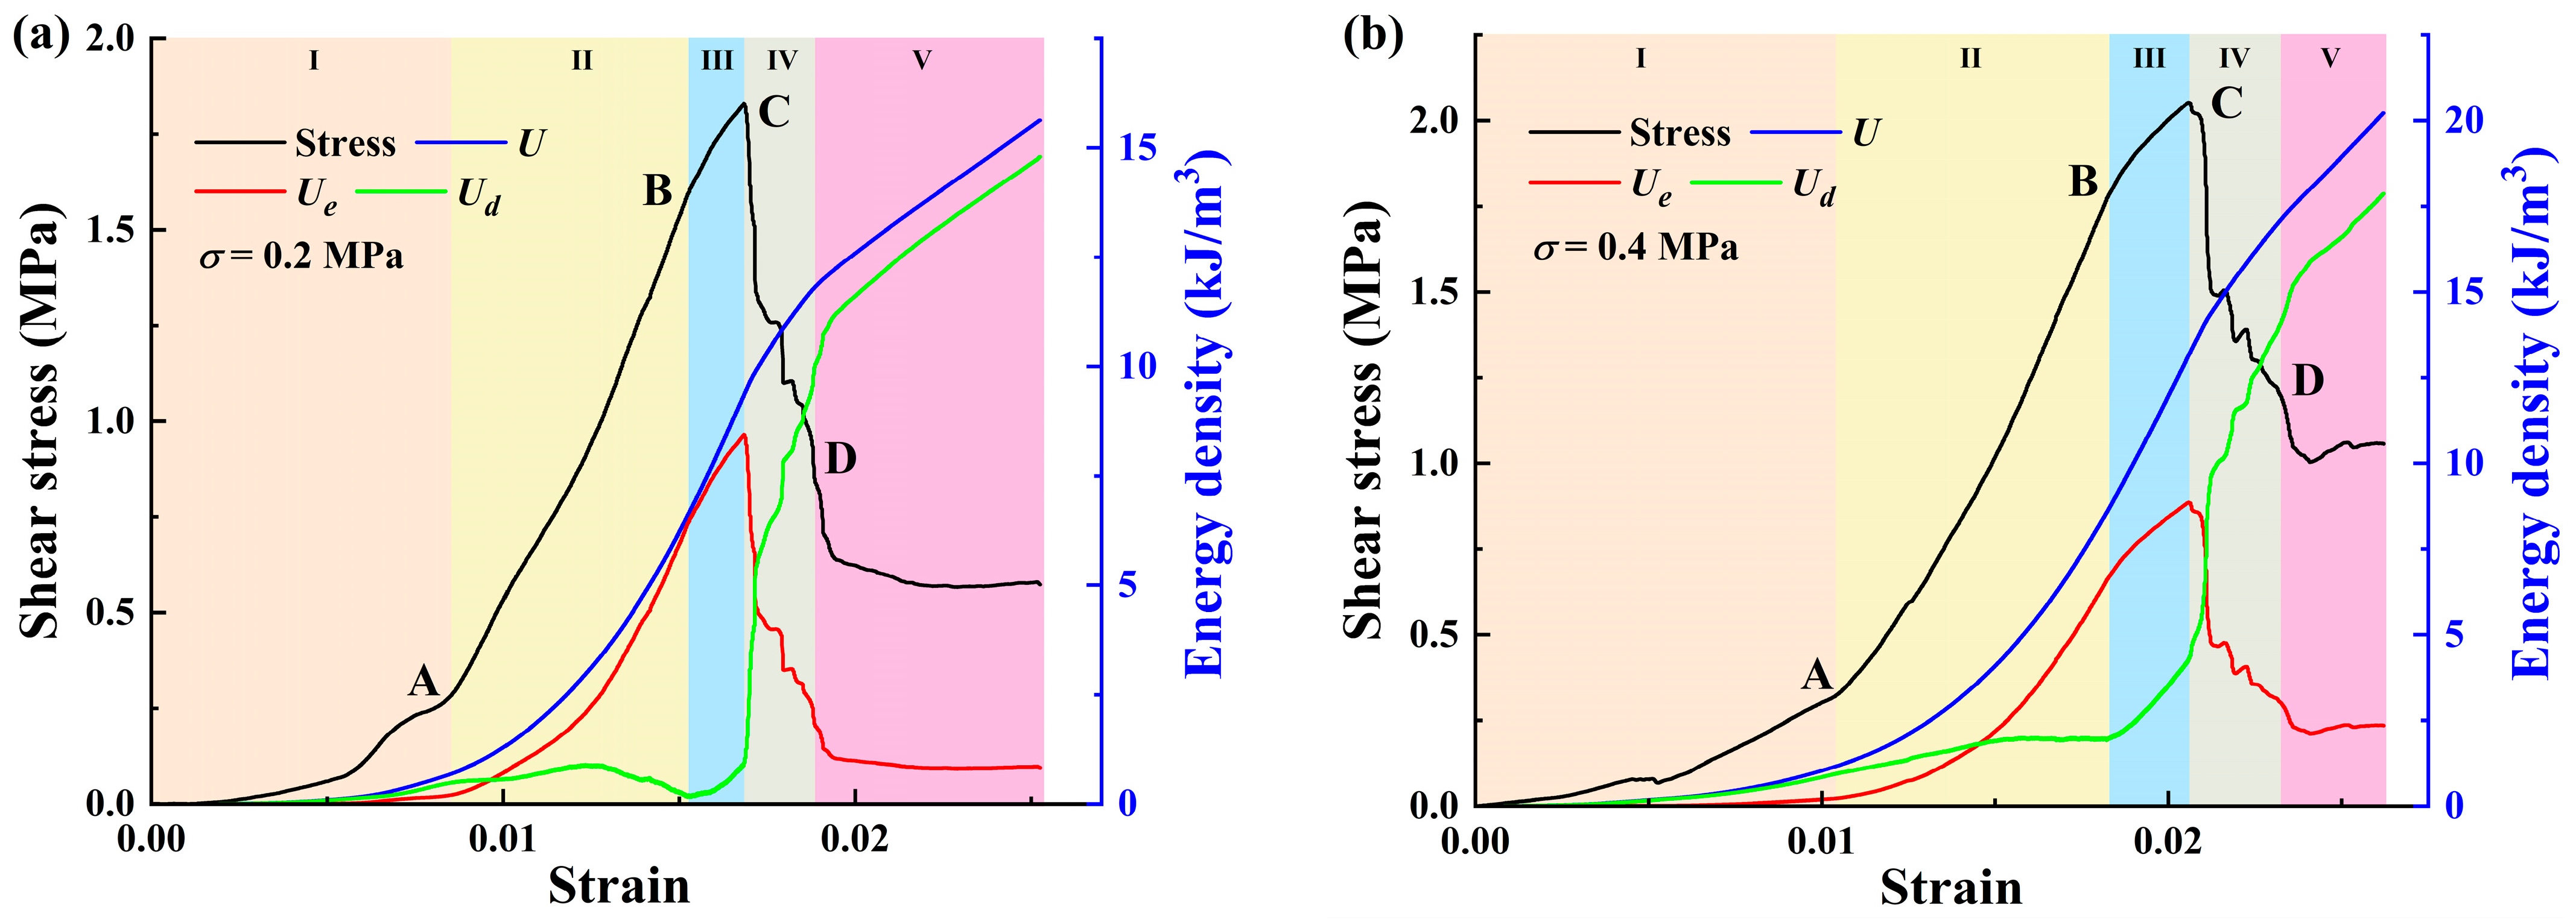
- Compaction stage (I): In this stage, the shear stress level of the sample is low. The total energy input into the sample, the elastic energy stored in the sample, and the energy dissipated by the sample to overcome the work done by the external load are all at a low level. To be specific, the total energy basically coincides with the dissipative energy and maintains a stable and slow increase, while the elastic energy is basically zero. This is mainly due to the shear densification in this stage, in which the input energy is mainly converted into dissipated energy for the closure of primary pores inside the sample. Note that the and curves begin to diverge at the end of this stage (point A) and the elastic energy slightly increases, which means the voids between interfaces are healed and a small amount of elastic energy is generated for storage.
- (2)
- Elastic deformation stage (II): After being compacted, the sample approaches a continuous medium, and shows obvious linear elastic characteristics. The total input energy density and elastic energy density are rapidly increasing, and basically maintain a parallel trend, while the dissipated energy density increases relatively slowly. This indicates that the energy absorbed by the sandstone–concrete specimens from the external environment is mainly stored in the specimens in the form of elastic strain energy.
- (3)
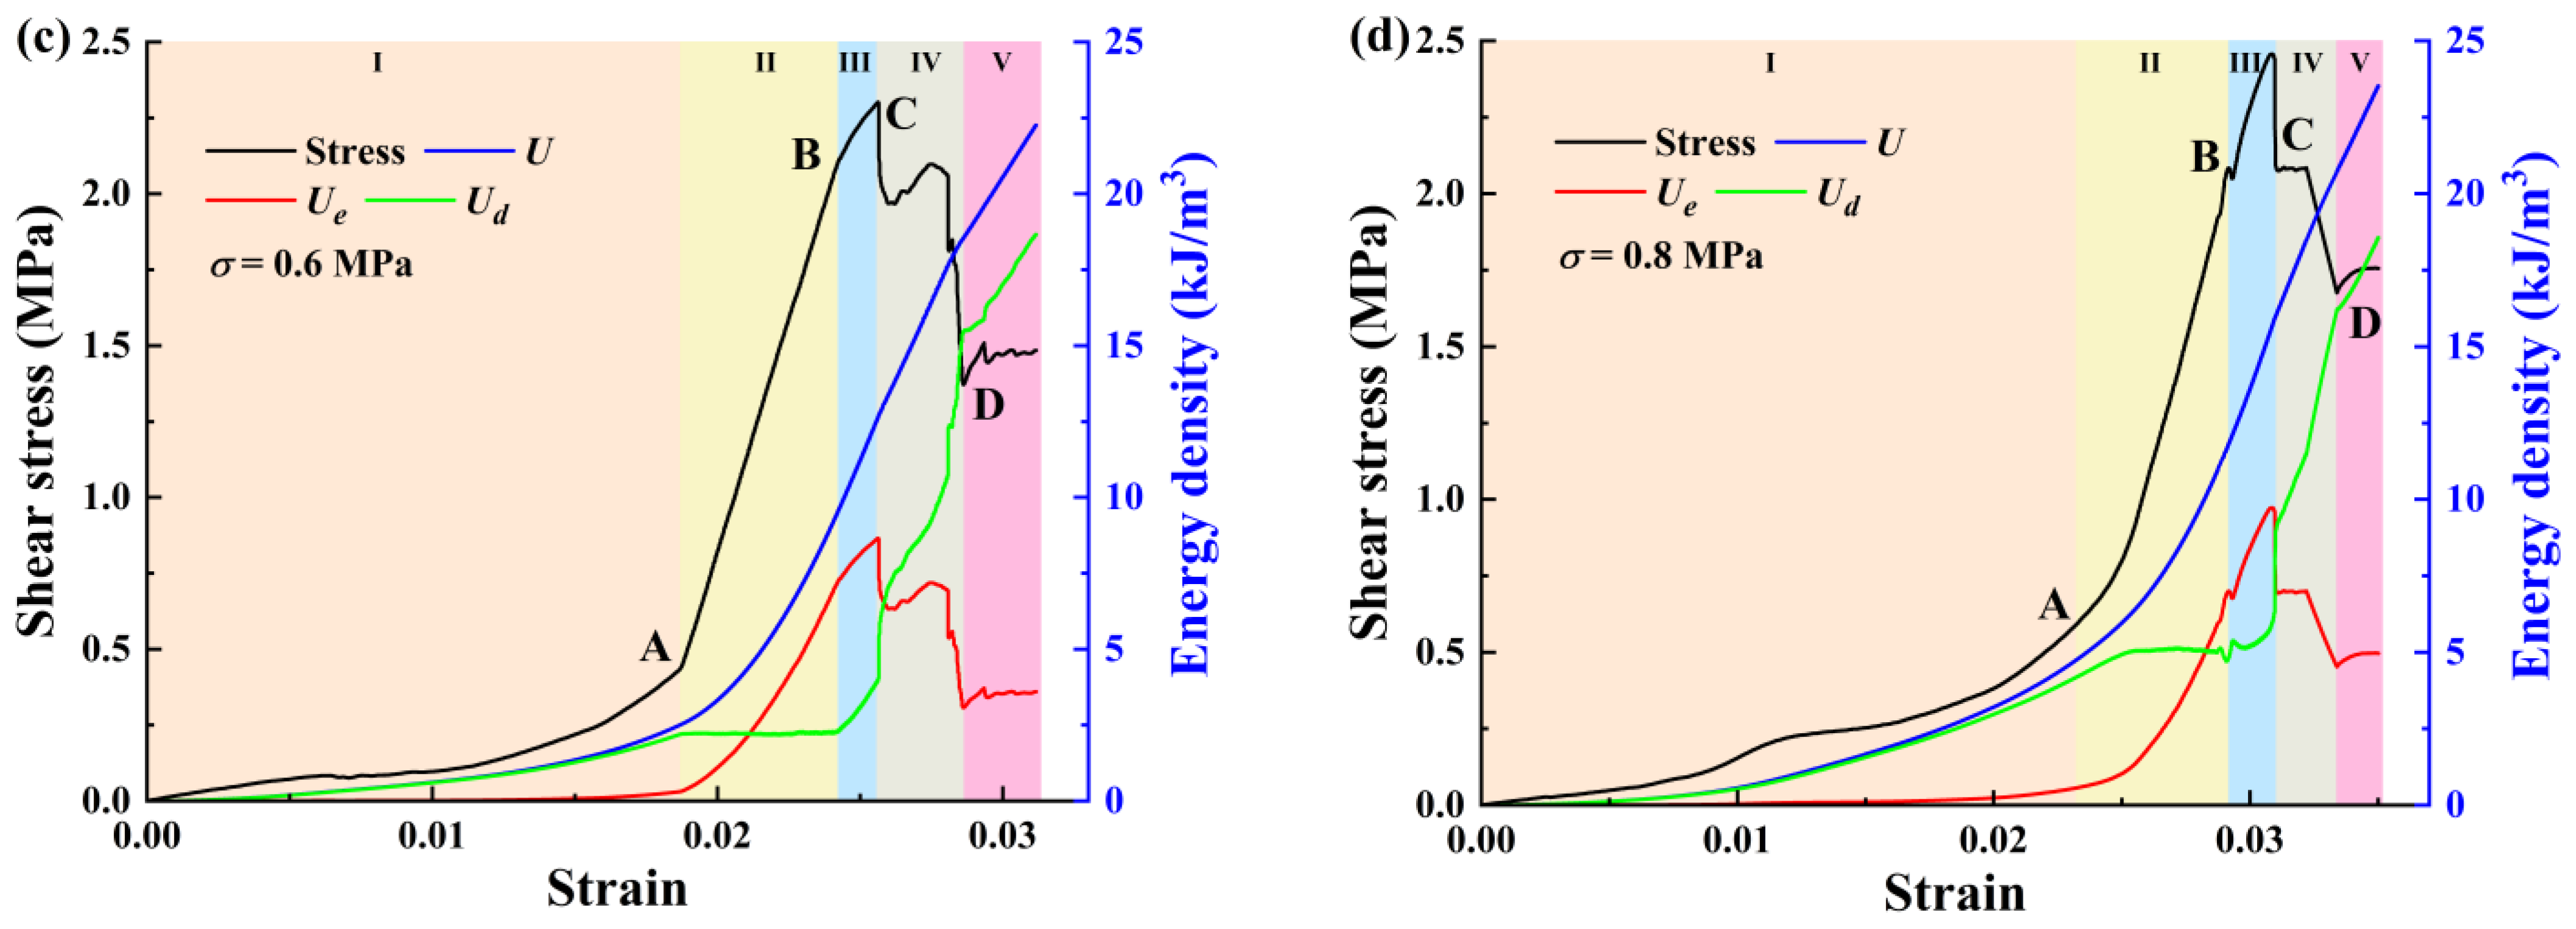
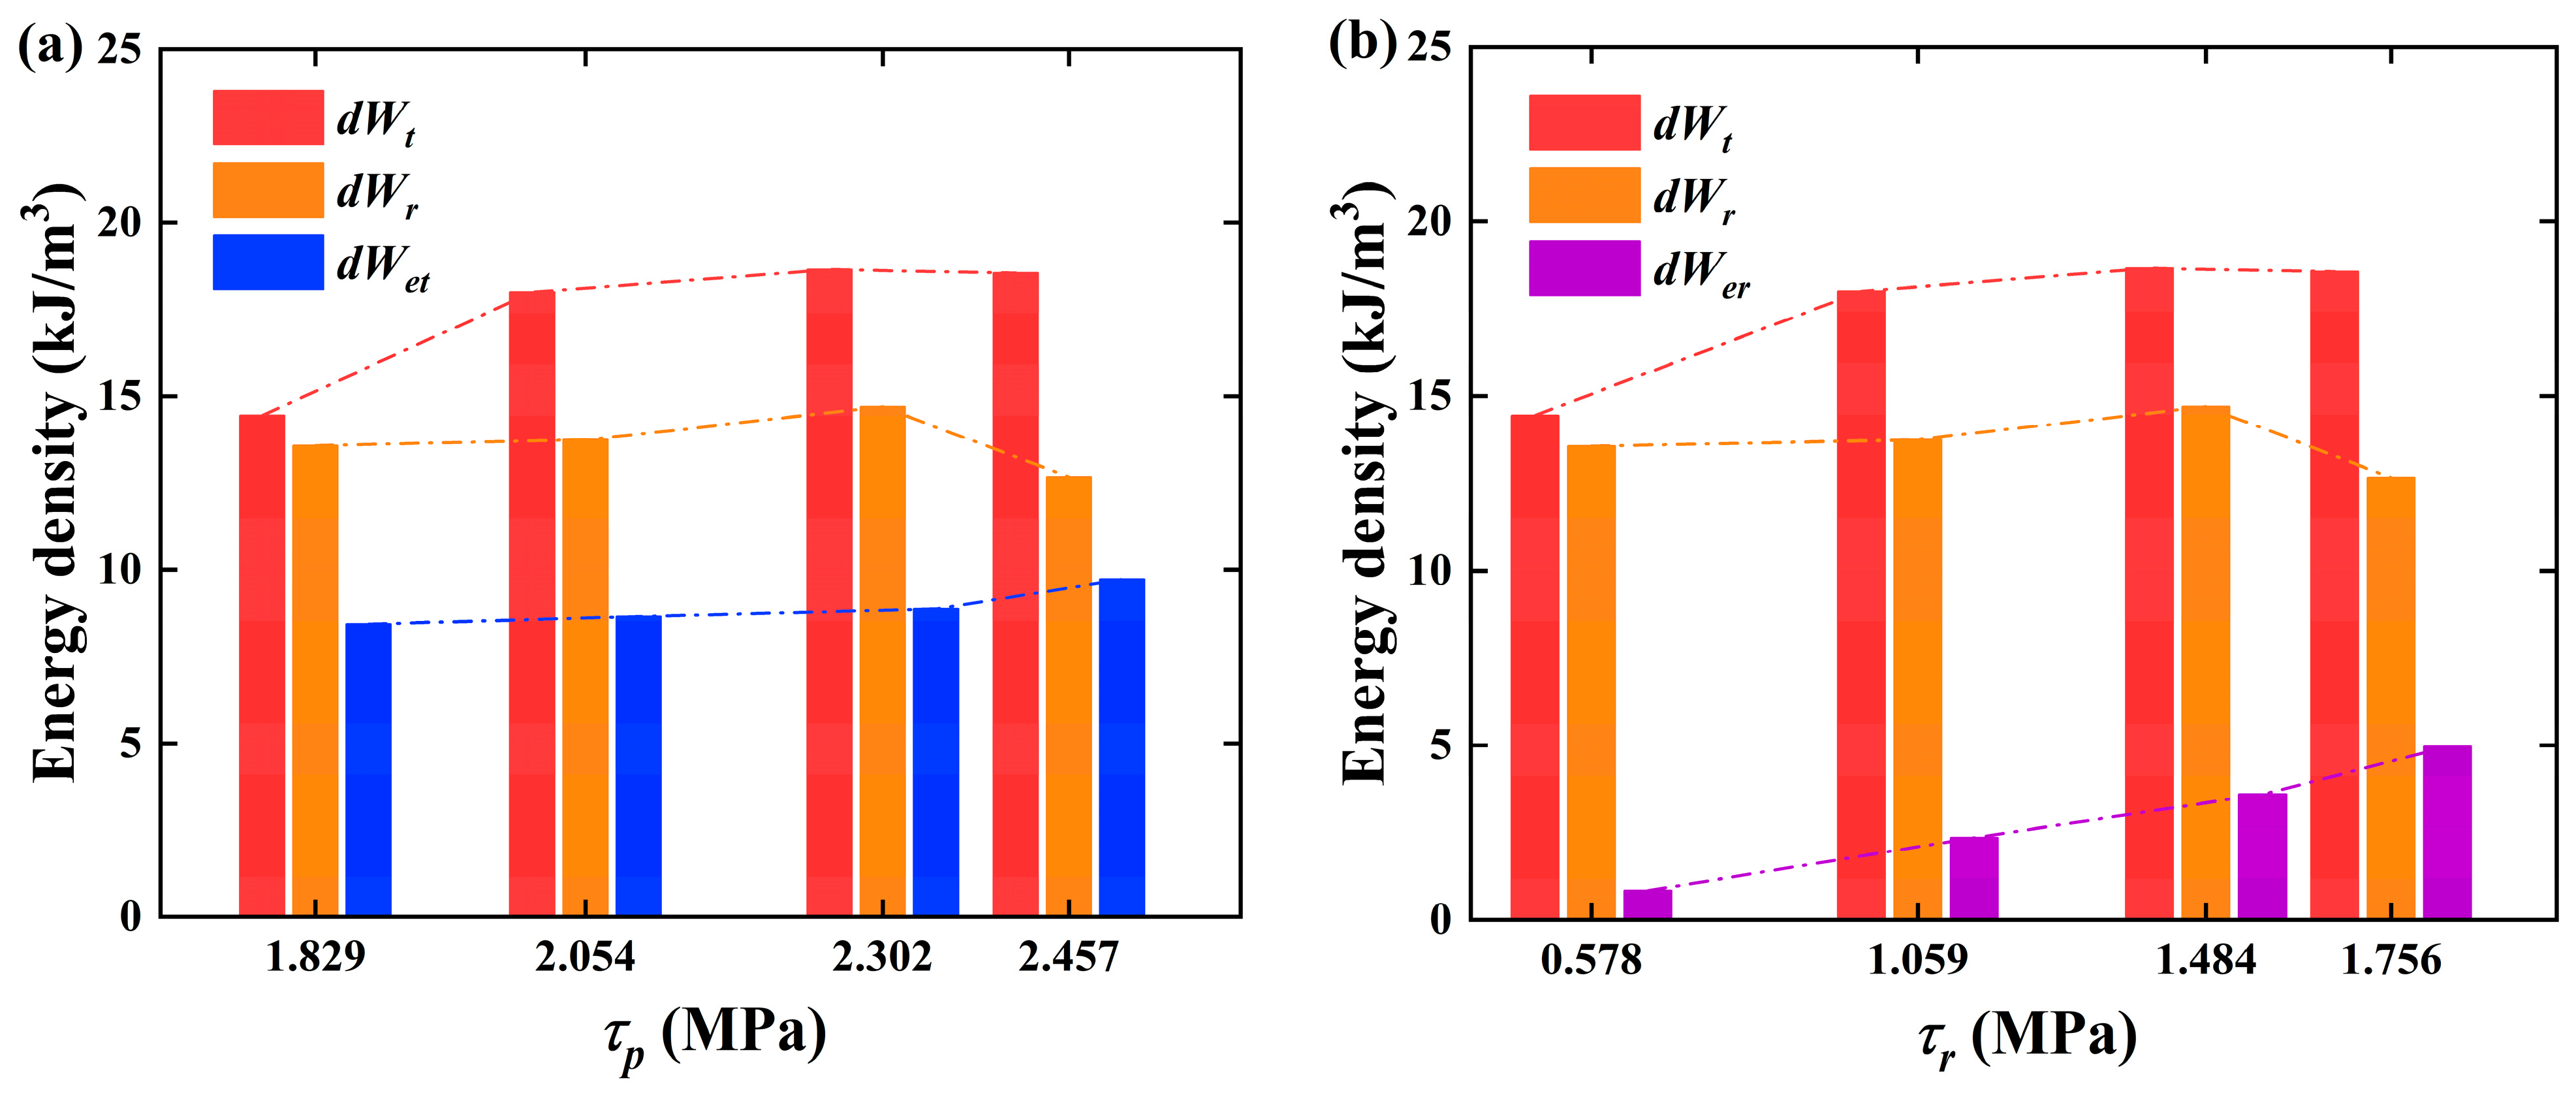
- Plastic stage (III): The shear stress–strain curve of the specimen shows nonlinear characteristics in this stage, and the specimen experiences irreversible plastic deformation. The energy absorbed by the sample is mainly converted into dissipated energy for the propagation of internal cracks and micro-fractures. The proportion of dissipated energy increases, while the proportion of elastic strain energy decreases. Moreover, the elastic strain energy reaches its maximum value at the stress peak (point C). And the value of at this point is considered as energy storage limit of the sample. It should be noted that the elastic strain energies at point C under different conditions are 8.4419 kJ/m3, 8.6534 kJ/m3, 8.8720 kJ/m3, and 9.7226 kJ/m3, respectively, showing an increasing trend with the normal stress. This indicates that the growth of normal stress improves the capacity of specimens for energy storage and increases the energy required for crack development and propagation, thus enhancing the specimen’s bearing capacity.
- (4)
- Failure stage (IV): The shear stress experiences a sudden drop and the micro-cracks inside the sample extend and coalesce into macroscopic cracks at point C, signifying that the sample has undergone structural instability and failure. The macroscopic cracks slide along the fracture surface, resulting in shear deformation. As the deformation increases, the total input energy continues to increase, while the stored elastic energy rapidly releases, and the dissipated energy density suddenly rises and then increases rapidly for crack aggregation, development, and coalescence. From the figures, the total input energy of specimens before failure for each case are 9.3122 kJ/m3, 12.6147 kJ/m3, 13.1233 kJ/m3, and 15.6145 kJ/m3, respectively. Compared to the case when is 0.2 MPa, the total energy U has increased by 35.46%, 40.93%, and 67.68%, respectively. It shows that as the normal stress increases, the input energy required for specimen failure keeps increasing.
- (5)
- Post-peak degradation stage (V): In this stage, as shear strain increases, shear stress begins to decrease, showing the characteristics of strain softening; the elastic energy density remains stable, while the dissipated energy and residual total energy show a parallel trend of steady growth. This is due to the slip friction between interfaces that causes the majority of the input energy to be converted into dissipated energy.
3.2.2. Energy Evolution Analysis Based on Shear Strength
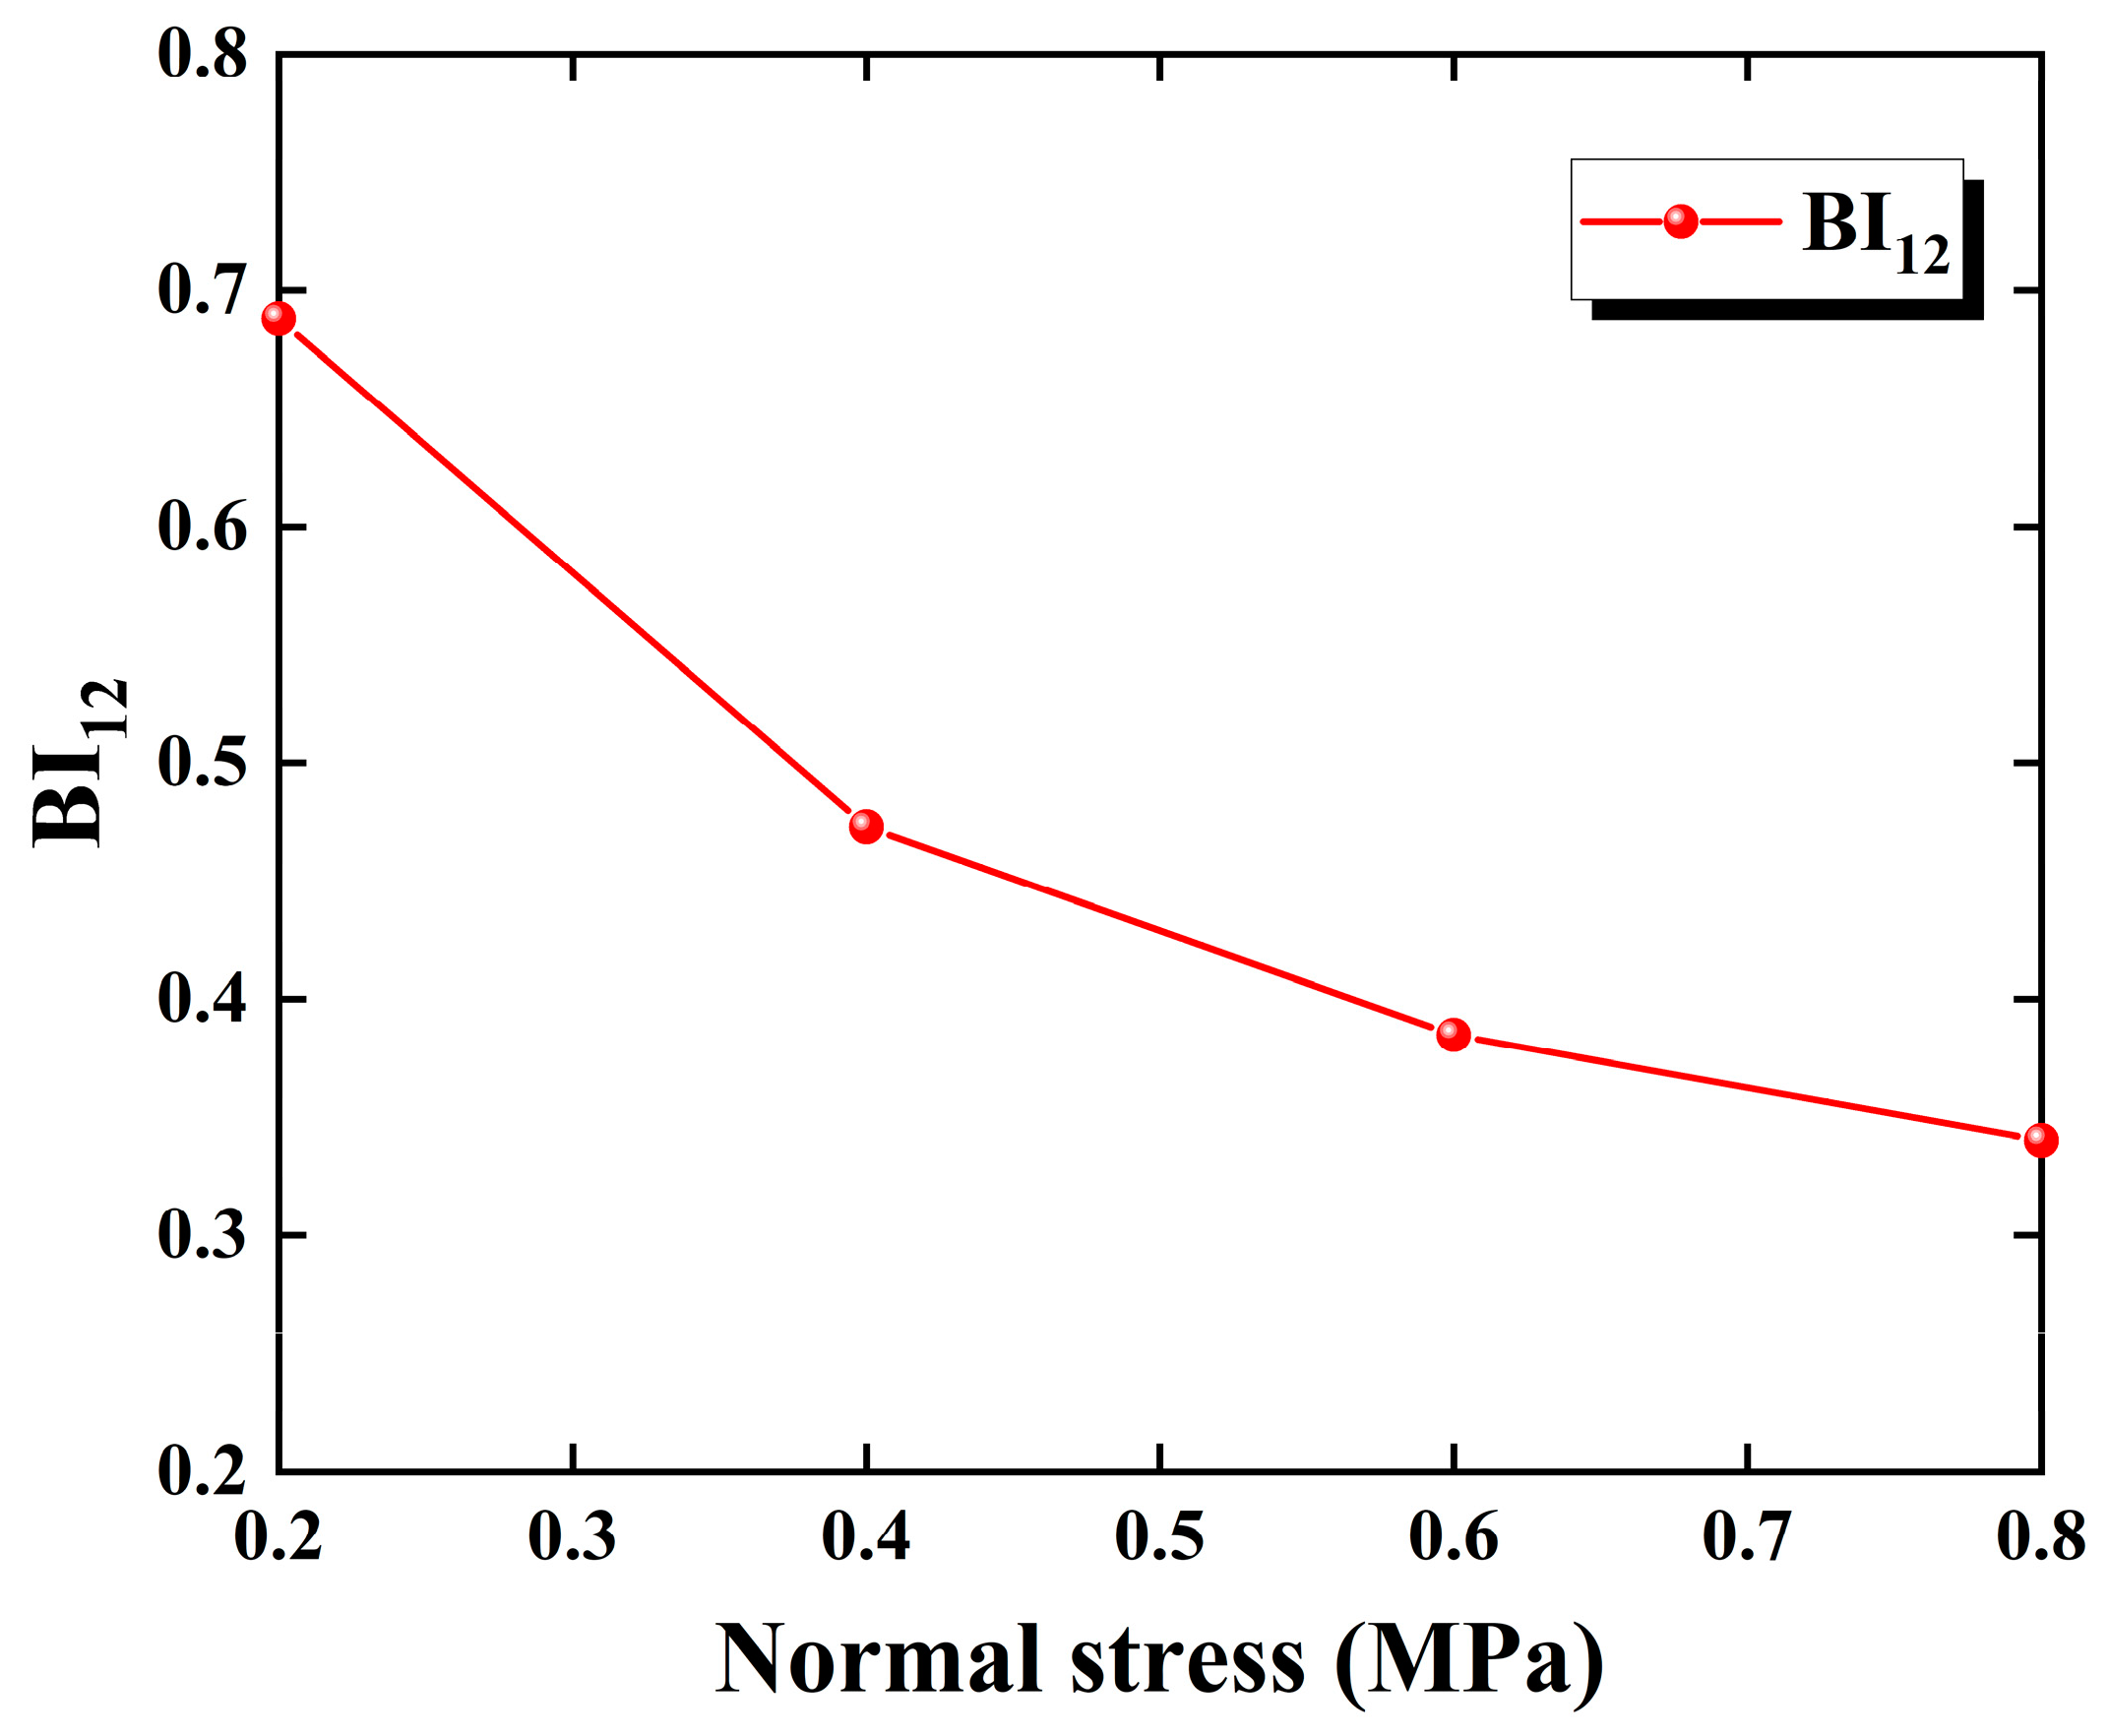
3.3. Brittleness Evaluation Based on the Energy Evolution Mechanism
4. Analysis of AE Characteristics and Fracture Behavior
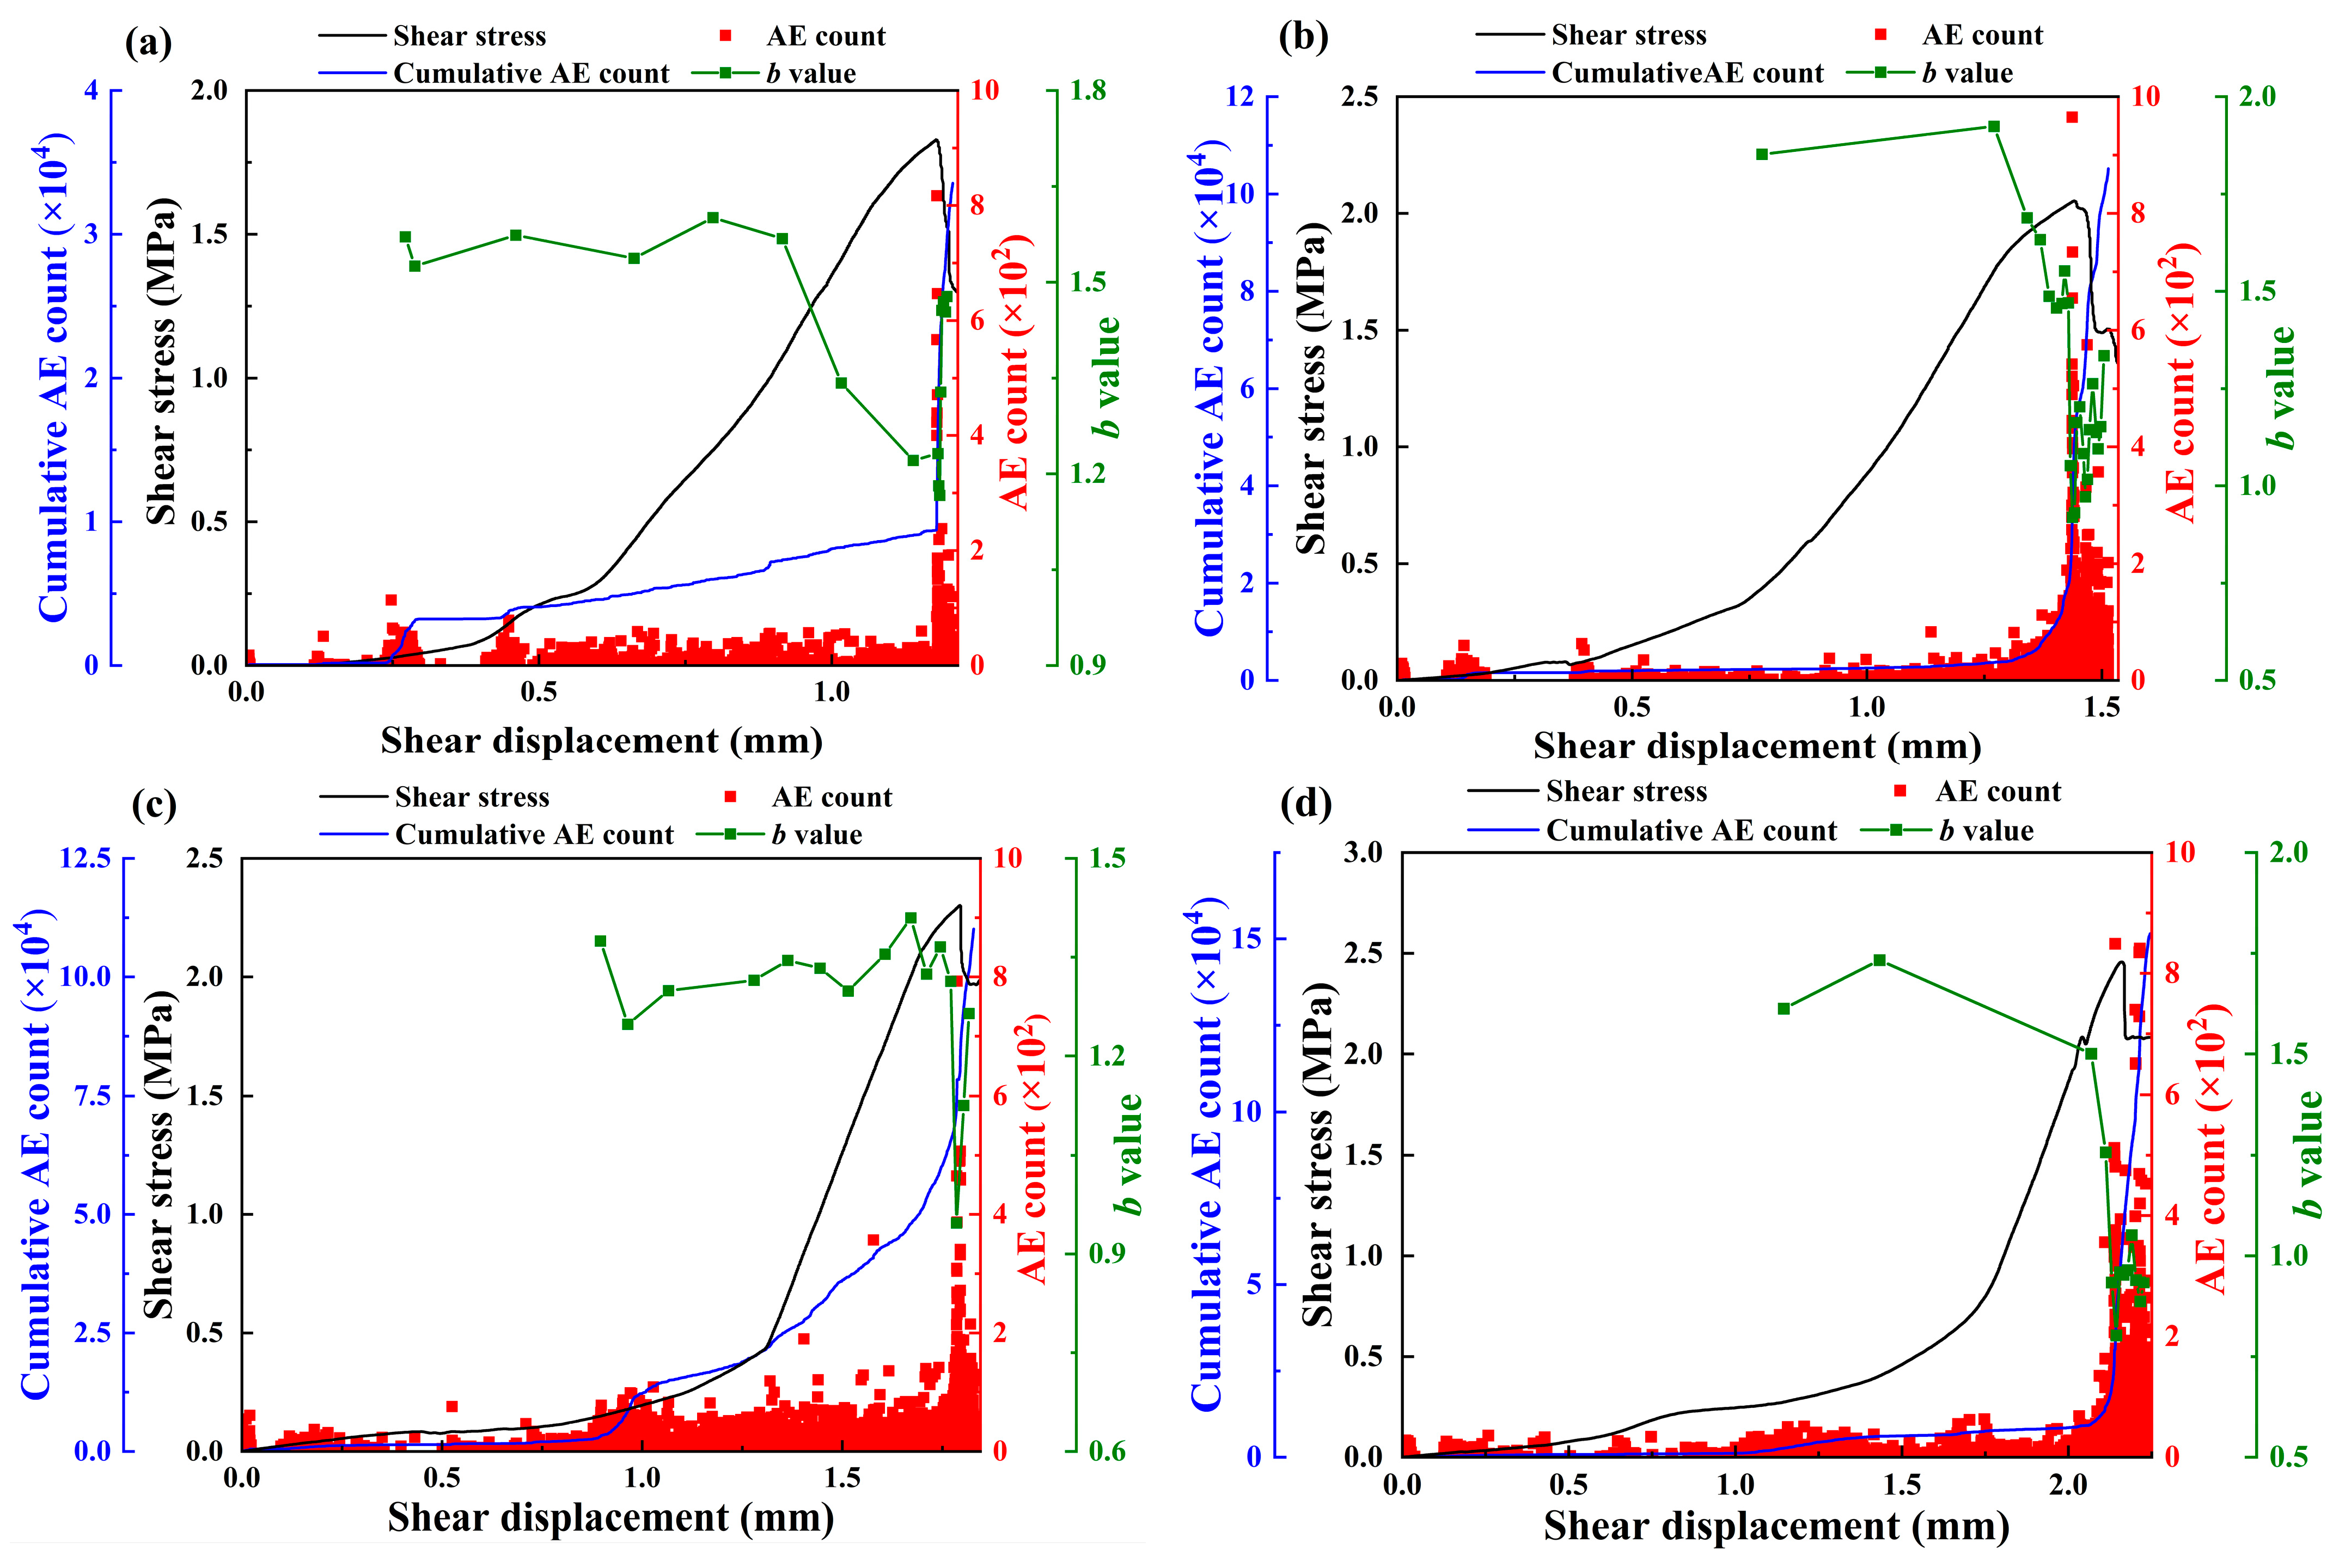
4.1. Analysis of b Value
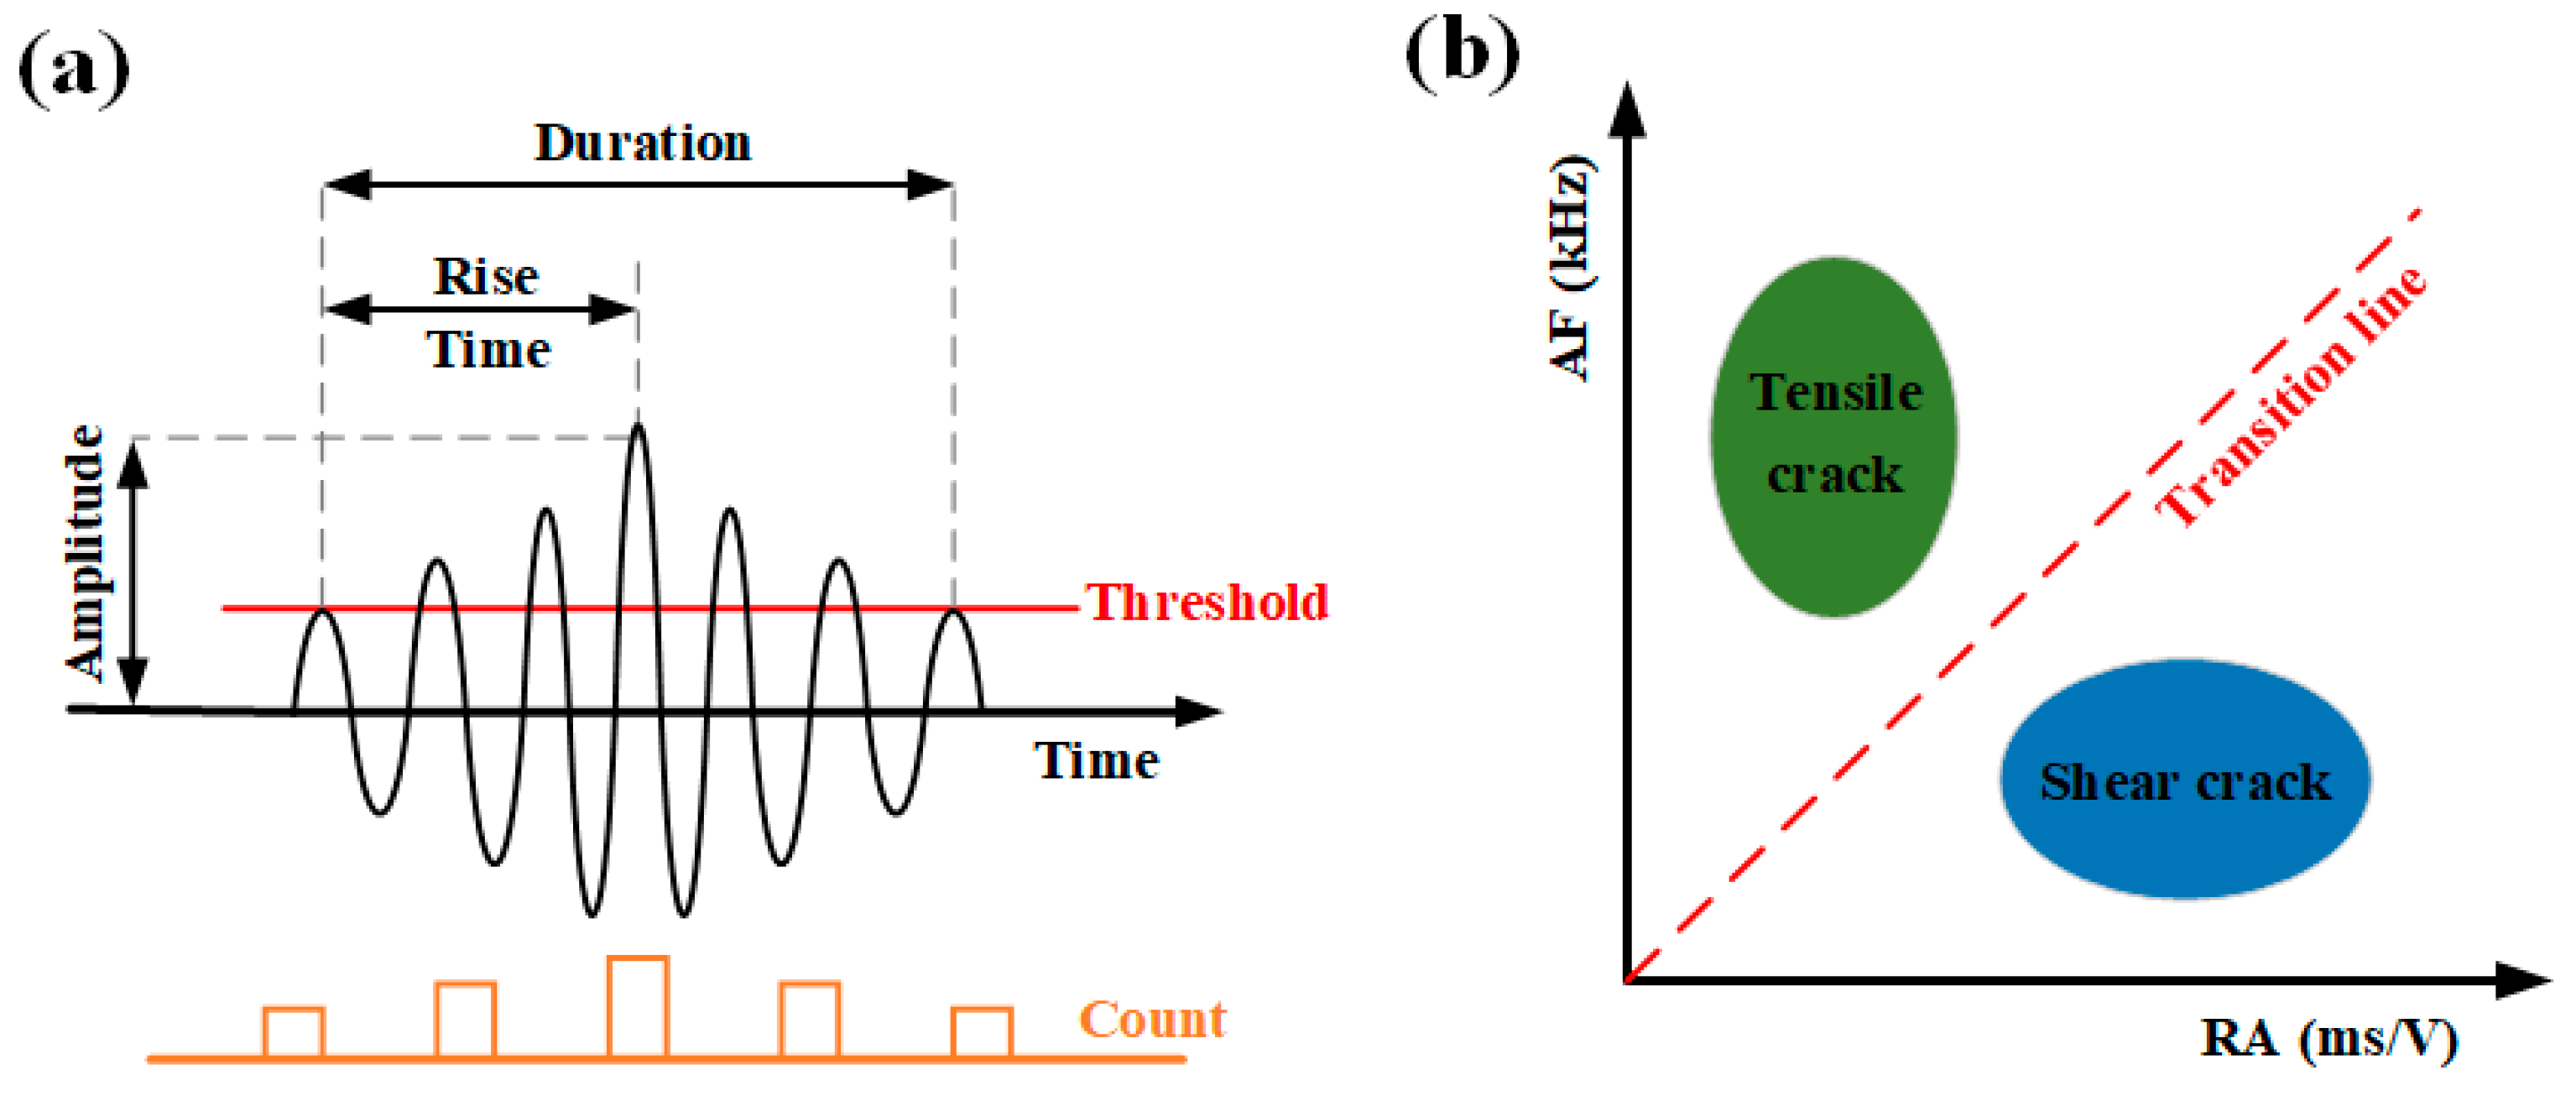
4.2. Analysis of Crack Classification Characteristics
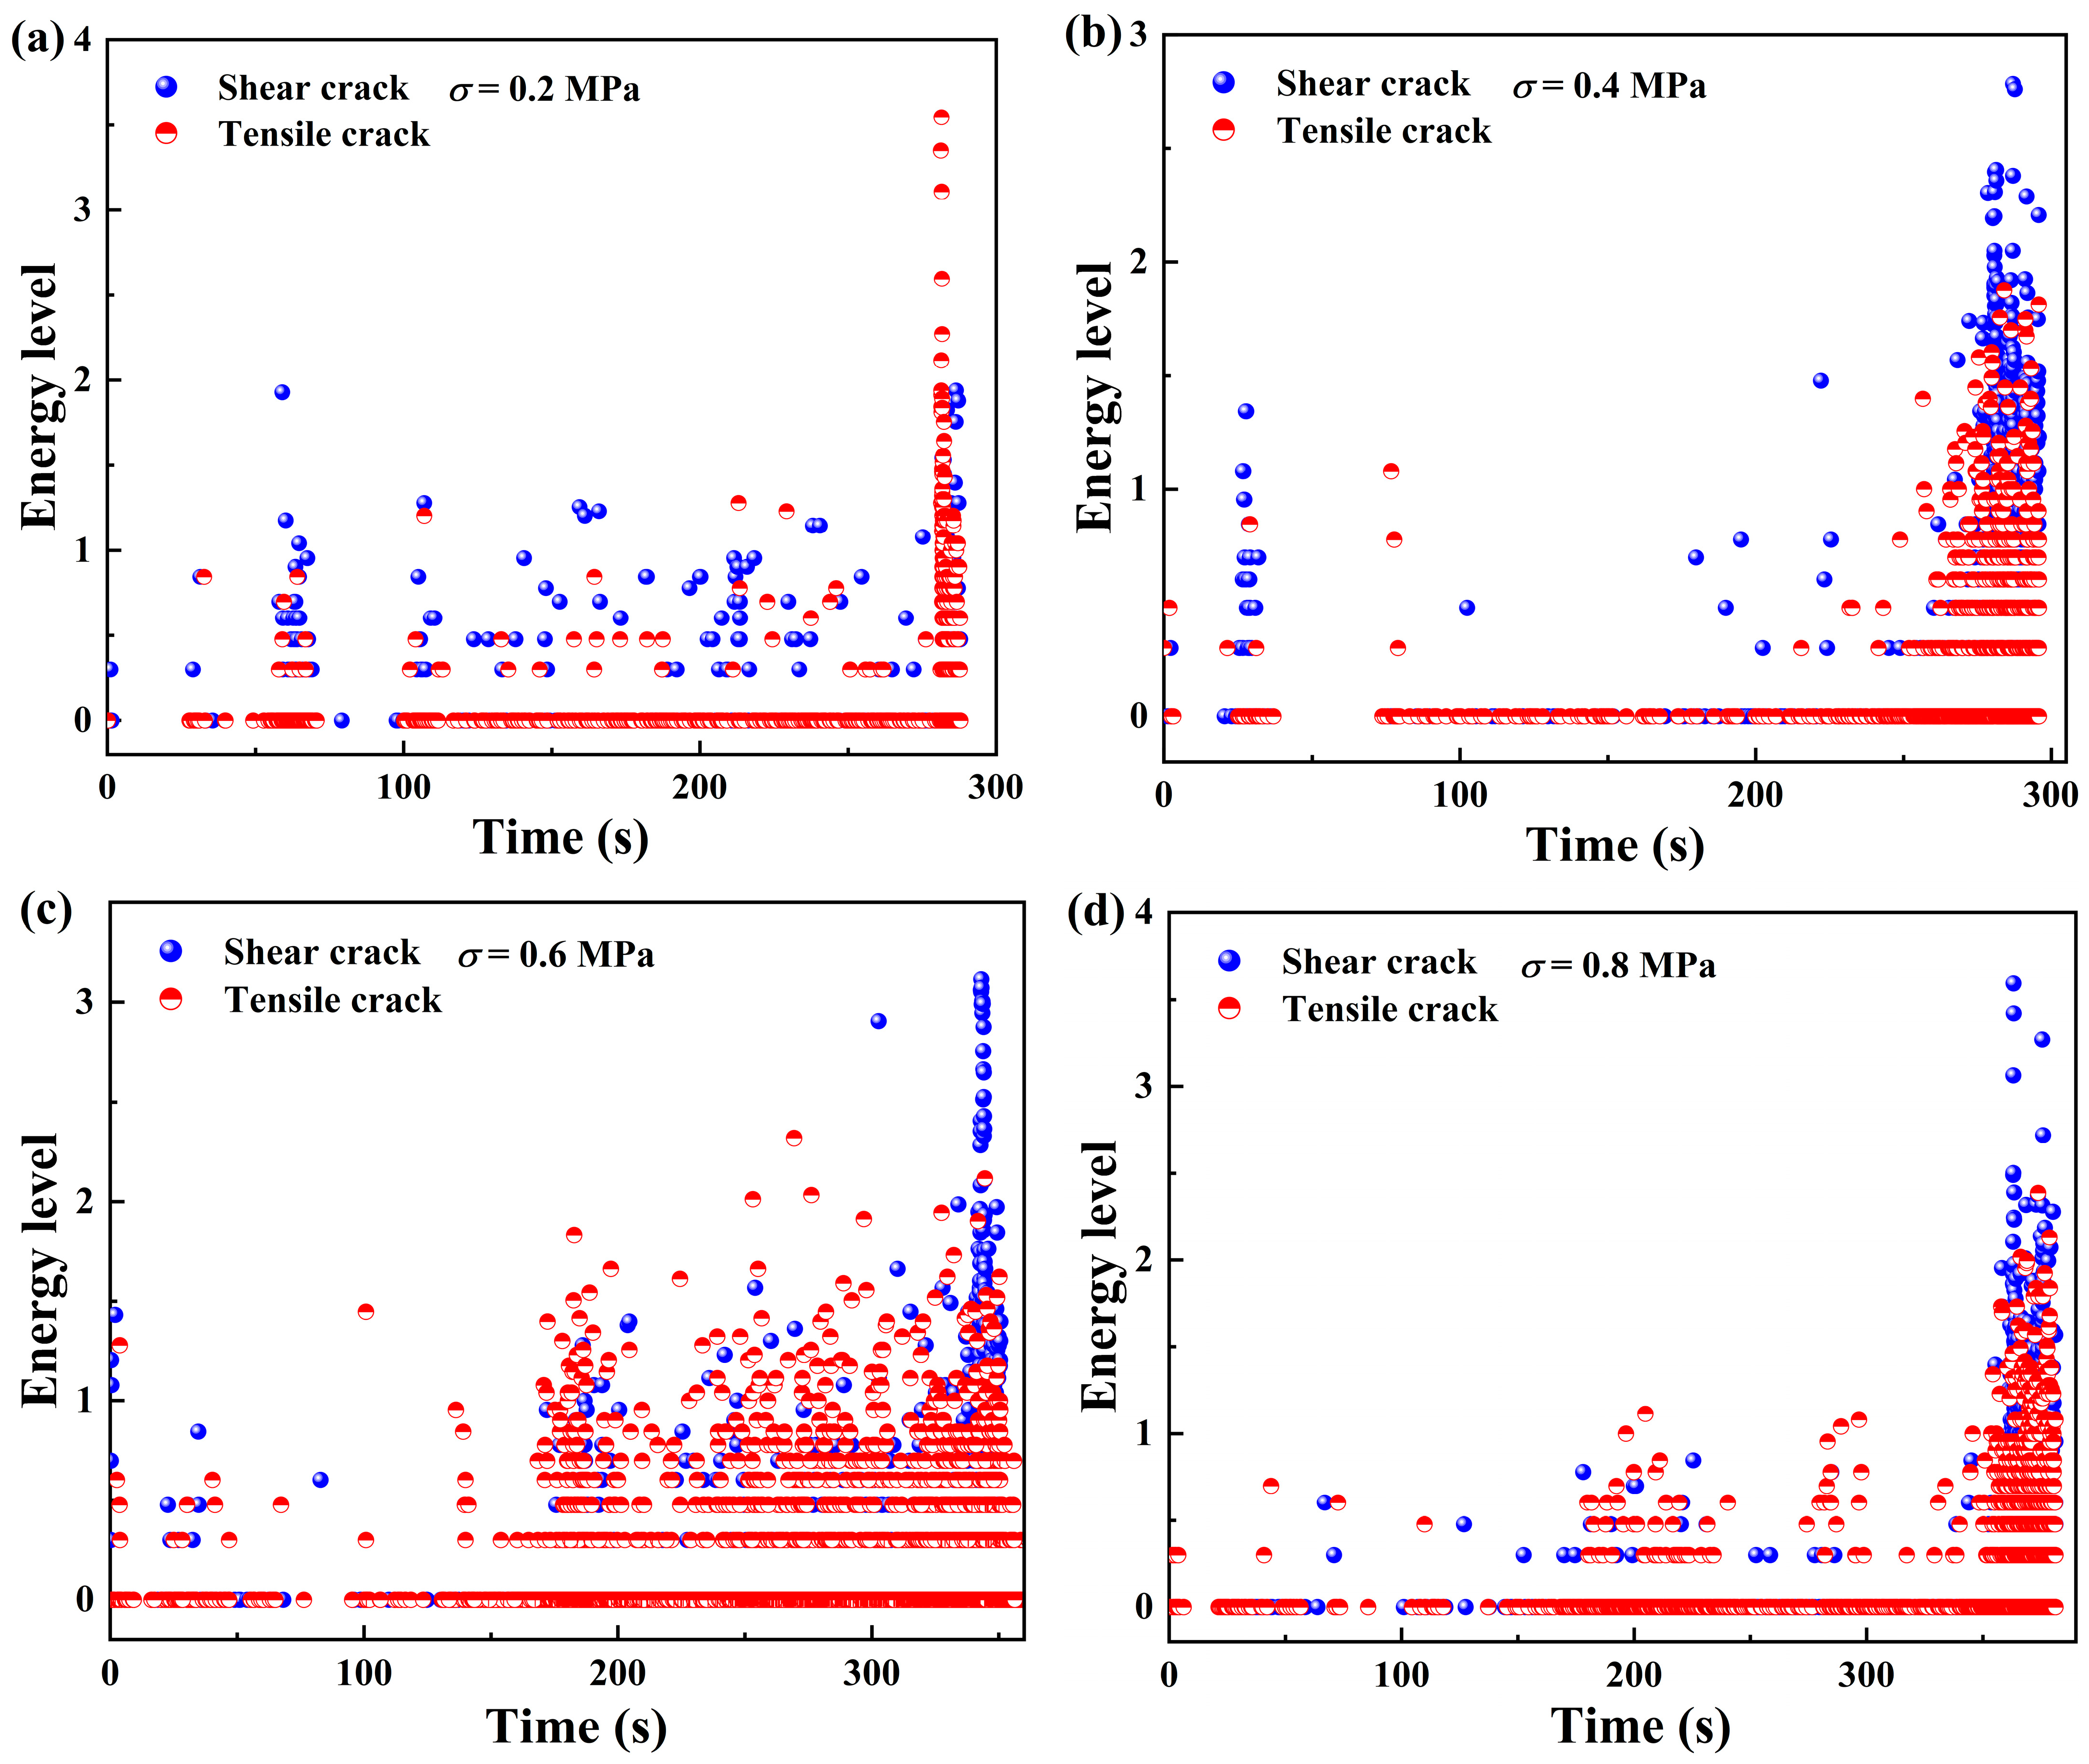
4.3. Temporal Distribution Characteristics of Micro-Fracture Types in Samples
4.4. Analysis of Full-Field Strain
5. Conclusions
- (1)
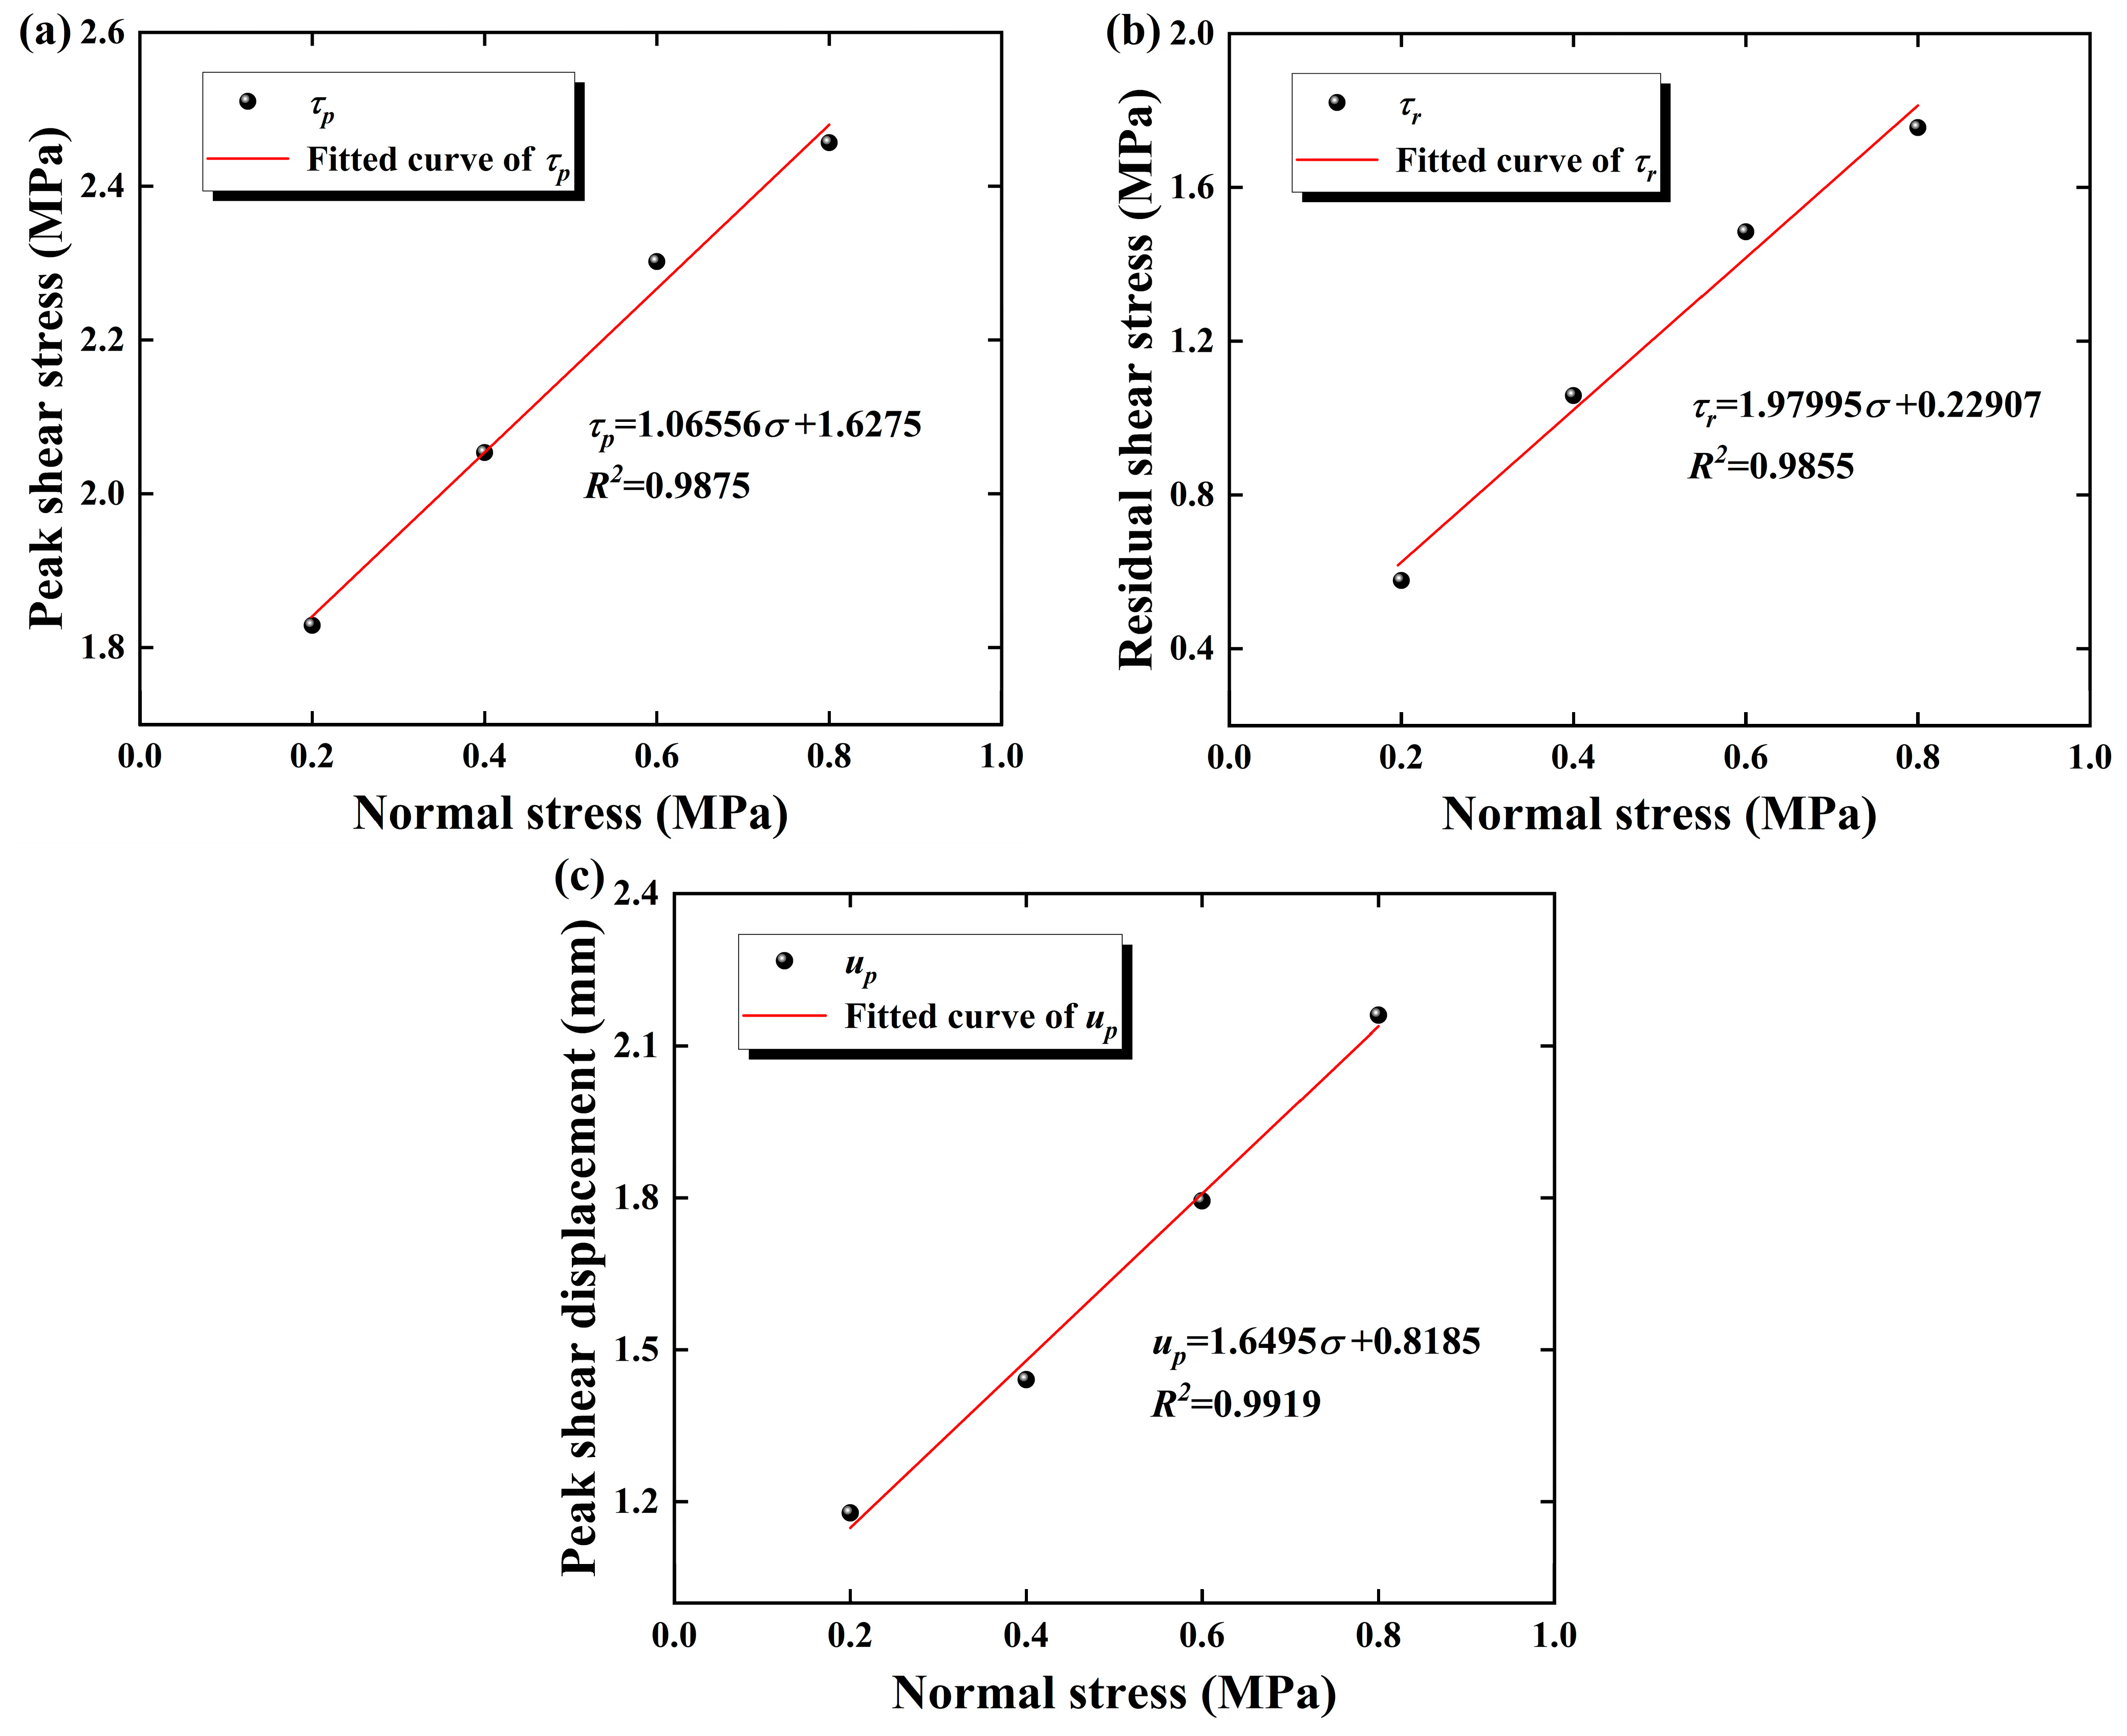
- The increase in normal stress inhibits the coalescence and penetration of micro-cracks within the sample, thereby enhancing the load-bearing capacity. The samples’ peak shear strength, residual strength, and shear displacement exhibit a linearly increasing relationship with normal stress.
- (2)
- The energy evolution features during the failure process are discussed in detail and the impact of normal stress on energy evolution is also revealed. An increase in normal stress can increase the energy storage limit of the sample, as well as the energy required for crack extension and penetration. In addition, the brittleness evaluation model indicates that the brittleness of the samples during direct shear tests shows a decreasing trend with the increase in the normal stress level.
- (3)
- The analysis results of the b values show three-stage changing characteristics as the deformation increases in the shear process for specimens under different conditions. The b value initially increases, then decreases, and finally fluctuates significantly at failure. And it is closely consistent with the specimen’s crack propagation scale, from small to large.
- (4)
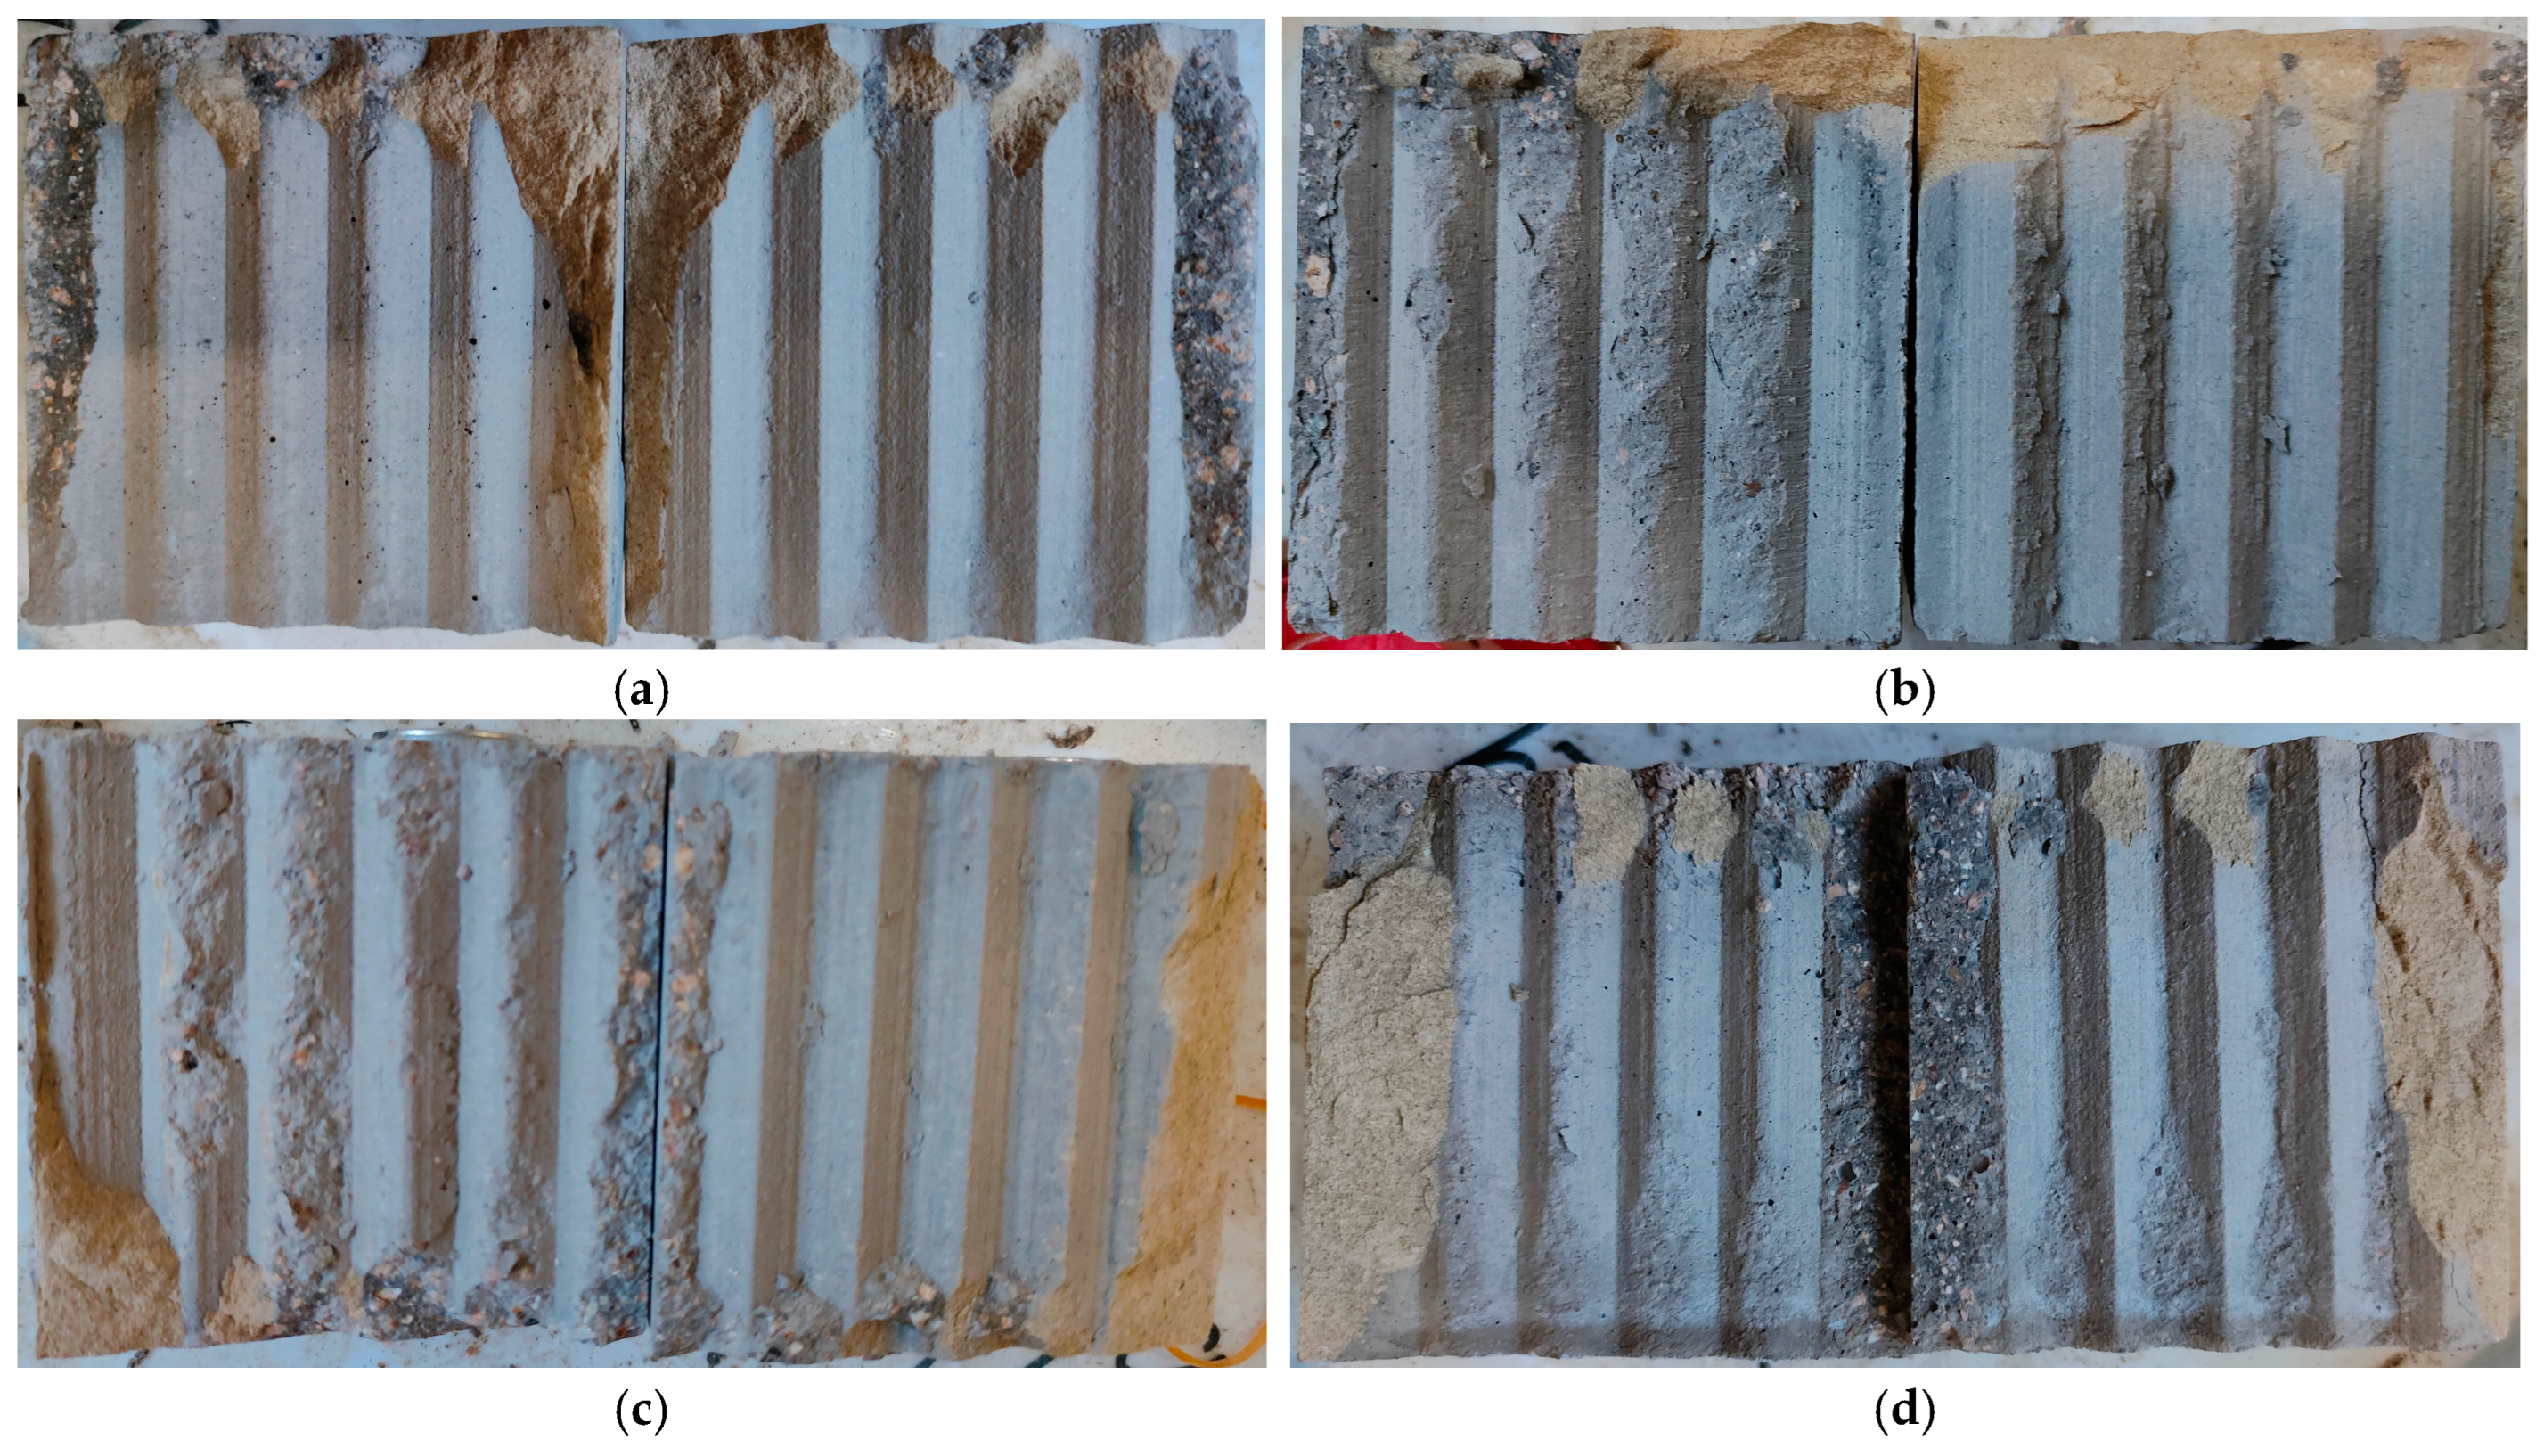
- With an increase in normal stress, the failure type of the samples became predominantly shear failure, and the proportion of shear cracks increased from 42.76% to 53.44% while the proportion of tensile cracks decreased from 57.24% to 46.56%. On the eve of sample destabilization, the high-energy level fracture type gradually changes from tensile fracture to shear fracture with the increase in normal stress, and the proportion of shear fracture also increases.
- (5)
- In terms of fracture evolution behaviors, the development of wing-shaped cracks is strongly influenced by normal stress. As the normal stress level increases, the interface failure becomes more severe, the tensile principal strain in the wing-shaped strain concentration zone increases, and the sample’s shear deformation resistance is enhanced.
Author Contributions
Funding
Institutional Review Board Statement
Informed Consent Statement
Data Availability Statement
Conflicts of Interest
Nomenclature
| AE amplitude | |
| AE count/duration time | |
| b value | |
| brittleness index | |
| AE count | |
| additional energy | |
| consumed elastic energy | |
| residual elastic energy | |
| total elastic energy | |
| dissipated plastic energy in the pre-peak region | |
| rupture energy | |
| total dissipated energy | |
| shear modulus | |
| initial elastic modulus | |
| unloading elastic modulus | |
| AE threshold | |
| rise time/amplitude | |
| AE duration time | |
| the rise time of AEs | |
| total energy density | |
| dissipated energy density | |
| elastic energy density | |
| maximum principal strain | |
| strain value at any point | |
| shear strain at peak shear stress | |
| shear strain at residual shear stress | |
| normal stress | |
| maximum principal stress | |
| stress value at any point | |
| peak shear stress | |
| residual shear stress | |
| peak shear displacement |
References
- Luo, Y.; Chen, J.; Shi, Z.; Li, J.; Liu, W. Mechanical characteristics of primary support of large span loess highway tunnel: A case study in Shaanxi Province, Loess Plateau, NW China primary. Tunn. Undergr. Space Technol. 2020, 104, 103532. [Google Scholar] [CrossRef]
- De Granrut, M.; Simon, A.; Dias, D. Artificial neural networks for the interpretation of piezometric levels at the rock-concrete interface of arch dams. Eng. Struct. 2019, 178, 616–634. [Google Scholar] [CrossRef]
- Tian, H.M.; Chen, W.Z.; Yang, D.S.; Yang, J.P. Experimental and numerical analysis of the shear behaviour of cemented concrete–rock joints. Rock Mech. Rock Eng. 2015, 48, 213–222. [Google Scholar] [CrossRef]
- Fishman, Y.A. Stability of concrete retaining structures and their interface with rock foundations. Int. J. Rock Mech. Min. Sci. 2009, 46, 957–966. [Google Scholar] [CrossRef]
- Pang, B.; Suárez, H.S.; Becker, F. Monte Carlo based study of radiation field in a deep geological repository for high-level nuclear waste with different host rock types. Nucl. Eng. Des. 2017, 325, 44–48. [Google Scholar] [CrossRef]
- Zhou, J.; Zhou, C.; Feng, Q.; Gao, T. Analytical model for load-transfer mechanism of rock-socketed drilled piles: Considering bond strength of the concrete-rock interface. Int. J. Geomech. 2020, 20, 04020059. [Google Scholar] [CrossRef]
- Lu, J.Y. Study on Mechanical Response and Fracture Law of Rock-Concrete Interface Under Impact Load; Central South University: Changsha, China, 2023. (In Chinese) [Google Scholar]
- Hou, J.; Zhao, H.; Peng, W.; Zhao, M. A limit solution for predicting side resistance on rock-socketed piles. J. Eng. Mech. 2022, 148, 04021131. [Google Scholar] [CrossRef]
- Liu, Y.; Zhao, H.; Zhao, M.; Hou, J. Laboratory and theoretical study for concrete–mudstone interface shear to account for asperity degradation. Environ. Earth Sci. 2022, 81, 18. [Google Scholar] [CrossRef]
- Badika, M.; El Merabi, B.; Capdevielle, S.; Dufour, F.; Saletti, D.; Briffaut, M. Influence of concrete-rock bonds and roughness on the shear behavior of concrete-rock interfaces under low normal loading, experimental and numerical analysis. Appl. Sci. 2022, 12, 5643. [Google Scholar] [CrossRef]
- Mirmozaffari, M.; Yazdani, M.; Boskabadi, A.; Ahady Dolatsara, H.; Kabirifar, K.; Amiri Golilarz, N. A novel machine learning approach combined with optimization models for eco-efficiency evaluation. Appl. Sci. 2020, 10, 5210. [Google Scholar] [CrossRef]
- Saadat, M.; Taheri, A.; Kawamura, Y. Incorporating asperity strength into rock joint constitutive model for approximating asperity damage: An insight from DEM modelling. Eng. Fract. Mech. 2021, 248, 107744. [Google Scholar] [CrossRef]
- Moradian, Z.A.; Ballivy, G.; Rivard, P.; Gravel, C.; Rousseau, B. Evaluating damage during shear tests of rock joints using acoustic emissions. Int. J. Rock Mech. Min. Sci. 2010, 47, 590–598. [Google Scholar] [CrossRef]
- Zhang, M.; Sheng, Q.; Cui, Z. Experimental and numerical study on the mechanical properties of the rock-concrete contact surface for consideration of ground-liner interaction in rock tunnelling. Eur. J. Environ. Civ. Eng. 2023, 27, 339–355. [Google Scholar] [CrossRef]
- Li, L.; Xia, Y.; Huang, B.; Zhang, L.; Li, M.; Li, A. The behaviour of fracture growth in sedimentary rocks: A numerical study based on hydraulic fracturing processes. Energies 2016, 9, 169. [Google Scholar] [CrossRef]
- Qiu, H.; Zhu, Z.; Wang, M.; Wang, F.; Ma, Y.; Lang, L.; Ying, P. Study on crack dynamic propagation behavior and fracture toughness in rock-mortar interface of concrete. Eng. Fract. Mech. 2020, 228, 106798. [Google Scholar] [CrossRef]
- Yuan, W.; Dong, W.; Zhang, B.; Zhong, H. Investigations on fracture properties and analytical solutions of fracture parameters at rock-concrete interface. Constr. Build. Mater. 2021, 300, 124040. [Google Scholar] [CrossRef]
- Xie, H.P.; Ju, Y.; Li, L.Y. Criteria for strength and structural failure of rocks based on energy dissipation and energy release principles. Chin. J. Rock Mech. Rock Eng. 2005, 17, 3003–3010. [Google Scholar]
- Xie, H.P.; Ju, Y.; Li, L.Y.; Peng, R.D. Energy mechanism of deformation and failure of rock masses. Chin. J. Rock Mech. Eng. 2008, 27, 1729–1740. [Google Scholar]
- Chen, Z.; He, C.; Ma, G.; Xu, G.; Ma, C. Energy damage evolution mechanism of rock and its application to brittleness evaluation. Rock Mech. Rock Eng. 2019, 52, 1265–1274. [Google Scholar] [CrossRef]
- Yu, X.; Song, W.; Tan, Y.; Kemeny, J.; Wang, J. Energy dissipation and 3d fracturing of Backfill-encased-rock under triaxial compression. Constr. Build. Mater. 2022, 341, 127877. [Google Scholar] [CrossRef]
- Peng, K.; Wang, Y.; Zou, Q.; Cheng, Y.; Song, X. Experimental study of energy dissipation characteristics and crack coalescence modes of cracked sandstone under different cyclic loading paths. Bull. Eng. Geol. Environ. 2021, 80, 5881–5895. [Google Scholar] [CrossRef]
- Shi, Z.; Li, J.; Wang, J.; Chen, J.; Lin, H.; Cao, P. Experimental and numerical study on fracture characteristics and constitutive model of sandstone under freeze-thaw-fatigue. Int. J. Fatigue 2023, 166, 107236. [Google Scholar] [CrossRef]
- Meng, Q.; Zhang, M.; Han, L.; Pu, H.; Nie, T. Effects of acoustic emission and energy evolution of rock specimens under the uniaxial cyclic loading and unloading compression. Rock Mech. Rock Eng. 2016, 49, 3873–3886. [Google Scholar] [CrossRef]
- Shi, Z.; Li, J.; Wang, J. Research on the fracture mode and damage evolution model of sandstone containing pre-existing crack under different stress paths. Eng. Fract. Mech. 2022, 264, 108299. [Google Scholar] [CrossRef]
- Liu, X.; Xu, B.; Lin, G.; Huang, J.; Zhou, X.; Xie, Y.; Wang, J.; Xiong, F. Experimental and numerical investigations on the macro-meso shear mechanical behaviors of artificial rock discontinuities with multiscale asperities. Rock Mech. Rock Eng. 2021, 54, 4079–4098. [Google Scholar] [CrossRef]
- Li, Y.; Zhao, T.; Li, Y.; Chen, Y. A five-parameter constitutive model for hysteresis shearing and energy dissipation of rock joints. Int. J. Min. Sci. Technol. 2022, 32, 737–746. [Google Scholar] [CrossRef]
- Zhang, S.; Lin, H.; Chen, Y.; Wang, Y.; Zhao, Y. Acoustic emission and failure characteristics of cracked rock under freezing-thawing and shearing. Theor. Appl. Fract. Mech. 2022, 121, 103537. [Google Scholar] [CrossRef]
- Han, W.; Hu, K.; Shi, Q.; Zhu, F. Damage evolution analysis of open-hole tensile laminated composites using a progress damage model verified by AE and DIC. Compos. Struct. 2020, 247, 112452. [Google Scholar] [CrossRef]
- Dong, L.; Zhang, Y.; Bi, S.; Ma, J.; Yan, Y.; Cao, H. Uncertainty investigation for the classification of rock micro-fracture types using acoustic emission parameters. Int. J. Rock Mech. Min. Sci. 2023, 162, 105292. [Google Scholar] [CrossRef]
- Gan, Y.X.; Wu, S.C.; Ren, Y.; Zhang, G. Evaluation indexes of granite splitting failure based on RA and AF of AE parameters. Rock Soil Mech. 2020, 41, 2324–2332. [Google Scholar]
- Chmel, A. A comparative acoustic emission study of compression and impact fracture in granite. Int. J. Rock Mech. Min. Sci. 2013, 64, 56–59. [Google Scholar] [CrossRef]
- Chmel, A.; Shcherbakov, I. Temperature dependence of acoustic emission from impact fractured granites. Tectonophysics 2014, 632, 218–223. [Google Scholar] [CrossRef]
- Guo, T.; Liu, K.; Li, X.; Wu, Y.; Yang, J. Effects of thermal treatment on the fracture behavior of rock-concrete bi-material specimens containing an interface crack. Theor. Appl. Fract. Mech. 2023, 127, 104071. [Google Scholar] [CrossRef]
- Guo, Y.; Chen, X.; Wang, Z.; Ning, Y.; Bai, L. Identification of mixed mode damage types on rock-concrete interface under cyclic loading. Int. J. Fatigue 2023, 166, 107273. [Google Scholar] [CrossRef]
- Yu, Y.; Liu, J.; Yang, Y.; Song, Z.; Zhao, S. Mechanical properties and damage constitutive model of coal with different water content based on energy principle. Coal Sci. Technol. 2024, 52, 67–80. [Google Scholar] [CrossRef]
- Meng, F.; Zhou, H.; Wang, Z.; Zhang, L.; Kong, L.; Li, S.; Zhang, C. Experimental study on the prediction of rockburst hazards induced by dynamic structural plane shearing in deeply buried hard rock tunnels. Int. J. Rock Mech. Min. Sci. 2016, 86, 210–223. [Google Scholar] [CrossRef]
- Xia, C.C.; Tang, Z.C.; Xiao, W.M.; Song, Y.L. New peak shear strength criterion of rock joints based on quantified surface description. Rock Mech. Rock Eng. 2014, 47, 387–400. [Google Scholar] [CrossRef]
- Liu, H.F.; Zhu, C.Q.; Wang, R.; Wang, X.Z.; Cui, X.; Wang, T.M. Shear test on reef limestone-concrete bonding interface. Rock Soil Mech. 2020, 41, 1540–1548. [Google Scholar]
- Xie, H.; Li, L.; Ju, Y.; Peng, R.; Yang, Y. Energy analysis for damage and catastrophic failure of rocks. Sci. China Technol. Sci. 2011, 54, 199–209. [Google Scholar] [CrossRef]
- Chen, Z.Y. Shear Heterogeneous Damage Evaluation and Energy Evolution Characteristics of Rock Joint; Chang’an University: Xi’an, China, 2023. (In Chinese) [Google Scholar]
- Lan, H.; Zhang, Y.; Macciotta, R.; Li, L.; Wu, Y.; Bao, H.; Peng, J. The role of discontinuities in the susceptibility, development, and runout of rock avalanches: A review. Landslides 2022, 19, 1391–1404. [Google Scholar] [CrossRef]
- Taylor, S.E.; Brodsky, E.E. Energy partitioning in granular flow depends on mineralogy via nanoscale plastic work. J. Geophys. Res. Solid Earth 2019, 124, 6397–6408. [Google Scholar] [CrossRef]
- Kivi, I.R.; Ameri, M.; Molladavoodi, H. Shale brittleness evaluation based on energy balance analysis of stress-strain curves. J. Pet. Sci. Eng. 2018, 167, 1–19. [Google Scholar] [CrossRef]
- Wang, X.; Xu, J.; Yue, Q.; Liu, X. Tracing fracture damage evolution and identifying damage patterns in cast steel using advanced acoustic emission analysis. Eng. Fract. Mech. 2023, 293, 109680. [Google Scholar] [CrossRef]
- Dong, L.J.; Yan, X.H.; Wang, J.; Tang, Z. Case study of microseismic tomography and multi-parameter characteristics under mining disturbances. J. Cent. South Univ. 2023, 30, 2252–2265. [Google Scholar] [CrossRef]
- Gutenberg, B.; Richter, C.F. Magnitude and energy of earthquakes. Science 1936, 83, 183–185. [Google Scholar] [CrossRef] [PubMed]
- Sagasta, F.; Zitto, M.E.; Piotrkowski, R.; Benavent-Climent, A.; Suarez, E.; Gallego, A. Acoustic emission energy b-value for local damage evaluation in reinforced concrete structures subjected to seismic loadings. Mech. Syst. Signal Process. 2018, 102, 262–277. [Google Scholar] [CrossRef]
- Dong, L.; Zhang, Y.; Wang, L.; Wang, L.; Zhang, S. Temperature dependence of mechanical properties and damage evolution of hot dry rocks under rapid cooling. J. Rock Mech. Geotech. Eng. 2024, 16, 645–660. [Google Scholar] [CrossRef]
- Shi, Z.; Li, J.; Wang, J. Effect of creep load on fatigue behavior and acoustic emission characteristics of sandstone containing pre-existing crack during fatigue loading. Theor. Appl. Fract. Mech. 2022, 119, 103296. [Google Scholar] [CrossRef]
- Dong, L.J.; Zhang, Y.H.; Sun, D.Y.; Chen, Y.; Tang, Z. Stage characteristics of acoustic emission and identification of unstable crack state for granite fractures. Chin. J. Rock Mech. Rock Eng. 2022, 41, 120–131. [Google Scholar]
- Shi, Z.; Li, J.; Wang, J. Energy evolution and fracture behavior of sandstone under the coupling action of freeze–thaw cycles and fatigue load. Rock Mech. Rock Eng. 2023, 56, 1321–1341. [Google Scholar] [CrossRef]
- Ju, S.; Li, D.; Jia, J. Machine-learning-based methods for crack classification using acoustic emission technique. Mech. Syst. Signal Process. 2022, 178, 109253. [Google Scholar] [CrossRef]
- Zhang, Z.H.; Deng, J.H. A new method for determining the crack classification criterion in acoustic emission parameter analysis. Int. J. Rock Mech. Min. Sci. 2020, 130, 104323. [Google Scholar] [CrossRef]
- Zhu, J.; Deng, J.; Chen, F.; Wang, F. Failure analysis of water-bearing rock under direct tension using acoustic emission. Eng. Geol. 2022, 299, 106541. [Google Scholar] [CrossRef]


| Ingredient | Ratio (kg/m3) |
|---|---|
| Cement | 461 |
| Water | 175 |
| Sand | 512 |
| Coarse aggregate | 1252 |
| (MPa) | (GPa) | (MPa) | (mm) | (MPa) |
|---|---|---|---|---|
| 0.2 | 0.198 | 1.829 | 1.178 | 0.578 |
| 0.4 | 0.238 | 2.054 | 1.441 | 1.059 |
| 0.6 | 0.306 | 2.302 | 1.794 | 1.484 |
| 0.8 | 0.310 | 2.457 | 2.160 | 1.756 |
| (MPa) | (kJ/m3) | (kJ/m3) | (kJ/m3) | (kJ/m3) |
|---|---|---|---|---|
| 0.2 | 14.447 | 13.576 | 8.442 | 0.842 |
| 0.4 | 18.004 | 13.752 | 8.653 | 2.357 |
| 0.6 | 18.661 | 14.701 | 8.872 | 3.599 |
| 0.8 | 18.560 | 12.668 | 9.723 | 4.965 |
| Normal Stress | Different Phases of Strain Evolution | Legend | |||
|---|---|---|---|---|---|
| I | II | III | IV | ||
| 0.2 MPa |  |  | 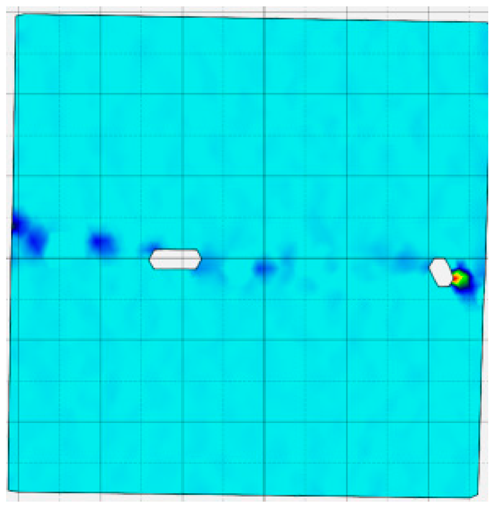 | 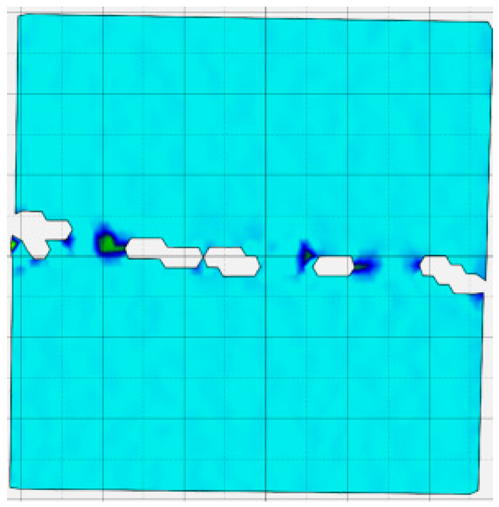 | 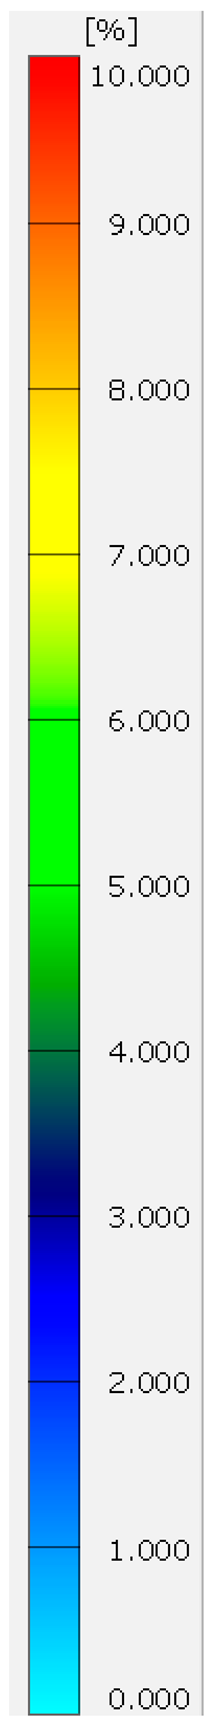 |
| 0.4 MPa |  | 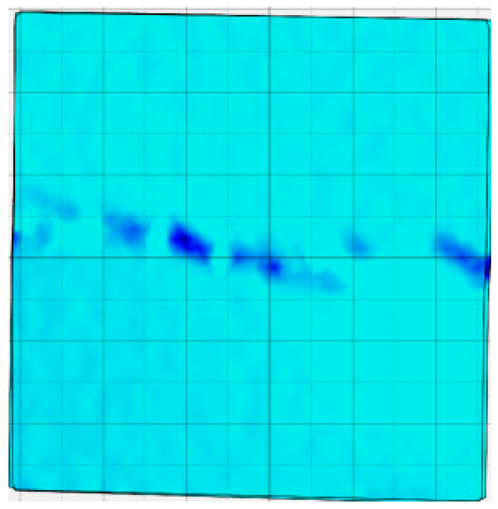 | 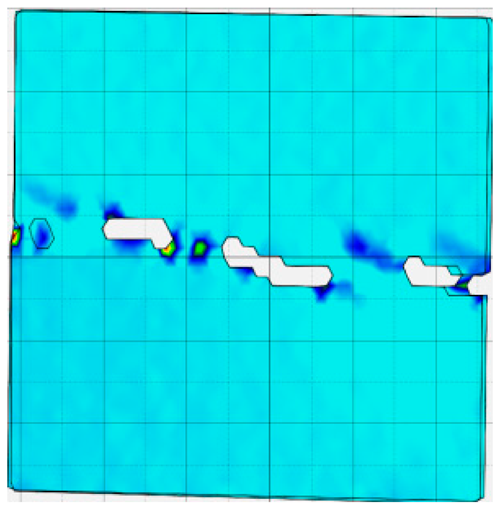 | 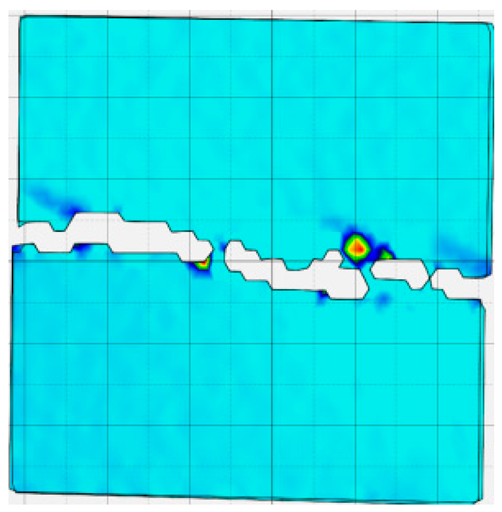 | |
| 0.6 MPa | 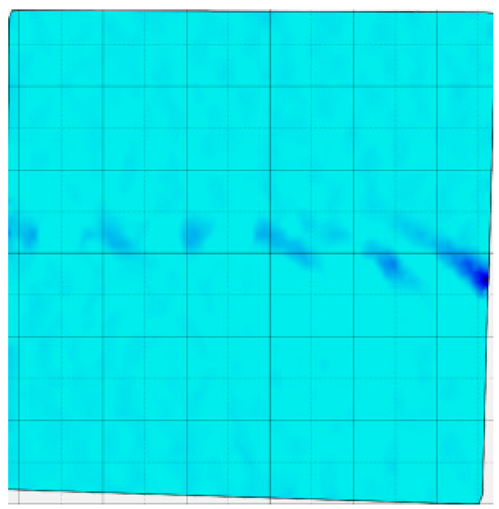 |  |  |  | |
| 0.8 MPa |  | 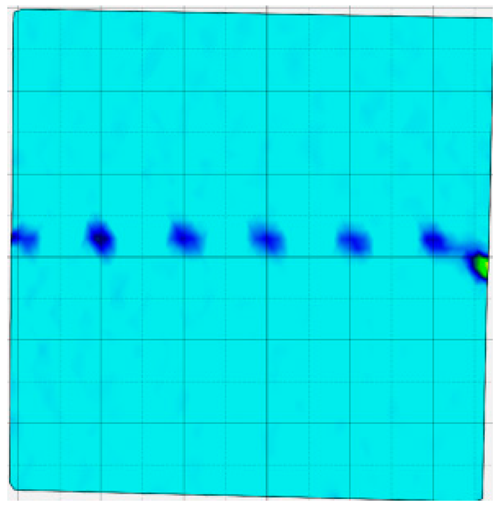 | 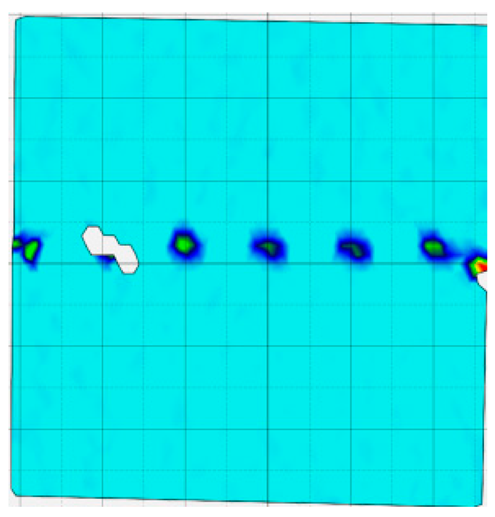 | 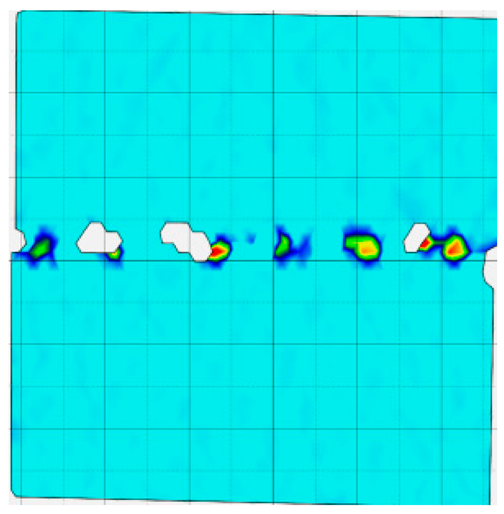 | |
Disclaimer/Publisher’s Note: The statements, opinions and data contained in all publications are solely those of the individual author(s) and contributor(s) and not of MDPI and/or the editor(s). MDPI and/or the editor(s) disclaim responsibility for any injury to people or property resulting from any ideas, methods, instructions or products referred to in the content. |
© 2025 by the authors. Licensee MDPI, Basel, Switzerland. This article is an open access article distributed under the terms and conditions of the Creative Commons Attribution (CC BY) license (https://creativecommons.org/licenses/by/4.0/).
Share and Cite
Liu, T.; Tang, M.; Cao, P.; Cui, M.; Dong, L. Shear Energy Evolution and Fracture Behavior of Rock–Concrete Interfaces Under Different Stress-Level Conditions. Materials 2025, 18, 795. https://doi.org/10.3390/ma18040795
Liu T, Tang M, Cao P, Cui M, Dong L. Shear Energy Evolution and Fracture Behavior of Rock–Concrete Interfaces Under Different Stress-Level Conditions. Materials. 2025; 18(4):795. https://doi.org/10.3390/ma18040795
Chicago/Turabian StyleLiu, Taoying, Min Tang, Ping Cao, Mengyuan Cui, and Longjun Dong. 2025. "Shear Energy Evolution and Fracture Behavior of Rock–Concrete Interfaces Under Different Stress-Level Conditions" Materials 18, no. 4: 795. https://doi.org/10.3390/ma18040795
APA StyleLiu, T., Tang, M., Cao, P., Cui, M., & Dong, L. (2025). Shear Energy Evolution and Fracture Behavior of Rock–Concrete Interfaces Under Different Stress-Level Conditions. Materials, 18(4), 795. https://doi.org/10.3390/ma18040795