
Mechanical Model of Tensile Loading of Geotechnical Reinforcement Materials


Abstract
1. Introduction
2. Materials and Methods
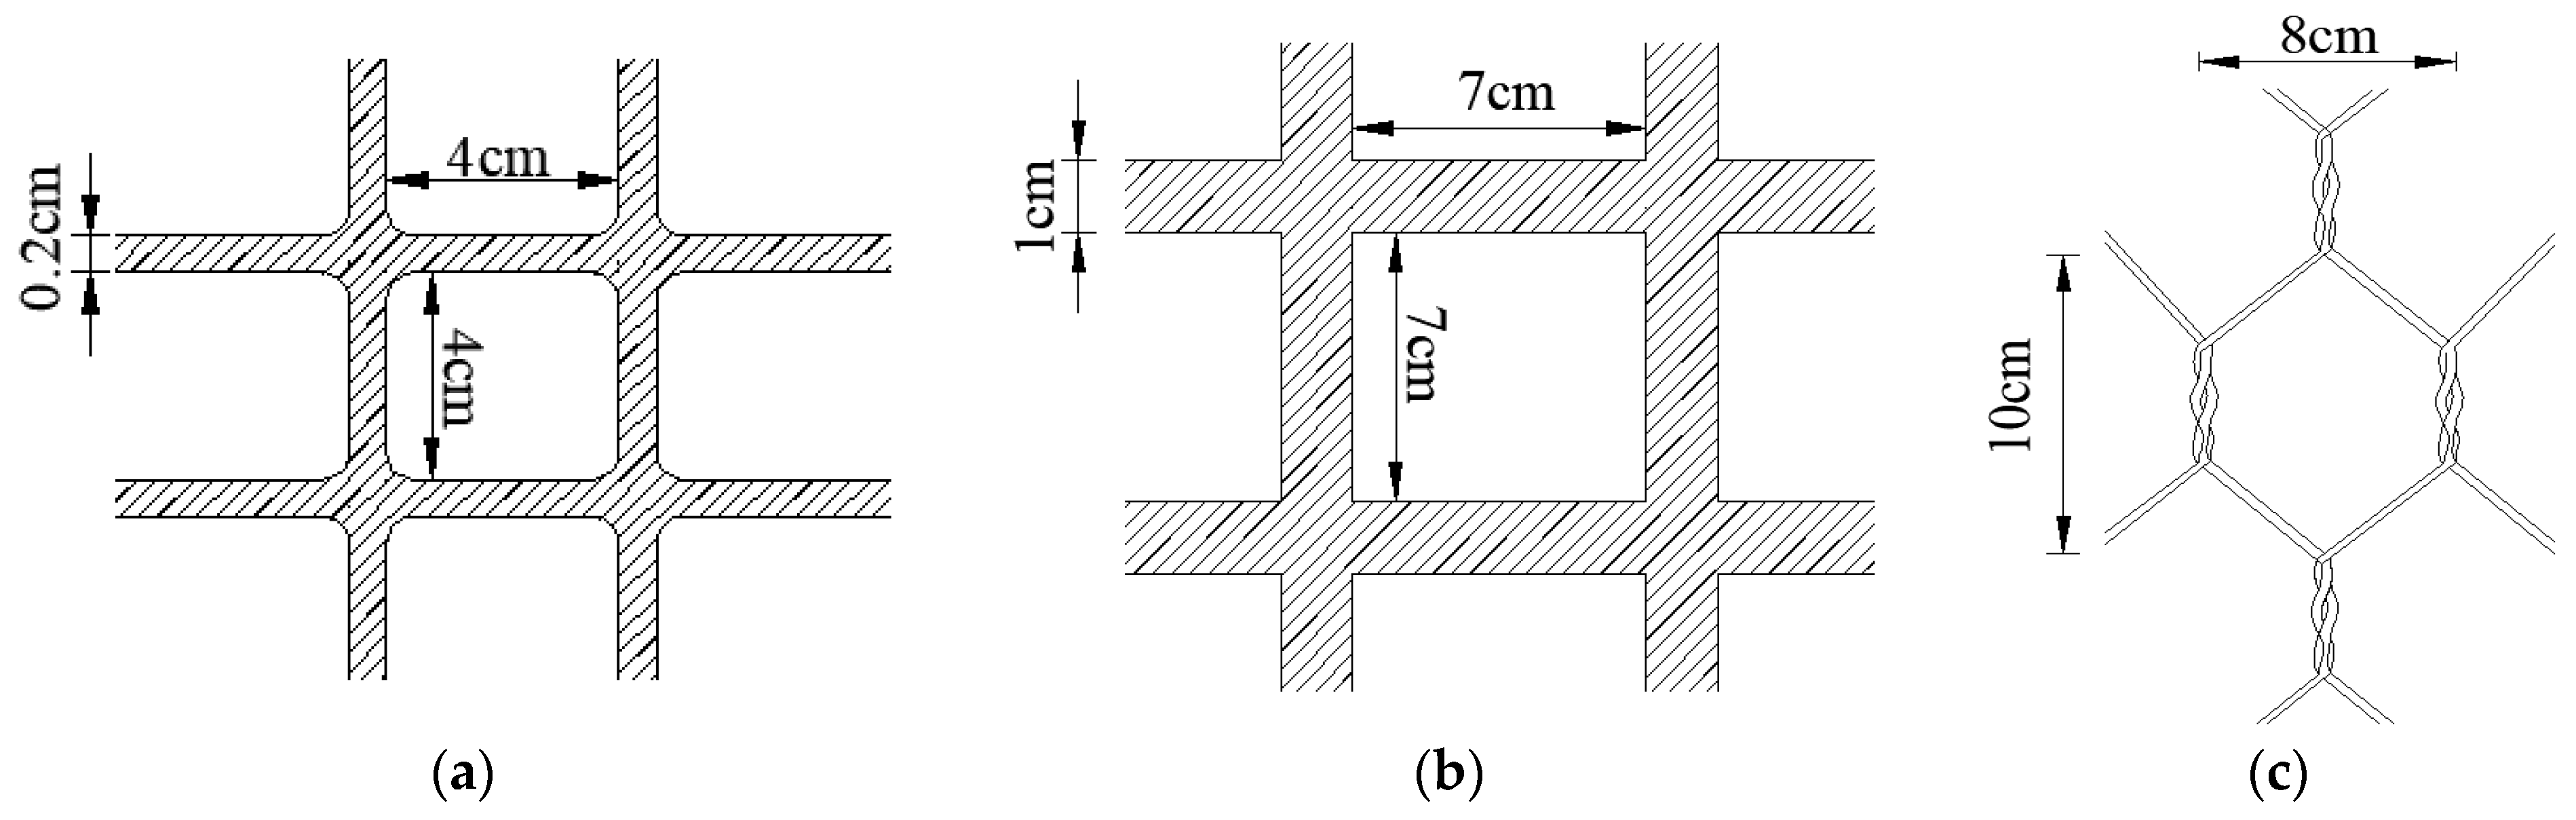
2.1. Materials
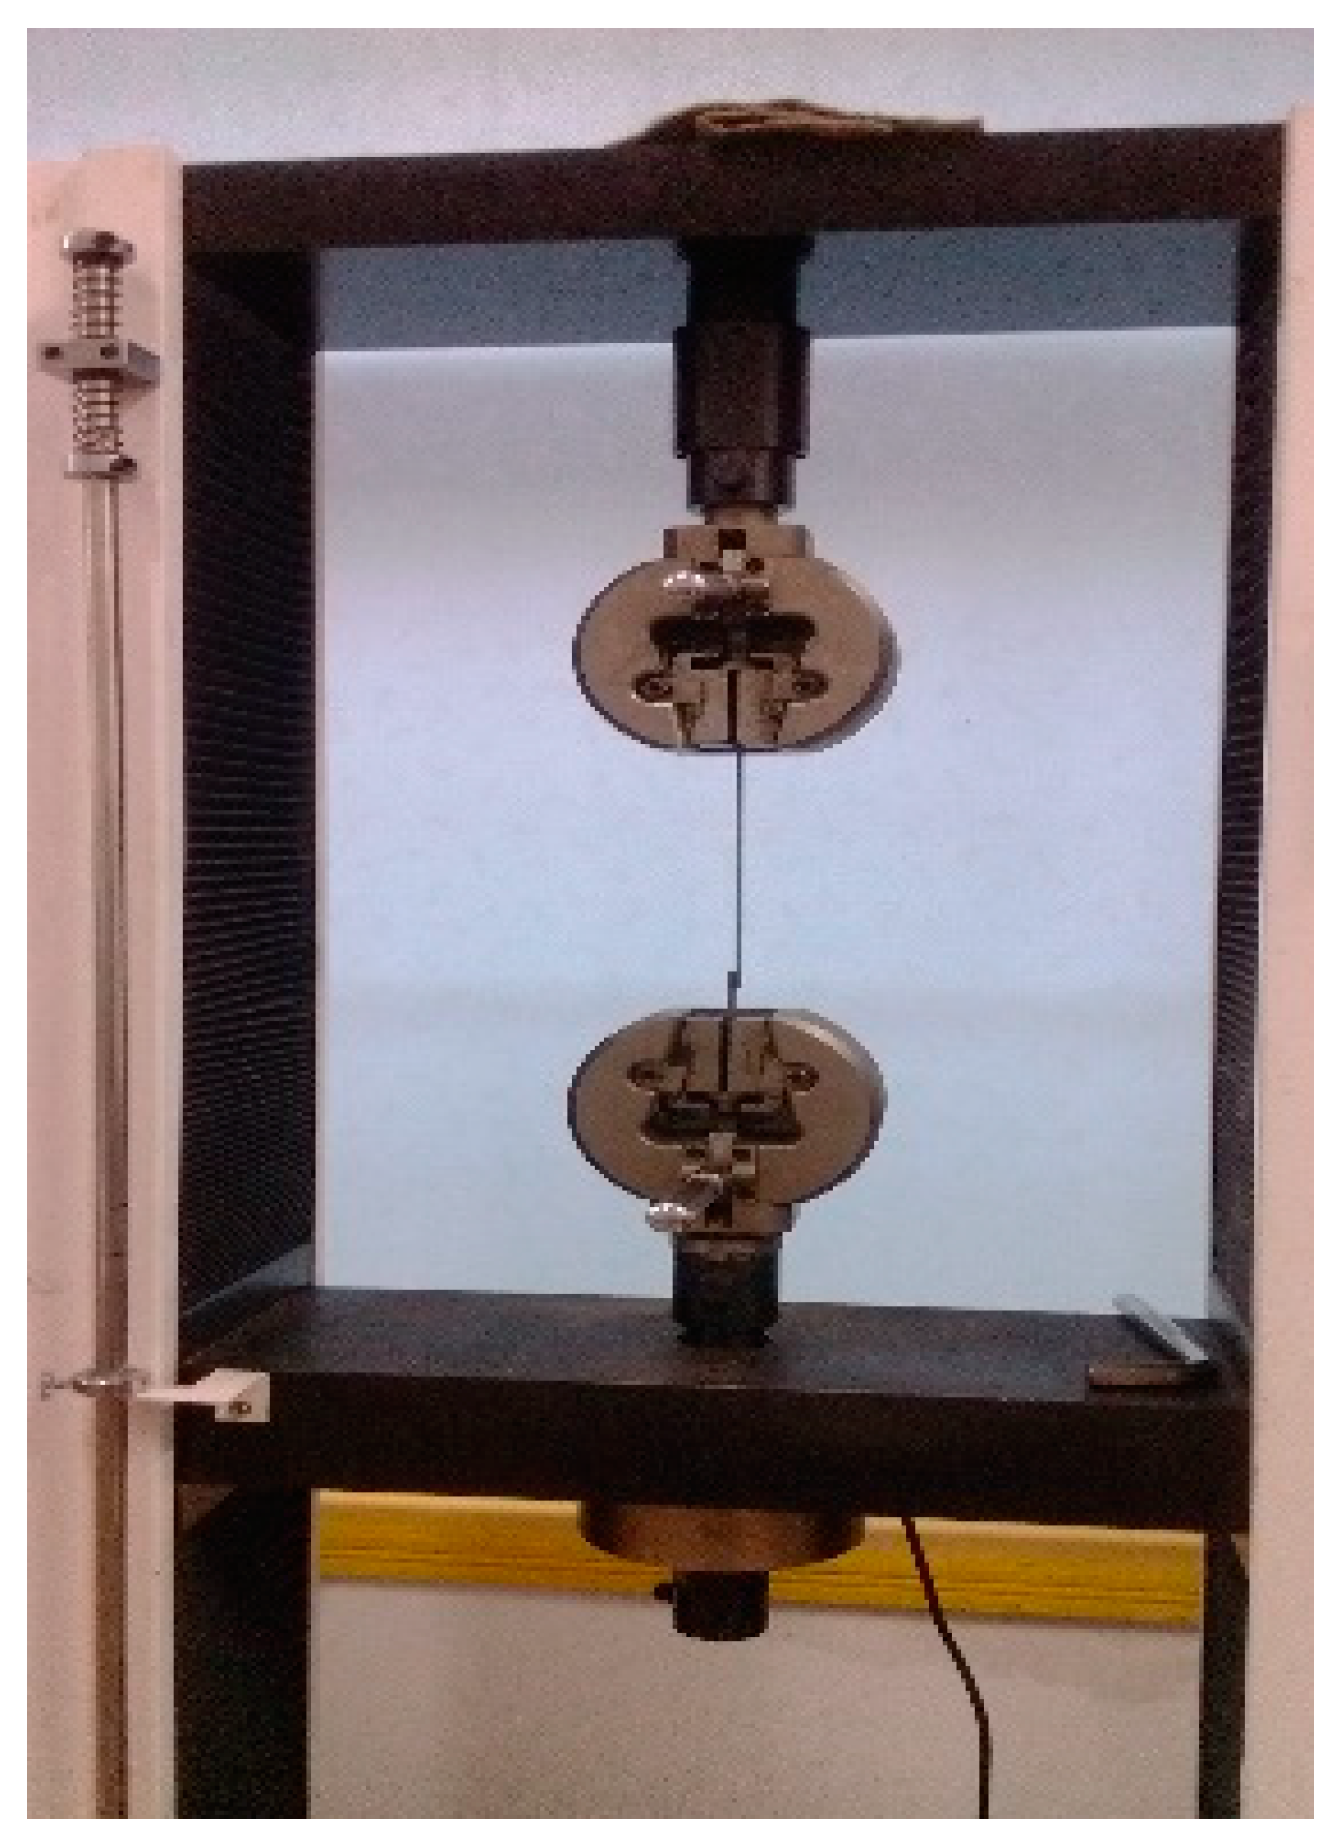
2.2. Methods
3. Results
3.1. Reinforcement Rib Results
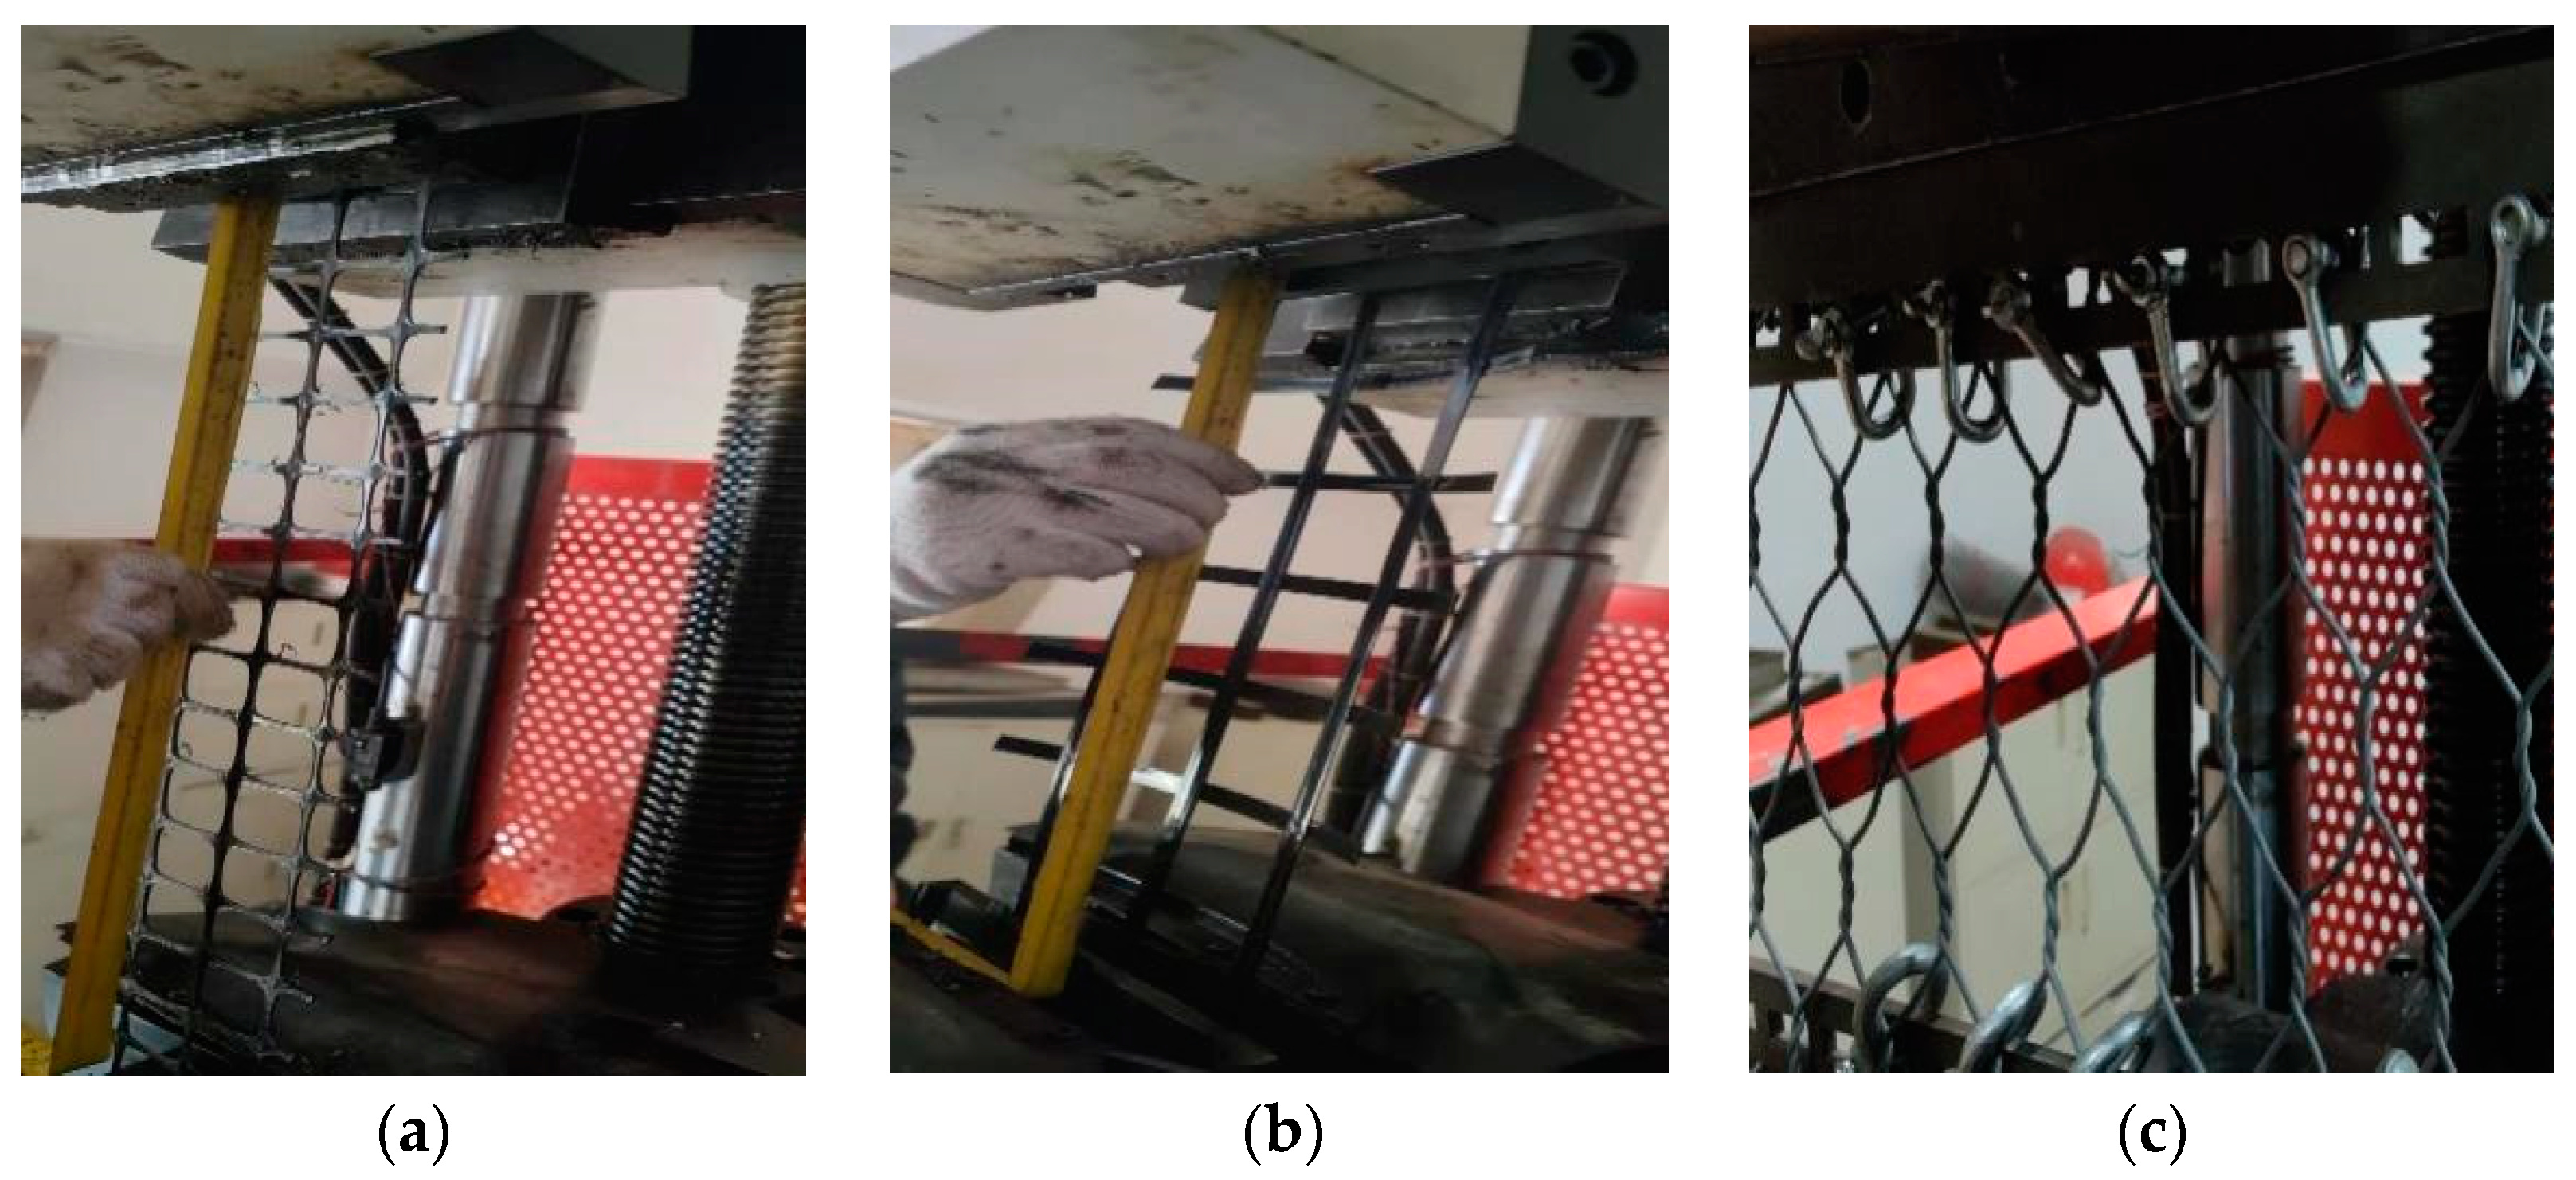
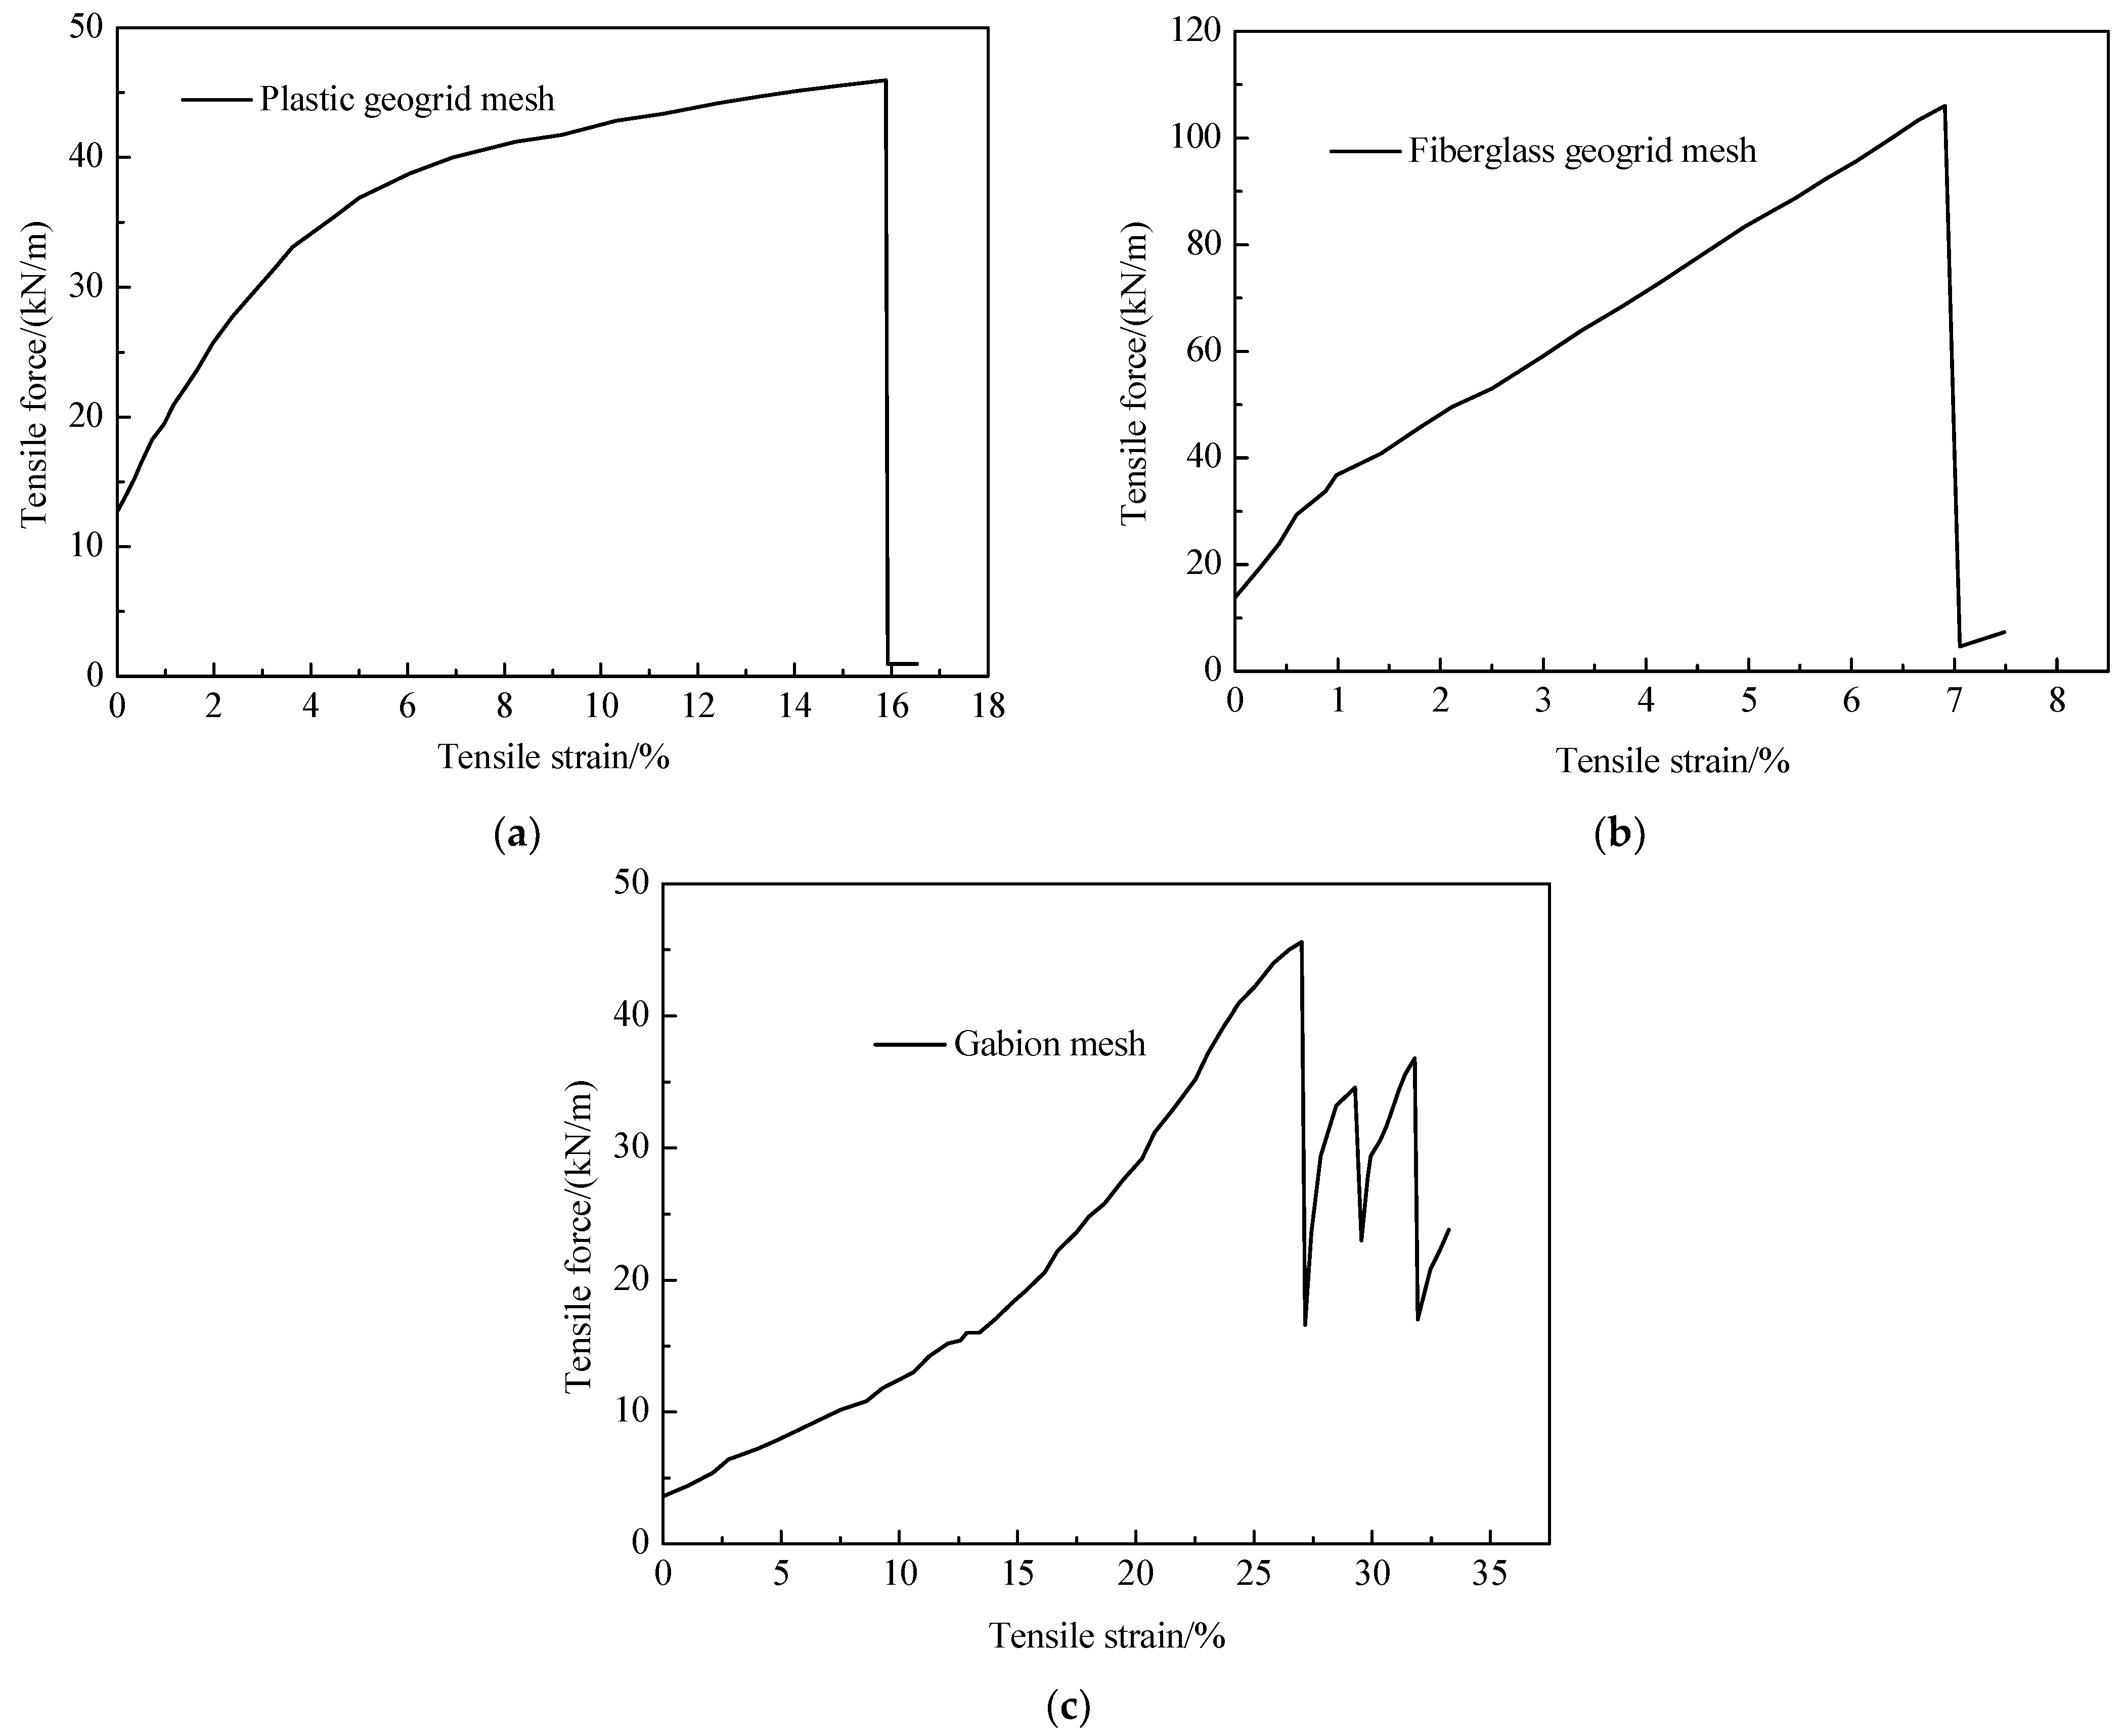
3.2. Reinforcement Mesh Results
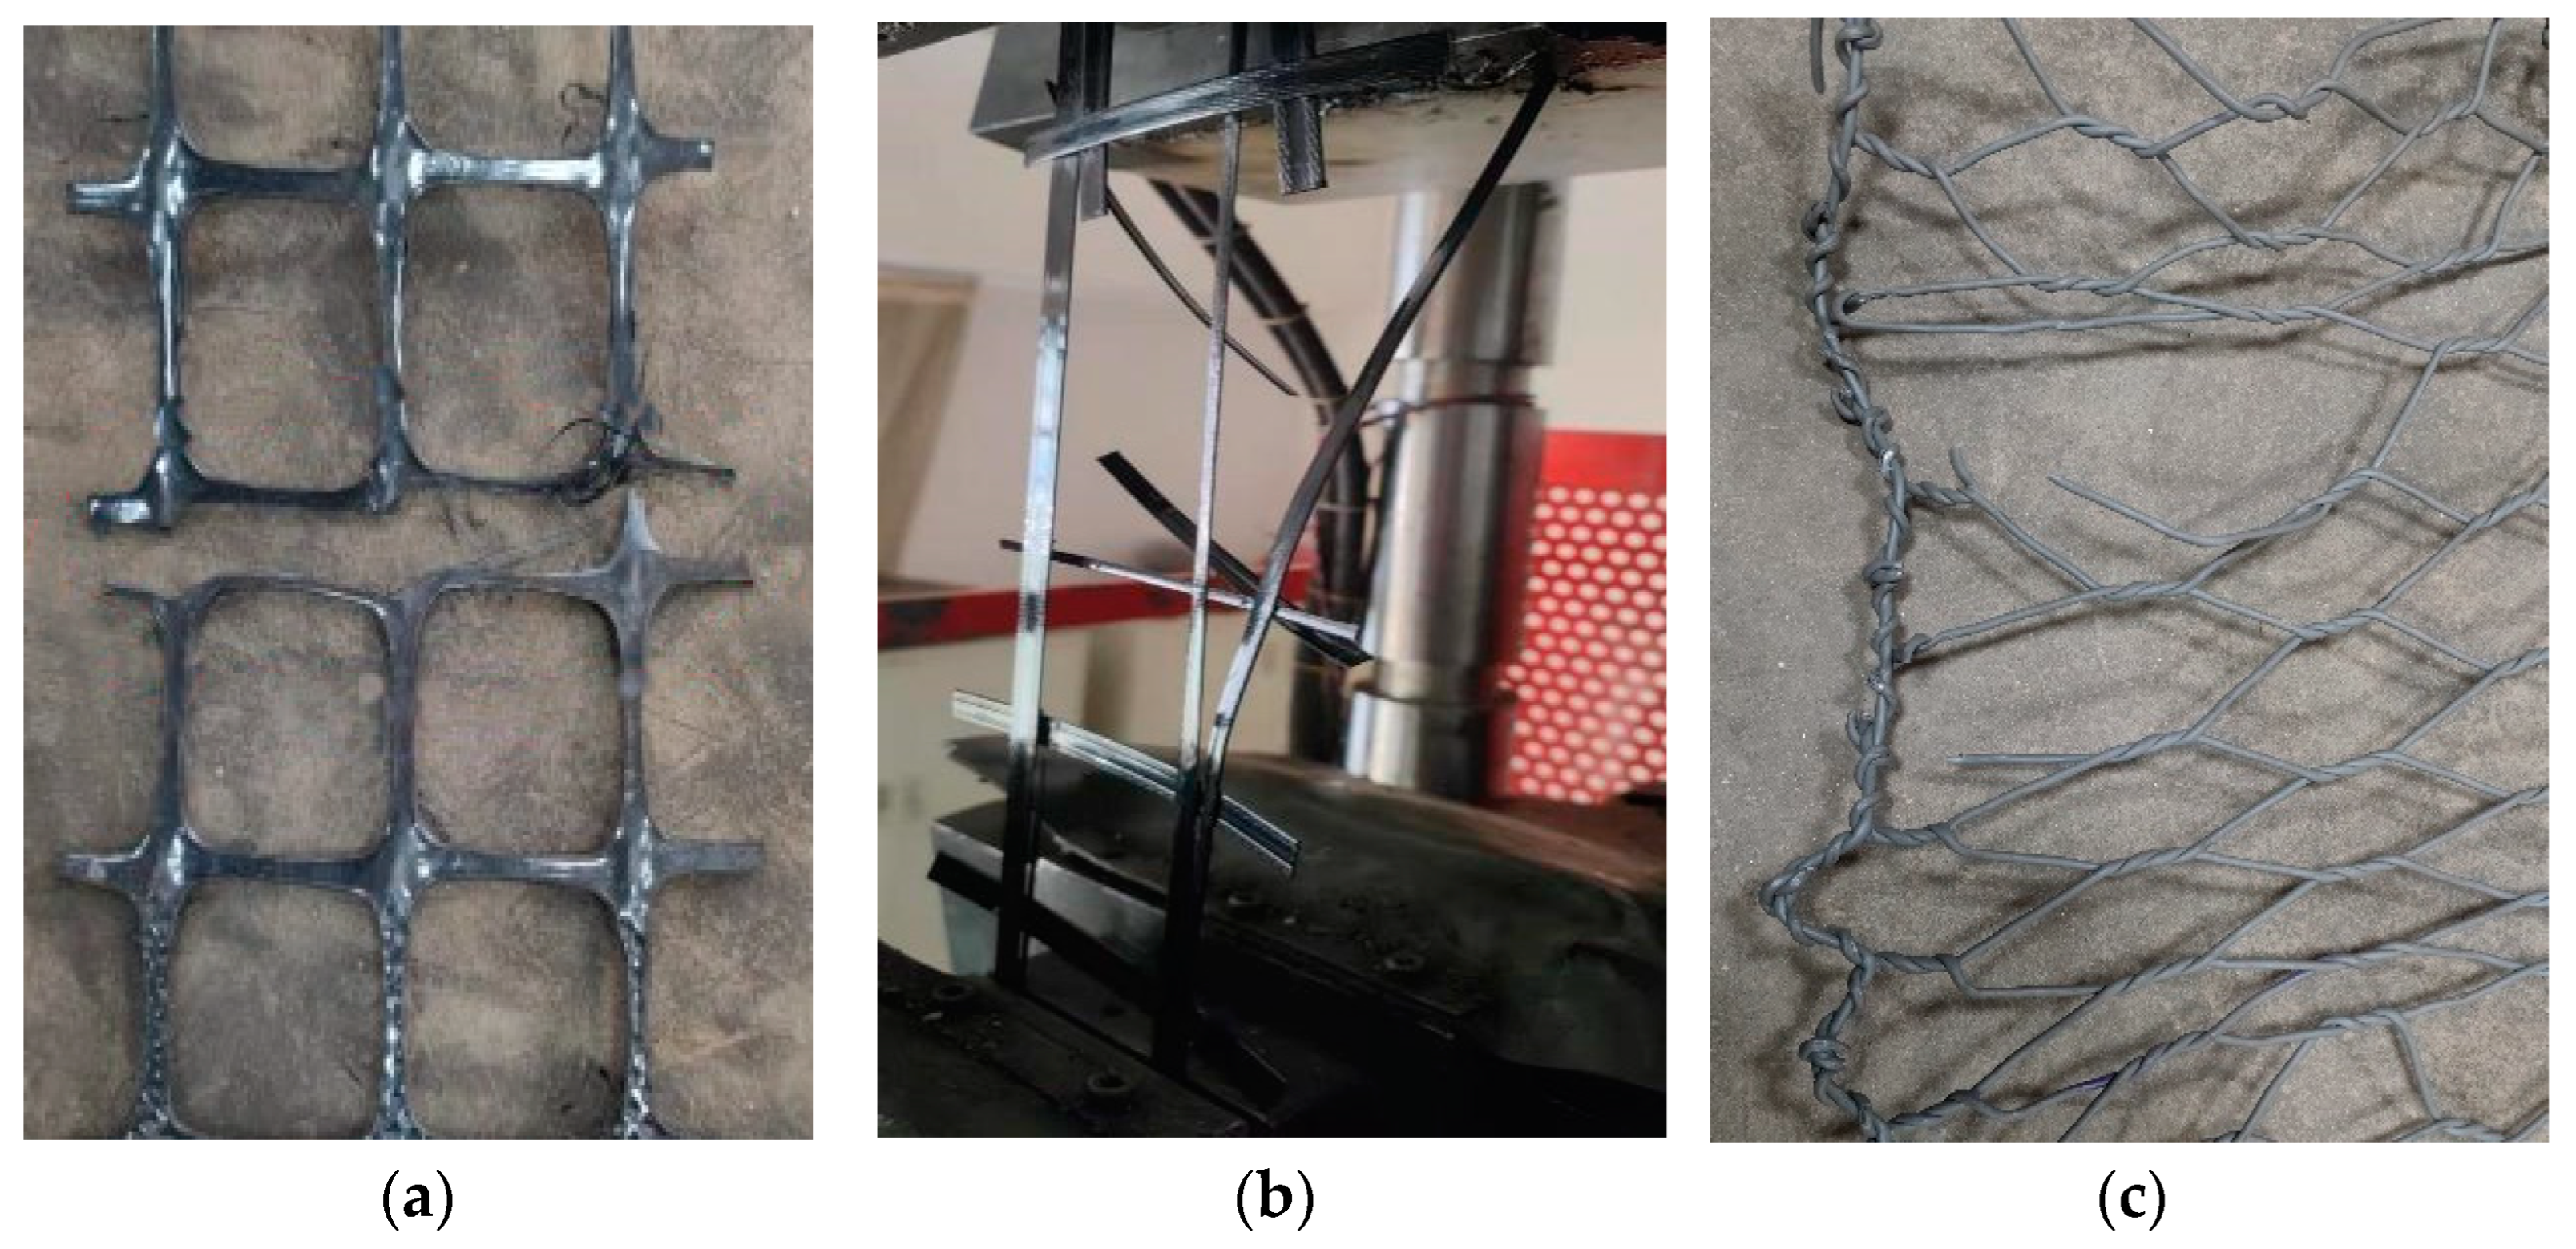
3.3. Failure Model of Reinforcement Materials
4. Tensile Mechanical Model
4.1. Model Overview
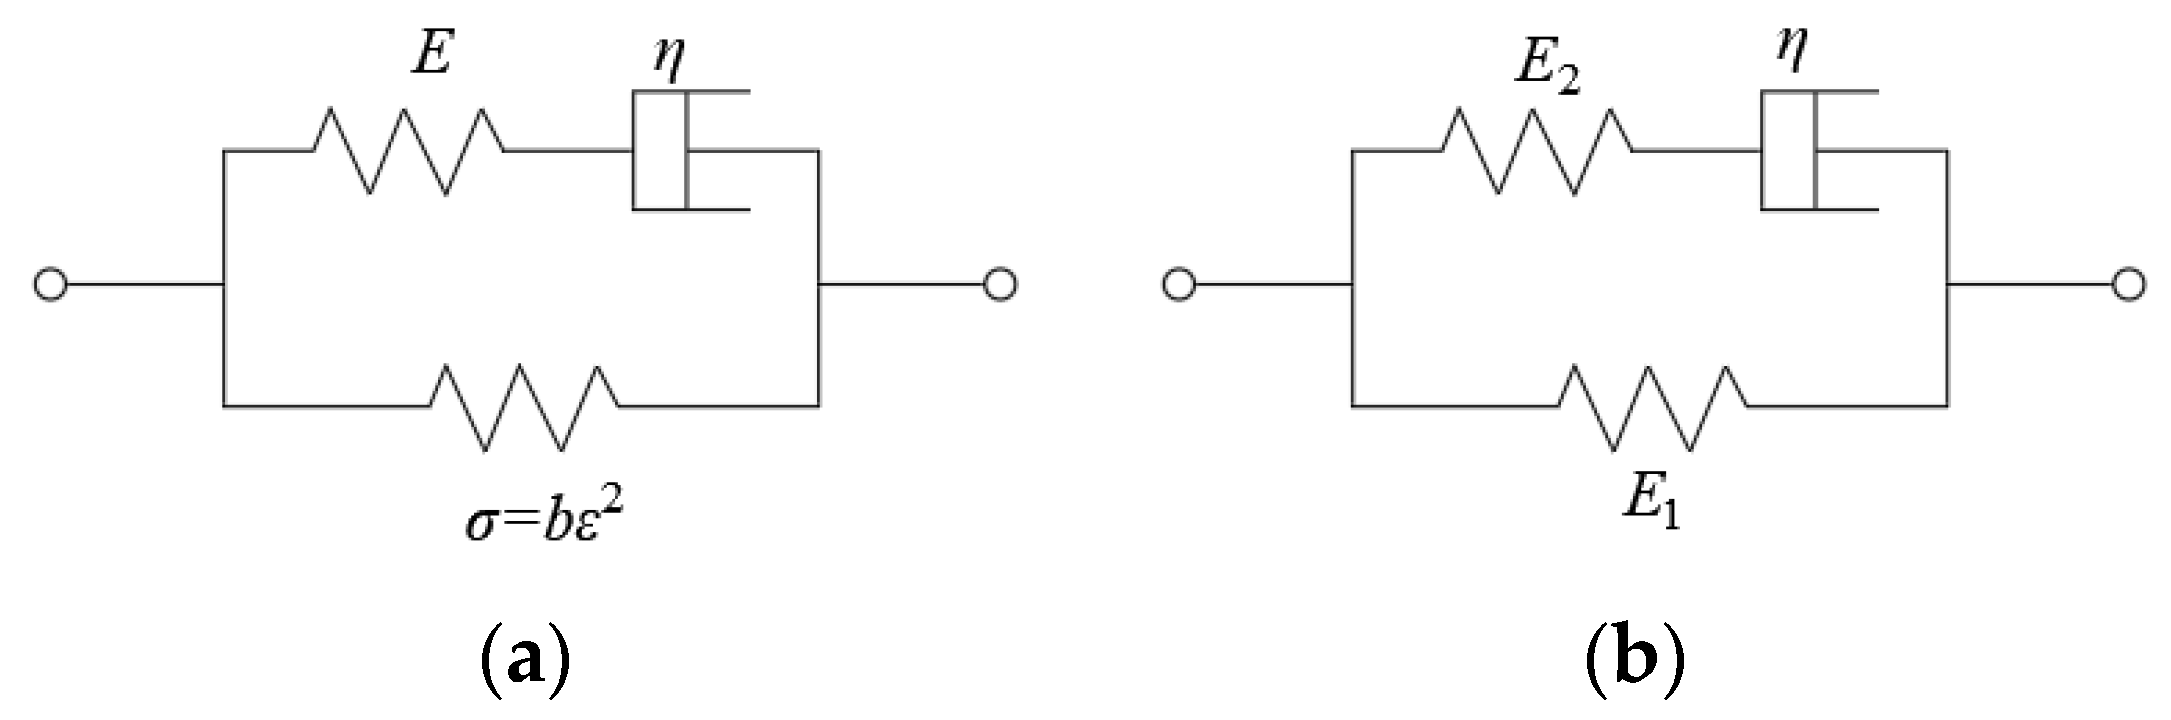
4.1.1. Linear and Nonlinear Three-Element Model
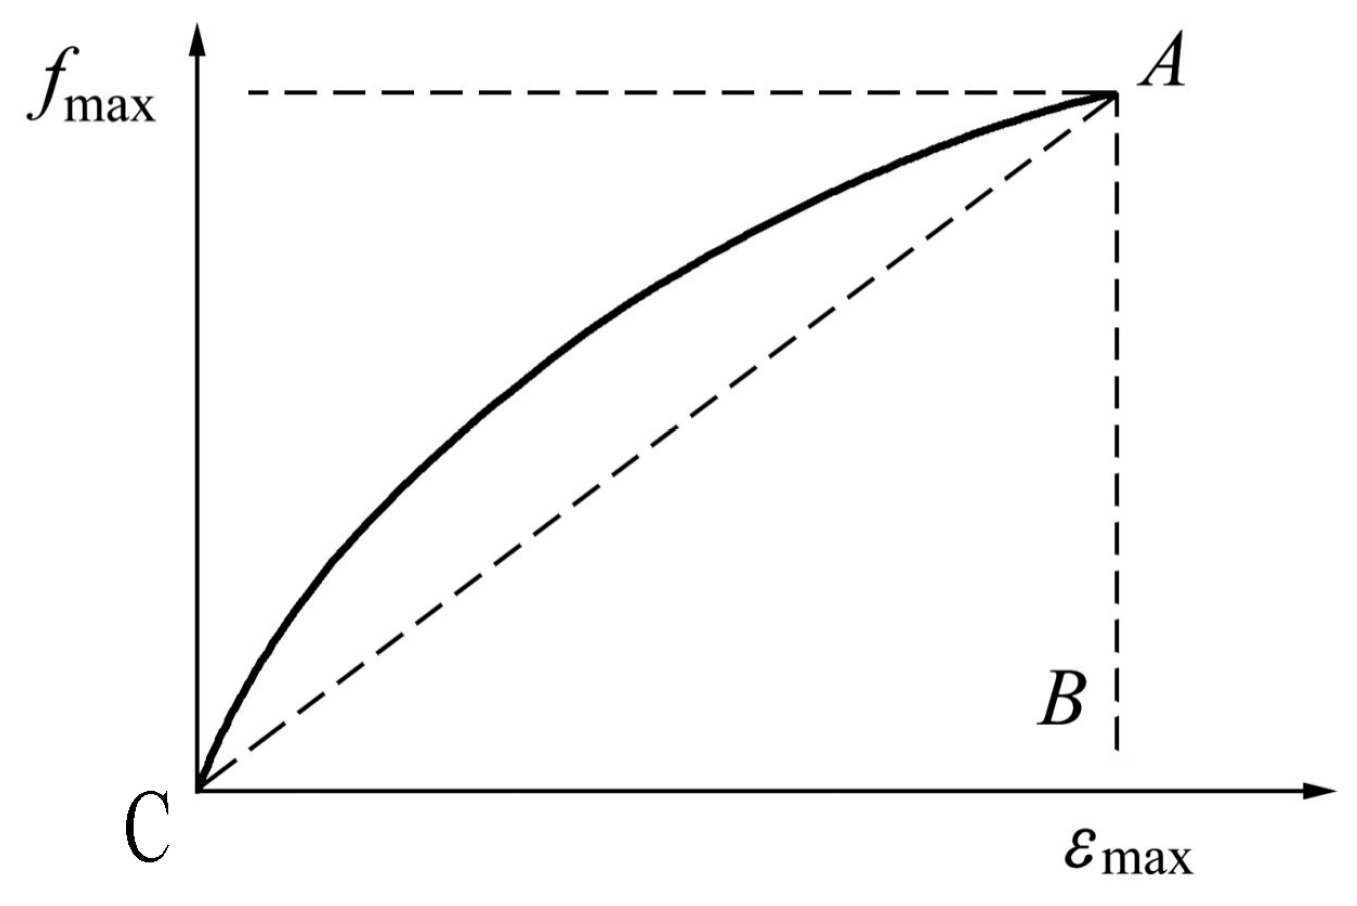
4.1.2. Improved Kawabata Model
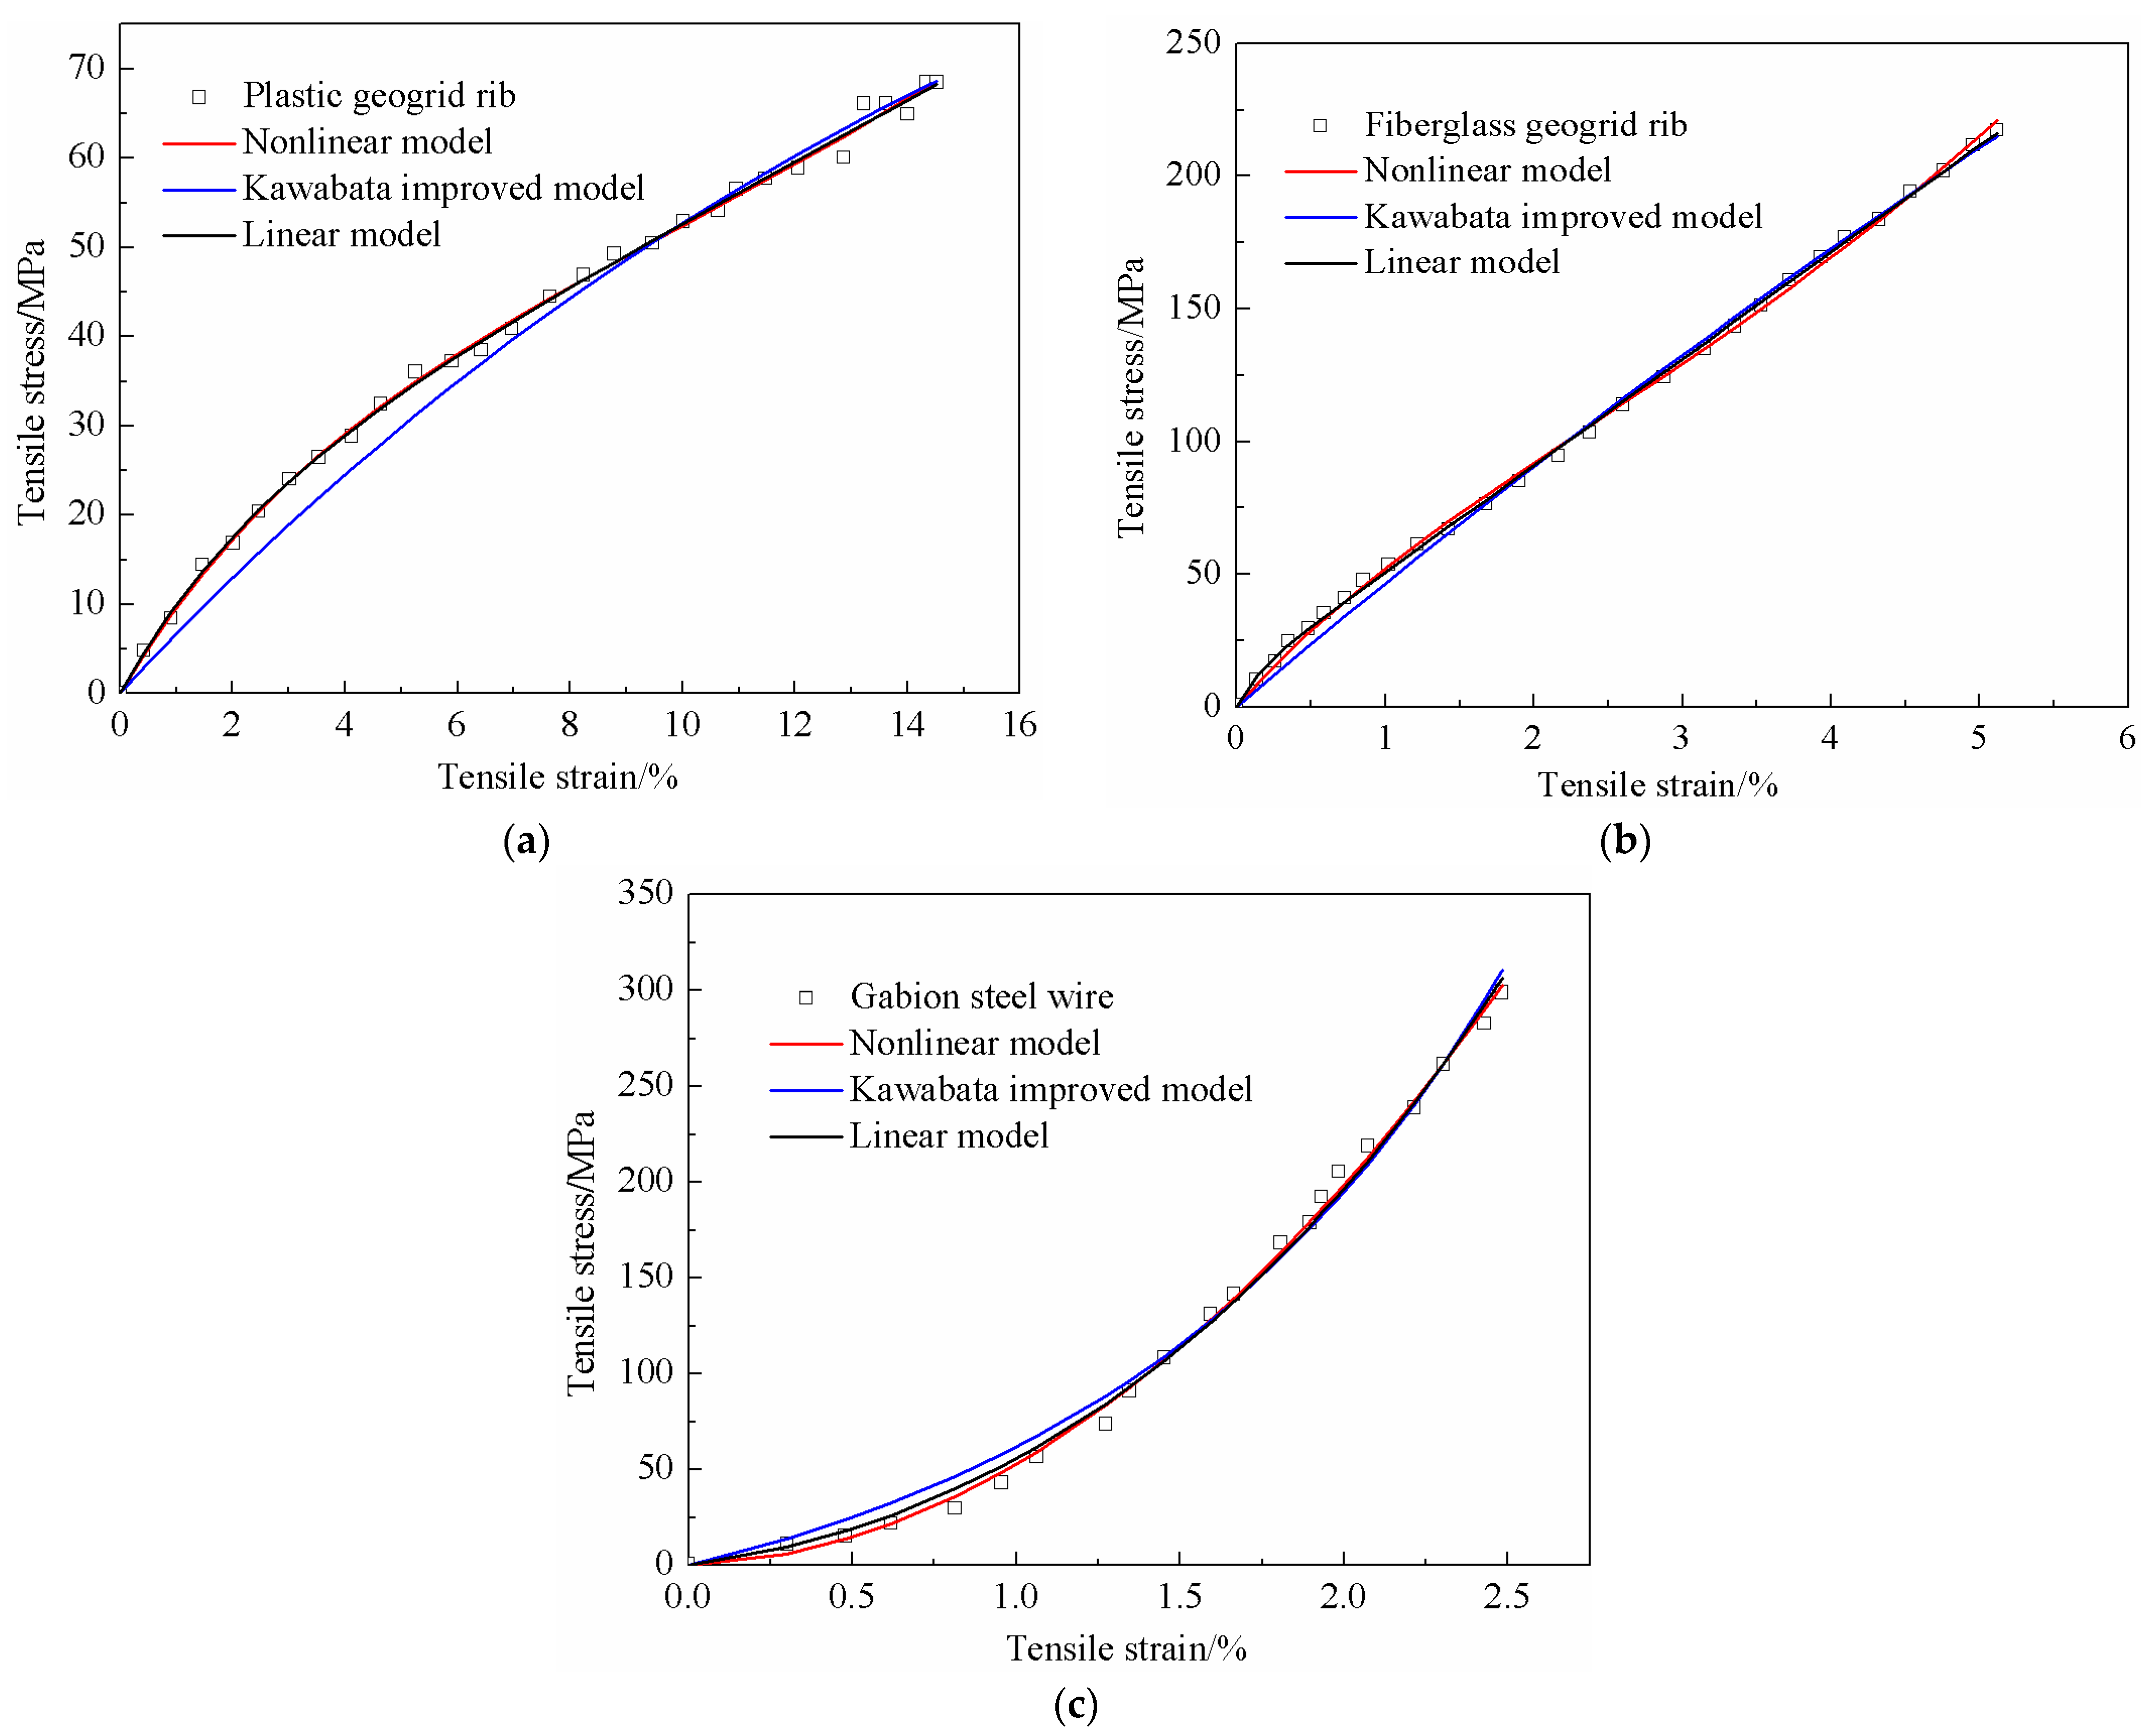
4.2. Model Simulation and Analysis
5. Discussion
6. Conclusions
Author Contributions
Funding
Institutional Review Board Statement
Informed Consent Statement
Data Availability Statement
Conflicts of Interest
References
- Lin, Y.; Zhang, Z.; Zhou, Y.; Duan, J.; Yang, G. Investigation on lateral pressure on a sheet-pile wall with EPS layer supporting an expansive soil slope. Case Stud. Constr. Mater. 2024, 21, e03945. [Google Scholar] [CrossRef]
- Lin, Y.; Lu, L.; Xing, H.; Ning, X.; Li, L. Upper bound solution on seismic anchor force and earth pressure of a combined retaining structure. Geomech. Eng. 2024, 39, 171–179. [Google Scholar]
- Duan, J.; Yang, G.; Lin, Y.; Cheng, X.; Dai, Z. Experimental investigation of a reinforced soil retaining wall with a flexible geogrid-wrapped ecological bag facing. Geotext. Geomembr. 2021, 49, 19–31. [Google Scholar] [CrossRef]
- Lin, Y.; Liu, S.; He, B.; Li, L.; Qiao, L. Mechanical behavior of geogrid flexible reinforced soil wall subjected to dynamic load. Buildings 2024, 14, 1628. [Google Scholar] [CrossRef]
- Gao, W.; Lin, Y.; Wang, X.; Zhou, T.; Zheng, C. Interface mechanics of double-twisted hexagonal gabion mesh with coarse grained filler based on pullout test. Materials 2024, 17, 164. [Google Scholar] [CrossRef]
- Quang, T.S.; Ghazi, H.; De Patrick, B.A. Multiphase approach to the stability analysis of reinforced earth structures accounting for a soil–strip failure condition. Comput. Geotech. 2009, 36, 454–462. [Google Scholar] [CrossRef]
- Zhang, L.; Zhao, M.H.; He, W. Working mechanism of two-direction reinforced composite foundation. J. Cent. South Univ. Technol. 2007, 14, 589–594. [Google Scholar] [CrossRef]
- Zhang, M.X.; Zhou, H.; Javadi, A.A.; Wang, Z.W. Experimental and theoretical investigation of strength of soil reinforced with multi-layer horizontal–vertical orthogonal elements. Geotext. Geomembr. 2008, 26, 1–13. [Google Scholar] [CrossRef]
- Viswanadham, B.V.S.; König, D. Centrifuge modeling of geotextile-reinforced slopes subjected to differential settlements. Geotext. Geomembr. 2009, 27, 77–88. [Google Scholar] [CrossRef]
- Zhang, Z.; Lin, Y.; Zhang, H.; He, B.; Yang, G.; Xu, Y. A field investigation on an expansive soil slope supported by a sheet-pile retaining structure. Struct. Eng. Mech. 2024, 91, 315–324. [Google Scholar]
- Lin, Y.; Lu, L.; Chen, X.; Xue, Y.; Wang, Z. Shaking table experiment on seismic response of a three-stage slope supported by anchoring lattice beam. Soil Dyn. Earthq. Eng. 2024, 187, 109003. [Google Scholar] [CrossRef]
- Lu, L.; Lin, Y.; Guo, D.; Xing, H.; Zhang, Z.; Duan, J. A modified Newmark block method for determining the seismic displacement of a slope reinforced by prestressed anchors. Comput. Geotech. 2023, 162, 105697. [Google Scholar] [CrossRef]
- Lin, Y.; Fang, P.; Wang, X.; Wu, J.; Yang, G. Experimental and numerical study on tensile behavior of double-twisted hexagonal gabion wire mesh. Buildings 2023, 13, 1657. [Google Scholar] [CrossRef]
- Hou, J.P.; Ruiz, C. Measurement of the properties of woven CFRP T300/914 at different strain rates. Compos. Sci. Technol. 2000, 60, 2829–2834. [Google Scholar] [CrossRef]
- Perkins, S.W.; Haselton, H.N. Resilient response of geosynthetics from cyclic and sustained in-air tensile loading. Geosynth. Int. 2019, 26, 428–435. [Google Scholar] [CrossRef]
- Pinho-Lopes, M.; Lopes, M.D. Tensile properties of geosynthetics after installation damage. Environ. Geotech. 2014, 1, 161–178. [Google Scholar] [CrossRef]
- Shinoda, M.; Bathurst, R.J. Lateral and axial deformation of PP, HDPE and PET geogrids under tensile load. Geotext. Geomembr. 2004, 22, 205–222. [Google Scholar] [CrossRef]
- Perkins, S.W. Constitutive modeling of geosynthetics. Geotext. Geomembr. 2000, 18, 273–292. [Google Scholar] [CrossRef]
- Boisse, P.; Gasser, A.; Hivet, G. Analyses of fabric tensile behaviour: Determination of the biaxial tension–strain surfaces and their use in forming simulations. Compos. Part A Appl. Sci. Manuf. 2001, 32, 1395–1414. [Google Scholar] [CrossRef]
- Buet-Gautier, K.; Boisse, P. Experimental analysis and modeling of biaxial mechanical behavior of woven composite reinforcements. Exp. Mech. 2001, 41, 260–269. [Google Scholar] [CrossRef]
- Palmeira, E.M. Bearing force mobilisation in pull-out tests on geogrids. Geotext. Geomembr. 2004, 22, 481–509. [Google Scholar] [CrossRef]
- Wilson, F.R.F.; Koerner, R.M. Finite element modelling of soil-geogrid interaction with application to the behavior of geogrids in a pullout loading condition. Geotext. Geomembr. 1993, 12, 479–501. [Google Scholar] [CrossRef]
- Afzal, A.; Kausar, A.; Siddiq, M. Role of polymeric composite in civil engineering applications: A review. Polym.-Plast. Technol. Mater. 2020, 59, 1023–1040. [Google Scholar] [CrossRef]
- Raman, R.S.; Guo, F.; Al-Saadi, S.; Zhao, X.L.; Jones, R. Understanding fibre-matrix degradation of FRP composites for advanced civil engineering applications: An overview. Corros. Mater. Degrad. 2018, 1, 27–41. [Google Scholar] [CrossRef]
- Benmokrane, B.; Chaallal, O.; Masmoudi, R. Glass fibre reinforced plastic (GFRP) rebars for concrete structures. Constr. Build. Mater. 1995, 9, 353–364. [Google Scholar] [CrossRef]
- Peterson, B.L.; Pangborn, R.N.; Pantano, C.G. Static and high strain rate response of a glass fiber reinforced thermoplastic. J. Compos. Mater. 1991, 25, 887–906. [Google Scholar] [CrossRef]
- Shokrieh, M.M.; Omidi, M.J. Tension behavior of unidirectional glass/epoxy composites under different strain rates. Compos. Struct. 2009, 88, 595–601. [Google Scholar] [CrossRef]
- Carneiro, J.R.; Almeida, F.; Carvalho, F.; Lopes, M. Tensile and Tearing Properties of a Geocomposite Mechanically Damaged by Repeated Loading and Abrasion. Materials 2023, 16, 7047. [Google Scholar] [CrossRef]
- Cen, W.J.; Wang, H.; Li, D.J.; Wen, L.S. Large-strain tensile behaviour of geomembranes with defects using 3D digital image correlation. Geosynth. Int. 2018, 25, 644–655. [Google Scholar] [CrossRef]
- Razzazan, S.; Keshavarz, A.; Mosallanezhad, M. Pullout behavior of polymeric strip in compacted dry granular soil under cyclic tensile load conditions. J. Rock Mech. Geotech. Eng. 2018, 10, 968–976. [Google Scholar] [CrossRef]
- Wesseloo, J.; Visser, A.T.; Rust, E. A mathematical model for the strain-rate dependent stress–strain response of HDPE geomembranes. Geotext. Geomembr. 2004, 22, 273–295. [Google Scholar] [CrossRef]
- Lifshitz, J.M. Impact strength of angle ply fiber reinforced materials. J. Compos. Mater. 1976, 10, 92–101. [Google Scholar] [CrossRef]
- Melin, L.G.; Asp, L.E. Effects of strain rate on transverse tension properties of a carbon/epoxy composite: Studied by moiré photography. Compos. Part A Appl. Sci. Manuf. 1999, 30, 305–316. [Google Scholar] [CrossRef]
- Ochola, R.O.; Marcus, K.; Nurick, G.N.; Franz, T. Mechanical behaviour of glass and carbon fibre reinforced composites at varying strain rates. Compos. Struct. 2004, 63, 455–467. [Google Scholar] [CrossRef]
- Subaida, E.A.; Chandrakaran, S.; Sankar, N. Experimental investigations on tensile and pullout behaviour of woven coir geotextiles. Geotext. Geomembr. 2008, 26, 384–392. [Google Scholar] [CrossRef]
- Mendes, M.J.A.; Palmeira, E.M.; Matheus, E. Some factors affecting the in-soil load–strain behaviour of virgin and damaged nonwoven geotextiles. Geosynth. Int. 2007, 14, 39–50. [Google Scholar] [CrossRef]
- Reis, J.M.L.; Coelho, J.L.V.; Monteiro, A.H.; da Costa Mattos, H.S. Tensile behavior of glass/epoxy laminates at varying strain rates and temperatures. Compos. Part B Eng. 2012, 43, 2041–2046. [Google Scholar] [CrossRef]
- Ou, Y.; Zhu, D.; Zhang, H.; Huang, L.; Yao, Y.; Li, G.; Mobasher, B. Mechanical characterization of the tensile properties of glass fiber and its reinforced polymer (GFRP) composite under varying strain rates and temperatures. Polymers 2016, 8, 196. [Google Scholar] [CrossRef]
- Wang, Z.; Zhou, Y.; Mallick, P.K. Effects of temperature and strain rate on the tensile behavior of short fiber reinforced polyamide-6. Polym. Compos. 2002, 23, 858–871. [Google Scholar] [CrossRef]
- Ou, Y.; Zhu, D. Tensile behavior of glass fiber reinforced composite at different strain rates and temperatures. Constr. Build. Mater. 2015, 96, 648–656. [Google Scholar] [CrossRef]
- Borosnyói, A. Influence of service temperature and strain rate on the bond performance of CFRP reinforcement in concrete. Compos. Struct. 2015, 127, 18–27. [Google Scholar] [CrossRef]
- Shirinbayan, M.; Fitoussi, J.; Kheradmand, F.; Montazeri, A.; Zuo, P.; Tcharkhtchi, A. Coupling effect of strain rate and temperature on tensile damage mechanism of polyphenylene sulfide reinforced by glass fiber (PPS/GF30). J. Thermoplast. Compos. Mater. 2022, 35, 1994–2008. [Google Scholar] [CrossRef]
- Hawileh, R.A.; Abu-Obeidah, A.; Abdalla, J.A.; Al-Tamimi, A. Temperature effect on the mechanical properties of carbon, glass and carbon–glass FRP laminates. Constr. Build. Mater. 2015, 75, 342–348. [Google Scholar] [CrossRef]
- Zhang, M.; Jiang, B.; Chen, C.; Drummer, D.; Zhai, Z. The effect of temperature and strain rate on the interfacial behavior of glass fiber reinforced polypropylene composites: A molecular dynamics study. Polymers 2019, 11, 1766. [Google Scholar] [CrossRef] [PubMed]
- Zhang, Y.; Sun, L.; Li, L.; Wei, J. Effects of strain rate and high temperature environment on the mechanical performance of carbon fiber reinforced thermoplastic composites fabricated by hot press molding. Compos. Part A Appl. Sci. Manuf. 2020, 134, 105905. [Google Scholar] [CrossRef]
- Elanchezhian, C.; Ramnath, B.V.; Hemalatha, J. Mechanical behaviour of glass and carbon fibre reinforced composites at varying strain rates and temperatures. Procedia Mater. Sci. 2014, 6, 1405–1418. [Google Scholar] [CrossRef]
- Sato, M.; Shirai, S.; Koyanagi, J.; Ishida, Y.; Kogo, Y. Numerical simulation for strain rate and temperature dependence of transverse tensile failure of unidirectional carbon fiber-reinforced plastics. J. Compos. Mater. 2019, 53, 4305–4312. [Google Scholar] [CrossRef]
- Machado, J.J.M.; Marques, E.A.S.; Campilho, R.D.S.G.; da Silva, L.F. Mode II fracture toughness of CFRP as a function of temperature and strain rate. Compos. Part B Eng. 2017, 114, 311–318. [Google Scholar] [CrossRef]
- Jia, Z.; Li, T.; Chiang, F.P.; Wang, L. An experimental investigation of the temperature effect on the mechanics of carbon fiber reinforced polymer composites. Compos. Sci. Technol. 2018, 154, 53–63. [Google Scholar] [CrossRef]
- Machado, J.J.M.; Hayashi, A.; Sekigushi, Y.; Campilho, R.D.S.G.; Marques, E.A.S.; Sato, C.; da Silva, L.F. Dynamic behaviour in mode I fracture toughness of CFRP as a function of temperature. Theor. Appl. Fract. Mech. 2019, 103, 102257. [Google Scholar] [CrossRef]
- Lin, Y.; Yang, G.; Liu, D. Tensile mechanical behaviors of reinforcements and model analysis. J. Cent. South Univ. (Sci. Technol.) 2011, 42, 2138–2146. [Google Scholar]
- Nachane, R.; Sundaram, V. Analnalysis of relaxation phenomena in textile fibers. 2. inverse relaxation. J. Text. Inst. 1995, 86, 509. [Google Scholar]
- Vangheluwe, L. Influence of strain rate and yarn number on tensile test results. Text. Res. J. 1992, 62, 586–589. [Google Scholar] [CrossRef]


| Type of Reinforcement Material | Length/mm | Width/mm | Maximum Tensile Load/kN | Tensile Force at 2% Tensile Strain/kN/m | Tensile Force at 5% Tensile Strain/kN/m) | Maximum Tensile Strength/kN/m | Maximum Tensile Strain/% |
|---|---|---|---|---|---|---|---|
| Plastic geogrid mesh | 530 | 80 | 3.19 | 25.7 | 33.4 | 39.8 | 12.70 |
| Fiberglass geogrid mesh | 350 | 70 | 6.90 | 48.5 | 82.1 | 98.9 | 7.23 |
| Gabion mesh | 280 | 450 | 19.40 | 5.7 | 7.7 | 43.5 | 26.58 |
| Plastic geogrid rib | 340 | / | 1.24 | / | / | 310 ** | 16.63 |
| Fiberglass geogrid rib | 470 | / | 3.14 | / | / | 314 ** | 5.30 |
| Gabion steel wire | 360 | / | 2.72 | / | / | 475 ** | 11.52 |
| Type of Reinforcement Material | Standard Linear Model | Nonlinear Model | Improved Kawabata Model | |||||||
|---|---|---|---|---|---|---|---|---|---|---|
| k/ mm·s−1 | η/ MPa·s·mm−1 | E2/ MPa | E1/ MPa | η/ MPa·s·mm−1 | E0/ MPa | b/ MPa | fmax/ MPa | Lt | Wt/ MPa | |
| Fiberglass geogrid rib | 3.22 | 3.22 | −62.02 | 40.25 | 32.68 | 62.95 | 4.6 | 9.36 | 1.0 | 0.93 |
| Plastic geogrid rib | 4.0 | 4.75 | −7.91 | 3.39 | 11.09 | 10.53 | 0.12 | 0.53 | 1.0 | 0.02 |
| Gabion steel wire | 40.31 | −9.78 | −150.5 | −127.5 | 97.14 | 6.27 | 46.63 | 100.3 | 0.82 | 57.32 |
| Type of Reinforcement Material | Standard Linear Model | Nonlinear Model | Improved Kawabata Model | |||||||
|---|---|---|---|---|---|---|---|---|---|---|
| k/ (mm·s−1) | η/ (kN·m−1·s·mm−1) | E2/ kN/m | E1/ kN/m | η/ (kN·m−1·s·mm−1) | E0/ kN·m−1 | b/ kN·m−1 | fmax/ kN·m−1 | Lt | Wt/ kN·m−1 | |
| Gabion mesh | −453.9 | 0.0002 | 1.19 | −0.02 | −606.5 | 0.9 | 0.029 | 0.07 | 0.9 | 0.003 |
| Plastic geogrid mesh | 5.44 | 5.46 | −8.93 | 0.26 | 5.79 | 9.18 | 0.01 | 6.38 | 1.03 | 2.6 |
| Fiberglass geogrid mesh | 3.32 | 3.32 | −21.9 | 11.68 | 12.21 | 27.89 | 1.17 | 40.02 | 1.05 | 51.13 |
Disclaimer/Publisher’s Note: The statements, opinions and data contained in all publications are solely those of the individual author(s) and contributor(s) and not of MDPI and/or the editor(s). MDPI and/or the editor(s) disclaim responsibility for any injury to people or property resulting from any ideas, methods, instructions or products referred to in the content. |
© 2025 by the authors. Licensee MDPI, Basel, Switzerland. This article is an open access article distributed under the terms and conditions of the Creative Commons Attribution (CC BY) license (https://creativecommons.org/licenses/by/4.0/).
Share and Cite
Liu, H.; Zhang, Z.; Long, Z.; He, B.; Chen, F.; Chen, Z.; Lin, Y. Mechanical Model of Tensile Loading of Geotechnical Reinforcement Materials. Materials 2025, 18, 241. https://doi.org/10.3390/ma18020241
Liu H, Zhang Z, Long Z, He B, Chen F, Chen Z, Lin Y. Mechanical Model of Tensile Loading of Geotechnical Reinforcement Materials. Materials. 2025; 18(2):241. https://doi.org/10.3390/ma18020241
Chicago/Turabian StyleLiu, Hao, Zhen Zhang, Zuhui Long, Bin He, Feng Chen, Ziang Chen, and Yuliang Lin. 2025. "Mechanical Model of Tensile Loading of Geotechnical Reinforcement Materials" Materials 18, no. 2: 241. https://doi.org/10.3390/ma18020241
APA StyleLiu, H., Zhang, Z., Long, Z., He, B., Chen, F., Chen, Z., & Lin, Y. (2025). Mechanical Model of Tensile Loading of Geotechnical Reinforcement Materials. Materials, 18(2), 241. https://doi.org/10.3390/ma18020241