Figure 1.
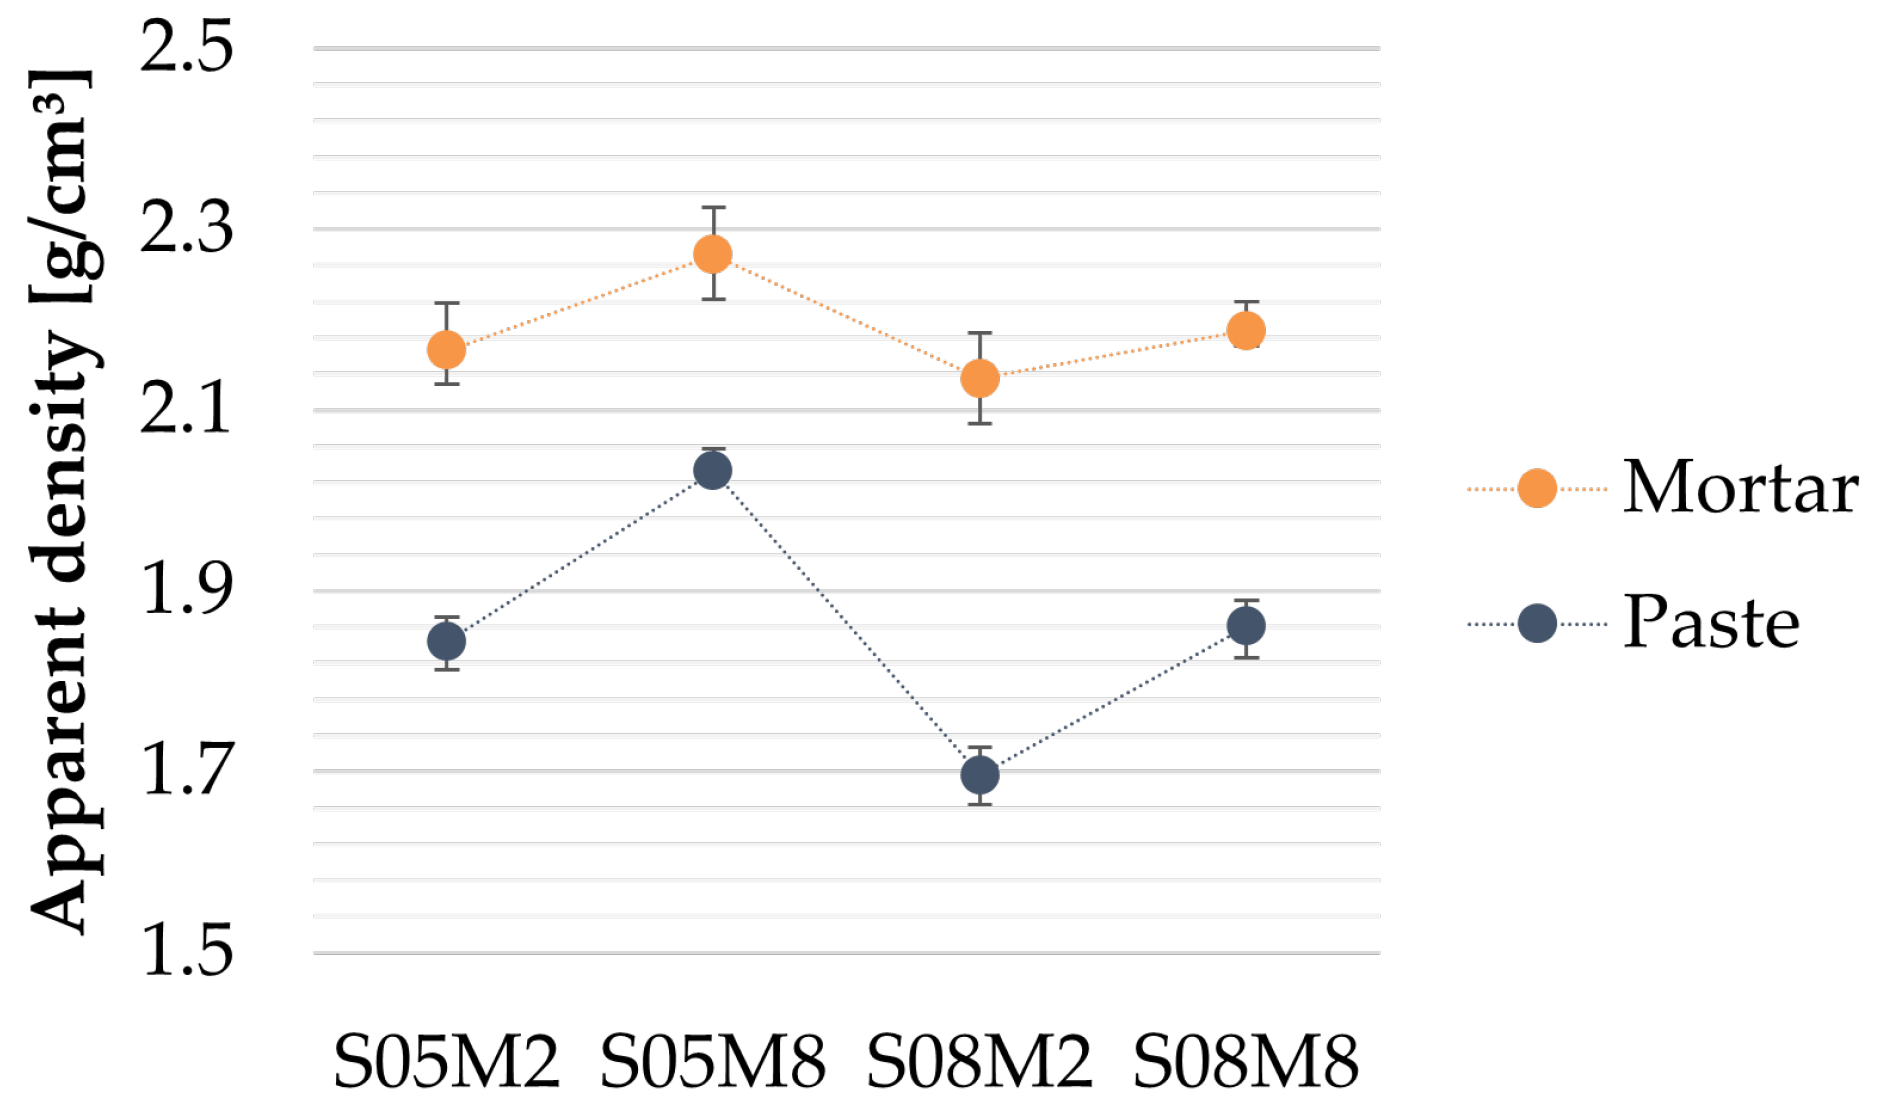
Apparent density of AAS mortars.
Figure 1.
Apparent density of AAS mortars.
Figure 2.
Compressive strength of AAS mortars and ratio between compressive strength of mortar and paste, as a function of the age.
Figure 2.
Compressive strength of AAS mortars and ratio between compressive strength of mortar and paste, as a function of the age.
Figure 3.
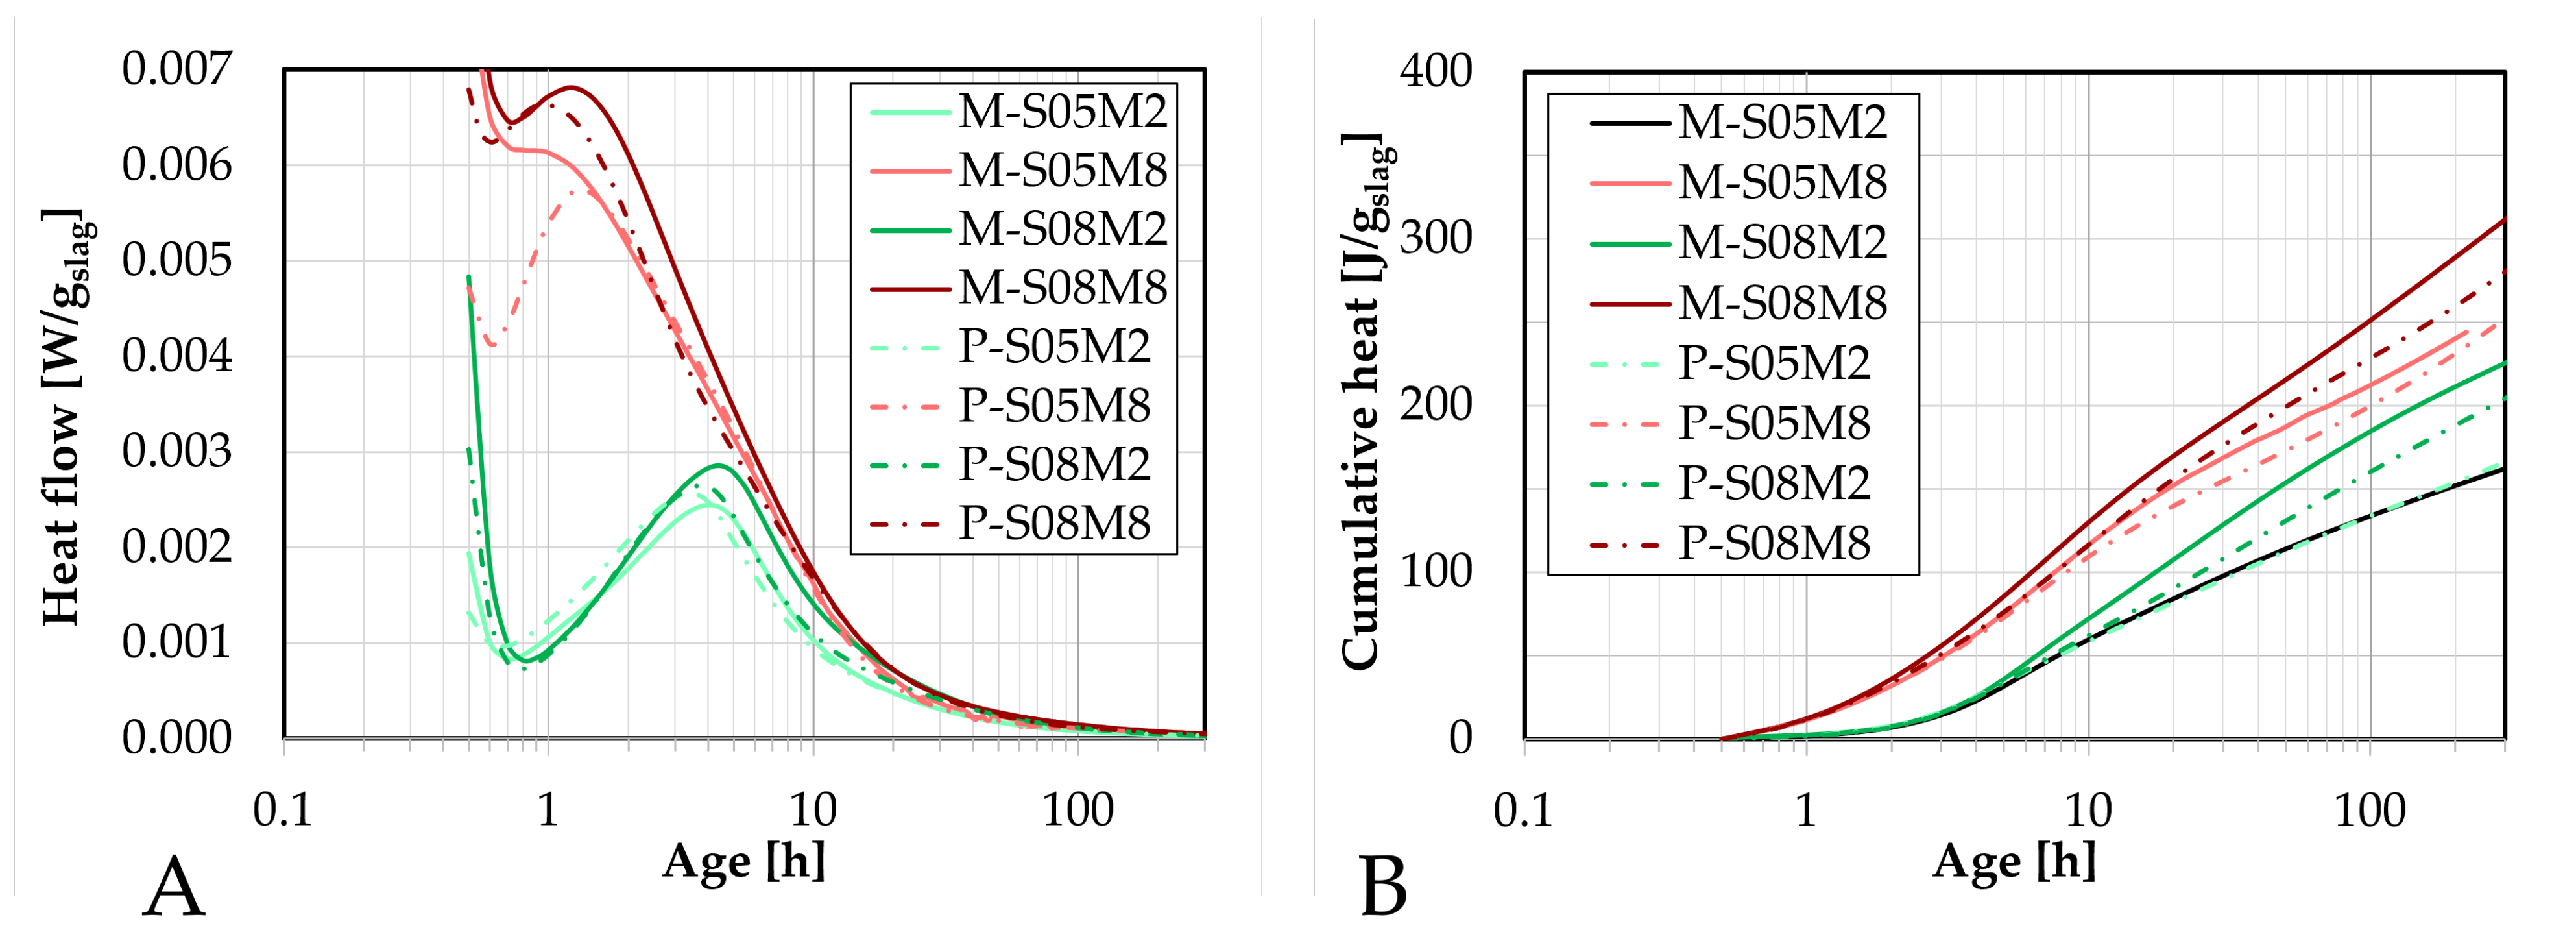
Results of isothermal calorimetry on mortar scale compared to the paste scale: (A). heat flow, (B). cumulative heat.
Figure 3.
Results of isothermal calorimetry on mortar scale compared to the paste scale: (A). heat flow, (B). cumulative heat.
Figure 4.
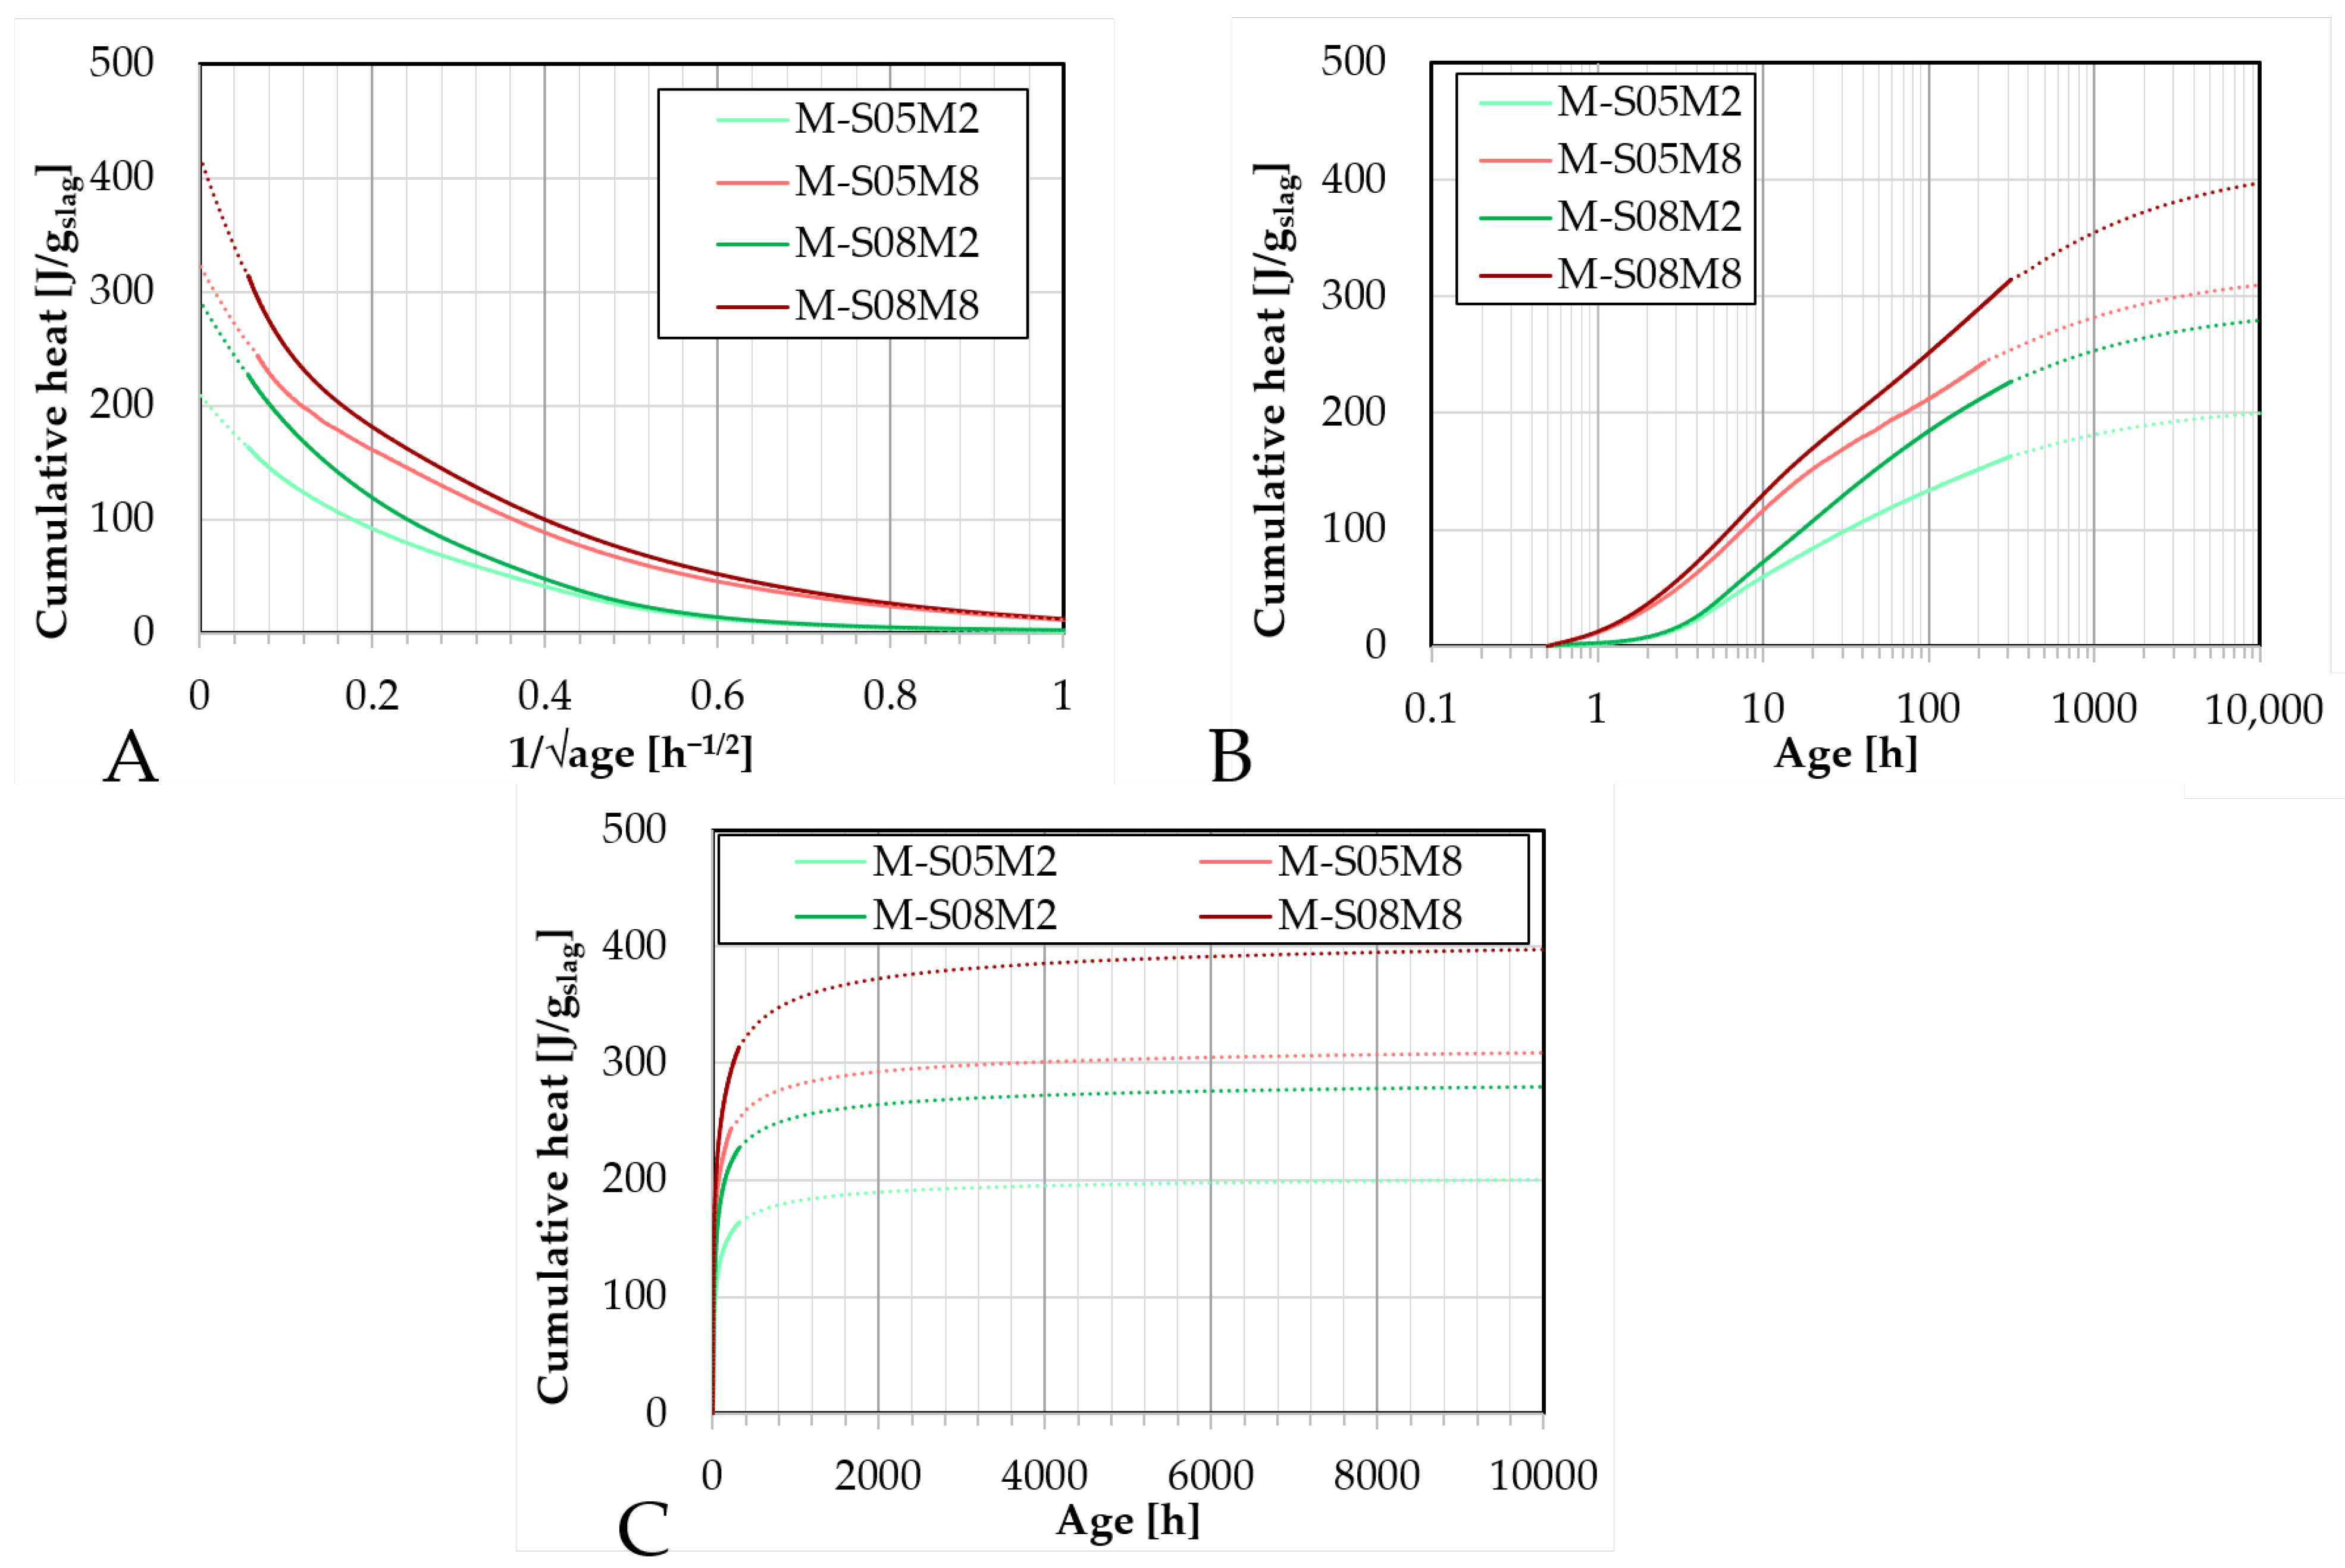
Fitting and extrapolation results (dotted lines) of AAS mortar to determine the ultimate heat based on the cumulative heat results (full lines): A. as function of the inverse of the square root of the age; B. as function of the age (logarithmic scale); C. as function of the age.
Figure 4.
Fitting and extrapolation results (dotted lines) of AAS mortar to determine the ultimate heat based on the cumulative heat results (full lines): A. as function of the inverse of the square root of the age; B. as function of the age (logarithmic scale); C. as function of the age.
Figure 5.
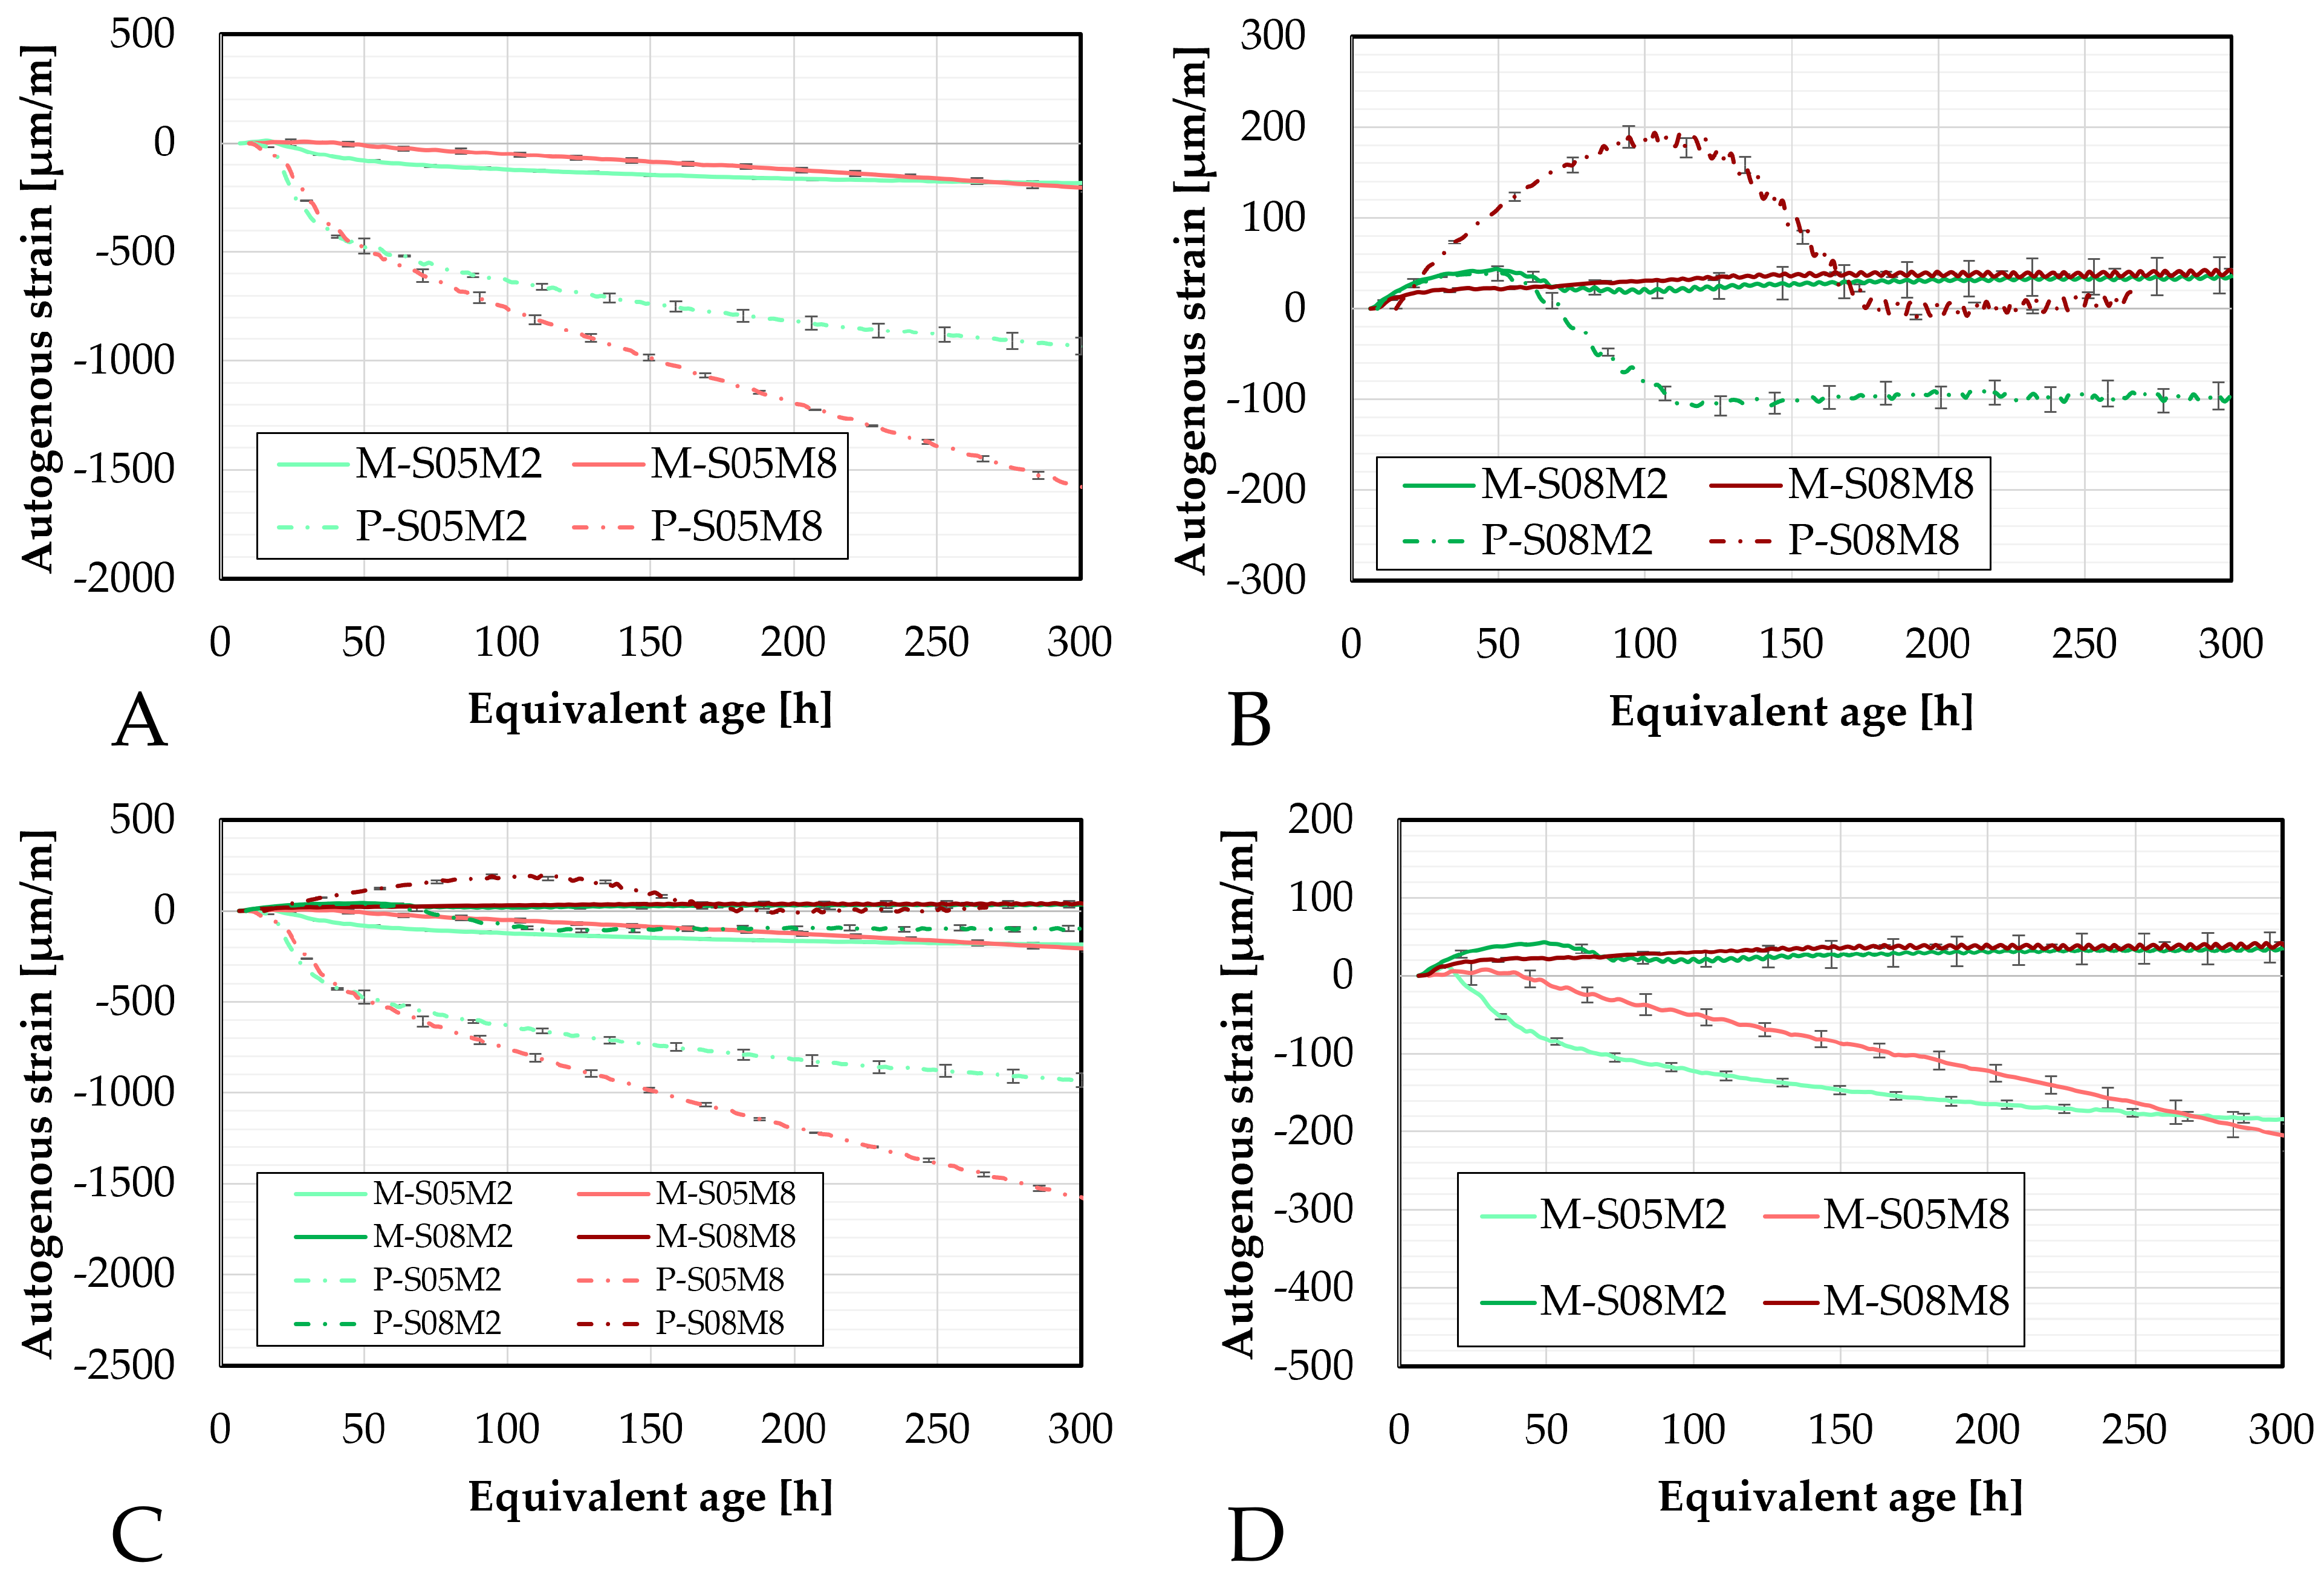
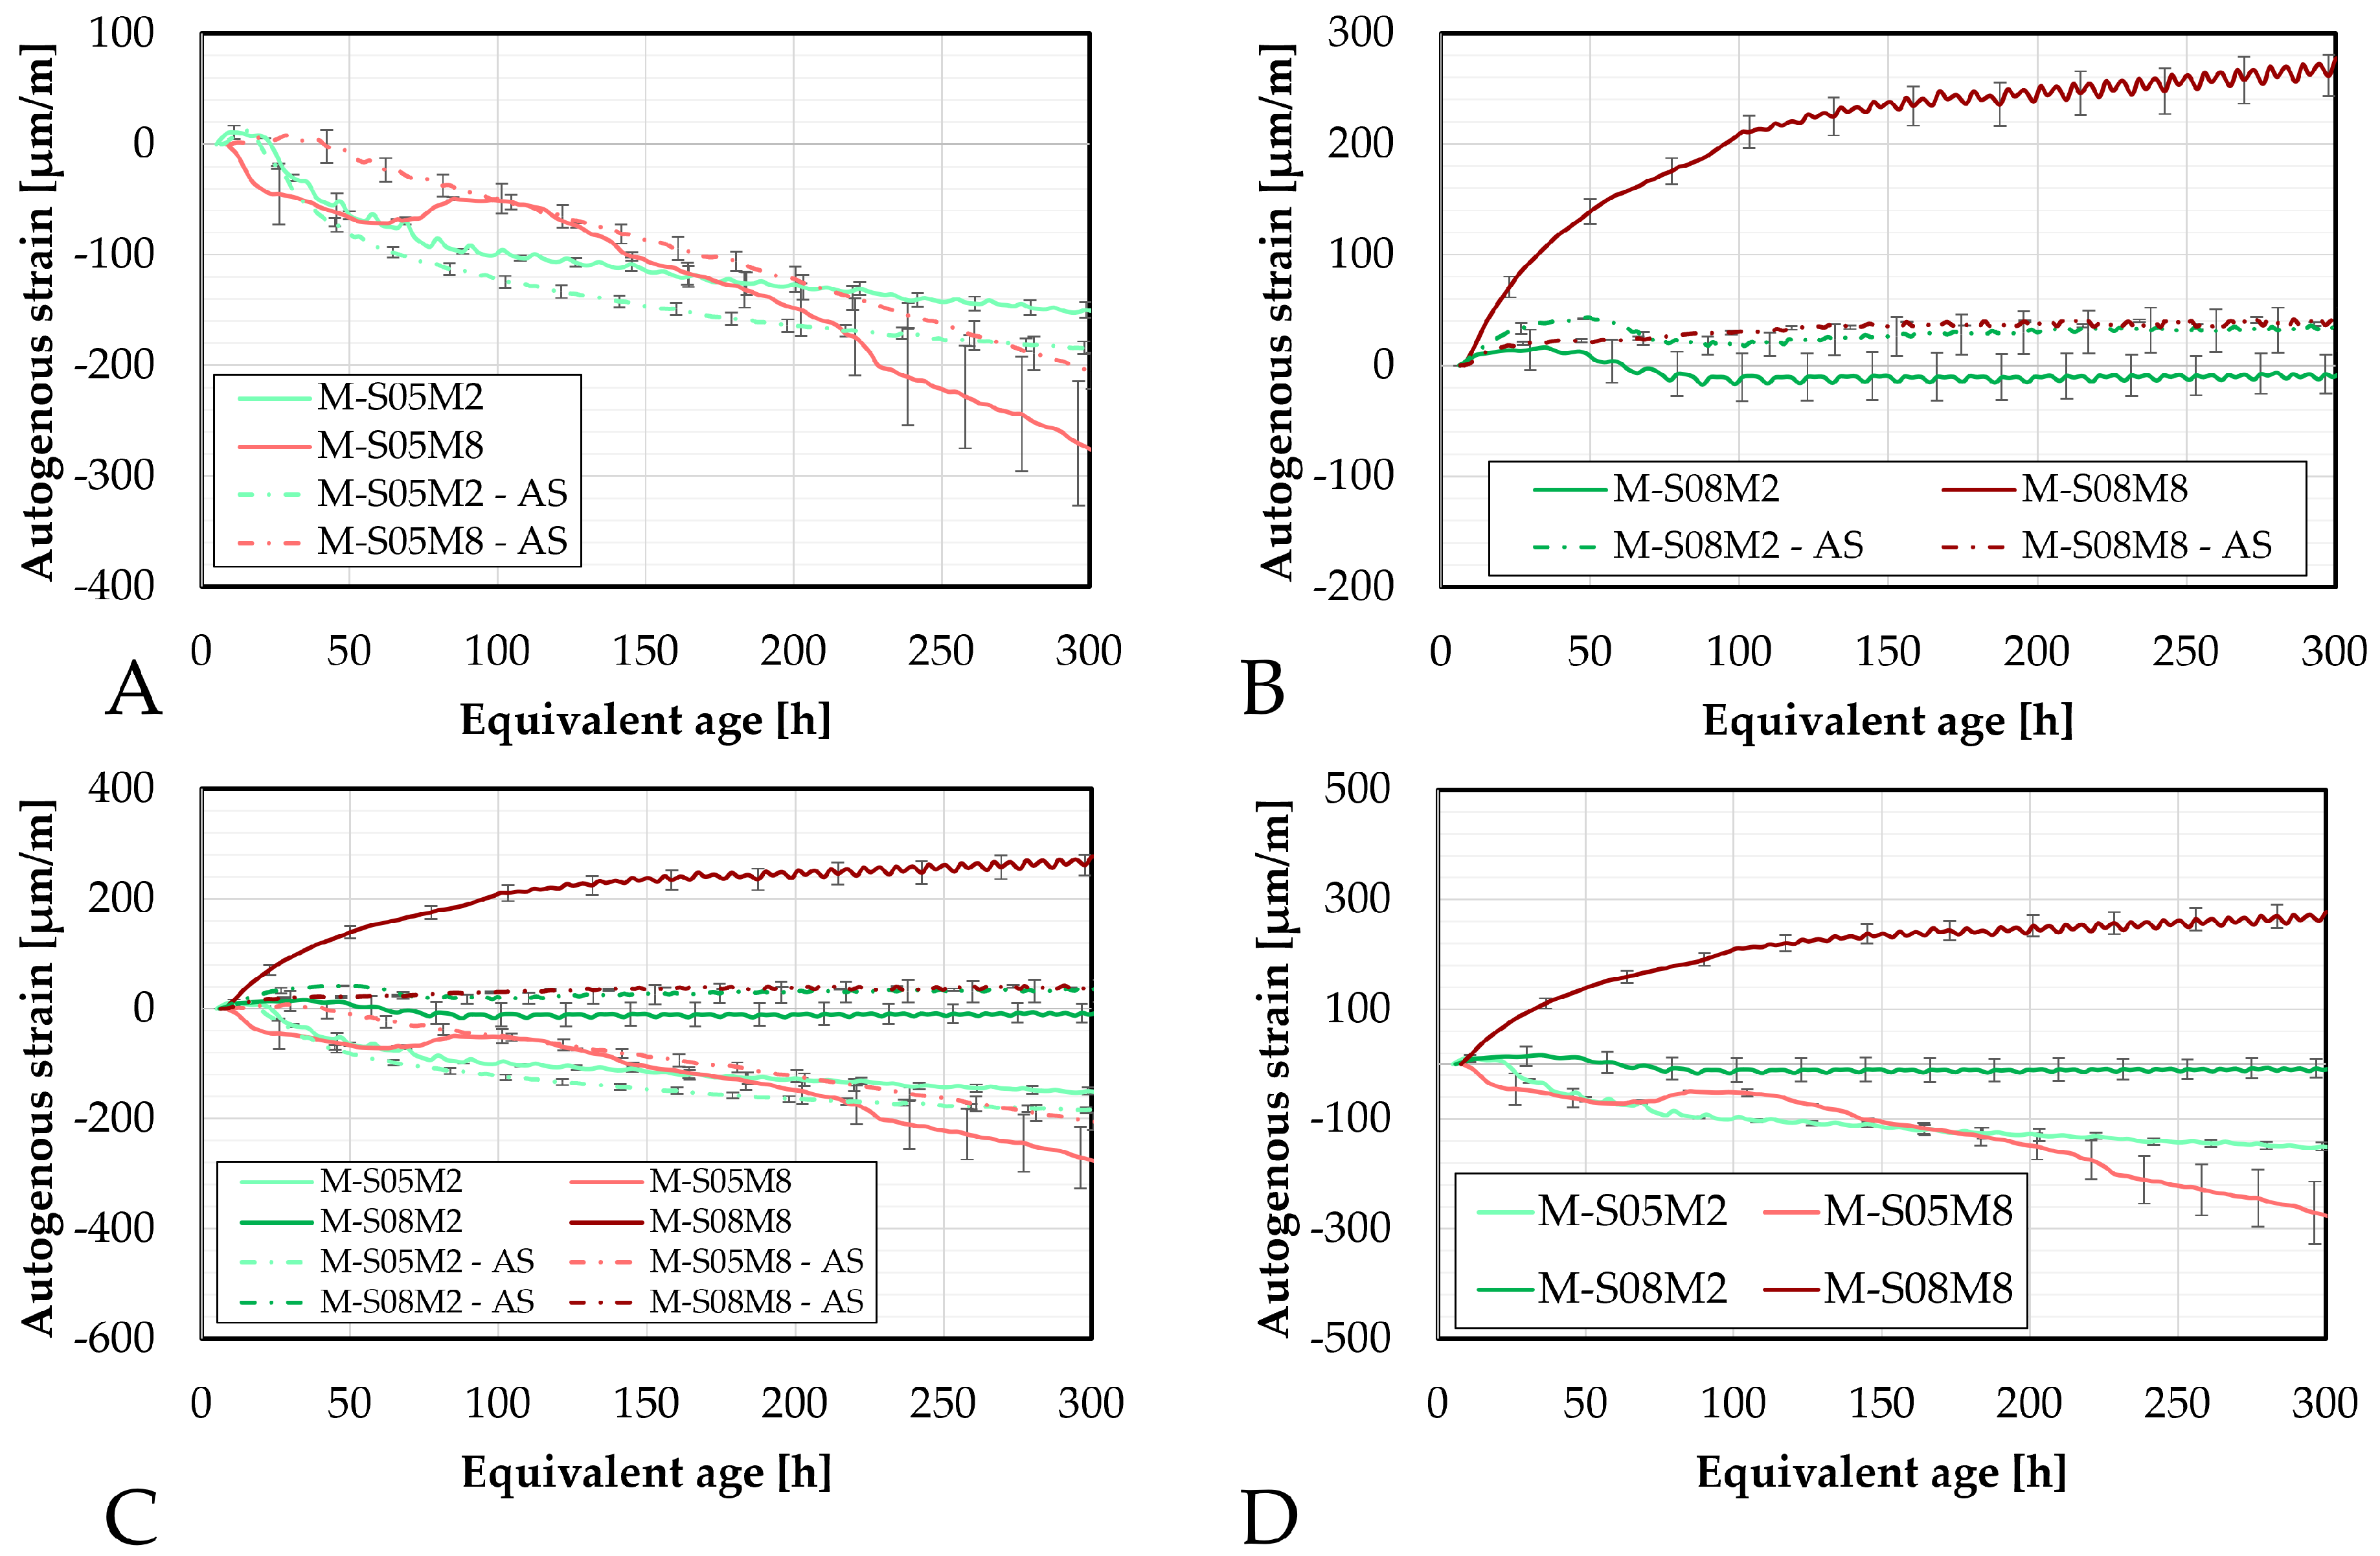
Autogenous strain of AAS mortars obtained with the corrugated tubes method, presented as a function of the equivalent age: (A). Compositions activated with S/B = 0.5 (compared to the equivalent paste compositions), (B). Compositions activated with S/B = 0.8, (C). Comparison of all mortar and paste compositions, (D). Comparison of the mortar compositions. M = mortar, P = paste.
Figure 6.
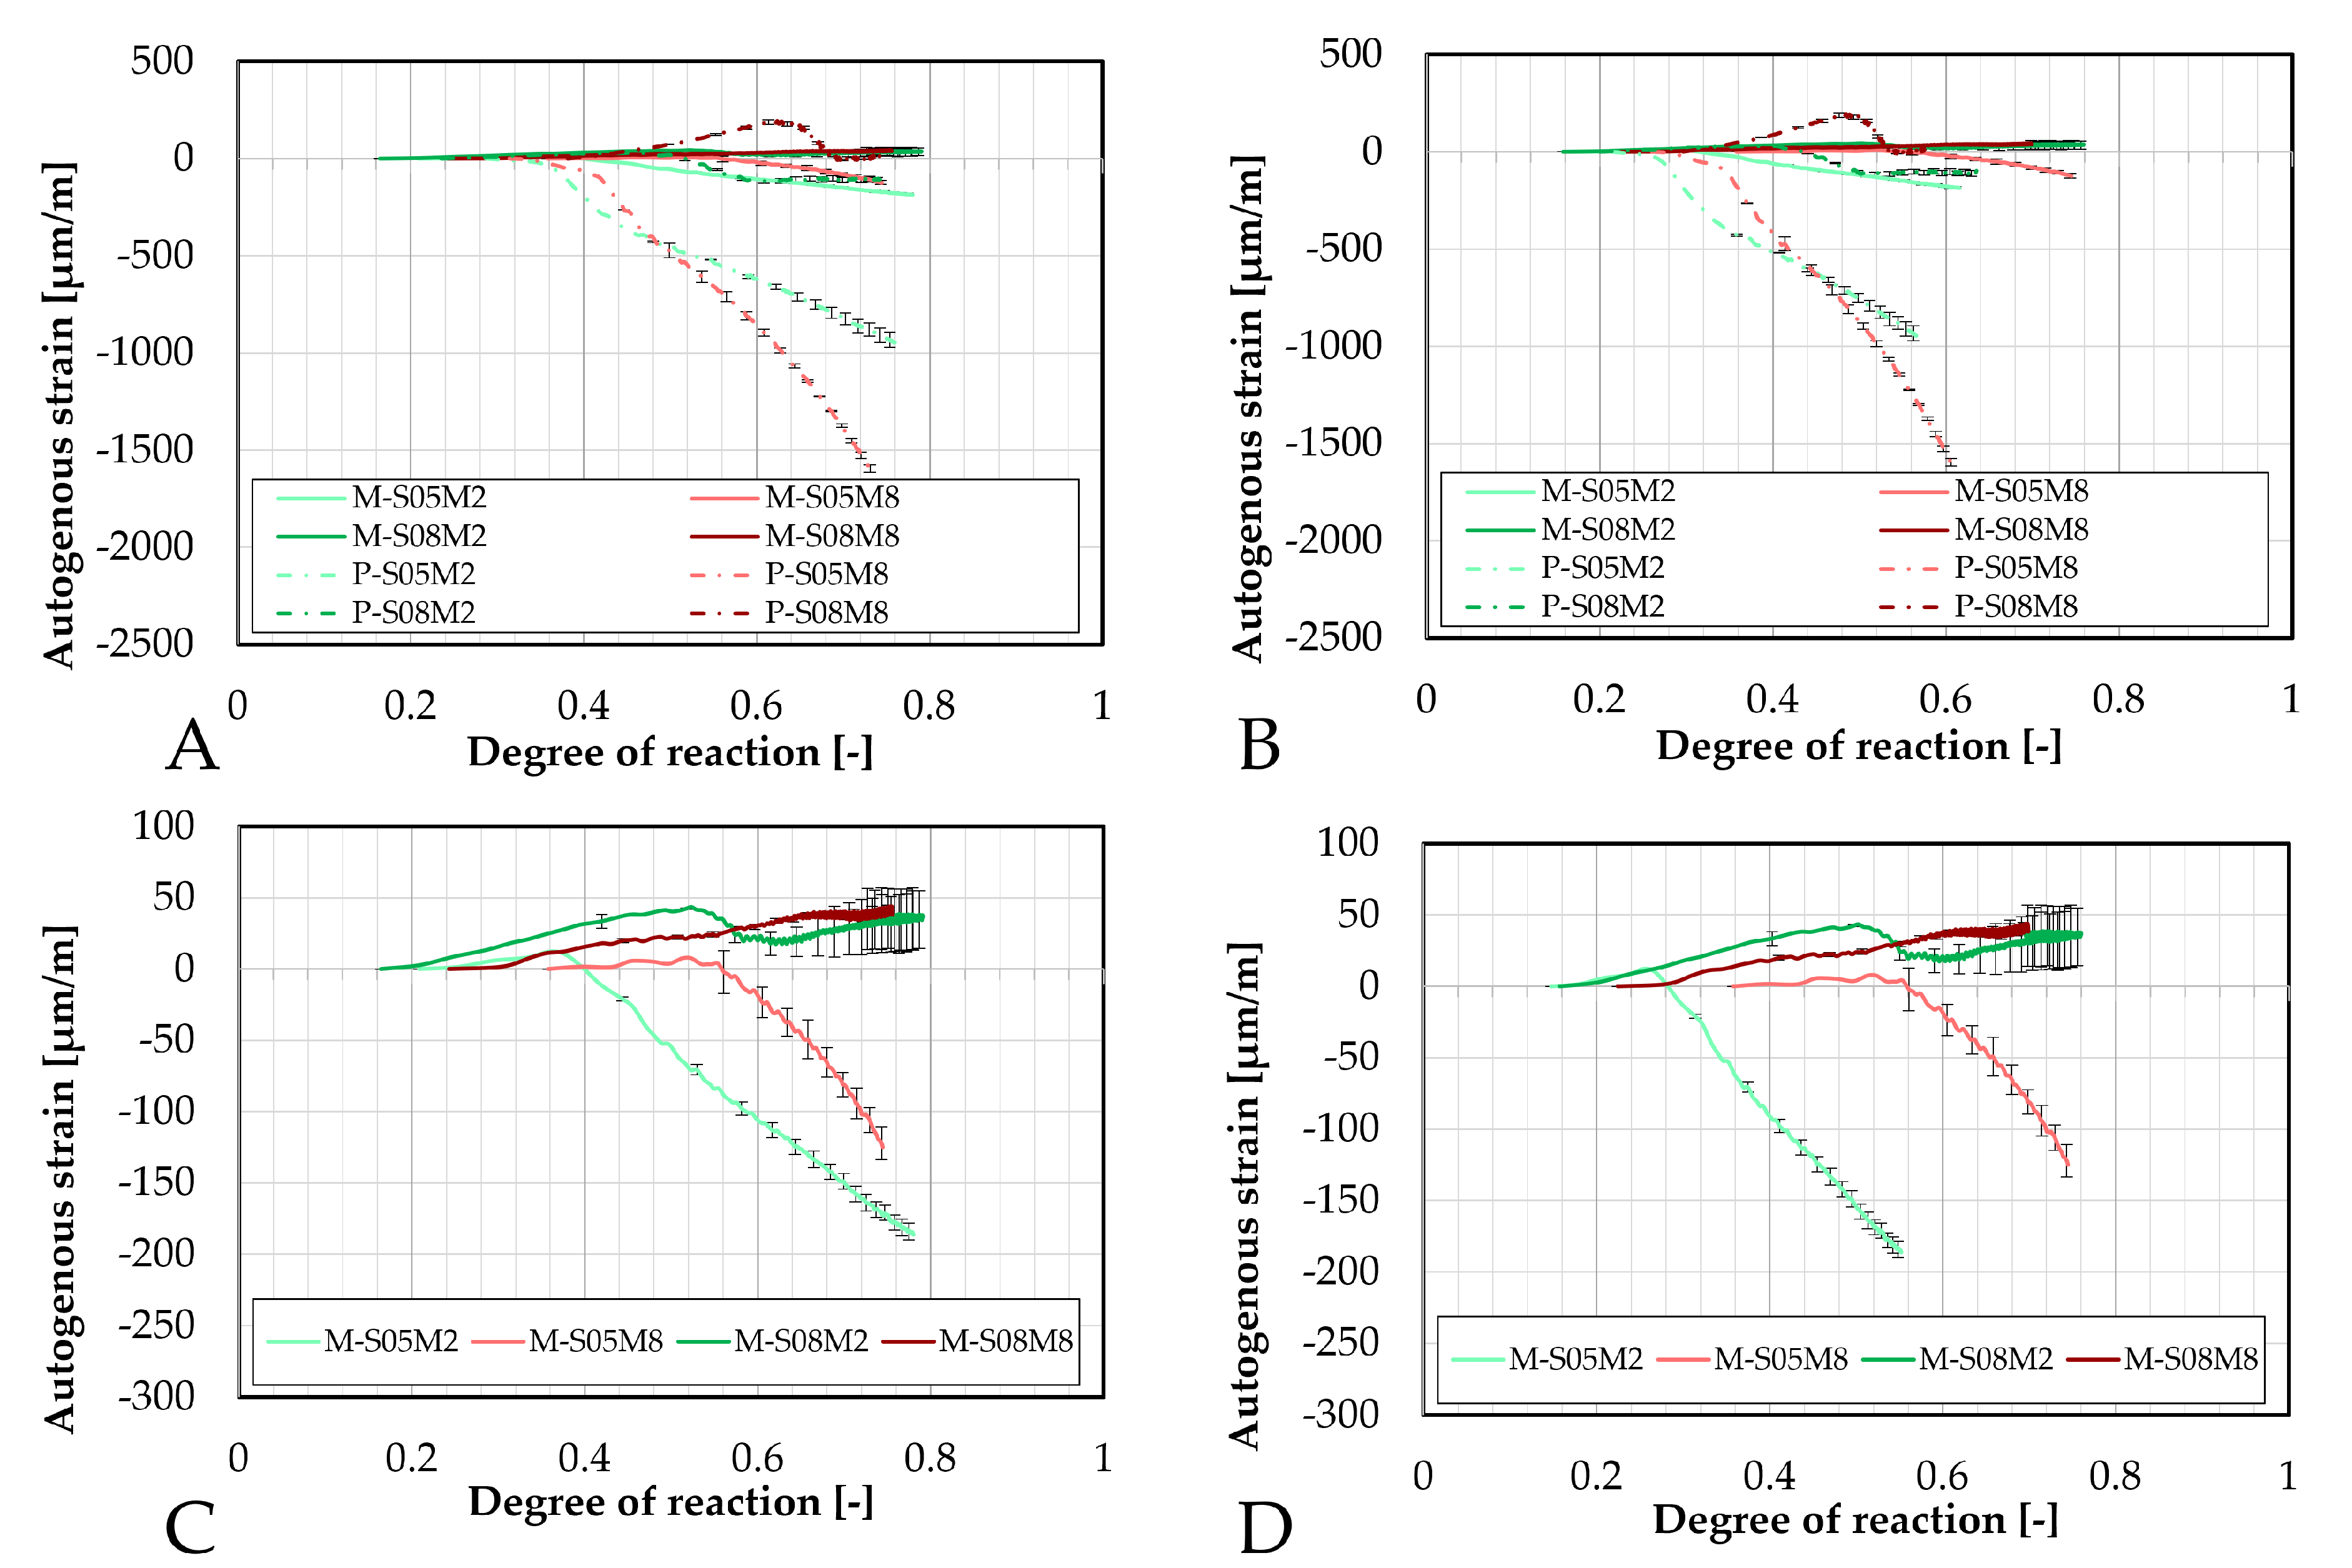
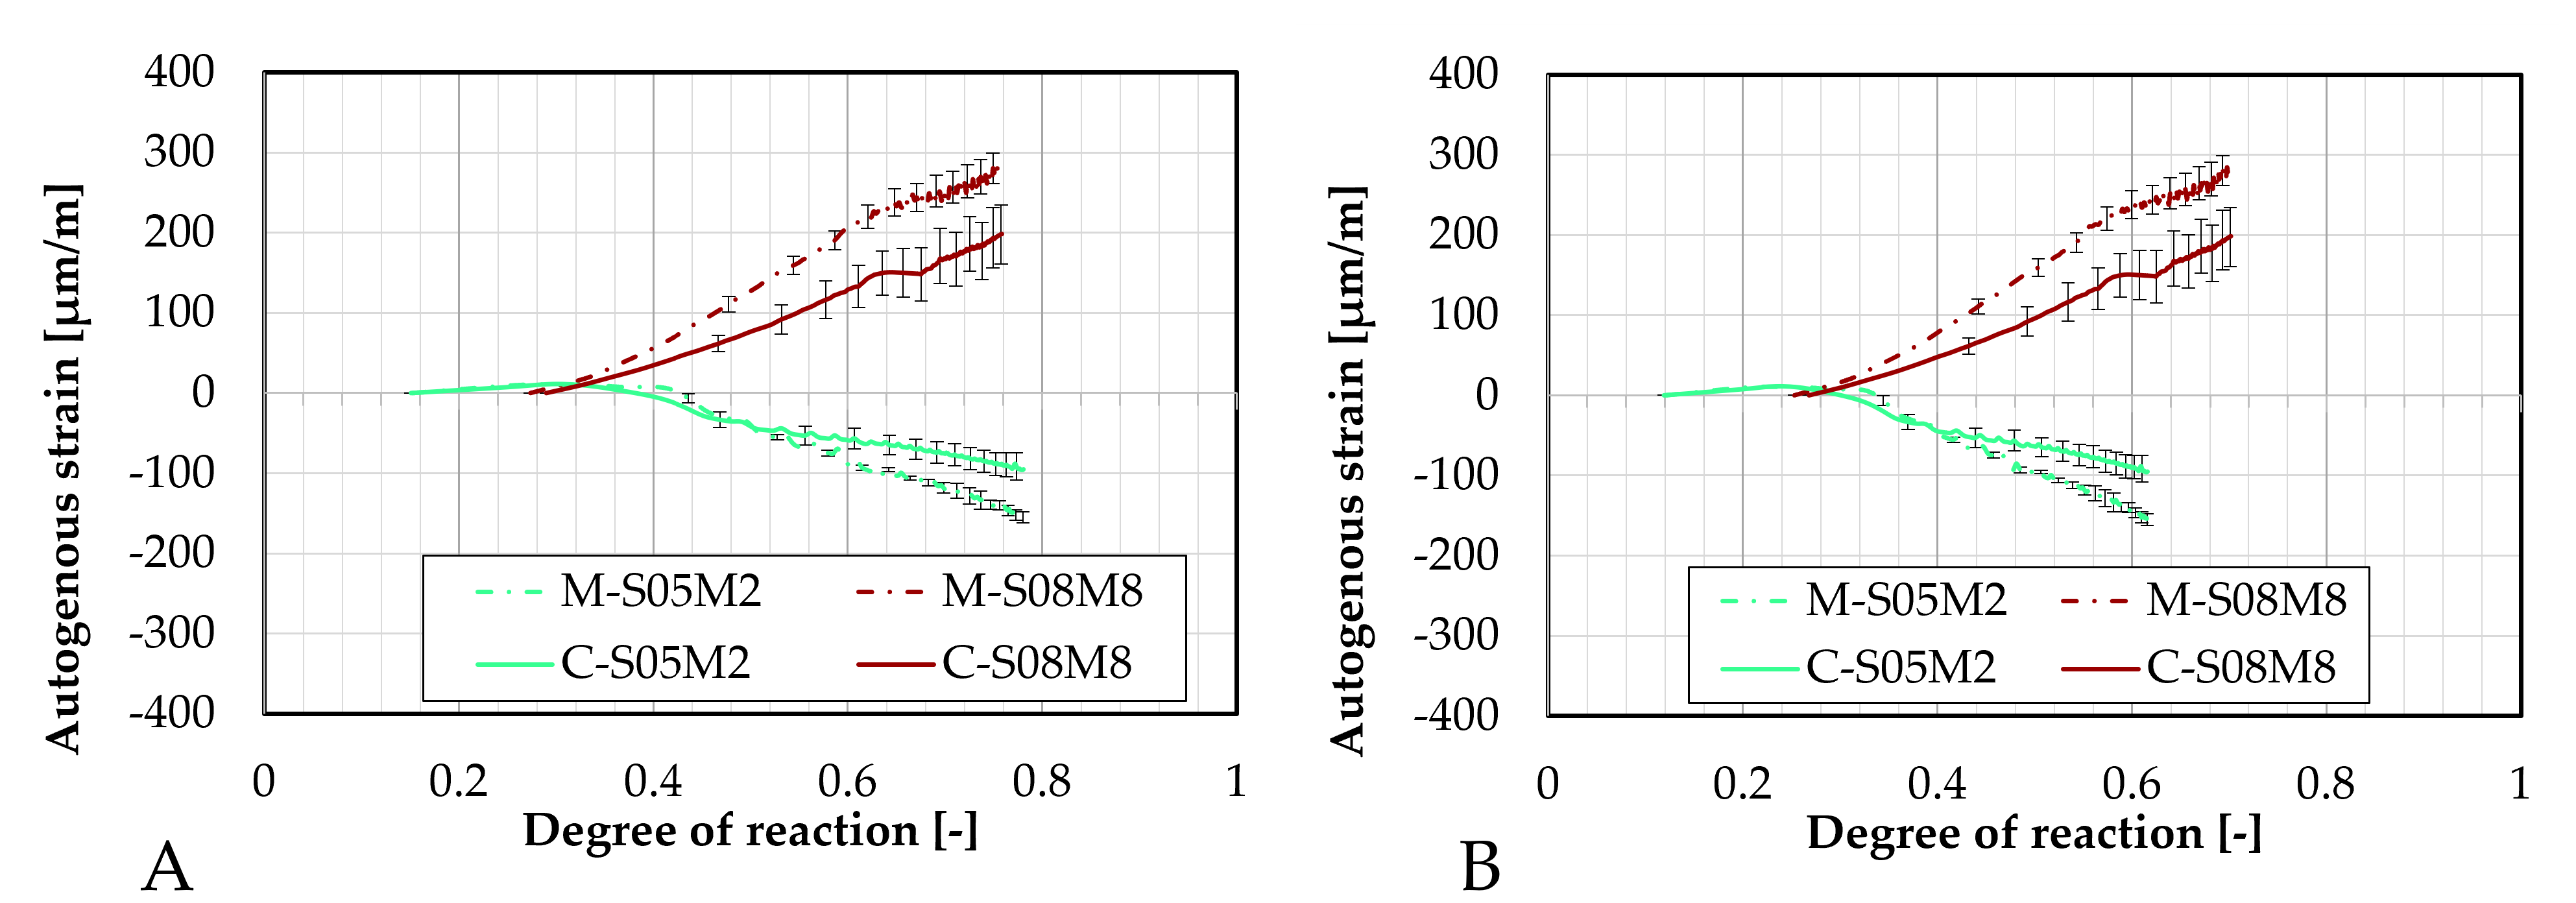
Comparison of the autogenous strain obtained with the corrugated tubes method for all AAS mortar compositions as function of the degree of reaction: (A). determined with polynomially fitted ultimate heat compared to the paste samples, (B). determined with the exponentially fitted ultimate heat compared to the paste samples, (C). determined with polynomially fitted ultimate heat, (D). determined with the exponentially fitted ultimate heat.
Figure 7.
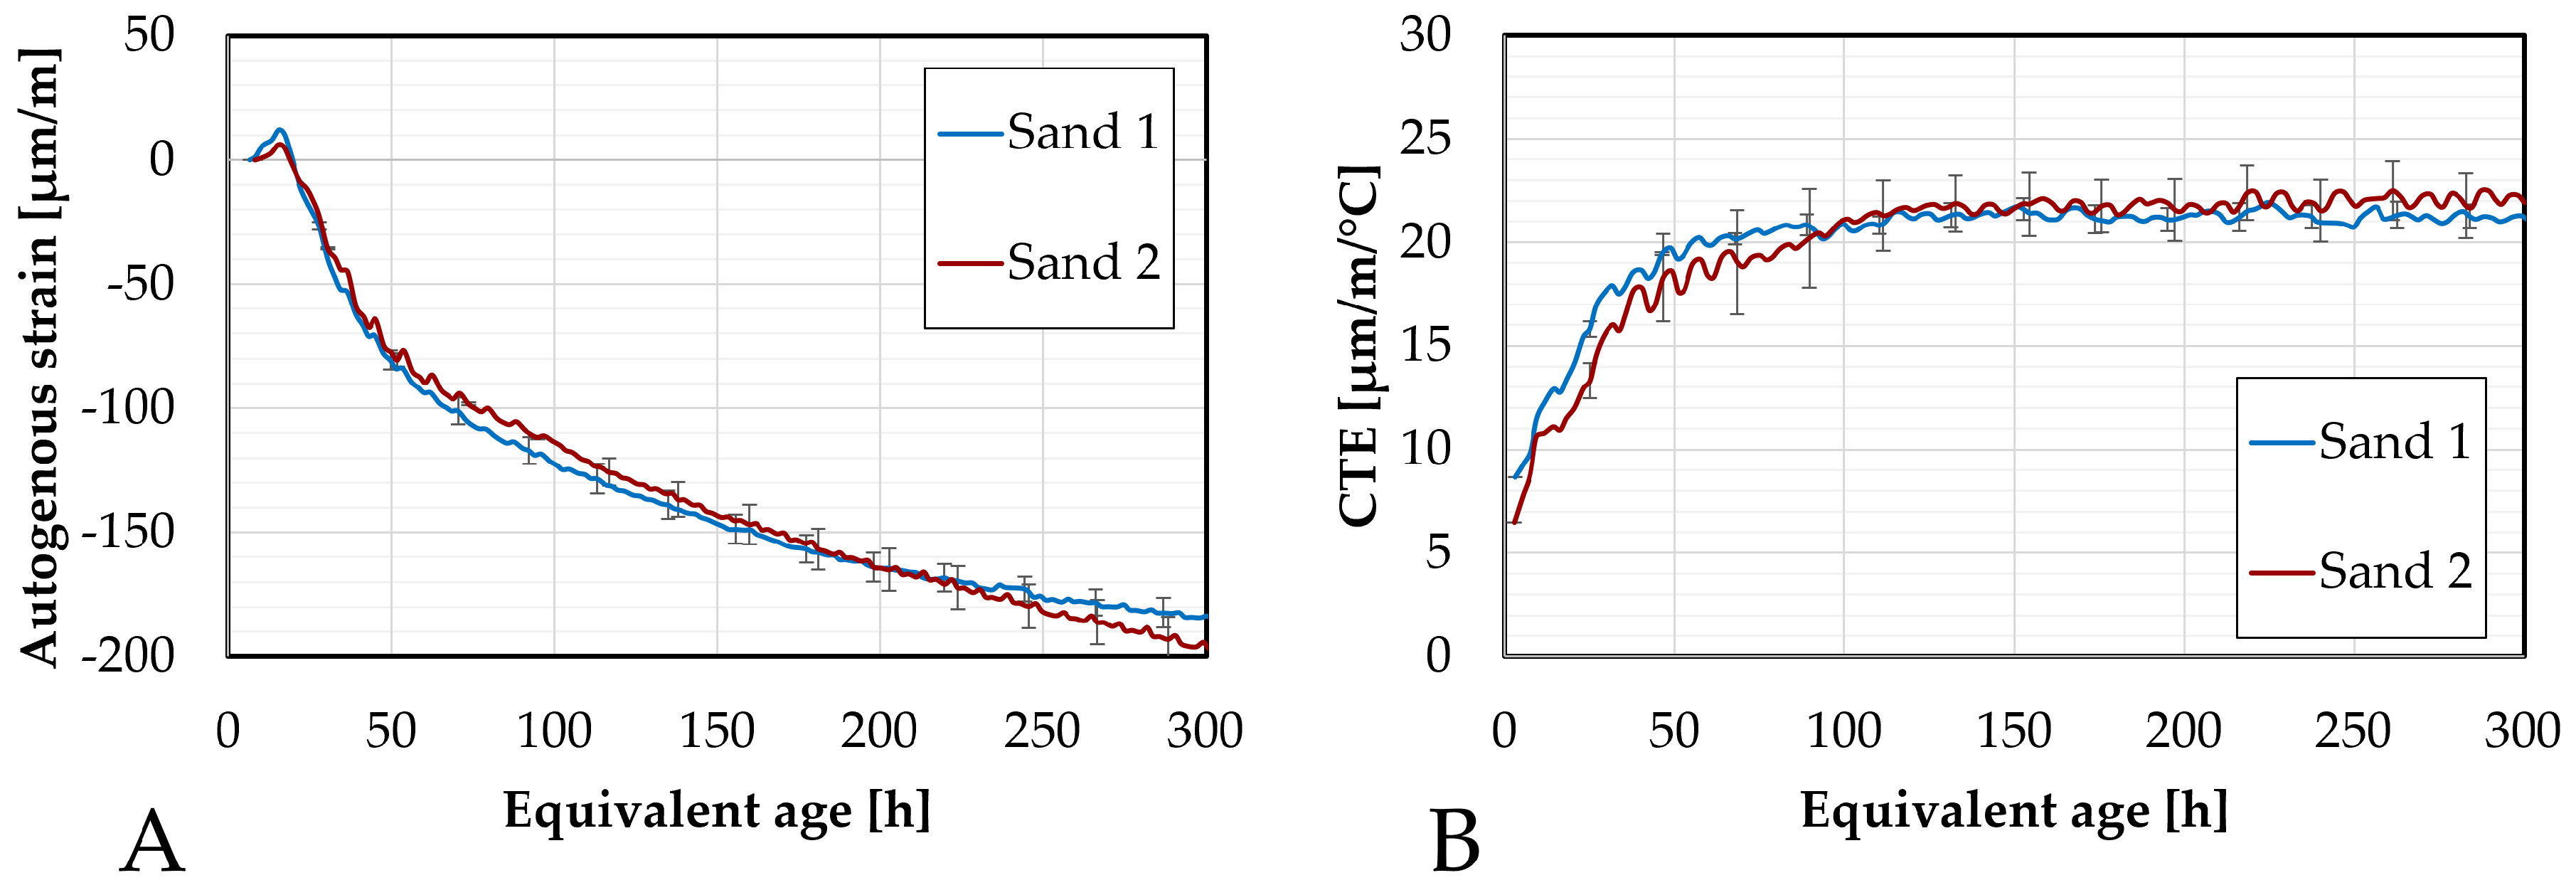
Differences between the two sands in terms of: (A). autogenous strain and of (B). CTE.
Figure 7.
Differences between the two sands in terms of: (A). autogenous strain and of (B). CTE.
Figure 8.
Autogenous strain of AAS mortars obtained with the BTJade device, presented as function of the equivalent age: (A). Compositions activated with S/B = 0.5 (compared to the equivalent corrugated tubes method), (B). Compositions activated with S/B = 0.8 (compared to the equivalent corrugated tubes method), (C). Comparison of all mortar compositions, (D). Comparison of the mortar compositions tested with BTJade. — = BTJade results, - · - : Corrugated tubes method.
Figure 9.
Comparison of the autogenous strain obtained with the BTJade device for all AAS mortar compositions as function of the degree of reaction: (A). determined with polynomially fitted ultimate heat compared to corrugated tubes method results, (B). determined with the exponentially fitted ultimate heat compared to corrugated tubes method results, (C). determined with polynomially fitted ultimate heat, (D). determined with the exponentially fitted ultimate heat. — = BTJade results, - · - : Corrugated tubes method.
Figure 10.
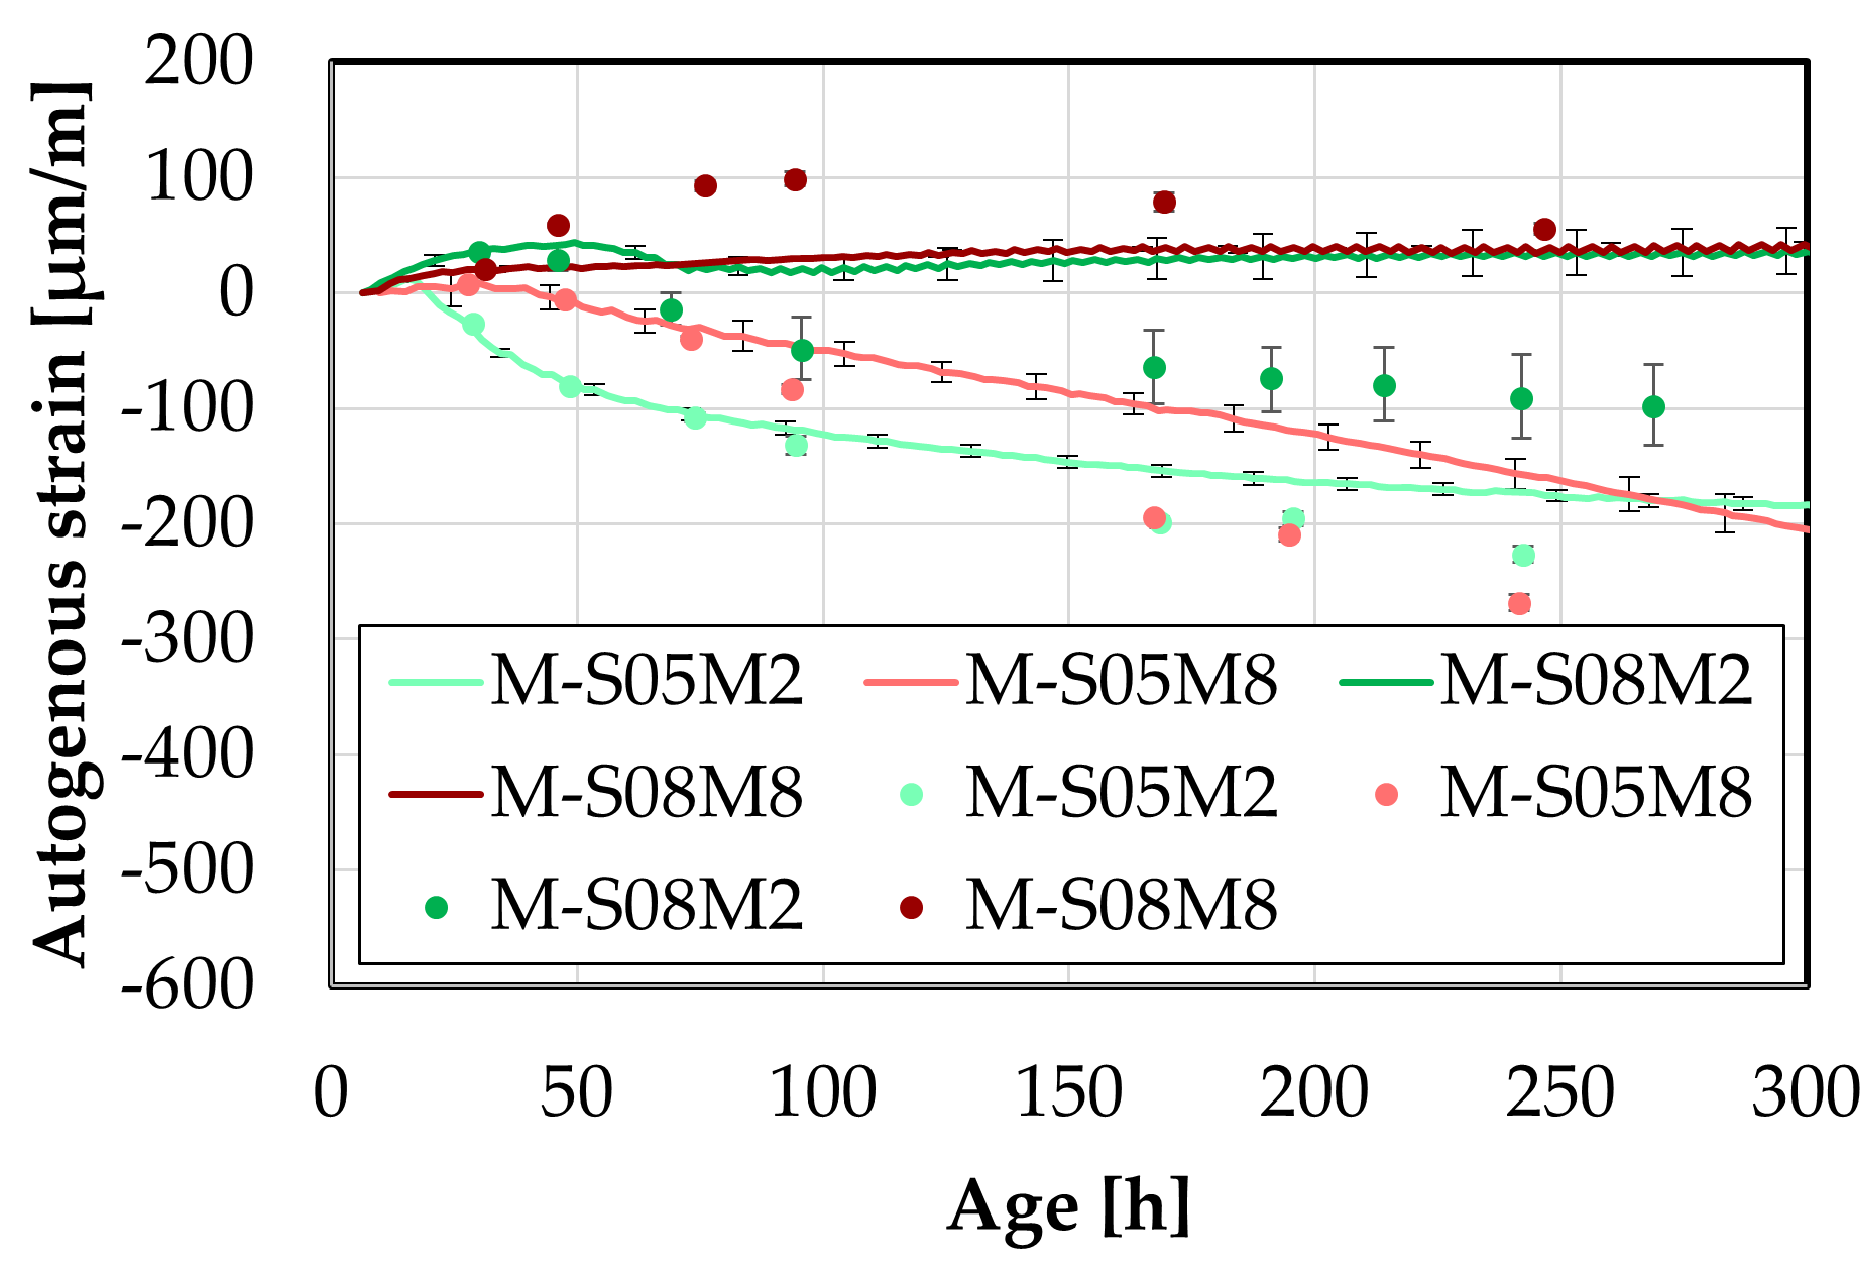
Early-age comparison between small DEMEC results and corrugated tubes method. Line = corrugated tubes method, dots = DEMEC results.
Figure 10.
Early-age comparison between small DEMEC results and corrugated tubes method. Line = corrugated tubes method, dots = DEMEC results.
Figure 11.
Early-age comparison between big DEMEC results and BTJade method. – = corrugated tubes method, = DEMEC results.
Figure 11.
Early-age comparison between big DEMEC results and BTJade method. – = corrugated tubes method, = DEMEC results.
Figure 12.
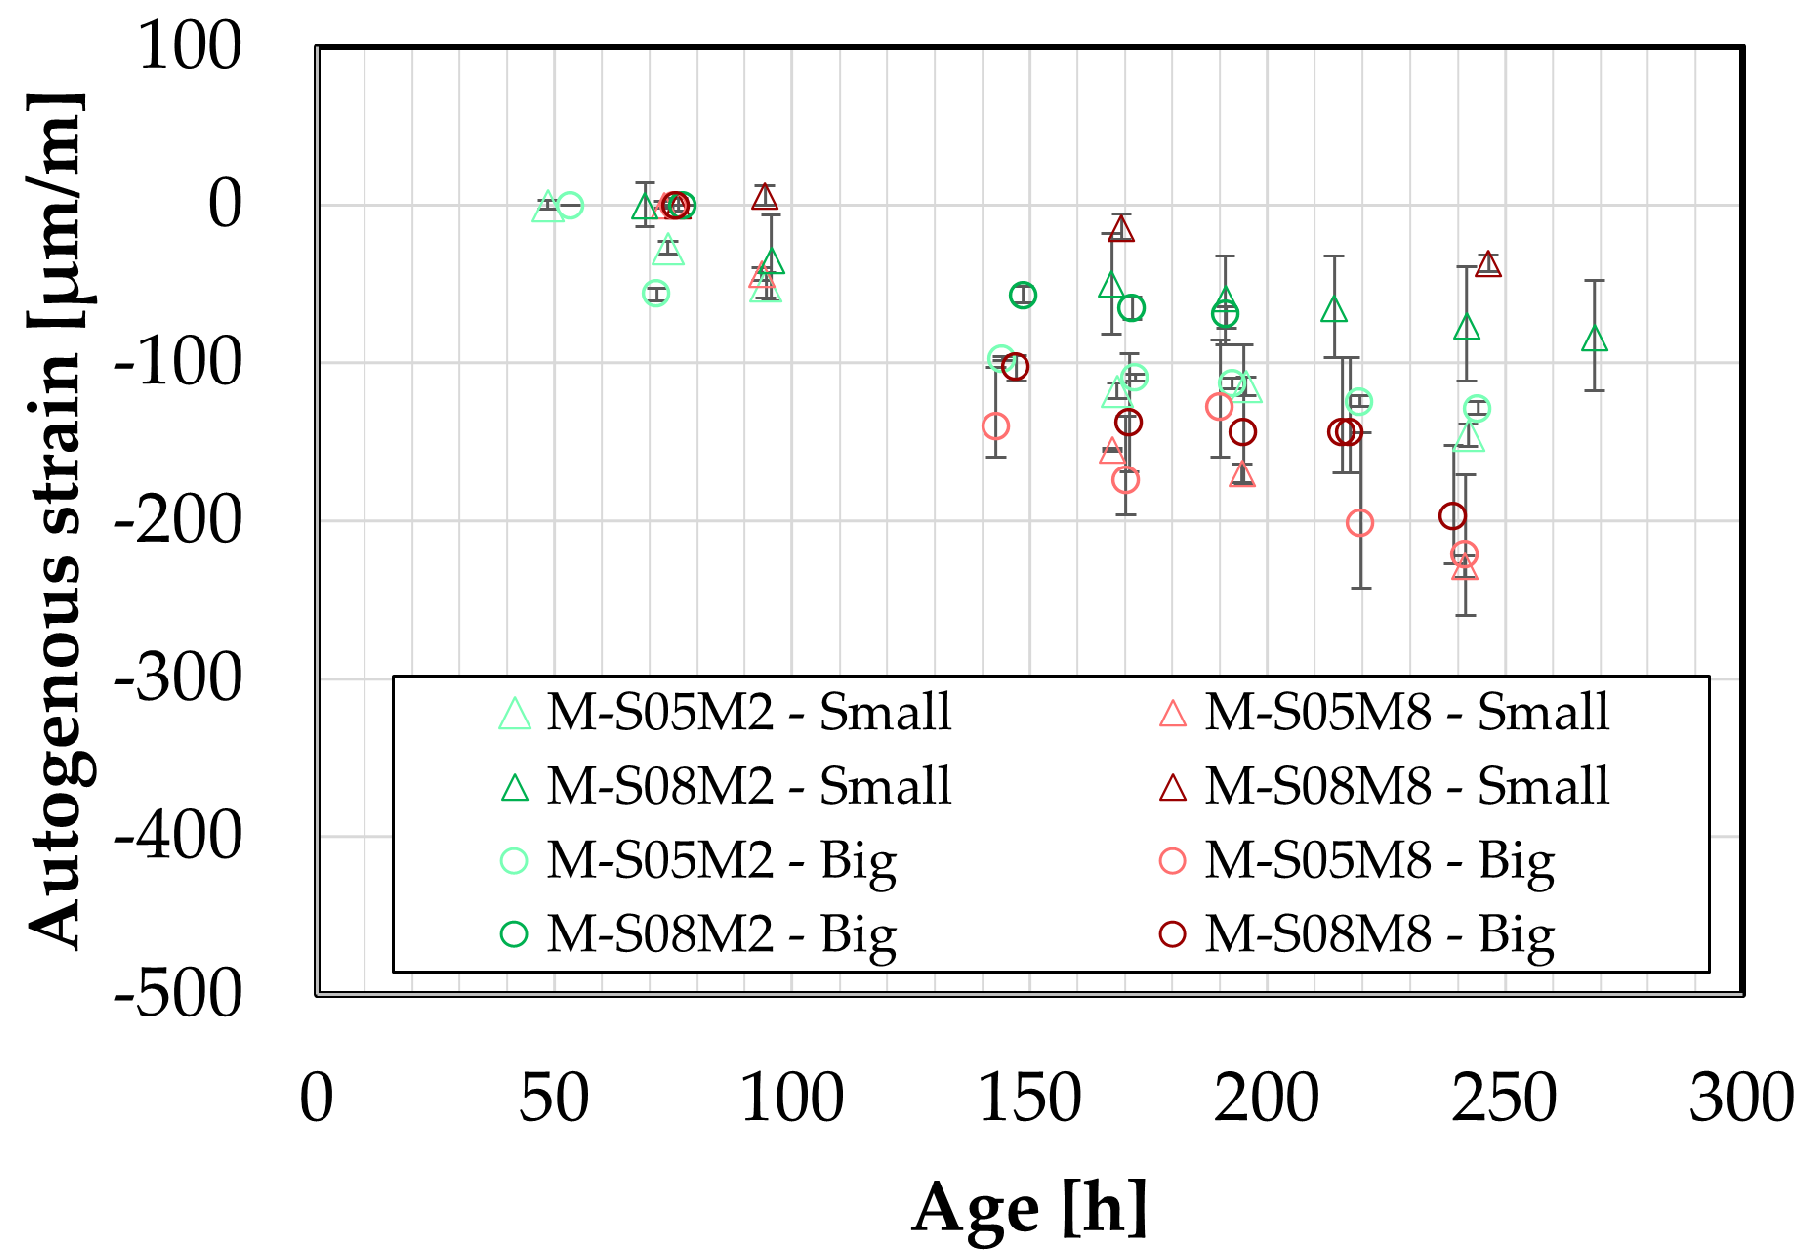
Early-age comparison between small and big DEMEC results.
Figure 12.
Early-age comparison between small and big DEMEC results.
Figure 13.
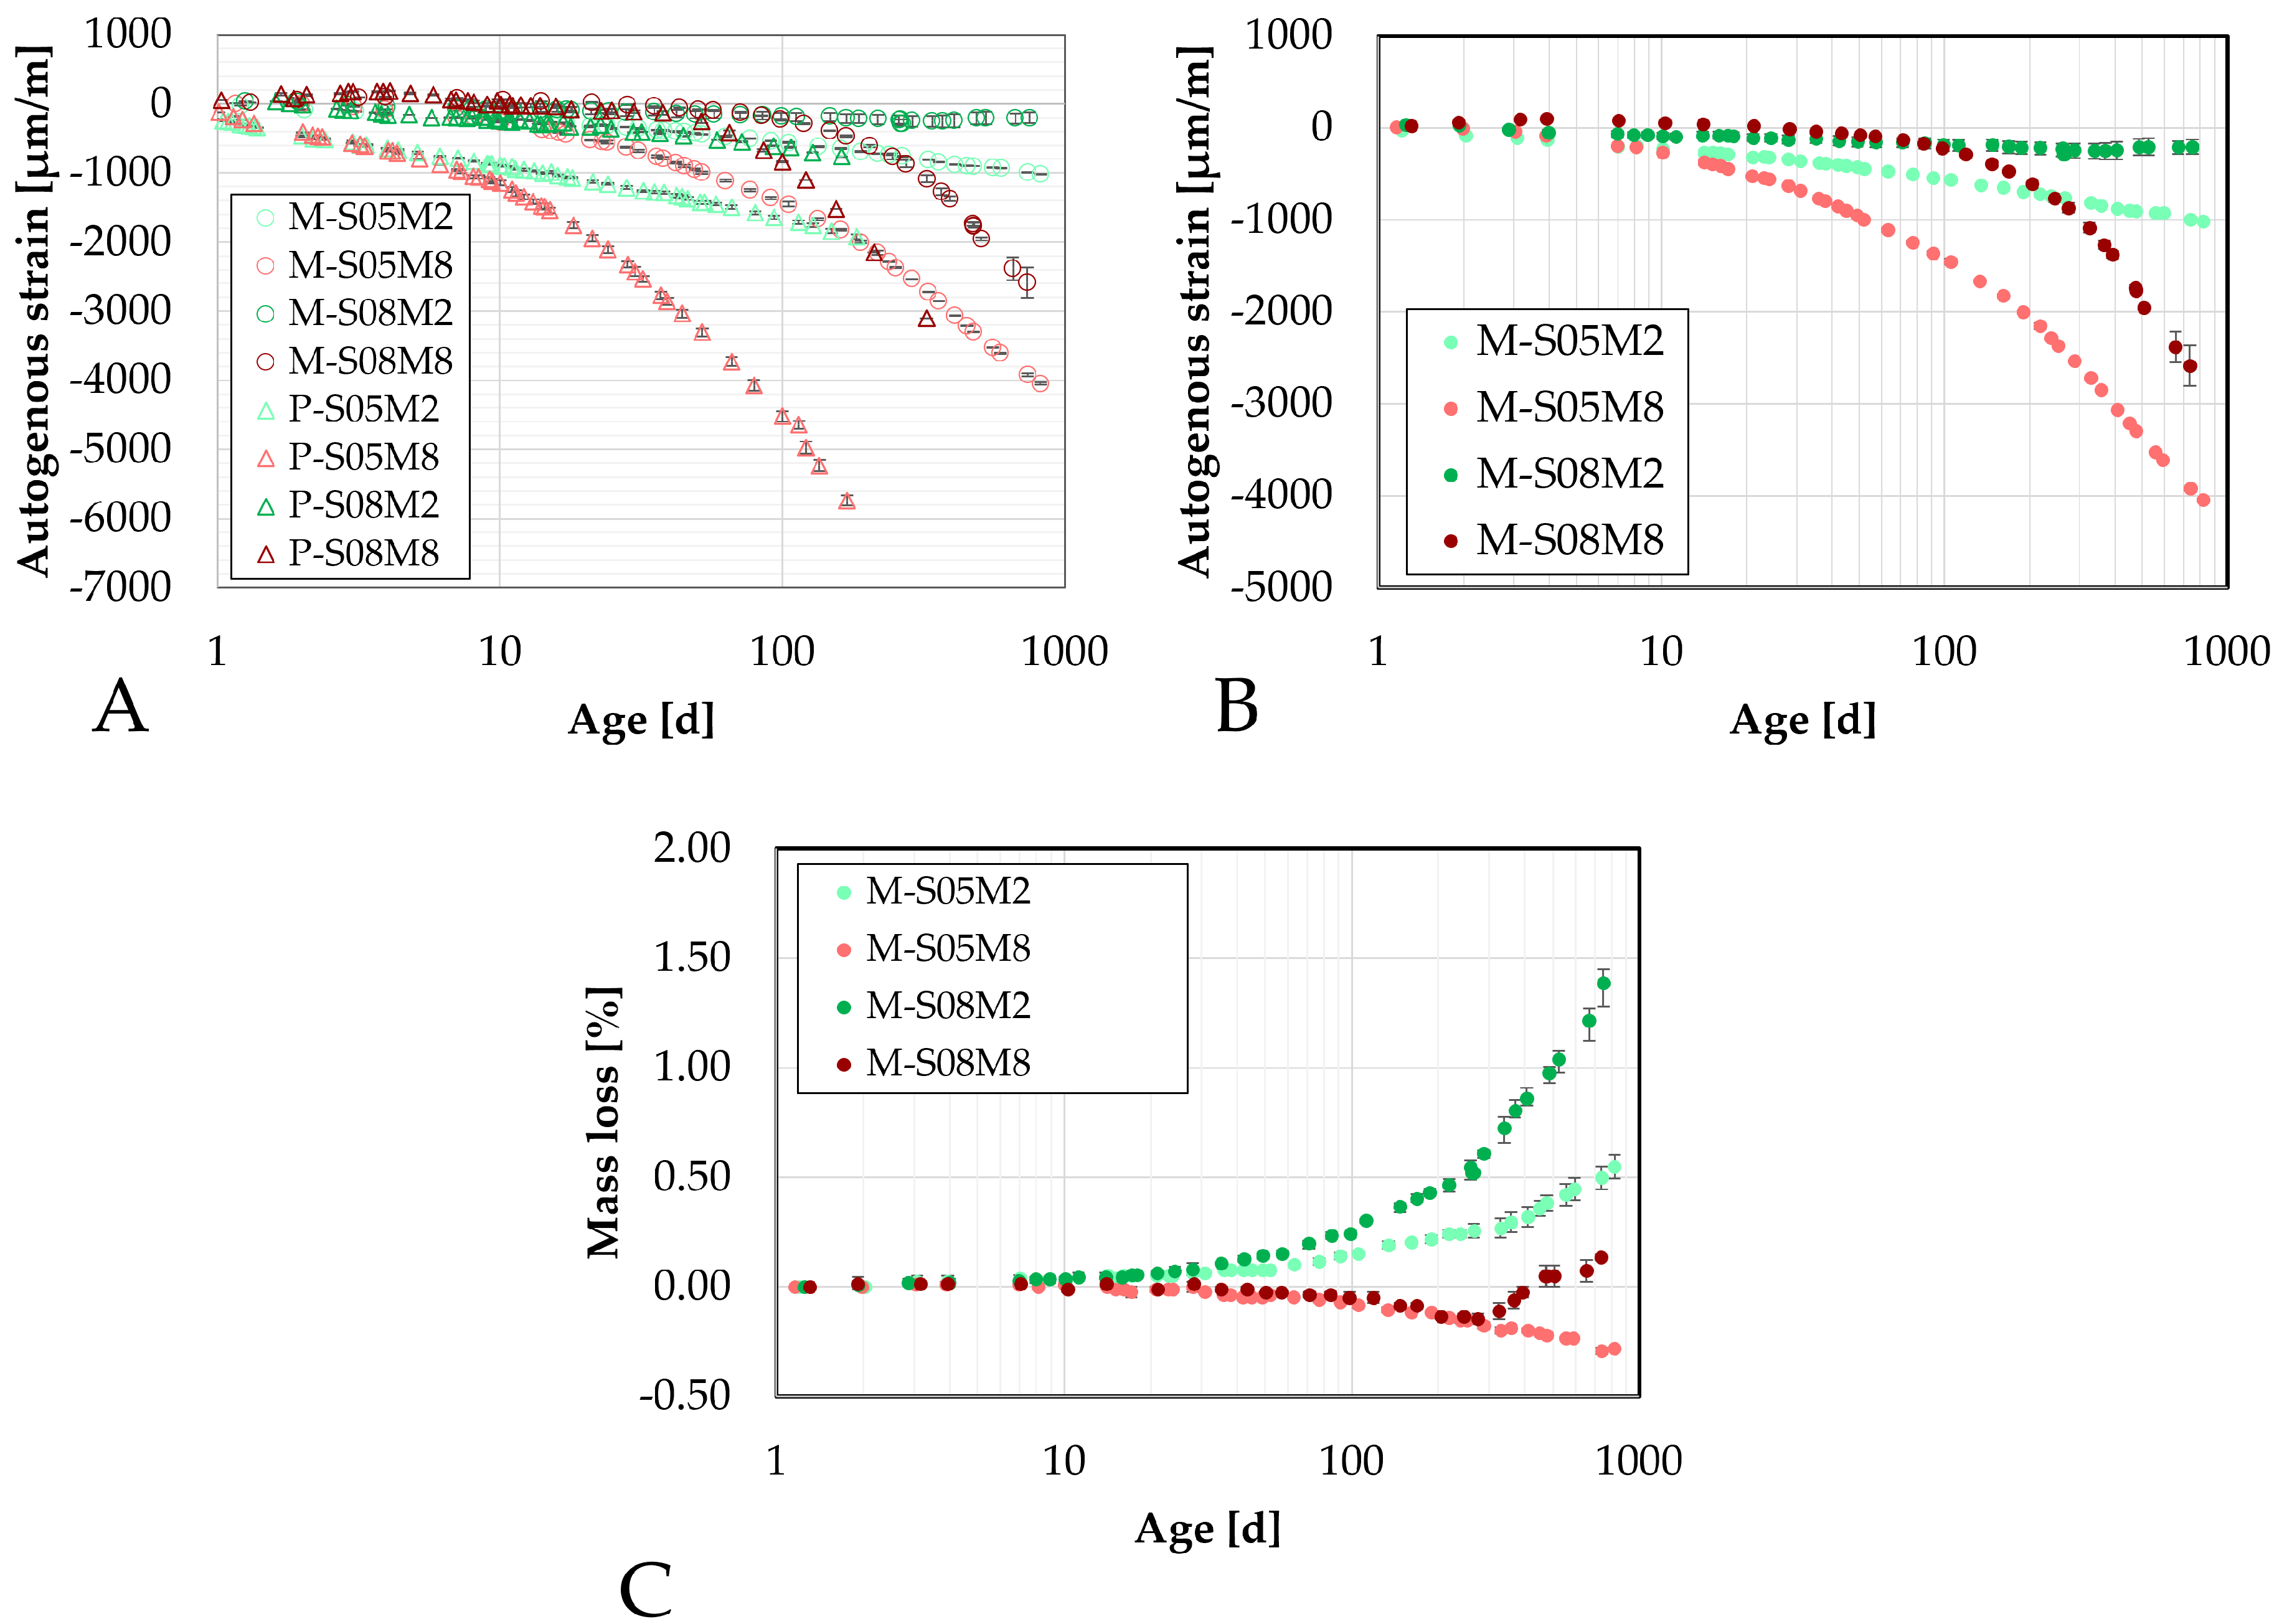
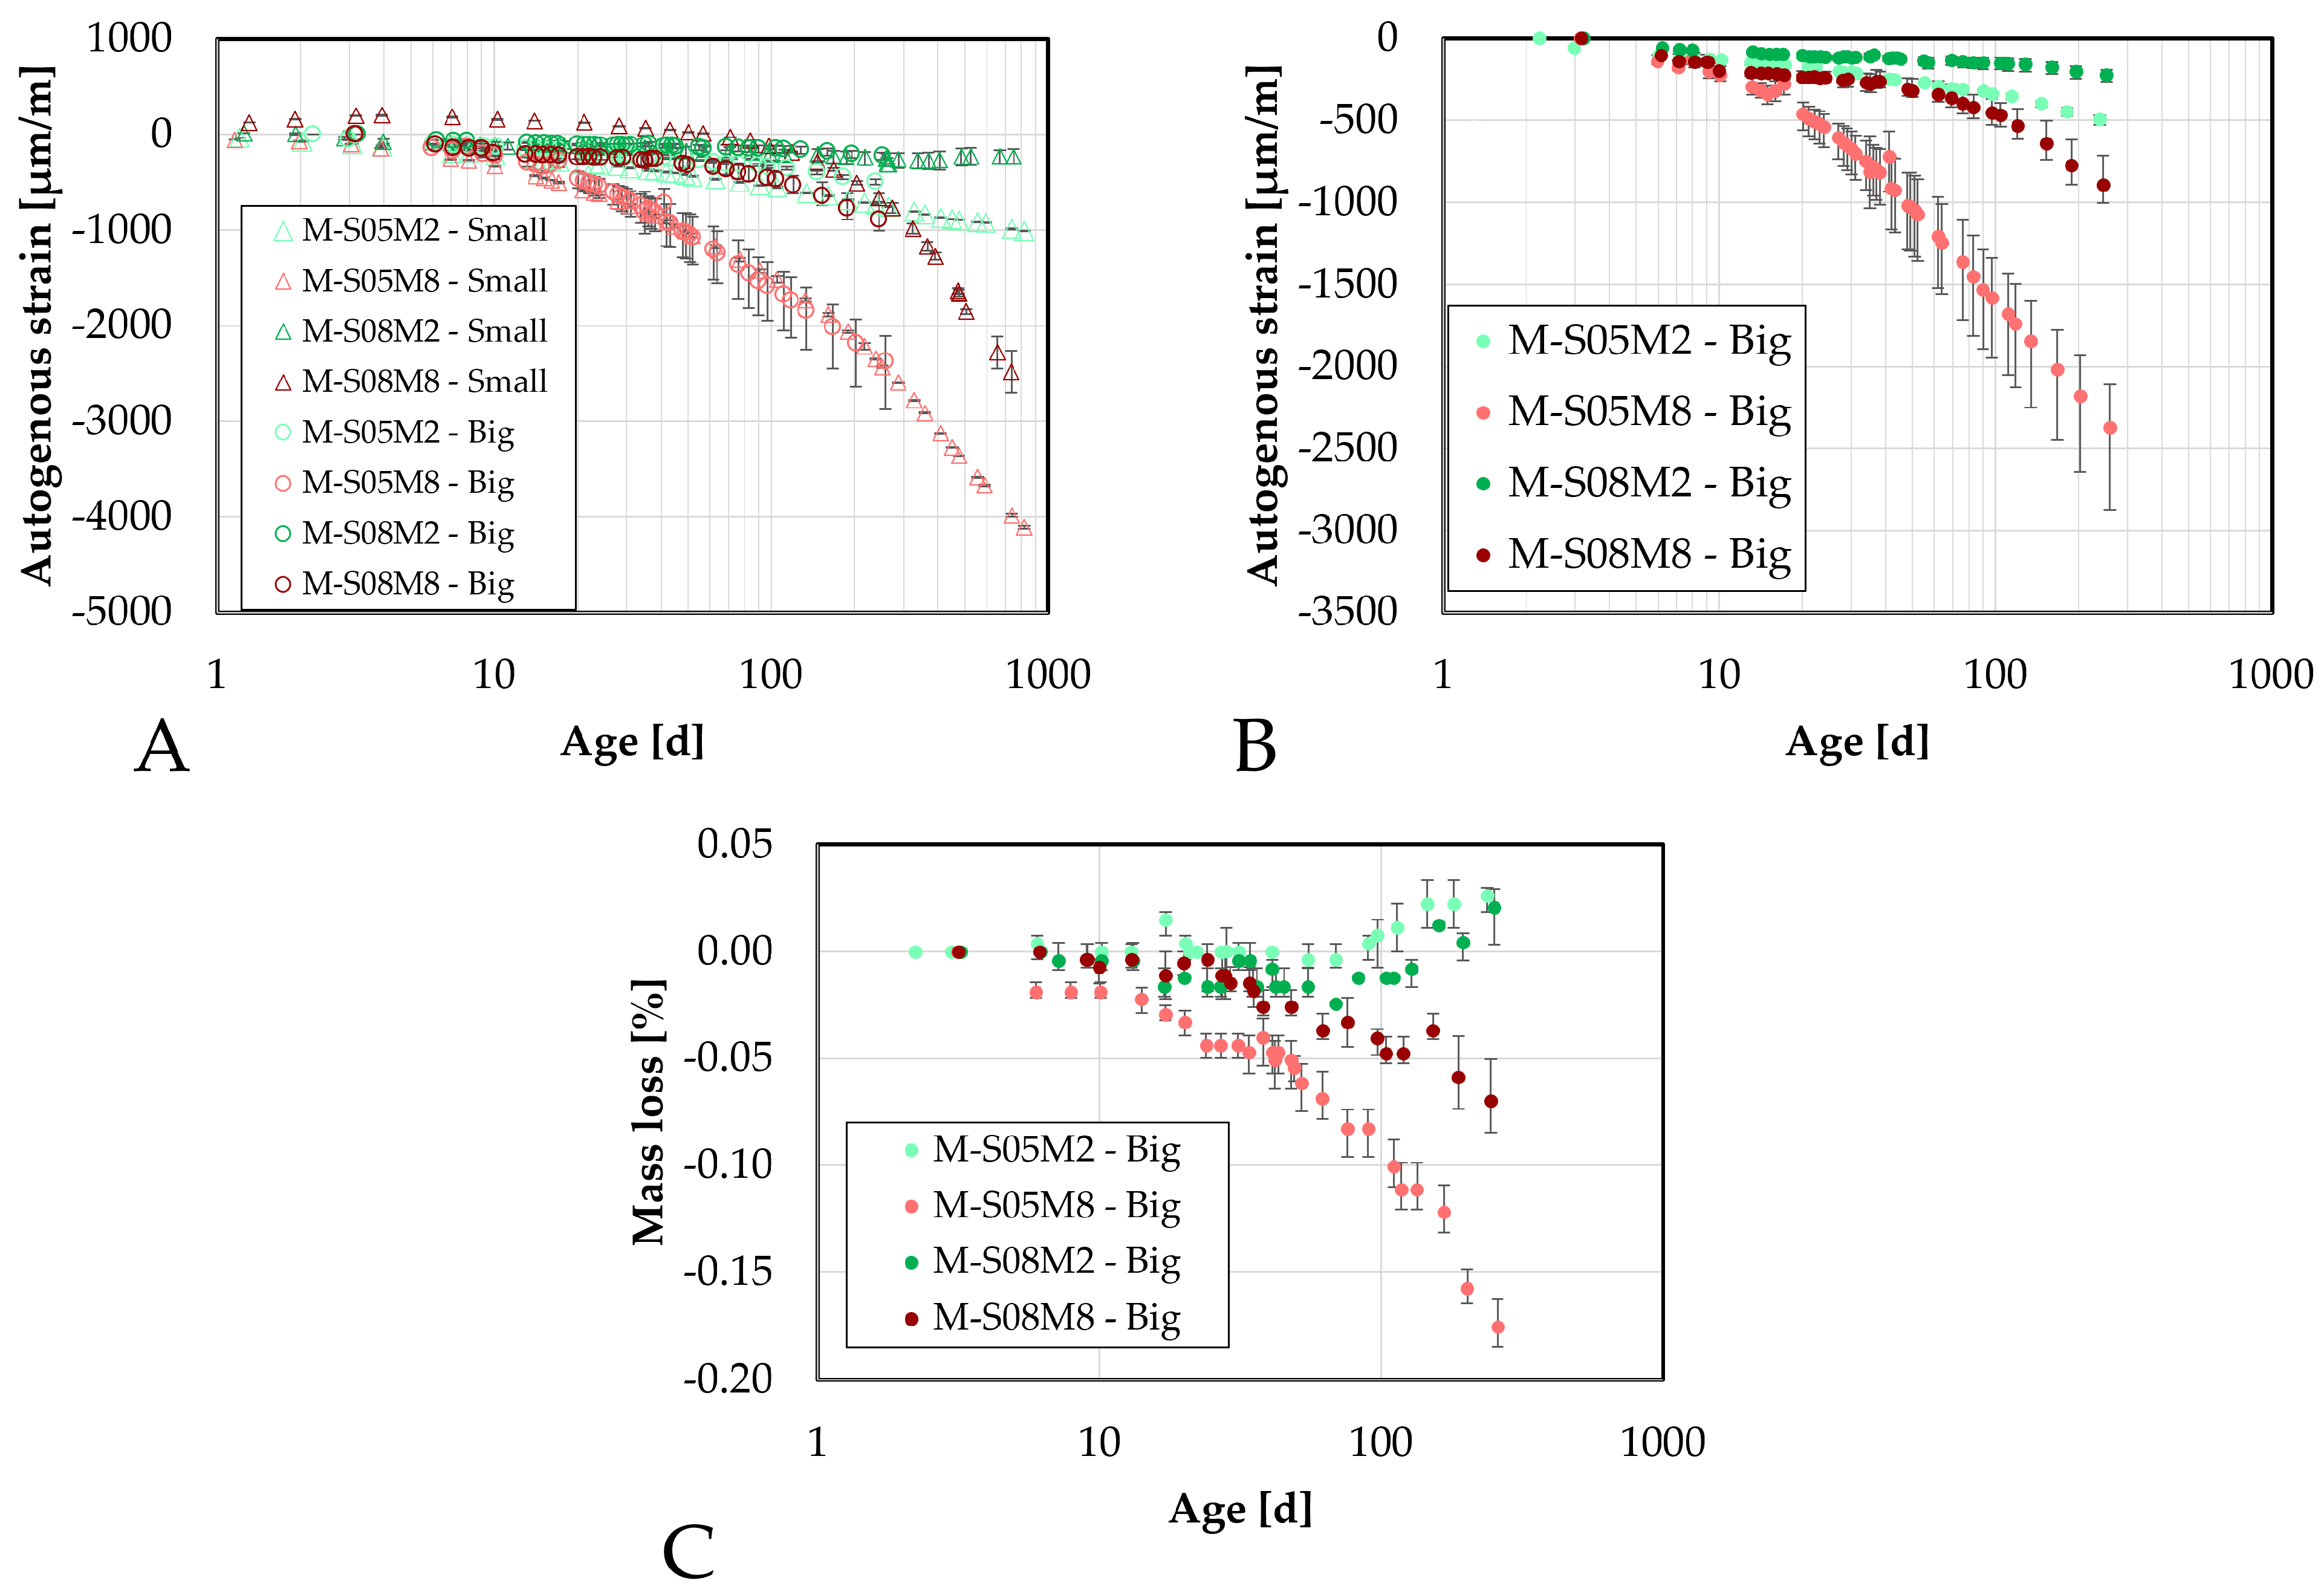
Autogenous strain of AAS mortar measured on the small DEMEC samples as function of the age: (A). comparison with the paste scale, (B). Comparison of the mortar scale, (C). Mass loss evolution.
Figure 13.
Autogenous strain of AAS mortar measured on the small DEMEC samples as function of the age: (A). comparison with the paste scale, (B). Comparison of the mortar scale, (C). Mass loss evolution.
Figure 14.
Autogenous strain of AAS mortar measured on the big DEMEC samples as function of the age: (A). comparison with the small scale, (B). Comparison of the mortar scale, (C). mass loss evolution.
Figure 14.
Autogenous strain of AAS mortar measured on the big DEMEC samples as function of the age: (A). comparison with the small scale, (B). Comparison of the mortar scale, (C). mass loss evolution.
Figure 15.
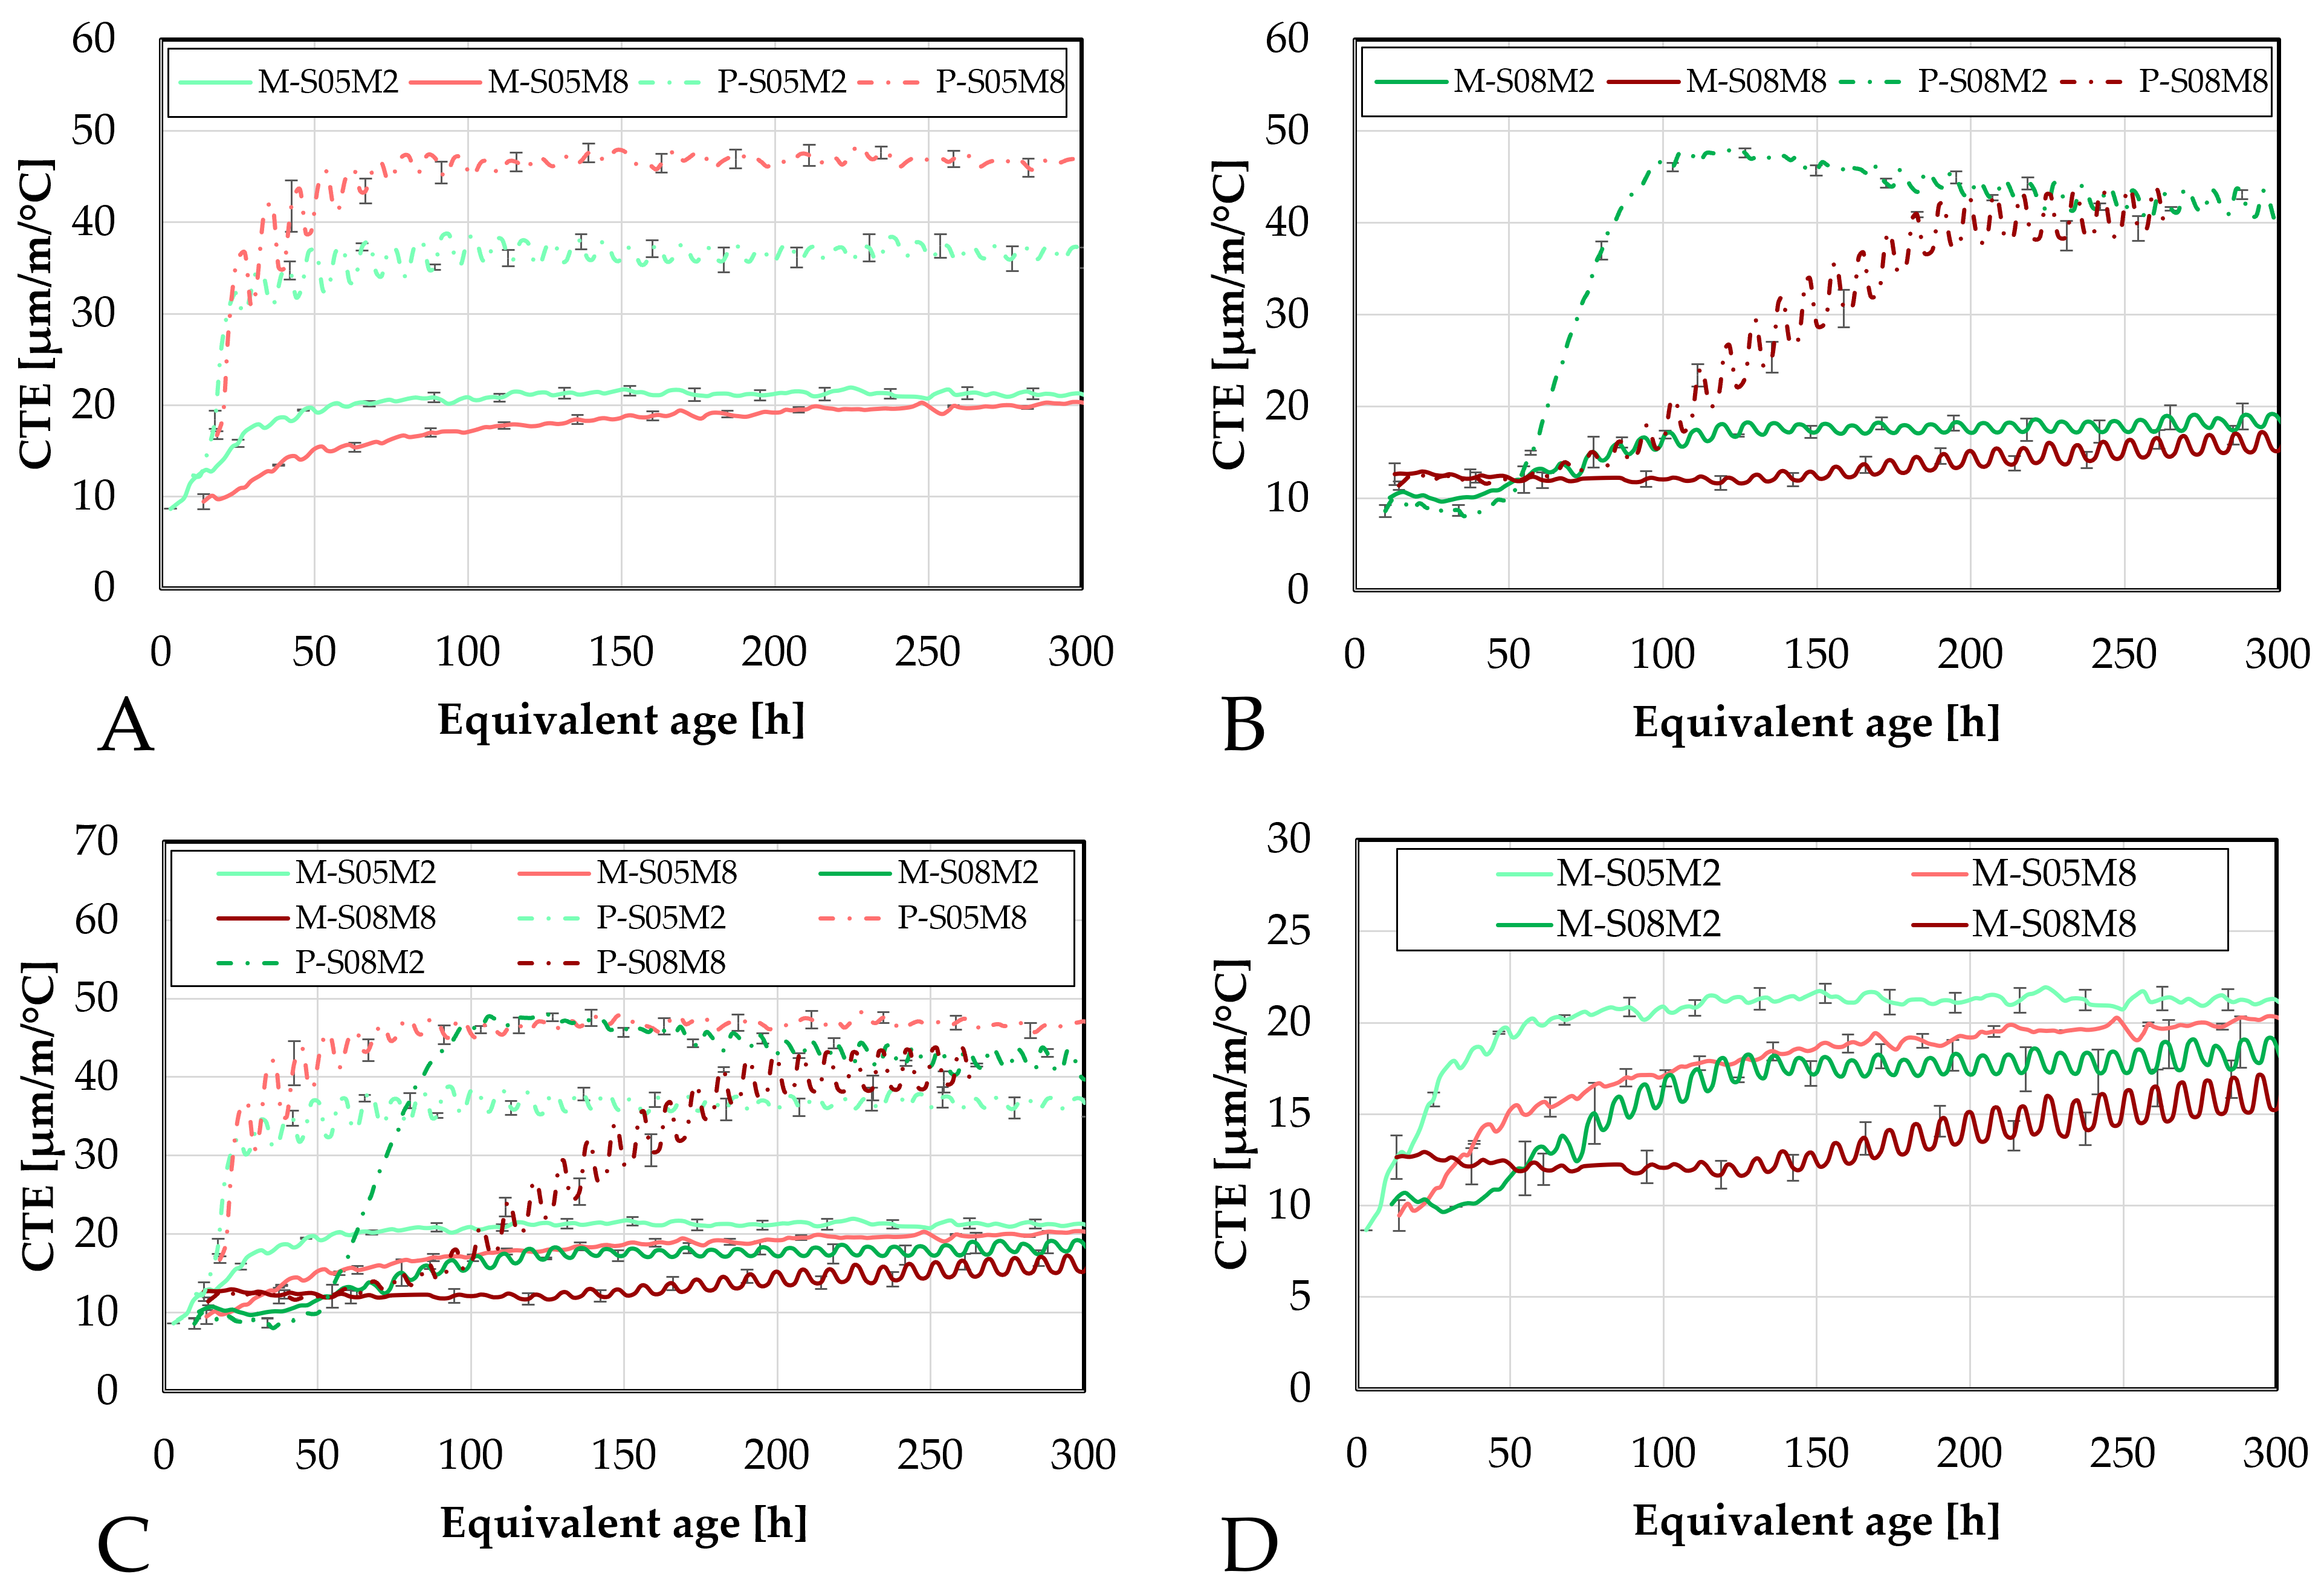
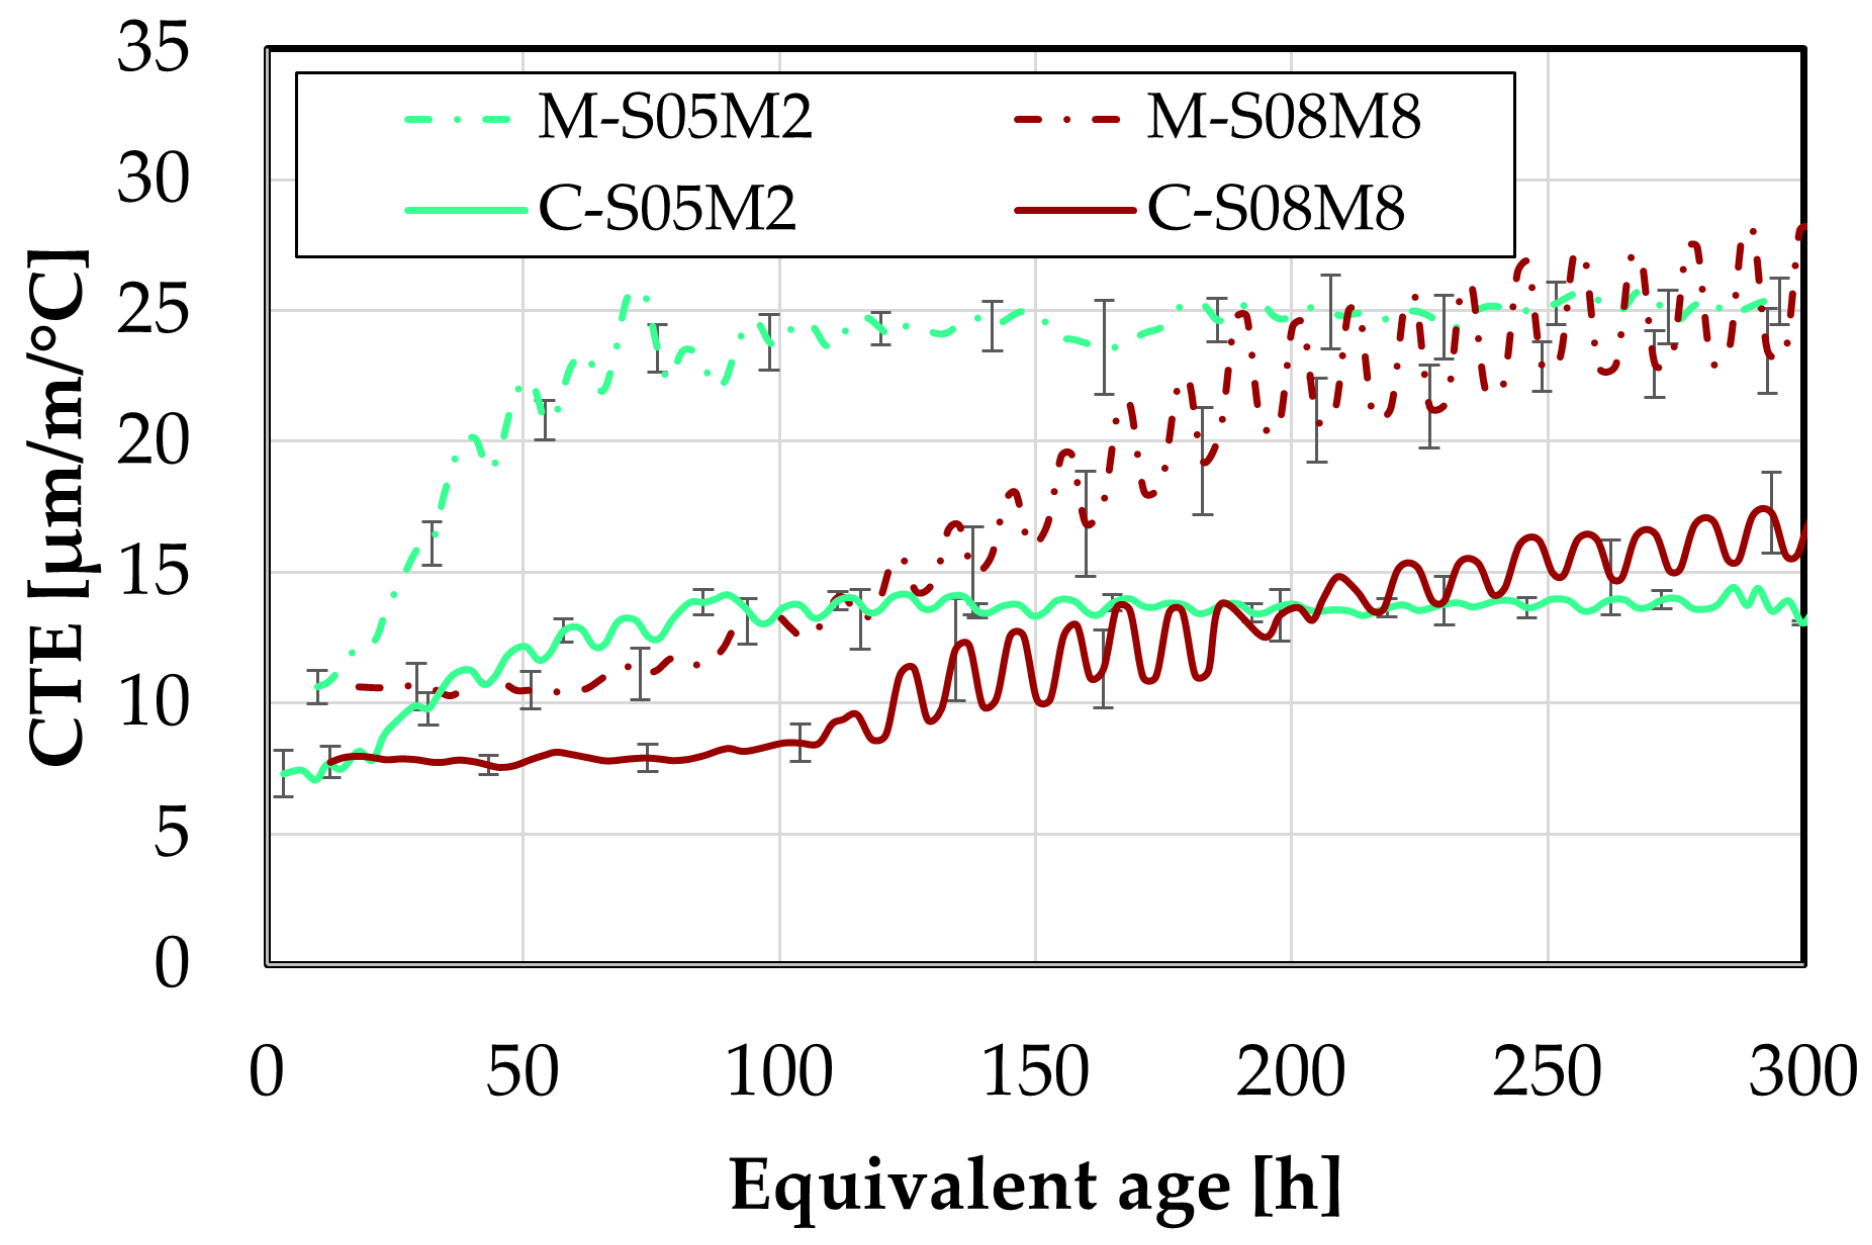
Coefficient of thermal expansion of AAS mortars obtained with the corrugated tubes method, presented as function of the equivalent age: (A). Compositions activated with S/B = 0.5 (compared to the equivalent paste compositions), (B). Compositions activated with S/B = 0.8, (C). Comparison of all mortar and paste compositions, (D). Comparison of the mortar compositions. M = mortar, P = paste.
Figure 16.
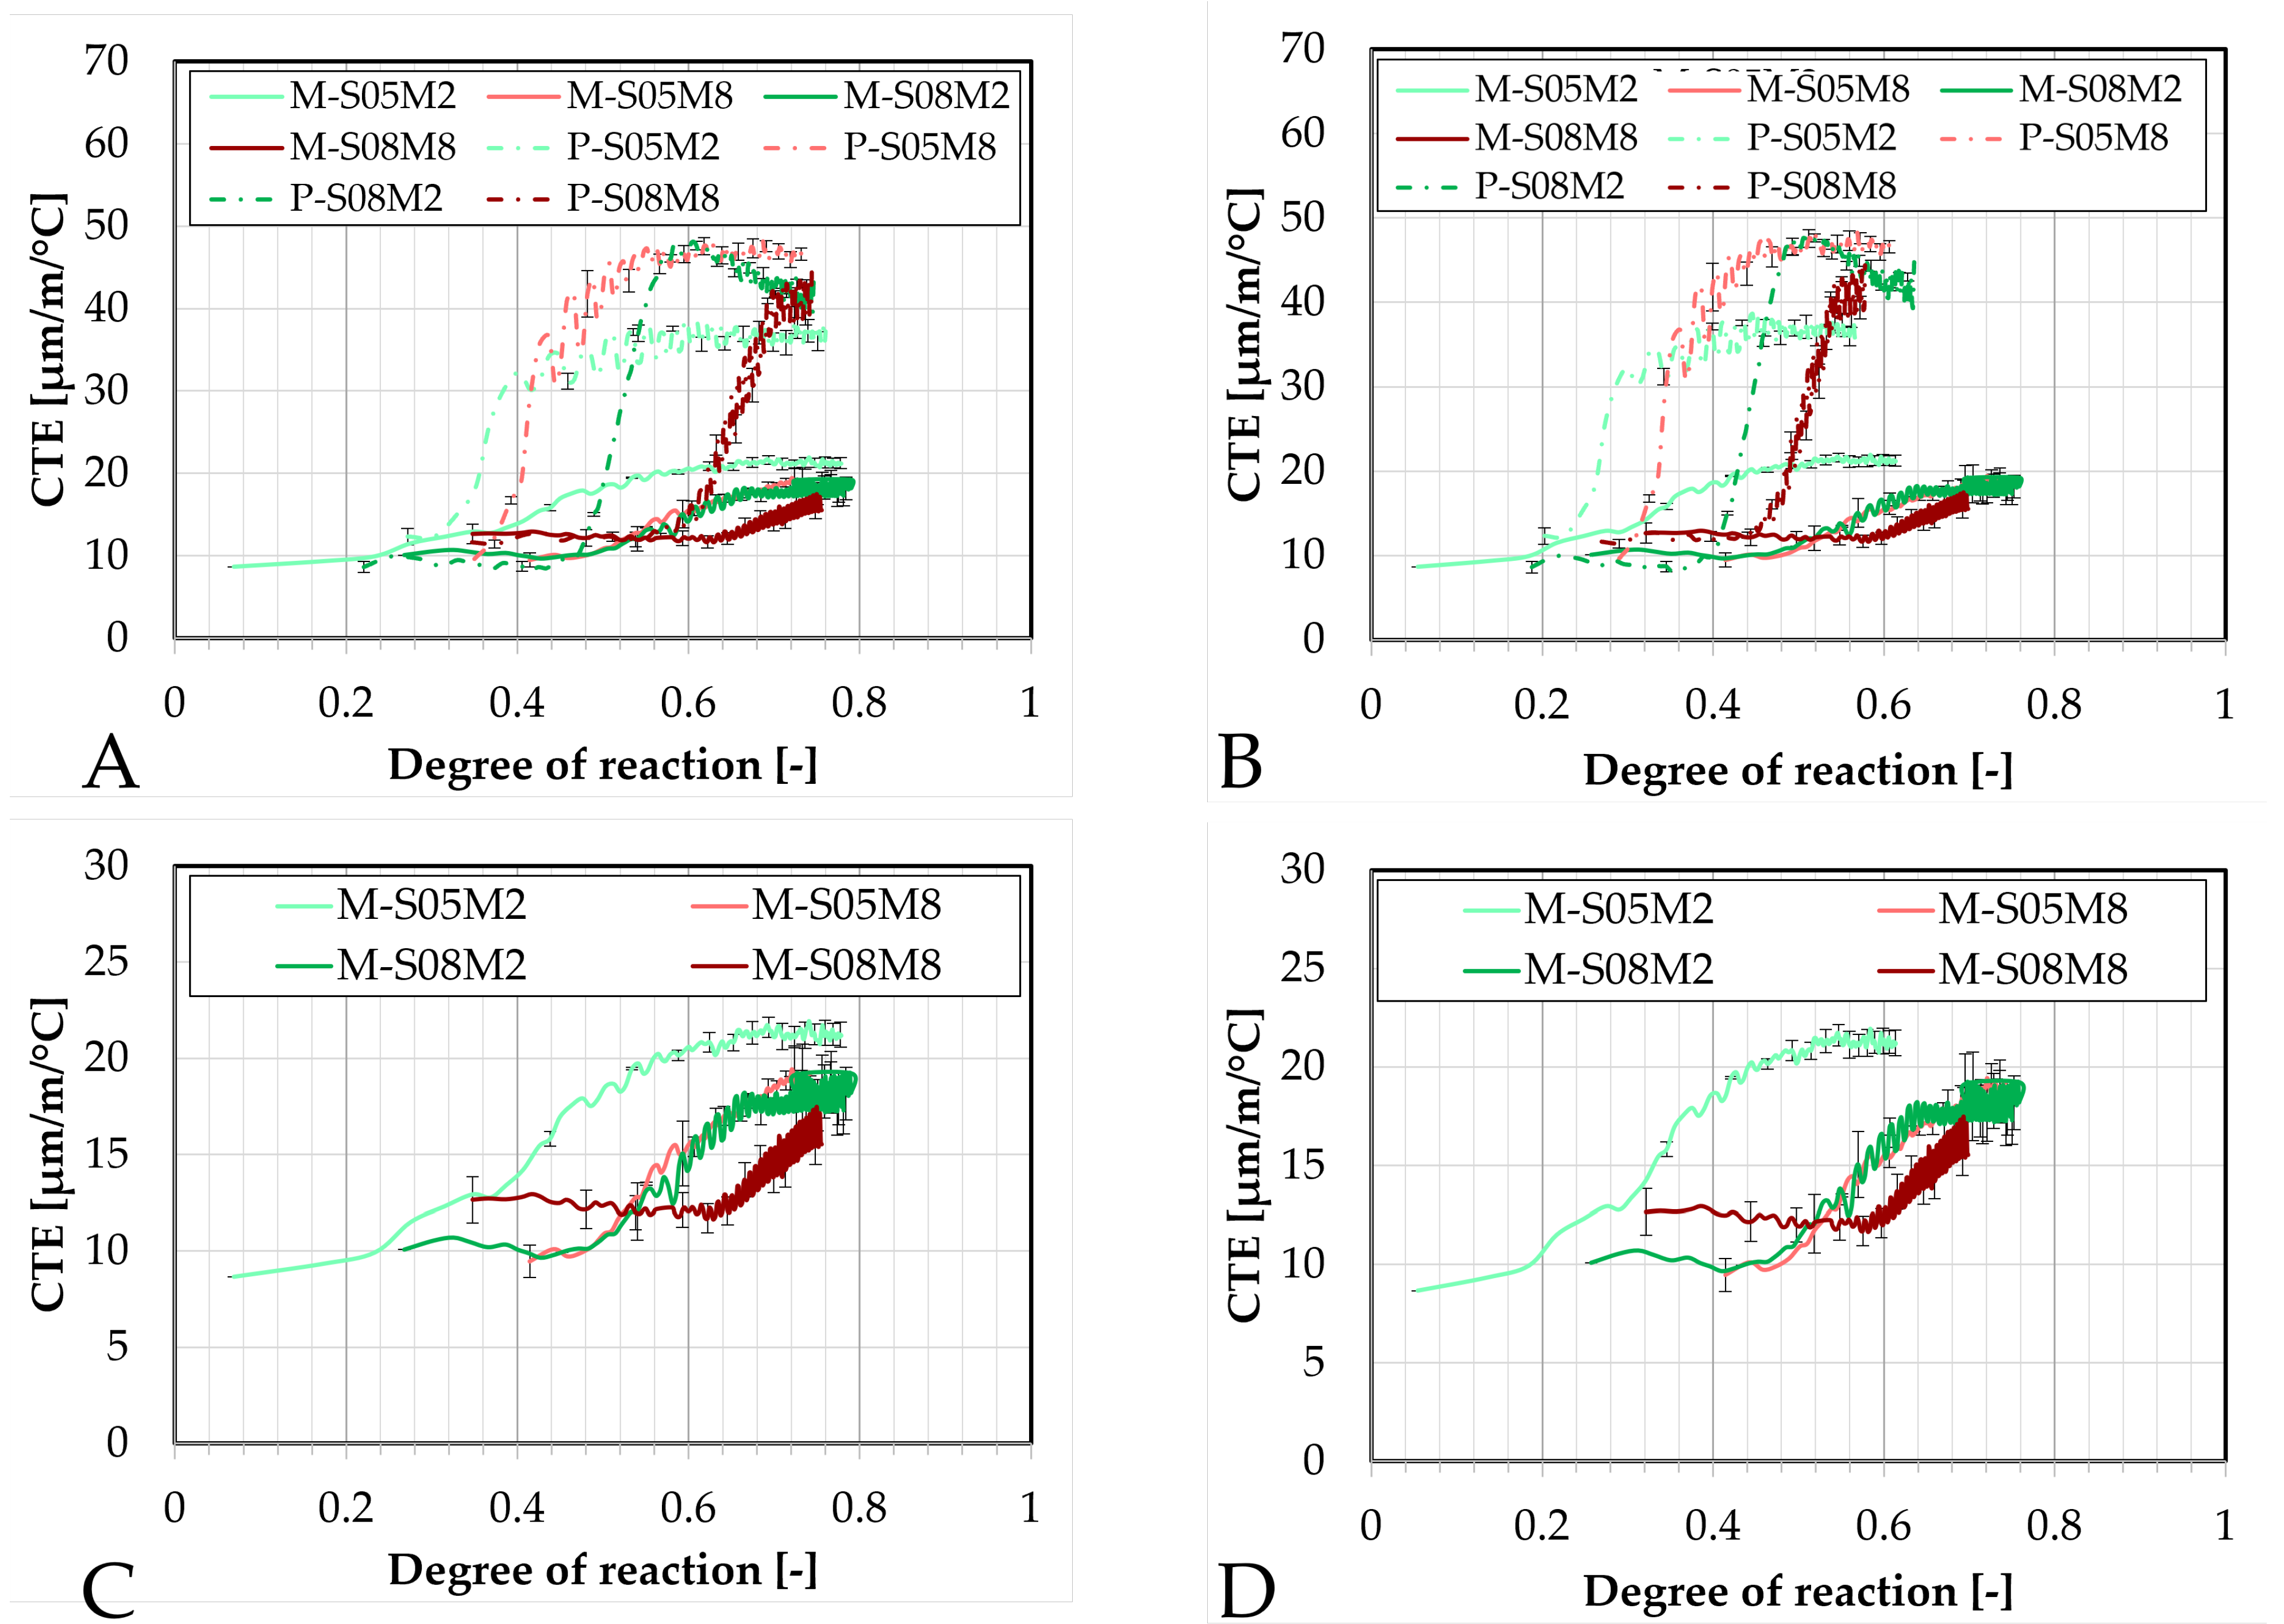
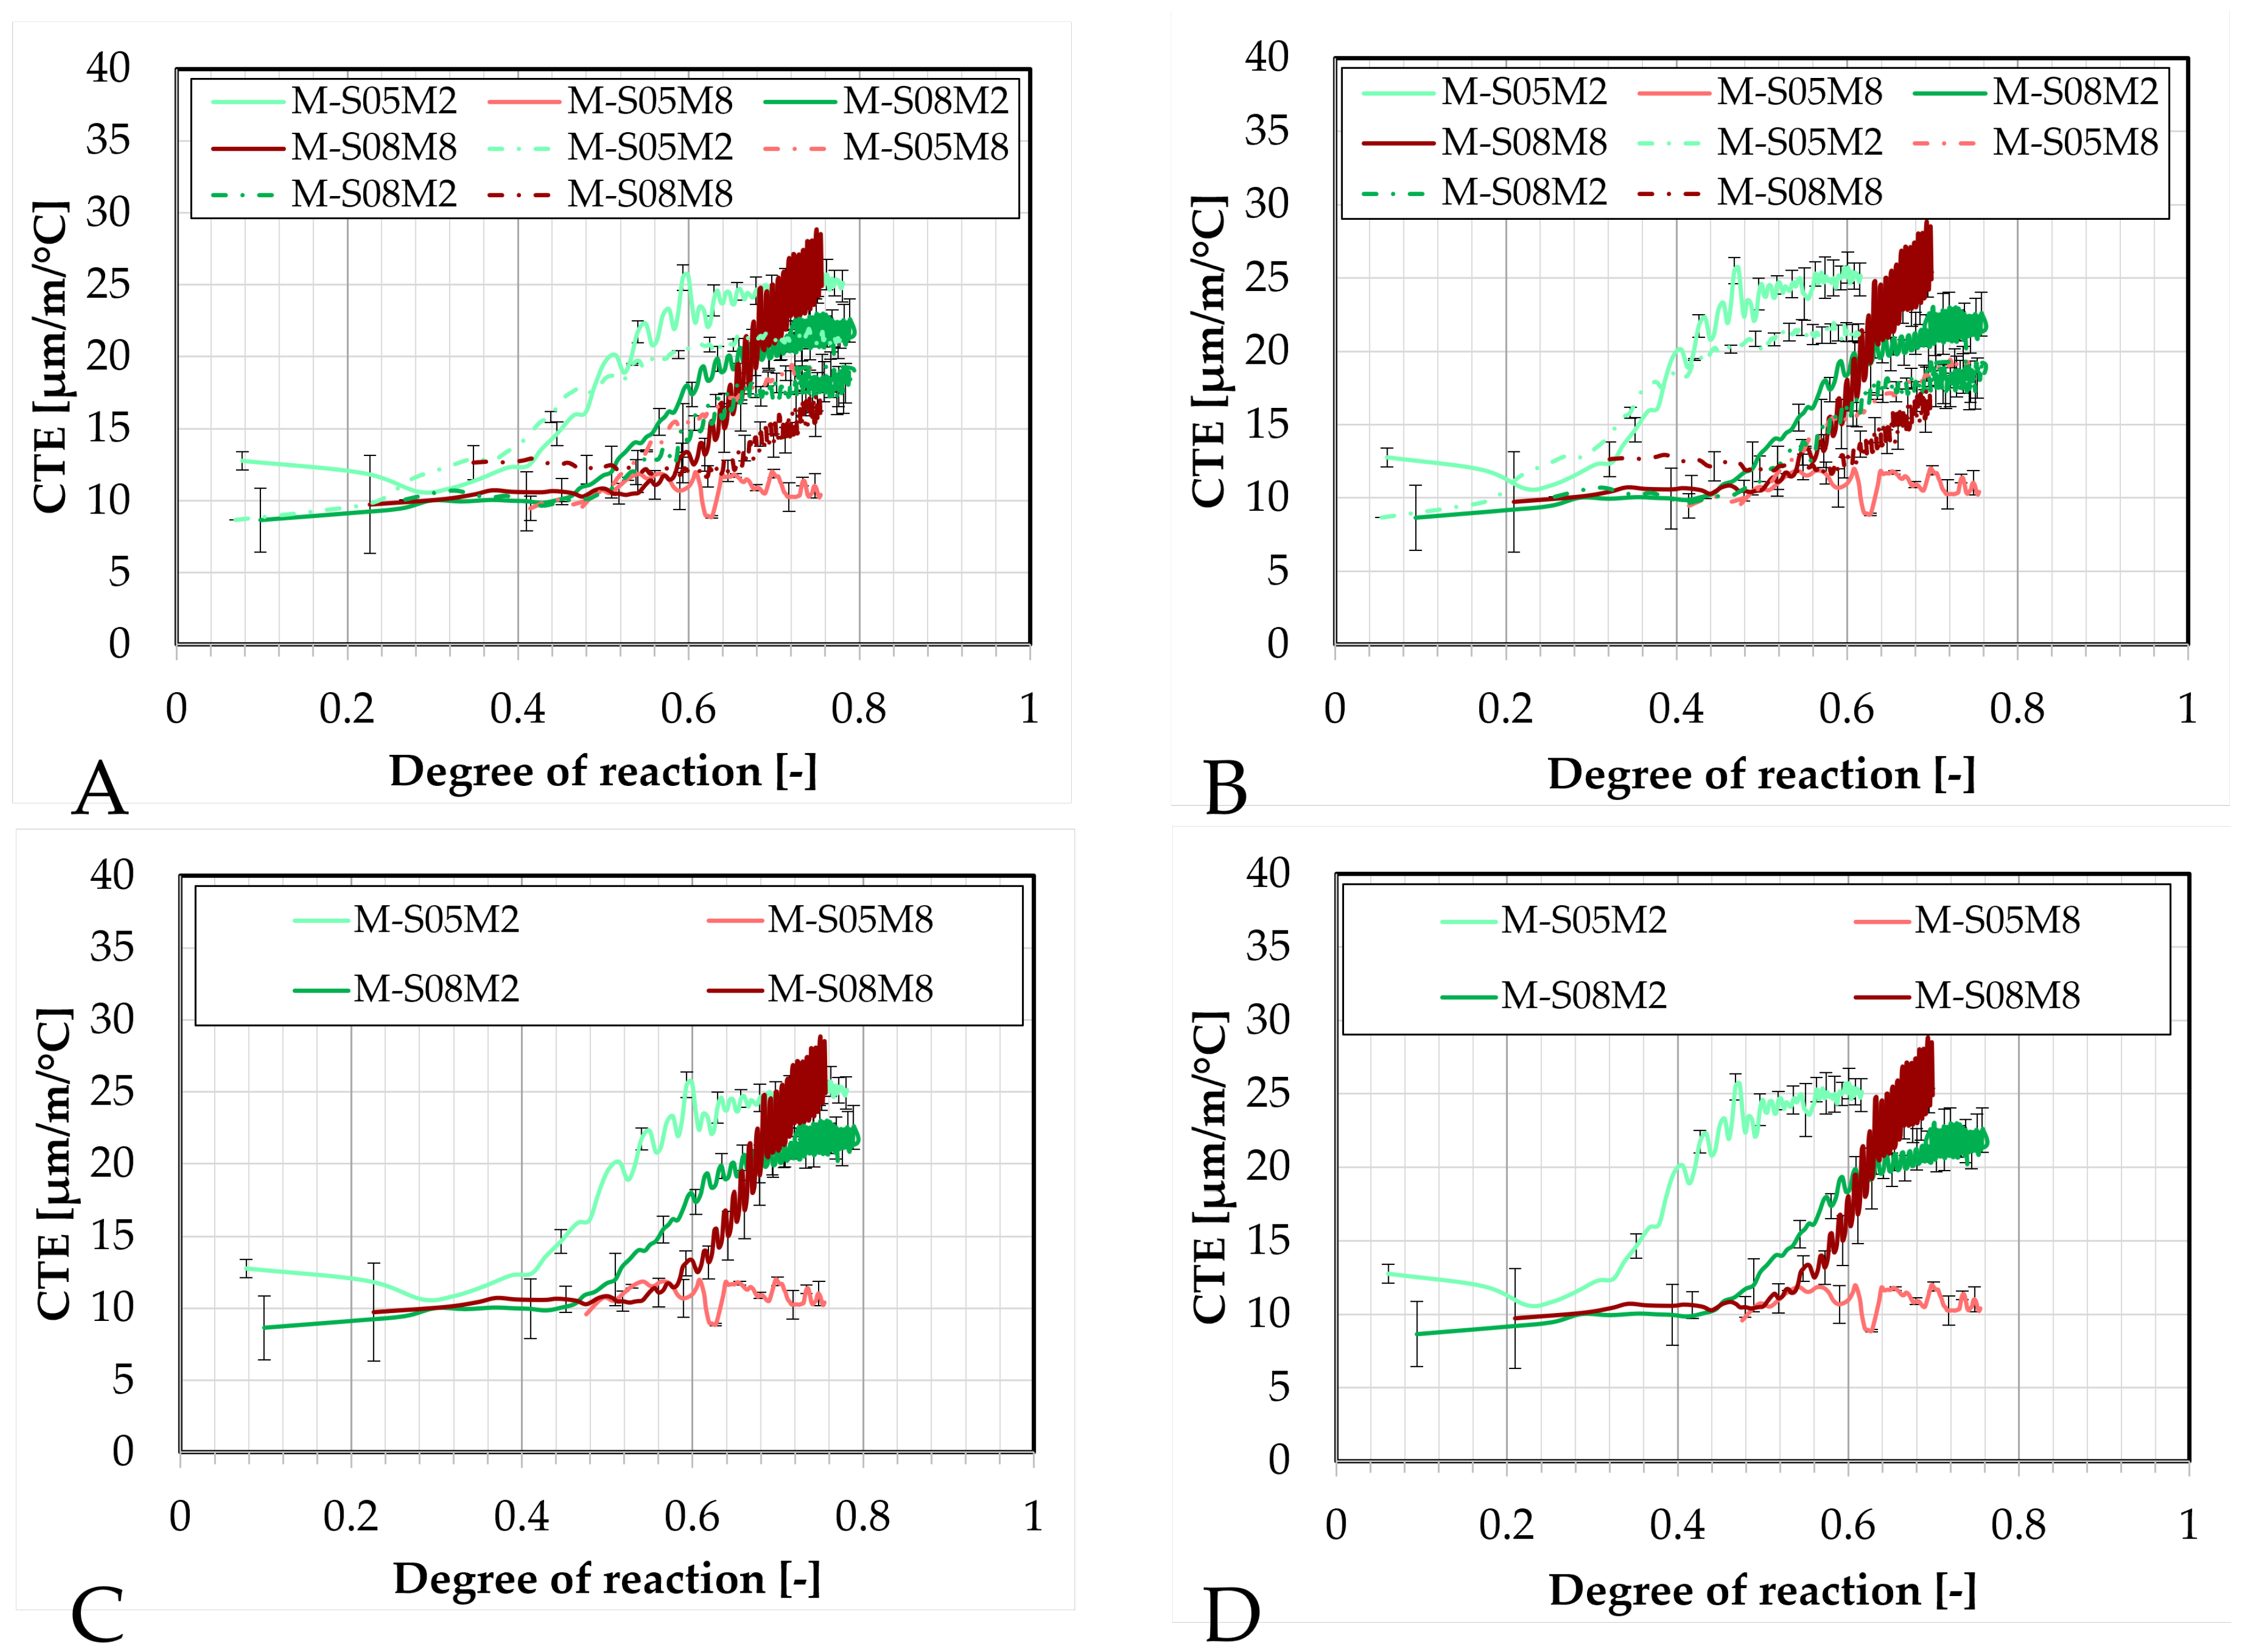
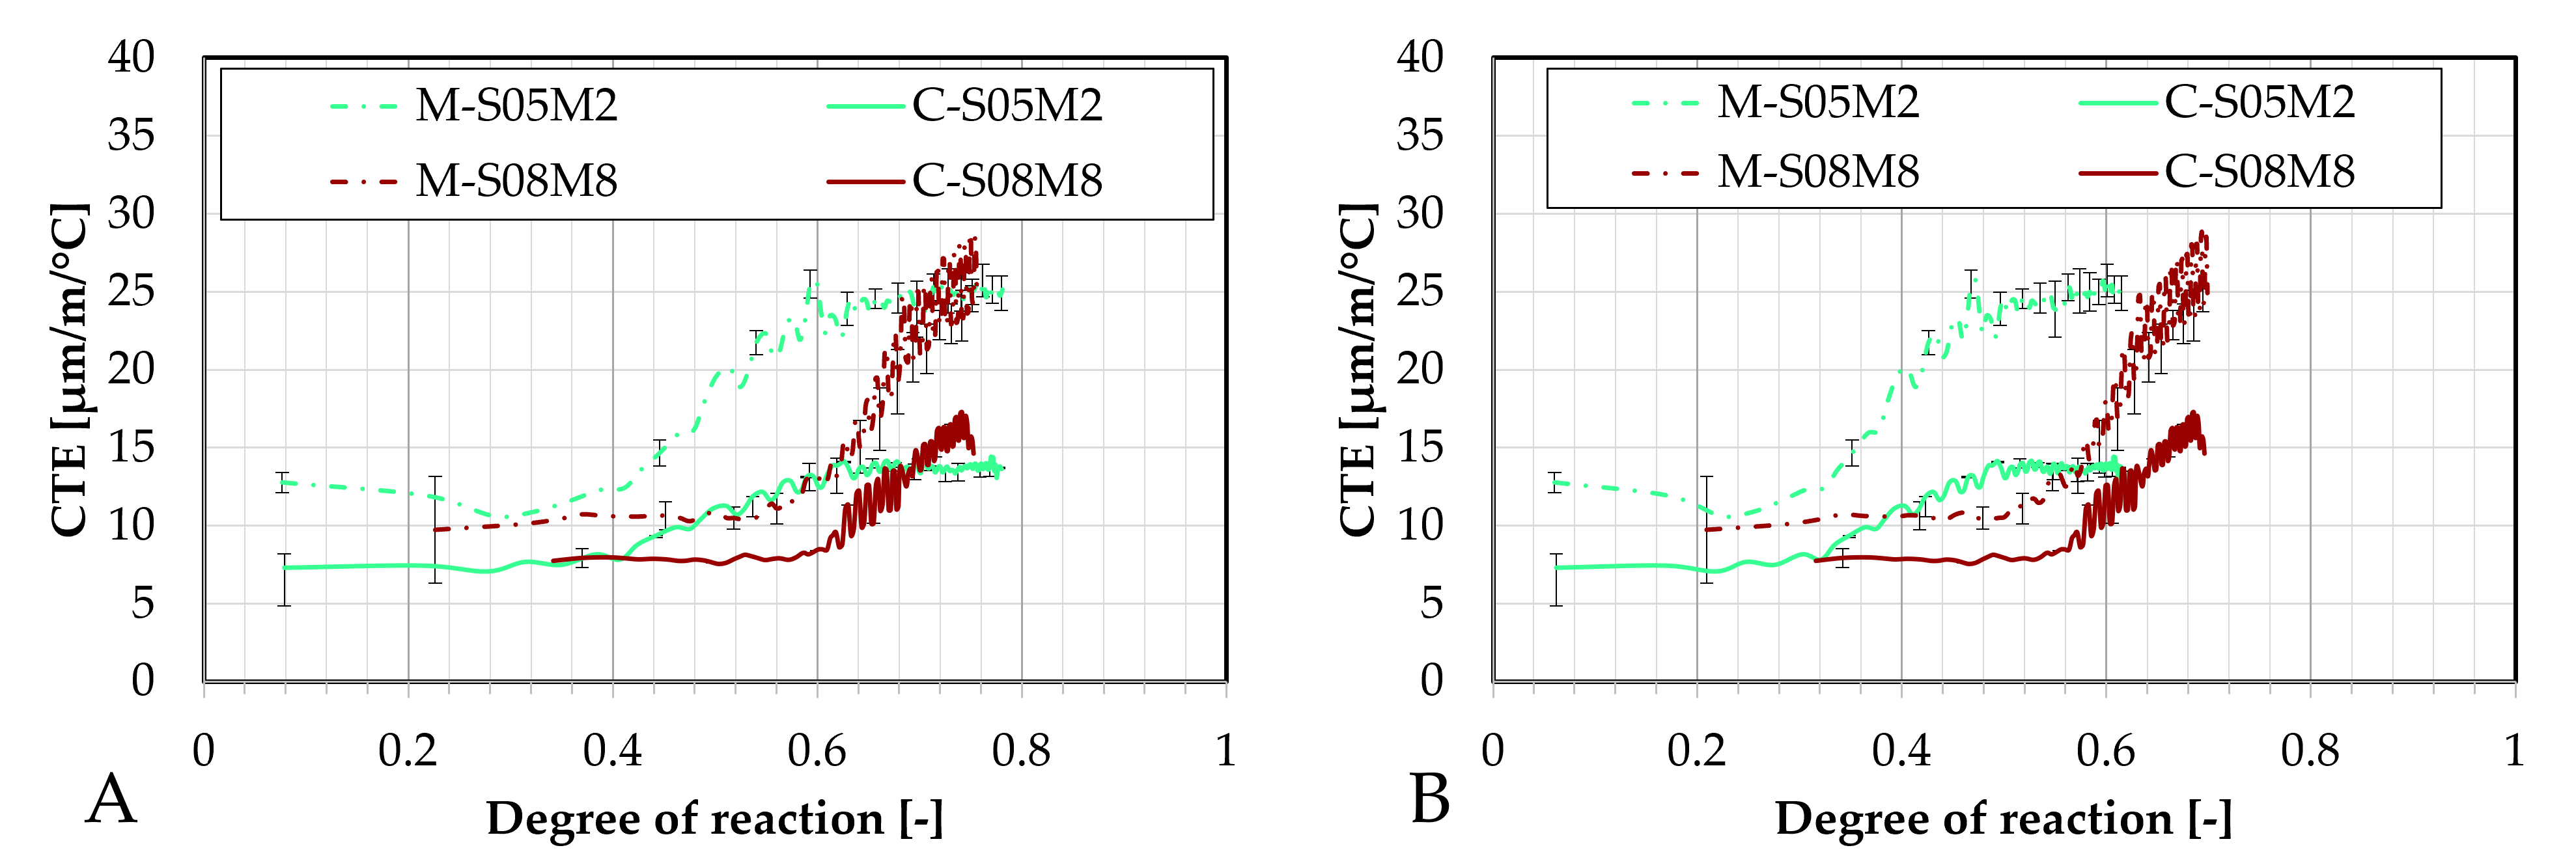
Comparison of the coefficient of thermal expansion obtained with the corrugated tubes method for all AAS mortar compositions as function of the degree of reaction: (A). determined with polynomially fitted ultimate heat compared to paste results, (B). determined with the exponentially fitted ultimate heat compared to the paste results, (C). determined with polynomially fitted ultimate heat, (D). determined with the exponentially fitted ultimate heat. — = mortar results, - · - : paste results.
Figure 17.
Parameters characterizing the coefficient of thermal expansion [
71].
Figure 17.
Parameters characterizing the coefficient of thermal expansion [
71].
Figure 18.
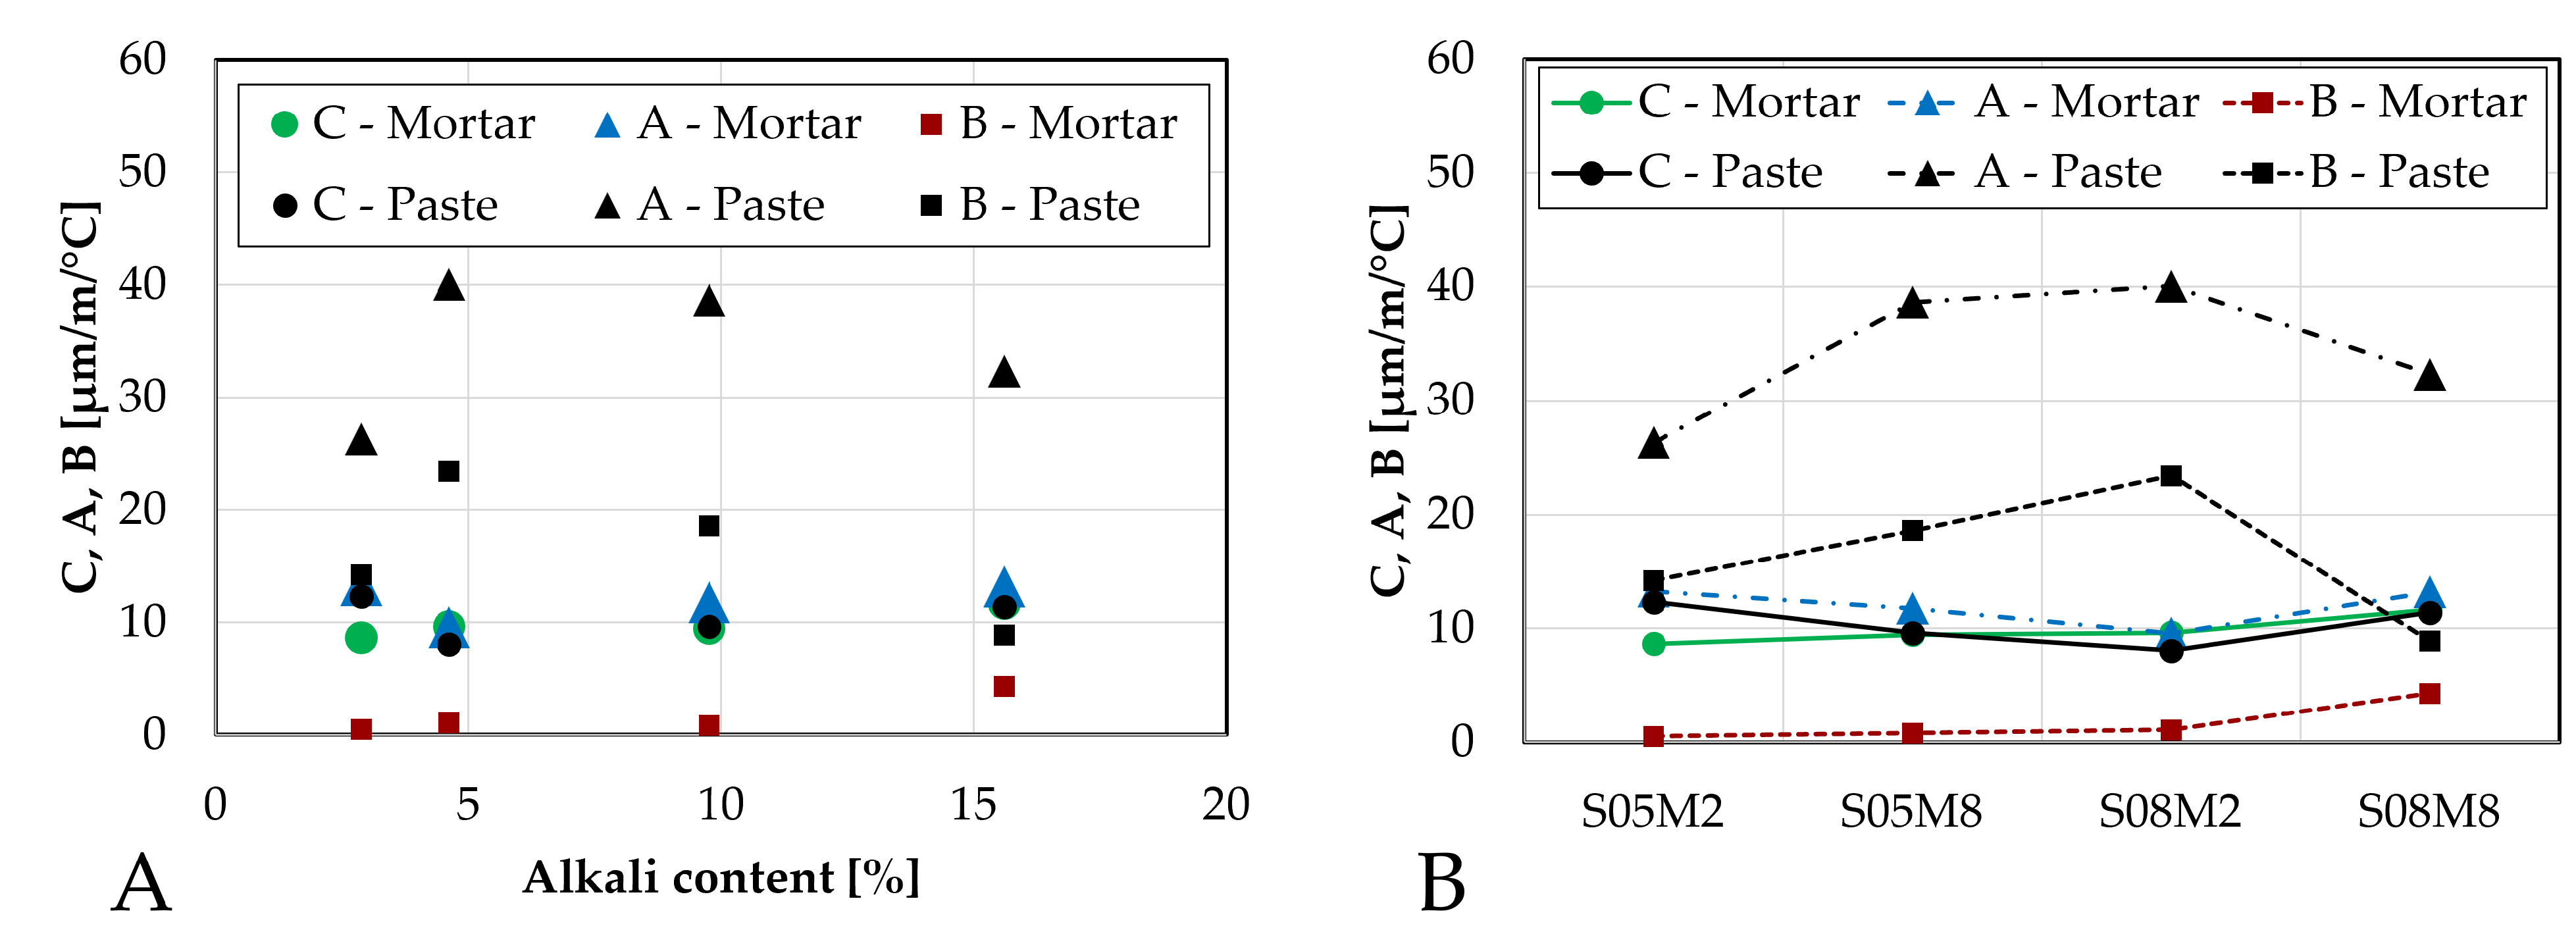
Parameters C, A and B characterizing the CTE of AAS mortars compared to the pastes: (A). as function of the alkali content; (B). as function of the compositions.
Figure 18.
Parameters C, A and B characterizing the CTE of AAS mortars compared to the pastes: (A). as function of the alkali content; (B). as function of the compositions.
Figure 19.
Coefficient of thermal expansion of AAS mortars obtained with the BTJade method, presented as function of the equivalent age: (A). Compositions activated with S/B = 0.5 (compared to the corrugated tubes method), (B). Compositions activated with S/B = 0.8, (C). Comparison of all mortar compositions on both methods, (D). Comparison of the mortar compositions with BTJade. — = BTJade, -- = Corrugated tubes.
Figure 20.
Comparison of the coefficient of thermal expansion obtained with the BTJade method for all AAS mortar compositions as function of the degree of reaction: (A). determined with polynomially fitted ultimate heat compared to the corrugated method, (B). determined with the exponentially fitted ultimate heat compared to the corrugated method, (C). determined with polynomially fitted ultimate heat, (D). determined with the exponentially fitted ultimate heat. (— = BTJade results, - · - = Corrugated tubes method).
Figure 21.
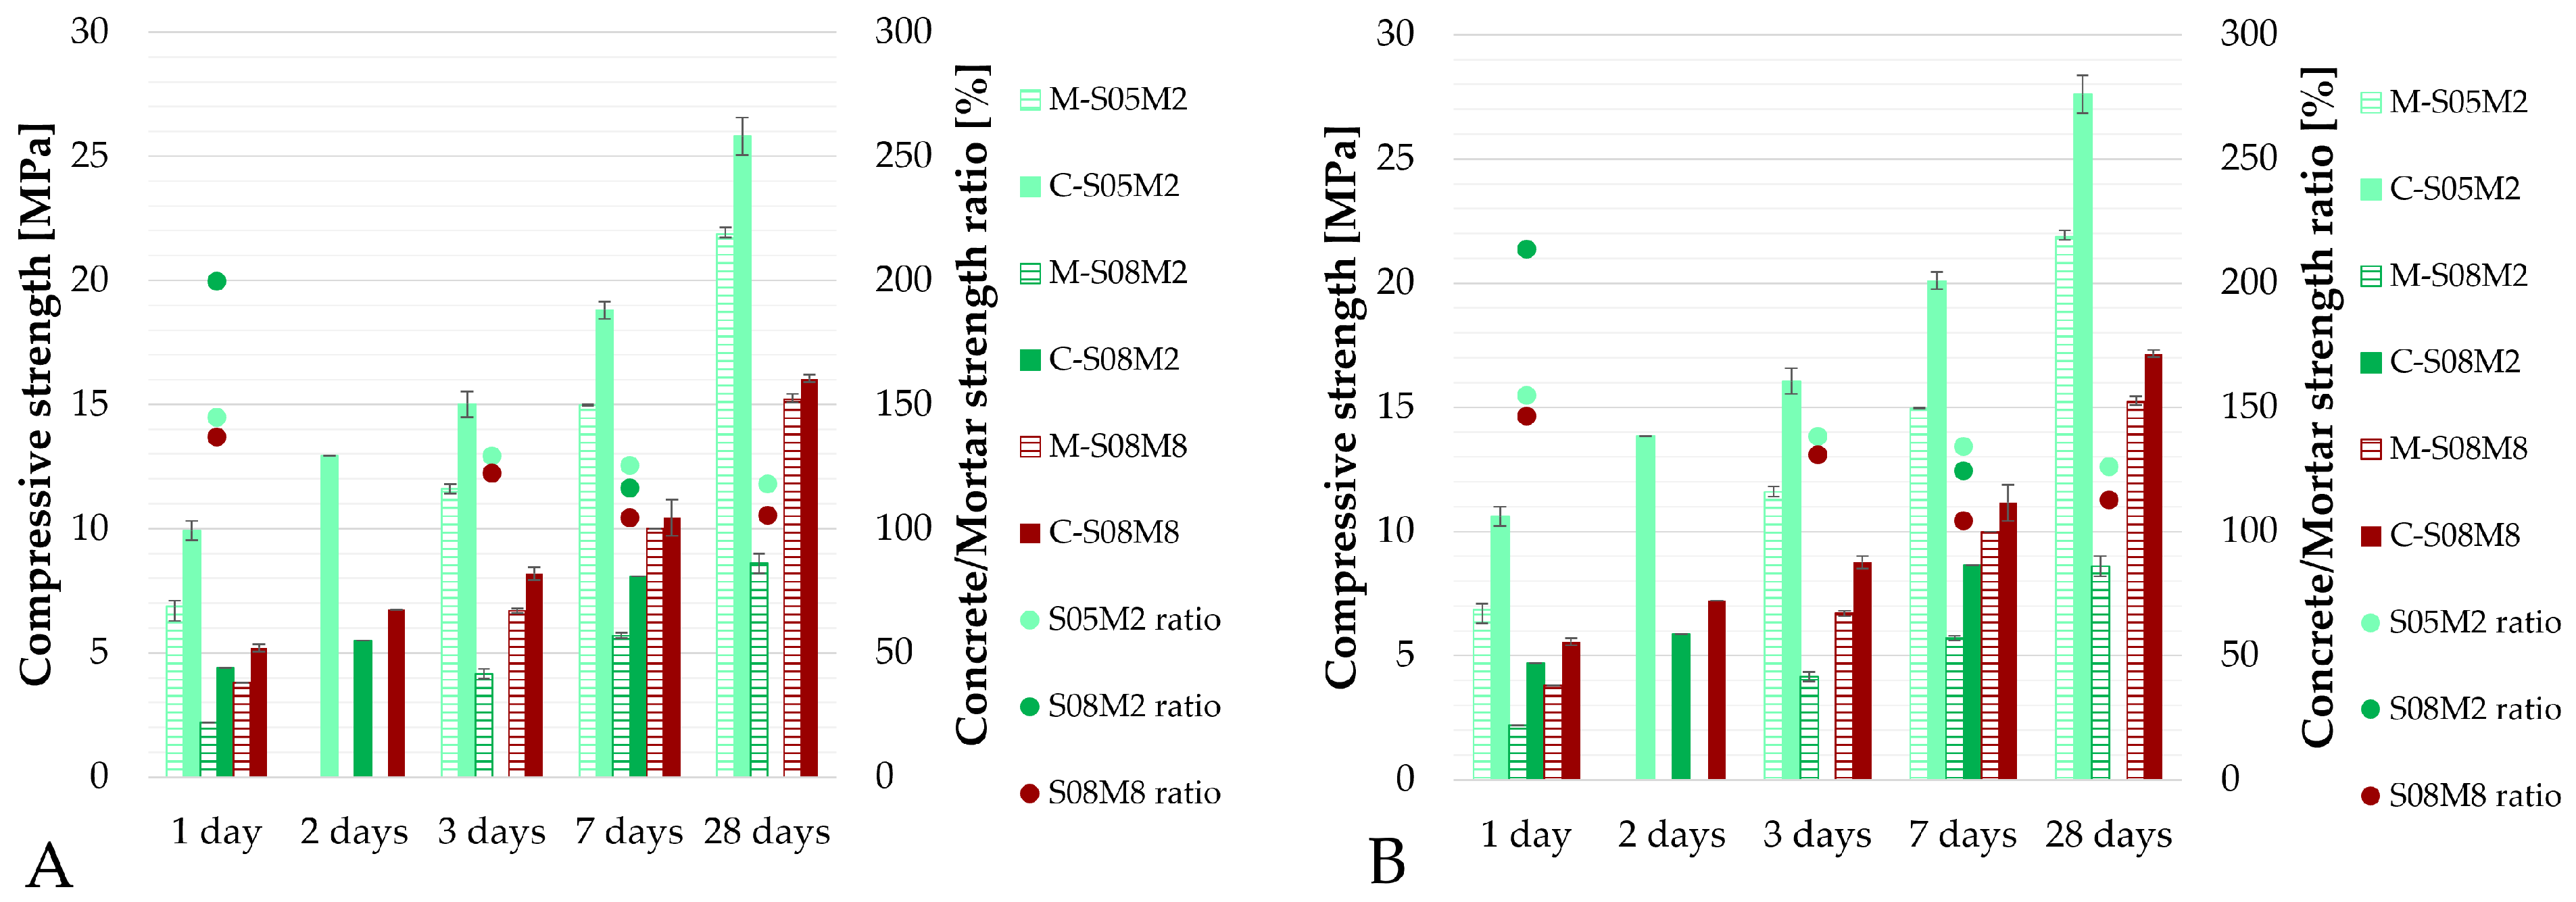
Compressive strength of: (A). AAS concrete cubes (10 × 10 × 10 cm3) compared mortar cubes (5 × 5 × 5 cm3), (B). AAS concrete cubes (equivalent 5 × 5 × 5 cm3) compared mortar cubes (5 × 5 × 5 cm3). Legend: bars: compressive strength, dots: compressive strength ratio between concrete and mortar scale.
Figure 22.
Tensile strength of AAS concrete: (A). as a function of the age, (B). as a function of the compressive strength (mod = modified prediction of the tensile strength).
Figure 22.
Tensile strength of AAS concrete: (A). as a function of the age, (B). as a function of the compressive strength (mod = modified prediction of the tensile strength).
Figure 23.
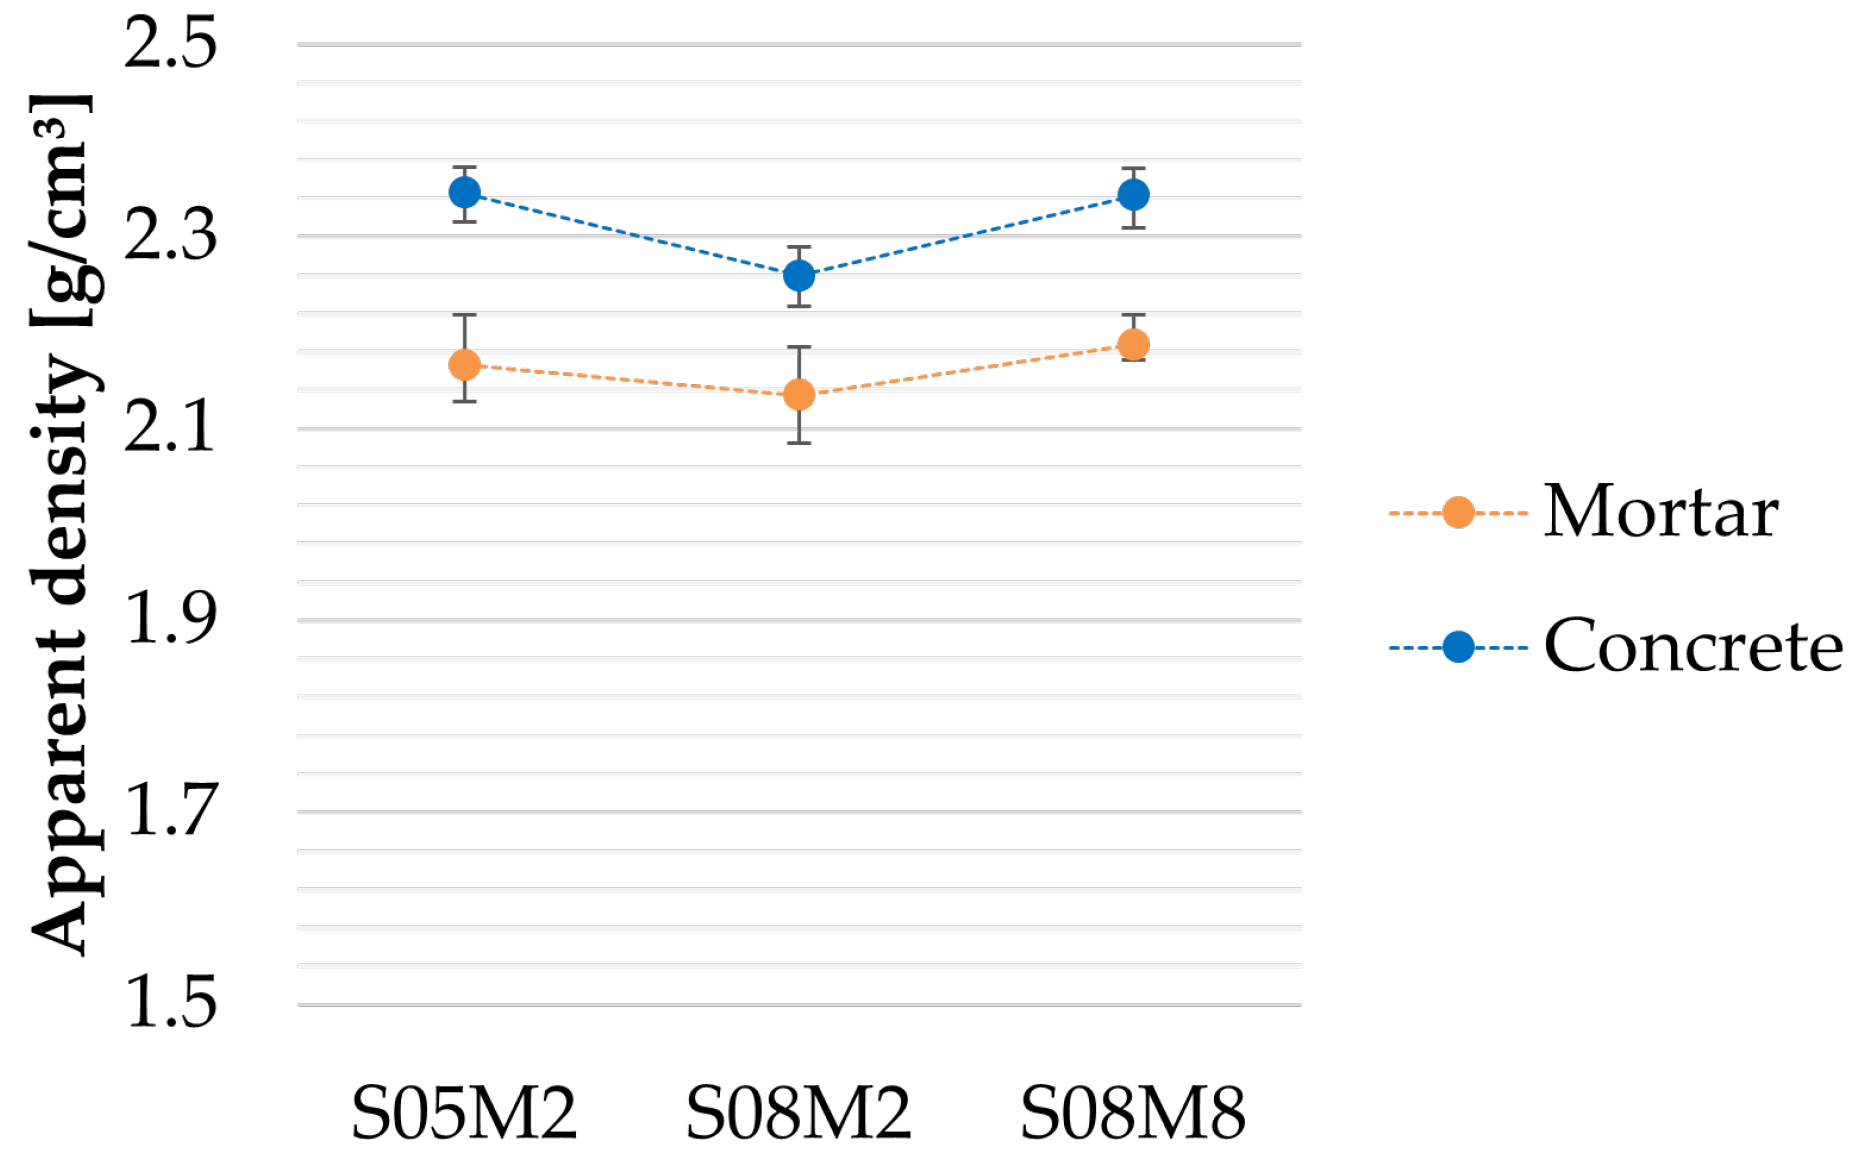
Apparent density of the AAS concrete compositions.
Figure 23.
Apparent density of the AAS concrete compositions.
Figure 24.
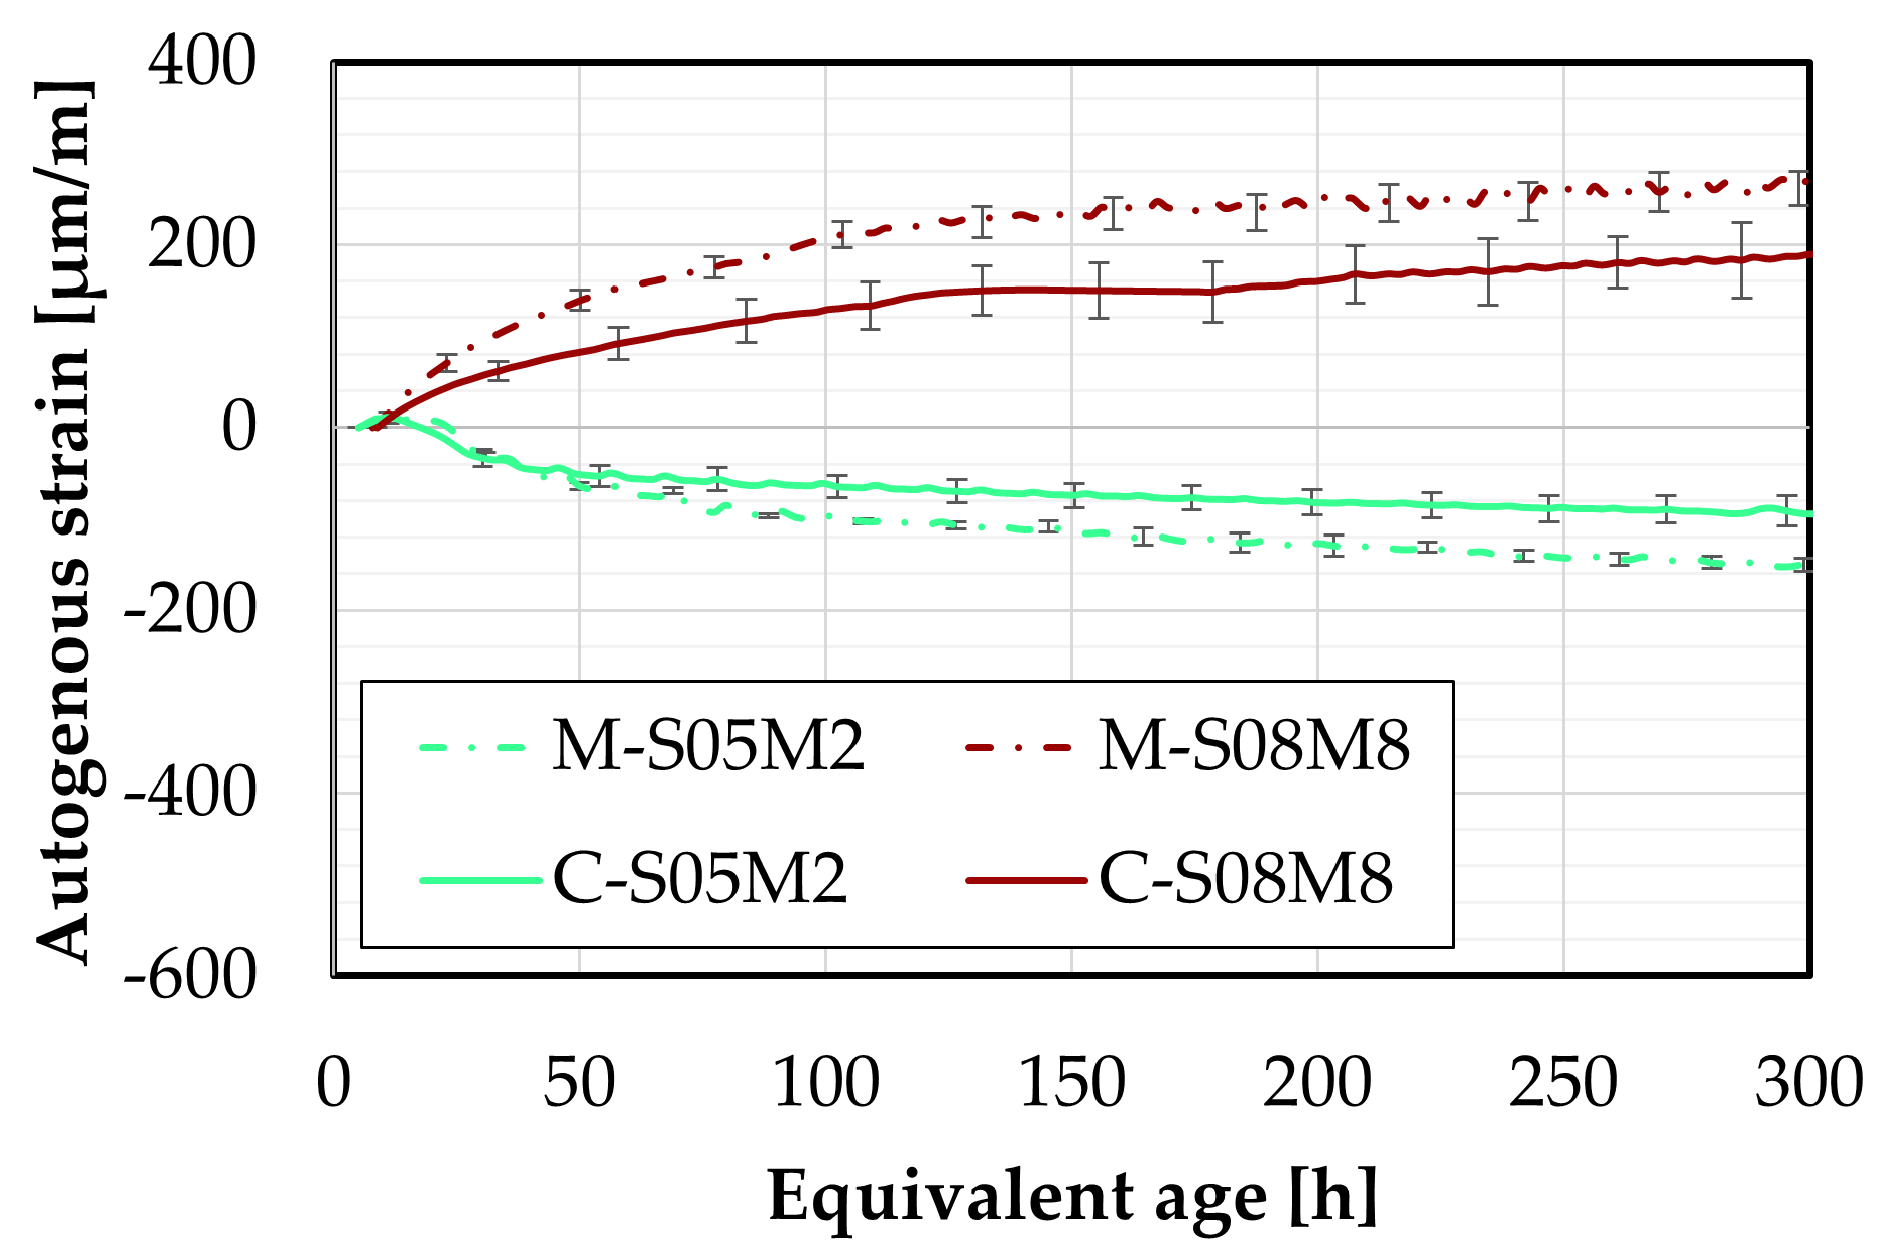
Autogenous strain of AAS concrete compositions compared to mortar compositions, as a function of the equivalent age.
Figure 24.
Autogenous strain of AAS concrete compositions compared to mortar compositions, as a function of the equivalent age.
Figure 25.
Autogenous strain of AAS concrete compositions compared to mortar compositions, as a function of the degree of reaction computed with the ultimate heat determined by: (A). the polynomial method, (B). the exponential method.
Figure 25.
Autogenous strain of AAS concrete compositions compared to mortar compositions, as a function of the degree of reaction computed with the ultimate heat determined by: (A). the polynomial method, (B). the exponential method.
Figure 26.
Coefficient of thermal expansion of AAS concrete compositions compared to mortar compositions, as a function of the equivalent age.
Figure 26.
Coefficient of thermal expansion of AAS concrete compositions compared to mortar compositions, as a function of the equivalent age.
Figure 27.
Coefficient of thermal expansion of AAS concrete compositions compared to mortar compositions, as a function of the degree of reaction computed with the ultimate heat determined by: (A). the polynomial method, (B). the exponential method.
Figure 27.
Coefficient of thermal expansion of AAS concrete compositions compared to mortar compositions, as a function of the degree of reaction computed with the ultimate heat determined by: (A). the polynomial method, (B). the exponential method.
Table 1.
Chemical composition of the blast-furnace slag in mass percent from X-ray fluorescence spectroscopy.
Table 1.
Chemical composition of the blast-furnace slag in mass percent from X-ray fluorescence spectroscopy.
| Material | SiO2 | Al2O3 | Fe2O3 | CaO | K2O | MgO | TiO2 | SO3 | Na2O | BaO | MnO |
|---|
| Slag | 34.20 | 12.86 | 0.35 | 39.95 | 0.62 | 7.91 | 1.13 | 1.88 | 0.50 | 0.13 | 0.30 |
Table 2.
Characteristics of the studied mortar compositions.
Table 2.
Characteristics of the studied mortar compositions.
| Composition | Alkaline Concentration [mol/L] | S/B [-] | W/B [-] | Alkali Content [%] | Paste/Sand [-] |
|---|
| M-S05M2 | 2 | 0.5 | 0.46 | 2.88 | 1/1 |
| M-S05M8 | 8 | 0.5 | 0.37 | 9.76 | 1/1 |
| M-S08M2 | 2 | 0.8 | 0.74 | 4.61 | 1/1 |
| M-S08M8 | 8 | 0.8 | 0.60 | 15.61 | 1/1 |
Table 3.
Compositions studied at the concrete scale.
Table 3.
Compositions studied at the concrete scale.
| Composition | Solution | Solution | Water | Slag | Sand | Aggregates | Aggregates | Aggregates |
|---|
| Concentration [mol/L] | [g] | [g] | [g] | 0/4 [g] | 6/10 [g] | 10/14 [g] | 14/20 [g] |
|---|
| C-S05M2 | 2 | 811.4 | 746.5 | 1622.8 | 2434.2 | 1641.7 | 816.2 | 853.3 |
| C-S08M2 | 2 | 1061.9 | 982.3 | 1327.4 | 2389.3 | 1641.7 | 816.2 | 853.3 |
| C-S08M8 | 8 | 1091.8 | 818.9 | 1364.8 | 2456.6 | 1641.7 | 816.2 | 853.3 |
Table 4.
Fitting parameters and for the polynomial fitting for mortar scale and and for paste scale.
Table 4.
Fitting parameters and for the polynomial fitting for mortar scale and and for paste scale.
| Composition | Mortar | Paste |
|---|
| a [h·J/g] | b [h1/2·J/g] | [J/g] | R2 [/] | [J/g] | R2 [/] |
|---|
| S05M2 | 1757.3 | 926.9 | 209.0 | 0.9991 | 220.2 | 0.9984 |
| S05M8 | 3110.5 | 1410.4 | 323.0 | 0.9973 | 346.0 | 0.9954 |
| S08M2 | 2206.6 | 1297.2 | 292.0 | 0.9997 | 278.6 | 0.9990 |
| S08M8 | 5166.6 | 2184.4 | 418.4 | 0.9982 | 368.4 | 0.9958 |
Table 5.
Fitting parameters and error for exponential fitting.
Table 5.
Fitting parameters and error for exponential fitting.
| Composition | [J/g] | [h] | [/] | [J/g] | [h] | [/] | [J/g] | S [J/g] |
|---|
| M-S05M2 | 69.37 | 5.91 | 1.08 | 195.64 | 120.67 | 0.34 | 265.01 | 20.81 |
| M-S05M8 | 245.41 | 6.35 | 0.63 | 77.54 | 267.66 | 0.96 | 322.96 | 70.36 |
| M-S08M2 | 35.22 | 5.36 | 1.63 | 268.91 | 33.34 | 0.47 | 304.13 | 14.26 |
| M-S08M8 | 265.42 | 6.27 | 0.65 | 187.06 | 340.63 | 0.60 | 452.48 | 27.17 |
Table 6.
Autogenous swelling and shrinkage of each mortar composition compared to the paste compositions.
Table 6.
Autogenous swelling and shrinkage of each mortar composition compared to the paste compositions.
| Composition | Mortar | Paste |
|---|
| Autogenous | Autogenous | Autogenous | Autogenous |
|---|
| Swelling [µm/m] | Shrinkage [µm/m] | Swelling [µm/m] | Shrinkage [µm/m] |
|---|
| S05M2 | 12.23 | 217.32 | 0 | 836.36 |
| S05M8 | 7.64 | 212.73 | 0 | 1194.65 |
| S08M2 | 43.51 | 7.58 | 36.55 | 133.61 |
| S08M8 | 42.44 | 0 | 214.06 | 202.71 |
Table 7.
Shrinkage differences between Sand 1 and Sand 2.
Table 7.
Shrinkage differences between Sand 1 and Sand 2.
| | Difference [%] | Standard Deviation |
|---|
| | [µm/m or µm/m/°C] |
|---|
| Equivalent Age [h] | 25 | 50 | 75 | 100 | 150 | 200 | 250 | 300 | Maximum |
|---|
| Autogenous strain | −36.8 | −10.4 | −11.3 | −11.0 | −5.9 | −3.4 | −0.3 | 3.1 | 7.5 |
| CTE | −15.9 | −6.5 | −5.8 | 1.0 | −0.2 | 1.8 | 5.2 | 3.5 | 1.8 |
Table 8.
RMSE between the tensile strength and the predicted tensile strength of the different methods. mod = modified equation.
Table 8.
RMSE between the tensile strength and the predicted tensile strength of the different methods. mod = modified equation.
| Method | RMSE |
|---|
| EC 2 | 0.51 |
| EC 2 mod | 0.15 |
| ACI 318 | 0.83 |
| ACI 318 mod | 0.23 |

