Article

Thermal Conductivity of UO2 with Defects via DFT+U Calculation and Boltzmann Transport Equation

1
The First Sub-Institue, Nuclear Power Institute of China, Chengdu 610005, China
2
College of Material Science and Engineering, Chongqing University, Chongqing 400044, China
3
National Key Laboratory of Nuclear Reactor Technology, Nuclear Power Institute of China, Chengdu 610041, China
4
State Key Laboratory of Advanced Nuclear Energy Technology, Nuclear Power Institute of China, Chengdu 610213, China
*
Author to whom correspondence should be addressed.
These authors contributed equally to this work.
Materials 2025, 18(15), 3584; https://doi.org/10.3390/ma18153584
Submission received: 26 June 2025 / Revised: 21 July 2025 / Accepted: 25 July 2025 / Published: 30 July 2025
(This article belongs to the Section Energy Materials)

Abstract

Accurate evaluation of the thermal conductivity of UO2 with defects is very significant for optimizing fuel performance and enhancing the safety design of reactors. We employed a method that combines the Boltzmann transport equation with DFT+U to calculate the thermal conductivity of UO2 containing fission products and irradiation-induced point defects. Our investigation reveals that the thermal conductivity of UO2 is influenced by defect concentration, defect type, and temperature. Fission products and irradiation defects result in a decrease in thermal conductivity, but they have markedly different impacts on phonon scattering mechanisms. Metal cations tend to scatter low-frequency phonons (less than 5.8 THz), while the fission gas xenon scatters both low-frequency and high-frequency phonons (greater than 5.8 THz), depending on its occupancy at lattice sites. Uranium vacancies scatter low-frequency phonons, while oxygen vacancies scatter high-frequency phonons. When uranium and oxygen vacancies coexist, they scatter phonons across the entire frequency spectrum, which further results in a significant reduction in the thermal conductivity of UO2. Our calculated results align well with experimental data across a wide temperature range and provide fundamental insights into the heat transfer mechanisms in irradiated UO2. These findings are essential for establishing a thermal conductivity database for UO2 under various irradiation conditions and benefit the development of advanced high-performance UO2 fuel.

1. Introduction

Uranium dioxide (UO2) is widely used as a nuclear fuel in reactors due to its high melting point (~2800 °C), excellent chemical stability, superior radiation resistance, and good compatibility with coolants [1]. However, as a ceramic fuel, UO2 suffers from a relatively low thermal conductivity (only around 8~10 W/(mK) at room temperature [2]). During operating conditions, the collision between fission fragments and lattice atoms will generate numerous point defects (e.g., vacancy-interstitial pairs). Most of these defects undergo recombination or migrate to sinks, such as dislocations and stacking faults, leaving only a small fraction stable [3]. Simultaneously, the fission of 235U produces a variety of solid fission products (e.g., Mo, Ru, Ba) that either precipitate as metals or dissolve as metal oxides, along with gaseous fission products (e.g., Xe, Kr) dispersed within the UO2 matrix [4]. These irradiation-induced defects and fission products introduce lattice distortion and stress concentration into the matrix, disrupting the translational symmetry and periodicity of the lattice and acting as scattering centers for heat transport. Since UO2 is a Mott insulator [5], heat conduction primarily occurs through phonons. However, radiation defects, along with solid and gaseous fission products scatter phonons, thereby reducing the phonon mean free path (MFP). The scattering strength of these point defects is proportional to the fourth power of the phonon frequency [6]. Furthermore, as burnup increases, the accumulation of fission products leads to the formation of a “high burnup structure” (HBS), which enhances phonon scattering, introduces thermal resistance phases (e.g., bubbles), significantly degrades the thermal conductivity of UO2 [7], and can result in pellet melting and fission gas release. Therefore, accurately predicting the thermal conductivity of irradiated UO2 is crucial for reactor safety and further performance optimization.
Thermal transport in nuclear fuels has been extensively investigated through both experimental and theoretical calculations. Martin et al. [8] measured the thermal diffusivity ( α ), heat capacity ( C P ), and density ( ρ ) of non-stoichiometric and porous UO2. They fitted the empirical thermal conductivity formula κ = α C P ρ with measured data using a first-order phonon scattering model, represented as α 1 = A + B T . In this model, parameters A and B correlate with phonon-defect and phonon-phonon scattering, respectively, while T represents temperature, thereby laying the groundwork for further experimental research. Minato et al. [9] employed the laser flash method to measure the thermal conductivity of disk-shaped UO2 and (U,Gd)O2 samples, demonstrating that irradiation-induced point defects significantly reduce the thermal conductivity of UO2. Philipponneau et al. [10] measured the thermal conductivity of non-stoichiometric and porous (U,Pu)O2−x mixed oxide (MOX) fuels and established a new empirical formula. Ronchi et al. [11] extended Martin’s model by incorporating irradiation effects, developing a unified empirical formula that describes the thermal conductivity of both pristine and irradiated UO2. This model provides a precise characterization of irradiation temperature and burnup, enabling accurate predictions of the thermal conductivity for UO2 under operation conditions.
Experimental measurement of thermal conductivity for irradiated UO2, particularly at high temperatures, remains challenging due to complex procedures and safety risks [11,12,13,14,15]. Theoretically, first-principles calculations combined with Slack theory [16], the Callaway model [17,18], or the phonon Boltzmann transport equation (BTE) can predict thermal conductivity. In contrast, molecular dynamics (MD) simulations [19,20,21] offer complementary insights, though they exhibit strong sensitivity to interatomic potentials, where inadequate potential models can introduce inaccuracies in thermal conductivity estimation. Currently, the thermal conductivity of irradiated UO2 is primarily established through experiments, which are used to create quantitative relationships with defect concentrations. However, the fundamental effects of point defects, fission products, dislocations, and grain boundaries on thermal conductivity have not been fully addressed. Although significant efforts have been made in multiscale modeling and experimental characterization, challenges persist in developing predictive models and advanced experimental tools.
In this work, we employ first-principles calculations combined with the phonon BTE to investigate the thermal conductivity of uranium dioxide (UO2) containing fission products and irradiation defects. This paper is organized as follows: (1) Introduction to the theory of thermal conductivity and the methods used in the calculations; (2) Results and Discussion of the electronic structure and phonon spectrum of UO2; (3) Thermal Conductivity of UO2 and a discussion of the effects of fission products and irradiation defects; (4) Conclusions and summary.

2. Theory and Methods

2.1. Theory of Thermal Conductivity

Thermal transport in insulators is primarily governed by quantized energy of lattice vibrations, known as phonons [22], and the contribution of a frequency-controlled phonon mode, denoted as ω , is determined by three fundamental parameters [6]: (1) the heat capacity C v of the phonon; (2) the group velocity υ g = d ω / d q ; and (3) the lifetime of the phonon τ . Accurately determining lattice thermal conductivity requires solving the phonon Boltzmann transport equation under non-equilibrium conditions. According to lattice vibartions, we can calculate the population of the phonon mode frequency ω q ν , where it follows Bose–Einstein statistics under equilibrium: n ¯ q ν = 1 / e ω q ν / k B T 1 . In this equation, q, ν , , and k B denote the wave vector, the branch index, the reduced Planck constant, and the Boltzmann constant, respectively. When the lattice is subjected to a temperature gradient T , the phonon distribution deviates from equilibrium ( n q ν n ¯ q ν ), resulting in a phonon flux from higher to lower temperature regions. The steady-state distribution is described by the BTE [22]:
n q ν T v q ν T = n q ν t | s c a t t
where the left term corresponds to the drift component induced by T , and the right term accounts for various scattering processes. Here, v q ν denotes the group velocity of the phonon mode q ν . Within the relaxation time approximation (RTA), the detailed derivation is presented in Appendix A, and the lattice thermal conductivity is expressed as [23]:
κ = 2 N 0 V k B T 2 q ν v q ν 2 ω q ν 2 n ¯ q ν n ¯ q ν + 1 τ q ν
where V is the volume of the primitive cell, and N 0 corresponds to the number of sampling points in the q-point grid across the Brillouin zone, the total relaxation time τ q ν incorporates all scattering mechanisms according to Matthiessen’s rule.
τ q ν 1 = τ q ν p h 1 + τ q ν d e f e c t s 1 + τ q ν o t h e r s 1
Cumulative thermal conductivity κ c ( ω ) and thermal conductivity κ ( ω ) with respect to frequency are defined by
κ c ( ω ) = 0 ω 1 N 0 q ν κ q ν δ ω q ν ω d ω
κ ω = 1 N 0 q ν κ q ν δ ω q ν ω
The three-phonon scattering rate is calculated using Fermi’s golden rule [24]:
τ q ν p h 1 = π 2 q ν , q ν Φ q ν , q ν , q ν 2 { n q ν + n q ν + 1 δ ω q ν ω q ν ω q ν + n q ν n q ν δ ω q ν + ω q ν ω q ν δ ω q ν ω q ν + ω q ν }
where Φ q ν , q ν , q ν represents the third-order anharmonic scattering strength matrix elements. For defect scattering, we employ the generalized Tamura model [25]:
τ q ν d e f e c t s 1 = V 0 η ω q ν 4 4 π v ¯ 3
where V 0 is the unit cell volume, v ¯ is the average velocity of the phonons, and η is the scattering parameter [15,26,27]:
η = i f i Δ M M ¯ 2 + 2 Δ K K ¯ 2 Q γ Δ R R ¯ 2
Here, f i denotes the concentration of defect type i, and Δ M and M ¯ represent the mass difference and average mass, respectively. Similarly, Δ K and K ¯ indicate the differences in force constants and the average force constants, while Δ R and R ¯ correspond to the differences in radius and the average radius, respectively. The average Grüneisen parameter is denoted as γ . The parameter Q, which is 4.2 for vacancies and 3.2 for substitutional defects in fluorite structures [28], accounts for nearest-neighbor bond distortion. The variation in force constants is typically proportional to volume, merging the combination of force constant and radius variation terms as follows:
η = i f i Δ M M ¯ 2 + ε Δ R R ¯ 2
The dimensionless parameter ε (typically ranging from 0 to 500) is determined through empirical fitting. There are three distinct defect scattering regimes [29]: (a) Mass-only defects (e.g., isotopic impurities): Only the mass variance term in Equation (9) contributes significantly; (b) Substitutional impurities (e.g., Mo in UO2): Both mass and volume terms are relevant, with possible bond modifications; (c) Vacancies/interstitials: All terms contribute substantially, including significant modifications to the force constants. For noble gas atoms (Xe, Kr) that do not form chemical bonds with the matrix, the scattering is dominated by mass and volume effects, with minimal contributions from force constants. This comprehensive approach facilitates accurate modeling of phonon scattering by various defect types in nuclear fuel materials.

2.2. Methods

First-principles calculations were performed using the Vienna Ab initio Simulation Package (VASP) within the framework of density functional theory (DFT) [30]. The projector augmented wave (PAW) method [31] was employed to describe the electron-ion interactions, and the exchange-correlation functional was treated with the generalized gradient approximation (GGA) in the Perdew-Burke-Ernzerhof (PBE) formulation [32]. To accurately account for the strong electron correlations in UO2, the Hubbard U correction (DFT+U) [33] was applied, incorporating spin-orbit coupling (SOC) to improve the accuracy of the electronic structure, with the spin quantization axis aligned along the z-axis. The initial structure of UO2 was modeled using a conventional unit cell (containing 4 U and 8 O atoms), as illustrated in Figure 1. A 2 × 2 × 2 supercell (96 atoms) was constructed with the 3k antiferromagnetic (AFM) ordering [34,35] along the a, b, and c axes. The plane-wave cutoff energy was set to 450 eV, and a 3 × 3 × 3 Monkhorst-Pack k-point mesh was used for Brillouin zone sampling, and the total energy convergence criterion was set to 10−6 eV. Structural optimization was performed under zero external pressure to obtain the equilibrium lattice parameters. The f-orbital occupation matrix control (OMC) method [36] was adopted to avoid metastable states and accelerate iterative convergence.
Subsequently, in order to accurately describe thermal transport in lattice, second- and third-order interatomic force constants (IFCs) were calculated by DFT+U and the supercell structures of UO2 were generated by the finite displacement method as implemented in the Phonopy [37] and Phono3py [38] codes with atomic displacements of 0.03 Å in supercell. The Born effective charges, dielectric constant tensor of UO2 were calculated by density functional perturbation theory (DFPT) [39] and the long-range Coulomb interactions in ionic crystal of UO2 (U4+ and O2−) were corrected by introducing non-analytical term corrections (NAC) [40]. Finally, the lattice thermal conductivity ( κ l ) of UO2 was computed by solving the Boltzmann transport equation within the relaxation time approximation. A 19 × 19 × 19 q-point mesh was used for Brillouin zone integration, and the tetrahedron method was applied to improve numerical accuracy. Symmetry operations were utilized to reduce computational costs and maintain high precision.

3. Results and Discussions

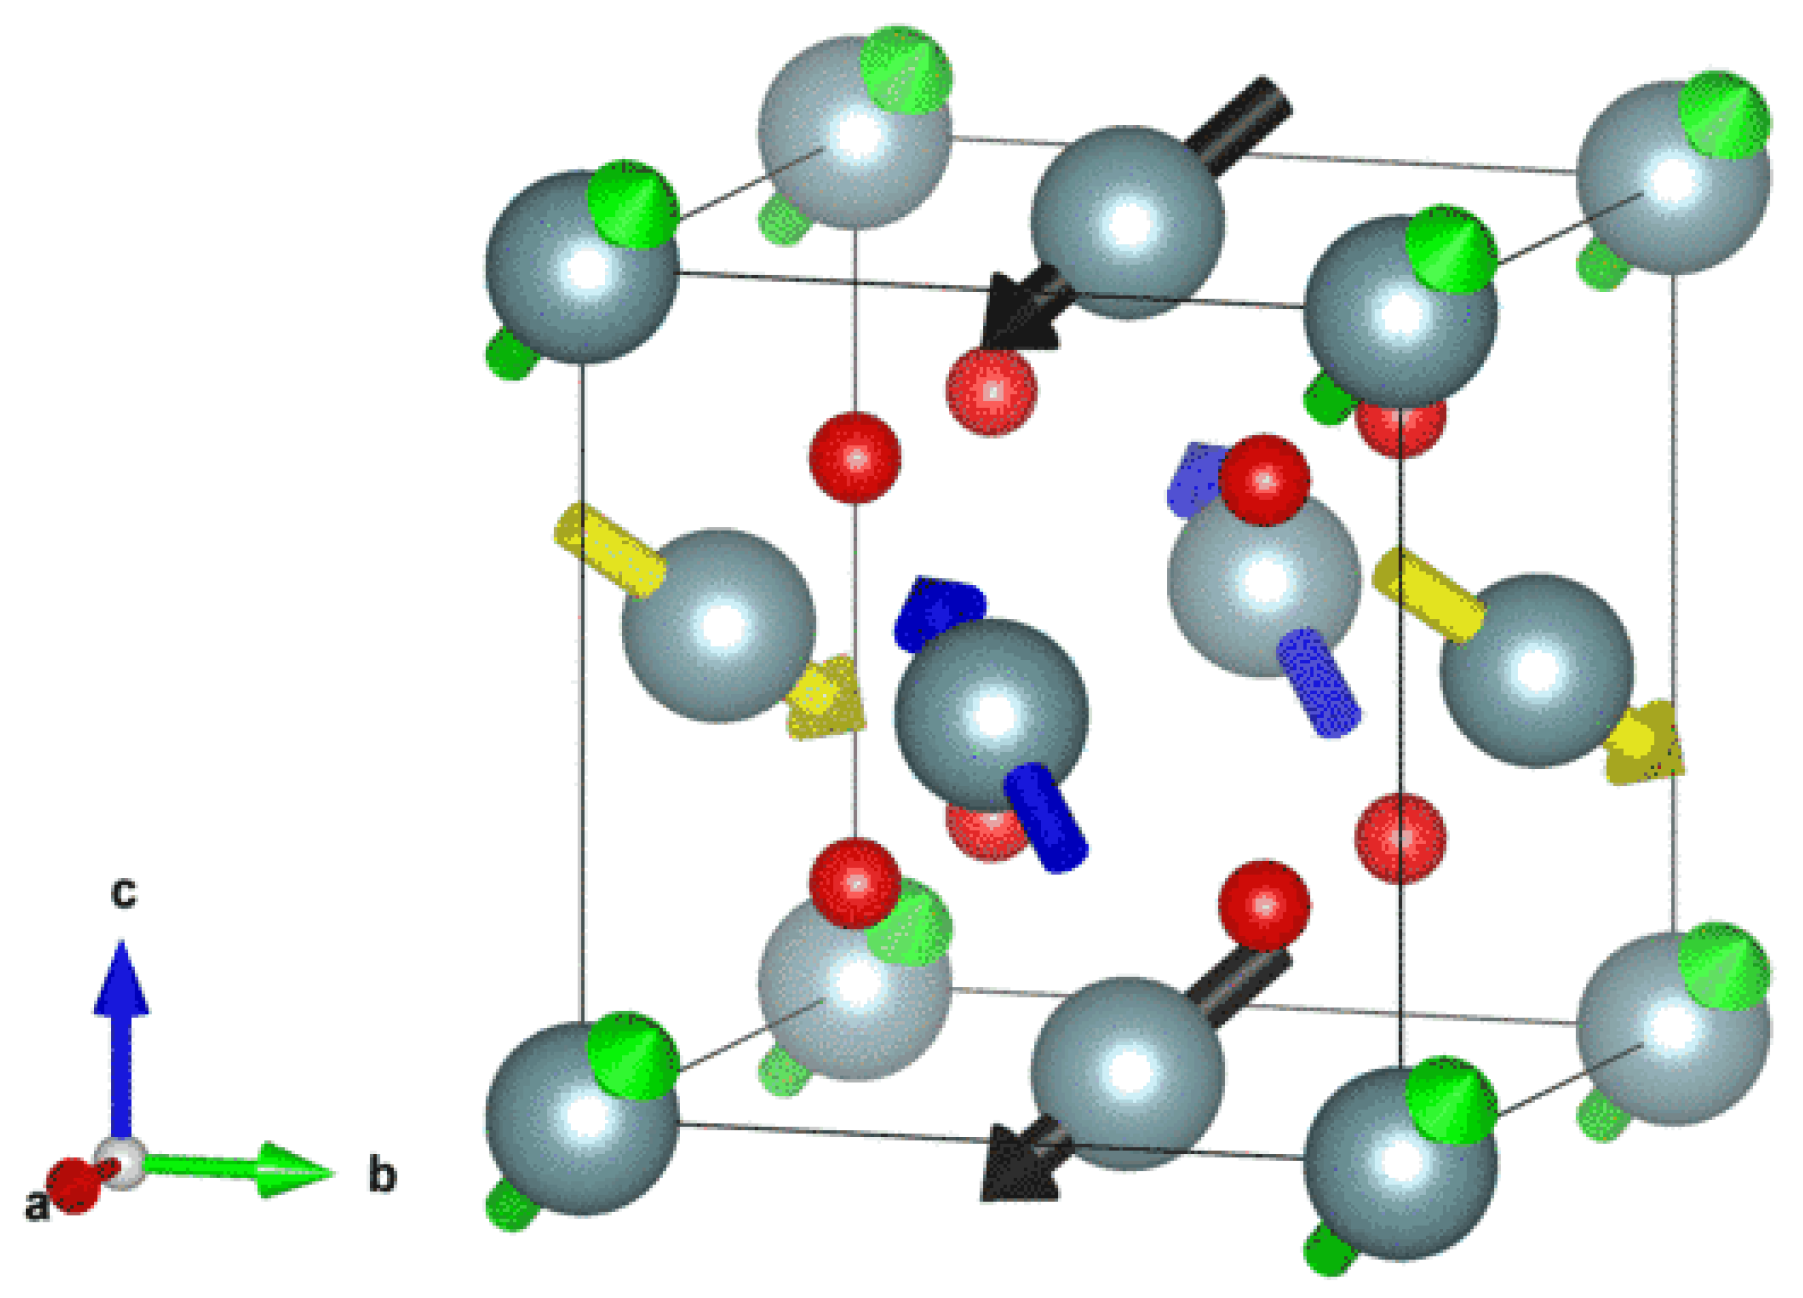
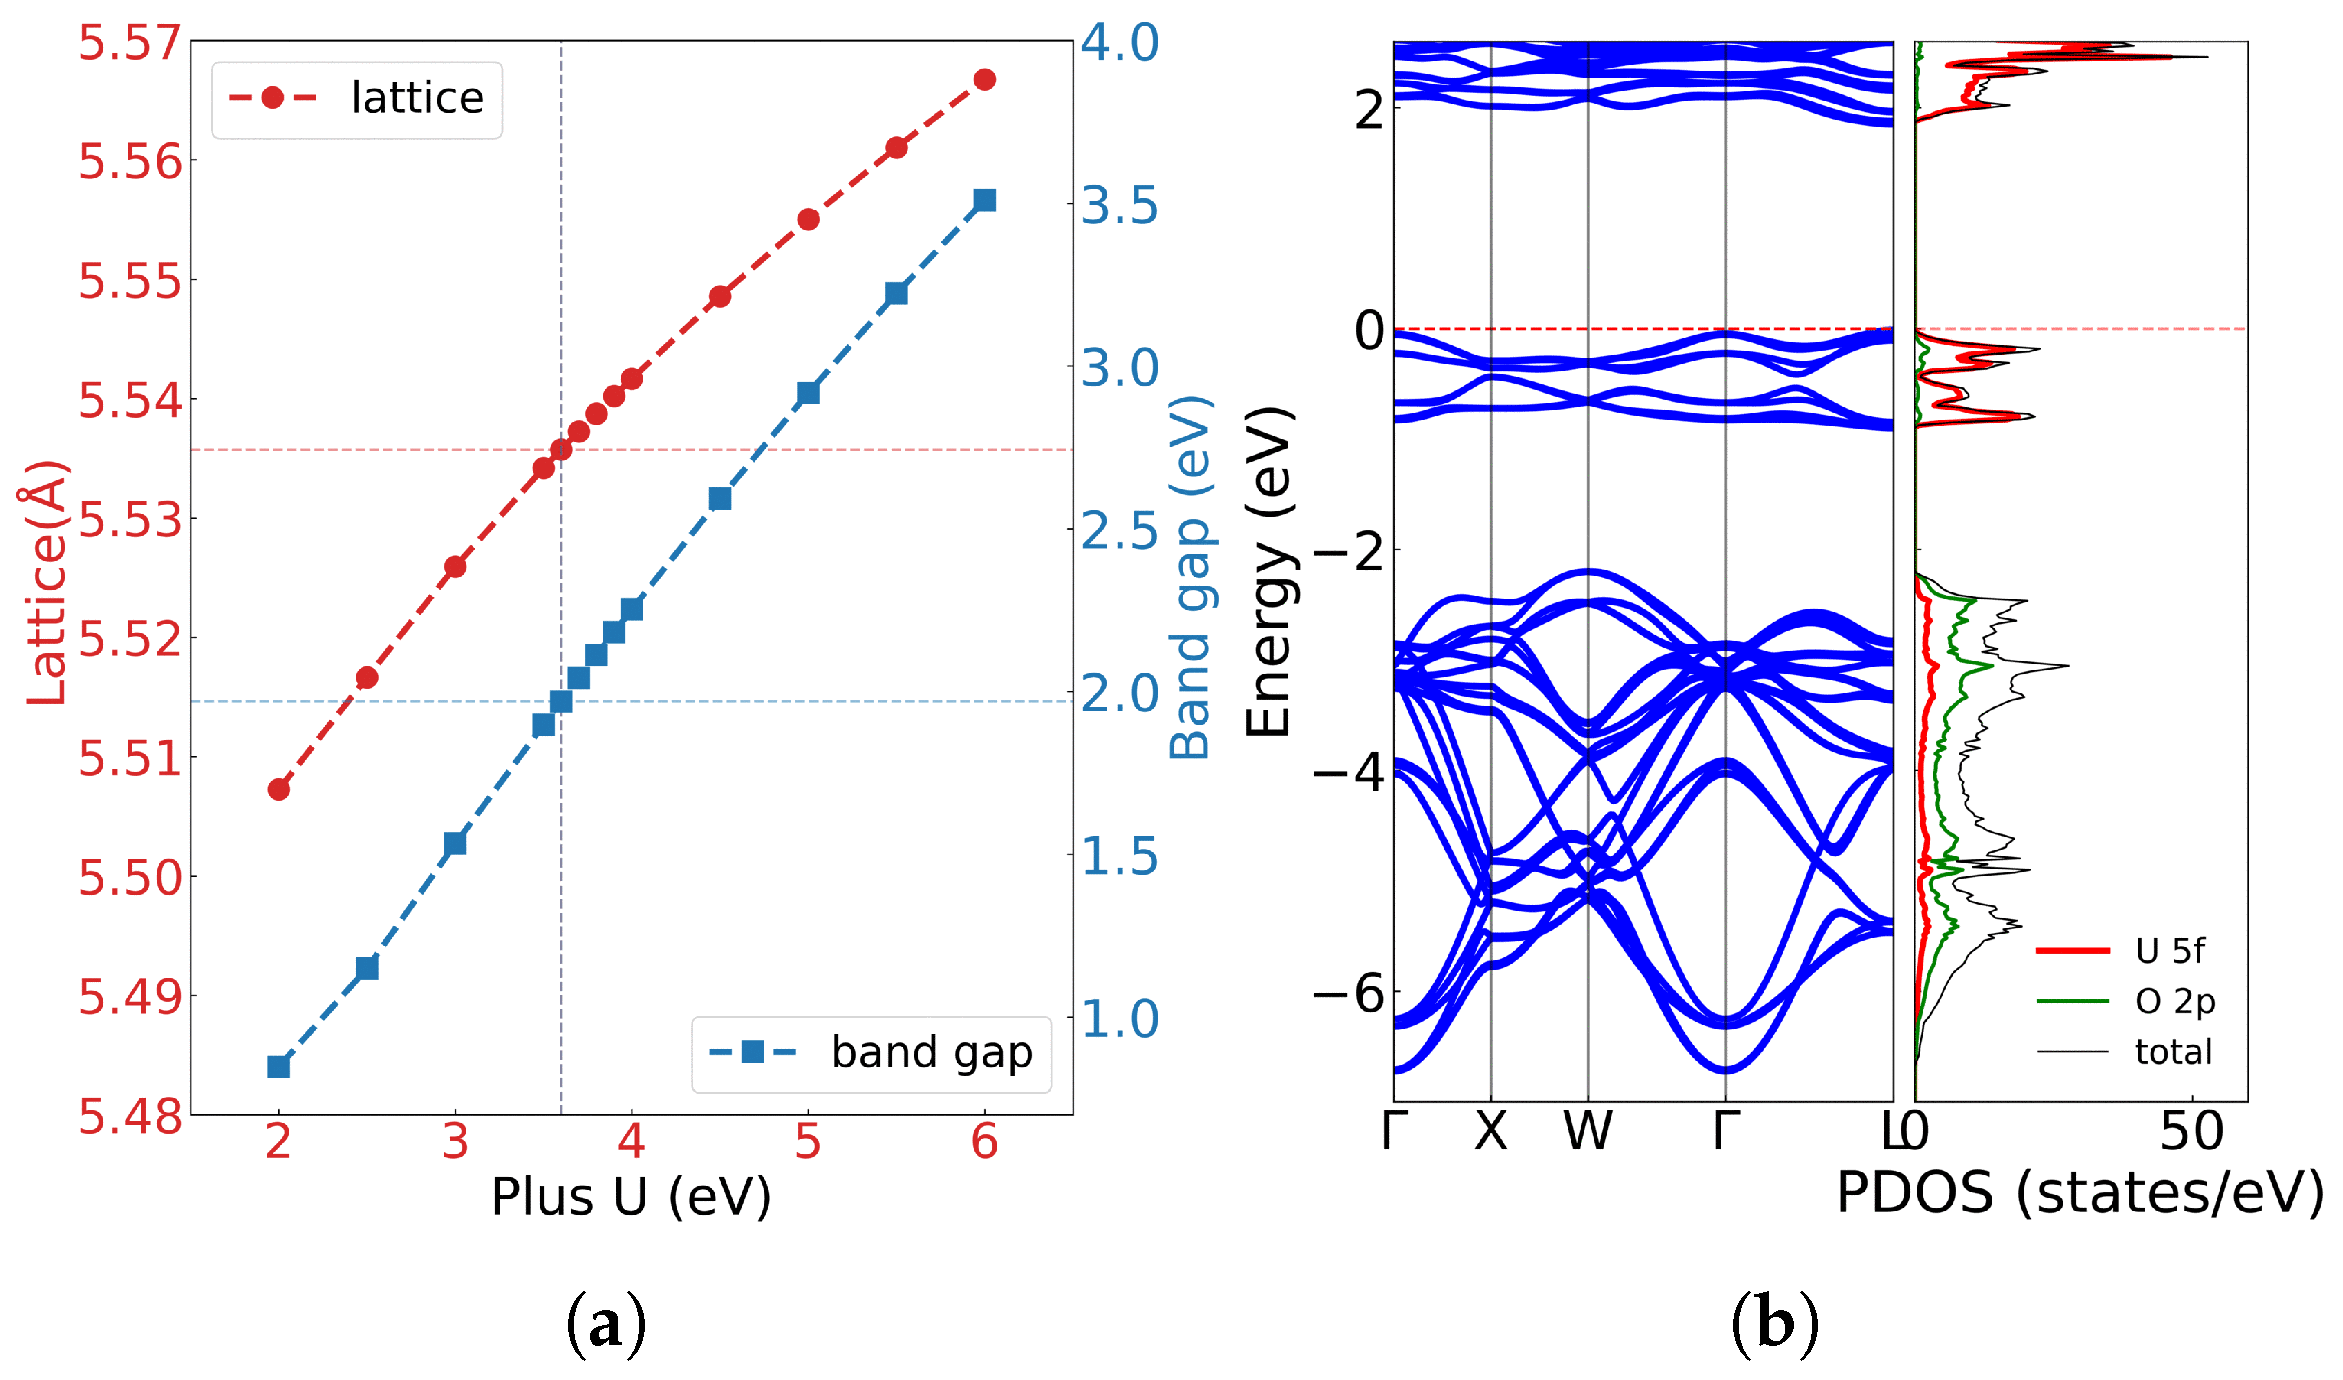
3.1. Electronic Structure

First-principles calculations provide fundamental insights into the electronic structure of uranium dioxide. Figure 2a illustrates the lattice constants and bandgap ( E g ) as a function of the Hubbard U with spin-orbit coupling. Both lattice constant and bandgap increase nearly linearly with U values, consistent with previous calculations by Dorado et al. [36]. Experimentally, UO2 exhibits a lattice constant of a = c = 5.47 Å, and the bandgap is approximately 2.0 eV. By comparing our result with experiment, a parameter of U = 3.6 eV and J = 0.0 eV was selected in our calculation, which can yield a bandgap of 1.990 eV, in excellent agreement with the experimental value of 2.0 eV. As shown in Figure 2b, the calculated band structure and density of state reveal that the valence band maximum and conduction band minimum are primarily derived from U 5f and O 2p orbitals.
Within U = 3.6 eV and J = 0.0 eV, our calculated lattice constant was a = c = 5.536 Å, showing consistency with previous studies. While Dorado et al. [36] obtained the lattice parameter of a = 5.56 Å and c = 5.50 Å (symmetry breaks and a c ) with U = 4.50 eV and J = 0.51 eV according to the experimental elastic constant. A similar c-axis contraction was also observed by Iwasawa et al. [41] and may be attributed to spin alignment in the antiferromagnetic (AFM) state, where U atoms with opposite magnetic moments move closer along the z axis. Meanwhile, using the PBE functional with U = 3.35 eV and J = 0.0 eV, Pegg et al. [34] found that the lattice constant a = c = 5.474 Å and the magnetic moment was insensitive to U or J. These results confirm that the PBE functional with Hubbard U correction can provide an accurate electronic structure but tends to overestimate the lattice parameter. All these computational results conclusively demonstrate that UO2 exhibits Mott insulating behavior where valence electrons are strongly localized around lattice atoms. This electronic configuration makes lattice vibrations (phonon) the dominant factor in heat transfer, while electronic thermal conductivity ( κ e ) only manifests a negligible influence.

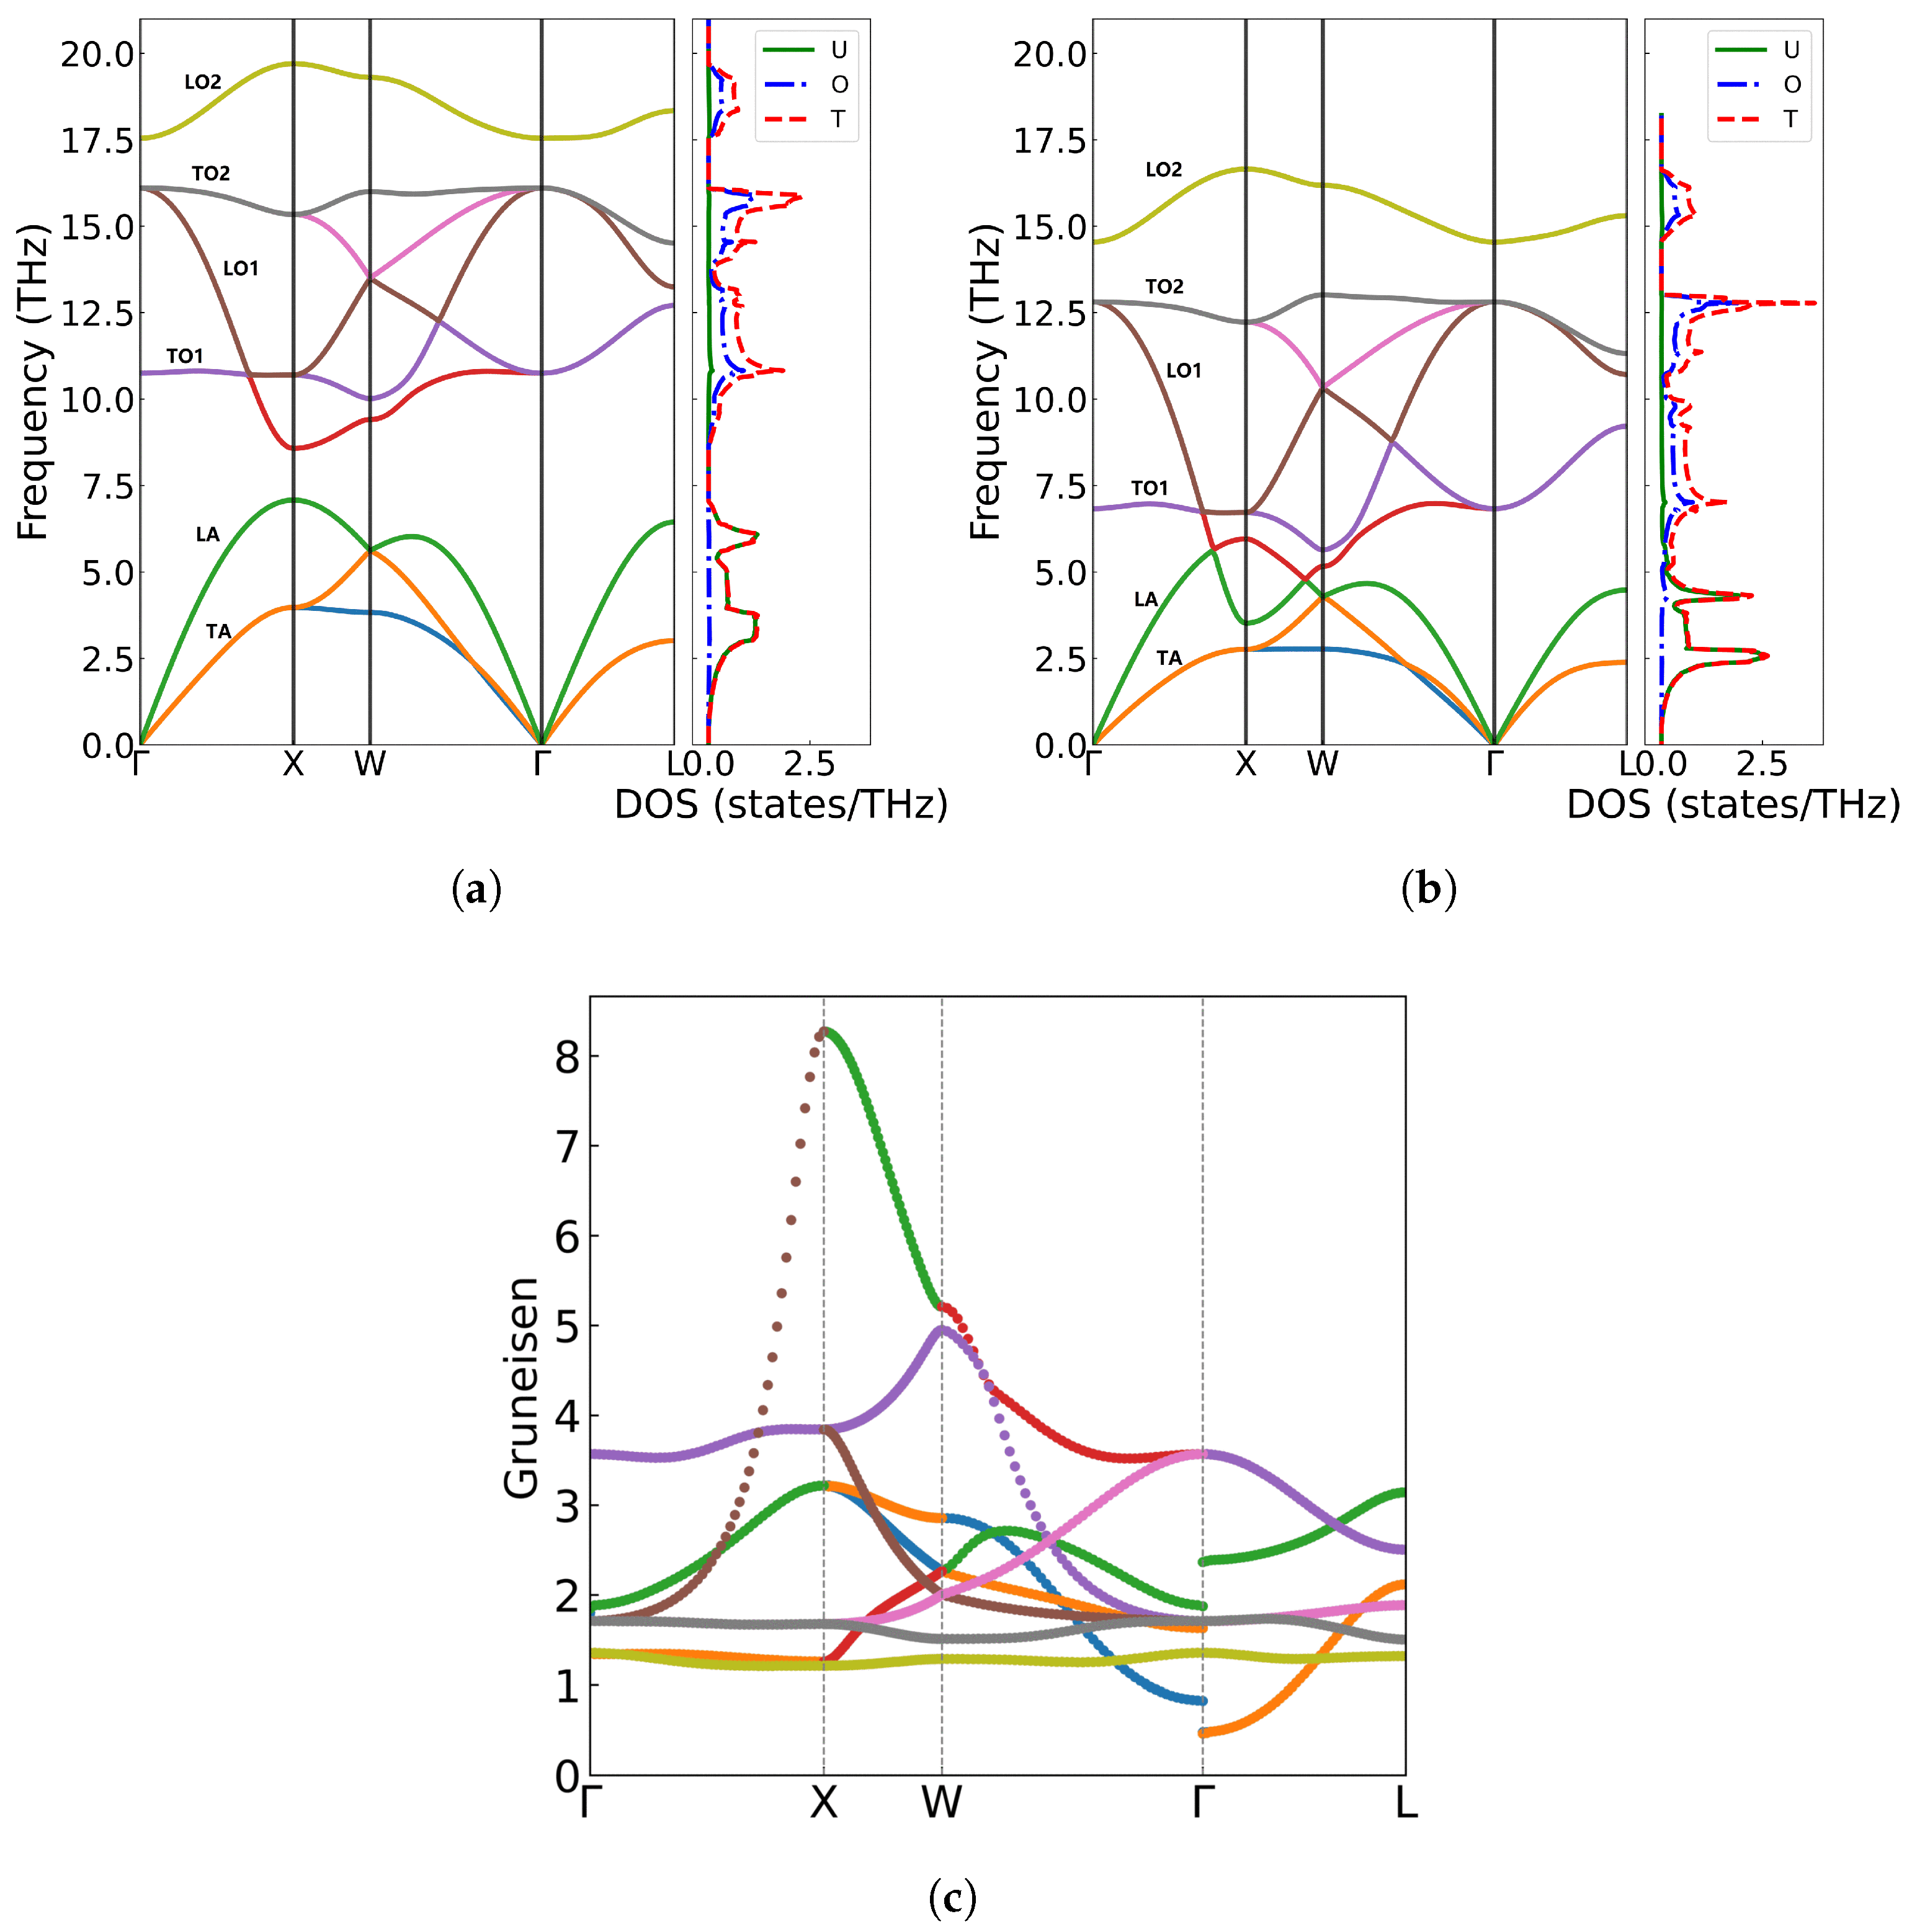
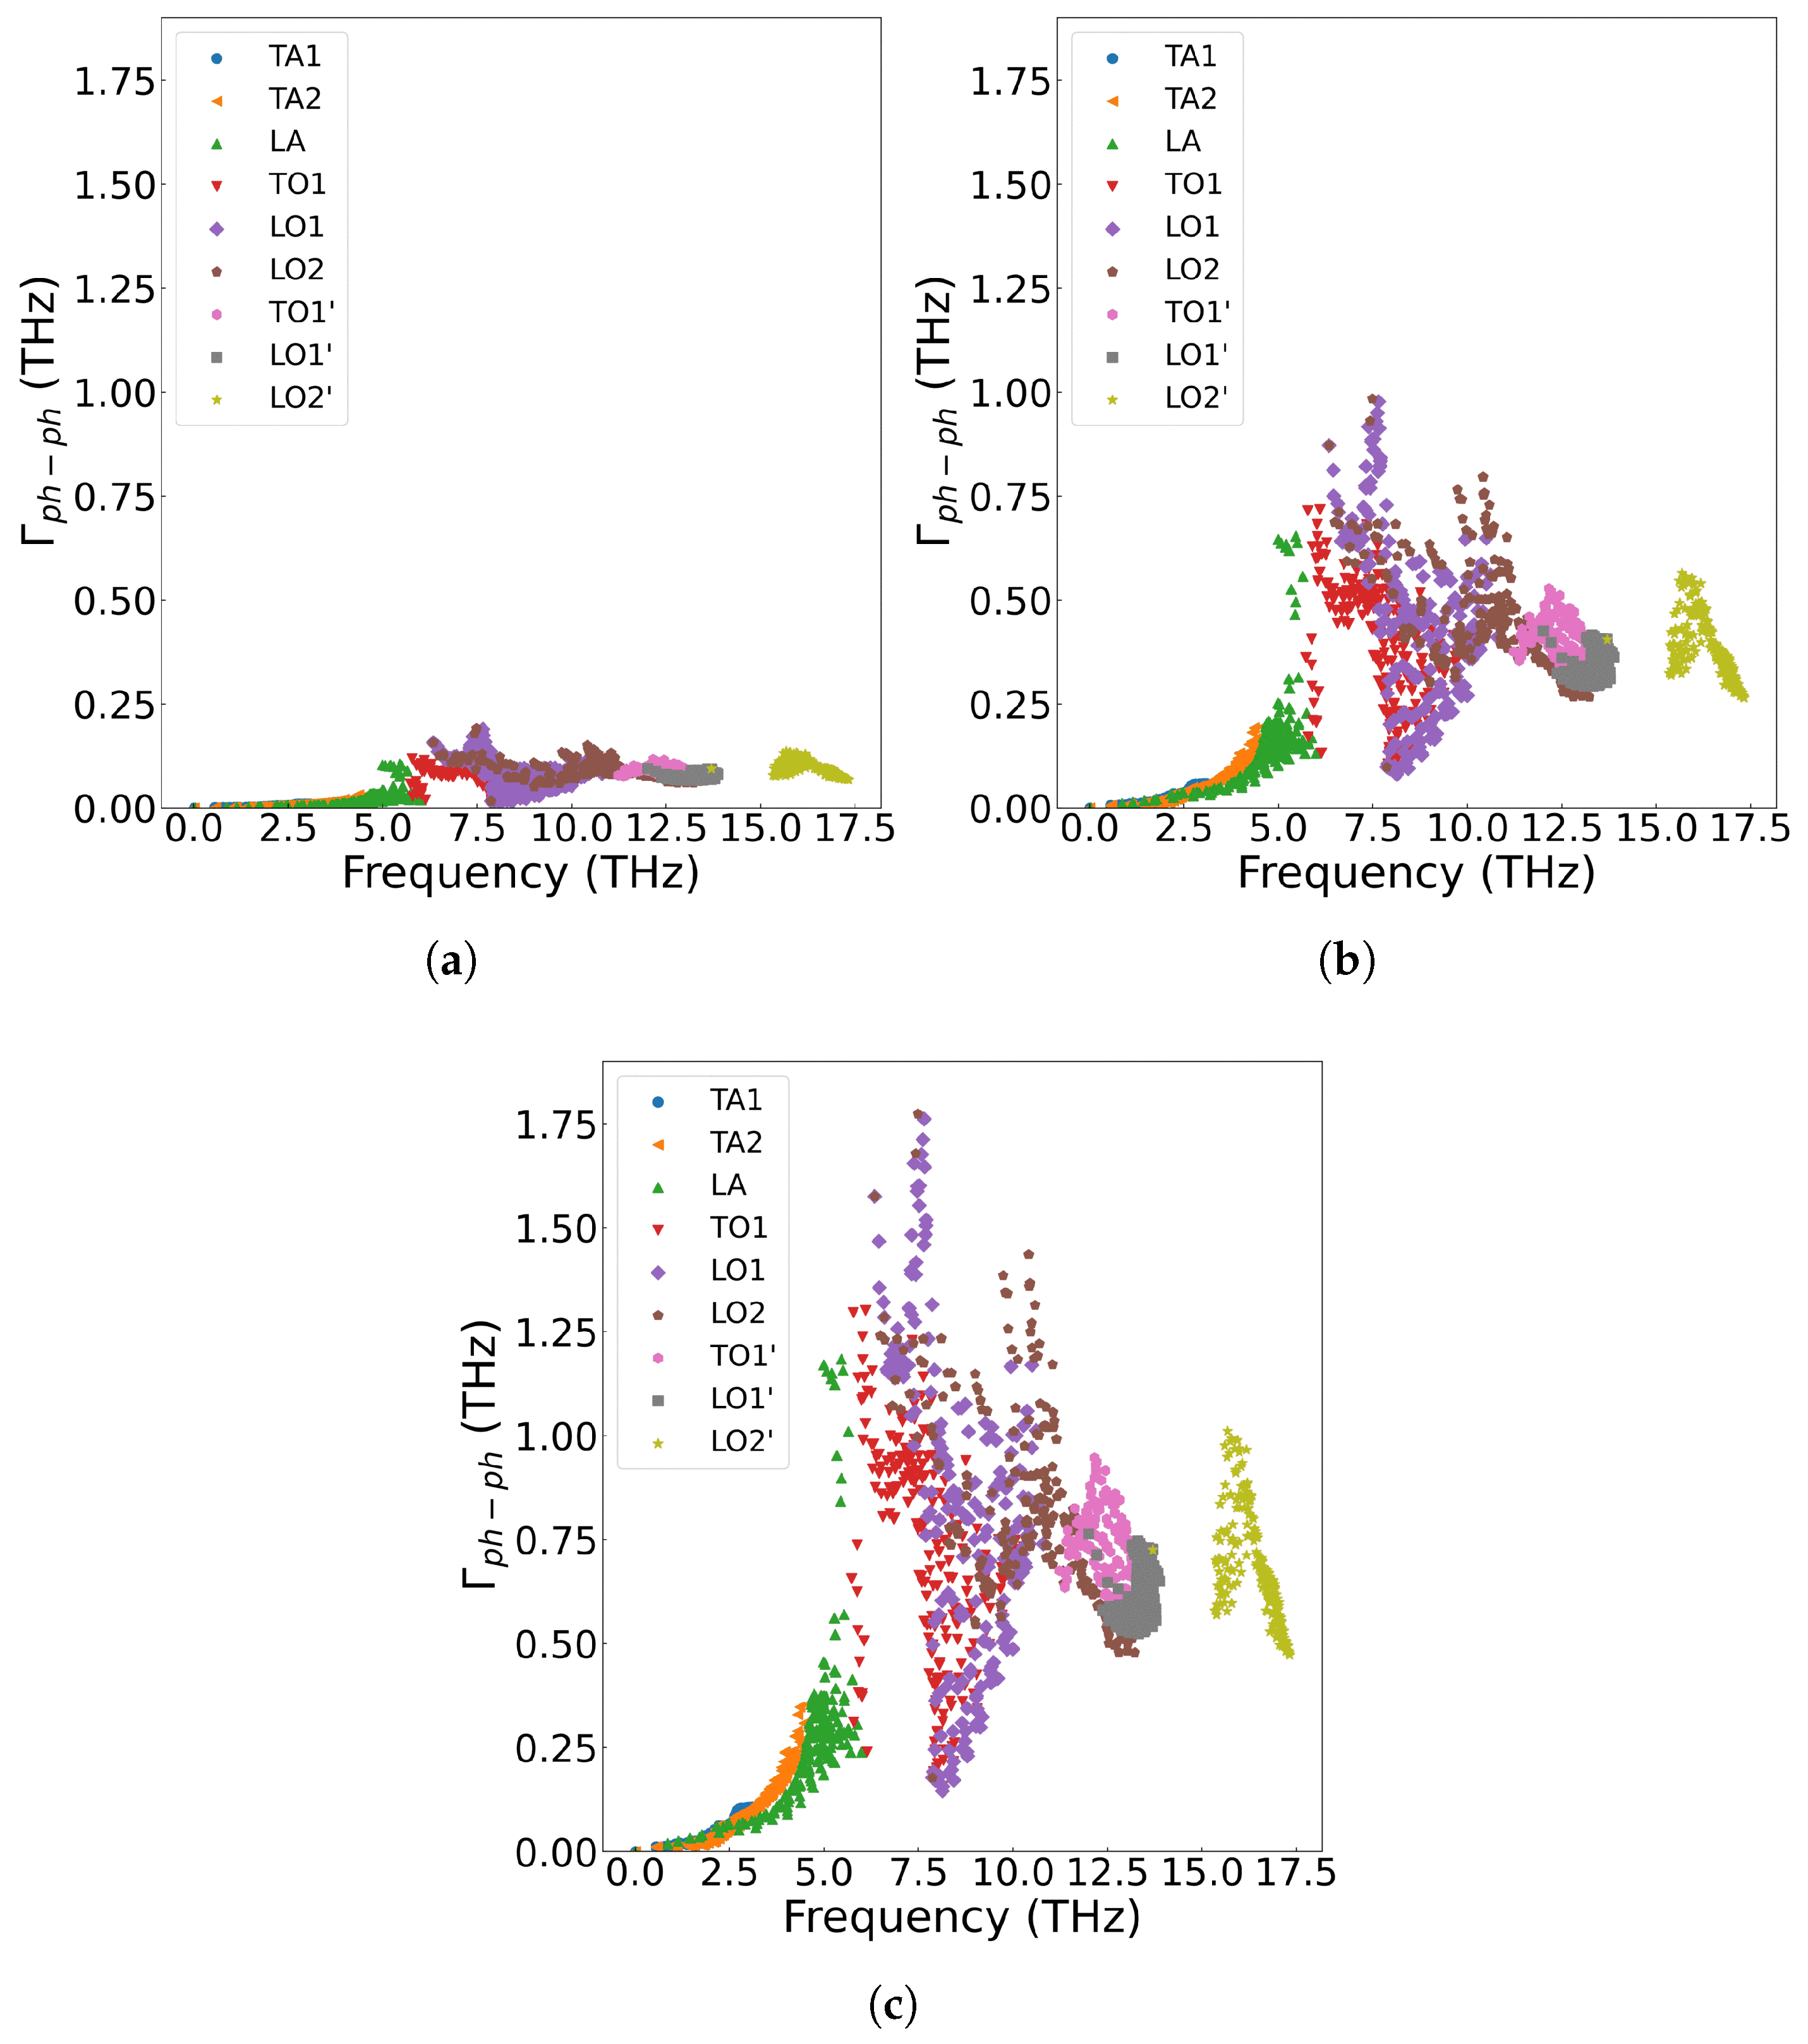
3.2. Phonon Spectrum

The phonon spectrum and density of states of UO2 were investigated using first-principles calculations and compared with experimental data from inelastic neutron scattering measurements at 296K [42,43], as shown in Figure 3. UO2 crystallizes in the fluorite structure (Fm3-m), with a primitive cell containing one uranium atom and two inequivalent oxygen atoms, giving rise to nine phonon branches—three acoustic (TA/LA) and six optical (TO/LO). The calculated phonon dispersion along the high-symmetry Γ -X-W- Γ -L path agrees well with experimental results, except for the TO2 branch near the Γ point, where the computed frequencies are slightly higher, likely due to the absence of temperature effects in the 0 K simulations. The acoustic modes, dominated by uranium vibrations, appear at low frequencies, while the optical branches, primarily associated with oxygen motion, exhibit higher frequencies. Obviously, longitudinal optical (LO2) and transverse optical (TO2) phonon branches split at the Γ point due to the long-range Coulomb interaction, which was accounted for by incorporating a non-analytical term in the dynamical matrix. The diagonal element of the static dielectric tensor yielded 5.4512, while the Born effective charge was calculated as Z U * = + 5.0378 and Z O * = 2.5189 , indicating significant charge transfer and partial covalent character.
The maximum phonon frequency depicted in the figure occurs at the X-point, with a value of 17.54 THz. Near the Γ -point, with the exception of the TO2 branch, the calculated phonon frequencies demonstrate excellent agreement with experimental measurements. Along the Γ -X high-symmetry path, slight discrepancies exist between the calculations and experimental measurement, with the calculated results exhibiting higher values than the experimental data. This difference may arise because the experimental measurements were conducted at 296 K, while the calculations were performed at 0 K; increasing temperature typically leads to phonon frequency softening. For the LA and TA branches, the calculated values align well with experimental measurements, although minor differences are observed at the boundary X-point. No direct comparison was made for frequencies between the X and W points due to the different paths taken in the experiment and calculation. Along the Γ -L path, the calculations and experimental results show good agreement. However, a relatively larger deviation is noted for the highest-frequency optical branch (TO2), which may be attributed to greater experimental uncertainties in measuring high-frequency optical modes.
The maximum phonon frequency in the figure occurs at the X-point with a value of 17.54 THz. Near the Γ -point, with the exception of the TO2 branch, the calculated phonon frequencies show excellent agreement with experimental measurements. Along the Γ -X high-symmetry path, slight discrepancies exists between calculation and experimental measurement and the calculated result exhibits higher value than experimental data. This difference may arise because the experimental measurement was performed at 296 K while calculations at 0 K, as increasing temperature typically leads to phonon frequency softening. For the LA and TA branches, the calculated values match well with experimental measurements, though minor differences appear at the boundary X-point. No direct comparison was made for frequencies between the X and W points due to different paths taken in experiment and calculation. Along the Γ -L path, the calculations and experimental results show good agreement. However, a relatively larger deviation is observed for the highest-frequency optical branch (TO2), which may be attributed to greater experimental uncertainties in high-frequency optical modes measurement.
From Figure 4a,b, we can see that phonon frequencies exhibit a strong dependence on lattice parameter variations. Using the equilibrium lattice constant a = 5.536 Å as reference, under compression (a = 5.50 Å) phonon hardening occurs, with the maximum frequency increasing to 19.698 THz at the X point and a widening gap between the LA and TO1 branches [44,45,46]. Conversely, lattice expansion (a = 5.540 Å) leads to phonon softening, reducing the highest frequency to 16.648 THz and causing the LA and TO1 branches to overlap. Such phonon frequency shifts with volume variation in UO2 may originate from the anharmonic nature of interatomic potentials. Our calculations reveal distinct phonon hardening under compression (a = 5.50 Å) and softening under expansion (a = 5.540 Å), demonstrating the significant role of lattice anharmonicity in vibrational properties. To quantitatively characterize these effects, we computed Grüneisen parameters ( γ ) along high-symmetry directions with the formula γ = ln ω / ln V . As shown in Figure 4c, our calculated Grüneisen parameters exhibit notable branch dependence, with an average value of 1.86, consistent with both theoretical [47] (1.88 from PBE+U calculations) and experimental (1.6–2.2) values.

3.3. Thermal Conducitivity
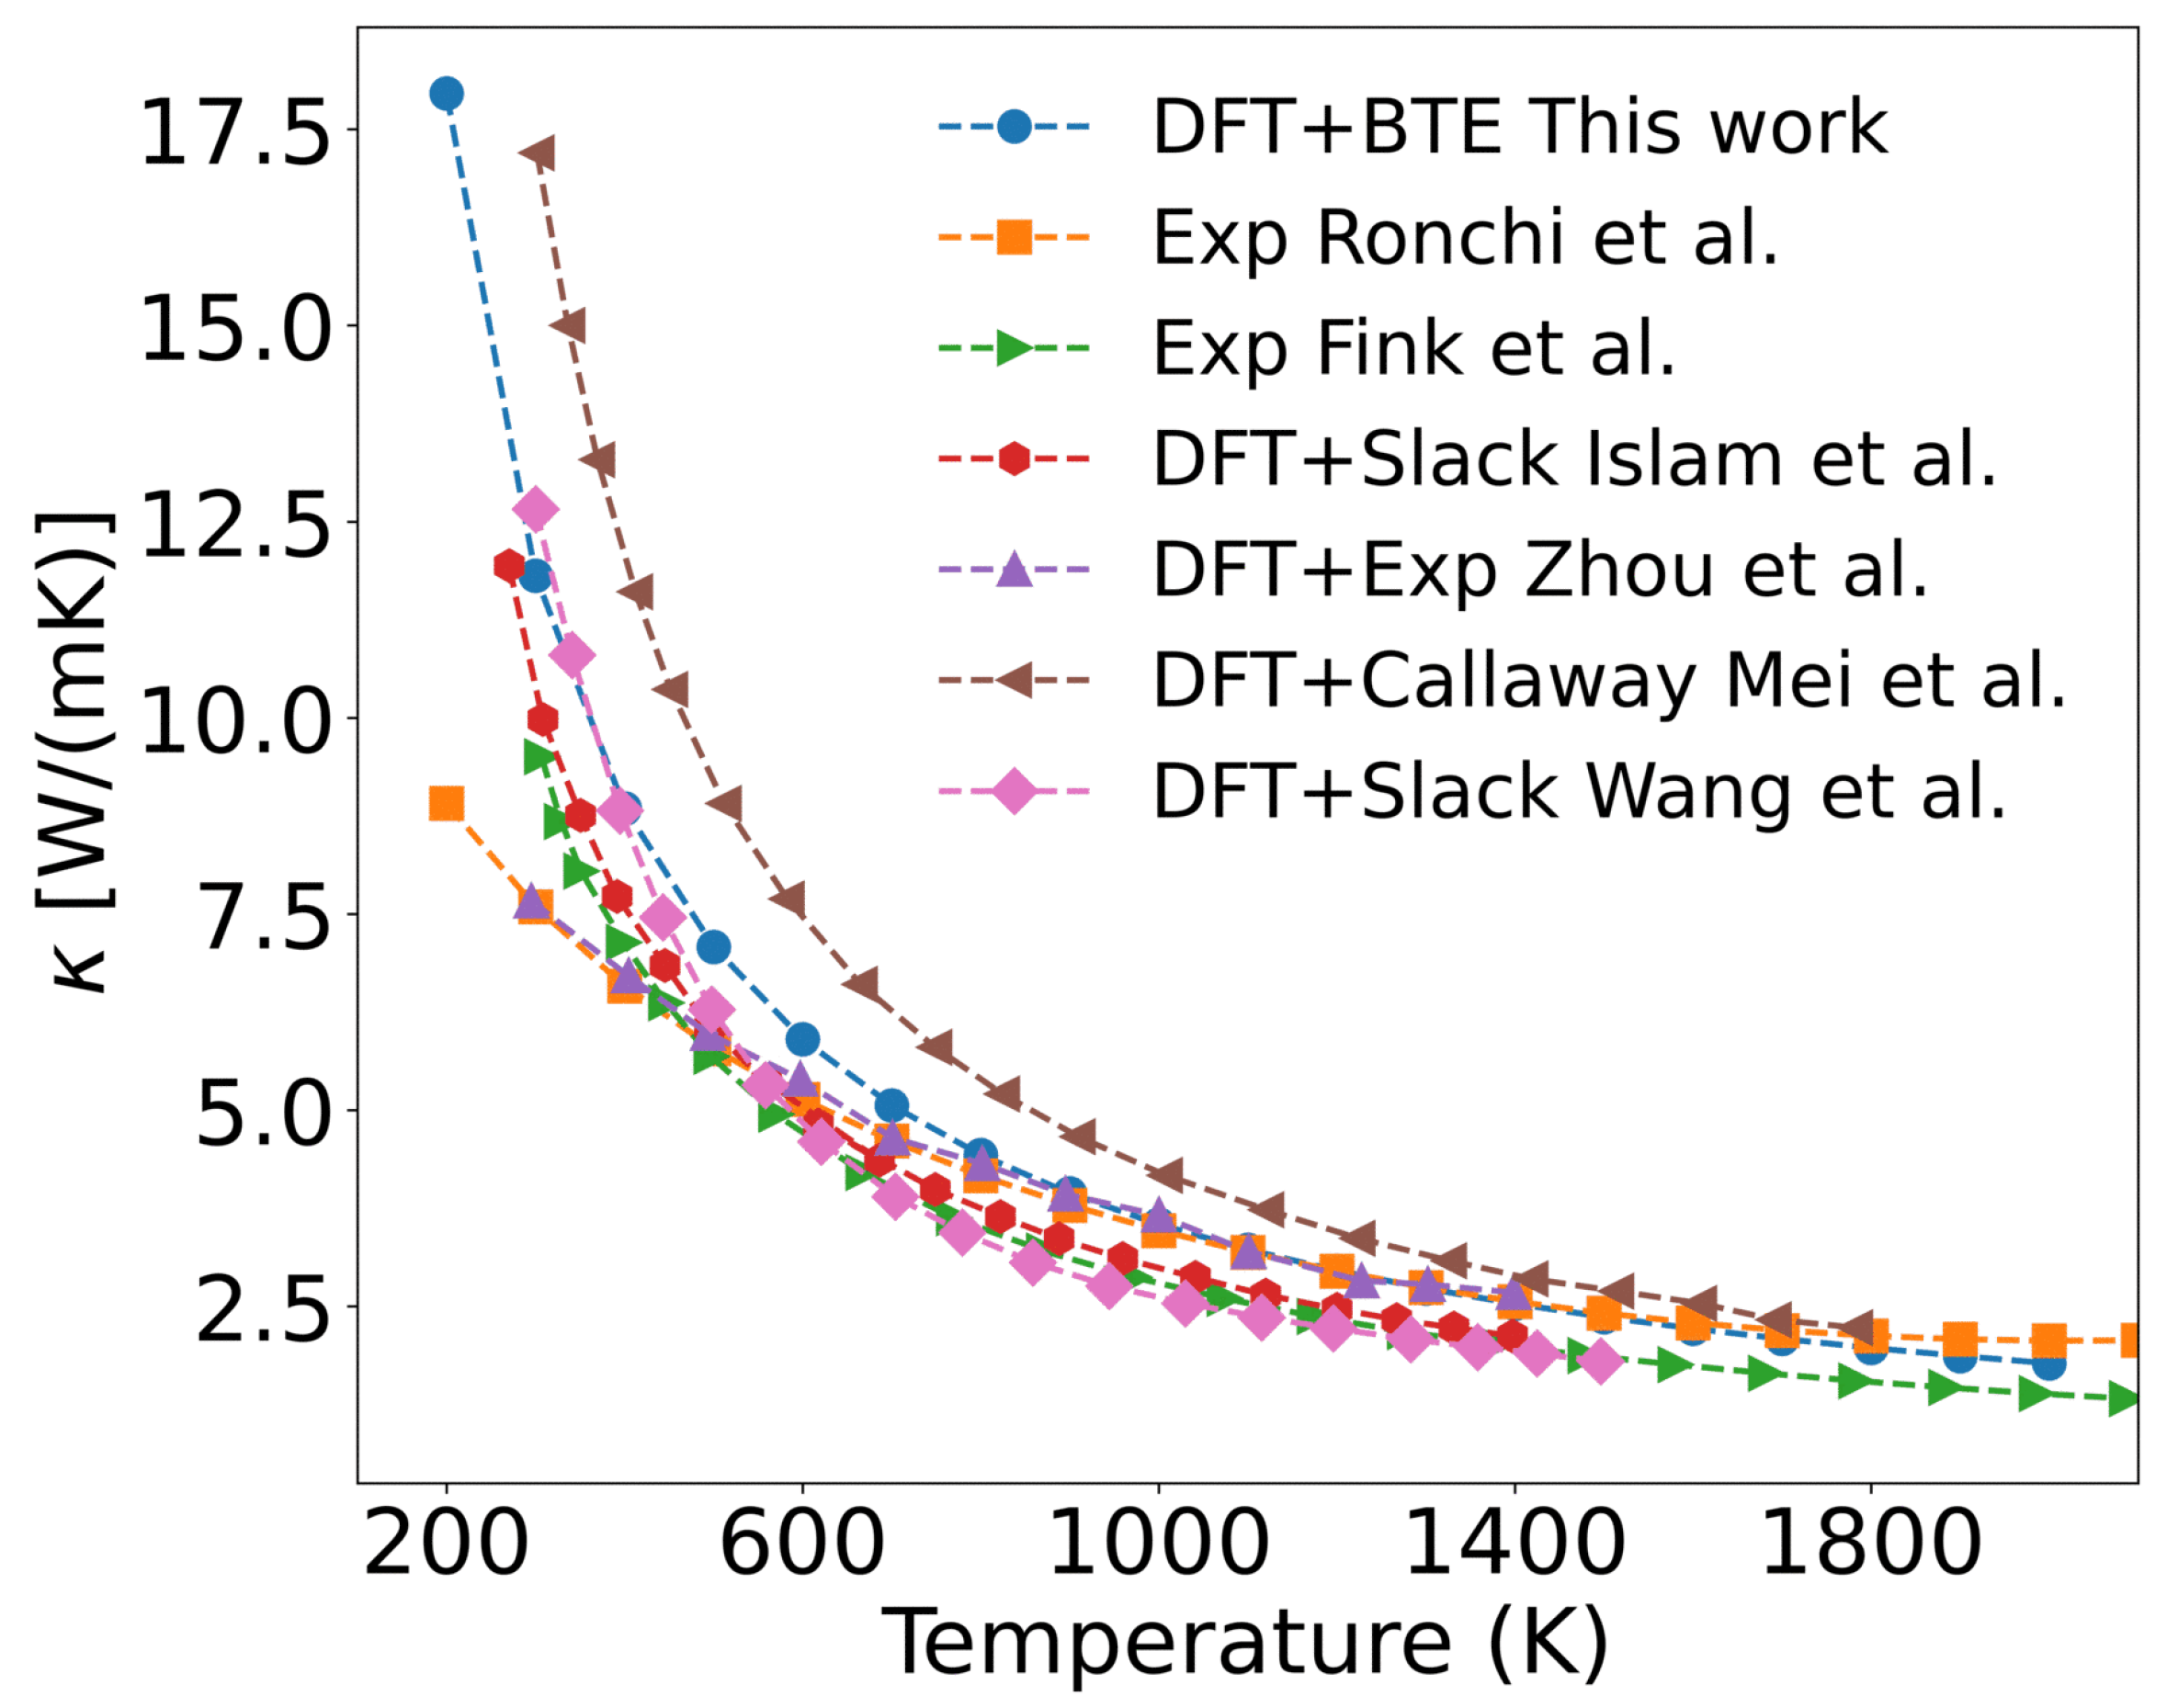
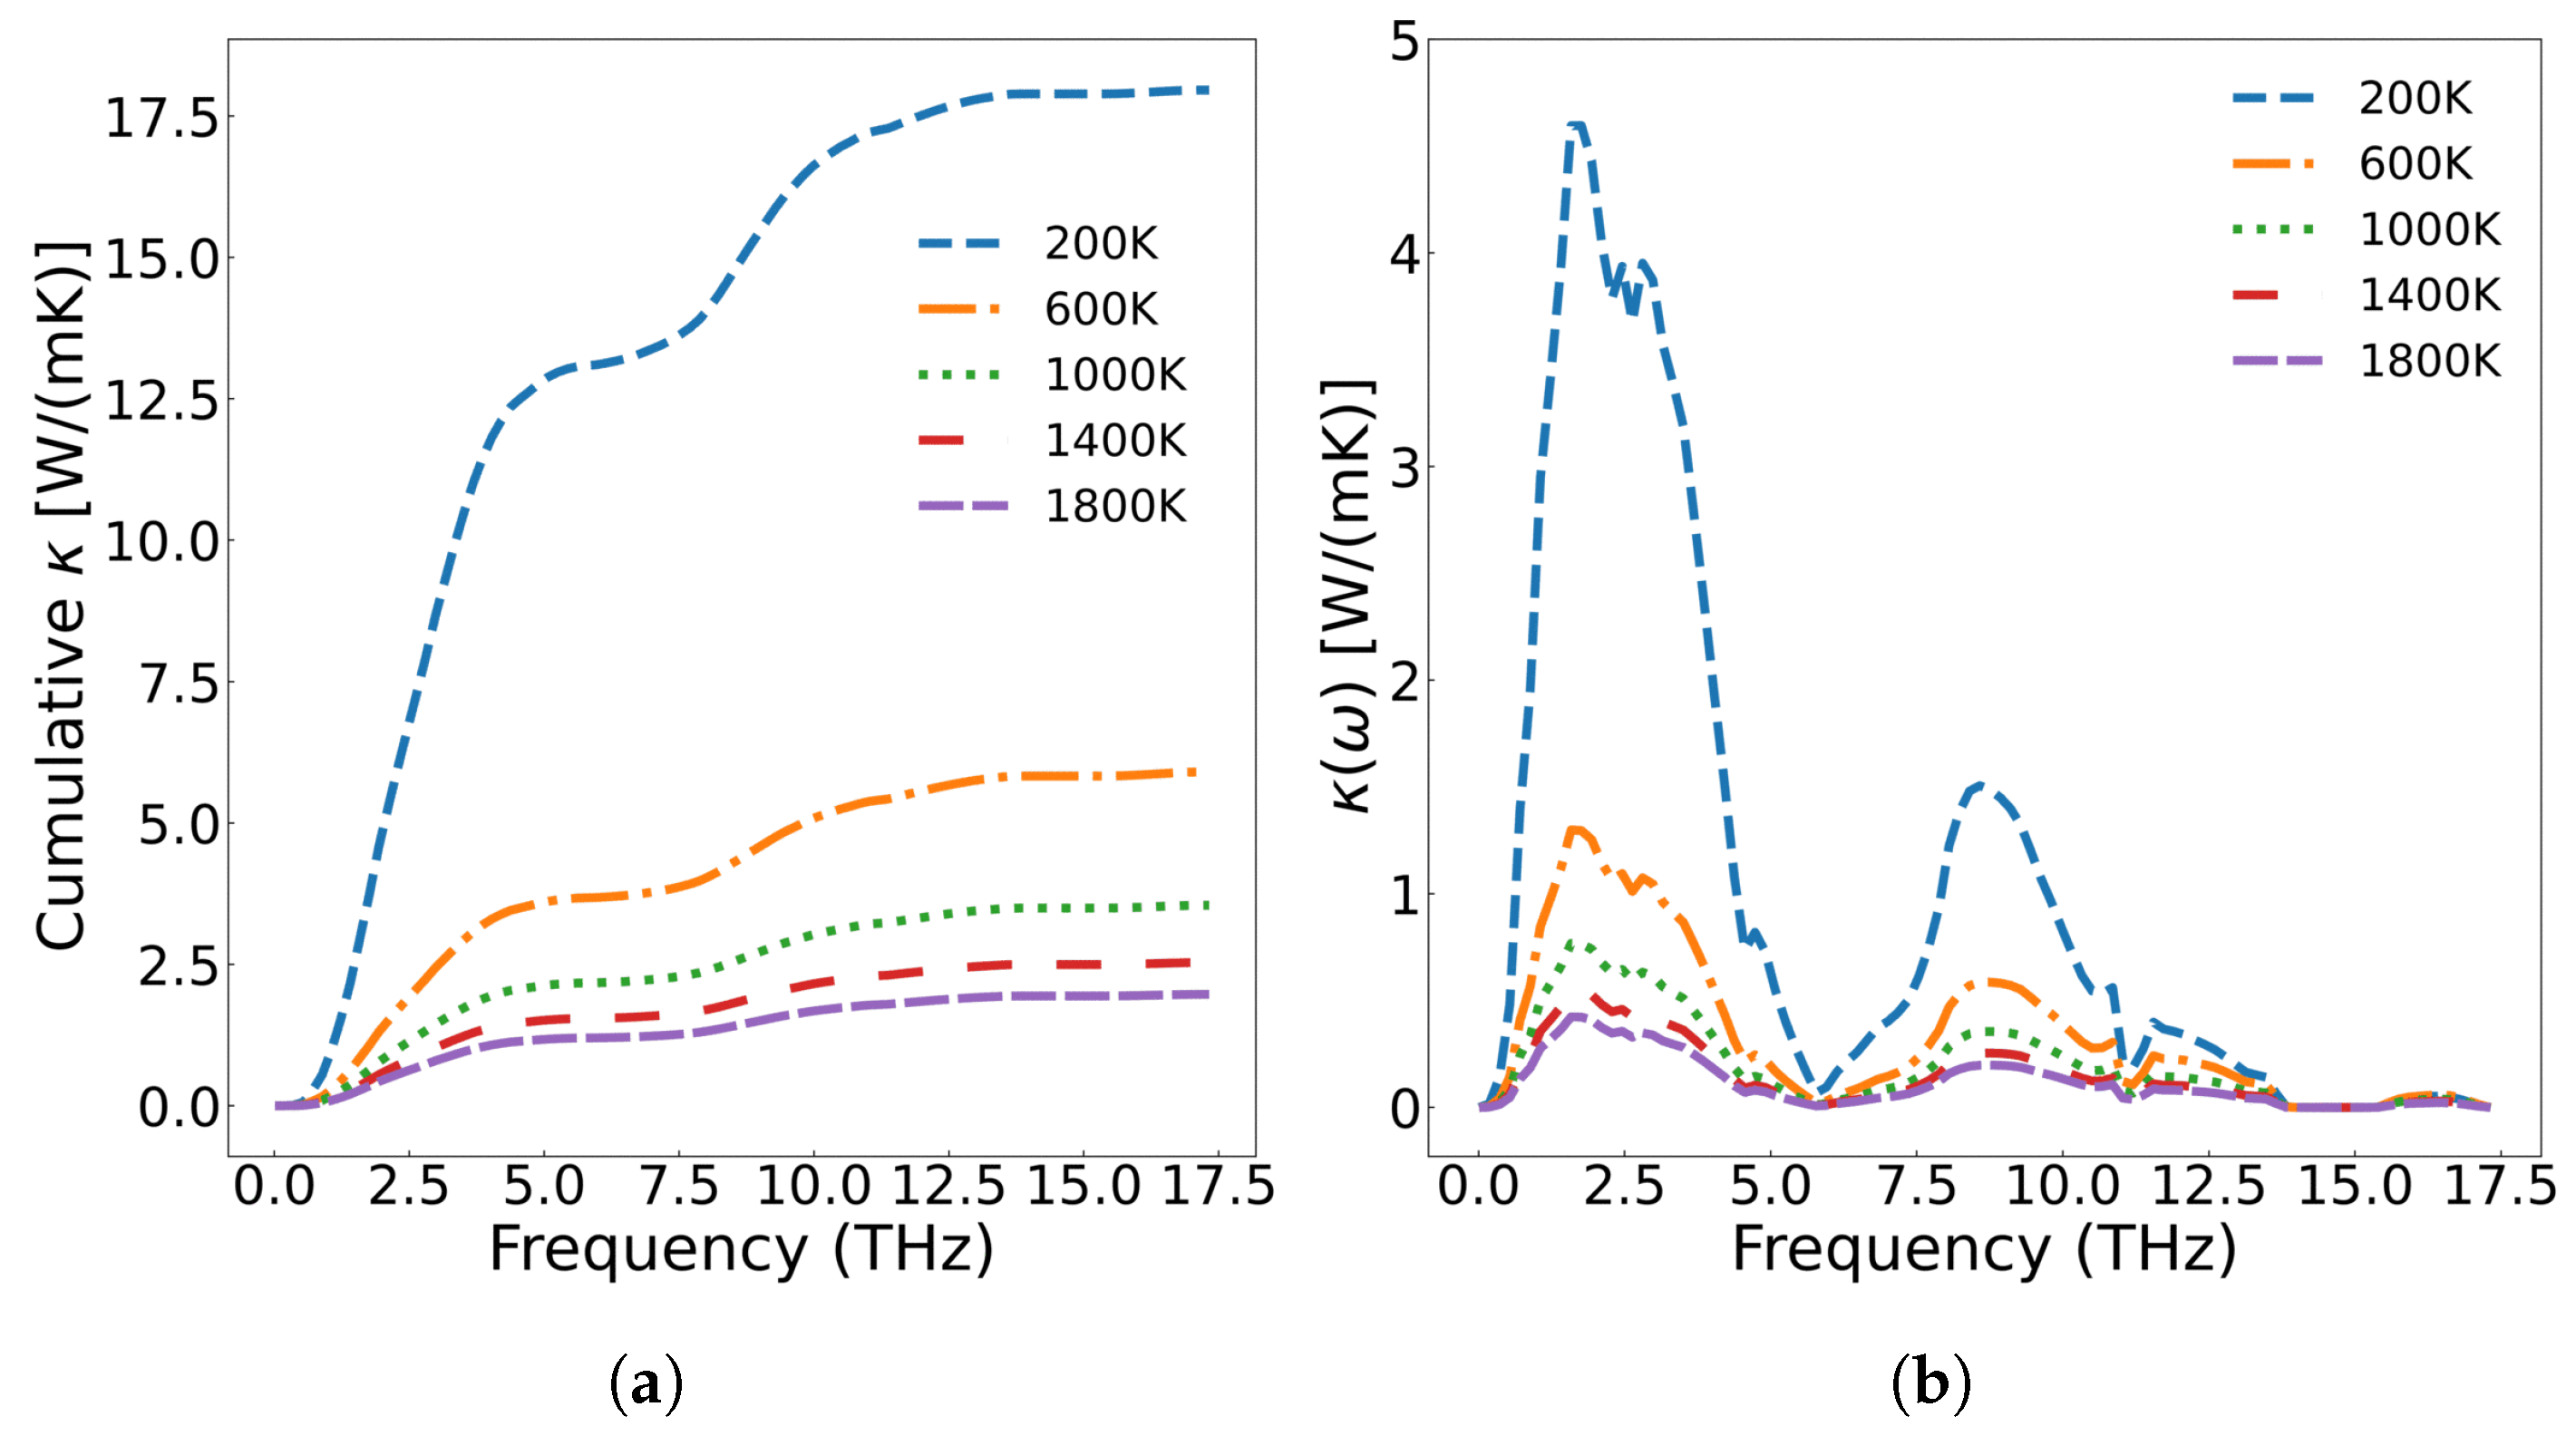
3.3.1. Pristine UO2

The thermal conductivity of unirradiated UO2, calculated through first-principles simulation combined with the Boltzmann transport equation, is shown in Figure 5. Since the UO2 single crystal contains no defects, its thermal conductivity is primarily governed by three-phonon scattering. As observed in the figure, the thermal conductivity gradually decreases with increasing temperature. At low temperatures (e.g., 300 K), lattice vibrations remain close to equilibrium positions, satisfying the harmonic approximation well. Under these conditions, different phonon modes are nearly independent, and phonon-phonon scattering is weak, resulting in high thermal conductivity (11.813 W/(m·K) at 300 K). As temperature rises, atomic vibrations deviate further from equilibrium, and the interatomic potential becomes asymmetric, breaking the independence of phonon modes. This leads to enhanced phonon scattering, such as the merging of two phonons into one or the decay of one phonon into two. Three-phonon scattering includes Normal (N) processes and Umklapp (U) processes. While N processes only redistribute phonon momentum without affecting thermal conductivity, U processes cause significant momentum reversal, increasing phonon scattering and reducing the mean free path. Consequently, thermal conductivity drops sharply at high temperatures (e.g., 1.970 W/(m·K) at 1800 K).
Figure 5 shows the calculated thermal conductivity of a perfect UO2 crystal only considering three-phonon scattering. The results exhibit a similar variation trend with existing results. In experiment, Ronchi [48], Fink [49], and others experimentally determined the thermal diffusivity, heat capacity, and density of UO2, from which they derived empirical formulas for thermal conductivity. The measured thermal conductivity in UO2 is lower than our calculated values in the 200–600 K range, as shown in Figure 5. This discrepancy may be ascribed to that UO2 samples used in experiments contain various impurities and defects (such as vacancies, grain boundaries, and surfaces). At lower temperatures, these defects scatter phonons, leading to a reduction of thermal conductivity in UO2 samples compared to the perfect single crystal. A detailed analysis of this effect will be presented later.
To validate our results, Figure 5 also presents several calculated thermal conductivity values of UO2. Among these, using Slack’s empirical model, Islam [50] and Wang [16] calculated the Debye temperature, Grüneisen parameter, and thermal conductivity. Their results, as shown in Figure 5, agree well with our calculations. However, this model cannot account for the thermal conductivity of defective UO2. Zhou [51] incorporated thermal expansion effects and employed first-principles calculations combined with the phonon Green’s function, using experimentally measured phonon linewidths for thermal conductivity calculations. Their results were lower and closer to experimental values. In contrast, Mei [52] applied the Callaway model with relaxation time approximation while adding a phonon momentum conservation term, leading to an overestimation of thermal conductivity compared to experimental data.
Figure 6a displays the frequency-dependent curve of cumulative thermal conductivity. In the figure, the contribution of phonons with different vibration frequencies is fully analyzed. As shown in Figure 6a, cumulative thermal conductivity grows rapidly as phonon frequency is below 5.8 THz, followed by slower progression in the 5.8–14.0 THz range, and for frequencies above 14.0 THz, shows no further change. Higher temperatures result in a smaller cumulative thermal conductivity value, and the variation of the cumulative thermal conductivity becomes more gradual at elevated temperatures. Figure 6b presents the thermal conductivity varying with respect to frequency. From the figure, we can see that acoustic phonons exhibit a significantly higher contribution to thermal conductivity compared with optical phonons. According to Equation (7), the thermal conductivity is multiplied by the phonon density of states. The analysis reveals that thermal conductivity is primarily governed by low-frequency (less than 5.8 THz) acoustic phonons, followed by mid-frequency optical phonons, while the high-frequency LO2’ optical branch shows negligible contribution. Additionally, the thermal conductivity decreases with increase of temperature across all frequency ranges. Figure 7 displays the three-phonon scattering strength for different phonon frequency branches at various temperatures. The results indicate that phonon scattering becomes more pronounced across all frequency branches as temperature increases, leading to a reduction in the mean free path and a shortening of phonon lifetimes.

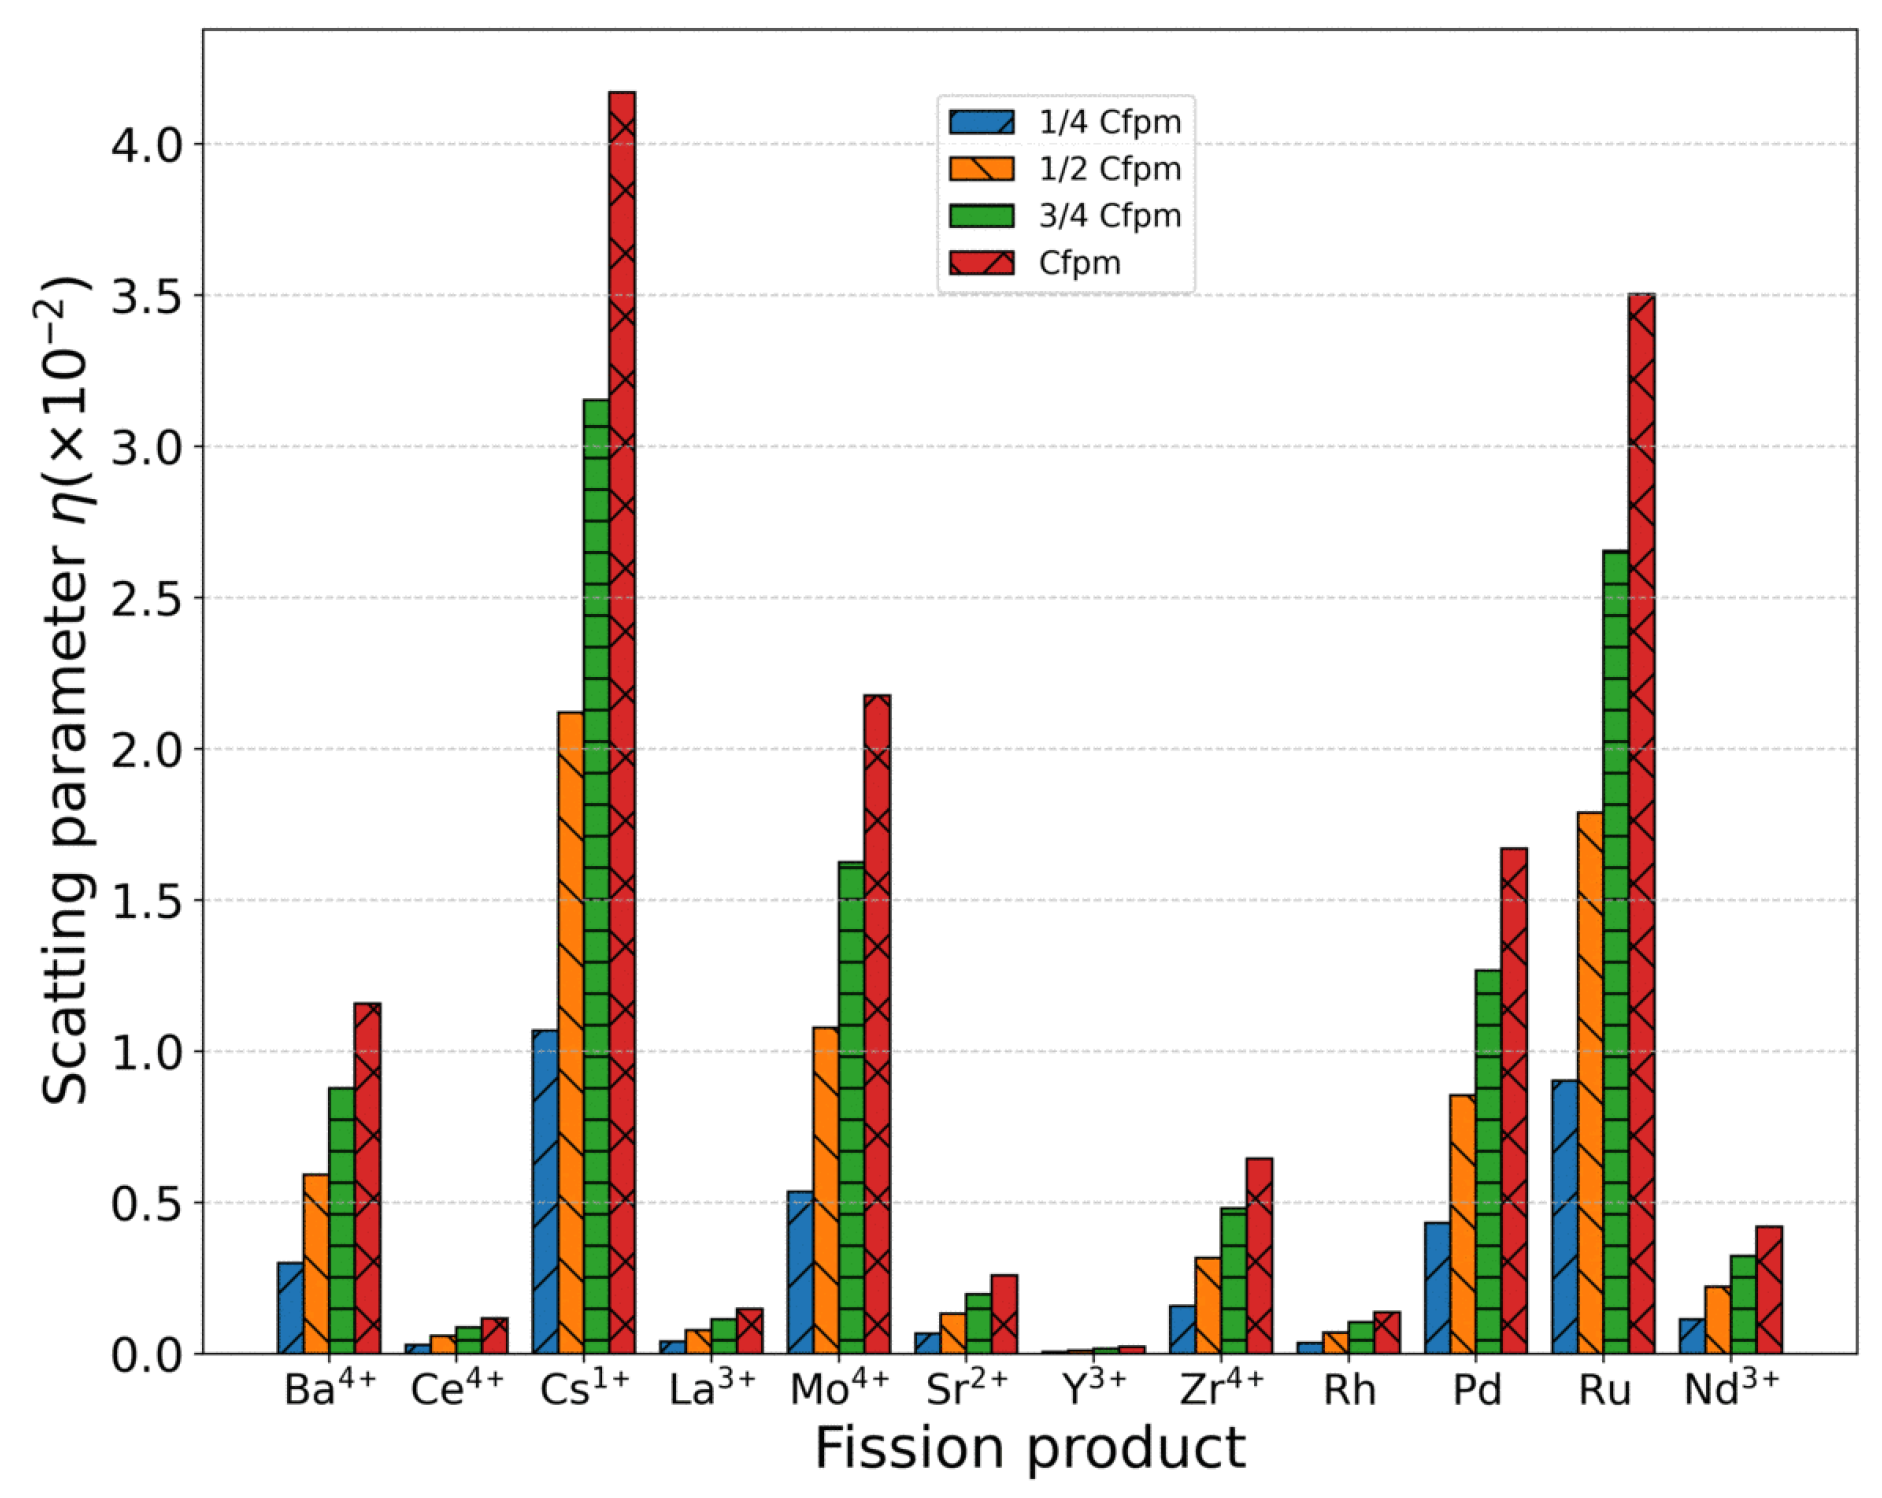
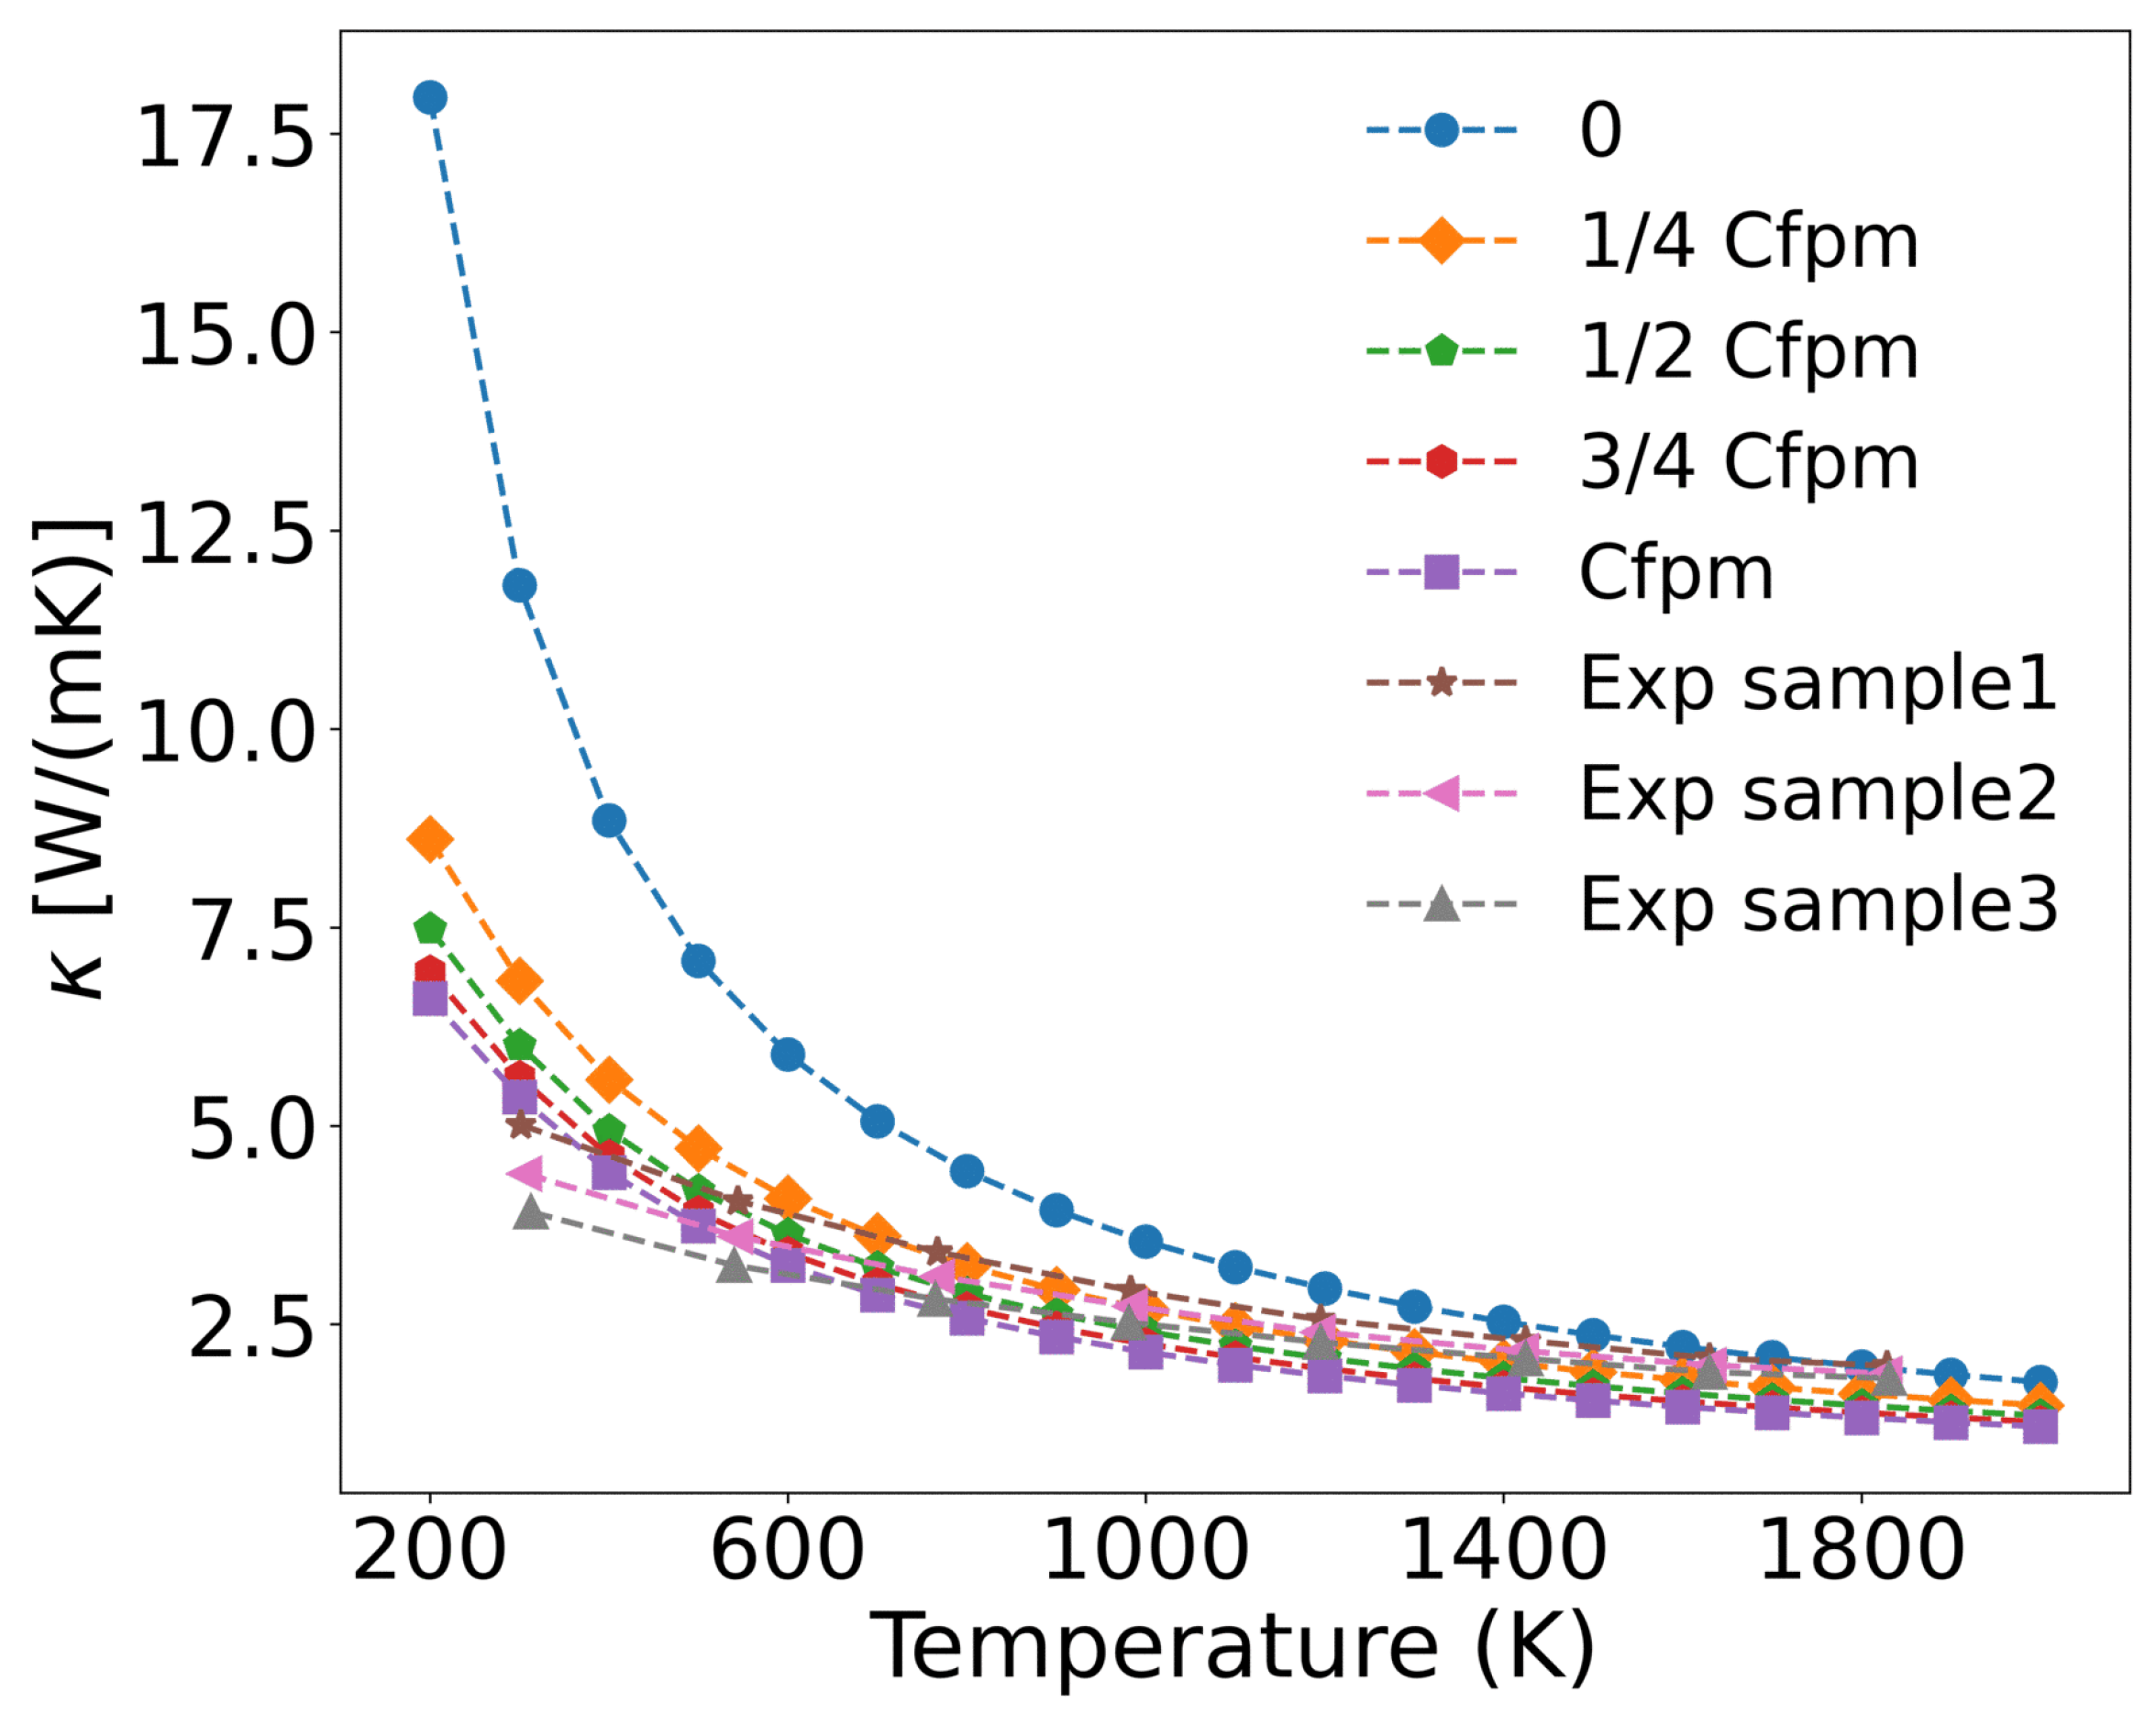
3.3.2. Solid Fission Products

The metallic elements produced during nuclear fission predominantly exist as cationic species [4,53]. These metallic atoms incorporate substitutionally into the UO2 lattice, replacing uranium atoms and acting as scattering centers for phonon transport. The phonon scattering strength induced by these defects can be quantified using Equation (7). Since the concentration of metal ions remains constant with temperature variation, their scattering strength depends exclusively on their concentration and intrinsic properties rather than thermal conditions. Table 1 presents the concentrations of various metallic fission products measured in SIMFUEL samples (76 GWd/tU burnup) from Chalk River Laboratories, Canada [54]. The scattering parameter η of each metallic ion was calculated based on its valence state and ionic radius within the UO2 matrix, with U 4 + and O 2 reference radii of 1.001 Å and 1.368 Å, respectively, as shown in Table 1. The calculated scattering strength of fission product elements are presented in Figure 8, revealing the following descending order of scattering strength: Cs 1 + > Ru > Mo 4 + > Pd > Ba 4 + > Zr 4 + > Nd 3 + > Sr 2 + > La 3 + > Rh > Ce 4 + > Y 3 + . Analysis of these point defects in Table 1 demonstrates that the scattering strength is governed by two key parameters: (1) the mass difference between impurity and host atoms ( | M i M ¯ | ); (2) the ionic radius mismatch ( | R i R ¯ | ). Notably, the radius difference ( | R i R ¯ | ) dominates the scattering behavior, as it simultaneously accounts for: (1) modifications in local force constants between the dopant and surrounding matrix atoms; (2) lattice strain induced by volumetric changes at defect sites.
In Equation (9), the constant ε is typically determined through experimental measurements. Masayuki et al. [55] investigated the thermal conductivity of ceramic solid solutions in ThO2-UO2 fuel systems. By fitting thermal conductivity data across different temperatures and uranium solid solubility levels, they determined ε = 100 for the ThO2 system, which was subsequently used to accurately predict the thermal conductivity of ThO2-CeO2 at various temperatures. Duriez et al. [27] adopted a linear regression approach in their study of thermal conductivity in non-stoichiometric (U,Pu)O2−x mixed oxide fuels with low plutonium content, obtaining ε = 25.85 for UO2. However, there remains no consensus on the optimal value of ε , and this study adopts ε = 25.85.
Based on measured concentrations of metallic fission products (denoted as Cfpm) in UO2 fuel at 76 GWd/tU burnup, and assuming a linear relationship between metal atom concentration and burnup, we established four concentrations levels: 1/4 Cfpm, 1/2 Cfpm, 3/4 Cfpm, and Cfpm, corresponding to burnups of 19 GWd/tU, 38 GWd/tU, 57 GWd/tU, and 76 GWd/tU, respectively. The fission product concentrations and burnup in UO2 fuel are typically determined through experimental measurements and numerical simulations [56]. The temperature-dependent thermal conductivity of UO2 was then calculated for these varying metal ion concentrations. As shown in Figure 9, the thermal conductivity progressively decreases with increasing metal ion concentration, and the calculated values align well with experimental data [57], which simulated burnup by doping fission product elements into UO2. Sample1, sample2, and sample3 correspond to simulated burnup levels of 30 GWd/tU, 60 GWd/tU, and 90 GWd/tU, respectively, with the concentrations of doping fission product elements are listed in Table 2.
The incorporation of metallic defects reduces the thermal conductivity of UO2, particularly in the 200–1000 K range, where reductions exceed 50%. However, the incremental effect diminishes at higher concentrations (1/4 Cfpm to Cfpm), suggesting that the impact of fission product metal ions on thermal conductivity saturates beyond a threshold concentration. All three experimental samples exhibited lower thermal conductivity than the calculated values. As shown in Table 1 and Table 2, the higher concentrations of solid fission products correlate with a greater degradation of thermal conductivity.
Figure 10 presents the frequency-dependent phonon scattering strength. Lower defect concentrations yield weaker scattering, with metallic fission products primarily scattering the low-frequency (less than 5.8 THz) acoustic branches generated by uranium atom vibration. The scattering strength increases with concentration, while optical branches originating from oxygen atom vibrations remain virtually invariant. Consequently, the reduction in thermal conductivity predominantly stems from scattering of low-frequency phonons.

3.3.3. Fission Gas Xe

The fission gas atom Xe differs from solid fission metal atoms in that, as an inert gas atom, it scarcely forms chemical bonds with the UO2 matrix. Its primary phonon scattering mechanisms arise from mass contrast, atomic size mismatch, and modifications to interatomic force constants near Xe defects. Xe atoms predominantly occupy irradiation-induced U and O vacancies, forming substitutional defects that are dispersed throughout the lattice. Figure 11 illustrates the influence of varying Xe concentrations on thermal conductivity when substituting for U sites alone versus simultaneous substitution at both U and O sites. As shown in Figure 11a, when Xe occupies only U vacancies, low concentrations (<0.1 at%) exhibit minimal impact on thermal conductivity, whereas higher concentrations (>0.5 at%) induce significant degradation between 200 and 1000 K. This effect diminishes at elevated temperatures (>1000 K), where three-phonon scattering becomes dominant. Below 1000 K, Xe exerts strong phonon scattering that weakens progressively with increasing temperature. These results agree with molecular dynamics simulations by CHEN et al. [58], though potentials by Basak and Busker overestimate thermal conductivity (16.10 and 18.99 W/(m·K) at 300 K compared to our calculated value of 11.813 W/(m·K). By systematically evaluating the thermal conductivity of UO2 at 0.01%, 0.05%, 0.1%, 0.5%, 1.0%, and 2.0% Xe concentrations, we provide fundamental data support for establishing fuel performance prediction under “high-burnup” structures.
As shown in Figure 11a, when Xe atoms occupy only U vacancies, they primarily scatter the low-frequency (less than 5.8 THz) acoustic phonon modes generated by U atom vibrations. However, when Xe atoms simultaneously occupy both U and O vacancies at the same concentration, their impact on thermal conductivity becomes more pronounced than when occupying U vacancies alone. This is demonstrated in Figure 11b, where a distribution of 90 at% Xe in U vacancies and 10 at% Xe in O vacancies results in greater thermal conductivity reduction at identical temperatures compared to the case where Xe occupies only U sites. The underlying mechanism, illustrated in Figure 12, reveals that Xe atoms occupying O vacancies exhibit stronger scattering of high-frequency (greater than 5.8 THz) phonons (generated by O atom vibrations) than the scattering of low-frequency phonons (generated by U atom vibrations). Fission gas Xe atoms significantly degrade the thermal conductivity of UO2, demonstrating strong scattering effects on both low- and high-frequency phonons, with the specific influence depending on their occupation sites.

3.3.4. Irradiated Point Defects

Unlike fission products, the concentration and distribution of irradiation-induced defects are strongly influenced by neutron energy spectra and irradiation temperature. The calculated formation energies of point defects in UO2 [59,60], revealing that the formation energy of oxygen interstitials is negative, and all other types of point defects exhibit positive and relatively high formation energies. According to Equation (9), since uranium interstitials and oxygen interstitials induce identical mass and radius differences (with the same proportionality constants being used), their scattering strength is equivalent to those of vacancies. To analyze the effect of irradiation defects on UO2 thermal conductivity, Figure 13a and b present the temperature-dependent thermal conductivity changes caused by irradiation-generated U and O vacancies. At equal concentrations, U vacancies demonstrate a greater impact on thermal conductivity reduction compared to O vacancies. However, in actual irradiated UO2, defects simultaneously contain both U and O vacancies. In this case, as shown in Figure 13c, both acoustic and optical phonon branches are scattered by vacancies, leading to more significant thermal conductivity degradation than when either U or O vacancies exist alone.
Kaloni et al. [61] employed the DFT+U method to investigate the electronic and phonon thermal conductivity of non-stoichiometric UOx (x = 1.75–2.0, corresponding to oxygen vacancy concentrations of 0–12.5 at%). For x < 1.87 (oxygen vacancy concentration <6.5 at%), the phonon thermal conductivity decreases with increasing oxygen vacancy concentration, consistent with our computational results. While the electronic thermal conductivity in this regime exceeds that of stoichiometric UO2, the increase remains marginal. However, when the oxygen vacancy concentration exceeds 6.5 at%, the thermal conductivity of UOx unexpectedly increases. This phenomenon arises from the insulator-to-metal transition in highly oxygen-deficient UOx, where enhanced electronic thermal conductivity dominates the overall heat transport. Figure 14 presents the scattering strength of 2.0 at% U and O vacancies on phonons and their temperature-dependent effects on thermal conductivity across different phonon frequencies. The results demonstrate that both U and O vacancies reduce thermal conductivity of UO2 but through distinct mechanisms: U vacancies primarily scatter low-frequency acoustic phonons, while O vacancies preferentially scatter high-frequency (greater than 5.8 THz) optical phonons. Notably, the combined presence of both vacancy types leads to broadband phonon scattering across all frequencies, resulting in more significant thermal conductivity reduction than either defect alone.

4. Conclusions

This study comprehensively investigated the phonon thermal conductivity of UO2 with defects using first-principles DFT+U calculations combined with the Boltzmann Transport Equation. The research elucidated the electronic structure, phonon spectrum, and thermal transport properties of UO2, with a focus on the effects of fission products and irradiation-induced defects. The key findings are summarized as follows:
  • Electronic and Phonon Properties: DFT+U calculations (U = 3.6 eV) accurately reproduced the Mott insulating nature of UO2, with a bandgap of 1.990 eV, consistent with experimental values (~2.0 eV). The phonon spectrum and Gruneisen parameter ( γ = 1.86) aligned well with inelastic neutron scattering data, though high-frequency optical modes exhibited slight deviations due to negligible anharmonic effects at 0 K;
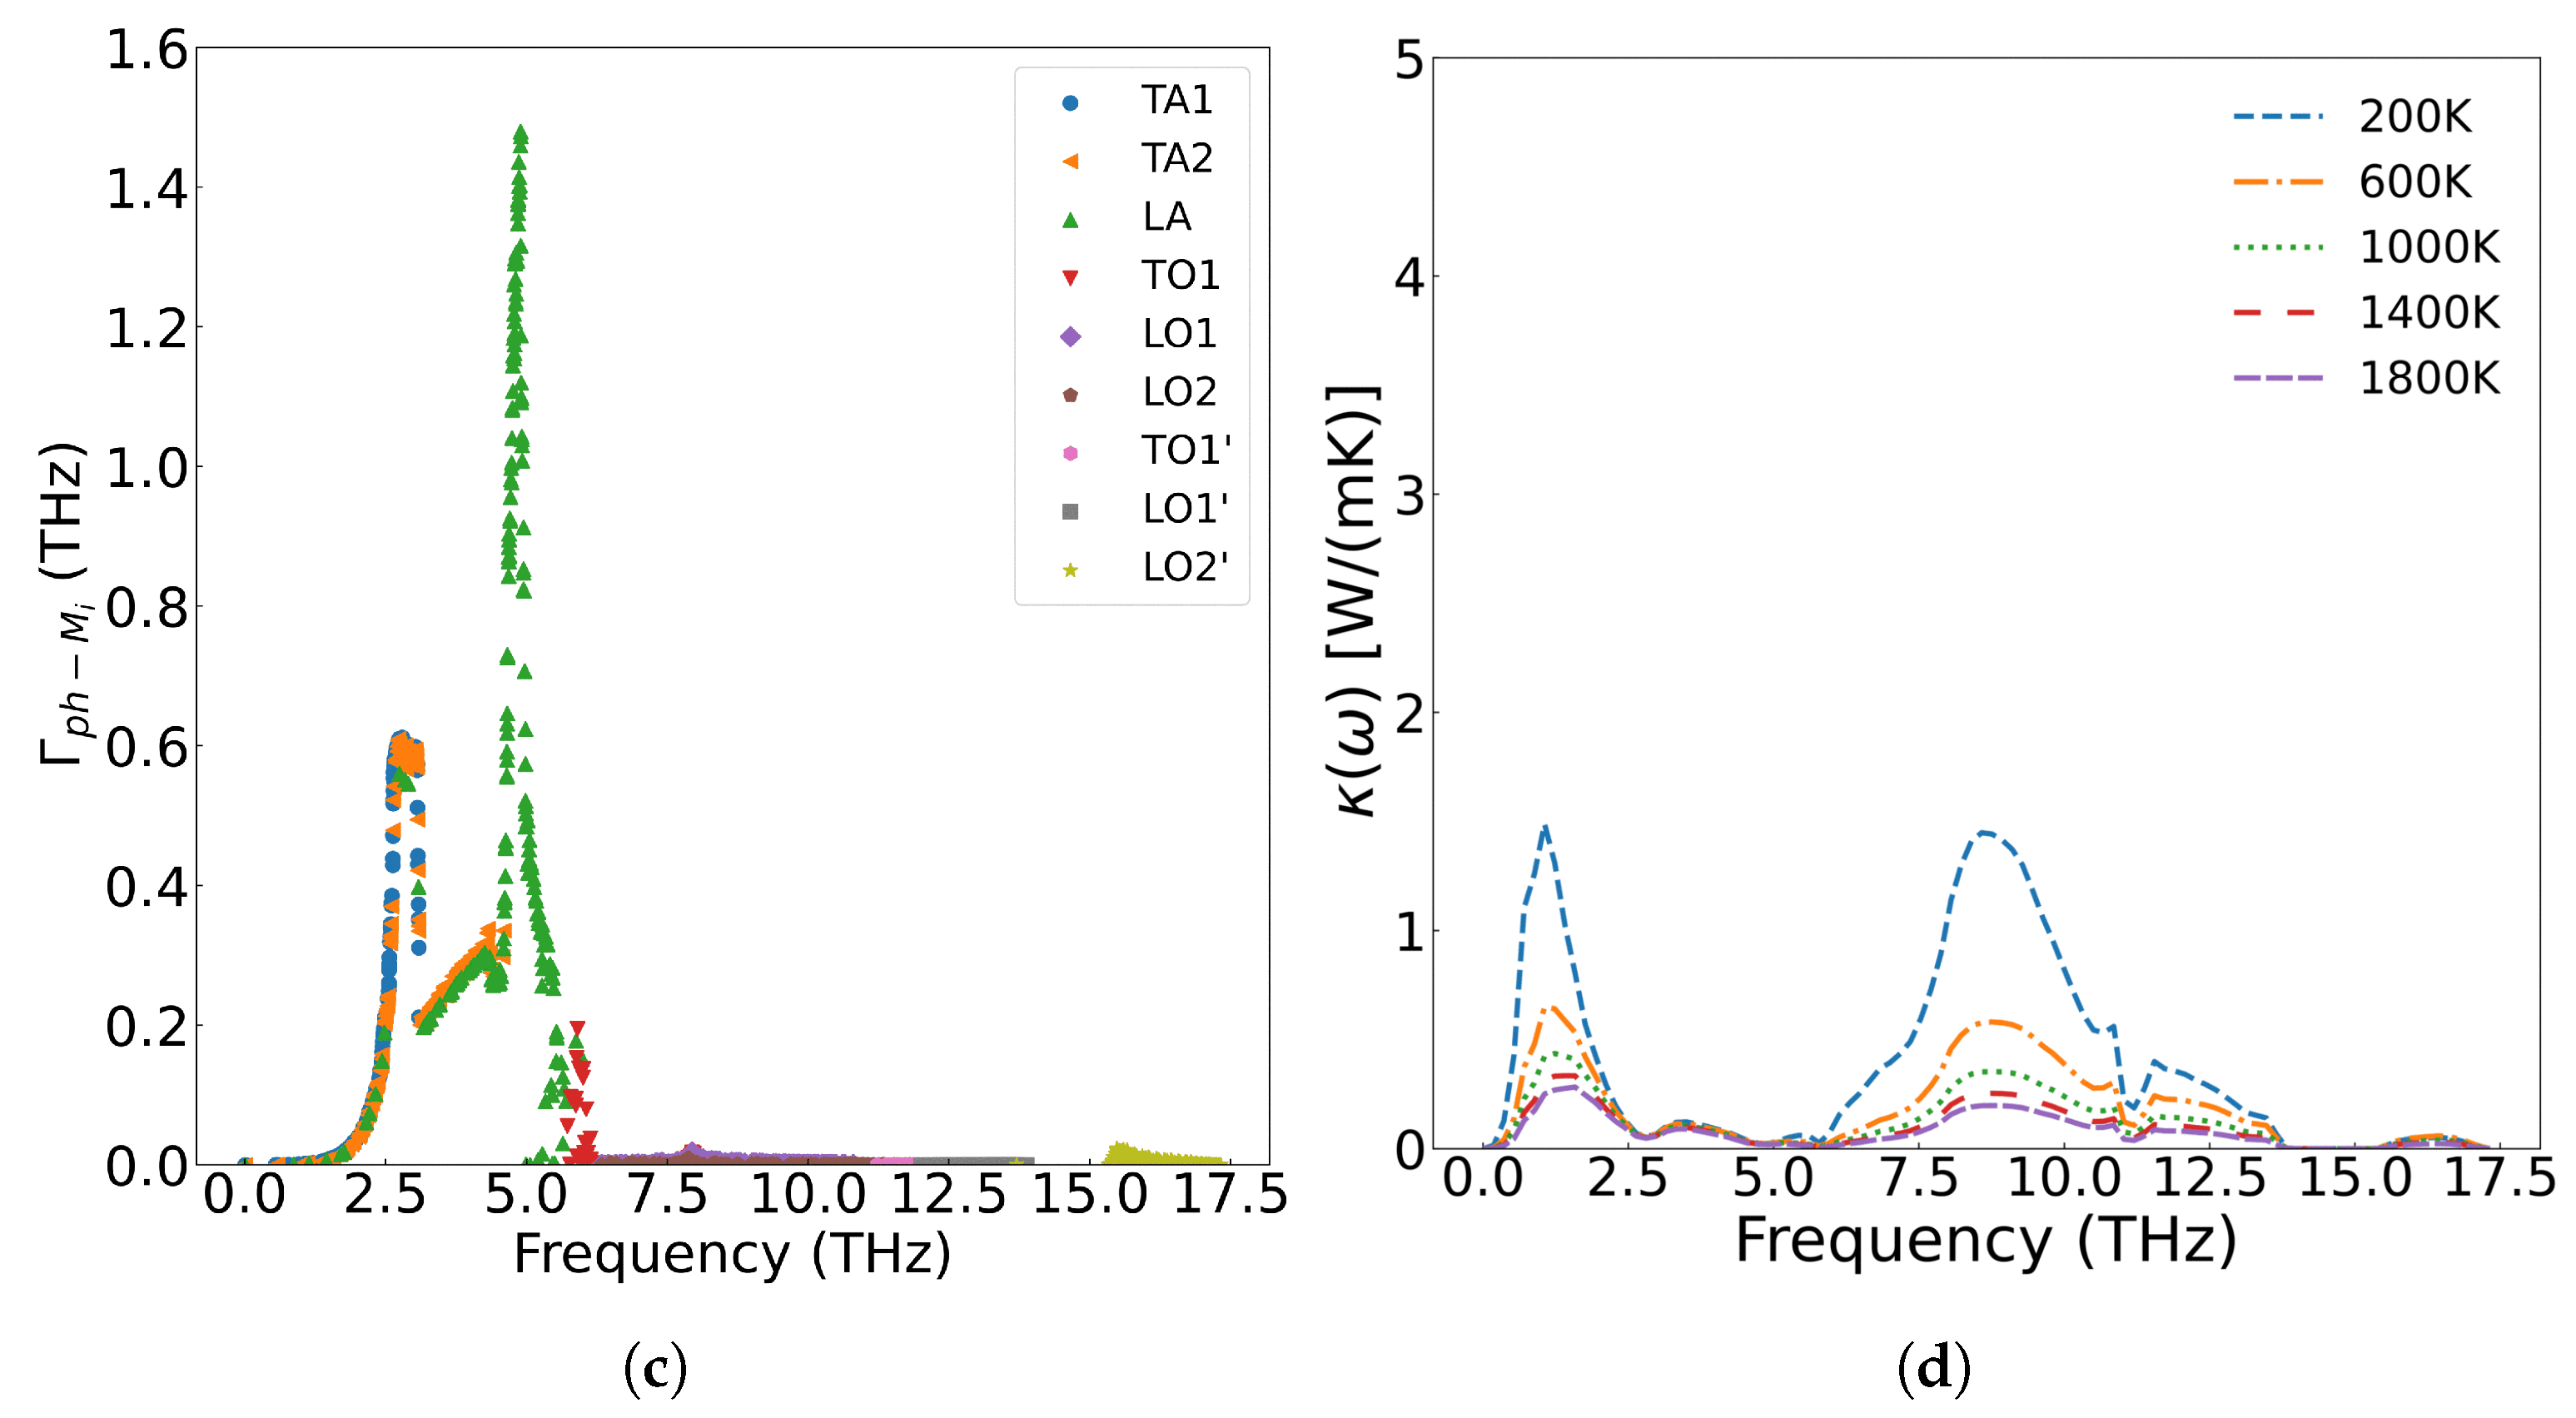
  • Impact of Fission Products: Metallic fission products (e.g., Mo, Ru, Ba) preferentially scattered low-frequency (less than 5.8 THz) phonons, reducing thermal conductivity by over 50% at high concentrations (76 GWd/tU). The scattering strength was governed by mass contrast and ionic radius mismatch, with the latter playing a dominant role. Fission gas Xe exhibited dual scattering mechanisms: occupying U vacancies primarily affected low-frequency phonons, while simultaneous occupation of U and O vacancies scattered both low- and high-frequency phonons, leading to more pronounced thermal conductivity degradation.
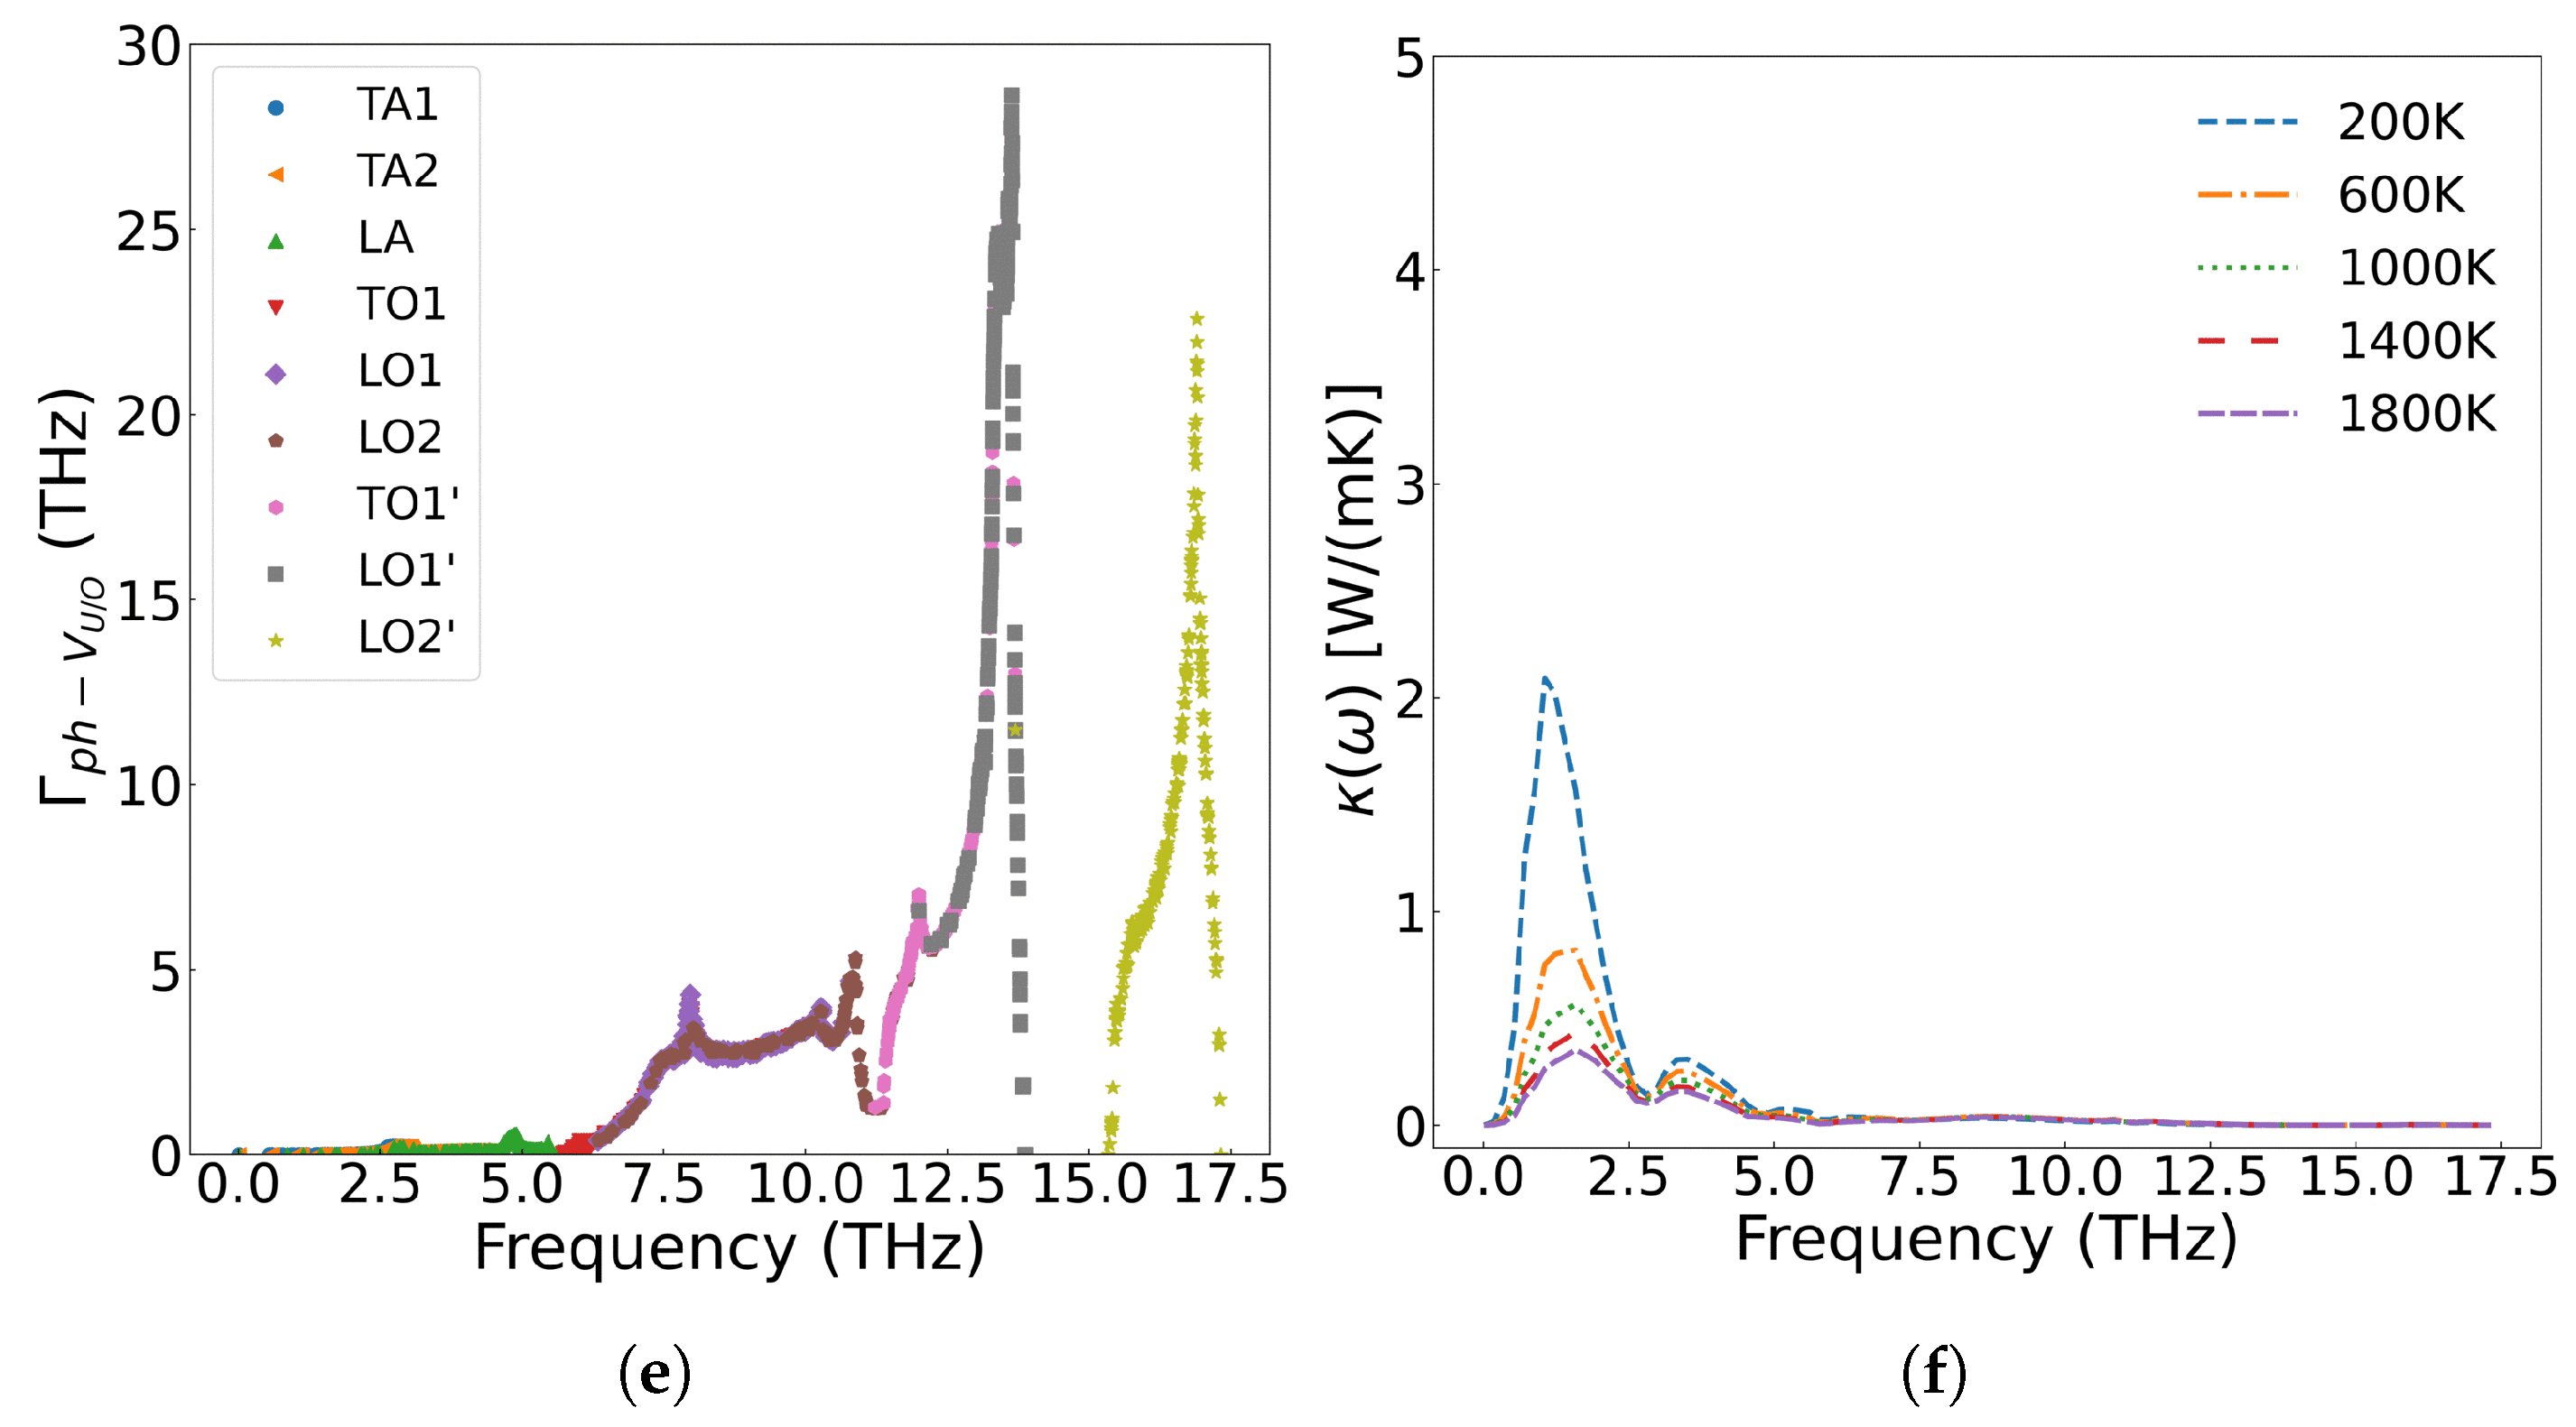
  • Irradiation-Induced Defects: U vacancies strongly scattered low-frequency phonons, whereas O vacancies targeted high-frequency (greater than 5.8 THz) modes. The combined presence of both vacancy types caused broadband phonon scattering, further reducing thermal conductivity. Notably, defect clusters and extended defects (not explicitly modeled here) likely introduce additional scattering channels in real irradiated fuels.
Although our results validate and extend prior theoretical and experimental work on thermal conductivity of irradiated UO2, there still exist some questions regarding defect-phonon interactions and thermal conductivity degradation mechanisms in defected UO2. For example, our defect models assume isolated point defects in irradiated fuels, but complex defect clusters (e.g., Xe bubbles, metal precipitates) and extended defects (dislocations, grain boundaries) likely introduce additional phonon scattering mechanisms not taken into consideration here. Future work should integrate DFT+U calculations with multiscale modeling approaches (e.g., phase-field, kinetic Monte Carlo) to simulate defect evolution under irradiation and discuss its impact on thermal transport. This study provides a fundamental understanding for thermal transport of UO2, emphasizes the critical role of defect management in mitigating thermal conductivity degradation, and helps to establish the design principle for more efficient nuclear fuels’ development.

Author Contributions

Conceptualization, J.Q., L.W. and A.T.; methodology, M.Z. and R.P.; software, J.Q.; validation, M.Z., J.Q. and R.P.; formal analysis, J.Q.; investigation, J.Q. and M.Z.; resources, L.W.; data curation, J.Q.; writing—original draft preparation, J.Q.; writing—review and editing, J.Q.; visualization, R.P.; supervision, A.T.; project administration, L.W.; funding acquisition, L.W. All authors have read and agreed to the published version of the manuscript.

Funding

This research was funded by National Key Research and Development Program of China (grant number 2022YFB1902401) and Natural Science Foundation of Sichuan Province (grant number 2024NSFSC0190).

Institutional Review Board Statement

Not applicable.

Informed Consent Statement

Not applicable.

Data Availability Statement

The original contributions presented in this study are included in the article. Further inquiries can be directed to the corresponding author.

Acknowledgments

The authors gratefully acknowledge the financial support from the National Natural Science Foundation of China and Sichuan Provincial Department of Science and Technology for this work.

Conflicts of Interest

The authors declare no conflicts of interest.

Appendix A. Relaxation-Time Approximation

The scattering term on the right side of Equation (1) is expressed in the form of Equation (A1):
n q ν t s c a t t = q ν Ω q ν , q ν δ n q ν
where Ω q ν , q ν is the scattering matrix, and δ n q ν = n q ν n ¯ q ν represents the deviation of the phonon population from its equilibrium value. Using perturbation theory to solve the system under a small temperature gradient T , the perturbed phonon population n q ν is replaced by n ¯ q ν . A function f q ν is introduced to quantify the deviation of the phonon population in mode q ν from the equilibrium distribution. Expanding the phonon distribution under the temperature gradient around the equilibrium distribution and retaining only the linear term [22], as shown in Equation (A2).
n q ν = 1 exp ω q ν / k B T f q ν 1 n ¯ q ν f q ν n ¯ q ν ( ω q ν / k B T ) = n ¯ q ν + f q ν n ¯ q ν ( n ¯ q ν + 1 )
For computational convenience, let A q ν , q ν = Ω q ν , q ν n ¯ q ν ( n ¯ q ν + 1 ) . The scattering matrix A is expressed as:
A q ν , q ν = q ν , q ν P q ν , q ν q ν + 1 2 P q ν q ν , q ν + q ν P q ν , q ν i m p u r i t y + P q ν o t h e r s
Based on Equations (A1)–(A3), the Boltzmann transport equation (BTE) is derived as:
v q ν n ¯ q ν T T = q ν , q ν [ P q ν , q ν q ν ( f q ν + f q ν f q ν ) + 1 2 P q ν q ν , q ν ( f q ν f q ν + f q ν ) ] + q ν P q ν , q ν i m p u r i t y ( f q ν f q ν ) + P q ν o t h e r s f q ν
Taking the derivative of n ¯ q ν with respect to temperature T, we obtain:
n ¯ q ν T = ω q ν k B T 2 n ¯ q ν ( n ¯ q ν + 1 )
The BTE can be written in matrix form as:
X = P f
In X , the X q ν = ω q ν k B T 2 n ¯ q ν ( n ¯ q ν + 1 ) v q ν T , according to the definition of thermal conductivity:
Q = κ T ,
where κ is the thermal conductivity, and the heat flux Q is given by:
Q = 1 N 0 V q ν ω q ν Δ n q ν v q ν = 1 N 0 V q ν ω q ν n ¯ q ν ( n ¯ q ν + 1 ) v q ν f q ν
Here, Δ n q ν = n q ν n ¯ q ν represents the deviation from the equilibrium concentration, expressing the thermal conductivity κ as:
κ = Q T = k B T 2 N 0 V | T | 2 q ν X q ν f q ν = k B T 2 N 0 V | T | 2 X f
The phonon scattering matrix P is expressed as P = Γ + Λ , where Γ is the diagonal scattering matrix and Λ is the off-diagonal matrix. Under the single-mode relaxation time approximation (SMRTA), only the diagonal elements of the scattering matrix are considered, and the off-diagonal elements (i.e., interactions between scatterings) are neglected, yielding P = Γ .
( P f ) q ν P q ν f q ν = Γ q ν f q ν = n q ν t s c a t t = n q ν n ¯ q ν τ q ν = n ¯ q ν ( n ¯ q ν + 1 ) f q ν τ q ν
From the above, we derive:
Γ q ν = n ¯ q ν ( n ¯ q ν + 1 ) τ q ν
Using Equation (A9)–(A11), the expression for the thermal conductivity κ [22] is:
κ = k B T 2 N 0 V | T | 2 X f = k B T 2 N 0 V | T | 2 X P 1 X = k B T 2 N 0 V | T | 2 X Γ 1 X = 2 N 0 V k B T 2 q ν v q ν 2 ω q ν 2 n ¯ q ν ( n ¯ q ν + 1 ) τ q ν

References

  1. Simnad, M.T. Nuclear Reactor Materials and Fuels. In Encyclopedia of Physical Science and Technology; Elsevier: Amsterdam, The Netherlands, 2003; pp. 775–815. [Google Scholar] [CrossRef]
  2. Bates, J.L.; Sayers, J.B.; Bergenlid, U. Thermal Conductivity of Uranium Dioxide; Number 59 in Technical Reports Series; International Atomic Energy Agency: Vienna, Austria, 1966; pp. 1–58. [Google Scholar]
  3. Olander, D. Point-defects in irradiated UO2. J. Nucl. Mater. 2010, 399, 236–239. [Google Scholar] [CrossRef]
  4. Glodeanu, F. PROCESSES of UO2 fuel cycle. Fuel 2020. preprint. [Google Scholar] [CrossRef]
  5. Sheykhi, S.; Payami, M. Electronic structure properties of UO2 as a Mott insulator. Phys. C Supercond. Appl. 2018, 549, 93–94. [Google Scholar] [CrossRef]
  6. Hurley, D.H.; El-Azab, A.; Bryan, M.S.; Cooper, M.W.D.; Dennett, C.A.; Gofryk, K.; He, L.; Khafizov, M.; Lander, G.H.; Manley, M.E.; et al. Thermal Energy Transport in Oxide Nuclear Fuel. Chem. Rev. 2021, 122, 3711–3762. [Google Scholar] [CrossRef]
  7. Rondinella, V.V.; Wiss, T. The high burn-up structure in nuclear fuel. Mater. Today 2010, 13, 24–32. [Google Scholar] [CrossRef]
  8. Martin, D. A re-appraisal of the thermal conductivity of UO2 and mixed (U,Pu) oxide fuels. J. Nucl. Mater. 1982, 110, 73–94. [Google Scholar] [CrossRef]
  9. Minato, K.; Shiratori, T.; Serizawa, H.; Hayashi, K.; Une, K.; Nogita, K.; Hirai, M.; Amaya, M. Thermal conductivities of irradiated UO2 and (U,Gd)O2. J. Nucl. Mater. 2001, 288, 57–65. [Google Scholar] [CrossRef]
  10. Philipponneau, Y. Thermal conductivity of (U,Pu)O2−x mixed oxide fuel. J. Nucl. Mater. 1992, 188, 194–197. [Google Scholar] [CrossRef]
  11. Ronchi, C.; Sheindlin, M.; Staicu, D.; Kinoshita, M. Effect of burn-up on the thermal conductivity of uranium dioxide up to 100.000 MWdt−1. J. Nucl. Mater. 2004, 327, 58–76. [Google Scholar] [CrossRef]
  12. Gibby, R. The effect of plutonium content on the thermal conductivity of (U,Pu)O2 solid solutions. J. Nucl. Mater. 1971, 38, 163–177. [Google Scholar] [CrossRef]
  13. Amaya, M.; Hirai, M. Recovery behavior of thermal conductivity in irradiated UO2 pellets. J. Nucl. Mater. 1997, 247, 76–81. [Google Scholar] [CrossRef]
  14. Carbajo, J.J.; Yoder, G.L.; Popov, S.G.; Ivanov, V.K. A review of the thermophysical properties of MOX and UO2 fuels. J. Nucl. Mater. 2001, 299, 181–198. [Google Scholar] [CrossRef]
  15. Cozzo, C.; Staicu, D.; Somers, J.; Fernandez, A.; Konings, R. Thermal diffusivity and conductivity of thorium–plutonium mixed oxides. J. Nucl. Mater. 2011, 416, 135–141. [Google Scholar] [CrossRef]
  16. Wang, B.T.; Zheng, J.J.; Qu, X.; Li, W.D.; Zhang, P. Thermal conductivity of UO2 and PuO2 from first-principles. J. Alloys Compd. 2015, 628, 267–271. [Google Scholar] [CrossRef]
  17. Callaway, J. Model for Lattice Thermal Conductivity at Low Temperatures. Phys. Rev. 1959, 113, 1046–1051. [Google Scholar] [CrossRef]
  18. Zhang, Y. First-principles Debye–Callaway approach to lattice thermal conductivity. J. Mater. 2016, 2, 237–247. [Google Scholar] [CrossRef]
  19. Higuchi, S.i. A Molecular Dynamics Study of Thermal Conductivity of UO2 with Impurities. J. Nucl. Sci. Technol. 1998, 35, 833–835. [Google Scholar] [CrossRef]
  20. Kim, H.; Kim, M.H.; Kaviany, M. Lattice thermal conductivity of UO2 using ab-initio and classical molecular dynamics. J. Appl. Phys. 2014, 115, 123510. [Google Scholar] [CrossRef]
  21. Nichenko, S.; Staicu, D. Thermal conductivity of porous UO2: Molecular Dynamics study. J. Nucl. Mater. 2014, 454, 315–322. [Google Scholar] [CrossRef]
  22. Srivastava, G.P. Theory of Lattice Thermal Conductivity. In The Physics of Phonons; CRC Press: Boca Raton, FL, USA, 2022; pp. 115–120. [Google Scholar] [CrossRef]
  23. Fugallo, G.; Lazzeri, M.; Paulatto, L.; Mauri, F. Ab initio variational approach for evaluating lattice thermal conductivity. Phys. Rev. B 2013, 88, 045430. [Google Scholar] [CrossRef]
  24. Maradudin, A.A.; Fein, A.E. Scattering of Neutrons by an Anharmonic Crystal. Phys. Rev. 1962, 128, 2589–2608. [Google Scholar] [CrossRef]
  25. Tamura, S.i. Isotope scattering of dispersive phonons in Ge. Phys. Rev. B 1983, 27, 858–866. [Google Scholar] [CrossRef]
  26. Abeles, B. Lattice Thermal Conductivity of Disordered Semiconductor Alloys at High Temperatures. Phys. Rev. 1963, 131, 1906–1911. [Google Scholar] [CrossRef]
  27. Duriez, C.; Alessandri, J.P.; Gervais, T.; Philipponneau, Y. Thermal conductivity of hypostoichiometric low Pu content (U,Pu)O2−x mixed oxide. J. Nucl. Mater. 2000, 277, 143–158. [Google Scholar] [CrossRef]
  28. Klemens, P.G. The Scattering of Low-Frequency Lattice Waves by Static Imperfections. Proc. Phys. Soc. Sect. A 1955, 68, 1113–1128. [Google Scholar] [CrossRef]
  29. Gurunathan, R.; Hanus, R.; Dylla, M.; Katre, A.; Snyder, G.J. Analytical Models of Phonon–Point-Defect Scattering. Phys. Rev. Appl. 2020, 13, 034011. [Google Scholar] [CrossRef]
  30. Kohn, W.; Sham, L.J. Self-Consistent Equations Including Exchange and Correlation Effects. Phys. Rev. 1965, 140, A1133–A1138. [Google Scholar] [CrossRef]
  31. Blöchl, P.E. Projector augmented-wave method. Phys. Rev. B 1994, 50, 17953–17979. [Google Scholar] [CrossRef] [PubMed]
  32. Perdew, J.P.; Ruzsinszky, A.; Csonka, G.I.; Vydrov, O.A.; Scuseria, G.E.; Constantin, L.A.; Zhou, X.; Burke, K. Restoring the Density-Gradient Expansion for Exchange in Solids and Surfaces. Phys. Rev. Lett. 2008, 100, 136406. [Google Scholar] [CrossRef] [PubMed]
  33. Dudarev, S.L.; Botton, G.A.; Savrasov, S.Y.; Humphreys, C.J.; Sutton, A.P. Electron-energy-loss spectra and the structural stability of nickel oxide: An LSDA+U study. Phys. Rev. B 1998, 57, 1505–1509. [Google Scholar] [CrossRef]
  34. Pegg, J.T.; Aparicio-Anglès, X.; Storr, M.; de Leeuw, N.H. DFT+U study of the structures and properties of the actinide dioxides. J. Nucl. Mater. 2017, 492, 269–278. [Google Scholar] [CrossRef]
  35. Dudarev, S.L.; Liu, P.; Andersson, D.A.; Stanek, C.R.; Ozaki, T.; Franchini, C. Parametrization of LSDA+U for noncollinear magnetic configurations: Multipolar magnetism in UO2. Phys. Rev. Mater. 2019, 3, 083802. [Google Scholar] [CrossRef]
  36. Dorado, B.; Amadon, B.; Freyss, M.; Bertolus, M. DFT+U calculations of the ground state and metastable states of uranium dioxide. Phys. Rev. B 2009, 79, 235125. [Google Scholar] [CrossRef]
  37. Togo, A.; Tanaka, I. First principles phonon calculations in materials science. Scr. Mater. 2015, 108, 1–5. [Google Scholar] [CrossRef]
  38. Togo, A.; Chaput, L.; Tanaka, I. Distributions of phonon lifetimes in Brillouin zones. Phys. Rev. B 2015, 91, 094306. [Google Scholar] [CrossRef]
  39. Gonze, X. Perturbation expansion of variational principles at arbitrary order. Phys. Rev. A 1995, 52, 1086–1095. [Google Scholar] [CrossRef] [PubMed]
  40. Gonze, X.; Lee, C. Dynamical matrices, Born effective charges, dielectric permittivity tensors, and interatomic force constants from density-functional perturbation theory. Phys. Rev. B 1997, 55, 10355–10368. [Google Scholar] [CrossRef]
  41. Iwasawa, M.; Chen, Y.; Kaneta, Y.; Ohnuma, T.; Geng, H.Y.; Kinoshita, M. First-Principles Calculation of Point Defects in Uranium Dioxide. Mater. Trans. 2006, 47, 2651–2657. [Google Scholar] [CrossRef]
  42. Dolling, G.; Cowley, R.A.; Woods, A.D.B. The Crystal Dynamics of Uranium Dioxide. Can. J. Phys. 1965, 43, 1397–1413. [Google Scholar] [CrossRef]
  43. Pang, J.W.L.; Buyers, W.J.L.; Chernatynskiy, A.; Lumsden, M.D.; Larson, B.C.; Phillpot, S.R. Phonon Lifetime Investigation of Anharmonicity and Thermal Conductivity of UO2 by Neutron Scattering and Theory. Phys. Rev. Lett. 2013, 110, 157401. [Google Scholar] [CrossRef]
  44. Yun, Y.; Legut, D.; Oppeneer, P.M. Phonon spectrum, thermal expansion and heat capacity of UO2 from first-principles. J. Nucl. Mater. 2012, 426, 109–114. [Google Scholar] [CrossRef]
  45. Sanati, M.; Albers, R.C.; Lookman, T.; Saxena, A. Elastic constants, phonon density of states, and thermal properties of UO2. Phys. Rev. B 2011, 84, 014116. [Google Scholar] [CrossRef]
  46. Torres, E.; CheikNjifon, I.; Kaloni, T.; Pencer, J. A comparative analysis of the phonon properties in UO2 using the Boltzmann transport equation coupled with DFT+U and empirical potentials. Comput. Mater. Sci. 2020, 177, 109594. [Google Scholar] [CrossRef]
  47. Wang, B.T.; Zhang, P.; Lizárraga, R.; Di Marco, I.; Eriksson, O. Phonon spectrum, thermodynamic properties, and pressure-temperature phase diagram of uranium dioxide. Phys. Rev. B 2013, 88, 104107. [Google Scholar] [CrossRef]
  48. Ronchi, C.; Sheindlin, M.; Musella, M.; Hyland, G.J. Thermal conductivity of uranium dioxide up to 2900 K from simultaneous measurement of the heat capacity and thermal diffusivity. J. Appl. Phys. 1999, 85, 776–789. [Google Scholar] [CrossRef]
  49. Fink, J.; Chasanov, M.; Leibowitz, L. Thermophysical properties of uranium dioxide. J. Nucl. Mater. 1981, 102, 17–25. [Google Scholar] [CrossRef]
  50. Islam, M. DFT and DFT+U Insights into the Physical Properties of UO2. J. Sci. Res. 2023, 15, 739–757. [Google Scholar] [CrossRef]
  51. Zhou, S.; Xiao, E.; Ma, H.; Gofryk, K.; Jiang, C.; Manley, M.E.; Hurley, D.H.; Marianetti, C.A. Phonon Thermal Transport in UO2 via Self-Consistent Perturbation Theory. Phys. Rev. Lett. 2024, 132, 106502. [Google Scholar] [CrossRef]
  52. Mei, Z.G.; Stan, M.; Yang, J. First-principles study of thermophysical properties of uranium dioxide. J. Alloys Compd. 2014, 603, 282–286. [Google Scholar] [CrossRef]
  53. Perriot, R.; Liu, X.Y.; Stanek, C.; Andersson, D. Diffusion of Zr, Ru, Ce, Y, La, Sr and Ba fission products in UO2. J. Nucl. Mater. 2015, 459, 90–96. [Google Scholar] [CrossRef]
  54. Geiger, E.; Bès, R.; Martin, P.; Pontillon, Y.; Solari, P.L.; Salome, M. Fission products behaviour in UO2 submitted to nuclear severe accident conditions. J. Phys. Conf. Ser. 2016, 712, 012098. [Google Scholar] [CrossRef]
  55. Murabayashi, M. Thermal Conductivity of Ceramic Solid Solutions. J. Nucl. Sci. Technol. 1970, 7, 559–563. [Google Scholar] [CrossRef]
  56. Oettingen, M.; Cetnar, J. Comparative analysis between measured and calculated concentrations of major actinides using destructive assay data from Ohi-2 PWR. Nukleonika 2015, 60, 571–580. [Google Scholar] [CrossRef]
  57. Ishimoto, S.; Hirai, M.; Ito, K.; Korei, Y. Effects of Soluble Fission Products on Thermal Conductivities of Nuclear Fuel Pellets. J. Nucl. Sci. Technol. 1994, 31, 796–802. [Google Scholar] [CrossRef]
  58. Chen, W.; Bai, X.M. Unified Effect of Dispersed Xe on the Thermal Conductivity of UO2 Predicted by Three Interatomic Potentials. JOM 2020, 72, 1710–1718. [Google Scholar] [CrossRef]
  59. Yun, Y.; Oppeneer, P.M. First-principles design of next-generation nuclear fuels. MRS Bull. 2011, 36, 178–184. [Google Scholar] [CrossRef]
  60. Dorado, B.; Freyss, M.; Amadon, B.; Bertolus, M.; Jomard, G.; Garcia, P. Advances in first-principles modelling of point defects in UO2: f electron correlations and the issue of local energy minima. J. Phys. Condens. Matter 2013, 25, 333201. [Google Scholar] [CrossRef] [PubMed]
  61. Kaloni, T.; Onder, N.; Pencer, J.; Torres, E. DFT+U approach on the electronic and thermal properties of hypostoichiometric UO2. Ann. Nucl. Energy 2020, 144, 107511. [Google Scholar] [CrossRef]
Figure 1. The 3k antiferromagnetic (AFM) ordering in the conventional unit cell of UO2, where the fractional coordinates of the U atoms are (0, 0, 0), (0, 0.5, 0.5), (0.5, 0, 0.5), and (0.5, 0.5, 0), with the corresponding magnetic moments being (1, 1, 1), (−1, −1, 1), (−1, 1, −1), and (1, −1, −1) in units of μ B .
Materials 18 03584 g001
Figure 2. (a) The lattice constant of UO2 with the U parameter; (b) the band structure and electronic density of states of UO2 at U = 3.60 eV and J = 0.0 eV.
Materials 18 03584 g002
Figure 3. The phonon spectrum and density of states of UO2. The hollow circles represent the measured values from inelastic neutron scattering, and the solid lines represent the simulated DFT+U calculation results. The fractional coordinates of the high-symmetry points in the Brillouin zone are Γ (0 0 0), X (0.5 0 0.5), W (0.5 0.25 0.75), and L (0.5 0.5 0.5).
Materials 18 03584 g003
Figure 4. Phonon spectra, density of states, and Grüneisen parameters of UO2 at different volumes: (a) a = 5.50 Å, (b) a = 5.540 Å, (c) Grüneisen parameters along high-symmetry points in the Brillouin zone.
Materials 18 03584 g004
Figure 5. Calculated phonon thermal conductivity of UO2 using the DFT+U+SOC method (filled circle), compared with experimental measurements and theoretical predictions from literature. The comparison includes: square for Ronchi et al. [48], rightward triangle for Fink et al. [49], filled hexagon for Islam et al. [50], upward triangle for Zhou et al. [51], leftward triangle for Mei et al. [52], and diamonds for Wang et al. [16].
Materials 18 03584 g005
Figure 6. (a) Cumulative thermal conductivity of UO2 at different temperatures; (b) the thermal conductivity of UO2 with respect to phonon frequency.
Materials 18 03584 g006
Figure 7. Three-phonon scattering strength in single-crystal UO2 at different temperatures: (a) 200 K (b) 1000 K, (c) 1800 K.
Materials 18 03584 g007
Figure 8. Scattering parameter η of metal ions/atoms with different mass and radii under each concentration.
Materials 18 03584 g008
Figure 9. Concentration-dependent thermal conductivity of UO2 with fission product metal ions.
Materials 18 03584 g009
Figure 10. The scattering strength of metal ions on phonons at different concentrations: (a) 1/4 Cfpm, (c) Cfpm; the effect of scattering on thermal conductivity at different concentrations: (b) 1/4 Cfpm, (d) Cfpm.
Materials 18 03584 g010aMaterials 18 03584 g010b
Figure 11. The effect of Xe concentration on thermal conductivity: (a) Xe substitutes only U, and (b) Xe simultaneously substitutes 90% U and 10% O.
Materials 18 03584 g011
Figure 12. 2.0 at% Xe in UO2: (a) Frequency-dependent phonon scattering strength when Xe substitutes U sites only; (b) Effect on thermal conductivity from U-site substitution; (c) Scattering strength when Xe substitutes both U and O sites; (d) Effect on thermal conductivity from U+O site substitution.
Materials 18 03584 g012
Figure 13. Thermal conductivity decrease in UO2 with different vacancy concentrations: (a) only uranium vacancies, (b) only oxygen vacancies, (c) Simultaneously containing uranium, and oxygen vacancies.
Materials 18 03584 g013
Figure 14. Frequency-dependent phonon scattering strength of 2.0 at% vacancies in UO2: (a) U vacancies only, (c) O vacancies only, (e) U and O vacancies; Effect on thermal conductivity from 2.0 at% vacancies in UO2: (b) U vacancies only, (d) O vacancies only, (f) U and O vacancies.
Materials 18 03584 g014aMaterials 18 03584 g014b
Table 1. Content, oxidation states, and ionic radii of fission elements in SIMFUEL samples of 76 GWd/tU burnup [54].
Fission ElementBaCeCsLaMoSrYZrRhPdRuNd
Content (at%)0.260.610.350.200.610.130.060.600.030.420.640.91
Oxidation State2+4+1+3+4+2+3+4+0003+
Ionic Radius (Å)1.420.971.691.160.651.261.020.841.421.391.461.12
Table 2. Experimentally different concentrations of doping fission product element in simulated burnup UO2 samples [57].
ElementConcentrations (at%)
Sample1 Sample2 Sample3
Sr0.2320.3620.466
Y0.1180.1860.242
Zr0.8731.5362.150
La0.1930.3670.536
Ce0.6311.1511.656
Nd0.6301.2701.903
Disclaimer/Publisher’s Note: The statements, opinions and data contained in all publications are solely those of the individual author(s) and contributor(s) and not of MDPI and/or the editor(s). MDPI and/or the editor(s) disclaim responsibility for any injury to people or property resulting from any ideas, methods, instructions or products referred to in the content.

