3.1. Clinical Assessment of the Hemostatic Process
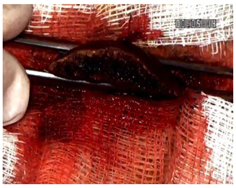
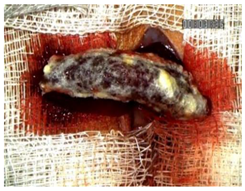
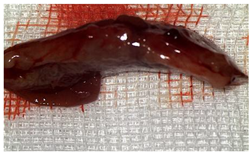
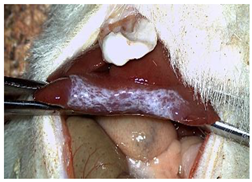
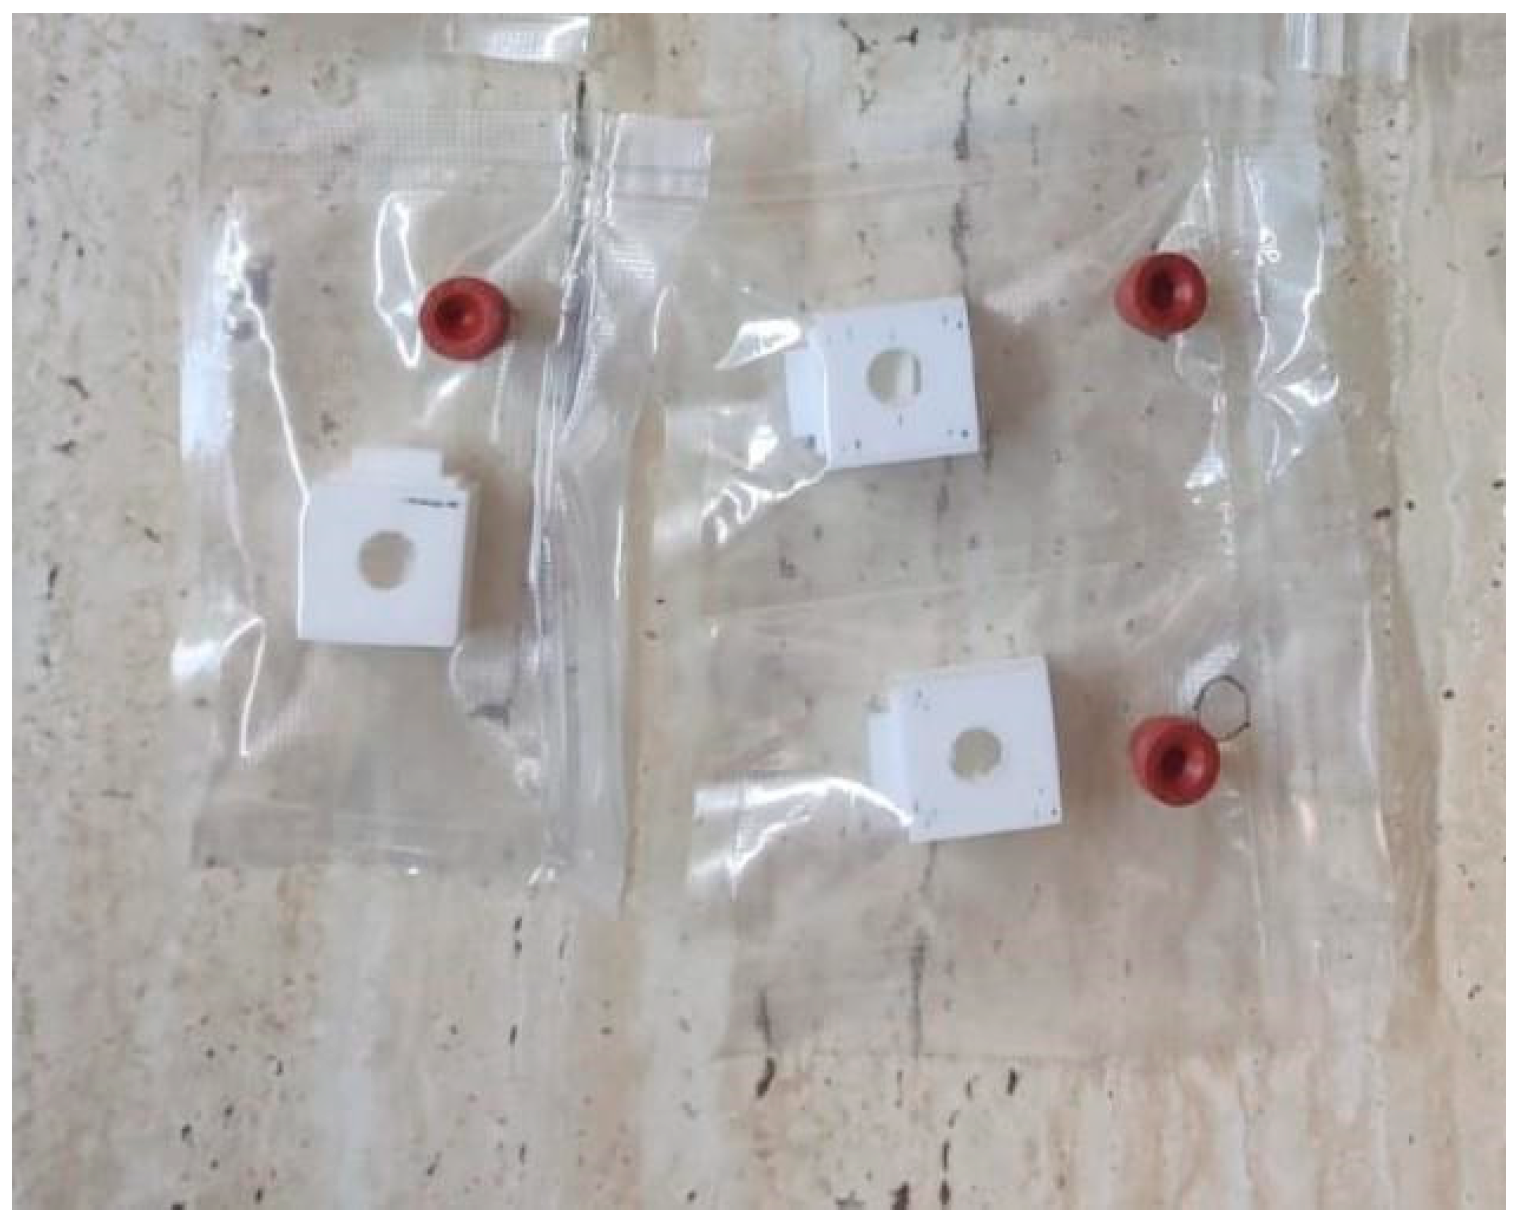
The CA + PLA patch proved effective in achieving rapid hemostasis. Upon contact with the bleeding liver, it quickly polymerized and adhered, forming a hardened, shell-like barrier that immediately stopped blood flow. Observations at PO day 50 showed that the patch remained intact on the resection plane, alongside mild to moderate abdominal adhesions. By PO day 100, while the omentum largely covered the resection site, approximately 40% of the patch had degraded. By PO day 150, peritoneal adhesions were more significant (including stomach and small bowel involvement in two instances), yet the patch itself had undergone substantial degradation, with over 80% of its original size resorbed.
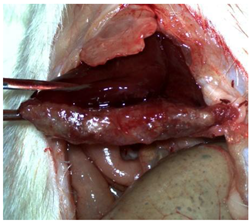
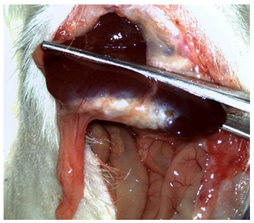
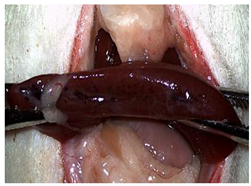
For the C group, the liver resection site showed minimal scarring and adhesions, consisting mainly of omental strips attached to the resected surface.
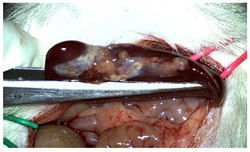
The subjects in the T group macroscopically displayed the fibrinogen/thrombin patch present at the resection plane at all time intervals. The patch appeared to thin over time, indicating its bioresorbable nature. Notably, this group developed the fewest peritoneal adhesions.
Table 2 illustrates the appearance of the hepatic resection plane for each study group at hemostasis and on postoperative days 50, 100, and 150.
3.2. Histopathological Assessment of the Hemostatic Agents
At sacrifice, 33 rats were evaluable—14 from the Study group (42%), 14 from the TachoSil
® group (42%), and 5 from the Control group (15%)—mirroring the original randomization ratio. On PO day 50, 5/14 Study animals and 5/14 TachoSil
® animals (35.7% each) were examined; on PO day 100, 2/14 (14.3%) animals from each active arm were examined; on PO day 150, 7/14 (50.0%) animals from each active arm plus all 5 controls were examined. The four-degrees-of-freedom χ
2 test returned χ
2 = 4.34 and
p = 0.362, indicating the that temporal pattern of when the necropsies were performed did not differ across the groups (
Table 3).
The median composite score was 2 [IQR 1–2] for the Control group, 2 [1–2] for the Study group, and 1 [1–2] for the TachoSil
® group. Grade 2 inflammation affected 5/14 (35.7%) of the Study group versus 4/14 (28.6%) of the TachoSil
® and 3/5 (60.0%) of the Control groups, whereas grade 3 changes were uncommon—3/14 (21.4%) in the Study group, 1/14 (7.1%) in the TachoSil
® group, and 0 controls. The Kruskal–Wallis statistic remained non-significant (H = 1.51,
p = 0.470) and the adjusted odds ratio for the Study versus TachoSil
® group in the CLMM was 1.32 (95% CI: 0.68–2.55;
p = 0.40). Thus, although numerically higher grades clustered in the CA + PLA arm, the overlap in score distributions plus the wide confidence intervals argue that overall, the amount of inflammation was comparable among the strategies (
Table 4).
A score of 3 for neutrophilia appeared in 4/14 of the Study rats (28.6%) but in 0/14 of the TachoSil
® rats and 0/5 of the controls. Scores of 1–2 were absent across the board, making the distribution sharply bimodal. The global test barely reached nominal significance (H = 5.99,
p = 0.050). After continuity-corrected logistic conversion (score 3 vs. <3) and PO day covariate adjustment, the CA + PLA patch yielded an odds ratio of 5.8 (1.03–32.6,
p = 0.048) versus TachoSil
®. The median scores emphasize the same picture (Study: 0 [0–2.2]; TachoSil
®: 0 [0–0]; Control: 0 [0–0]). All the subjects in the Control group reached POD 150 (
Table 5).
The median lymphocyte grades rose from 1 [1–1.8] with TachoSil
® to 2 [1–2] with the CA + PLA patch, while the controls sat at 1 [1–2]. High-grade (score of 3) lymphocytosis was observed in 3/14 (21.4%) of the Study animals, 2/14 (14.3%) of the TachoSil
® group, and 0/5 of the controls. The global Kruskal–Wallis test result remained non-significant (H = 2.47,
p = 0.291). However, the within-TachoSil
® Spearman analysis demonstrated a strong inverse time trend: ρ = −0.76,
p = 0.002, i.e., the lymphocyte burden decreased by half between PO day 50 and PO day 150. No such modulation occurred in the CA + PLA cohort (ρ = +0.06,
p = 0.83), as presented in
Table 6.
The control cautery scars were dominated by histiocytes: 4/5 (80.0%) scored 3 and 1/5 (20.0%) scored 2, yielding a median of 3 [3–3]. The tissues in the Study group had intermediate scores—7/14 (50%) scored 2 and 5/14 (35.7%) scored 3, resulting in a median of 2 [2–3]. The TachoSil® group showed the lowest burden: 12/14 (85.7%) had a score of 1 and a single rat (7.1%) scored a 2 (median: 1 [1–1]). The global statistic was H = 14.93 (
p < 0.001); the pairwise Bonferroni analysis revealed the Study group’s scores were greater than those of the TachoSil® group (
p < 0.001) and the Control group’s scores were greater than those of the TachoSil
® group (
p < 0.001). Quantitatively, the CA + PLA patch doubled the probability of encountering ≥ grade 2 histiocytosis compared with TachoSil
® (risk ratio 2.06), as shown in
Table 7.
High-grade fusion (scores of 2–3) was observed in 9/14 (64.3%) of the CA + PLA implants versus 1/14 (7.1%) of the TachoSil® and 0/5 of the cautery animals. When calculated as n (%), is the percentages were 64%, 7%, and 0%. The medians were 2 [1–2.8] for the Study group, 0 [0–1] for the TachoSil® group, and 1 [1–1] for the Control group. The Kruskal–Wallis test produced an H of 16.04 (
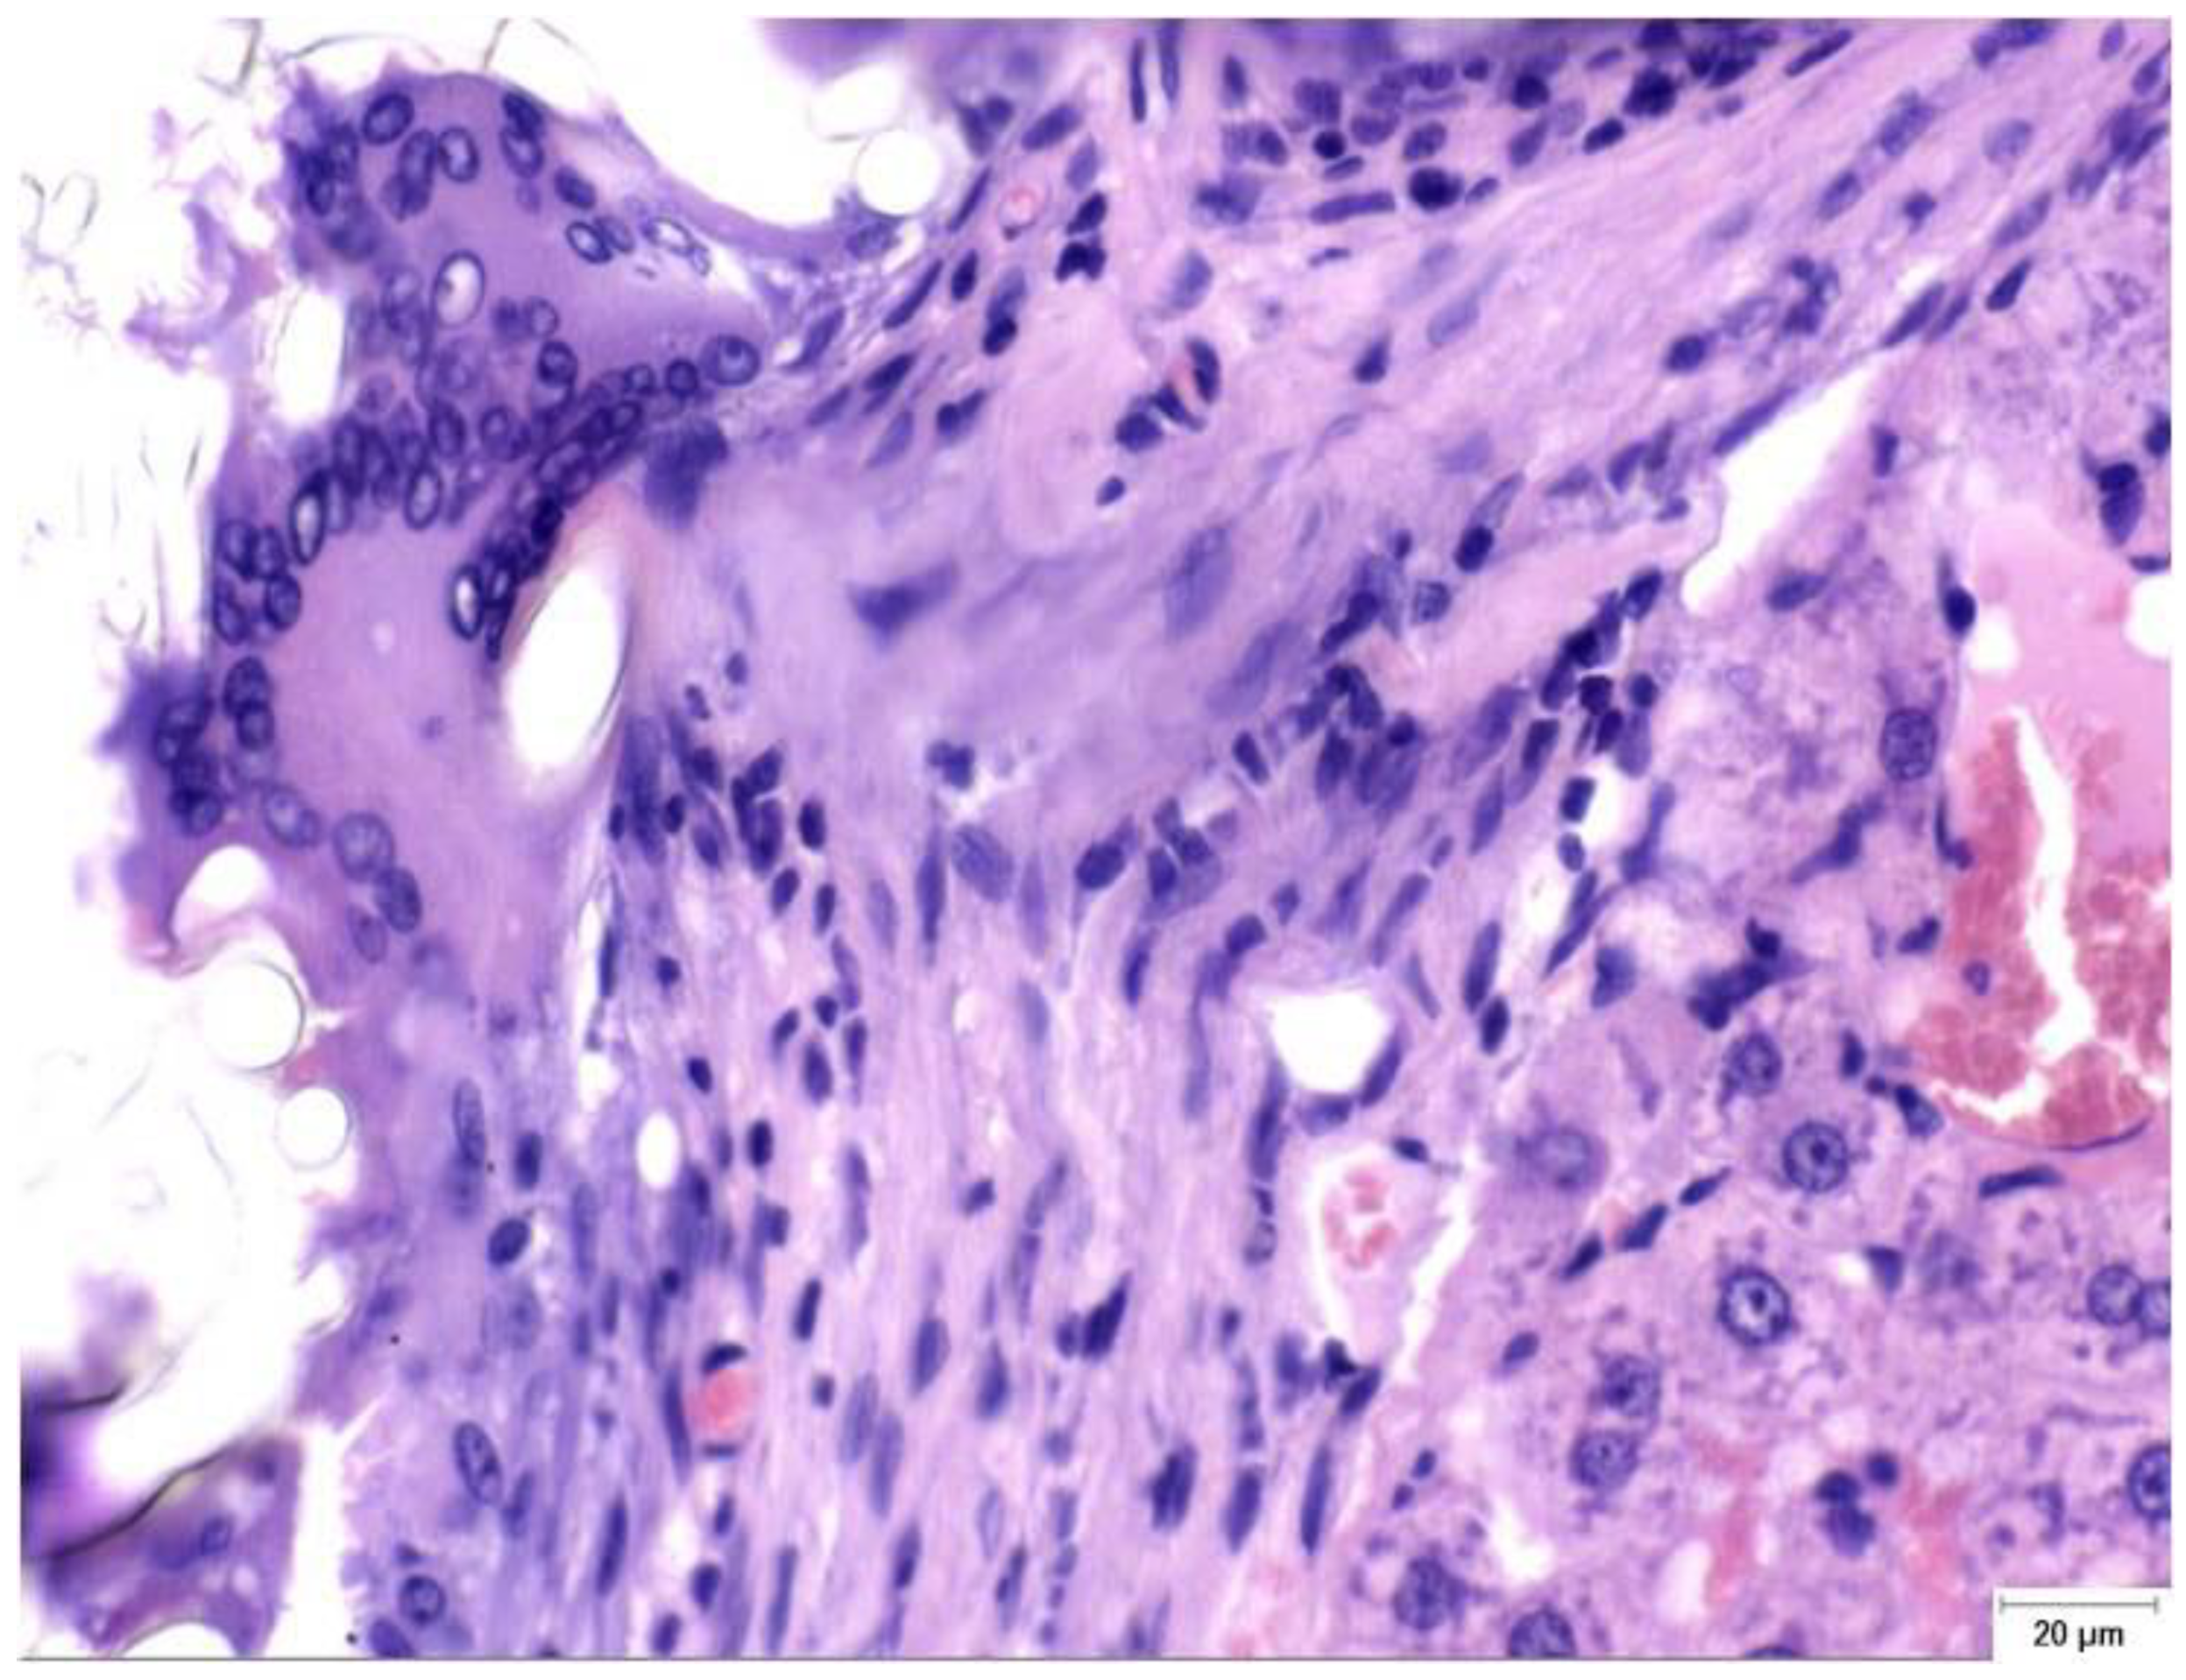
p < 0.001); the CLMM gave an aOR of 9.7 (3.0–31.2, p < 0.001) for the Study vs. TachoSil® group comparison. This means that out of every 100 patients, ∼64 could develop pronounced FBGC layers with the PLA patch versus < 10 with the fibrin sealant (
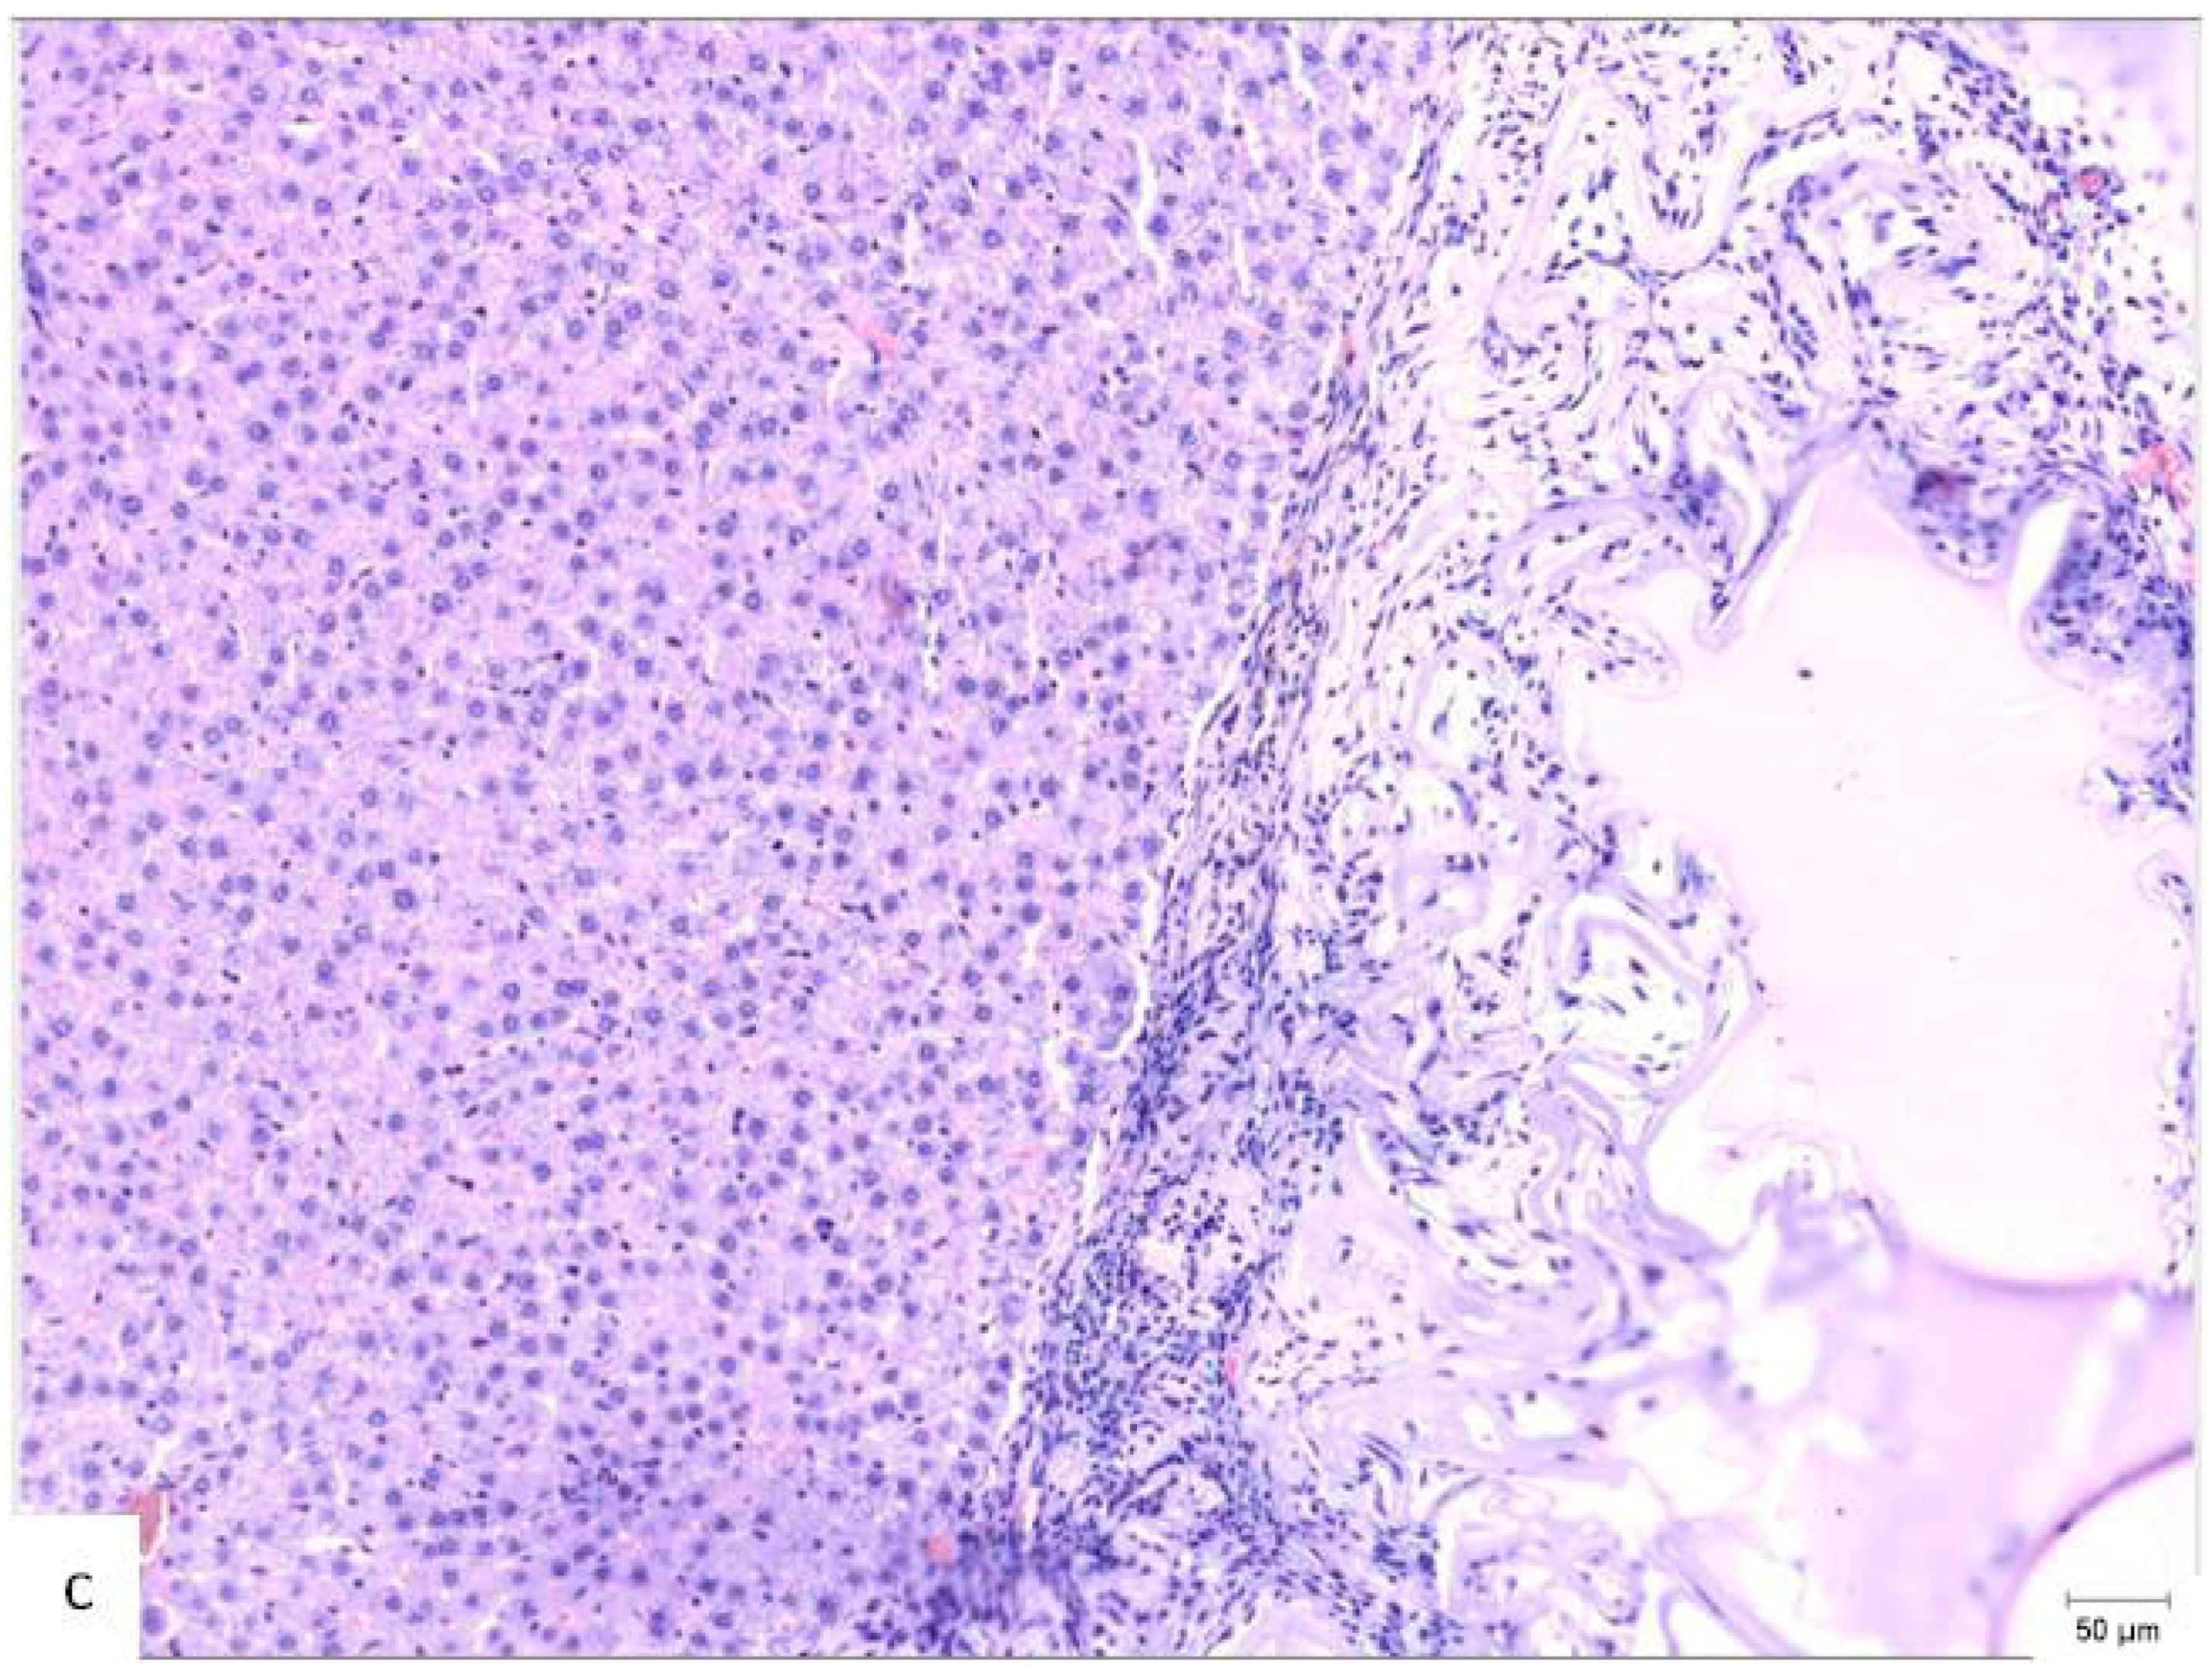
Table 8). Granulomatous foreign body reactions could be observed in the perihepatic tissue of the S group at PO day 150 (
Figure 2).
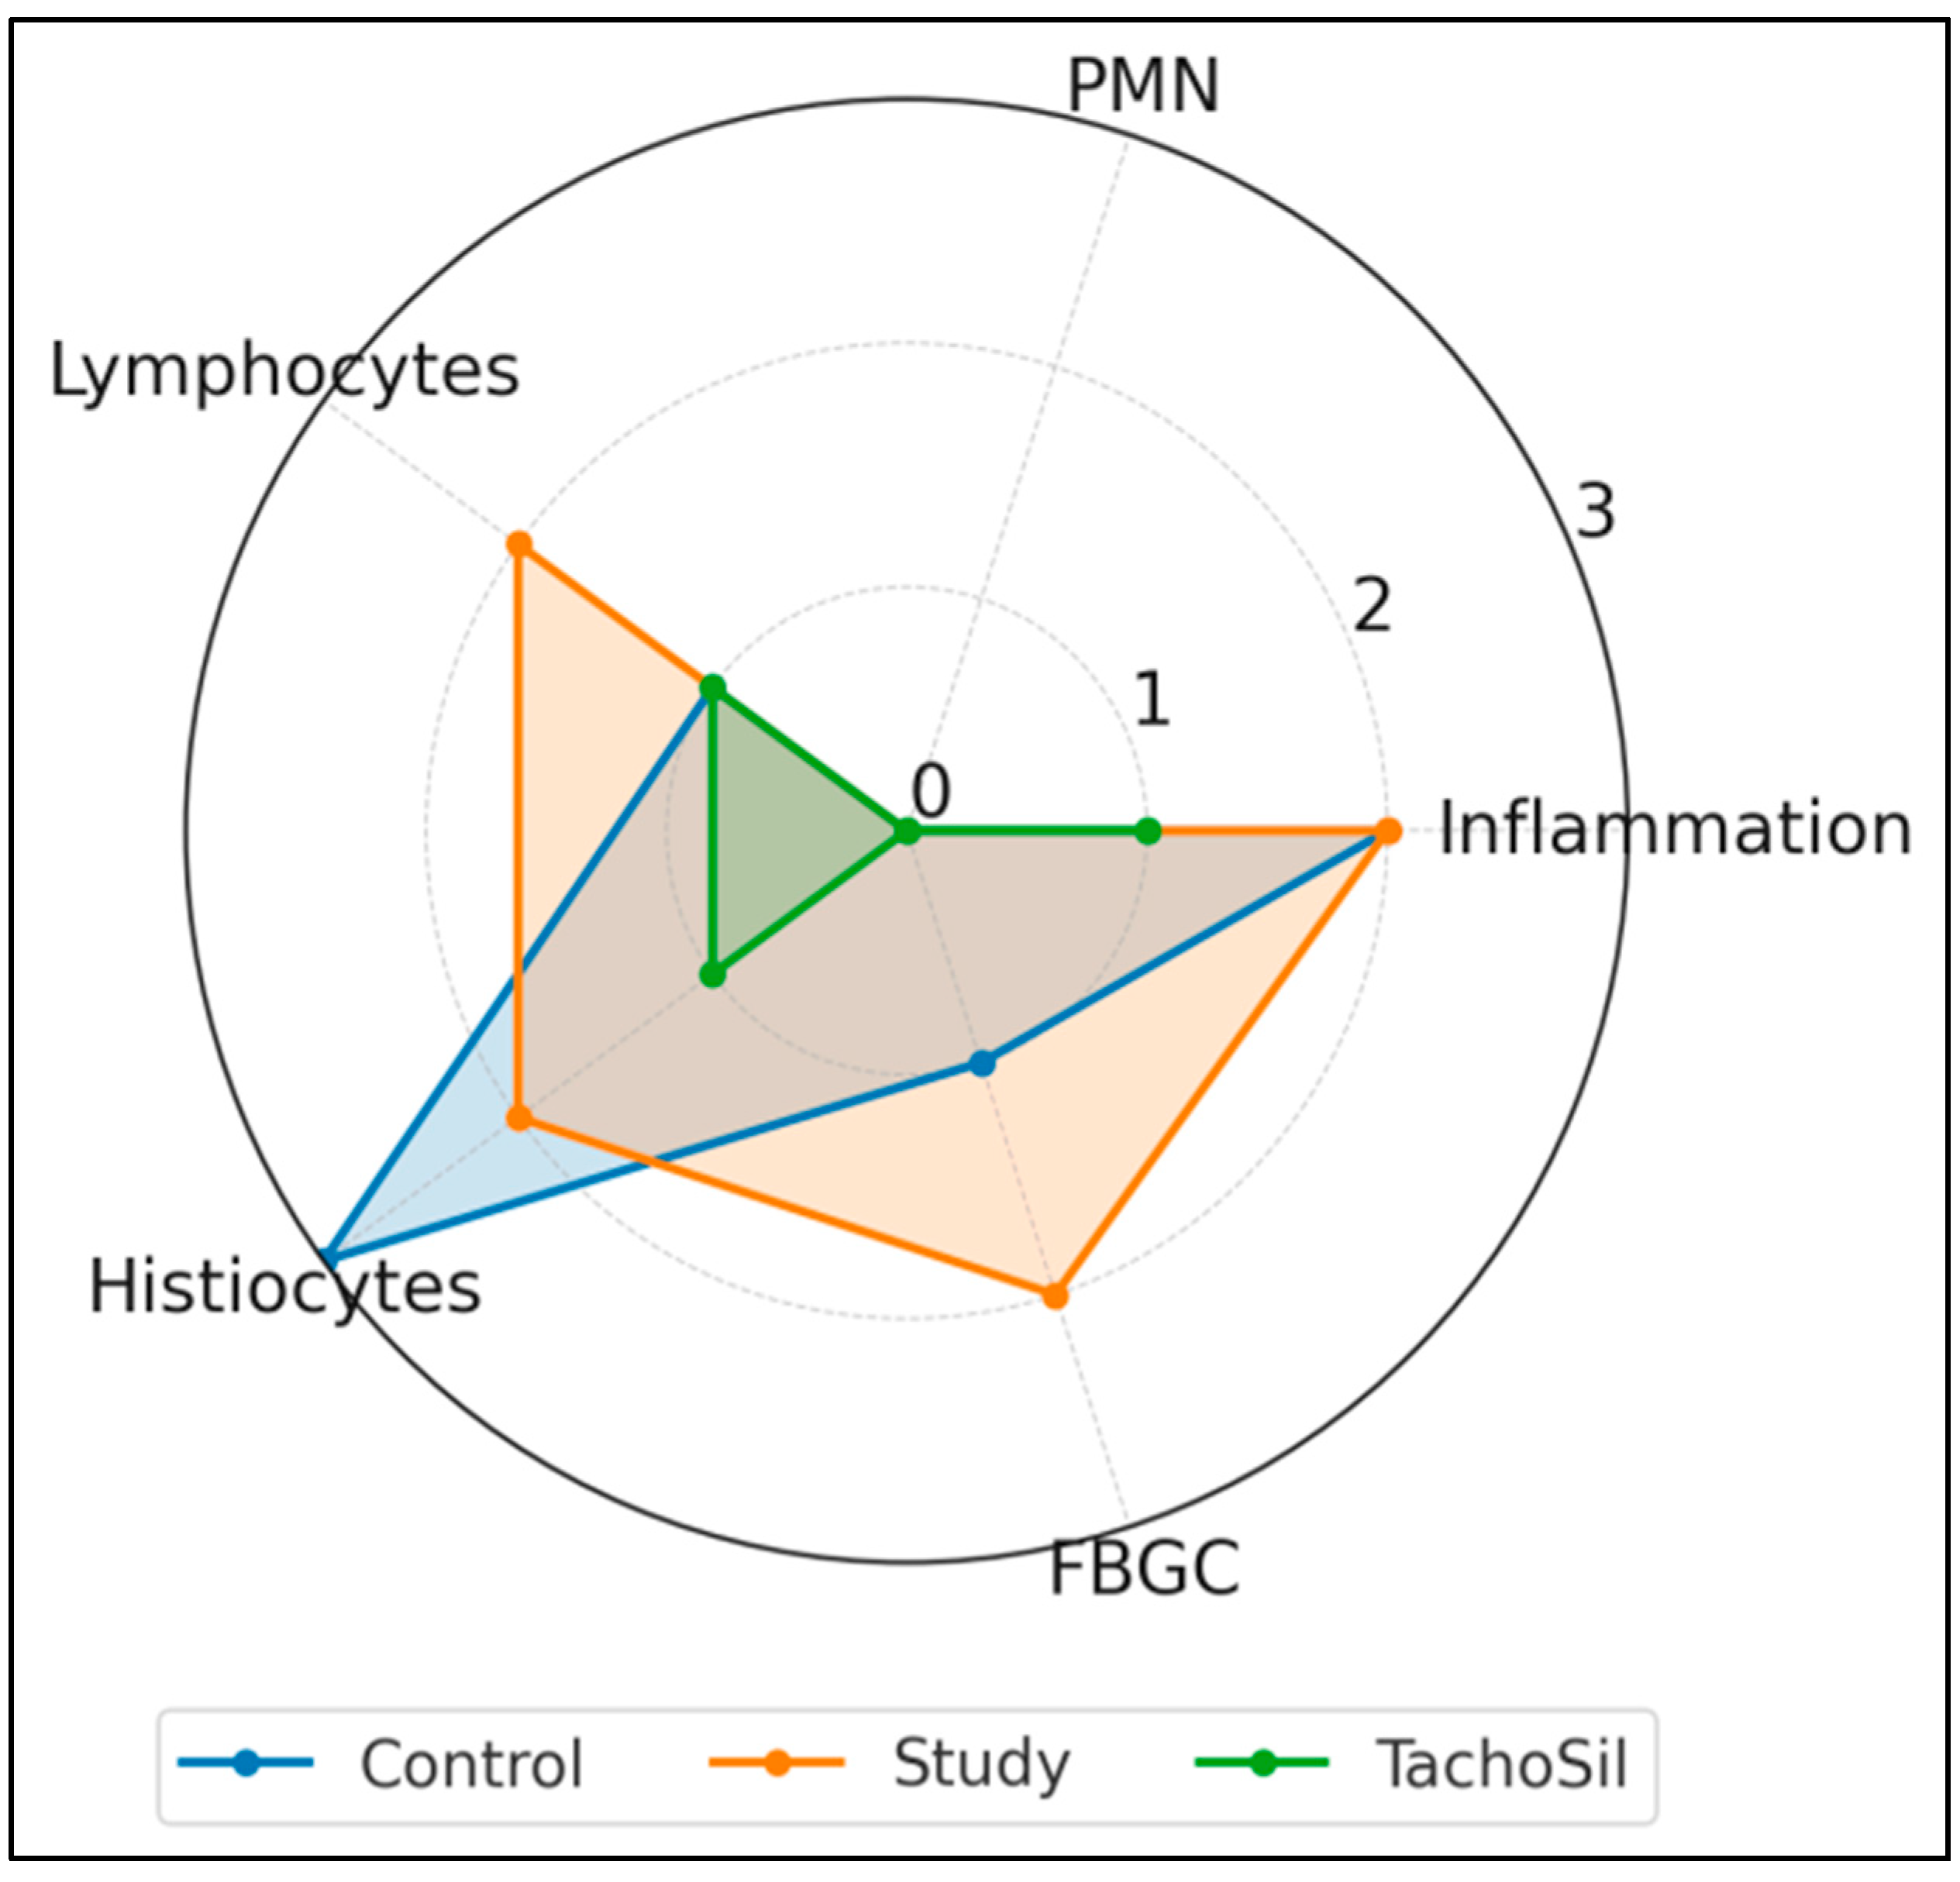
Figure 3 summarizes the median scores (0–3) for the five histologic parameters. All the groups showed similar overall levels of inflammation (a median of 2 for the Control/Study groups, and 1 for the TachoSil
® group) and negligible neutrophil counts (0 in Control/ TachoSil
® groups and a score of 3 in 4/14 subjects from the Study group). Lymphocyte infiltration was highest in the CA + PLA patch group (median: 2) versus the Control/TachoSil
® groups (1). Histiocytic infiltration was highest in the Control group (3), intermediate in the Study (2) group, and low in the TachoSil
® group (1). Finally, FBGC formation was pronounced in the Study group (2), modest in the Control group (1), and absent in the TachoSil
® group (0).
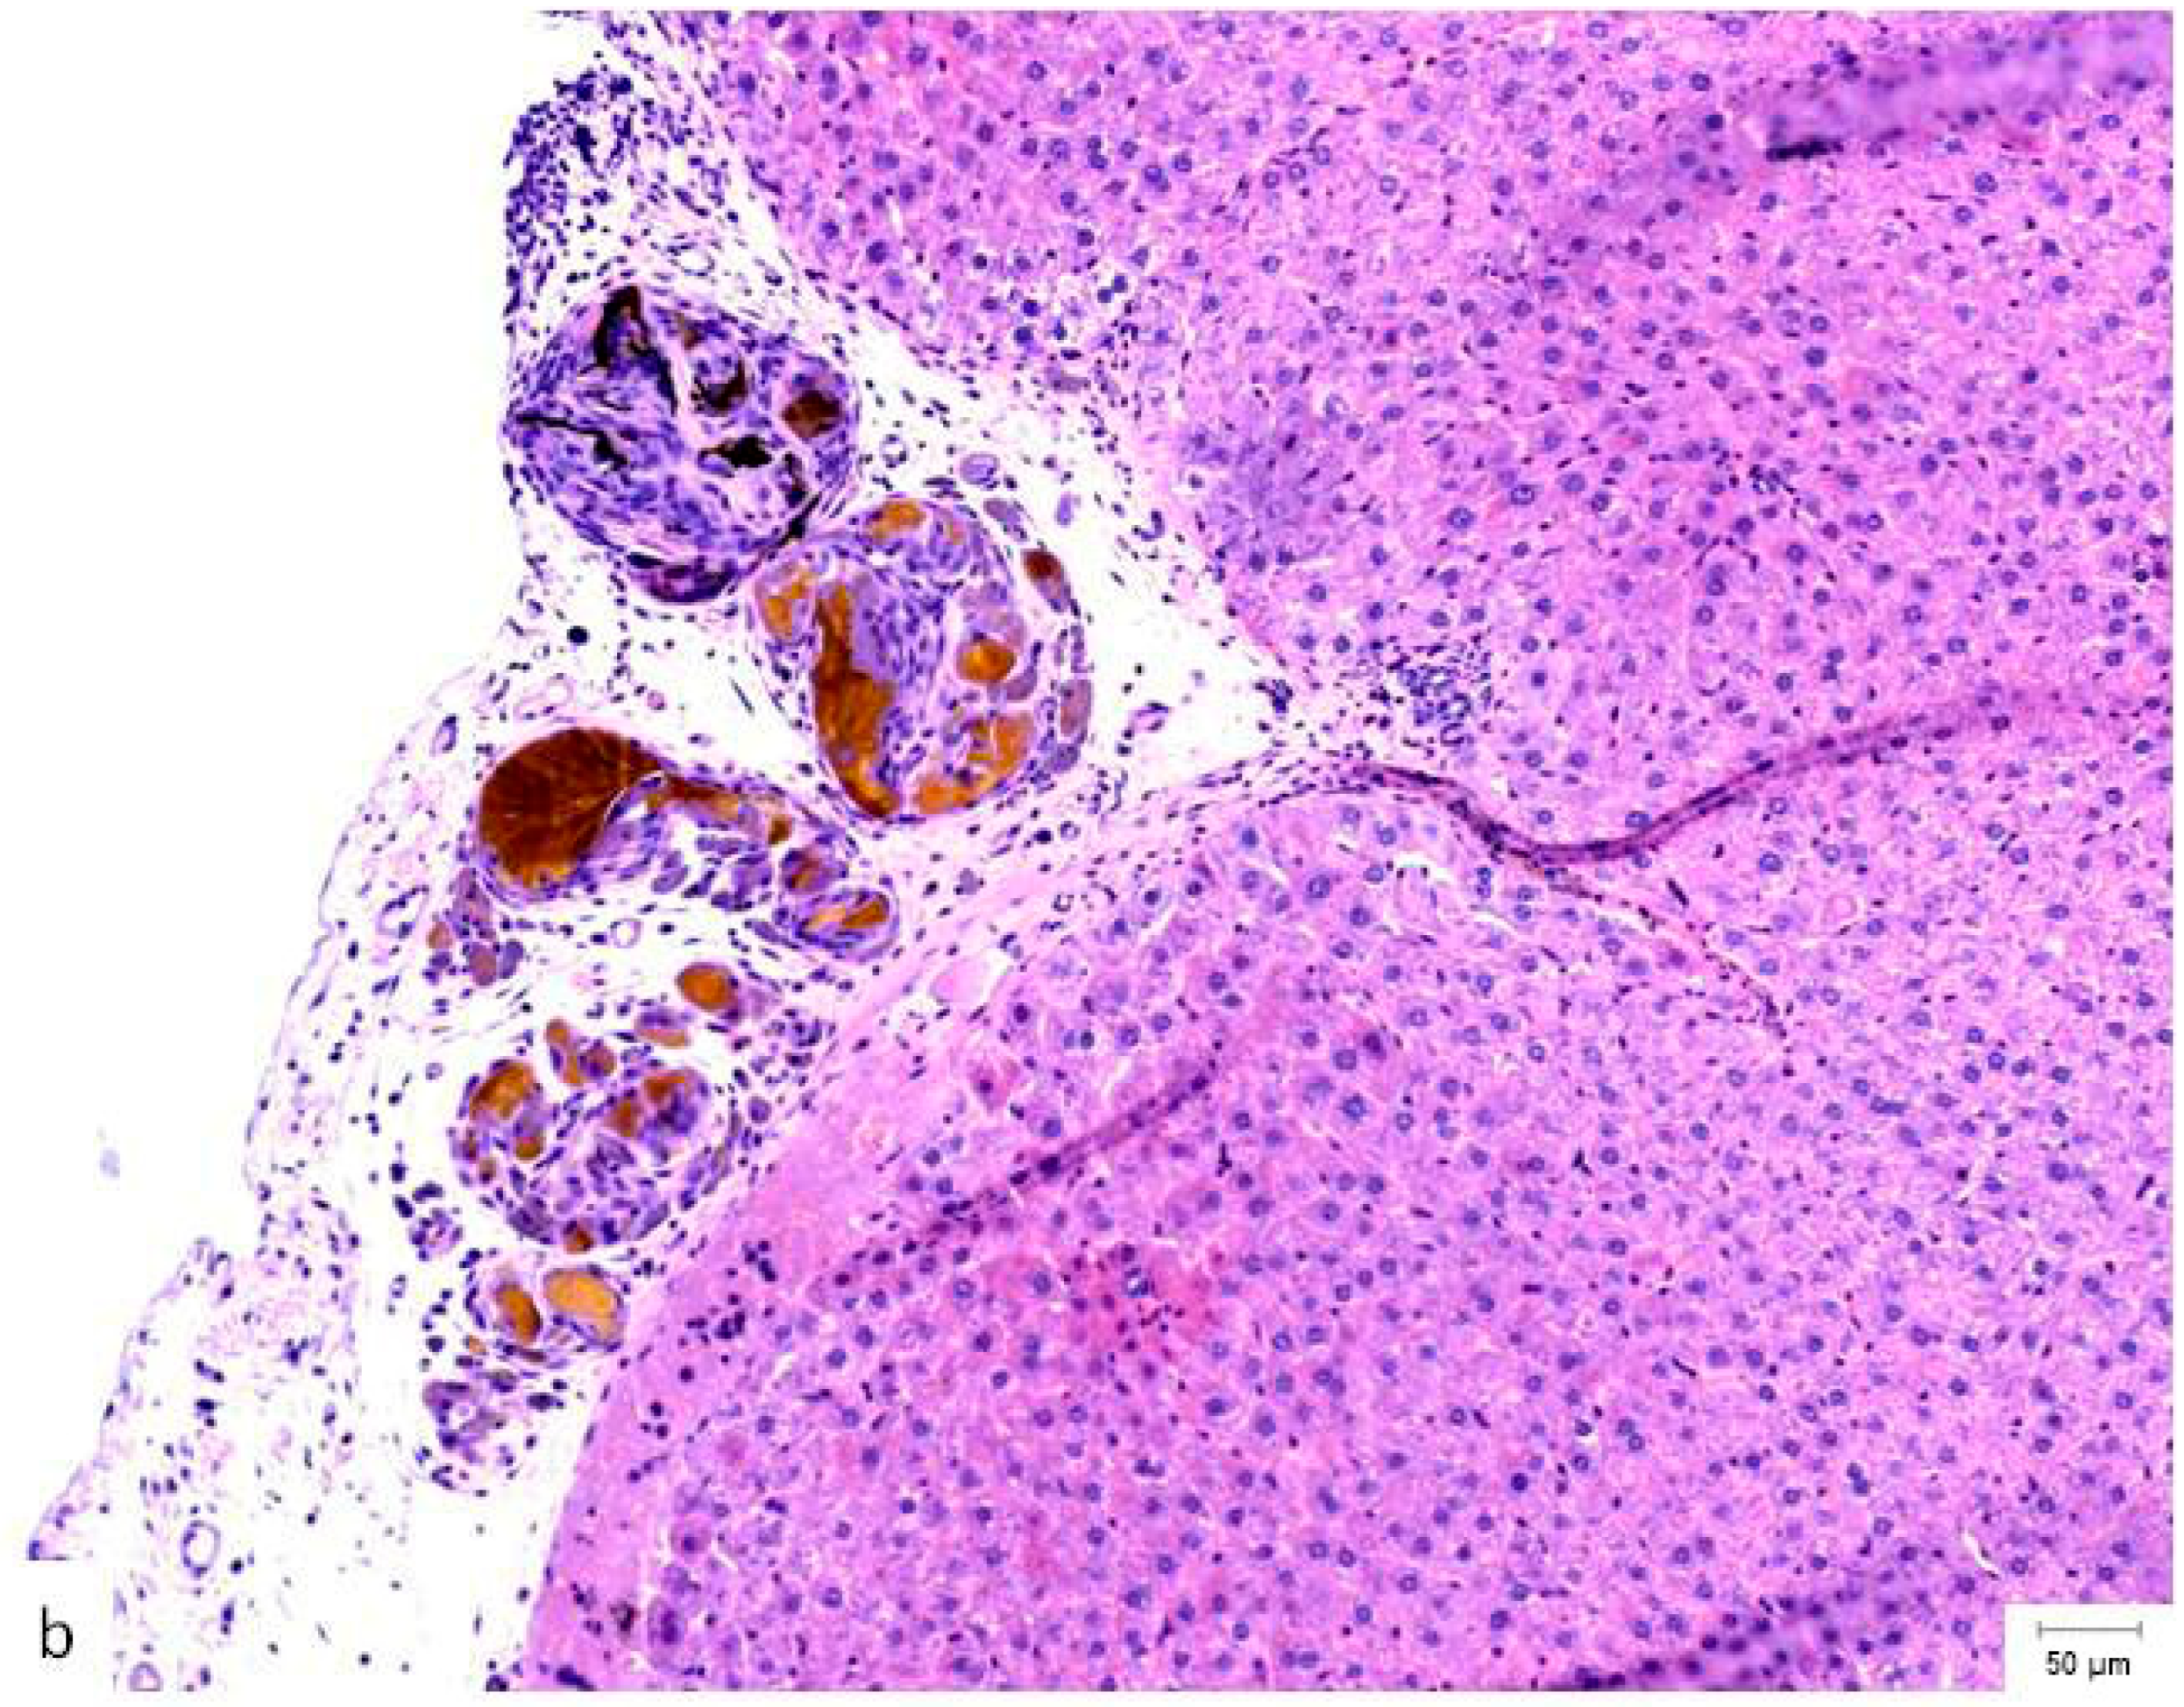
A comparison of the histopathological findings in the hepatic tissues of the three experimental groups on PO day 50 can be seen in
Figure 4.
Collagen encapsulated 11/14 of the CA + PLA patches (78.6%) but 0/14 of the TachoSil
® patches and 0/5 of the controls, yielding an infinite χ
2 odds ratio (continuity corrected OR = 94.5, CI 8.1–∞,
p < 0.001). Conversely, mature thick-walled vessels appeared in 7/14 of the (50.0%) TachoSil
® livers versus 2/14 (14.3%) of the CA + PLA and 0/5 of the control livers (χ
2 6.71,
p = 0.035). Put plainly, fibrin treatment quintupled the odds of vascular maturation (OR 5.1, CI 1.1–23.9) while the CA + PLA patch multiplied the odds of pathologic scarring by > 90-fold. The 95% CI lower bound of 8.1 still indicates a very large effect. Together, the quantitative results—79% of patches encapsulated with collagen without vascular maturity in the CA + PLA group vs. 0% with collagen and 50% with vascular maturity in the TachoSil
® group—reveals diametrically opposed healing trajectories (
Table 9).
Late abscesses complicated 4/14 of the CA + PLA rats (28.6%) but 0/14 of the TachoSil® rats and 0/5 of the controls. The Fisher–Freeman–Halton exact test returned a p value of 0.046; the continuity-corrected OR for Study vs. TachoSil® was 23.3 (1.1–501). The absolute risk difference is 28.6% (CI 7.1–50.1%), corresponding to roughly one additional abscess for every four CA + PLA patches. The median PMN score in abscess-positive CA + PLA rats was 3, whereas it was 0 in abscess-free CA + PLA rats (p = 0.02), numerically linking the two endpoints. No necrosis or liver failure was observed.
The CA + PLA (red circles) parameters clustered far from those of the TachoSil
® and Control groups on PC1, which were driven by fibrosis and FBGC load. The TachoSil
® (orange squares) parameters occupied the opposite quadrant (low composite pathology). The Control parameters (blue triangles) sit in the middle of the plot, reflecting macrophage-dominant scarring. The variance (%) captured on the figure axis shows that PC1 alone captured the most material-specific biology parameters (
Figure 5).


 ,
, 


