Author Contributions
Conceptualization, H.W., W.B., Z.T. and W.Z.; Methodology, Z.C., D.C., H.C., Y.F., X.S., W.H., H.W., W.B., Z.T., X.L. and W.Z.; Validation, Z.C., D.C., X.S., C.F. and X.L.; Formal analysis, X.L.; Investigation, Z.C., D.C. and Y.F.; Resources, W.H.; Data curation, C.F.; Writing—original draft, Z.C.; Writing—review & editing, D.C., H.C., Y.F., X.S., W.H., C.F. and Z.T.; Visualization, H.C., W.B. and Z.T.; Project administration, Z.C. and W.Z. All authors have read and agreed to the published version of the manuscript.
Figure 1.
Road data comprehensive inspection vehicle.
Figure 1.
Road data comprehensive inspection vehicle.
Figure 2.
3D radar map characteristics of structural cracks.
Figure 2.
3D radar map characteristics of structural cracks.
Figure 3.
Verification of crack detection results of ground penetrating radar based on core samples.
Figure 3.
Verification of crack detection results of ground penetrating radar based on core samples.
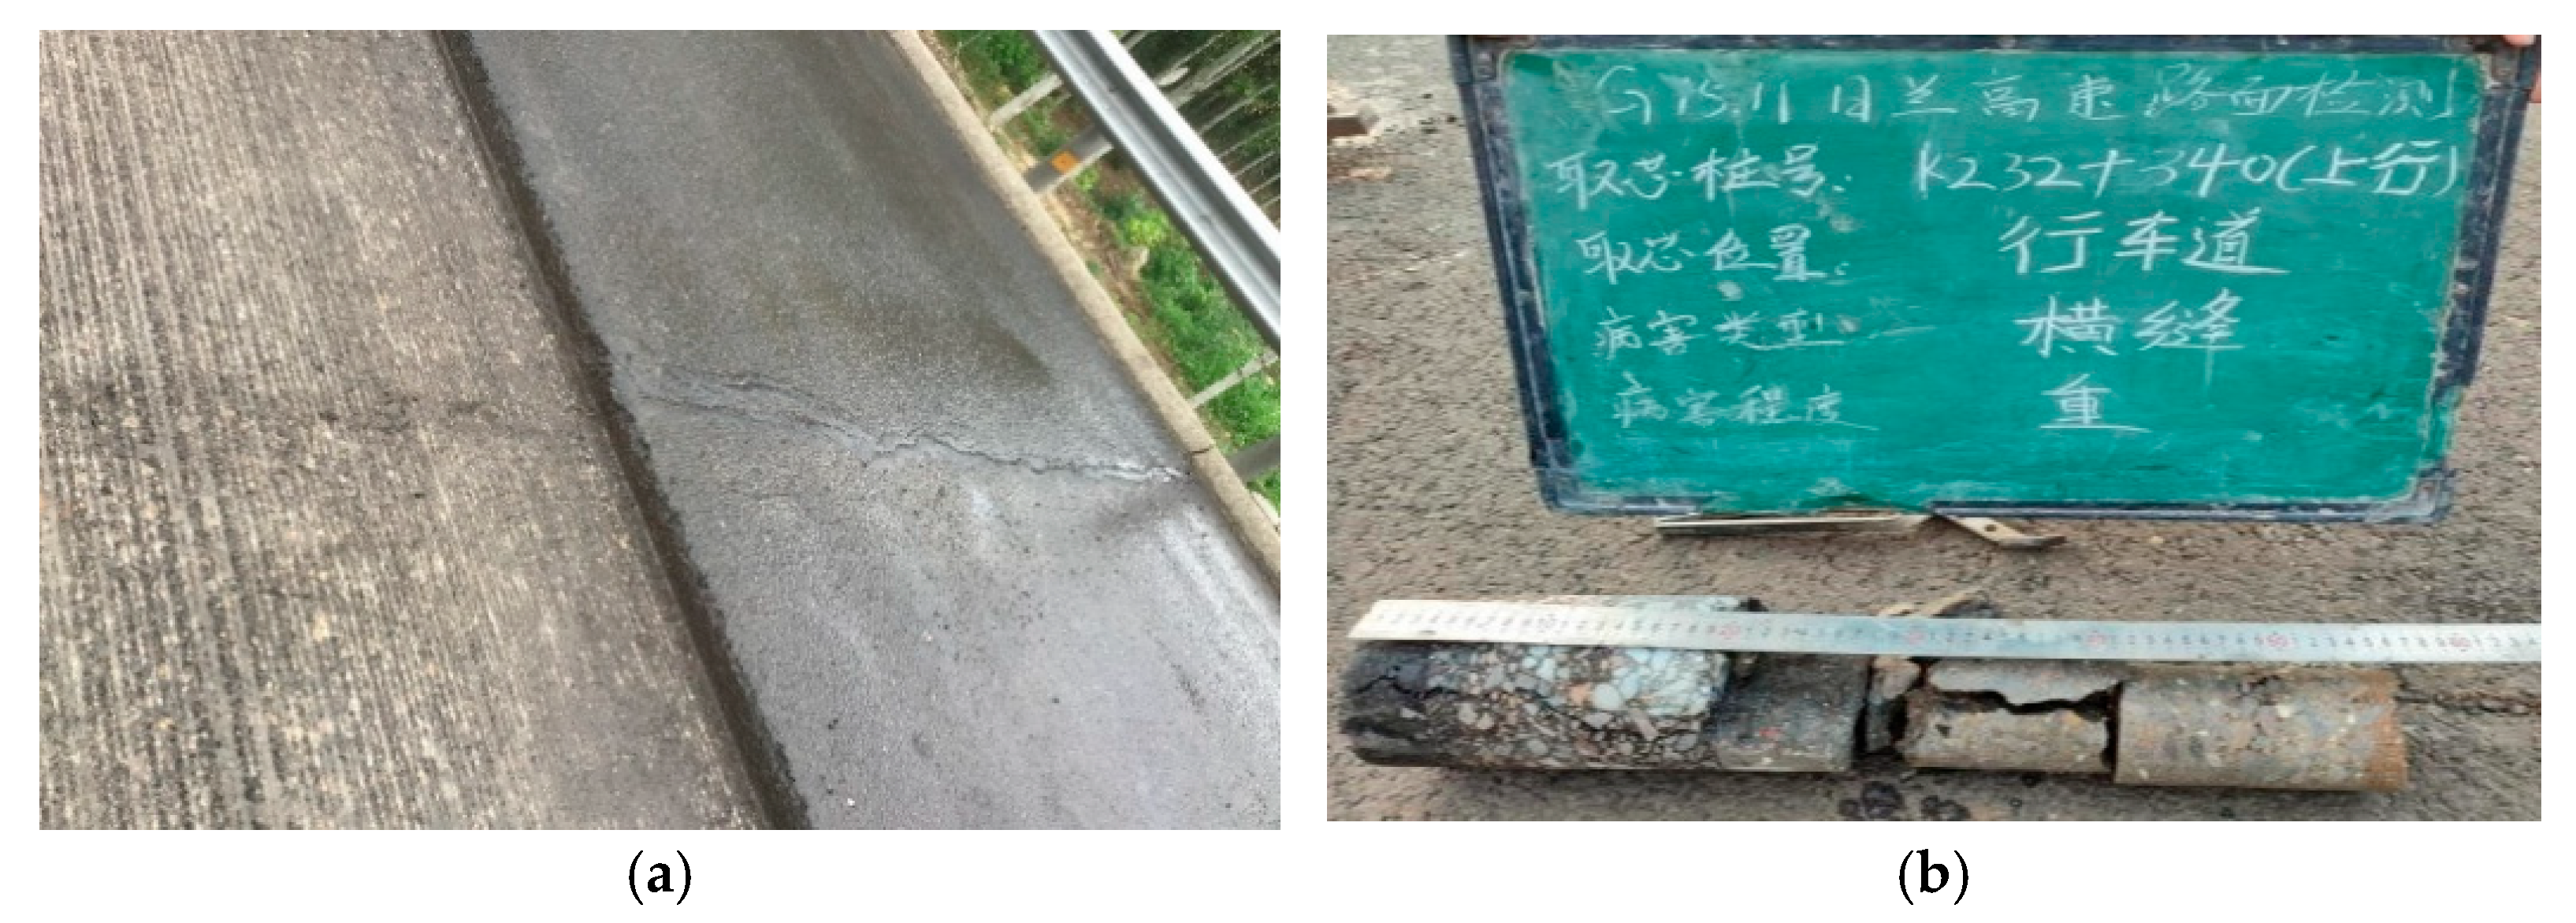
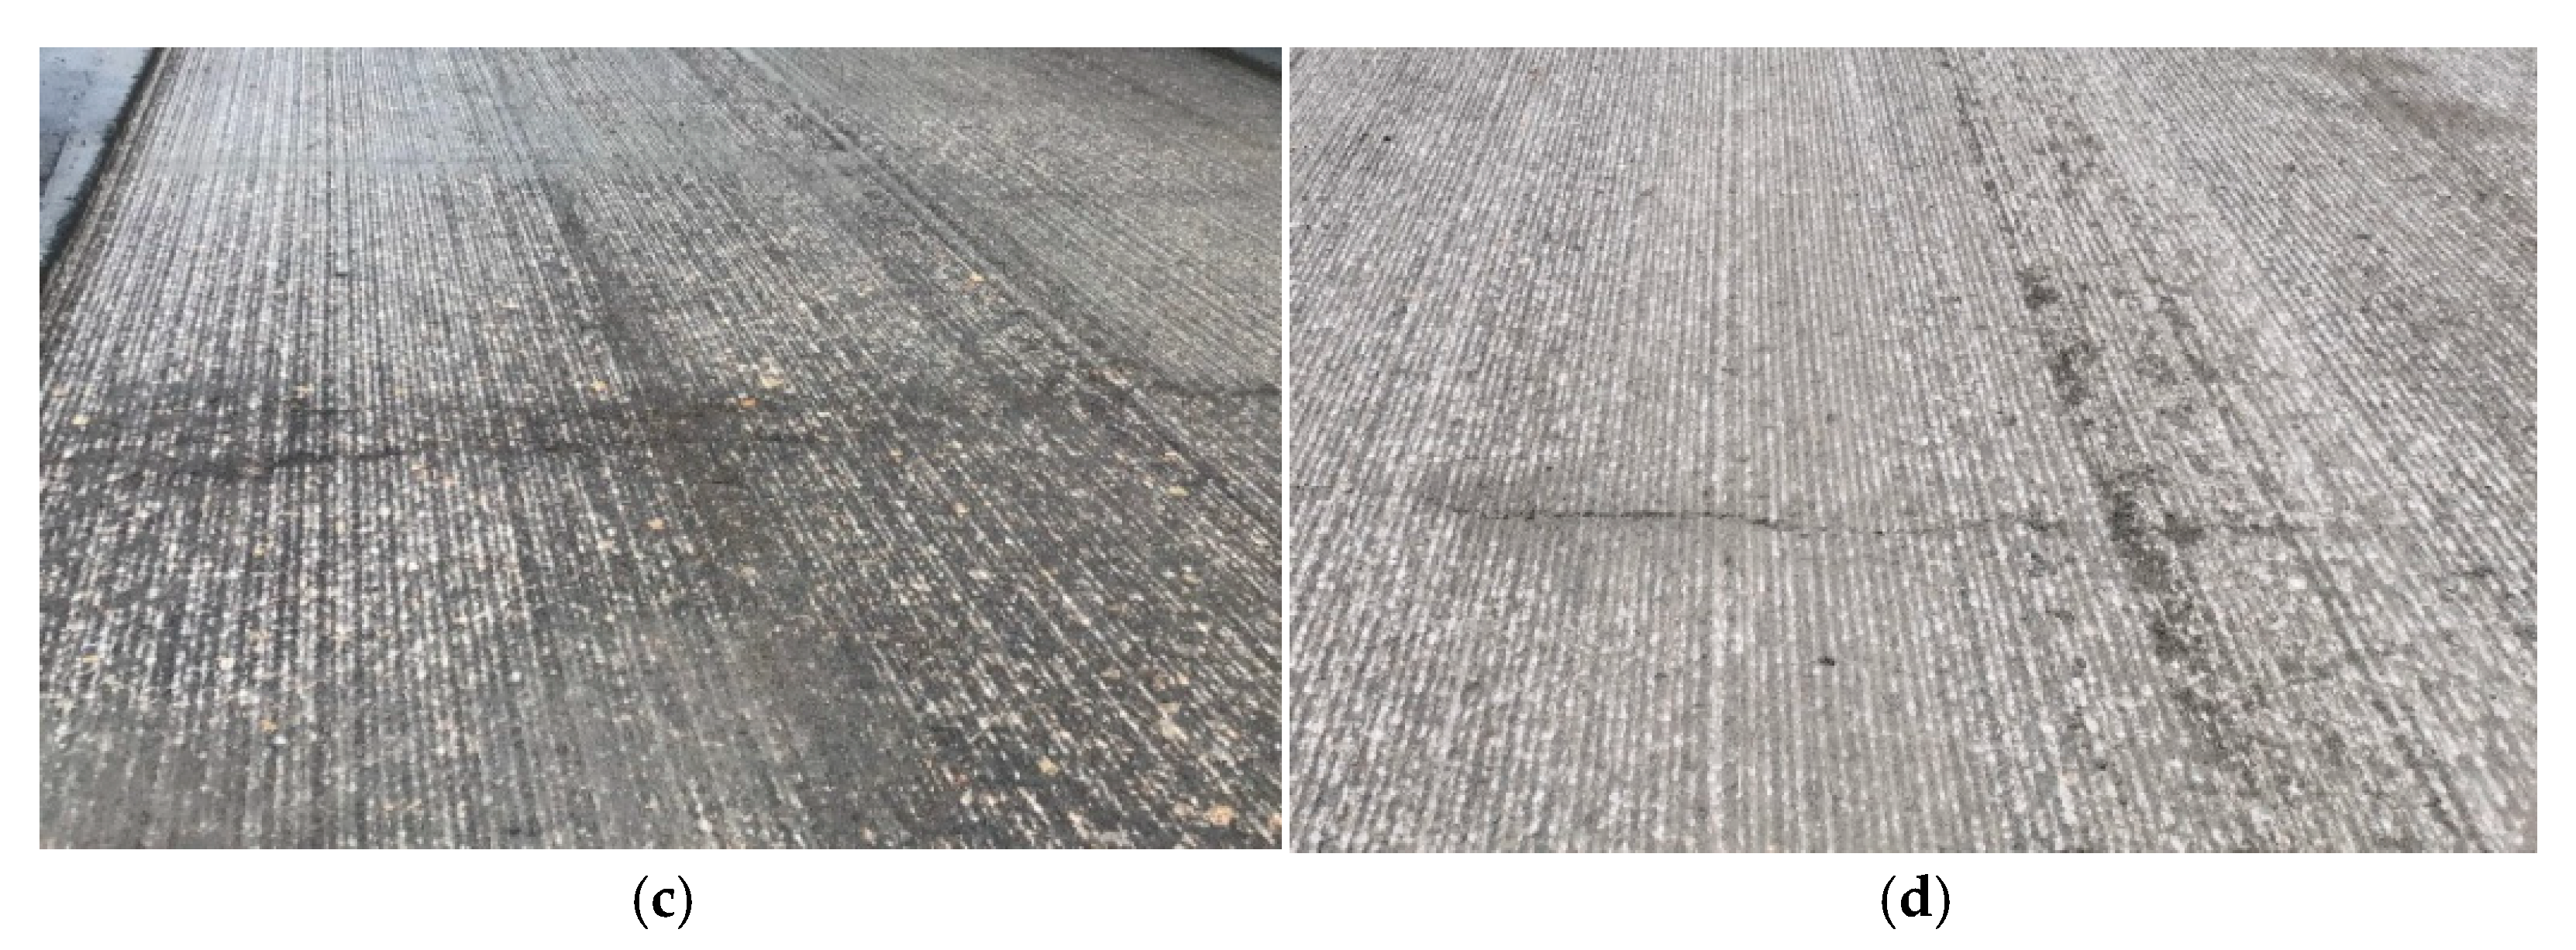
Figure 4.
Transverse crack K232 + 340 up. (a) Transverse surface cracks in the field, (b) Core sampling in the field (The text in the image is: Rilan Expressway Pavement Inspection; Core Sampling Stake Number K232 + 340 up; Location: Travel lane; Defect Type: Transverse crack; Severity Level: Severe), (c) Cracks after milling the upper surface layer, and (d) Cracks after milling the lower surface layer.
Figure 5.
Statistics of the number of structural cracks and surface cracks.
Figure 5.
Statistics of the number of structural cracks and surface cracks.
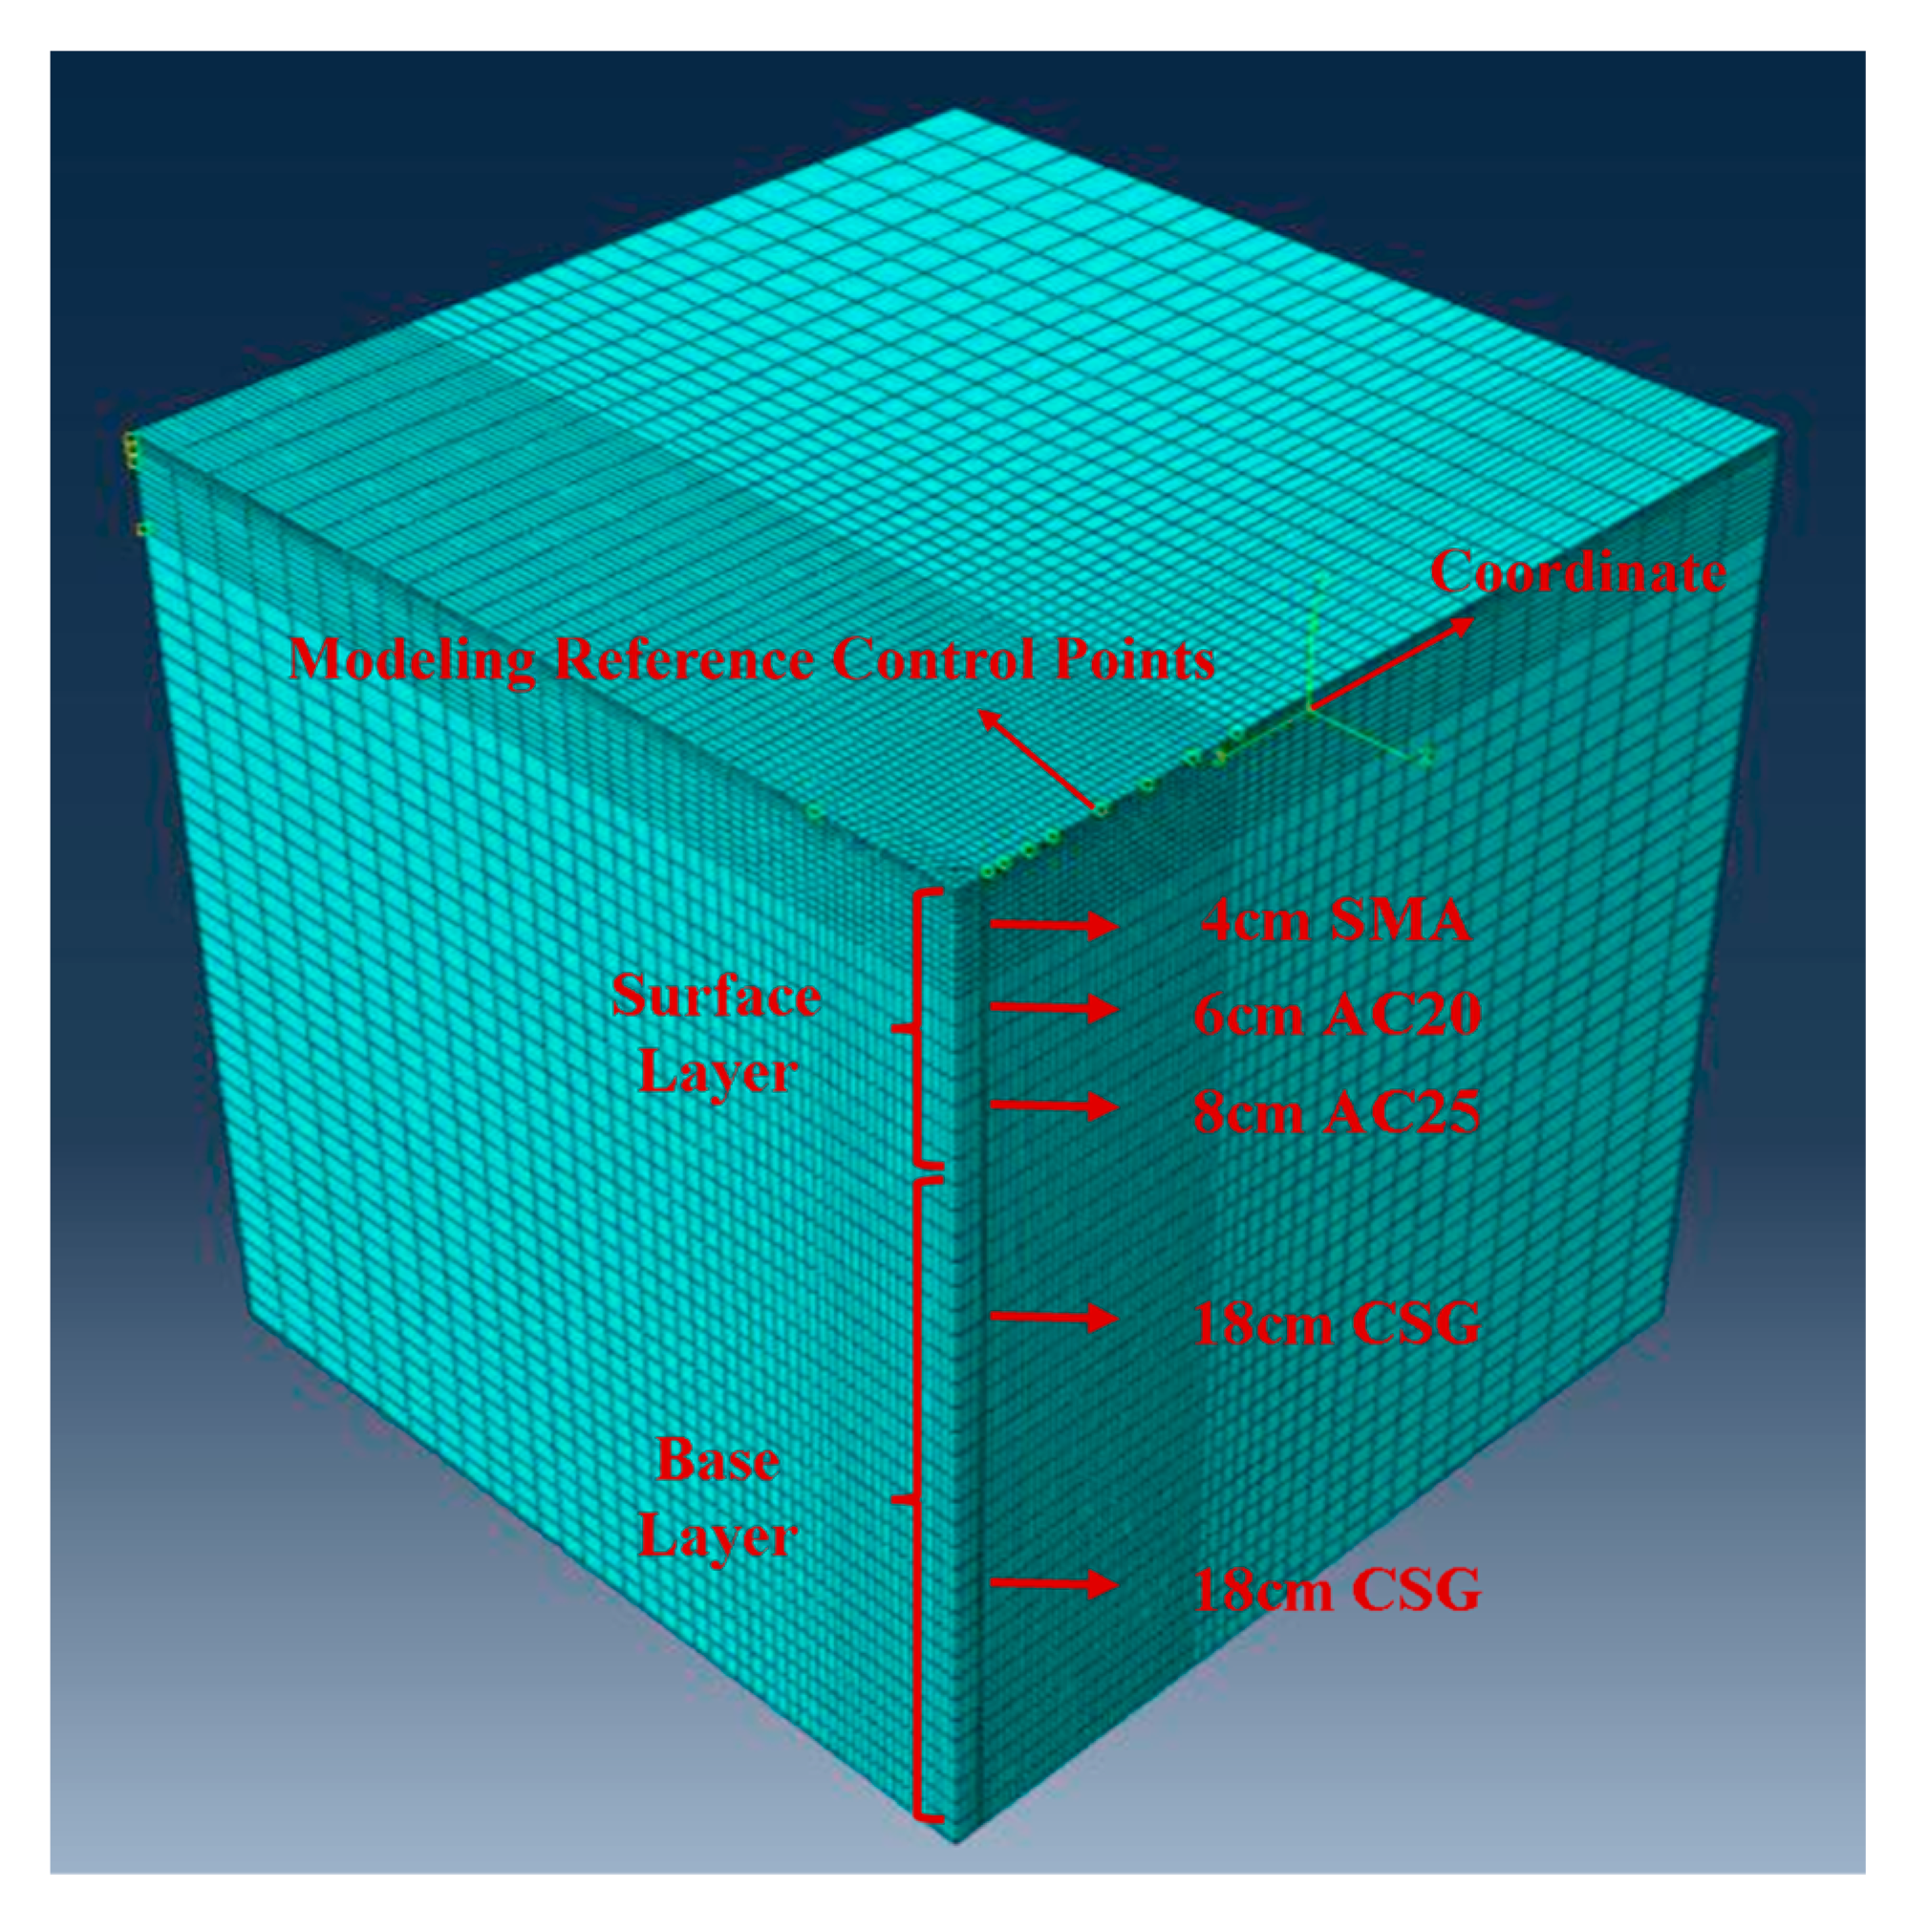
Figure 6.
Pavement finite element model.
Figure 6.
Pavement finite element model.
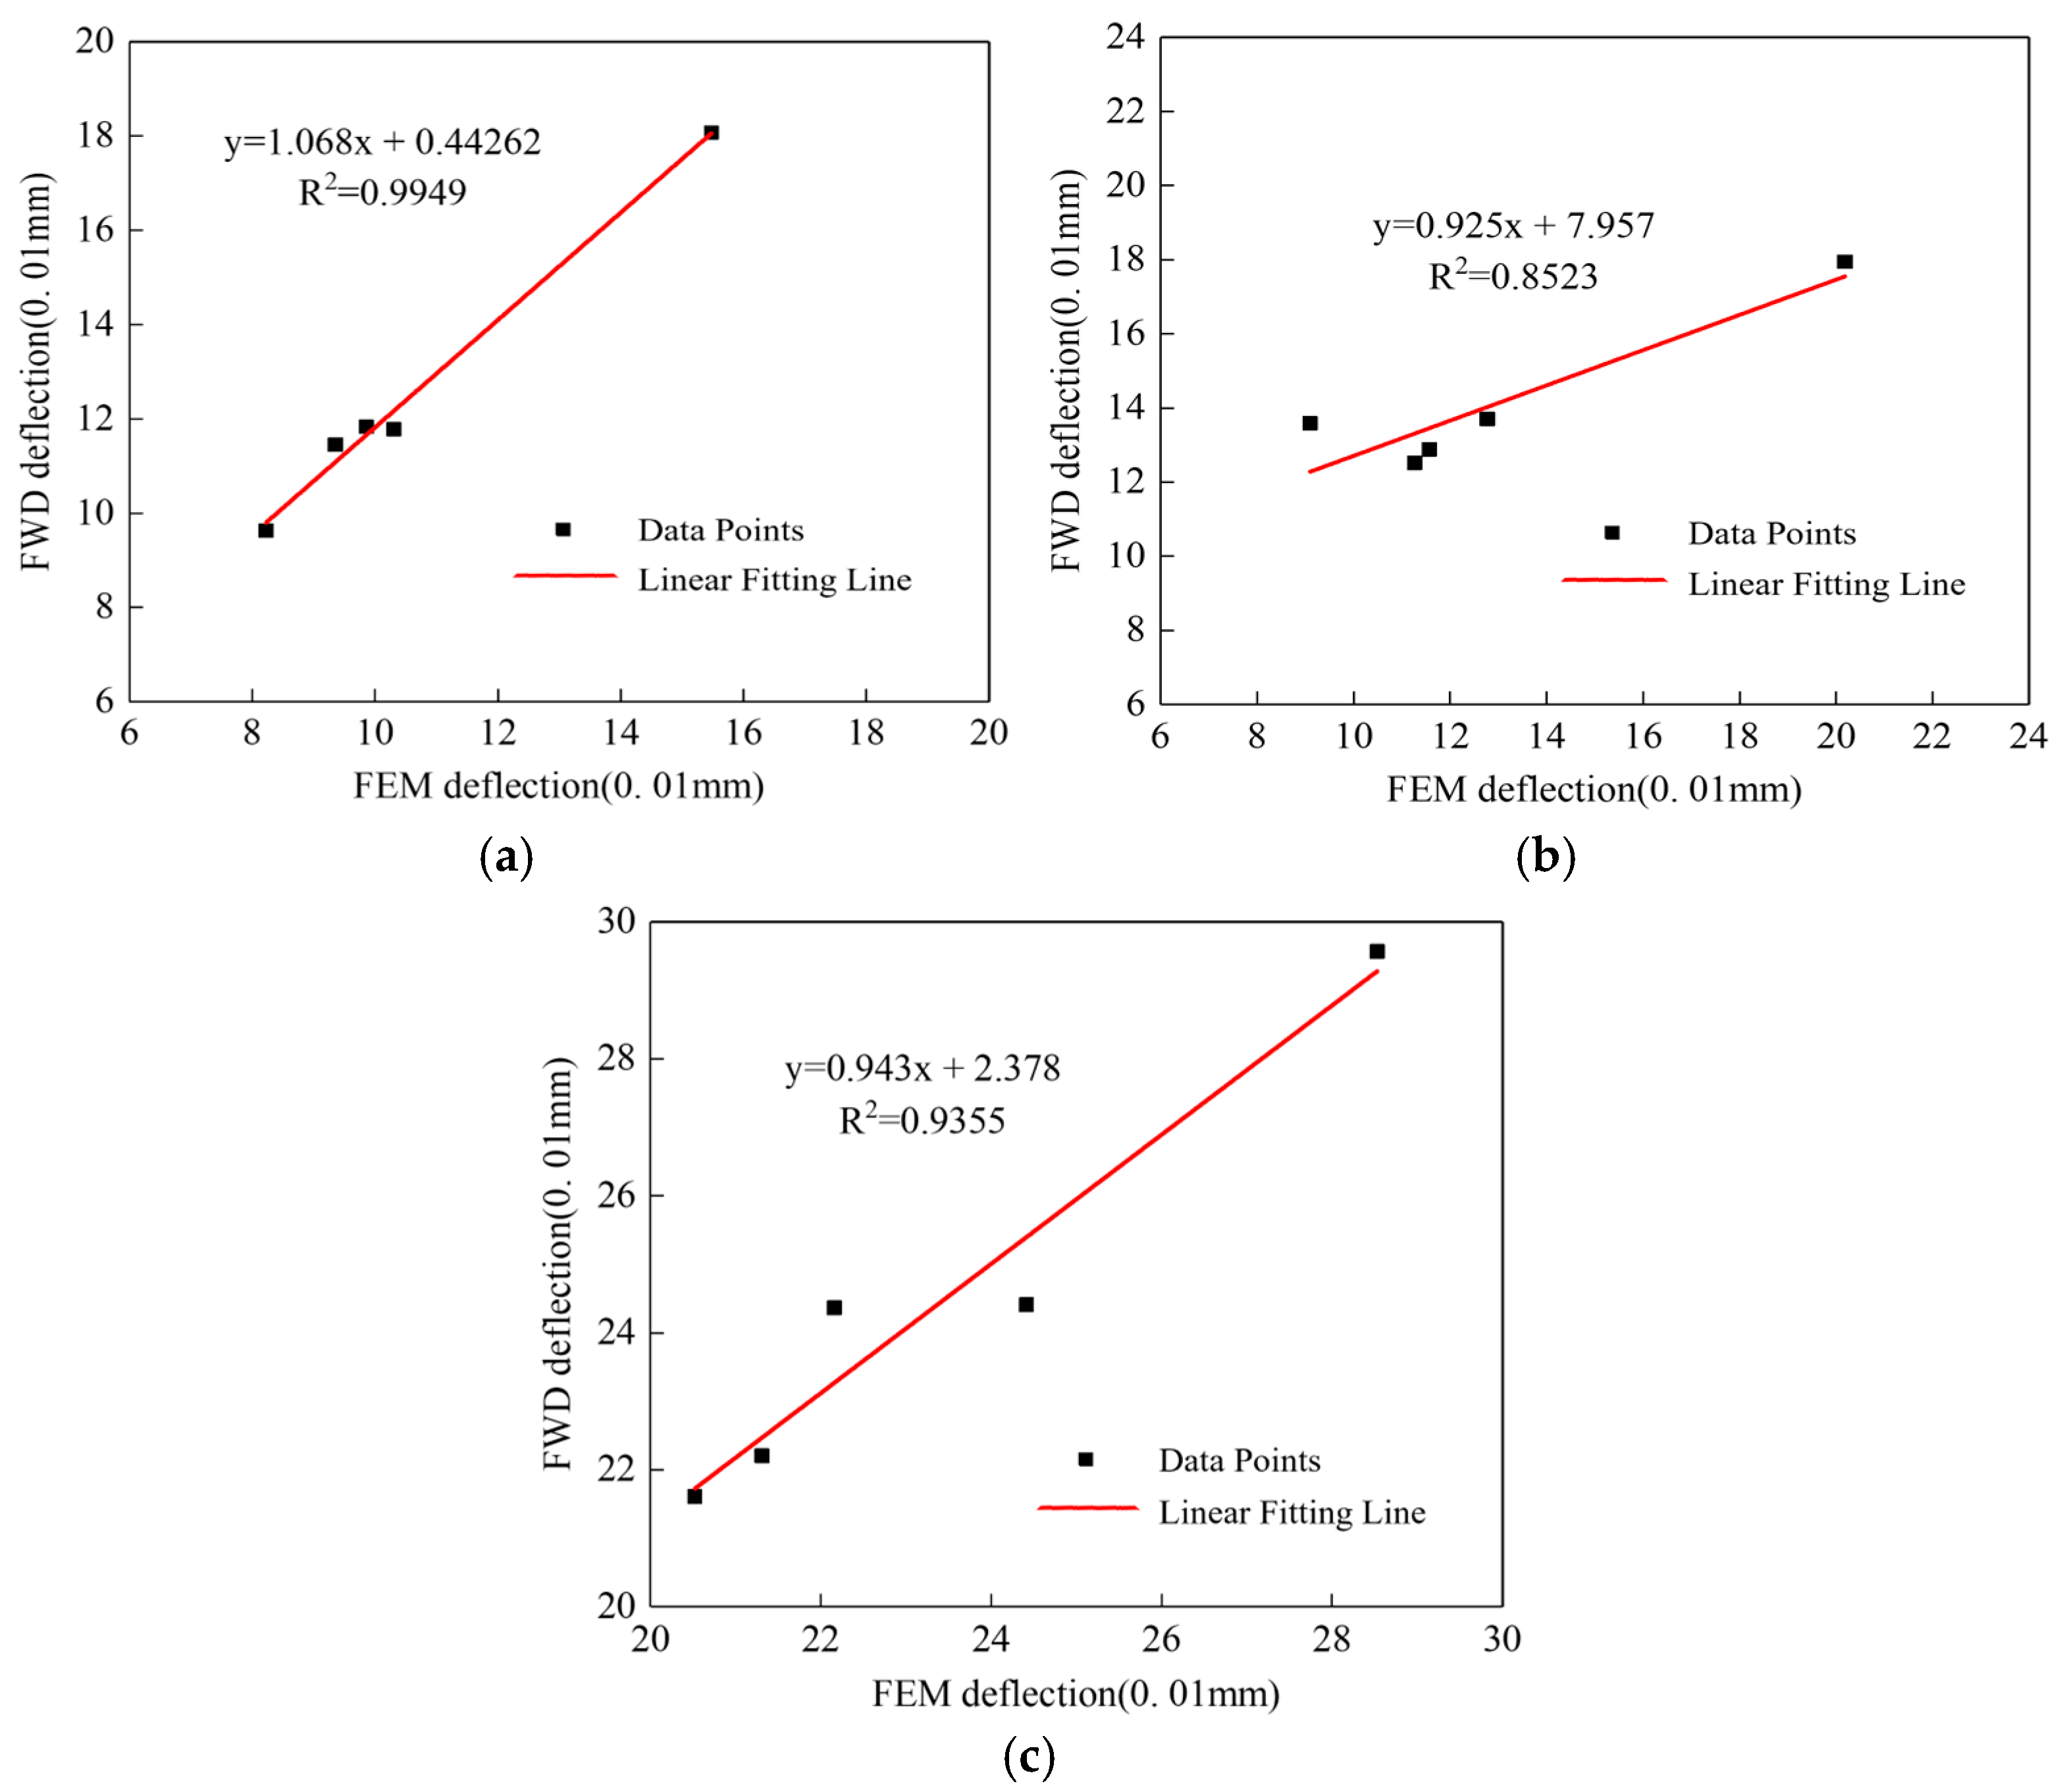
Figure 7.
Correlation analysis between FWD measurements and finite element model deflection responses for the tested pavement sections: (a) 3-mm width, 3.75-m length structural crack section, and (b) 5-mm width, 3.75-m length structural crack section, and (c) 10-mm width, 7.5-m length structural crack section.
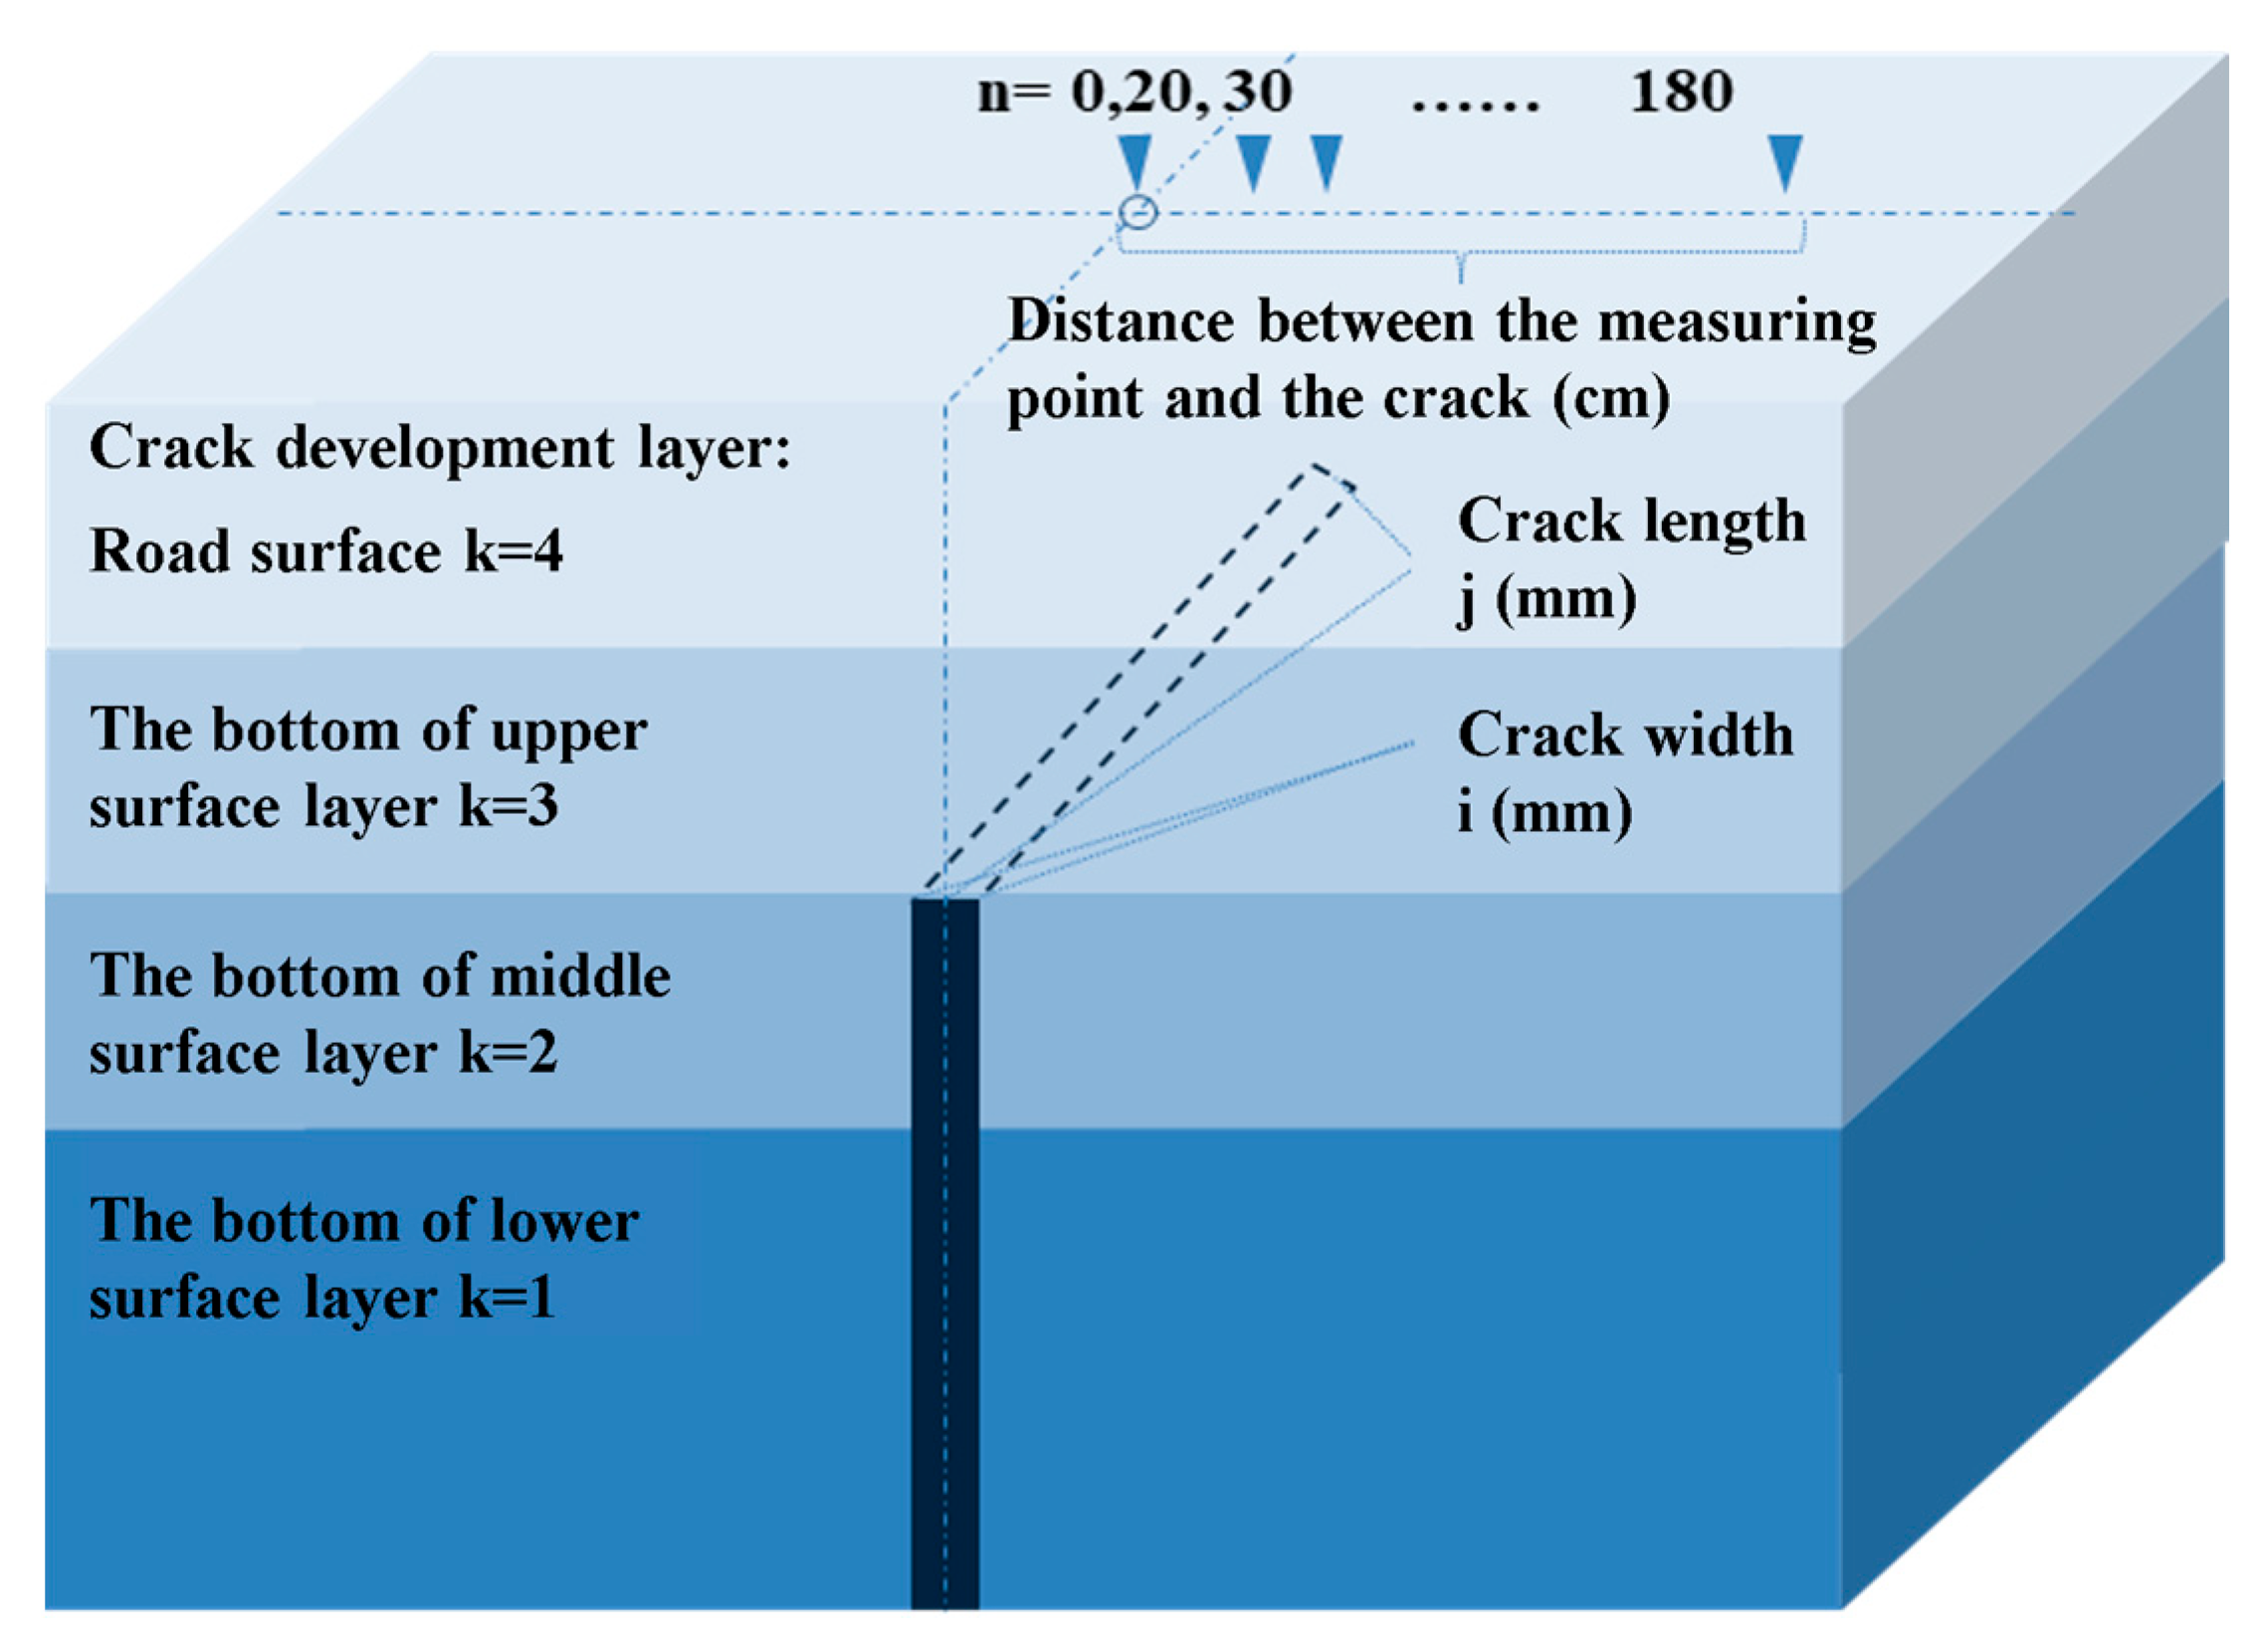
Figure 8.
Deflection calculation diagram.
Figure 8.
Deflection calculation diagram.
Figure 9.
Bending ratio curve based on simulation calculation. (a) Structural crack: length 10.5 m, width 15 mm, and (b) Structural crack: length 1.87 m, width 1 mm.
Figure 9.
Bending ratio curve based on simulation calculation. (a) Structural crack: length 10.5 m, width 15 mm, and (b) Structural crack: length 1.87 m, width 1 mm.
Figure 10.
Midpoint deflection ratio of structural cracks of different lengths.
Figure 10.
Midpoint deflection ratio of structural cracks of different lengths.
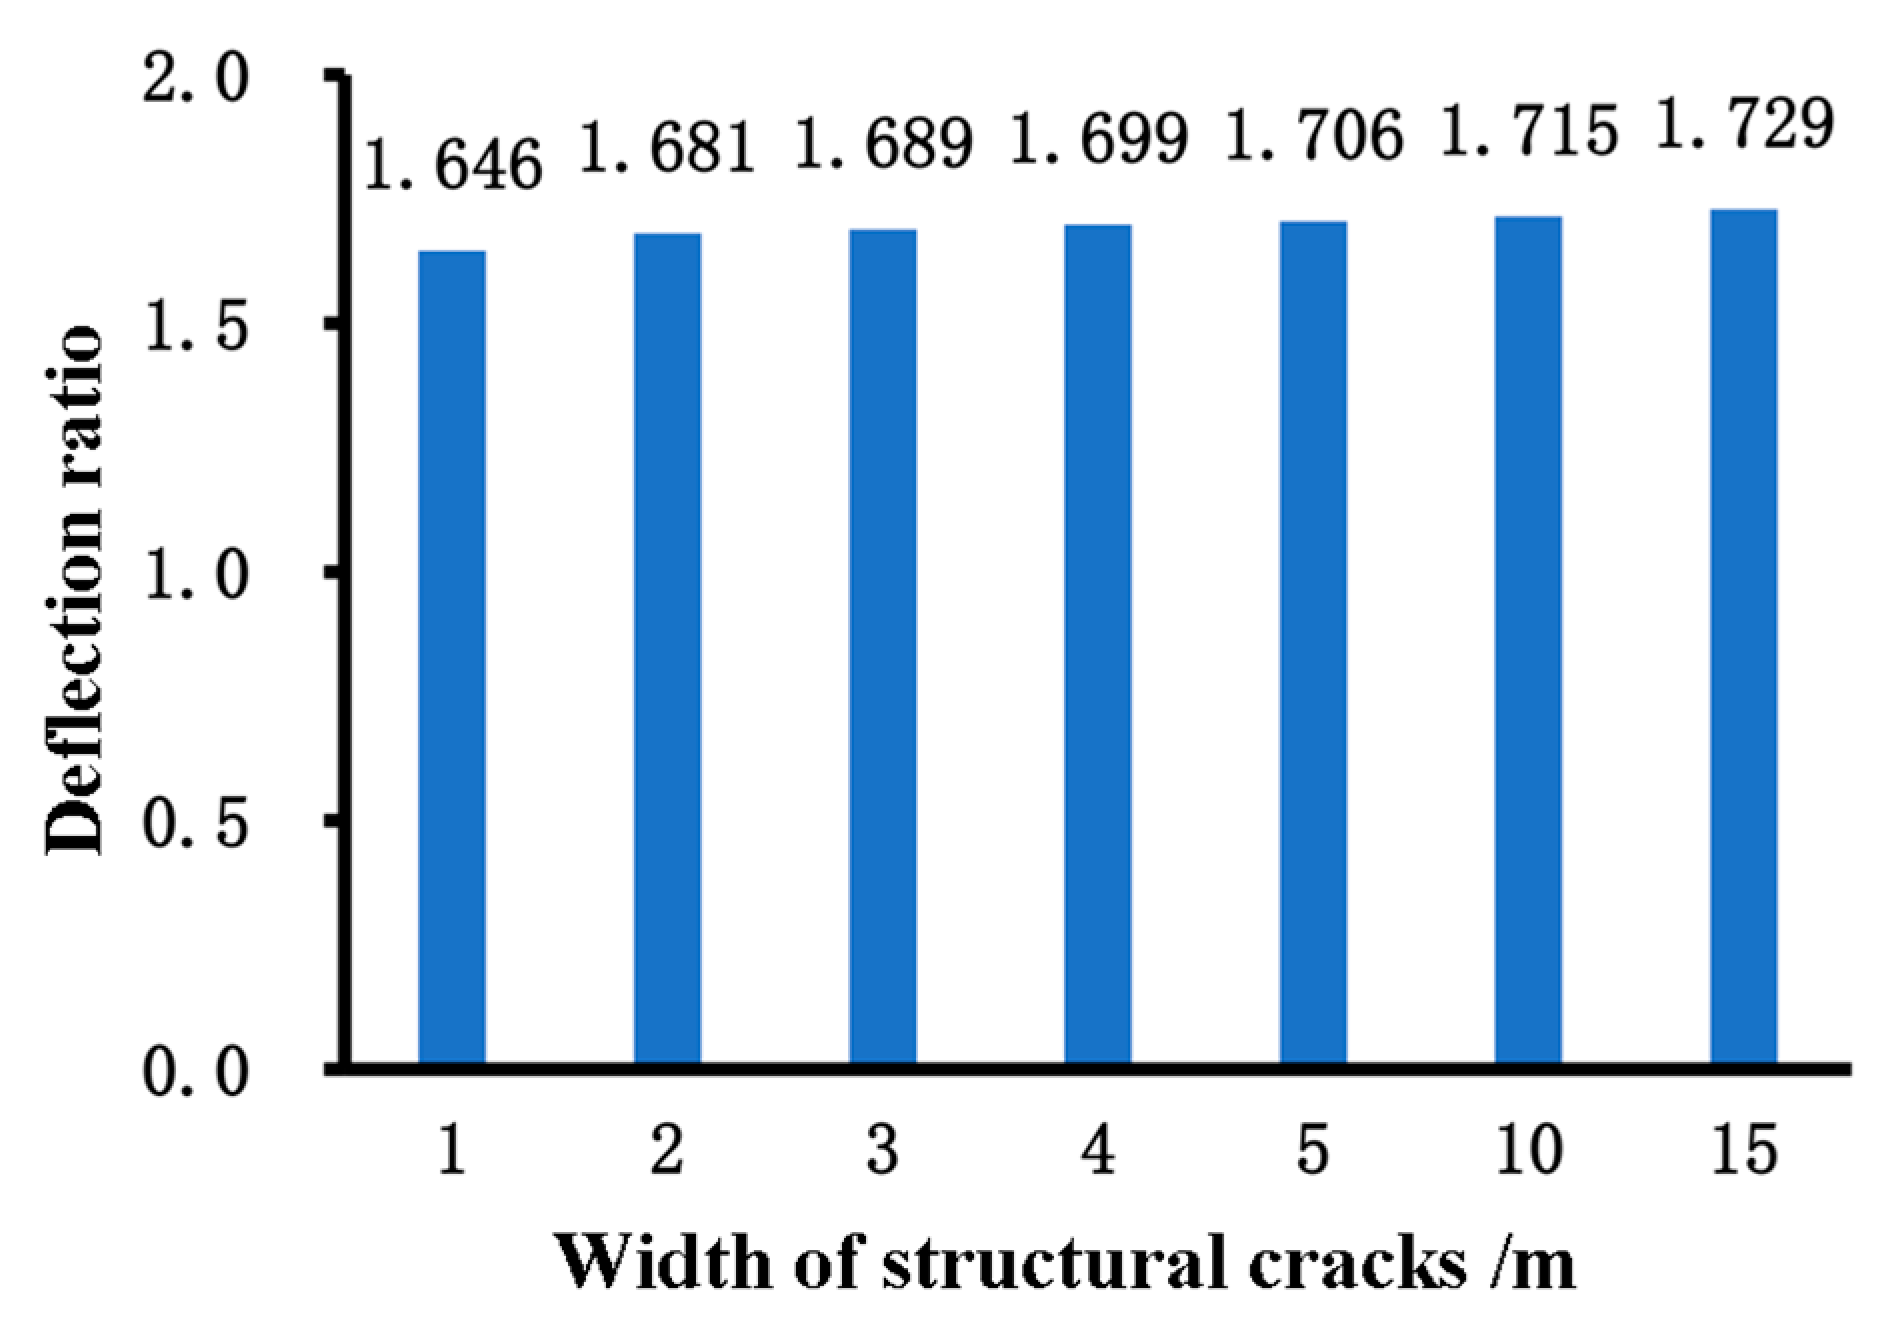
Figure 11.
Midpoint deflection ratio of structural cracks of different widths.
Figure 11.
Midpoint deflection ratio of structural cracks of different widths.
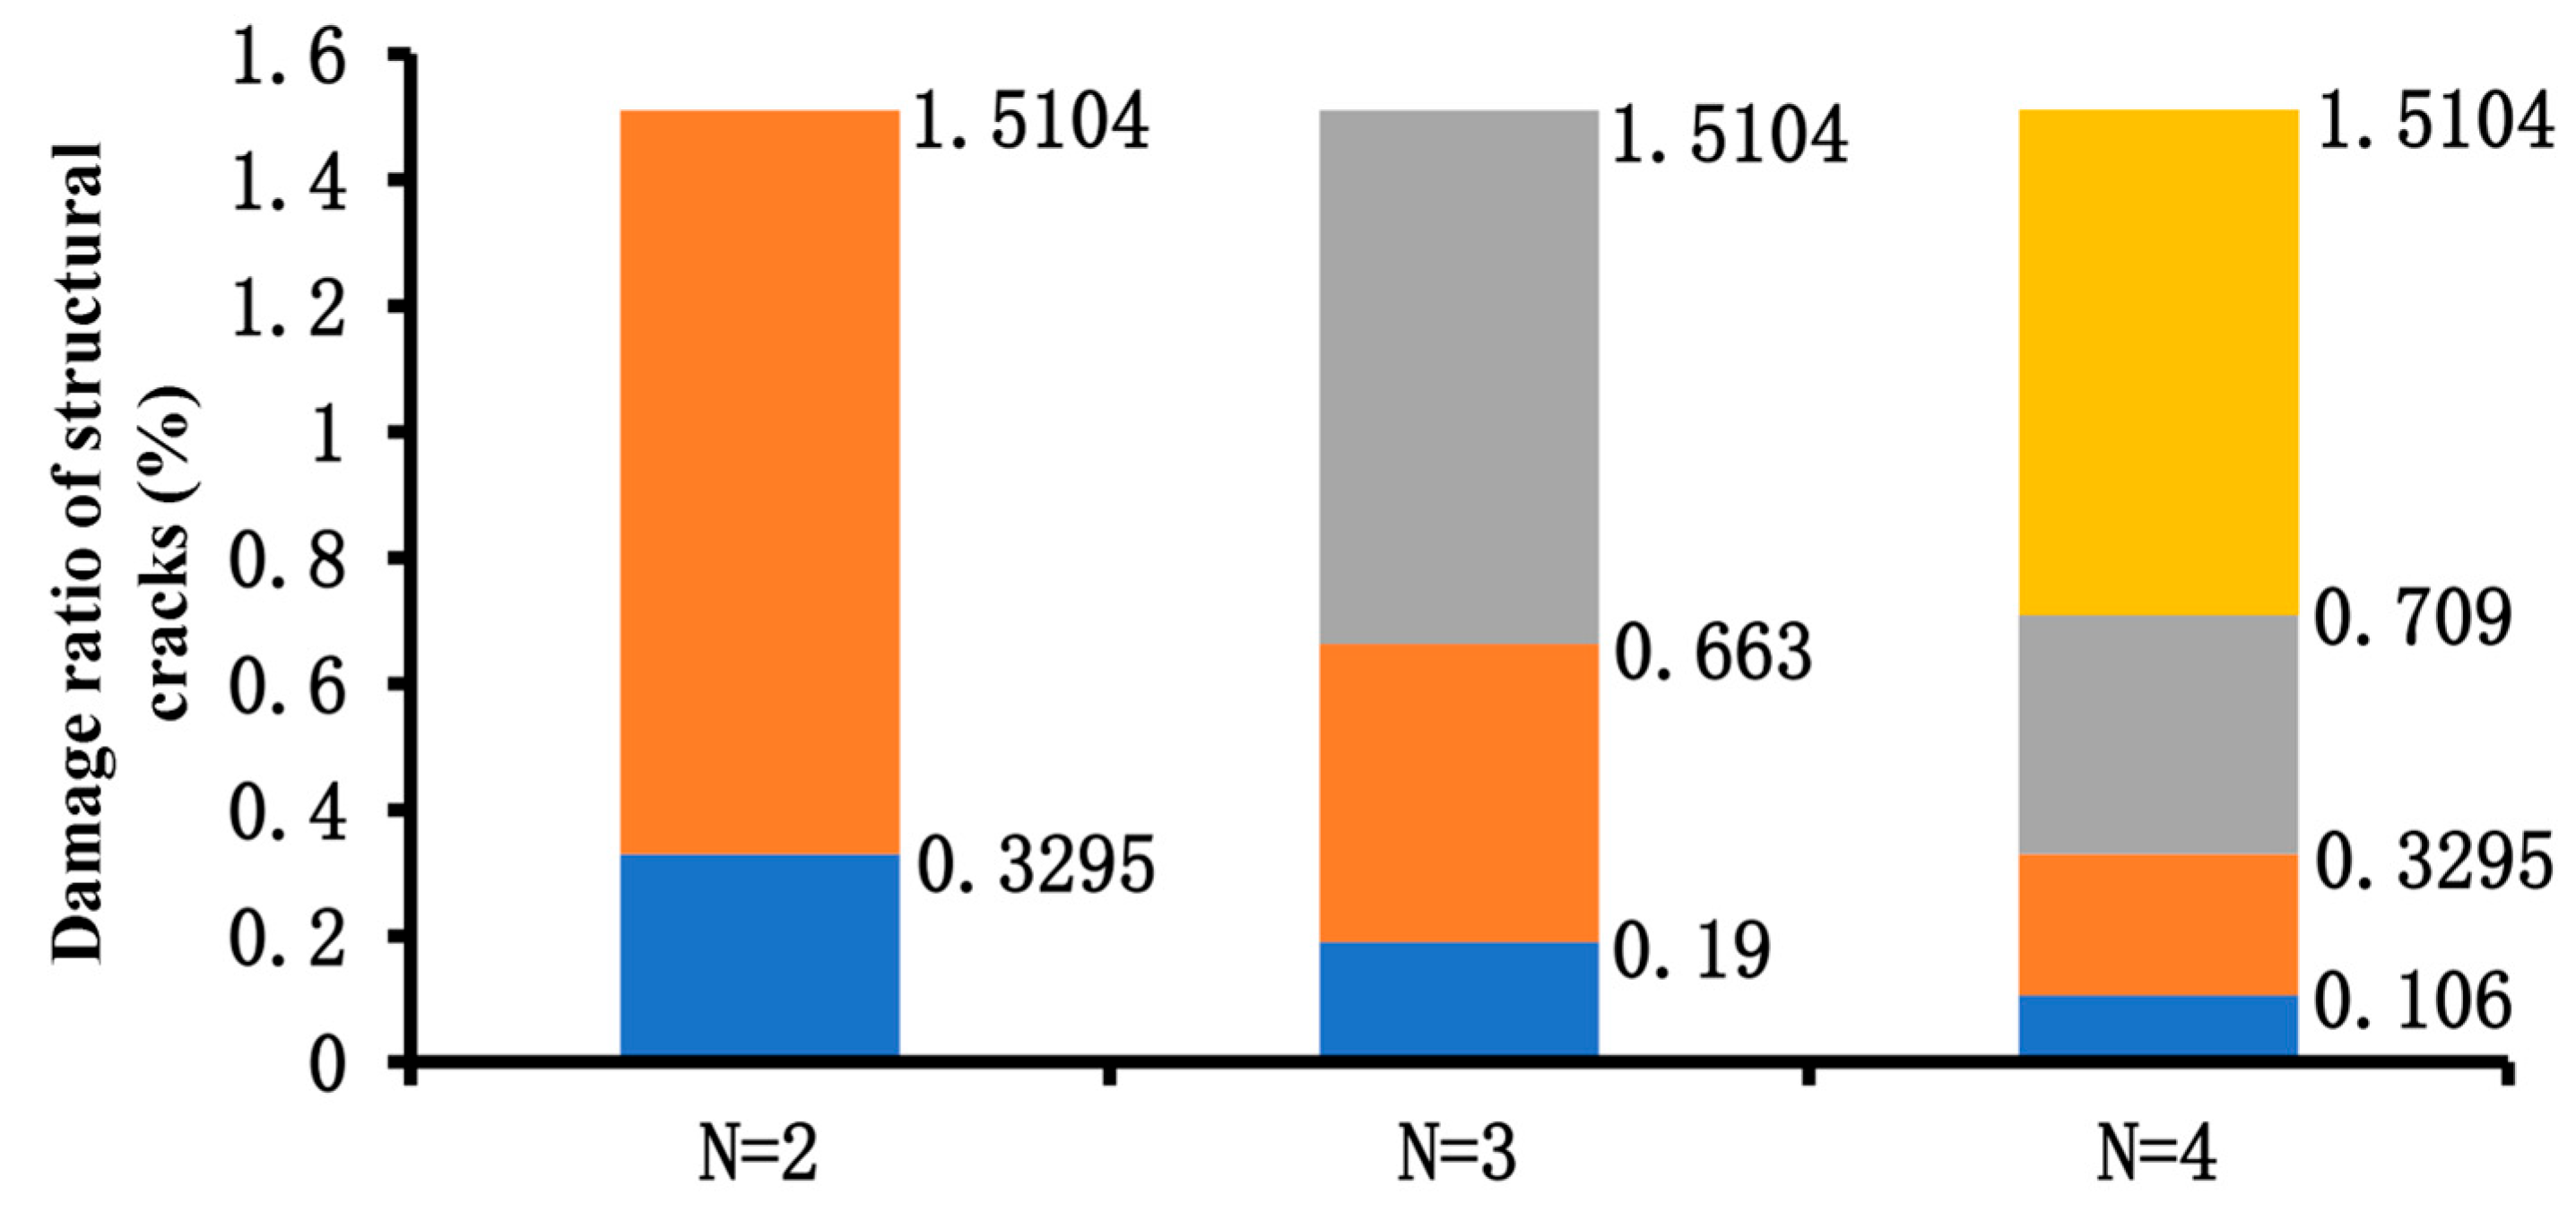
Figure 12.
Summary of the final thresholds.
Figure 12.
Summary of the final thresholds.
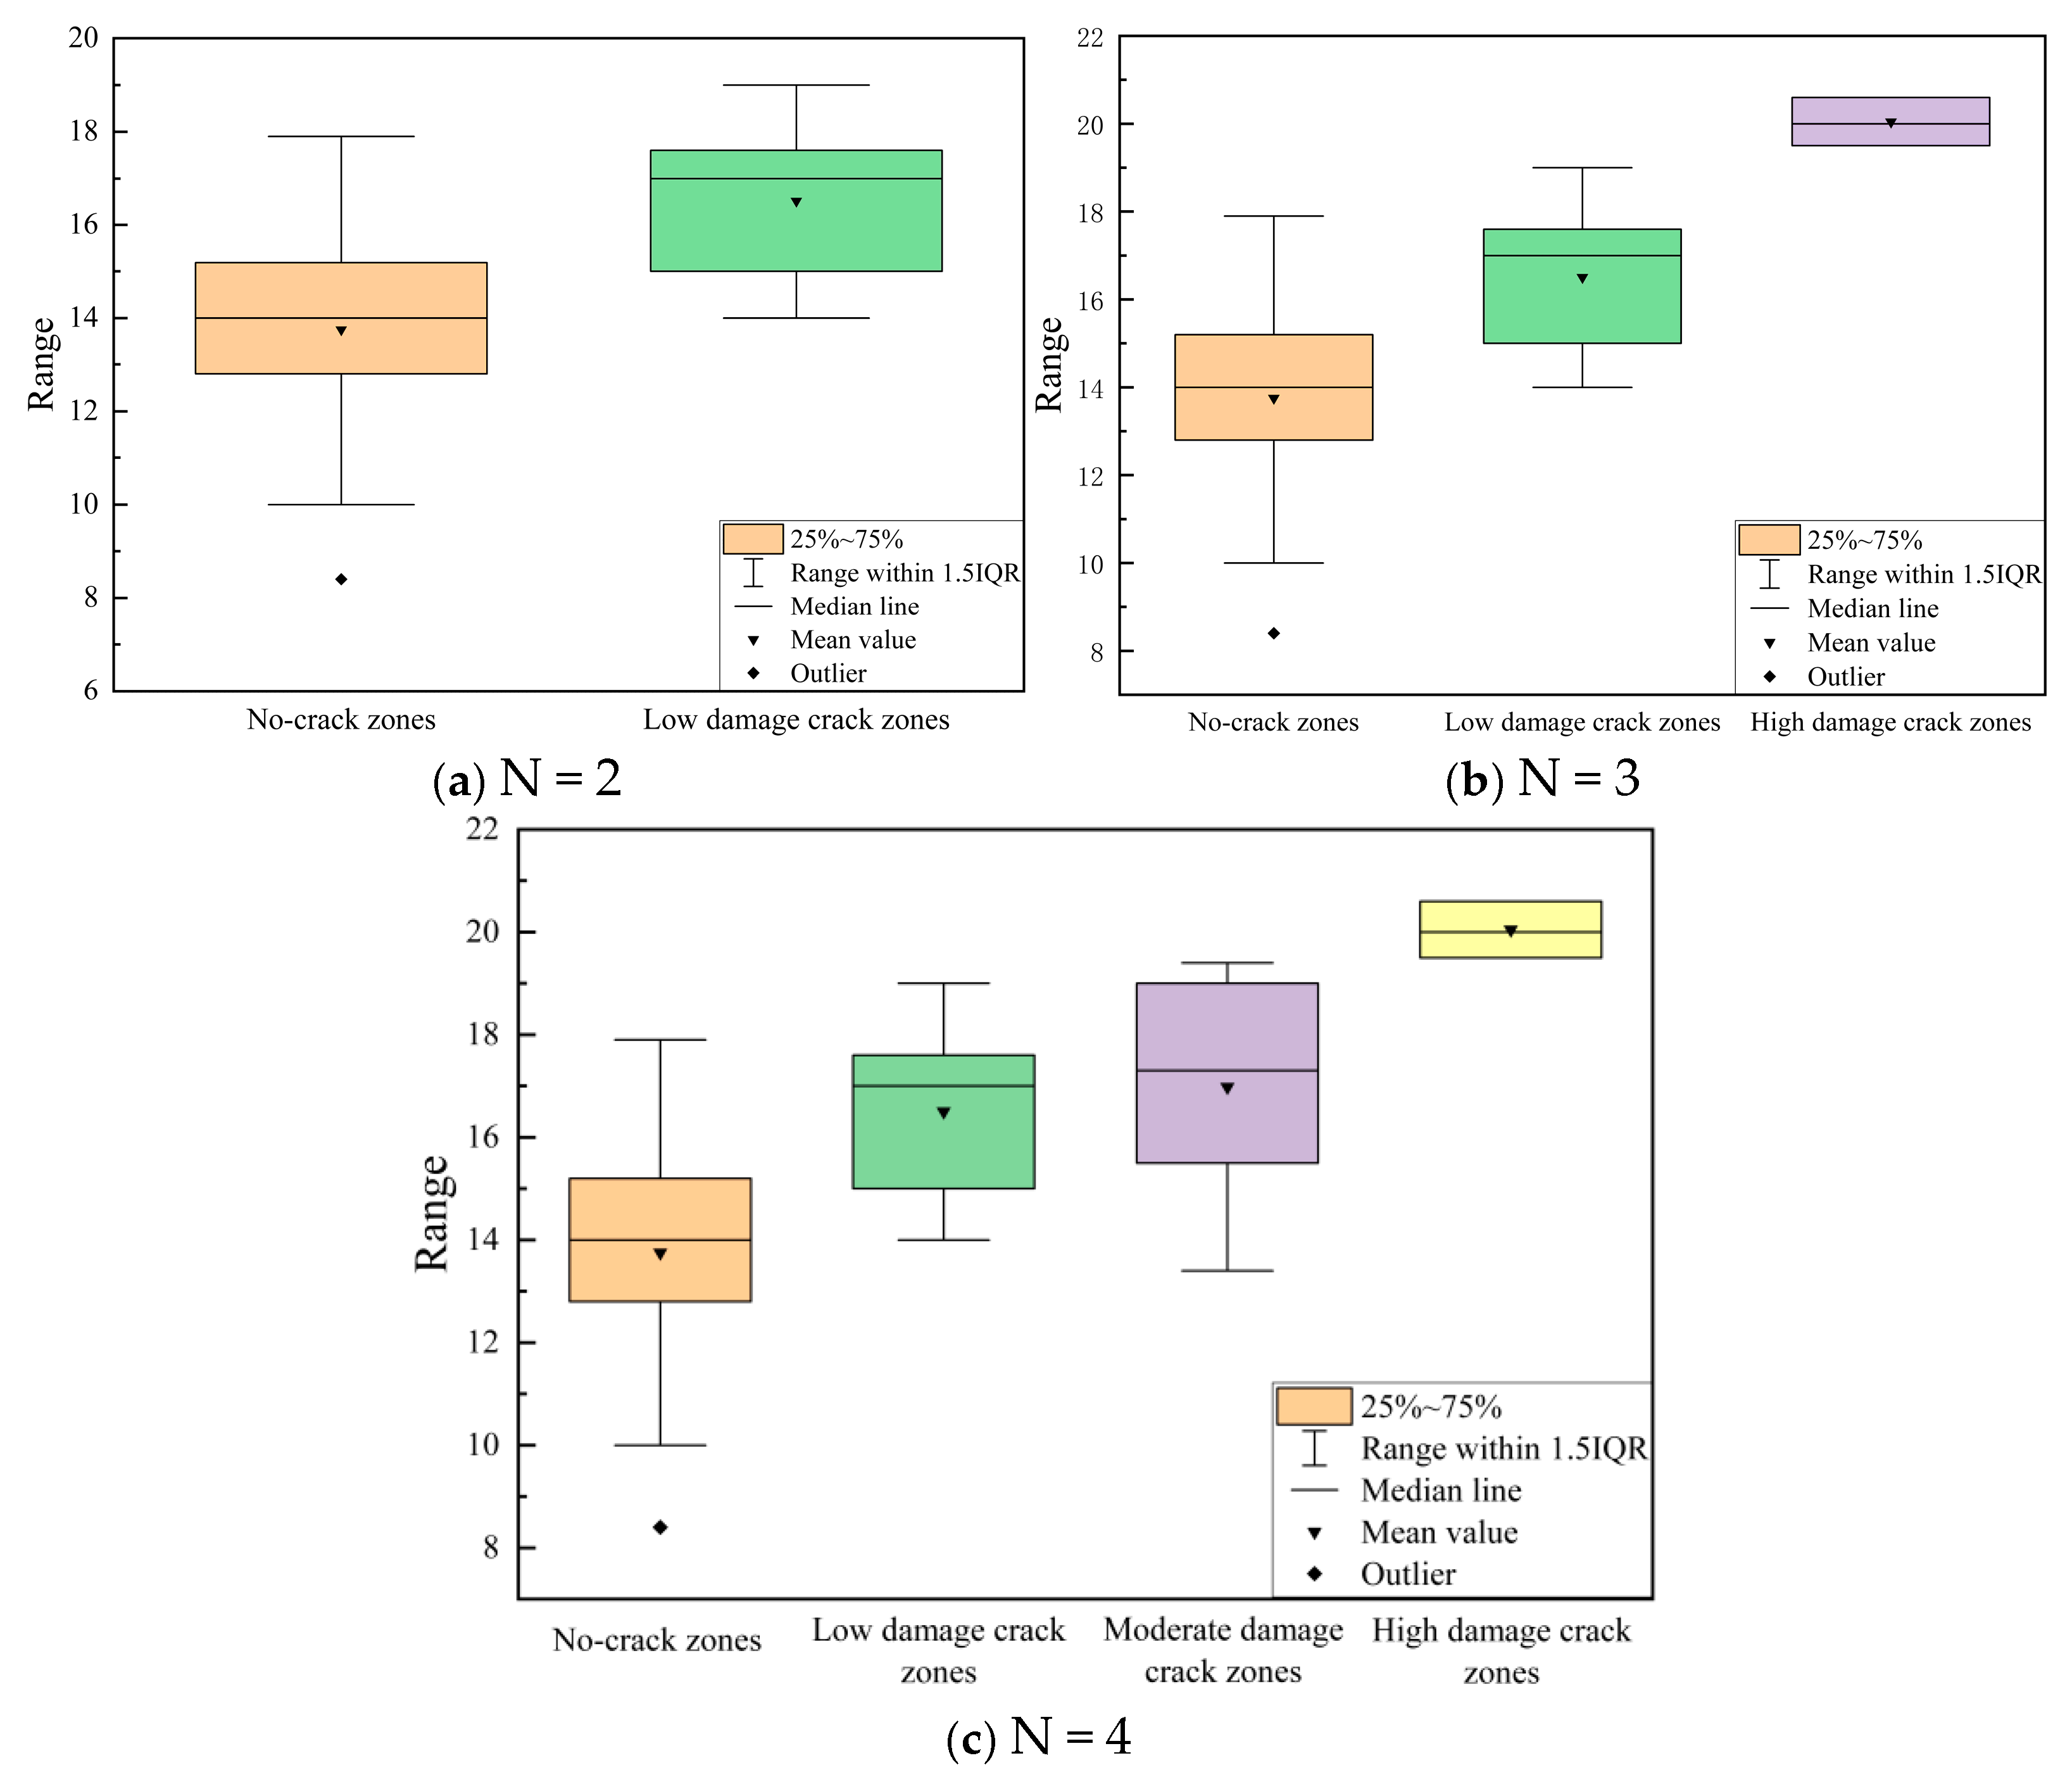
Figure 13.
Effect of failure rate of structural cracks on pavement midpoint deflection.
Figure 13.
Effect of failure rate of structural cracks on pavement midpoint deflection.
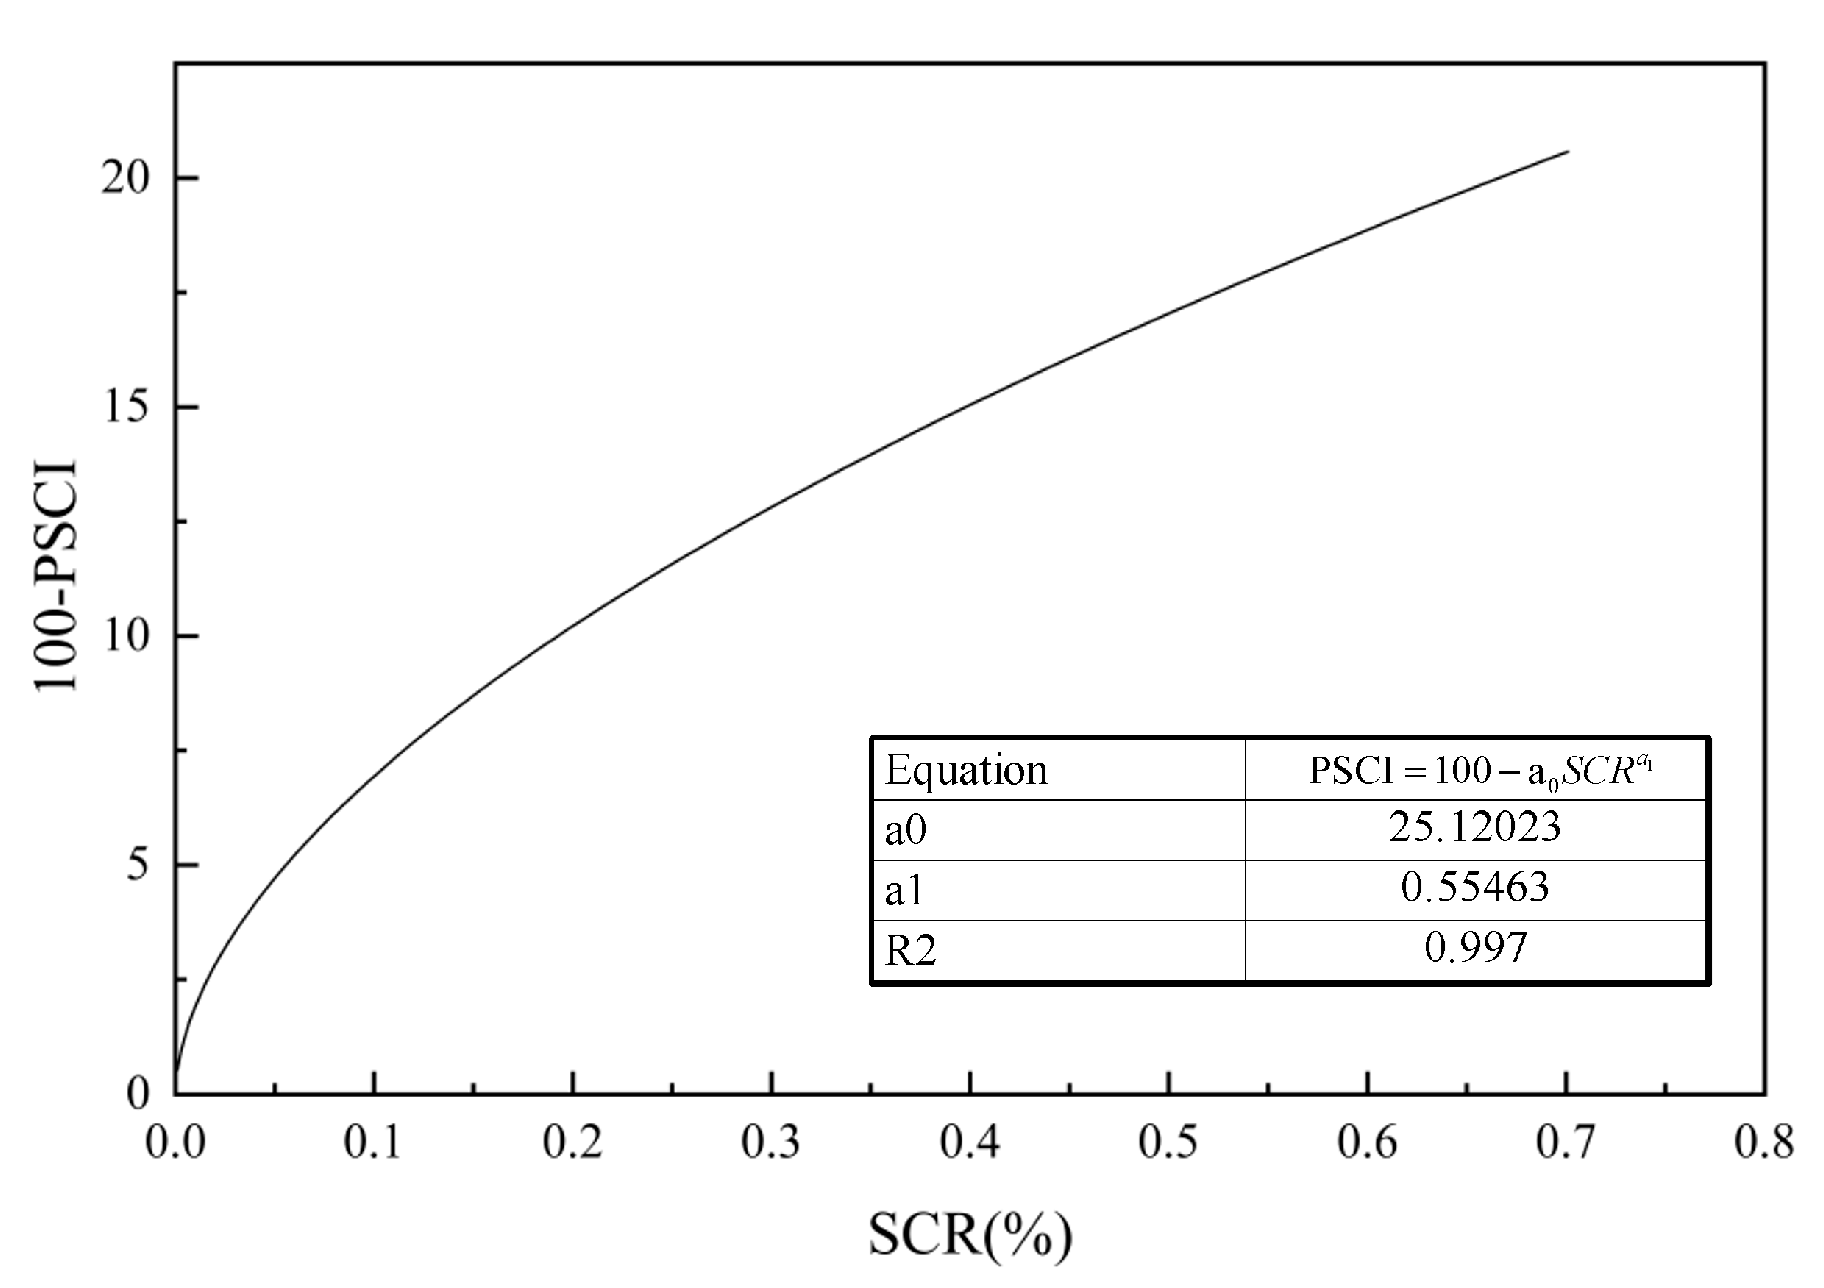
Figure 14.
Nonlinear fitting results of PSCI and SCR.
Figure 14.
Nonlinear fitting results of PSCI and SCR.
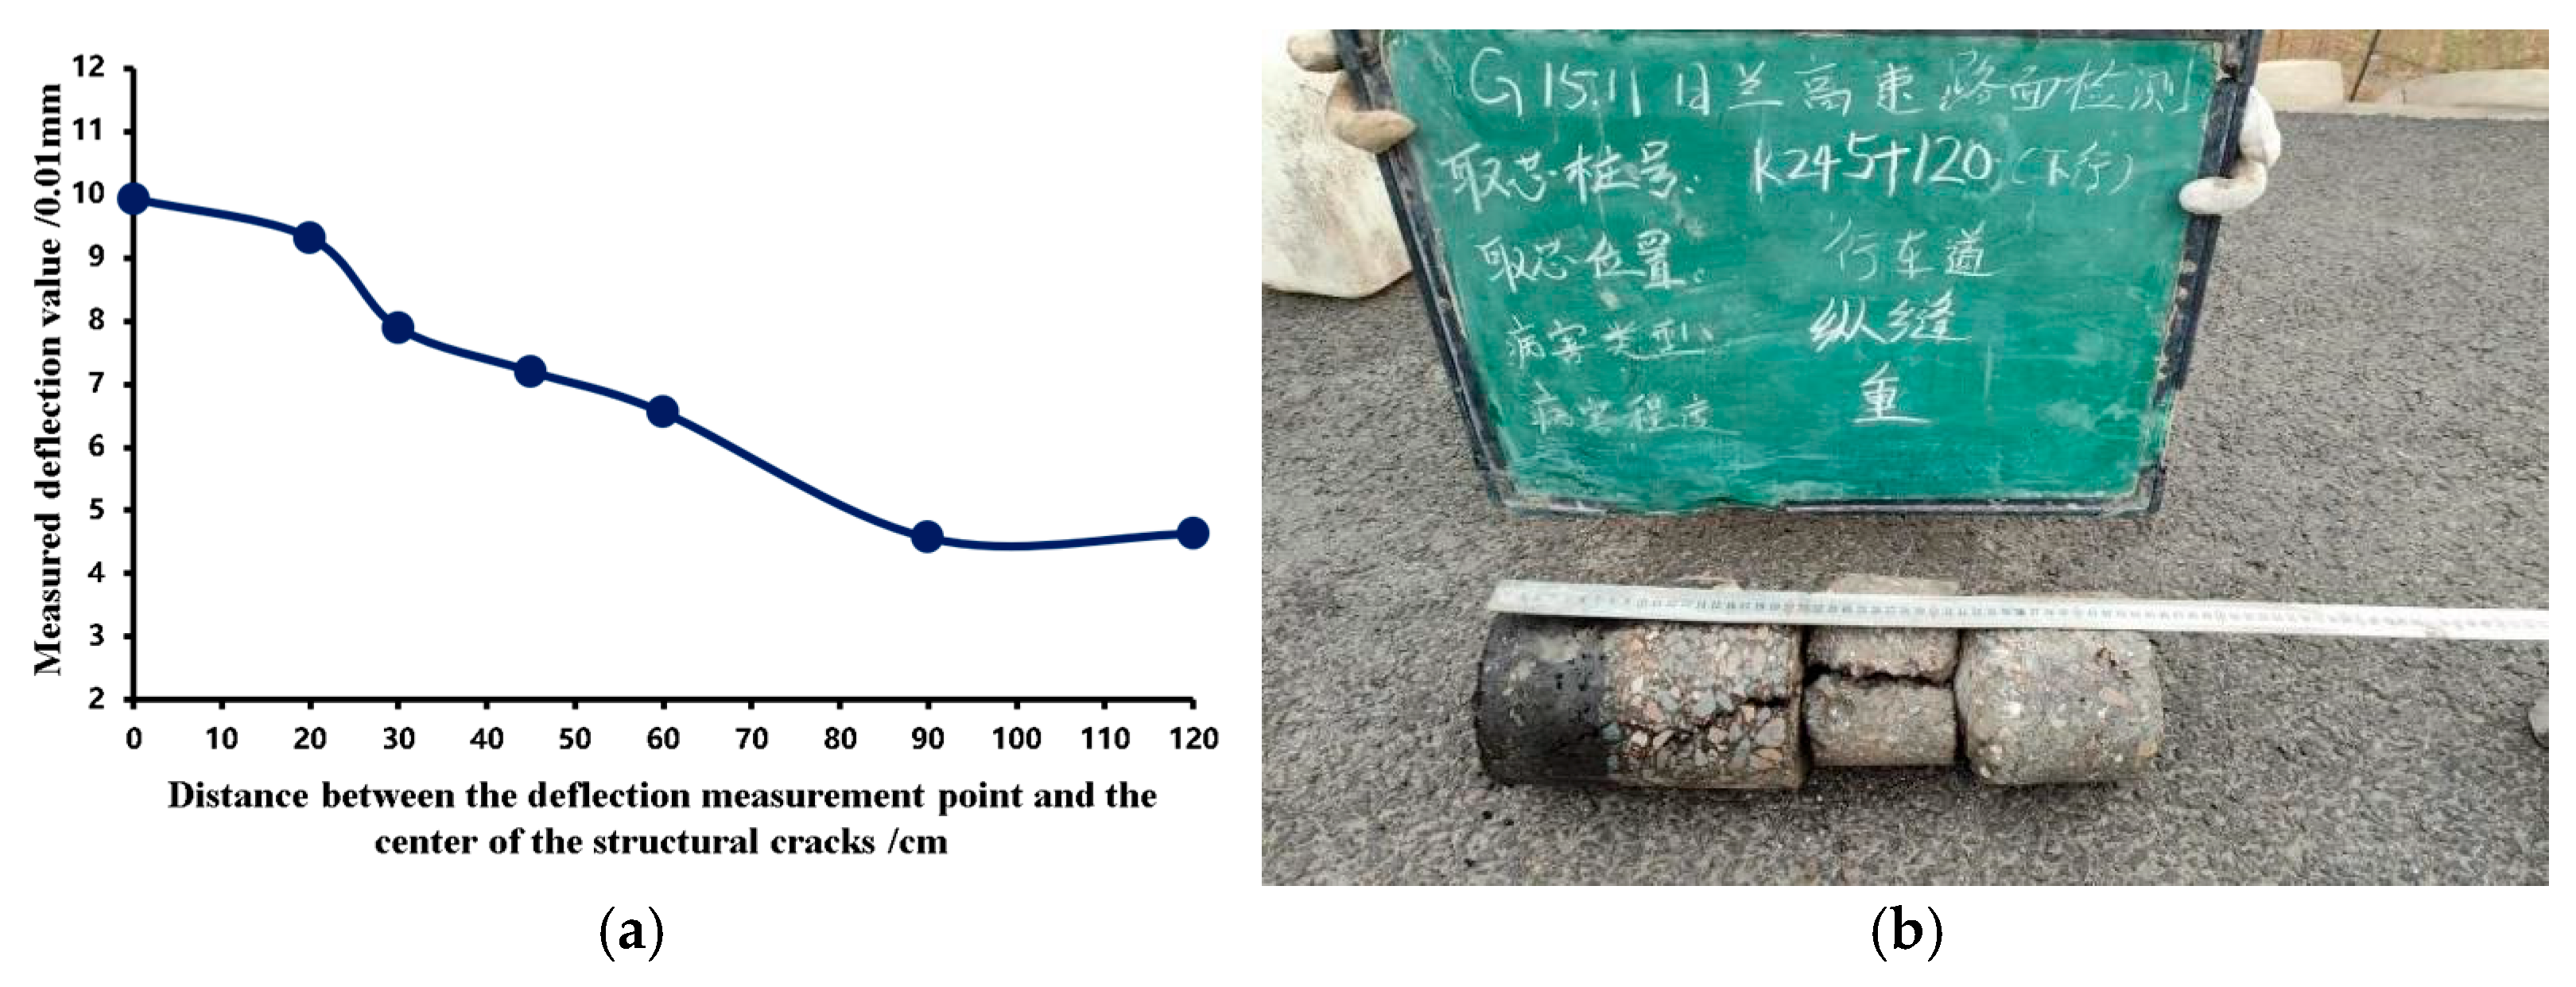
Figure 15.
Core sample results and bending basin data at ascending K230+328. (a) FWD measured deflection basin data, (b) Core sample results (The text in the image is: Rilan Expressway Pavement Inspection; Core Sampling Stake Number K245 + 120 down; Location: Travel lane; Defect Type: Longitudinal Crack; Severity Level: Severe).
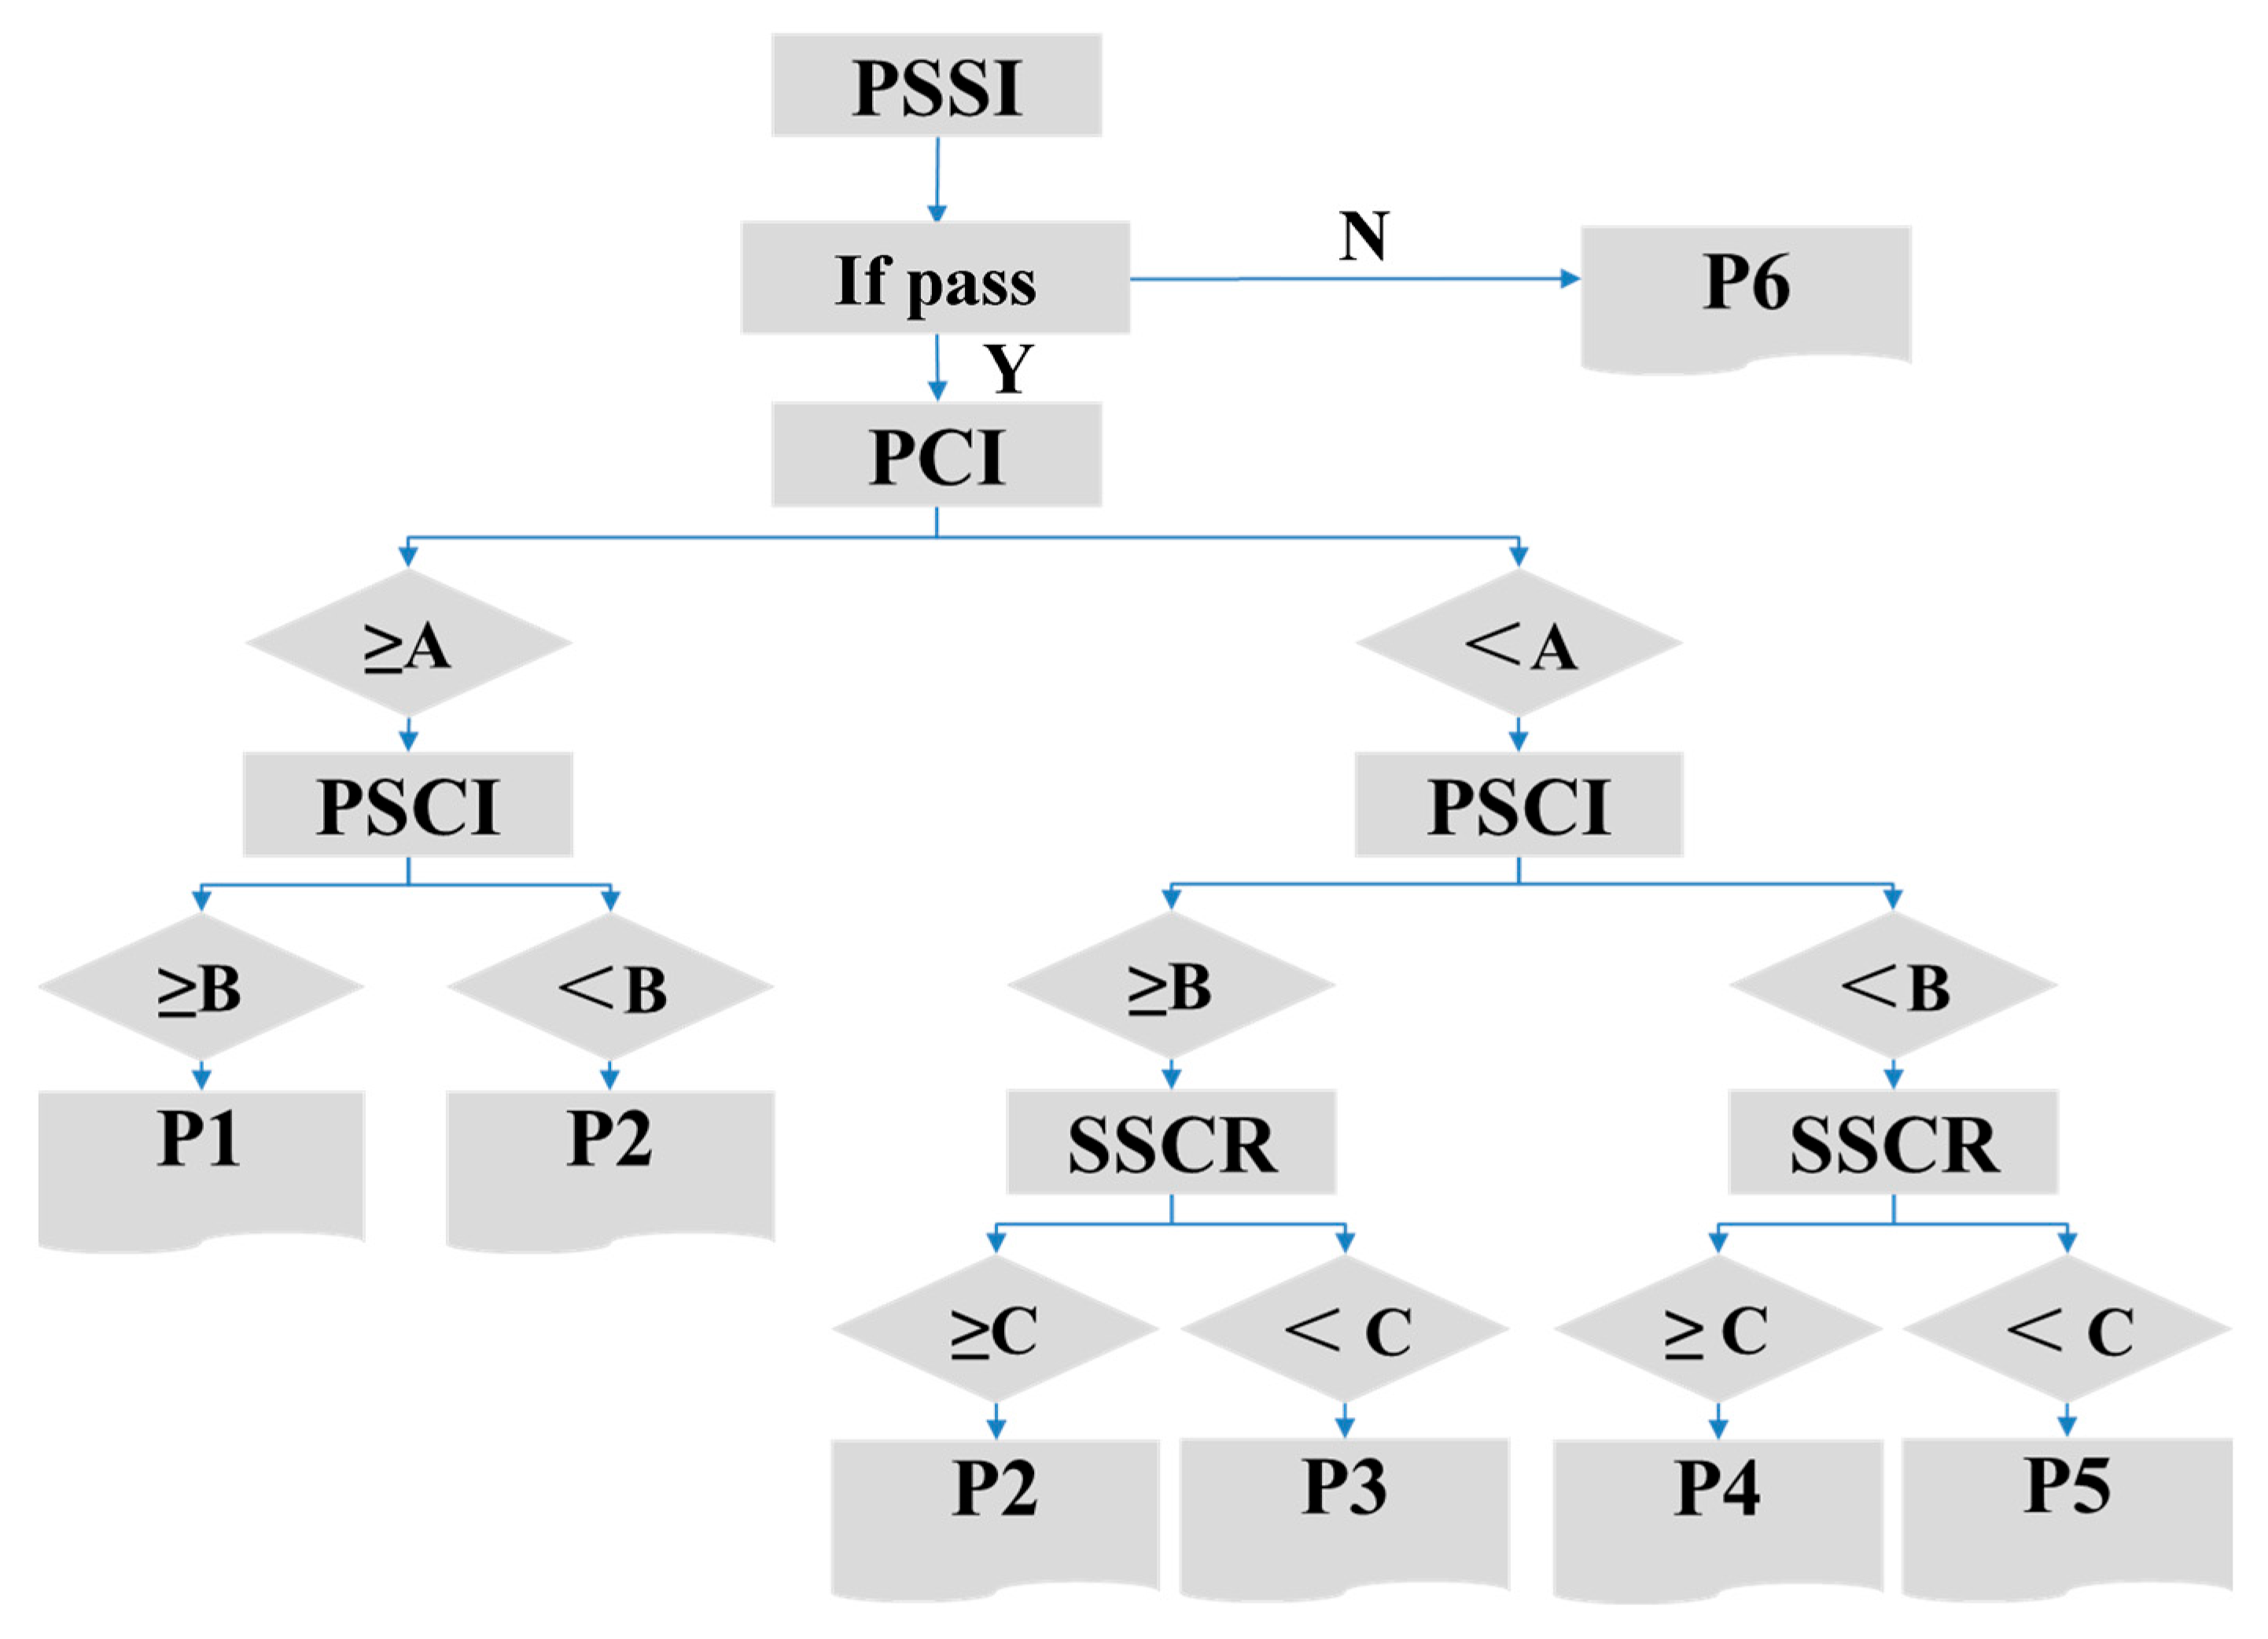
Figure 16.
Maintenance decision tree based on structural crack evaluation method.
Figure 16.
Maintenance decision tree based on structural crack evaluation method.
Table 1.
Typical pavement structure.
Table 1.
Typical pavement structure.
| Structural Layer | Material Type | Thickness/cm |
|---|
| Surface layer | SMA-13 | 4 |
| AK-16 | 4 |
| AC-20 | 5 |
| AC-25 | 6 |
| Base layer | Cement stabilized crushed stone | 2 × 18 |
| Subbase layer | Cement stabilized gravel | 18 |
Table 2.
Amount of various pavement surface distresses.
Table 2.
Amount of various pavement surface distresses.
| Surface Distress Type | Quantity (Occurrences) |
|---|
| Transverse cracks | 2141 |
| Longitudinal cracks | 1754 |
| Loosening | 109 |
| Alligator cracking | 32 |
| Potholes | 28 |
| Settling | 5 |
| Rutting | 2 |
| Block cracking | 3 |
| Total | 4074 |
Table 3.
The mean value and range of pavement deflection value and PSSI value.
Table 3.
The mean value and range of pavement deflection value and PSSI value.
| Data Type | Average Value | Range |
|---|
| Pavement deflection/0.01mm | 17.65 | 8.13~30.51 |
| PSSI | 93.355 | 57.63~99.68 |
Table 4.
The number of structural damage statistics.
Table 4.
The number of structural damage statistics.
| Structural Damage Type | Quantity (Occurrences) |
|---|
| Structural cracks | 836 |
| Poor bonding between surface and base layer | 99 |
| Poor bonding within base layer | 402 |
| Surface loosening | 7 |
| Base layer loosening | 38 |
| Uneven settling of subgrade | 3 |
| Total | 1405 |
Table 5.
The number and size of structural cracks based on ground penetrating radar detection.
Table 5.
The number and size of structural cracks based on ground penetrating radar detection.
| Type | Quantity (Count) | Length Range (m) | Depth Range (cm) | Width Range (mm) |
|---|
| Cracks only in base layer | 693 | 1.5–13 | 18–54 | 0–5 |
| Cracks only in surface layer | 30 | 1.5–4.5 | 0–18 | 0–4 |
| Cracks in both surface and base | 113 | 1.5–23 | 0–54 | 0–6 |
Table 6.
Core sample information statistics.
Table 6.
Core sample information statistics.
| Core Sample Quantity and Proportion | Structural Layer Integrity Evaluation |
|---|
| Intact Structural Layer | Severe Damage to Surface or Base Layer |
|---|
| Crack Condition | Cracks penetrating both surface and base layers | 0 | 42 samples, accounting for 58.3% |
| Cracks penetrating the surface layer | 0 | 17 samples, accounting for 23.6% |
| Cracks existing in both surface and base layers | 1 sample, accounting for 1.4% | 4 samples, accounting for 5.6% |
| Cracks existing in the base layer | 3 samples, accounting for 4.2% | 5 samples, accounting for 6.9% |
Table 7.
Material parameter table of each structural layer of road.
Table 7.
Material parameter table of each structural layer of road.
| Layer | Material | Thickness/cm | Dynamic Compression Modulus/MPa | Elastic Modulus /MPa | Damping Coefficient | Density/kg/m3 |
|---|
| Surface Layer | SMA13-
SBS Modified Asphalt | 4 | 8600 | | 0.05 | 2400 |
| AC20 | 6 | 9200 | | 0.05 | 2390 |
| AC25 | 8 | 9200 | | 0.05 | 2380 |
| Base Layer | Cement Stabilized Gravel | 18 | | 11,500 | 0.8 | 2400 |
| Cement Stabilized Gravel | 18 | | 11,500 | 0.8 | 2400 |
| Sub-base Layer | Cement Stabilized Sand-Gravel | 18 | | 10,000 | 0.8 | 2400 |
| Subgrade | Low Plasticity Clay | — | | 60 | 0.4 | 1800 |
Table 8.
Relaxation modulus viscoelastic Prony series of each asphalt mixture.
Table 8.
Relaxation modulus viscoelastic Prony series of each asphalt mixture.
| Relaxation Time/s | SMA13 | AC20 | AC25 |
|---|
| 0.0001 | 0.12734 | 0.09046 | 0.07845 |
| 0.001 | 0.17877 | 0.13667 | 0.11686 |
| 0.01 | 0.25998 | 0.22808 | 0.20089 |
| 0.1 | 0.21919 | 0.25391 | 0.24342 |
| 1 | 0.12627 | 0.19037 | 0.21453 |
| 10 | 0.04332 | 0.07047 | 0.10207 |
| 100 | 0.02001 | 0.02166 | 0.03189 |
| 1000 | 0.00473 | 0.00388 | 0.00725 |
| 10,000 | 0.00417 | 0.00251 | 0.00262 |
| 10,0000 | 0.00082 | 0.00022 | 0.00074 |
| Transient shear modulus (20 °C)/MPa | 7902 | 6911 | 8173 |
Table 9.
Deflection test 9 measuring point location distribution.
Table 9.
Deflection test 9 measuring point location distribution.
| Sensor Number | D1 | D2 | D3 | D4 | D5 | D6 | D7 | D8 | D9 |
|---|
| Distance/cm | 0 | 20 | 30 | 45 | 60 | 90 | 120 | 150 | 180 |
Table 10.
The width, length, and height of structural cracks in the simulation model.
Table 10.
The width, length, and height of structural cracks in the simulation model.
| | Width/mm | 1 | 2 | 3 | 4 | 5 | 10 | 15 |
|---|
| Length/m | |
|---|
| 1.87 | √ | √ | √ | √ | √ | √ | √ |
| 3.75 | √ | √ | √ | √ | √ | √ | √ |
| 7.5 | √ | √ | √ | √ | √ | √ | √ |
| 10.50 | √ | √ | √ | √ | √ | √ | √ |
| The location of the structural layer where the crack develops | Cracks develop from the bottom of the base layer upwards. For each width and length, there are four possible development scenarios: extending to the bottom of the lower layer, the bottom of the middle layer, the bottom of the upper layer, and the road surface. |
Table 11.
Grading standard of pavement structure condition based on structural crack evaluation.
Table 11.
Grading standard of pavement structure condition based on structural crack evaluation.
| Evaluation Index | Excellent | Good | Medium |
|---|
| PSCI | ≥90 | ≥80, <90 | ≥70, <80 |
Table 12.
Comprehensive Evaluation and Classification of Structural and Surface Cracks.
Table 12.
Comprehensive Evaluation and Classification of Structural and Surface Cracks.
| Evaluation Index | Excellent | Good |
|---|
| SCRR | ≥1 | <1 |
Table 13.
The analytic hierarchy process and entropy weight method combined valuation method.
Table 13.
The analytic hierarchy process and entropy weight method combined valuation method.
| Judgment matrix | | Structural Cracks in the Base Layer | Structural Cracks in Both the Surface Layer and the Base Layer | Structural Cracks in the Surface Layer |
| Structural cracks existing in the base layer | 1 | 5 | 7 |
| Structural cracks existing in both the surface layer and the base layer | 1/5 | 1 | 3 |
| Structural cracks existing in the surface layer | 1/7 | 1/3 | 1 |
| 0.2 | 0.7 | 0.1 |
| 0.8 | 0.2 | 0 |
| 1.1 | 1 | 0.1 |
Table 14.
The cluster center summary.
Table 14.
The cluster center summary.
| | N = 2 | N = 3 | N = 4 |
|---|
| Cluster center | 0.053 | 0.017 | 0.002 |
| 0.607 | 0.362 | 0.208 |
| | 0.92 | 0.454 |
| | | 0.961 |
Table 15.
Detect the range of road section evaluation indicators.
Table 15.
Detect the range of road section evaluation indicators.
| Evaluation Indicator | Overall Assessment Result | Percentage of Pavement Sections in Different Evaluation Grades |
|---|
| Excellent | Good and Below |
|---|
| Structural crack evaluation index (PSCI) | 92.391 | 75.5% | 24.5% |
| Structural crack reflection ratio (SCRR) | 0.340 | 19.8% | 80.2% |
| Pavement structural strength index (PSSI) | 93.355 | 95.9% | 4.1% |
| Invisible crack rate (ICR) (%) | 0.278 | 82.7% | 17.3% |
Table 16.
Detection section classification standard.
Table 16.
Detection section classification standard.
| Pavement Condition Type | PSSI | PCI | PSCI | SCRR |
|---|
| I | Meets requirements | ≥A | ≥B | — |
| II | <B | — |
| III | <A | ≥B | ≥C |
| IV | <C |
| V | <B | ≥C |
| VI | <C |
| VII | Does not meet requirements | — |
Table 17.
Evaluation index standard value reference range.
Table 17.
Evaluation index standard value reference range.
| Indicator Name | PCI | PSCI | SCRR |
|---|
| A | B | C |
|---|
| Reference Value | 87~92 | 80~90 | 1 |
Table 18.
Standard for grading the intensity of conservation measures.
Table 18.
Standard for grading the intensity of conservation measures.
| Strength Grade | Maintenance Measures |
|---|
| P1 | Routine Maintenance Measures: Crack sealing, joint sealing, and other routine maintenance measures |
| P2 | Surface Functional Maintenance Measures: Fog seal, microsurfacing, thin overlay, in-situ hot recycling, and grouting |
| P3 | Milling and Overlay with Local Crack Treatment: Milling and repaving the surface layer, or adding an additional layer, with localized crack treatment |
| P4 | Milling and Repaving of Middle and Upper Layers with Local Crack Treatment: Milling and repaving the middle and upper layers, or milling and overlaying one layer with two additional layers |
| P5 | Milling and Repaving of the Surface Layer with Local Crack Treatment: Milling and repaving the surface layer, or milling two layers and adding three layers. |
| P6 | Milling and Repaving of Surface Layer and Base Layer: Milling and re-paving both the surface layer and base layer. |


 ,
, 


