
Characterization of Force Distribution and Force Chain Topology in Asphalt Mixtures Using the Discrete Element Method

 , , ,
, , , 
Abstract
1. Introduction
2. Materials and Methods
2.1. Materials and Gradations
2.2. DEM Simulation of Asphalt Mixtures
2.2.1. Contact Parameters of Simulation Model
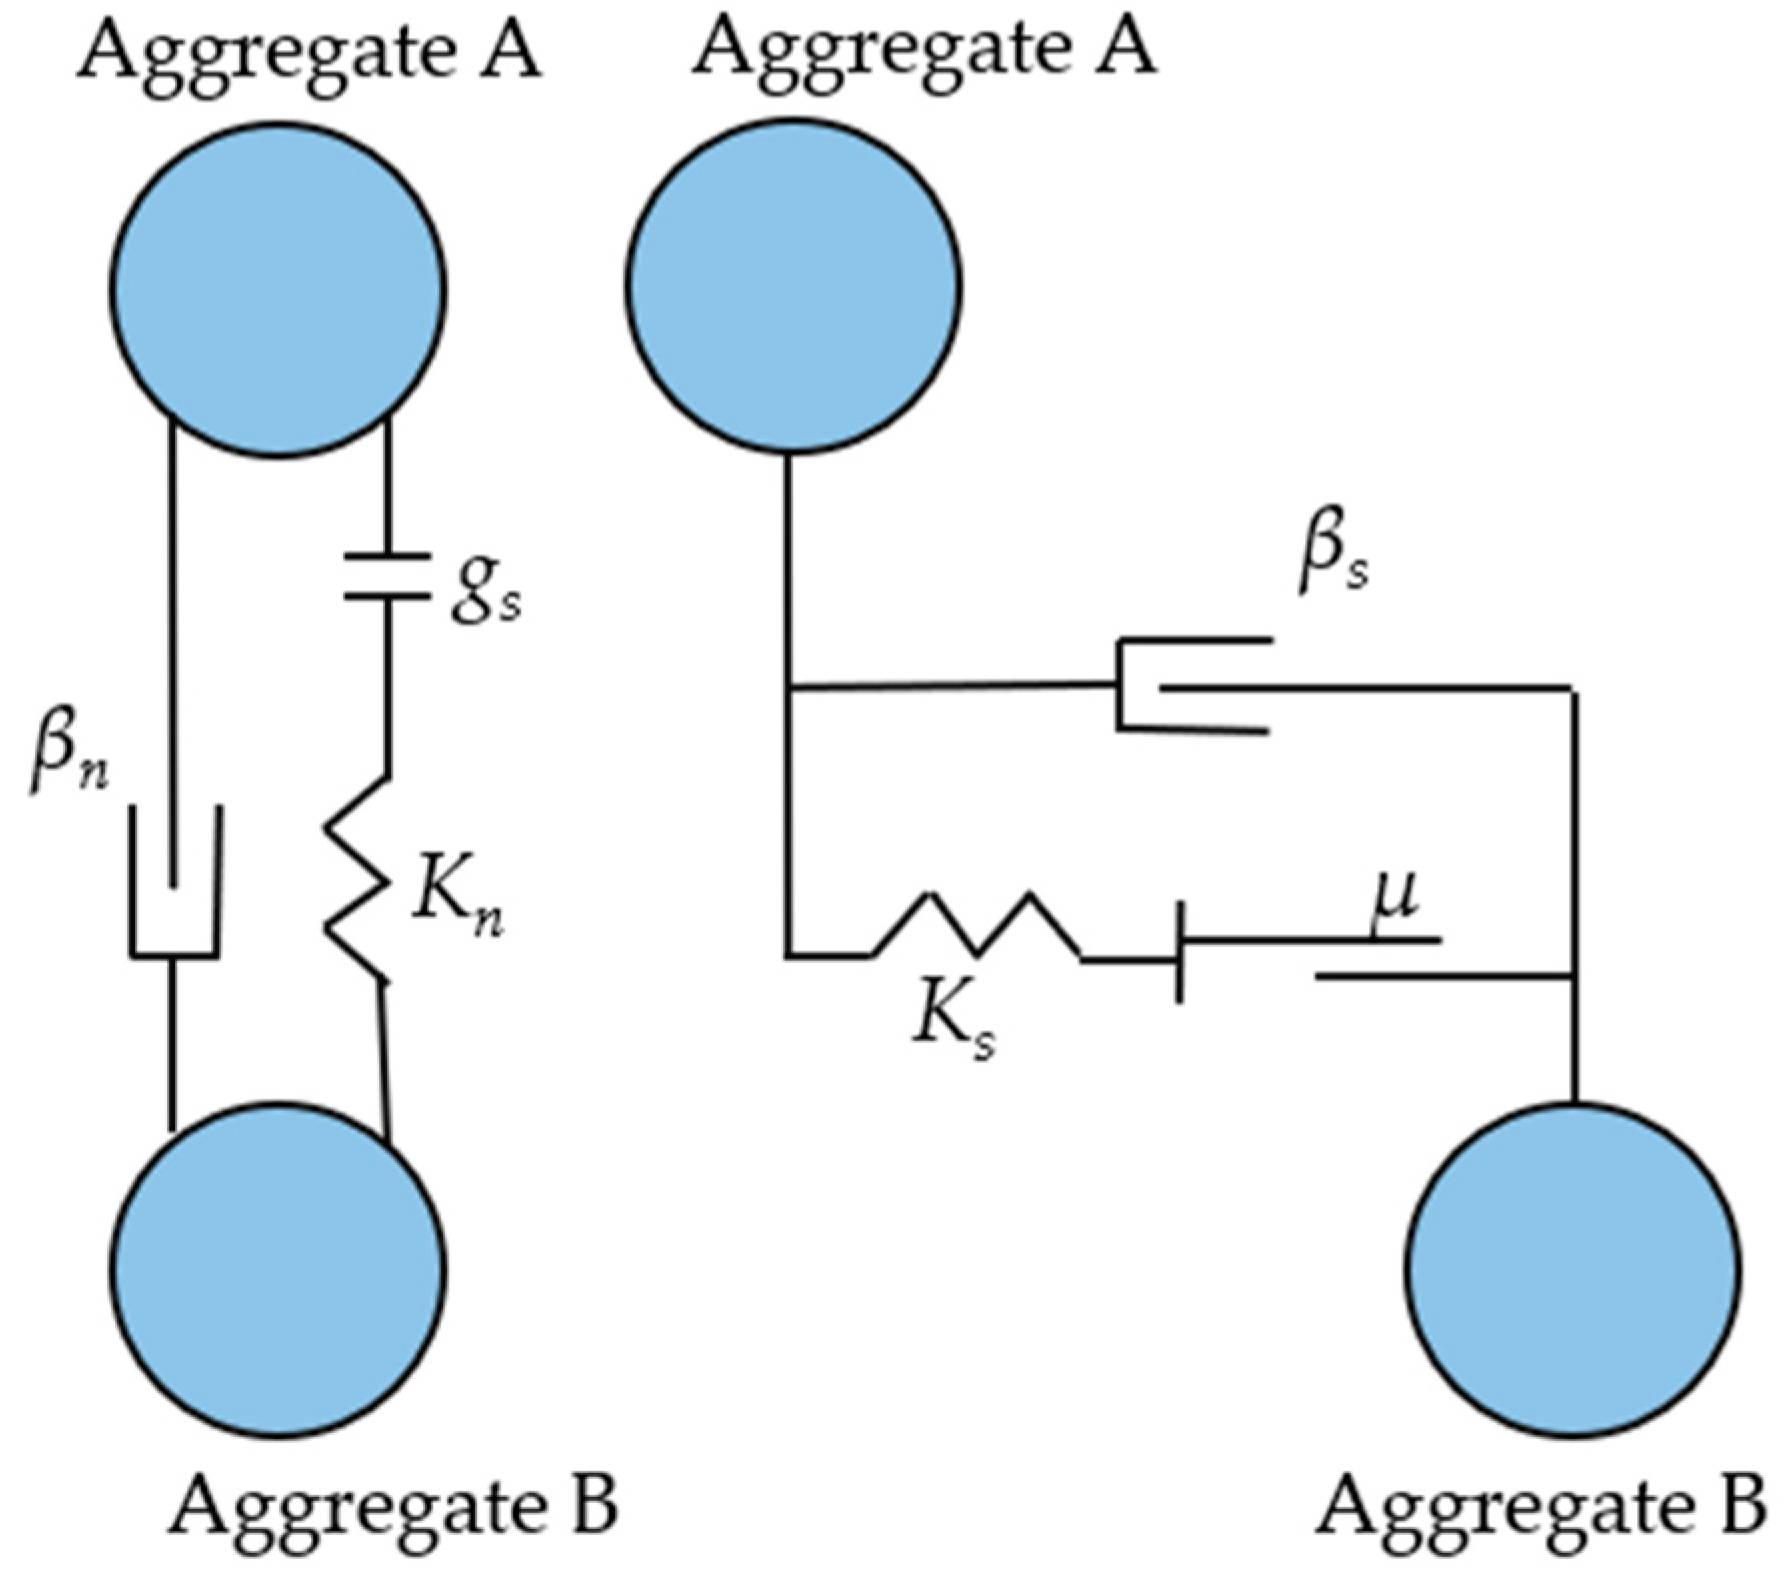
- (1)
- Linear contact model of coarse aggregates
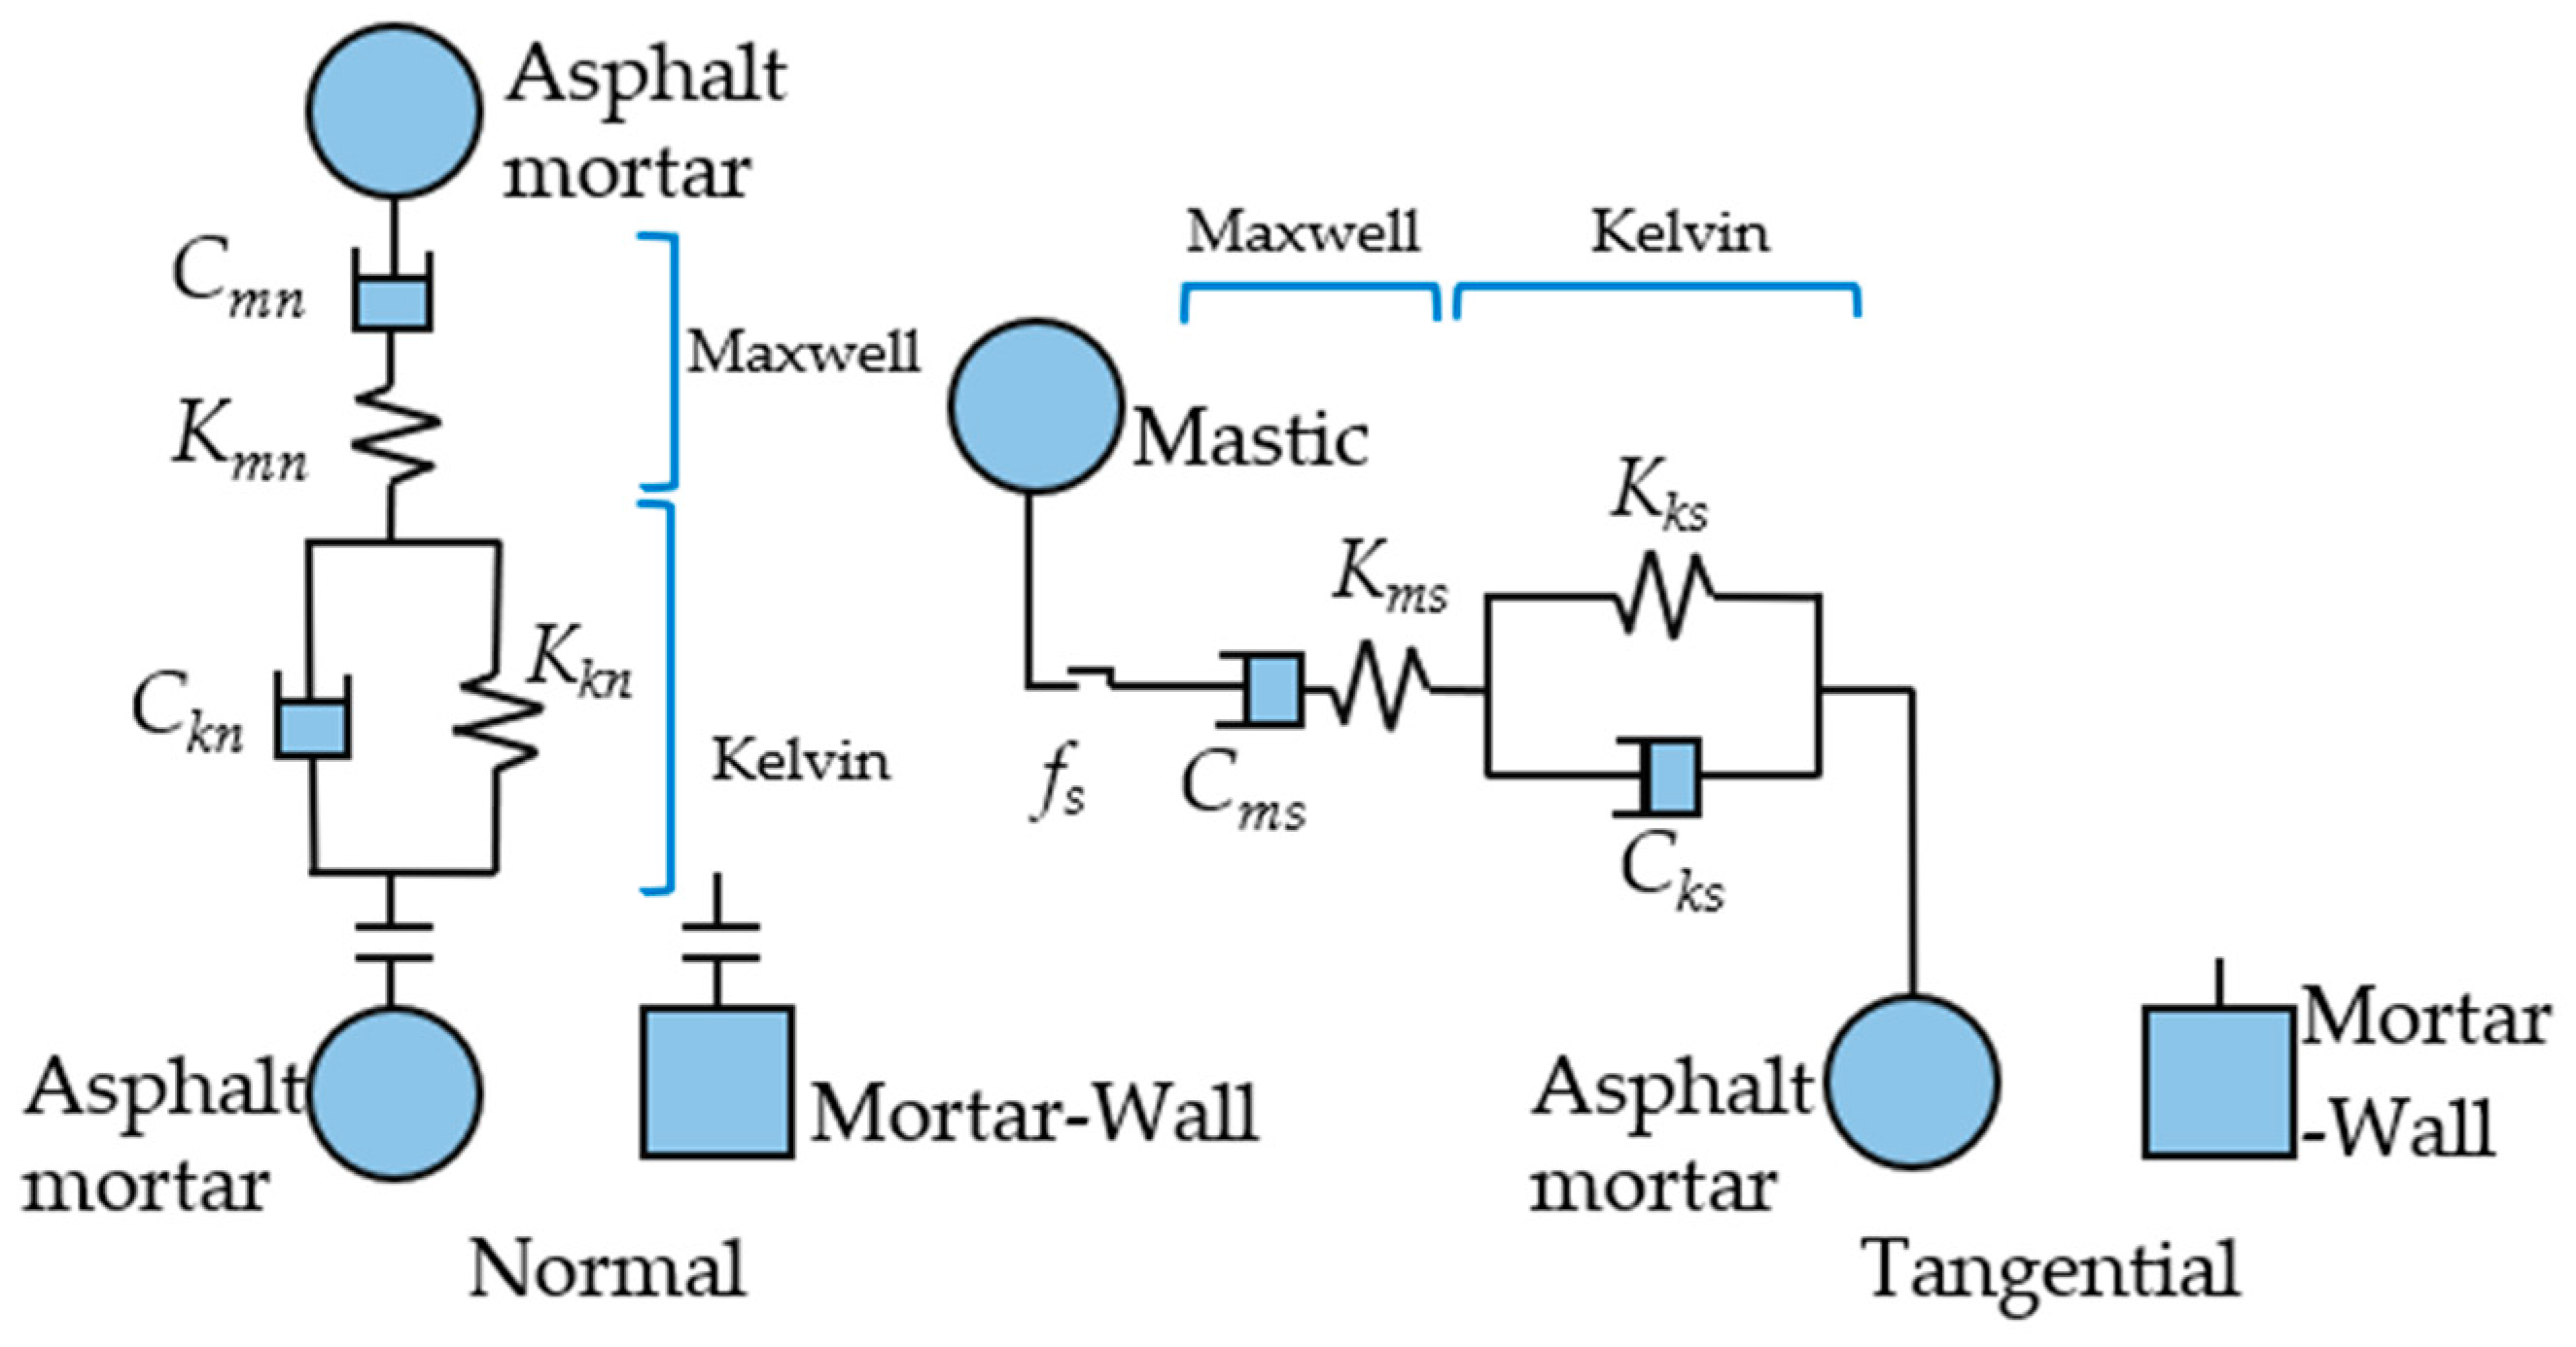
- (2)
- Burger’s model of asphalt mortar
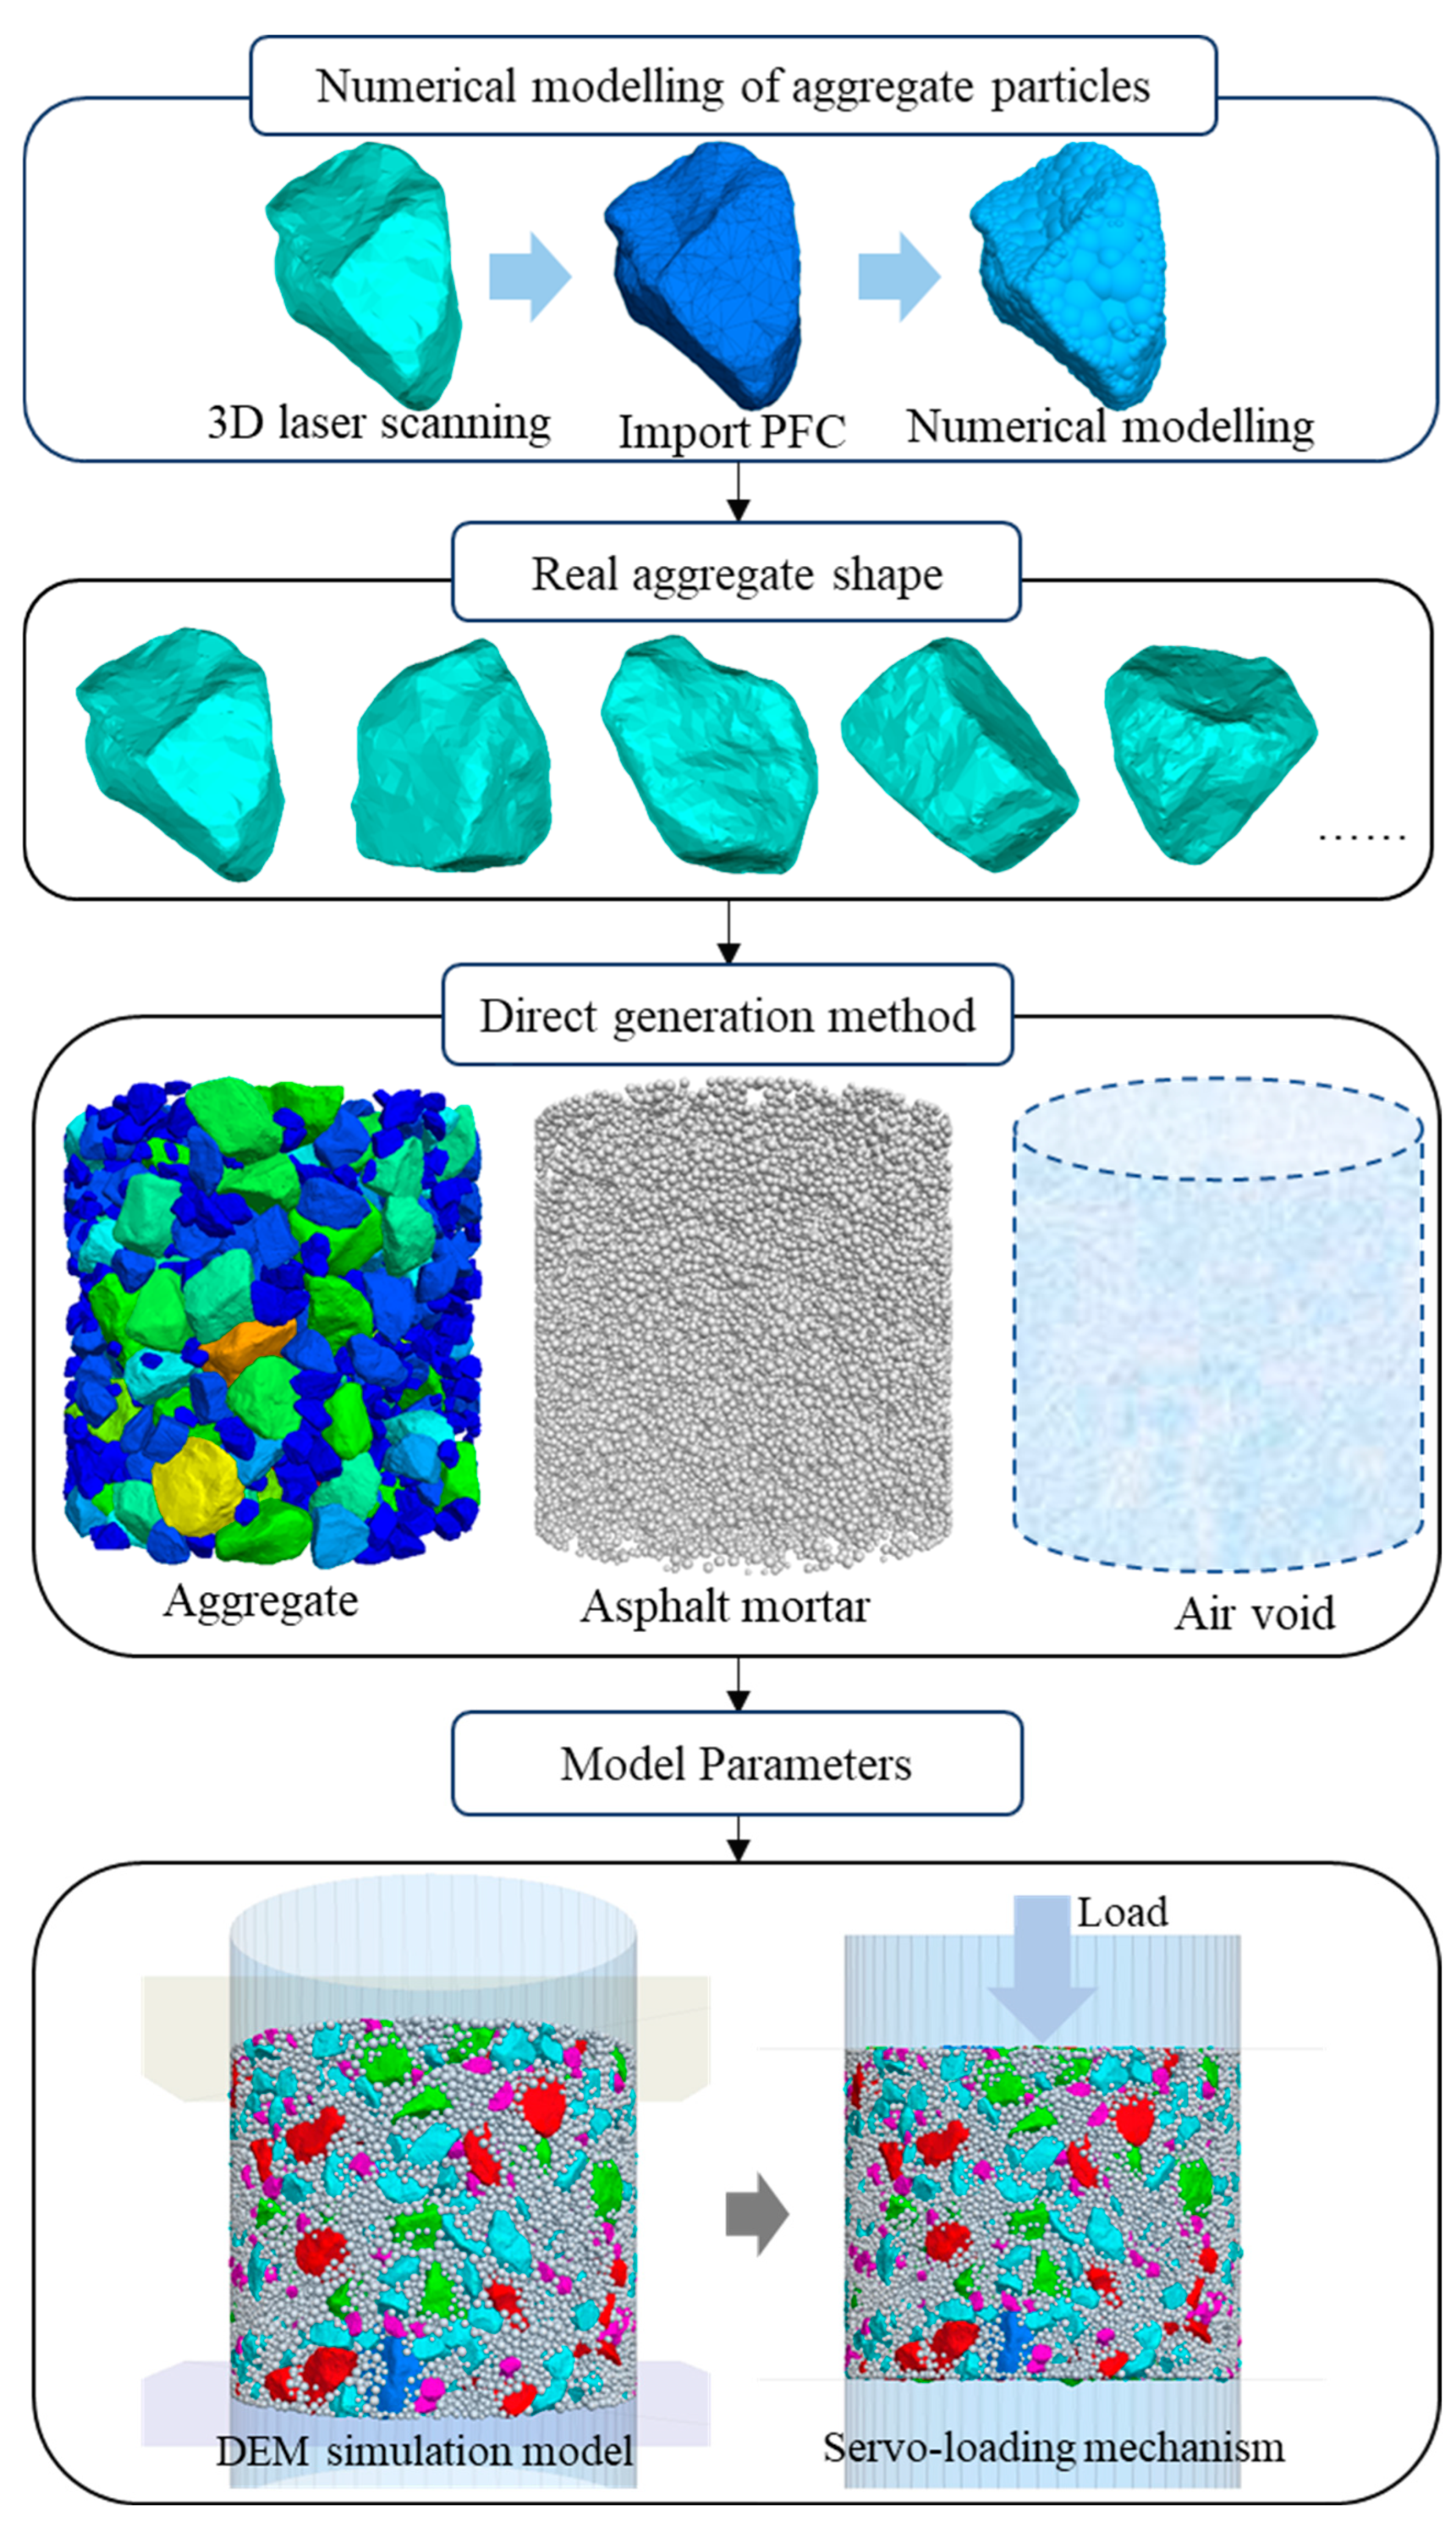
2.2.2. Simulation Process
- (1)
- Numerical model of aggregate particles
- (2)
- Distribution of component materials
- (3)
- Parameter settings
- (4)
- Compaction process
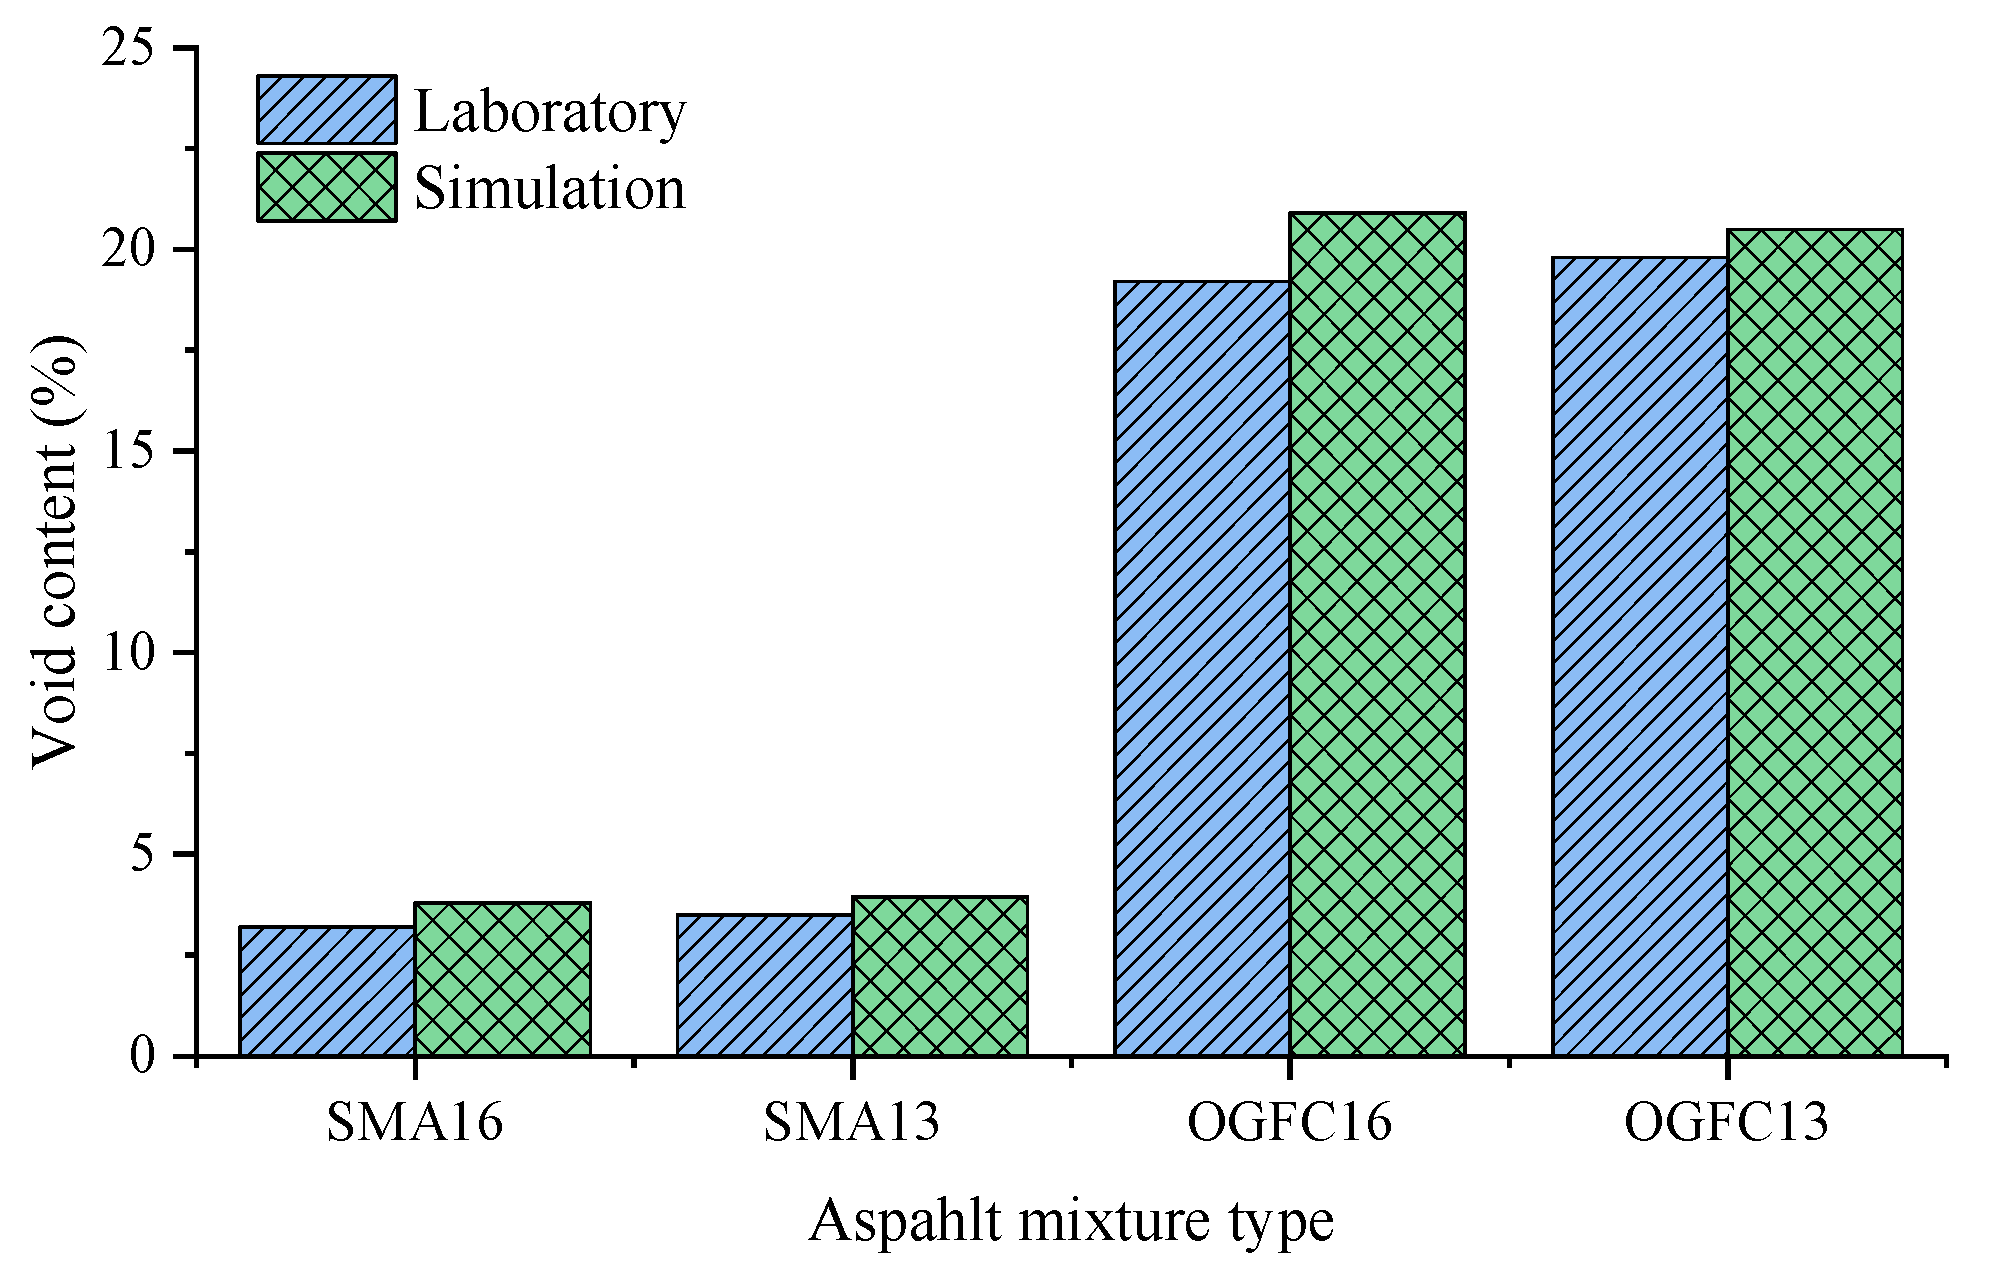
2.2.3. Simulation Model Validation
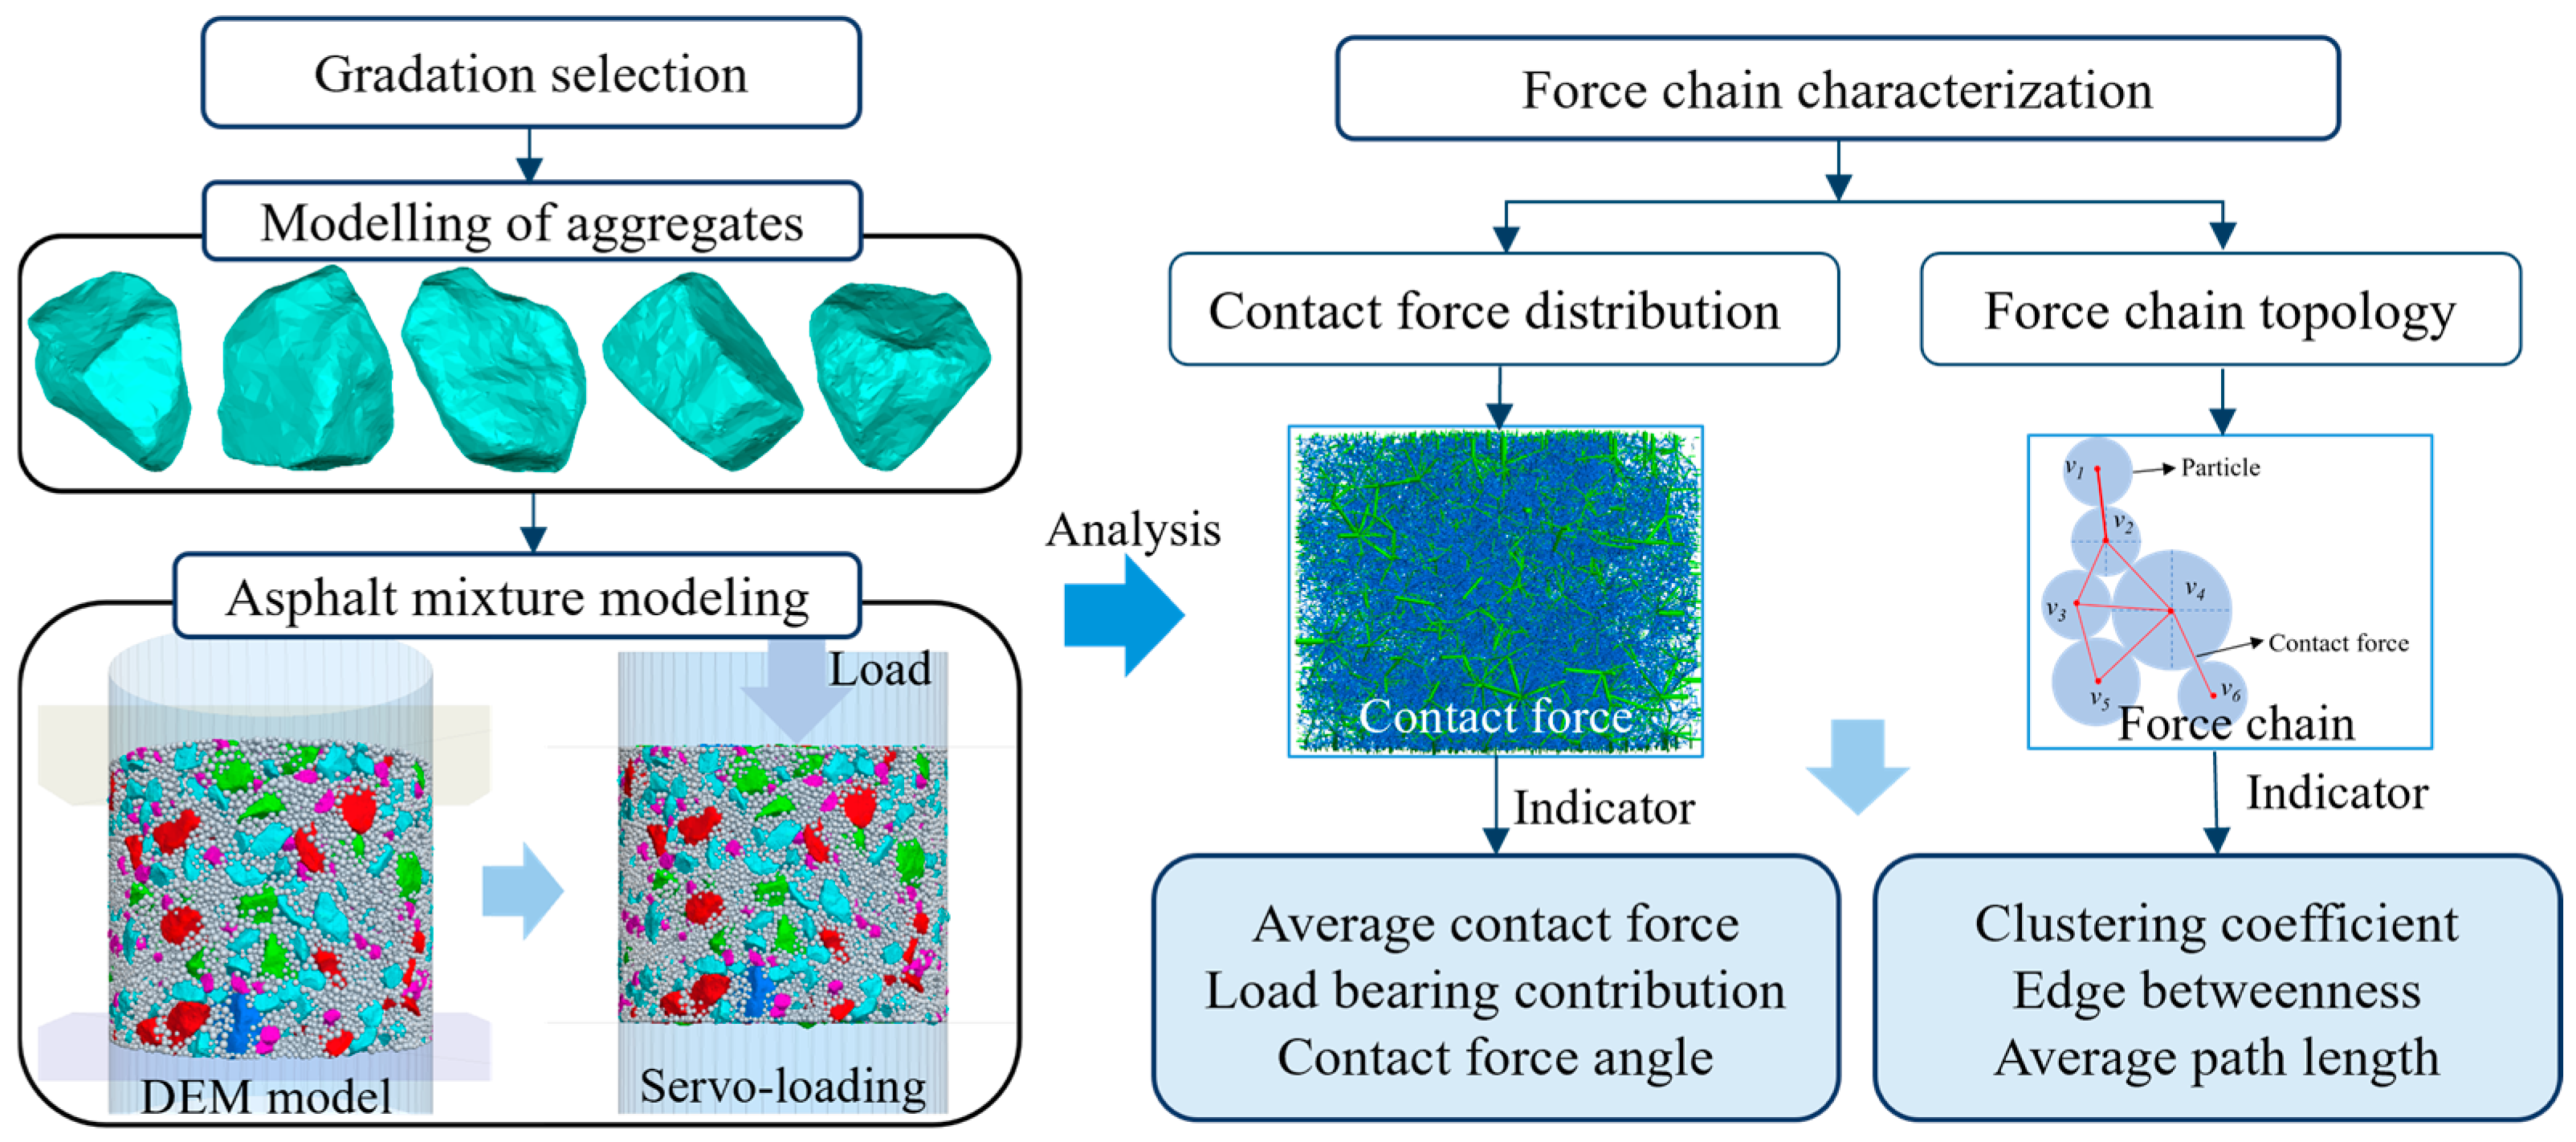
3. Force Chain Characterization Indicators
3.1. Contact Force Distribution Characteristics Indicators
3.1.1. Average Contact Force
3.1.2. Load Bearing Contribution
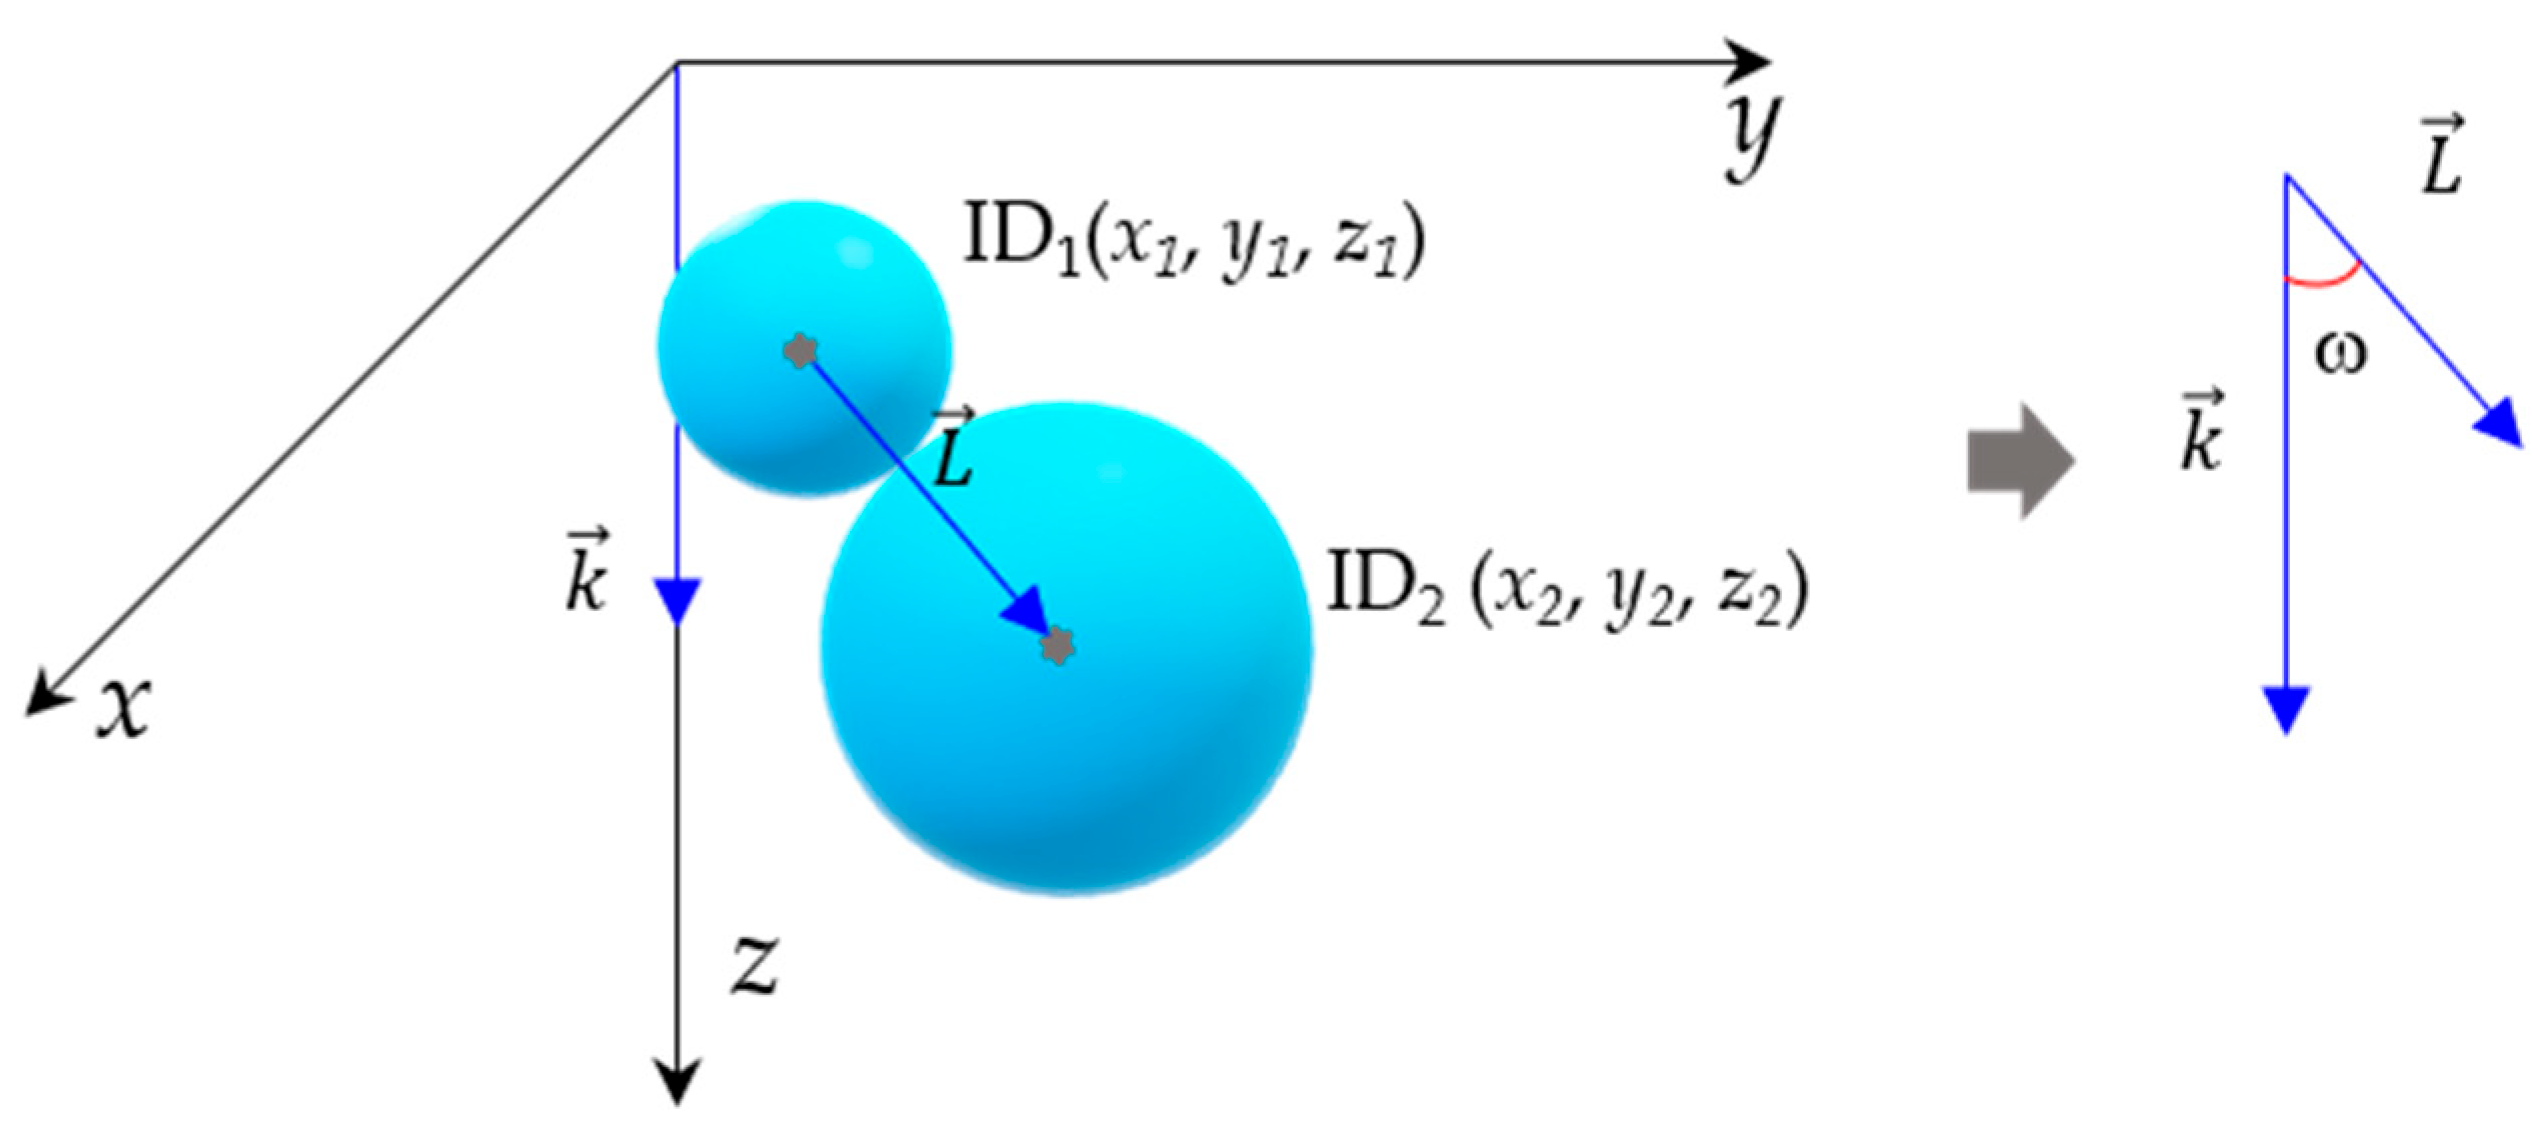
3.1.3. Contact Force Angle
3.2. Topology Characterization Indicator of Force Chain
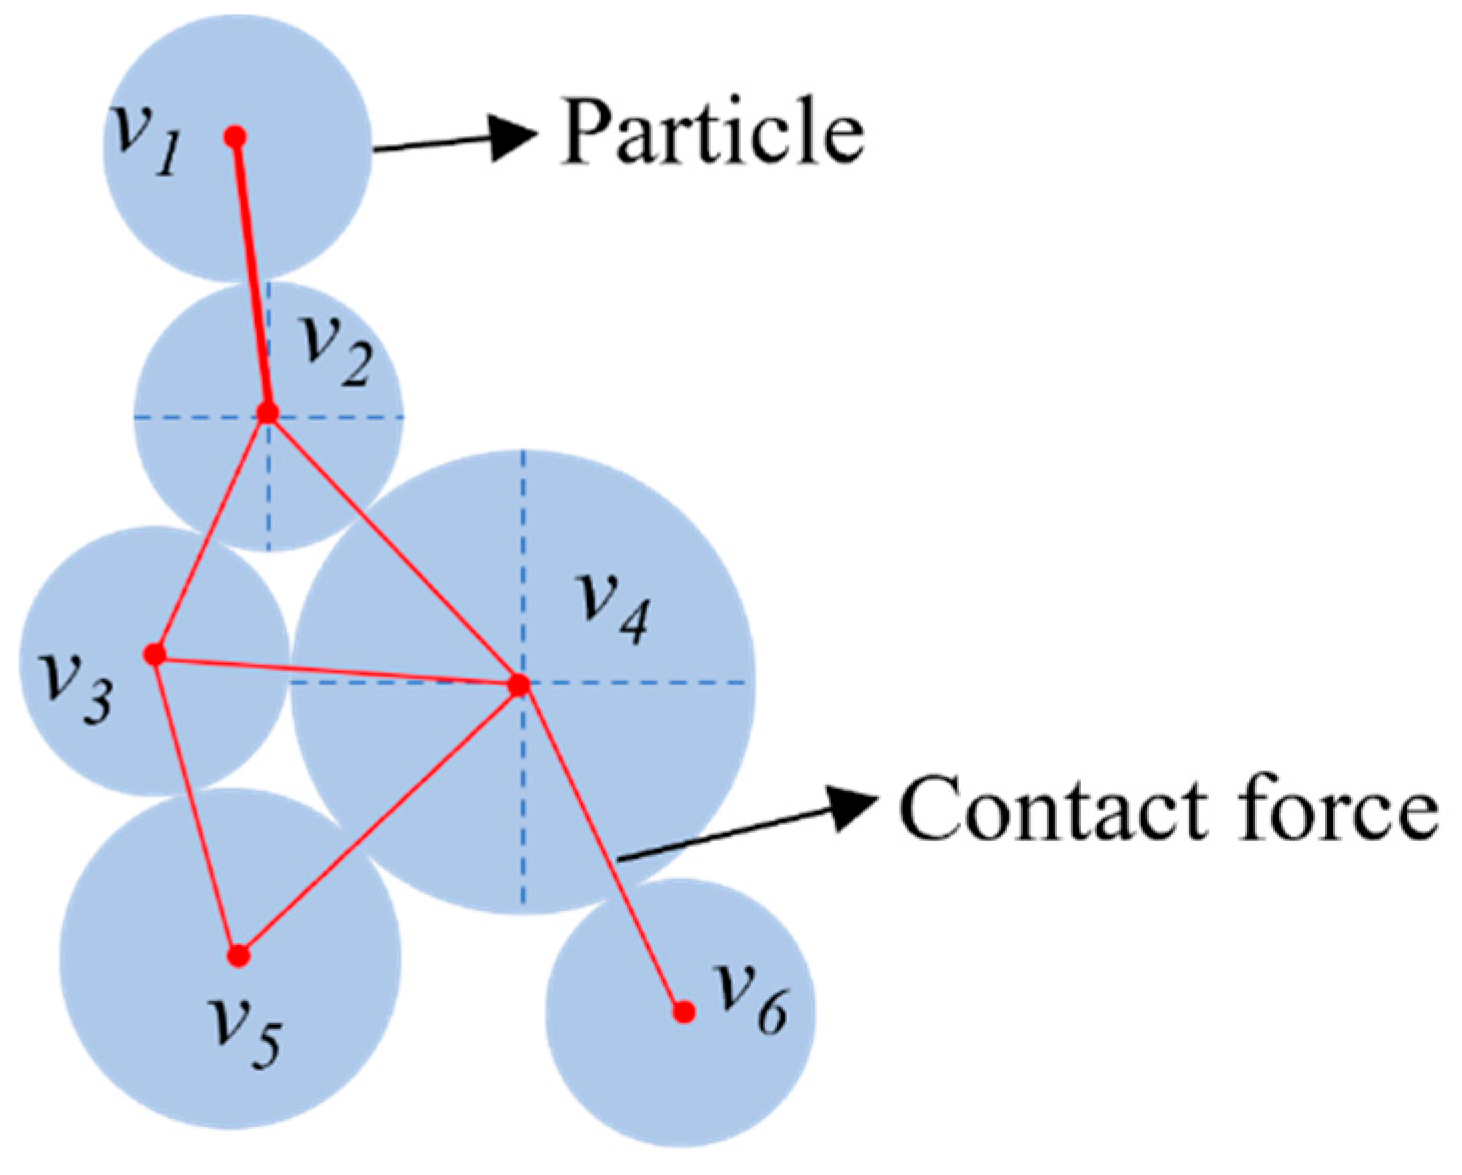
3.2.1. Topology Theory
3.2.2. Clustering Coefficient
3.2.3. Edge Betweenness
3.2.4. Average Path Length
4. Results and Discussion
4.1. Contact Force Distribution Characteristics in Asphalt Mixtures
4.1.1. Average Contact Force of Particles
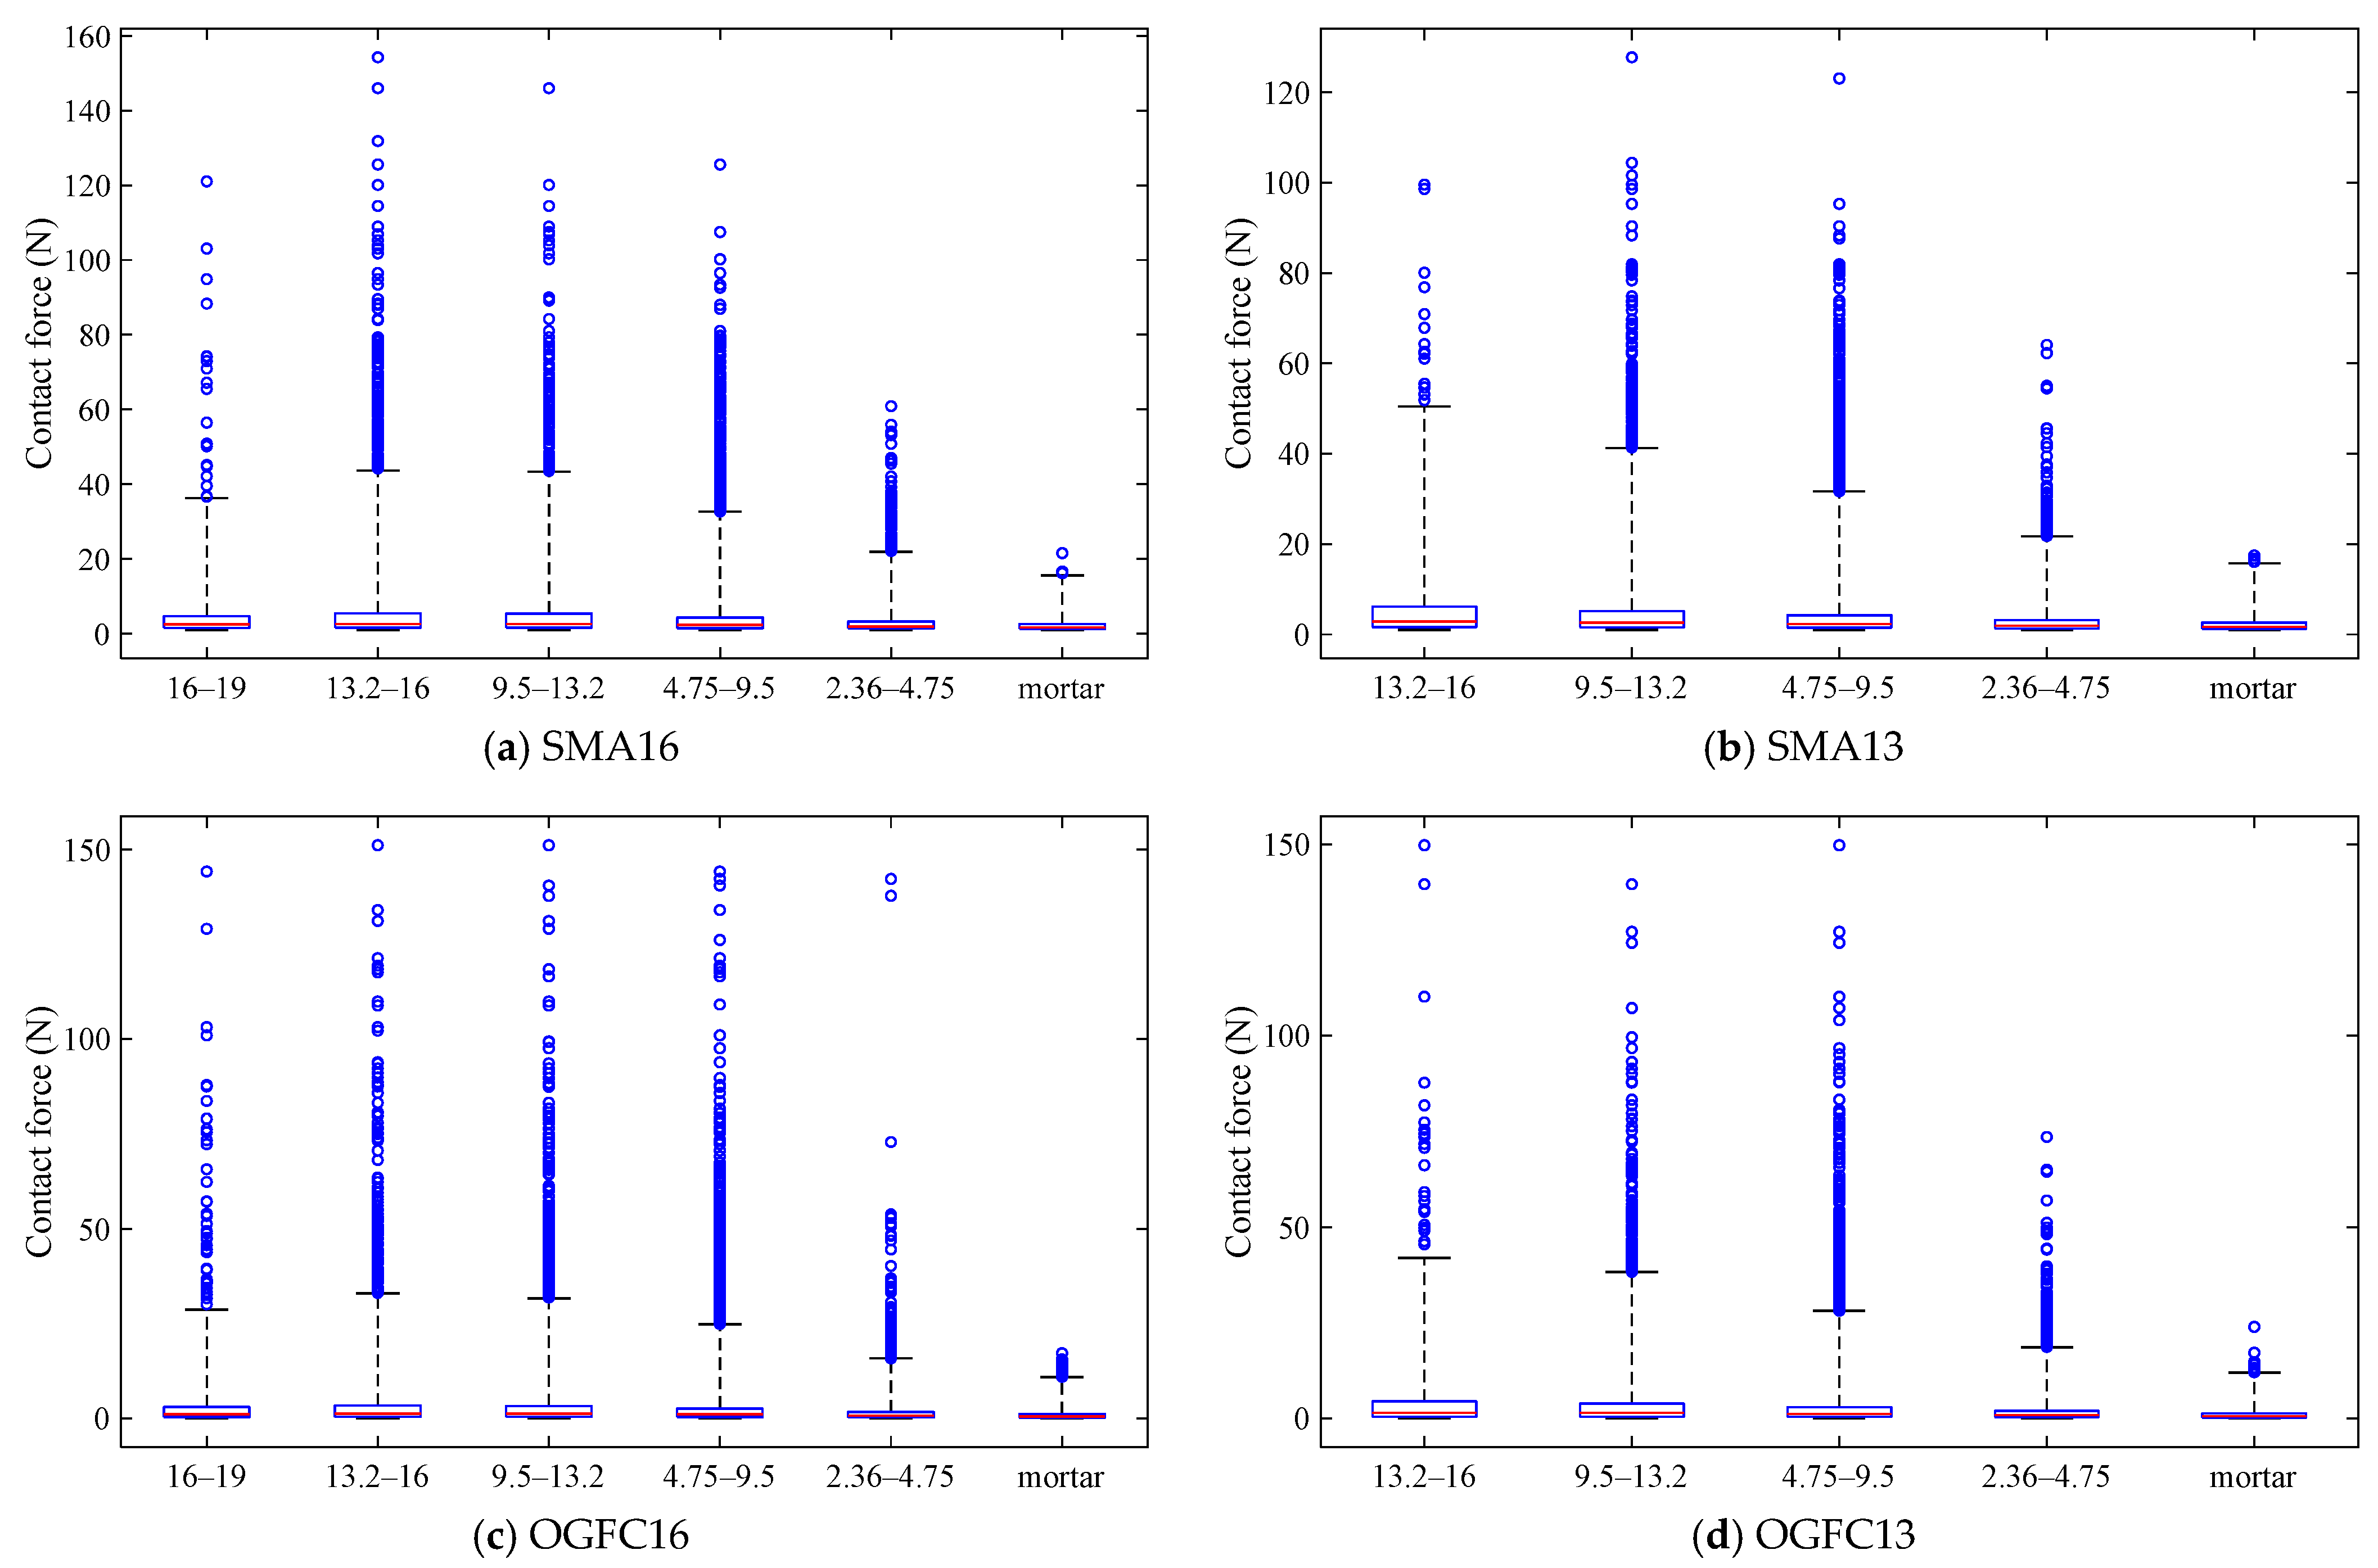
- (1)
- Contact force distribution
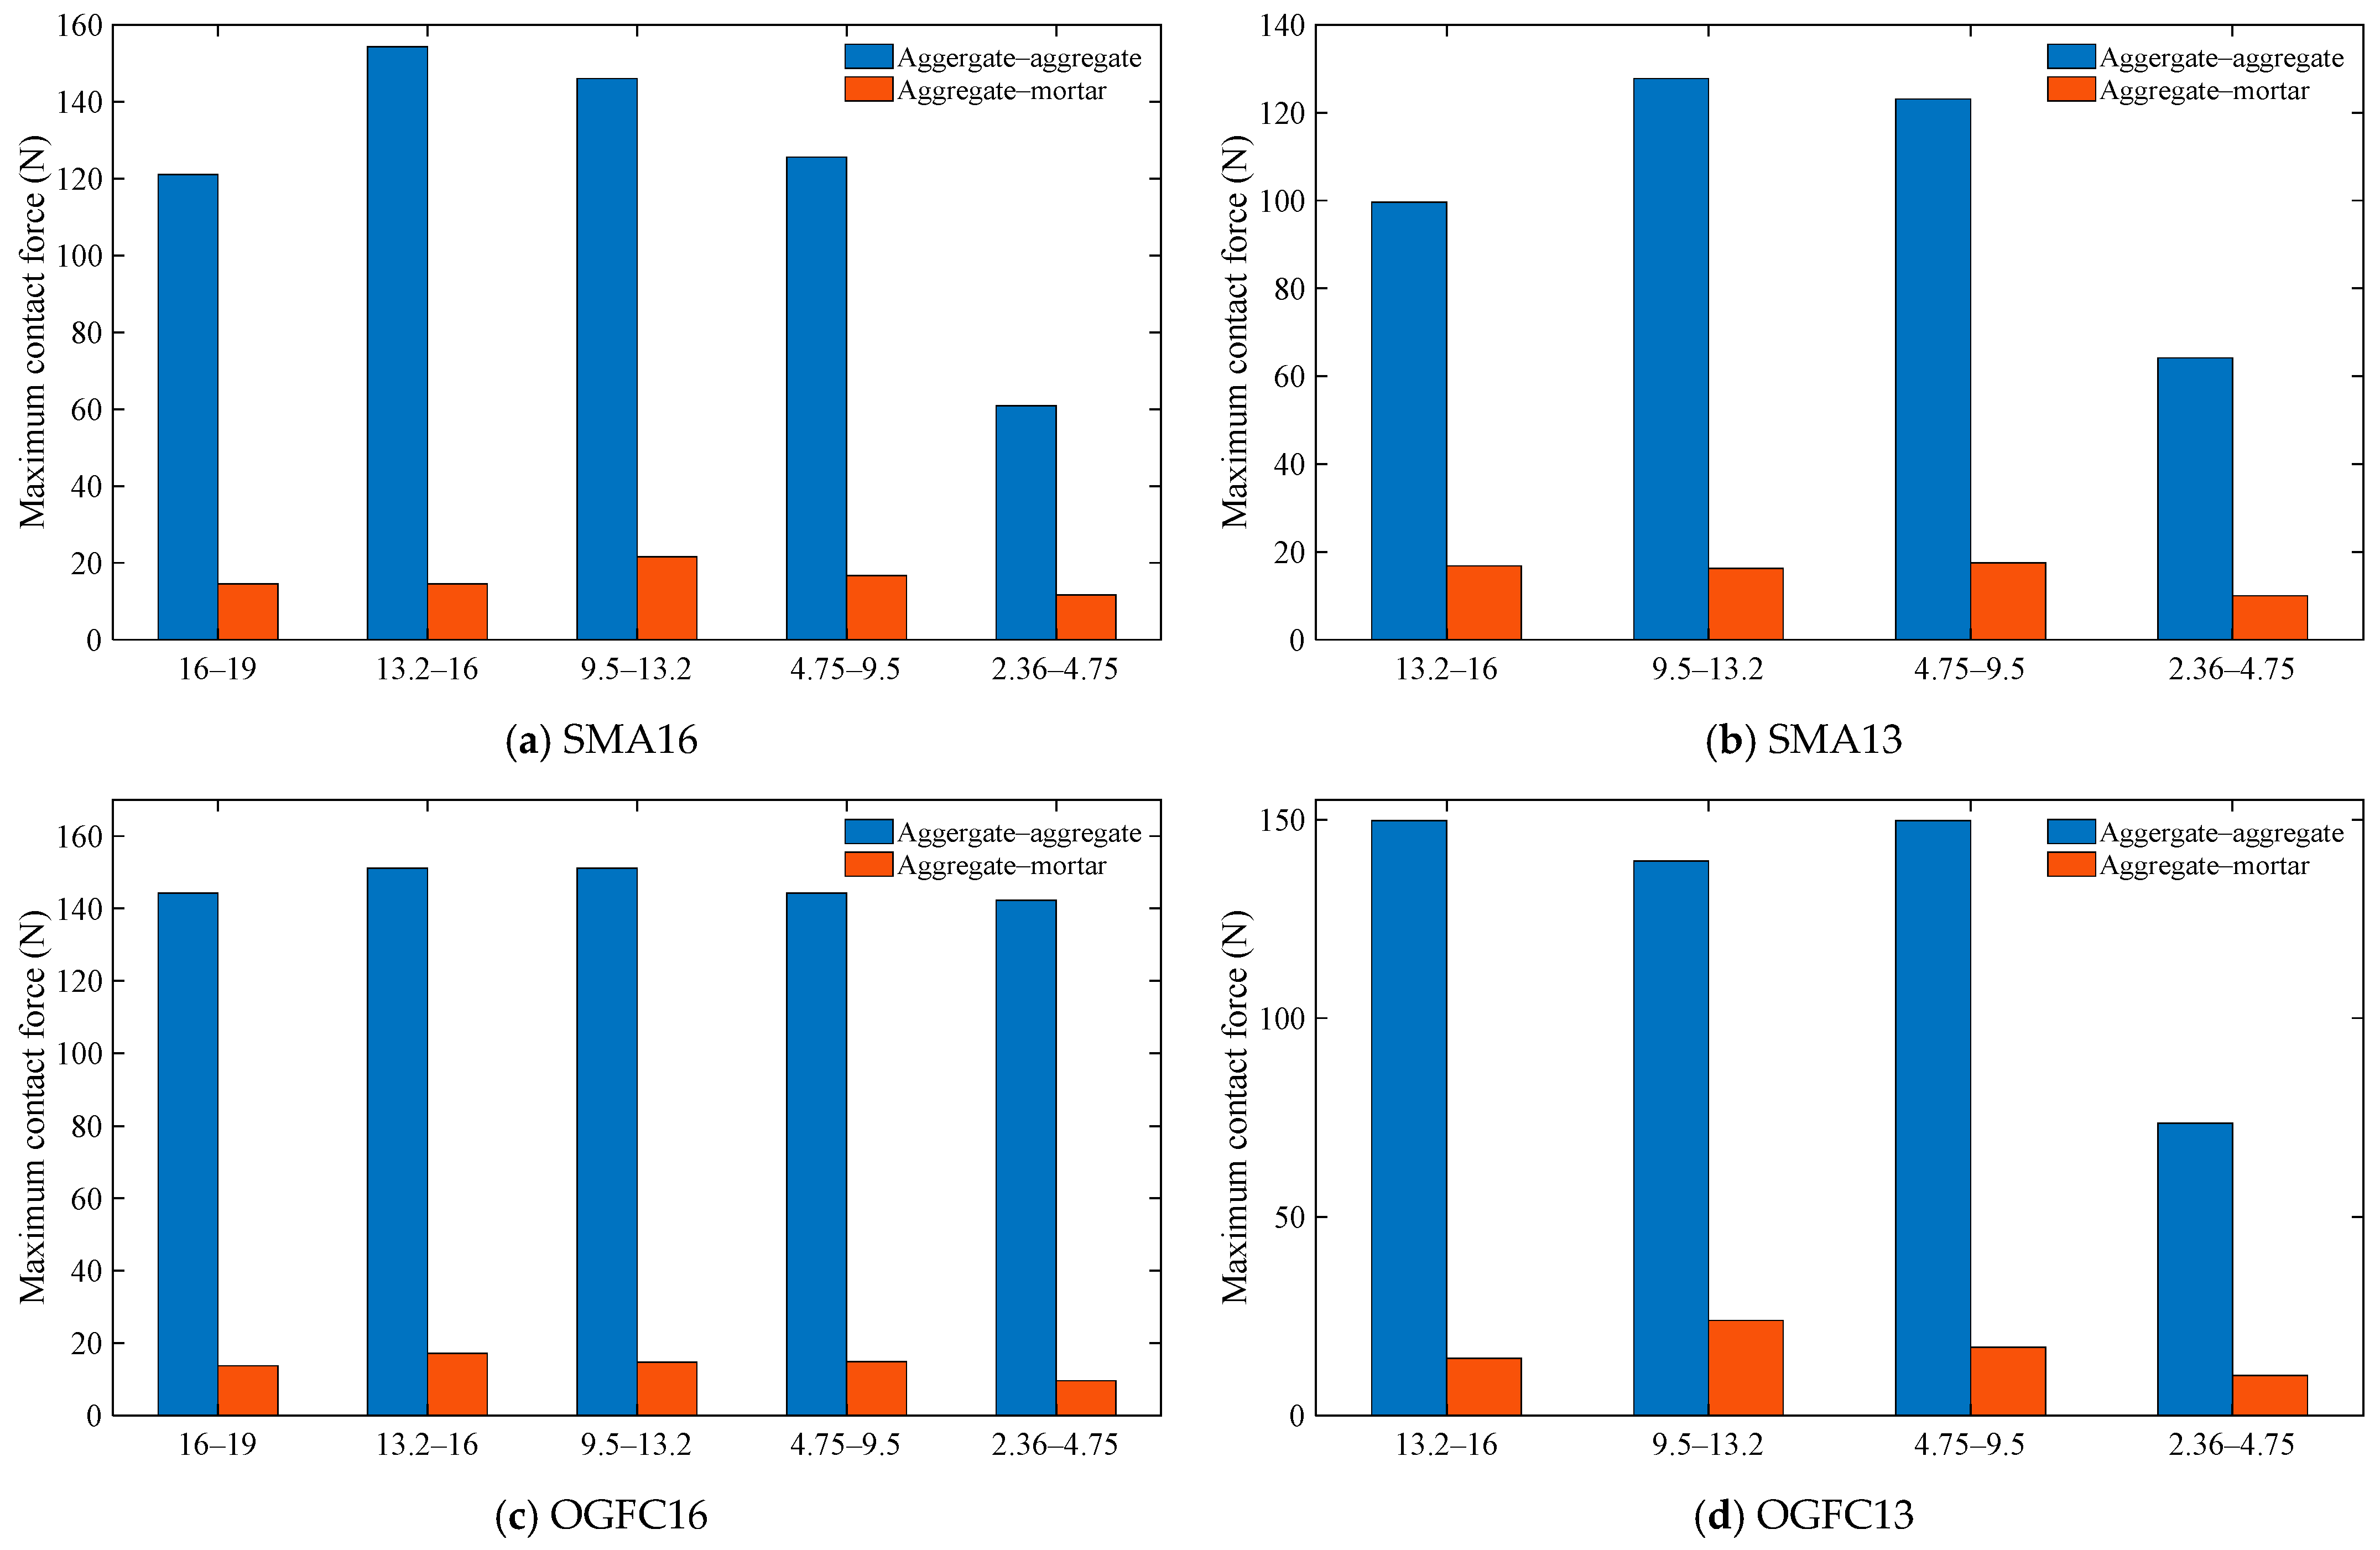
- (2)
- Maximum contact force and average contact force
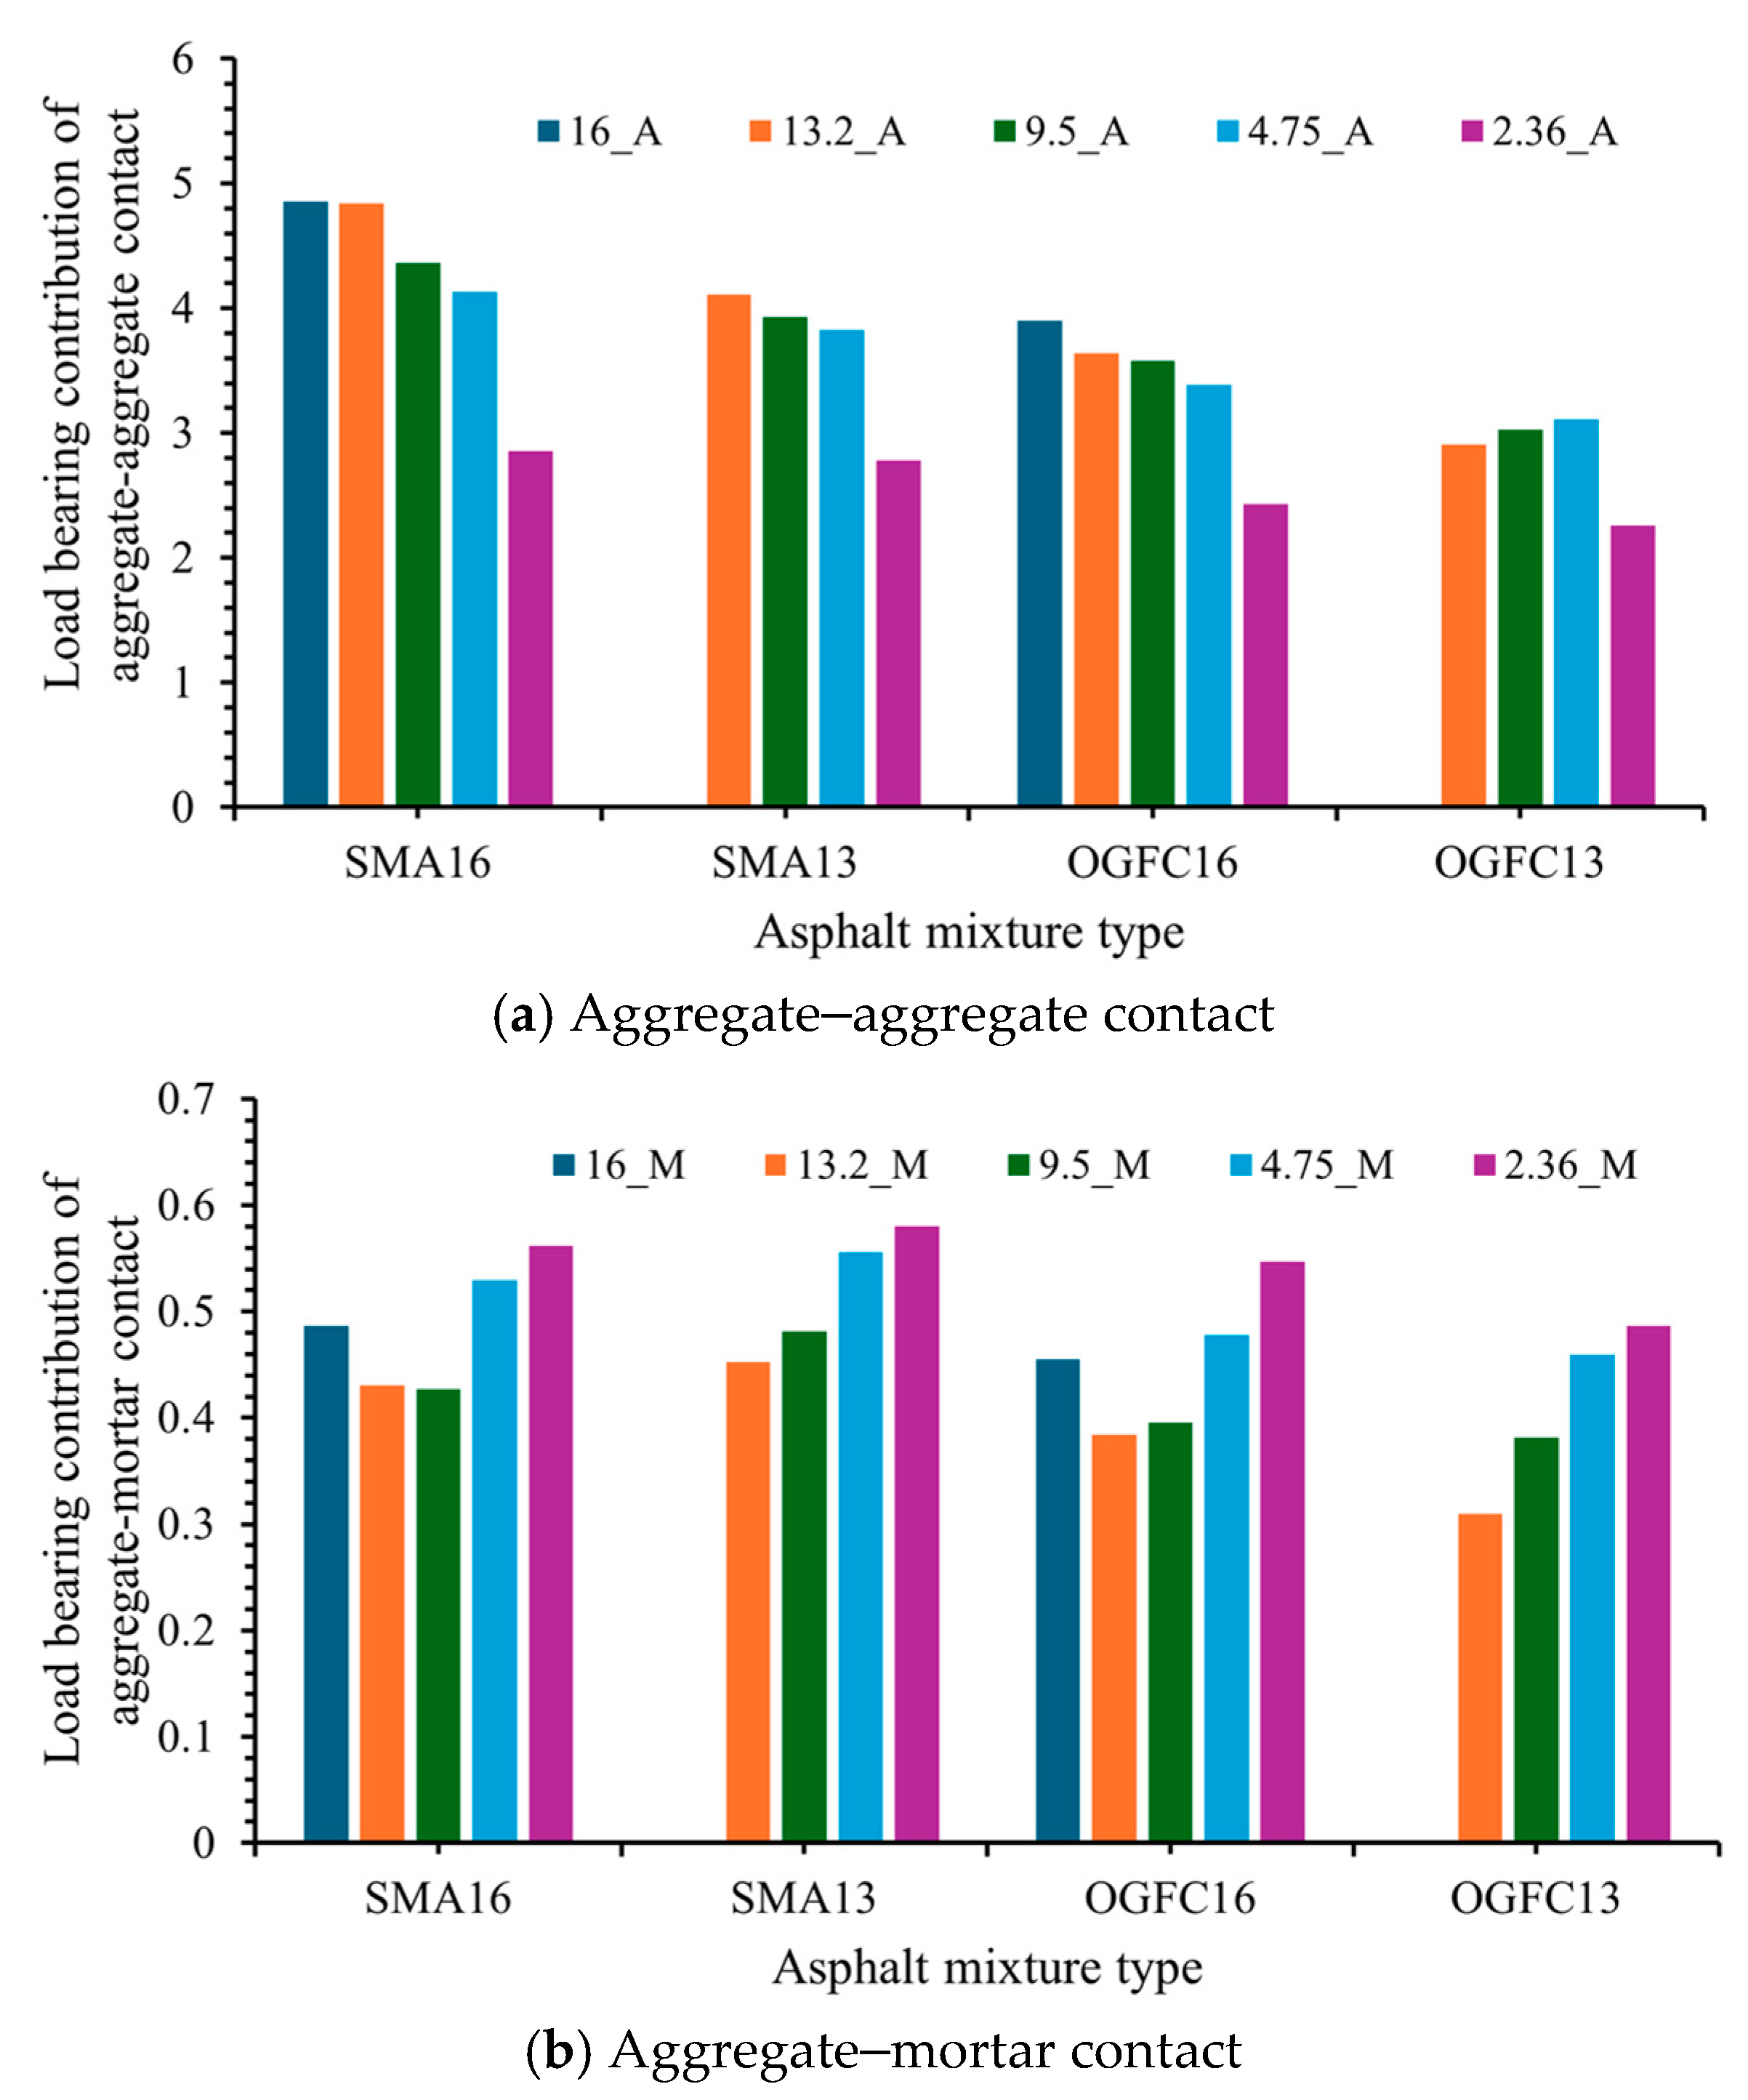
4.1.2. Load-Bearing Contribution of Particles
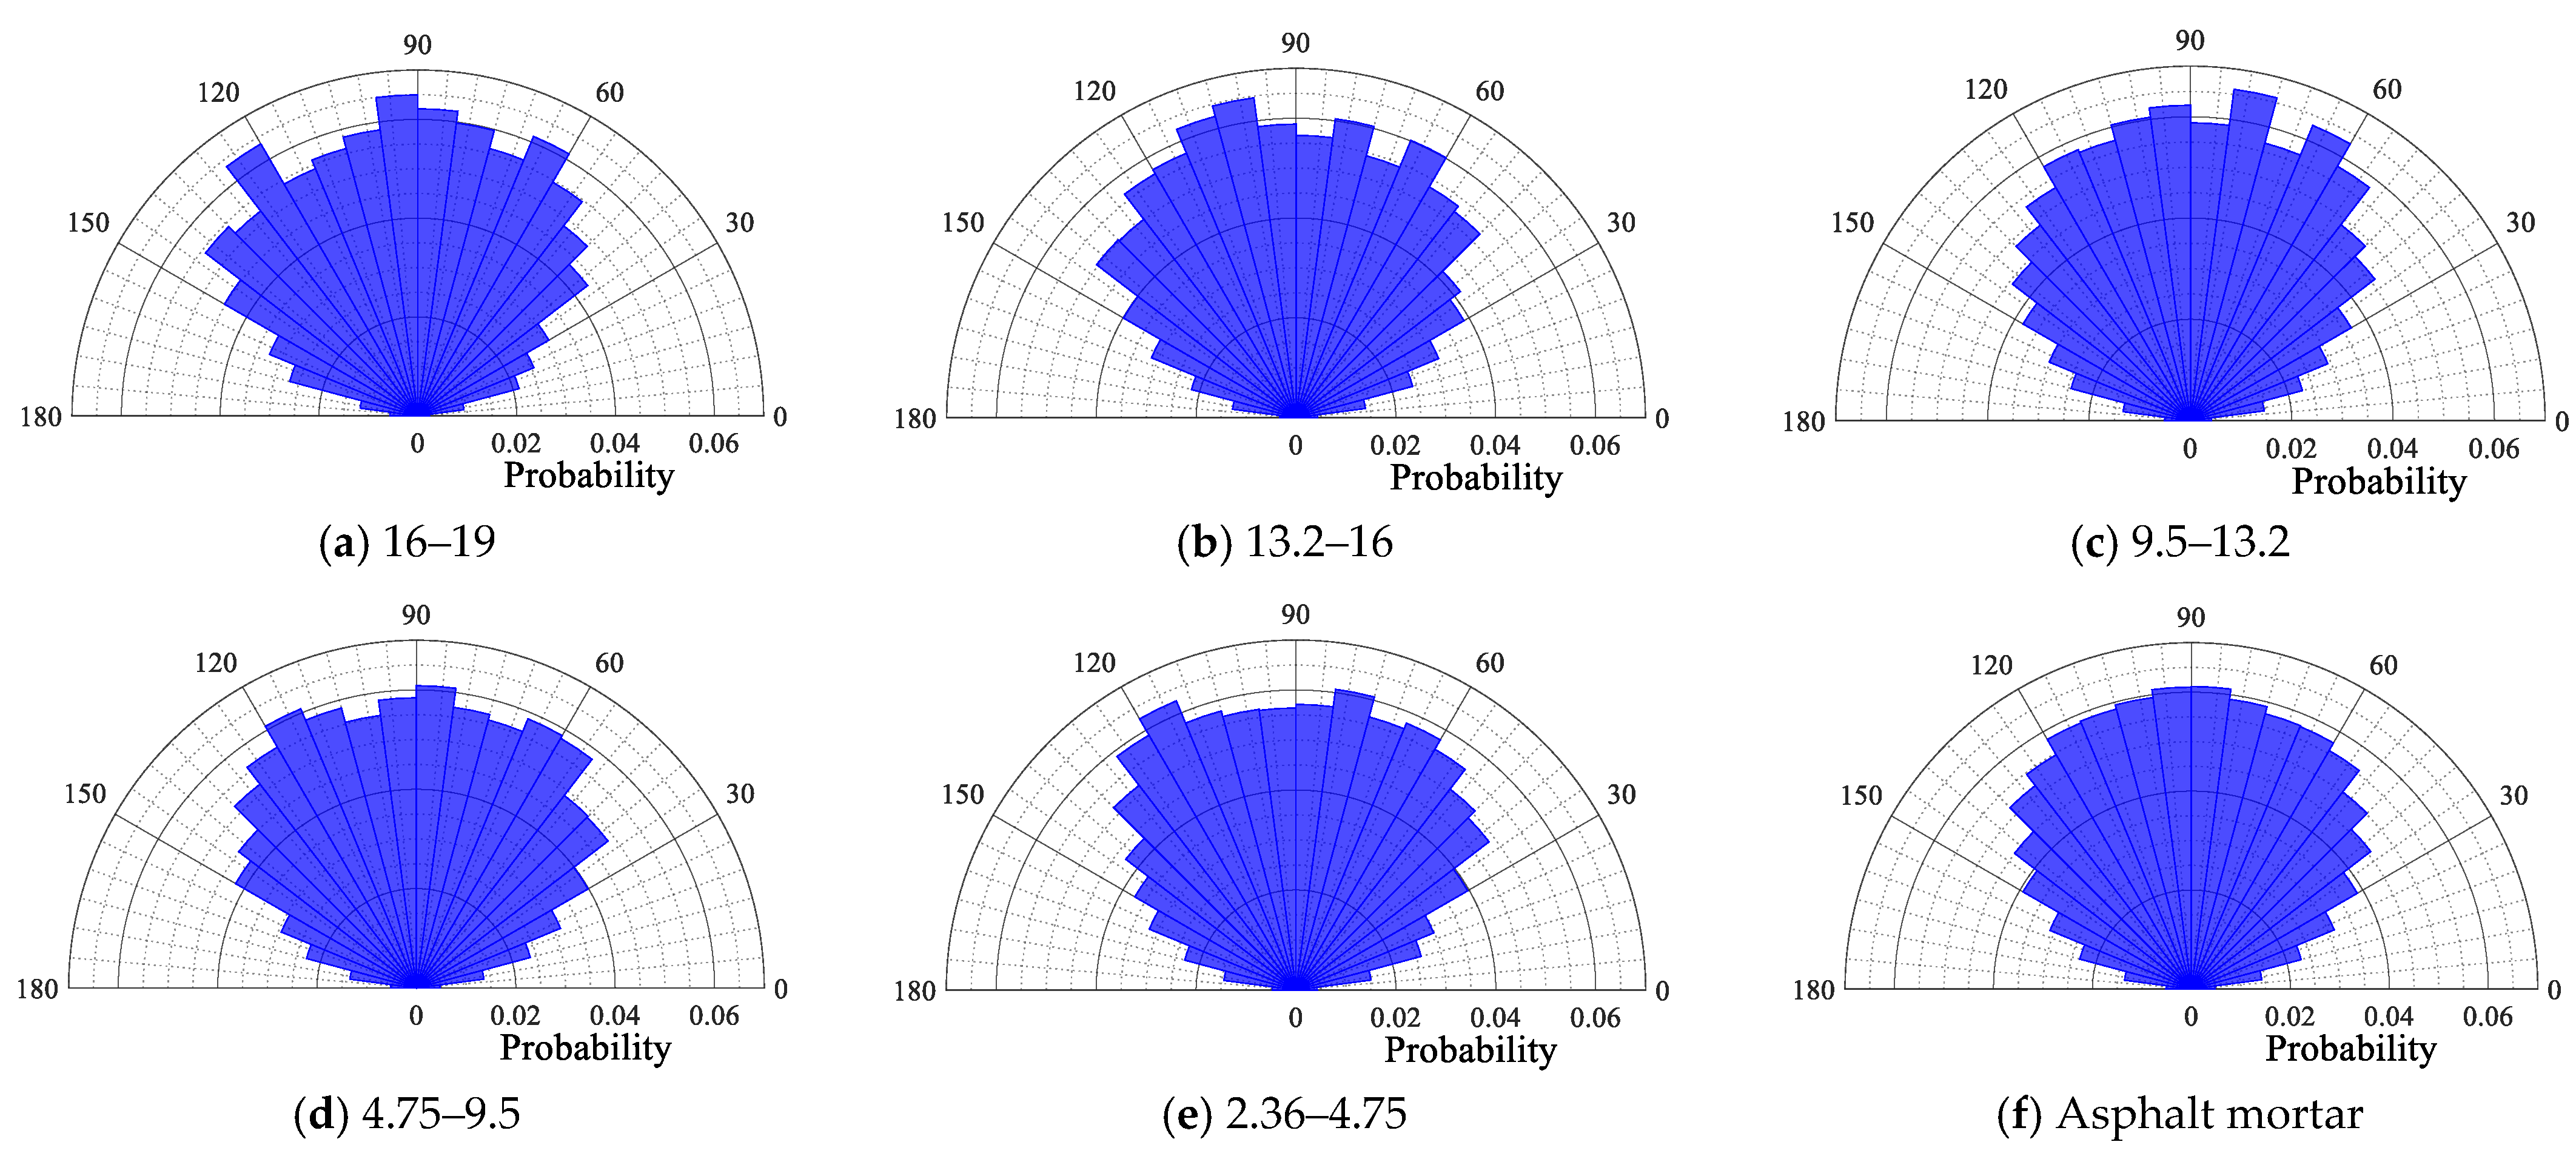
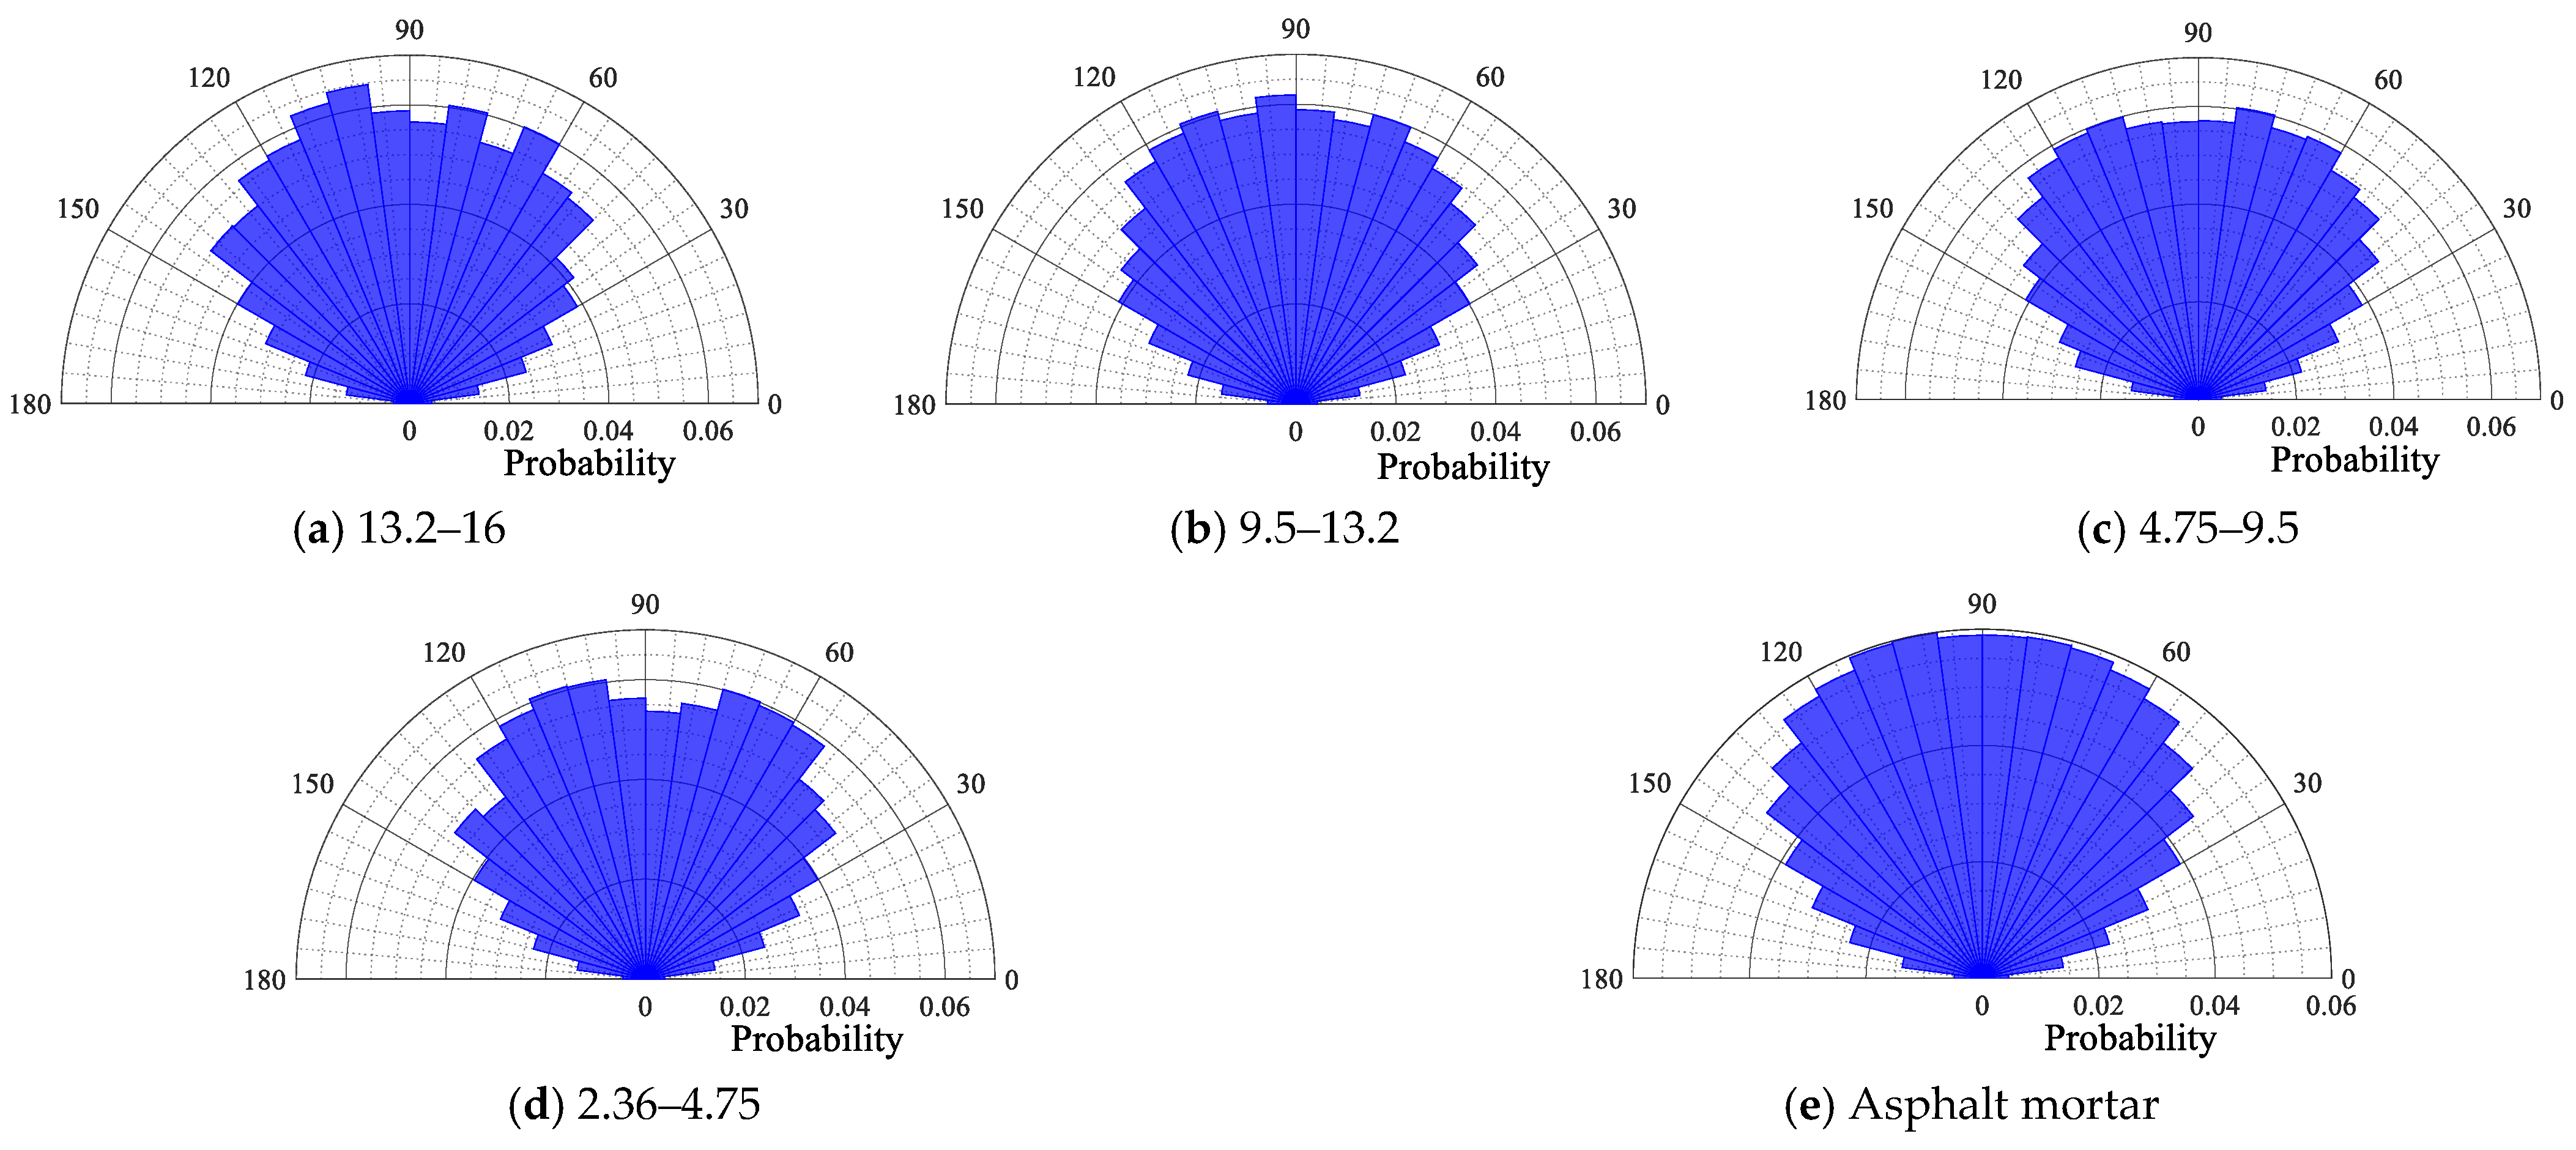
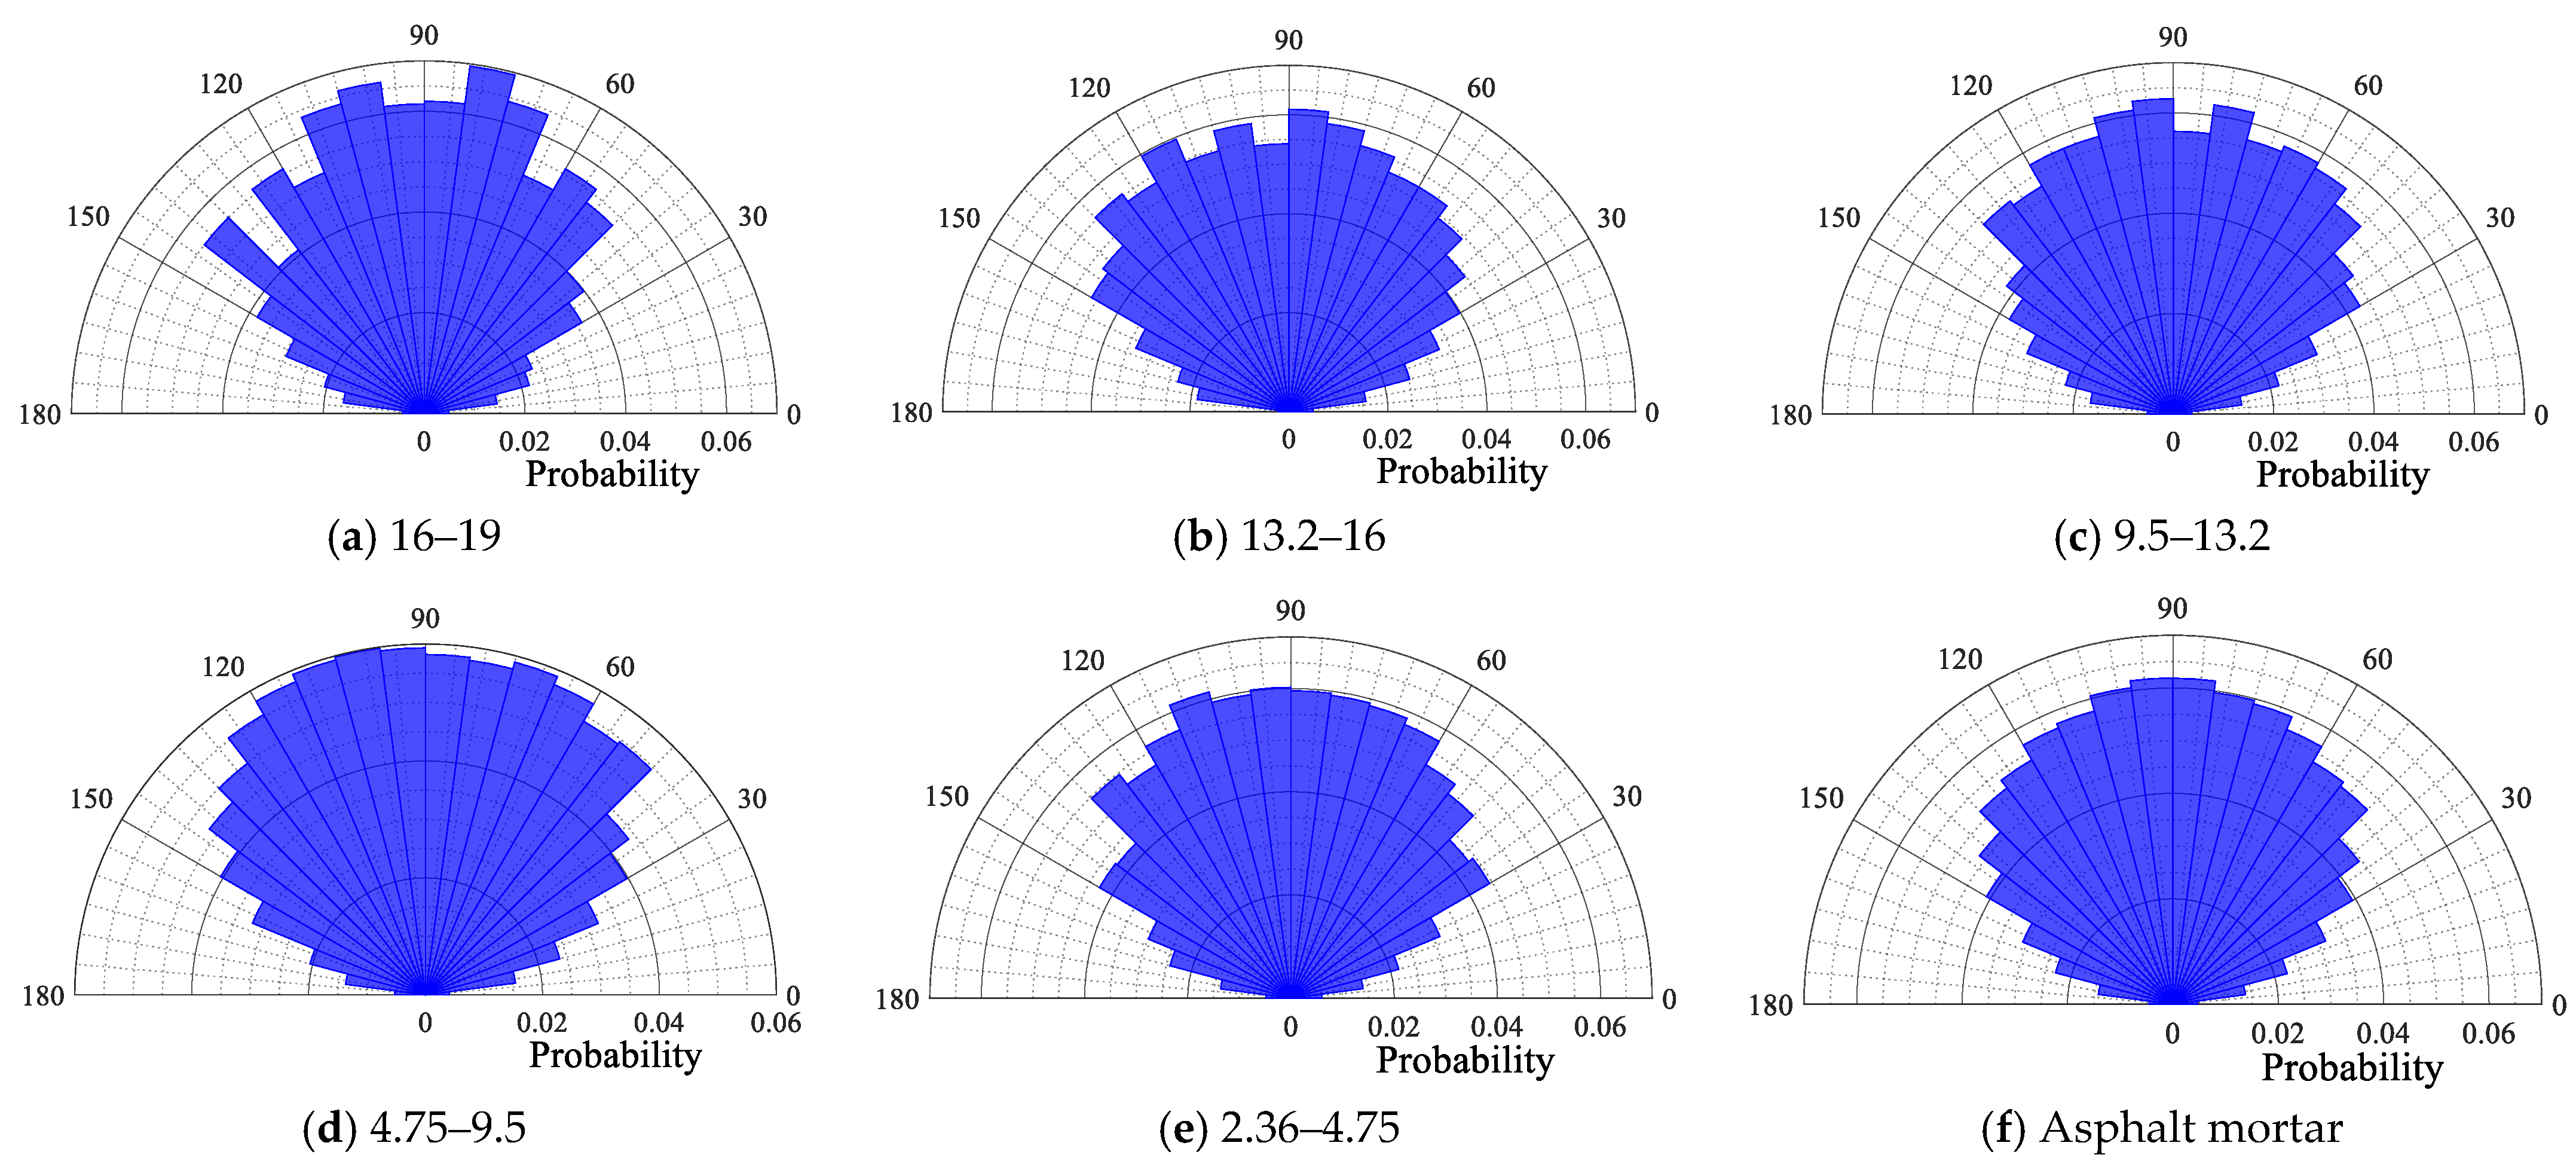
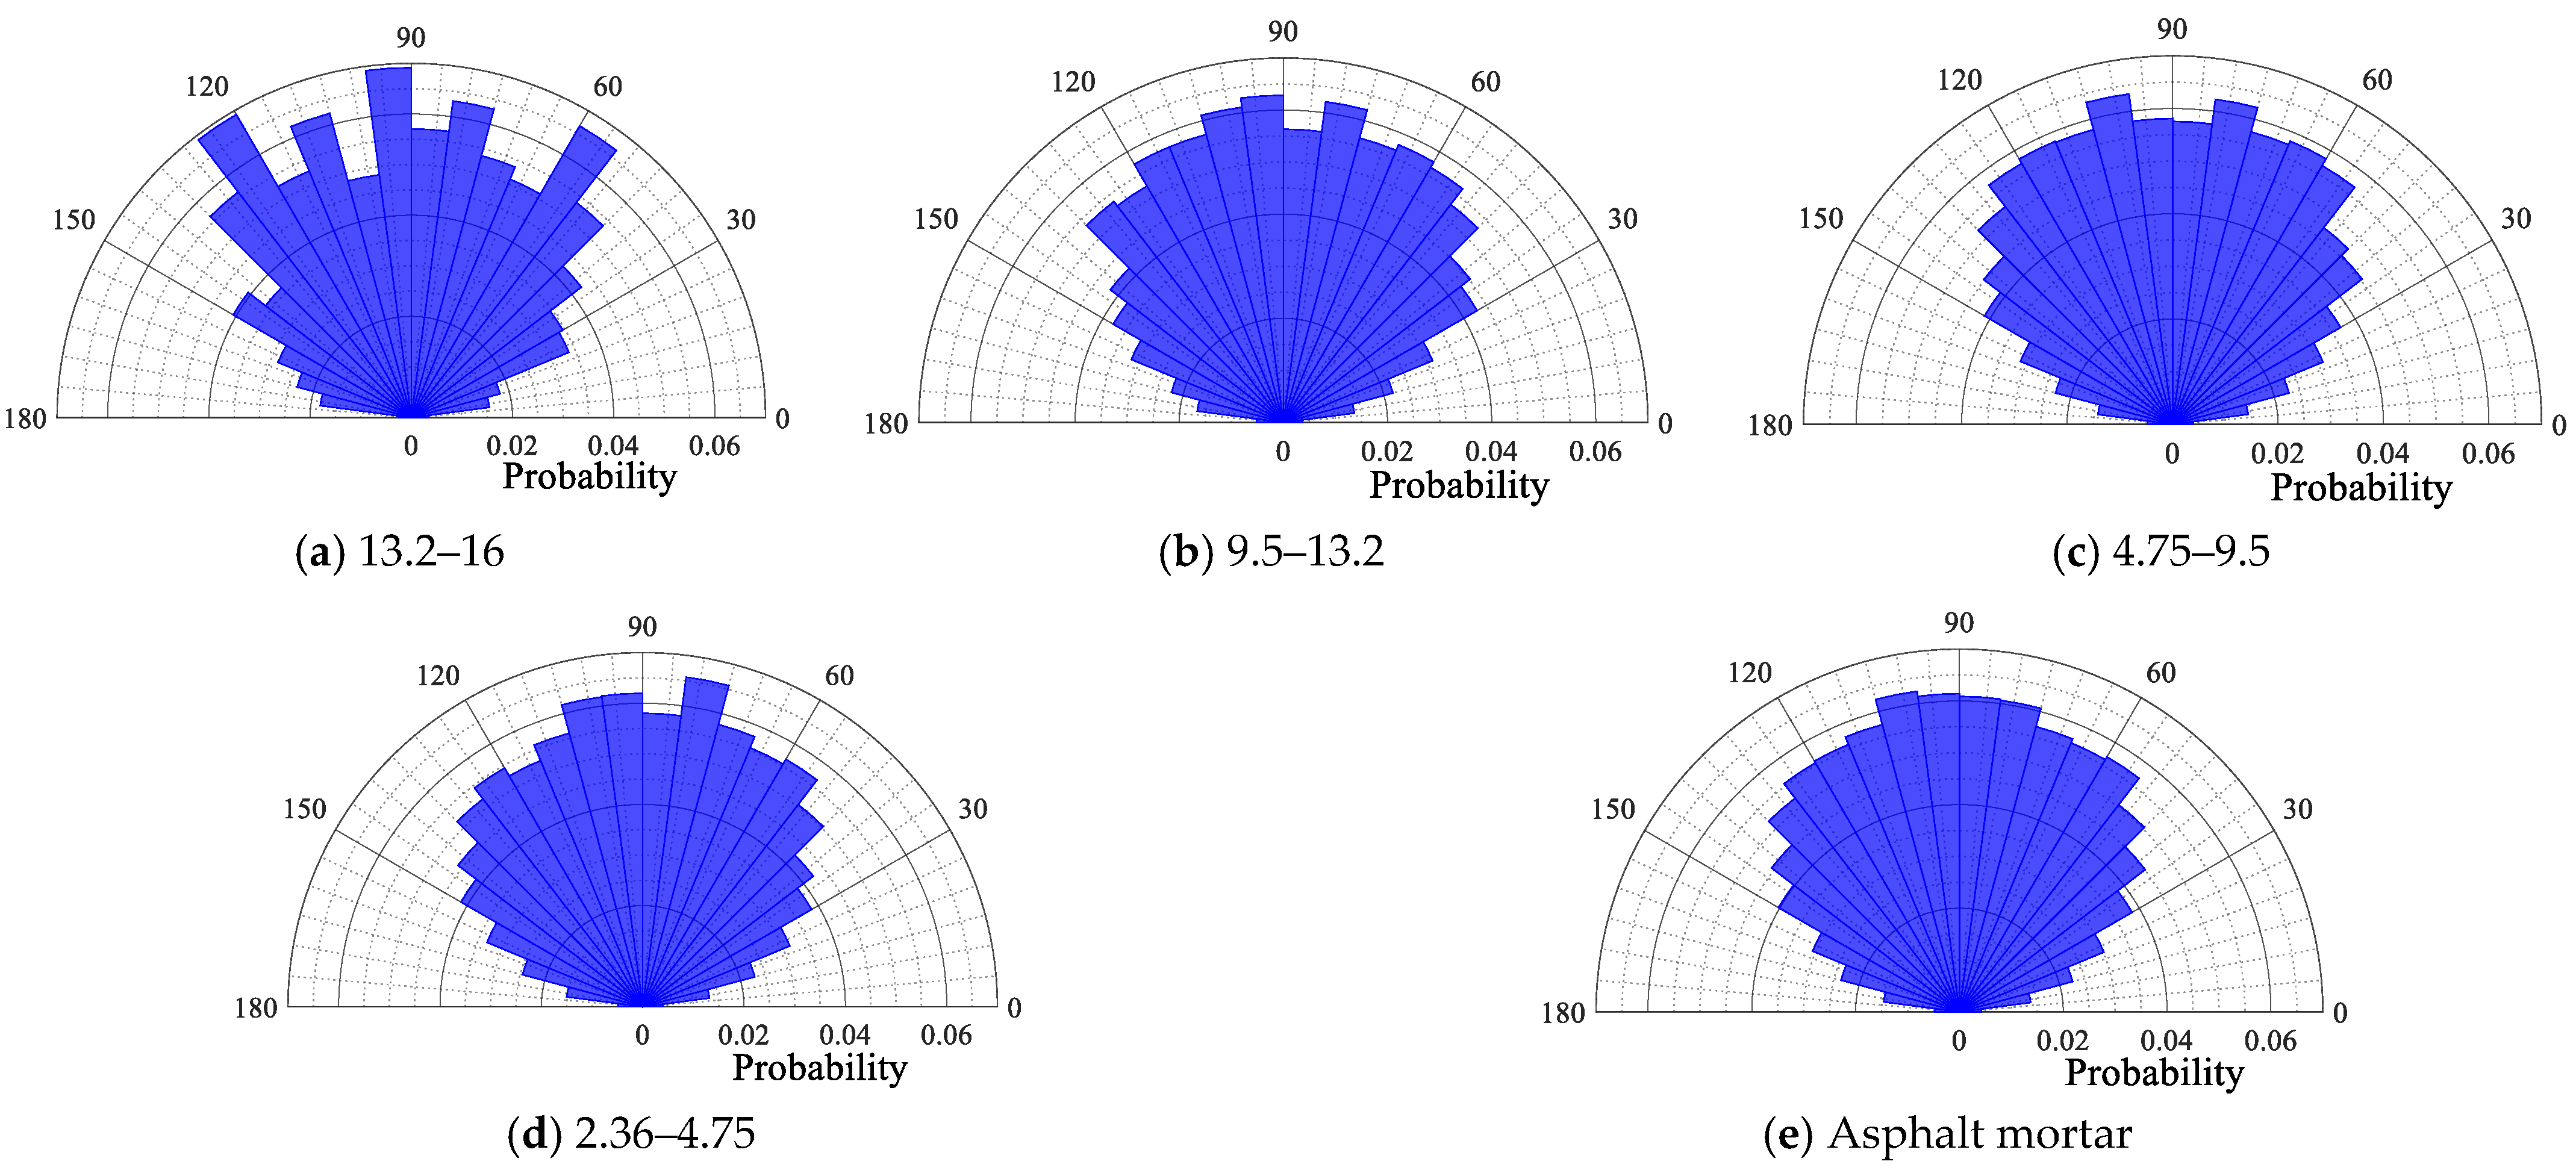
4.1.3. Contact Force Angle of Particles
4.2. Force Chain Topology Characteristics in Asphalt Mixtures
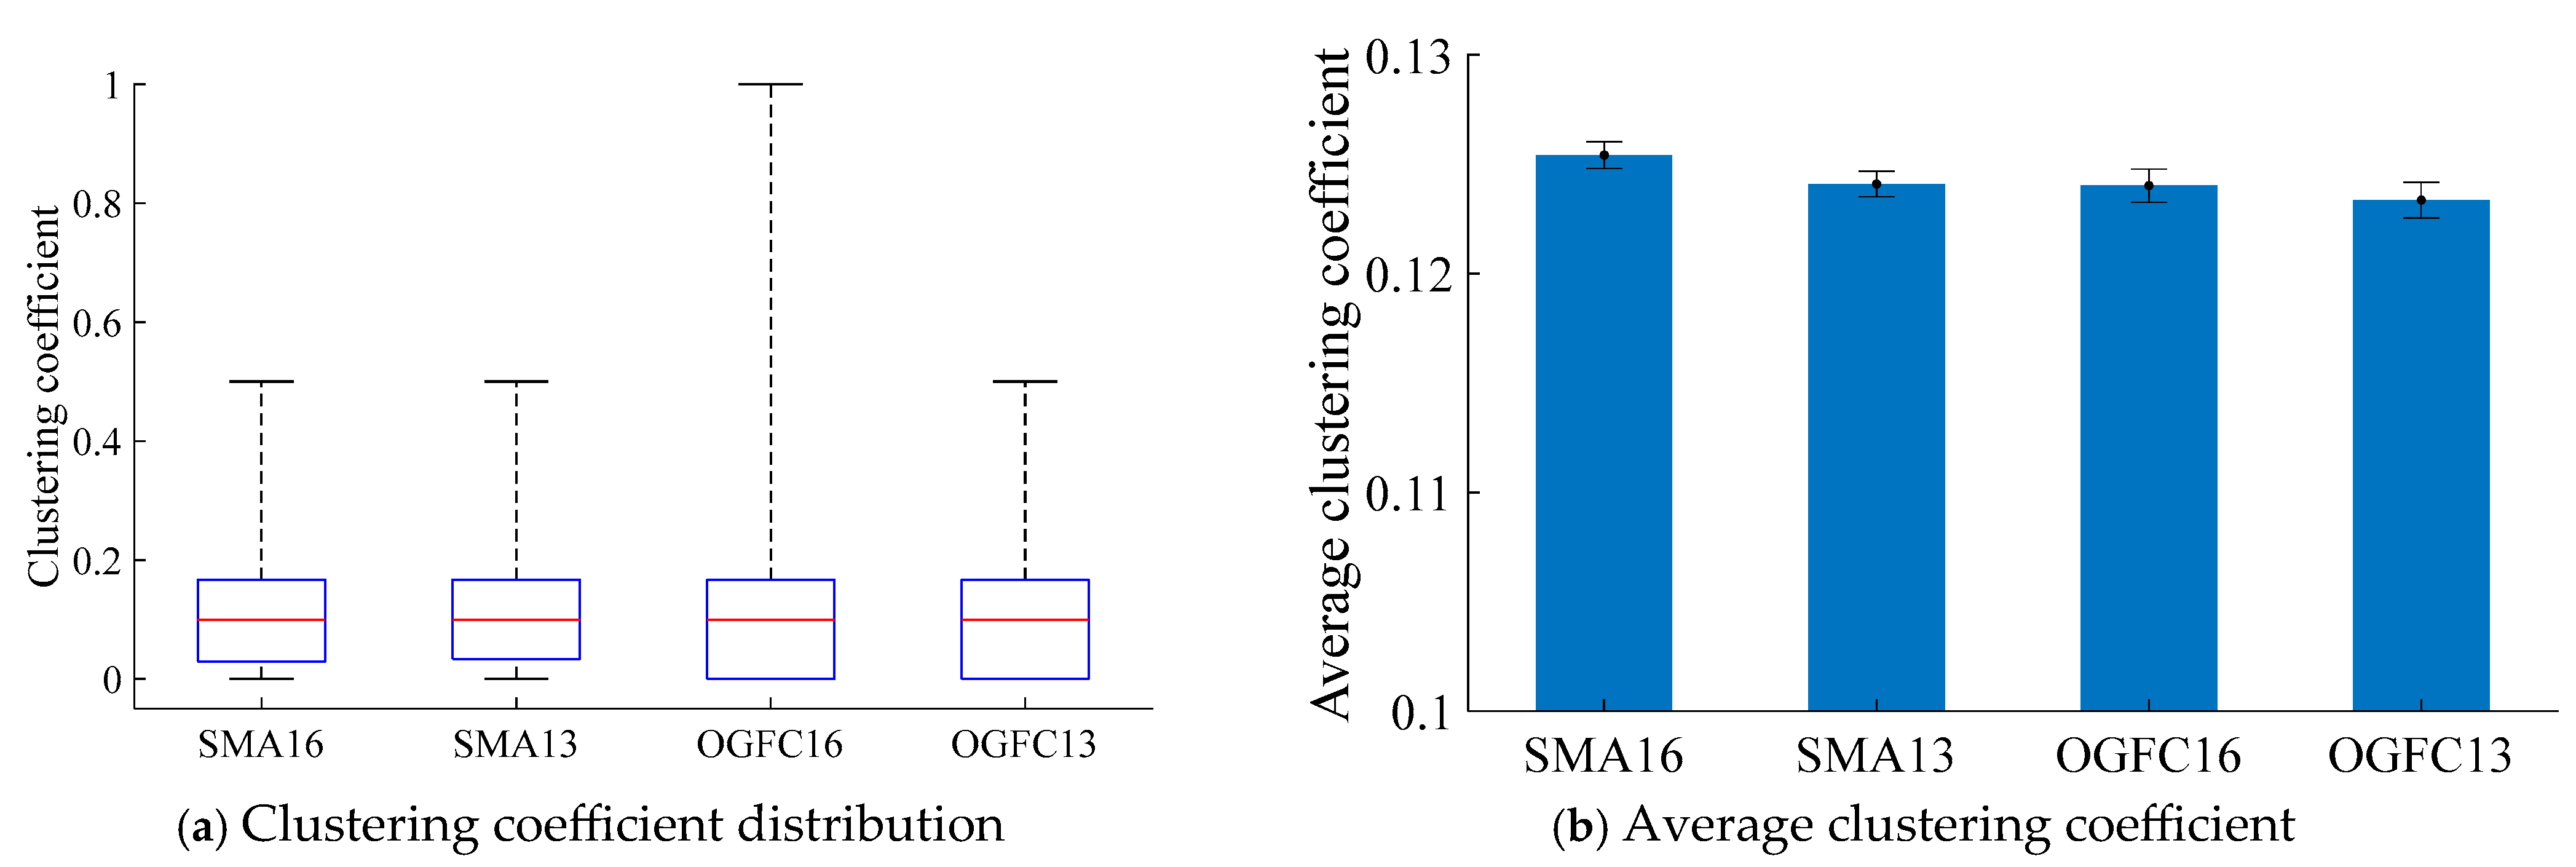
4.2.1. Clustering Coefficient of Asphalt Mixture
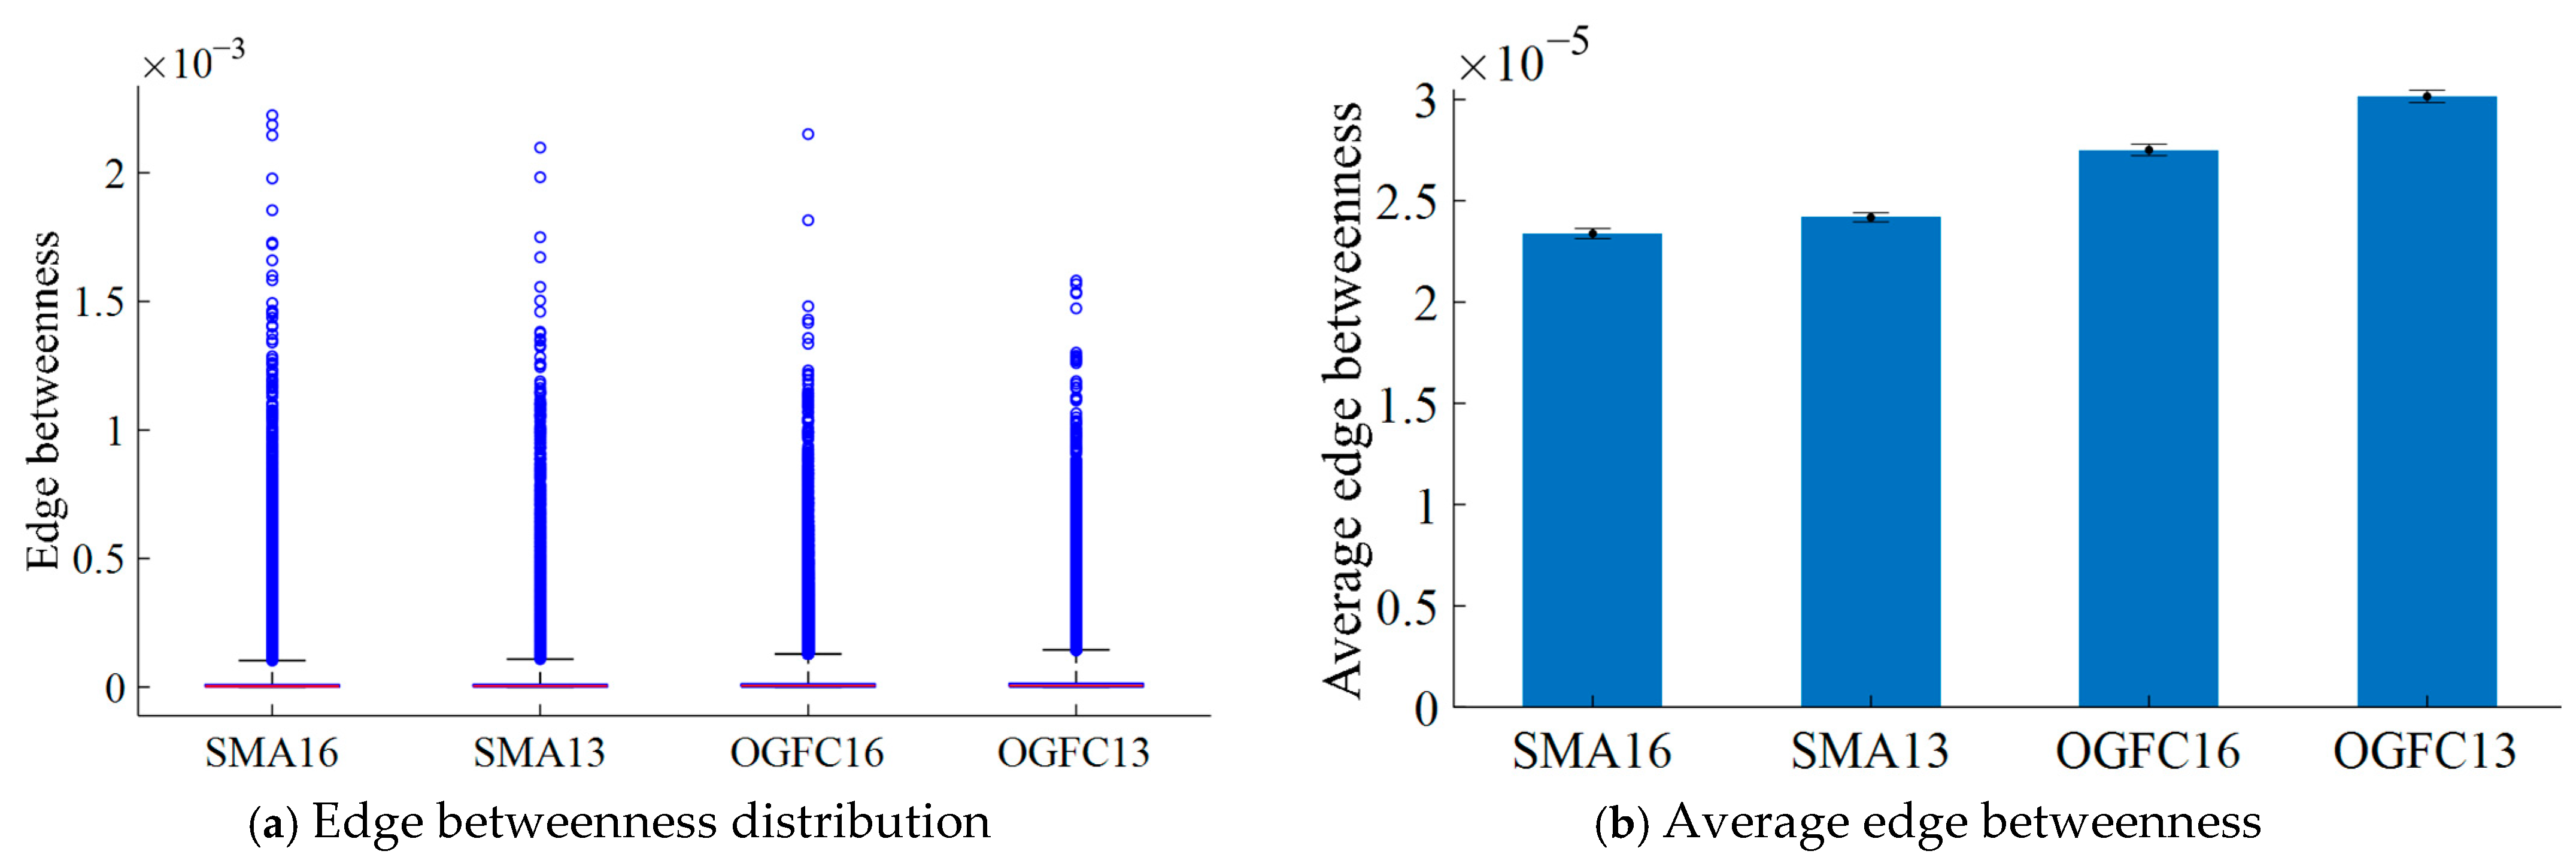
4.2.2. Edge Betweenness of Asphalt Mixture
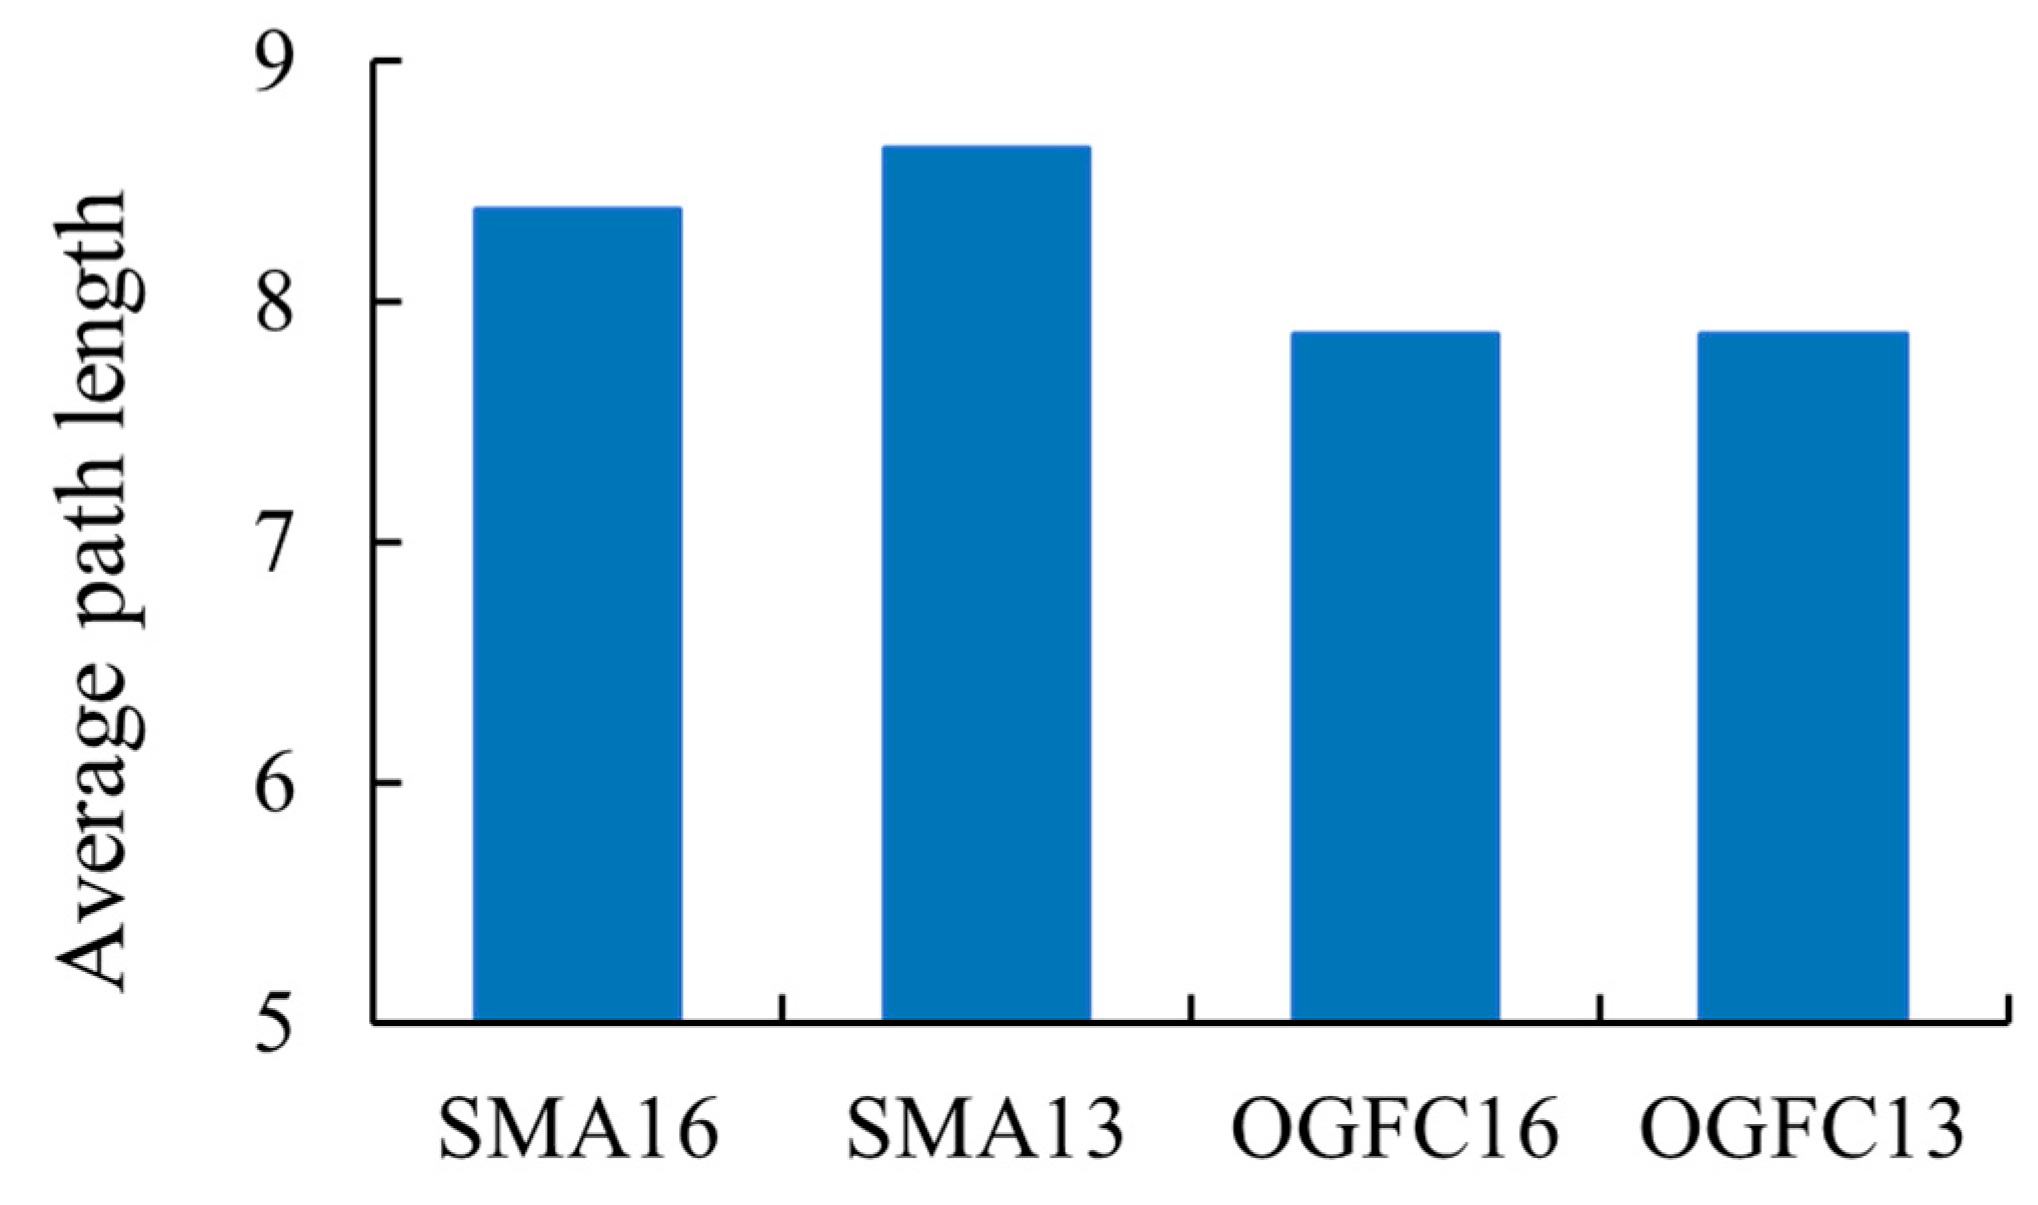
4.2.3. Average Path Length of Asphalt Mixture
5. Conclusions
- (1)
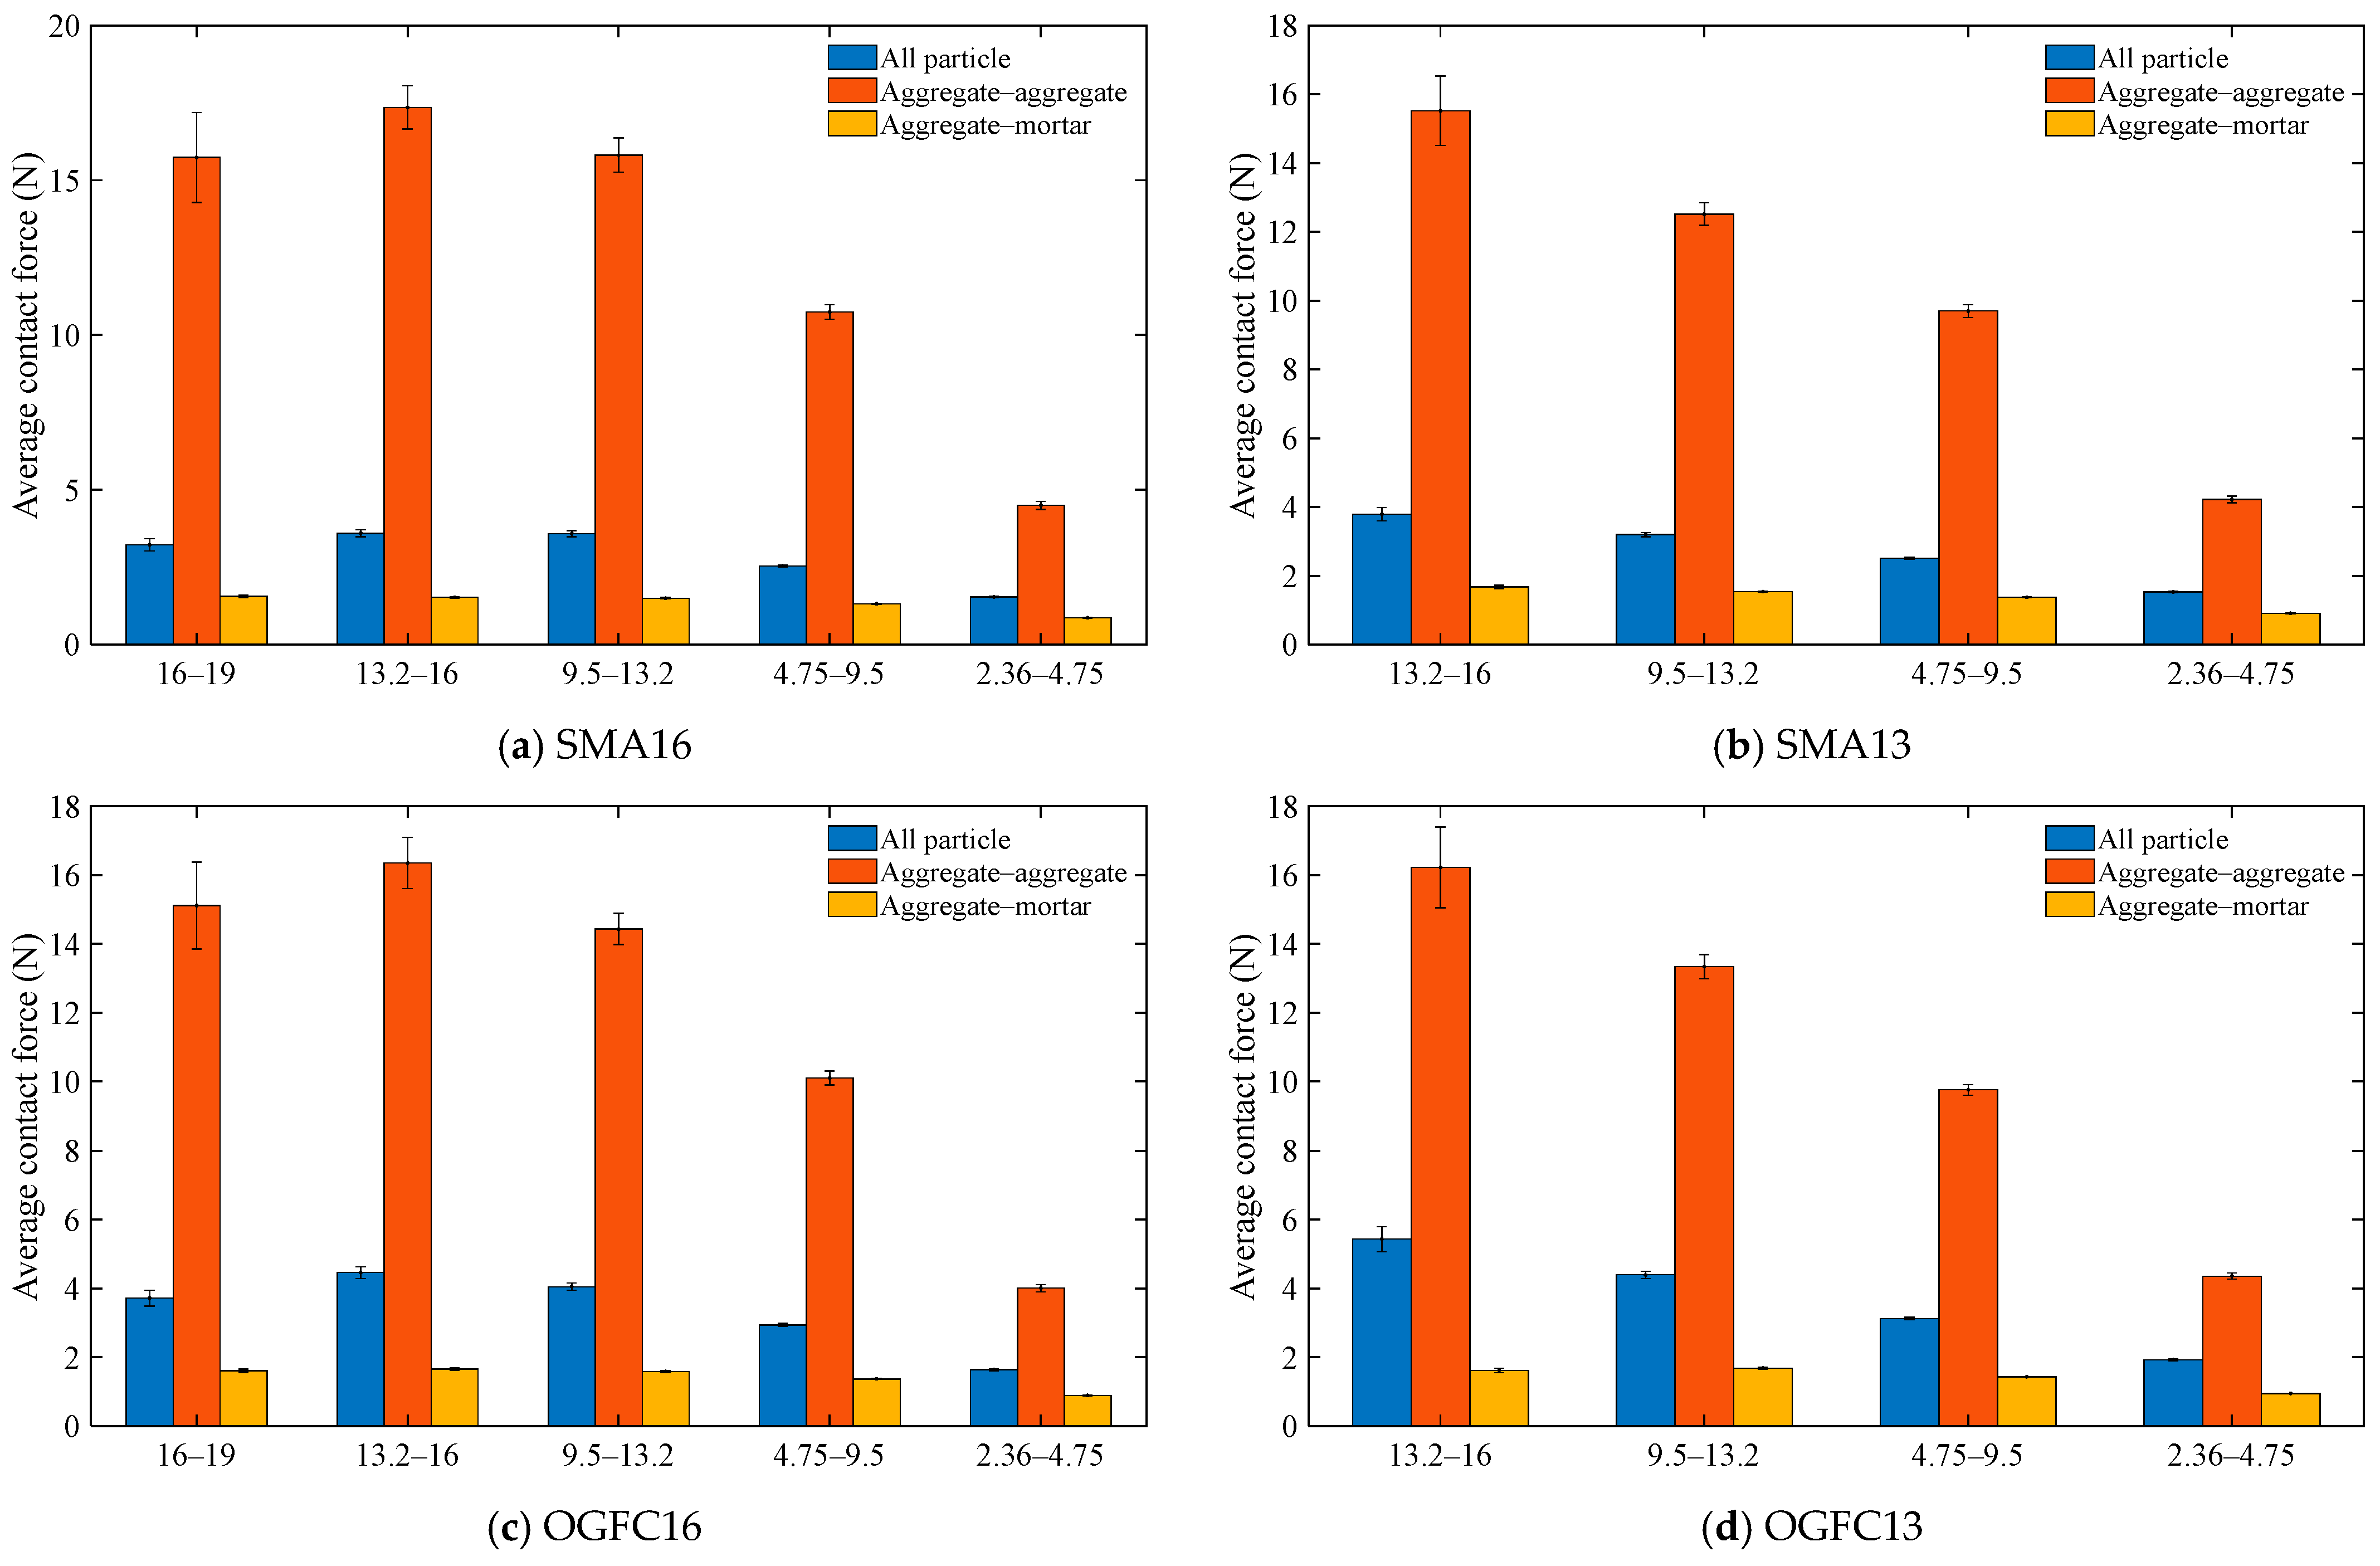
- The contact forces of aggregate particles of varying grain sizes in asphalt mixtures are distinct. The average contact force of particles in SMA16 and OGFC16 exhibits a tendency to increase and subsequently decrease with decreasing particle size, with the maximum average contact force recorded for a particle size of 13.2 mm. For SMA13 and OGFC13 asphalt mixtures, the average contact force demonstrates a gradual decline with decreasing particle size.
- (2)
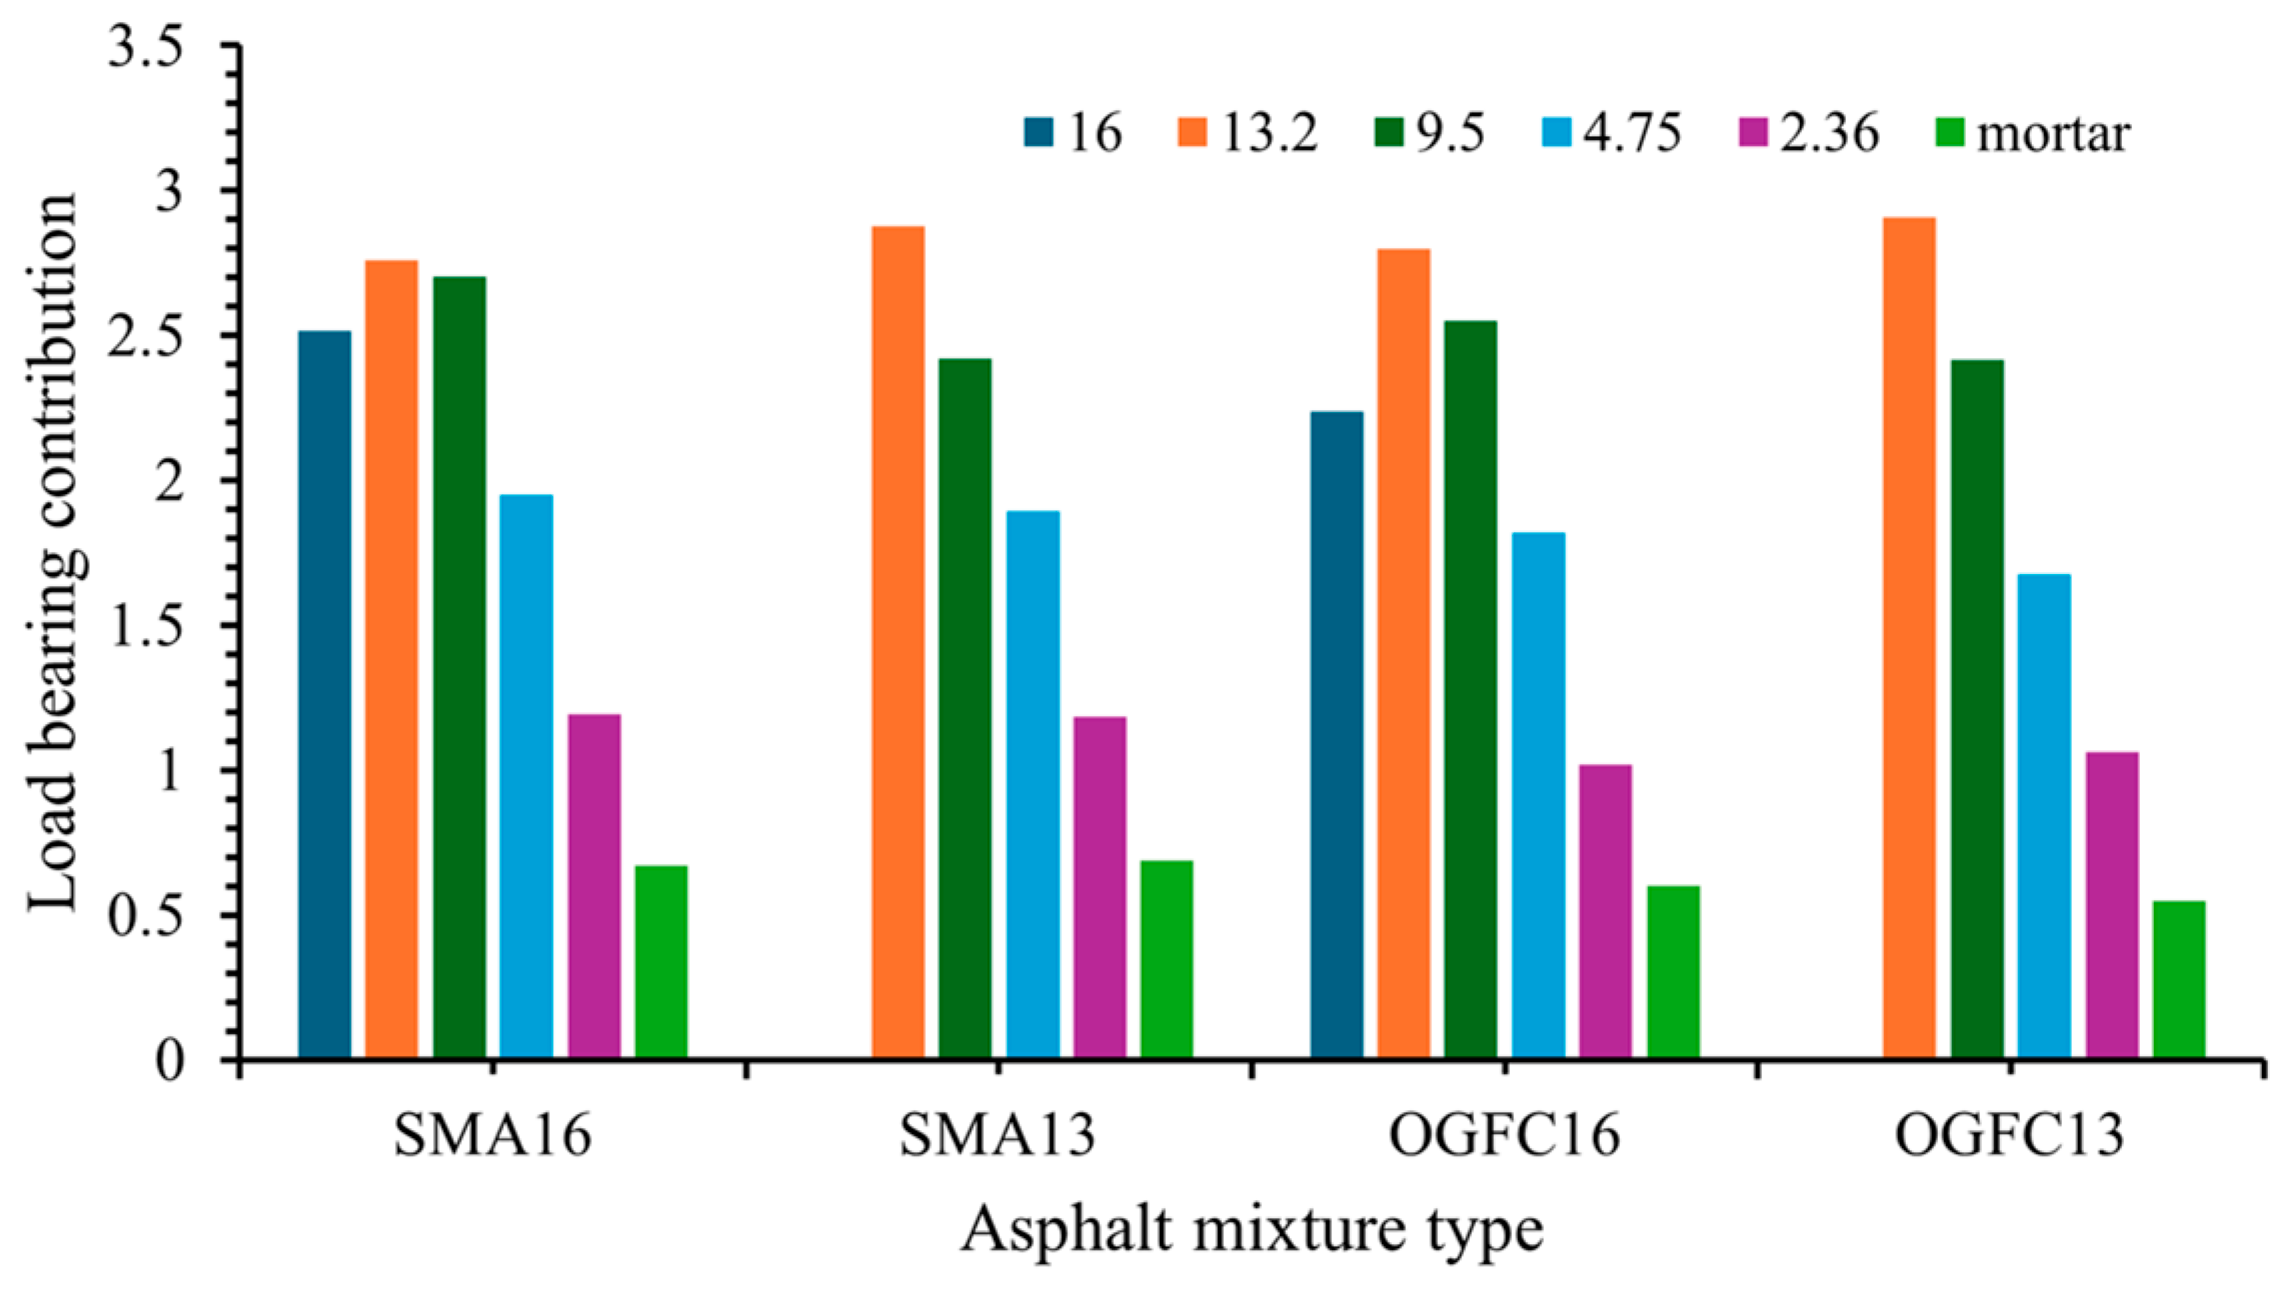
- The particles with different sizes in the asphalt mixture have different load-bearing contributions. For SMA16 and OGFC16 asphalt mixtures, the load-bearing contribution initially increases and then decreases with decreasing aggregate size, reaching a maximum at 13.2 mm. For SMA13 and OGFC13 asphalt mixtures, the aggregate particles’ load-bearing contribution decreases with decreasing particle size. The load-bearing contributions of different contact types in asphalt mixtures are different. The is significantly larger than . The for SMA16 is the largest, followed by SMA13, and then OGFC16, with OGFC13 being the smallest.
- (3)
- The contact force angle distribution characteristics are less affected by the type of asphalt mixture. The contact force angle of each particle size is symmetrically distributed around a center axis of 90°, with the contact force angle centrally distributed within the range of 30° to 150°.
- (4)
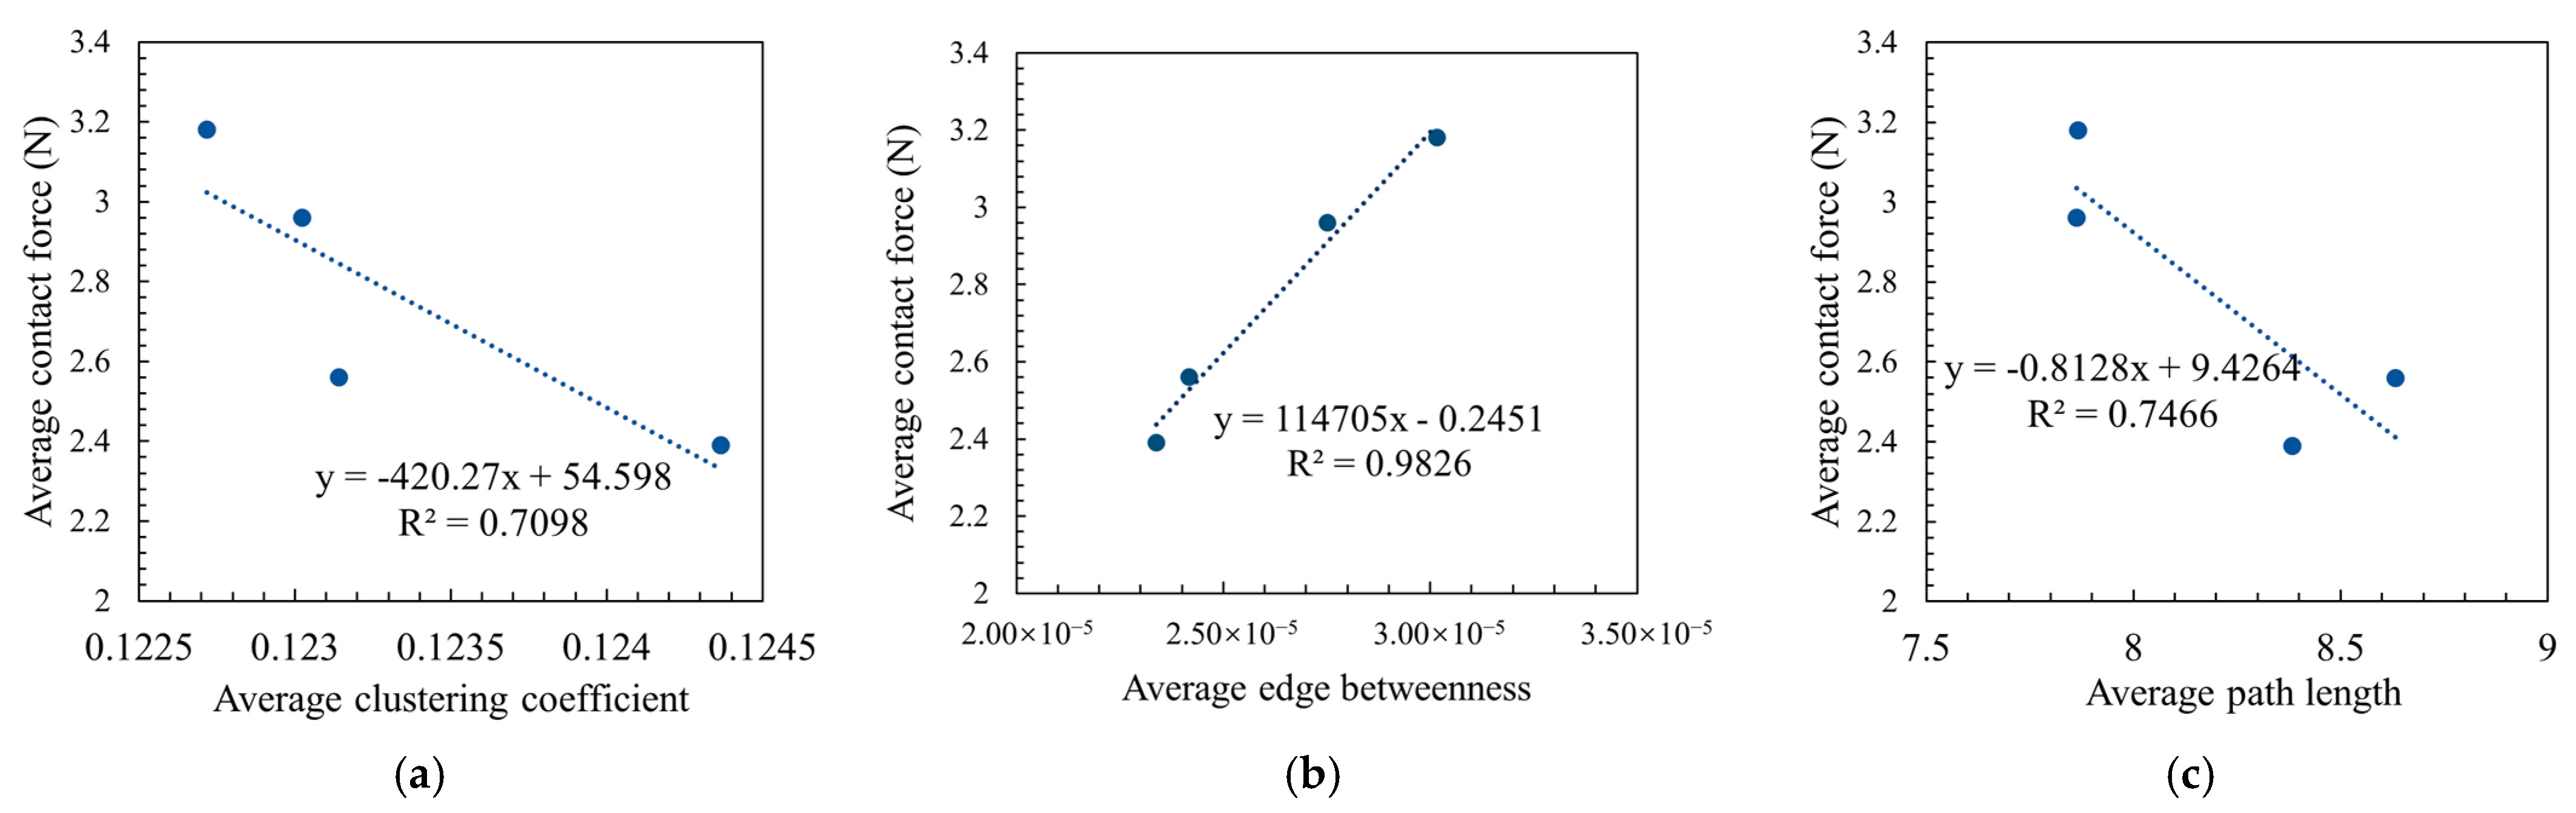
- The topological characteristic parameters can effectively characterize the structural features of the asphalt mixture’s force chain network. The average clustering coefficients of SMA are larger than those of the OGFC. The SMA asphalt mixture has a better load-bearing force chain structure than the OGFC asphalt mixture. The average clustering coefficient of SMA13 is smaller than that of SMA16. The load-bearing force chain structure of SMA16 is better than that of SMA13. The average clustering coefficient of OGFC16 is larger than that of OGFC13. The force chain structure of OGFC16 is better than that of OGFC13.
- (5)
- The edge betweenness of the aggregate–aggregate in the force chain in SMA asphalt mixture is smaller than that in OGFC asphalt mixture. Additionally, the average edge betweenness in SMA16 is smaller than that in SMA13. The edge between two particles in SMA13 contributes more to the force chain network structure than SMA16; the edge between two particles in OGFC13 contributes more to the force chain network structure than OGFC16.
- (6)
- The gradation type of asphalt mixture has a significant effect on the average path length of the force chain network, and the maximum nominal particle size of the same gradation has a lesser effect on the average path length. The relative change rate in average path length for the same gradation type of asphalt mixture with different maximum nominal particle sizes is 3%, while the relative change rate in the average path length of the force chain network for different gradation types of asphalt mixtures is 7% to 9%.
Author Contributions
Funding
Institutional Review Board Statement
Informed Consent Statement
Data Availability Statement
Conflicts of Interest
References
- Wang, S.; Yu, W.; Miao, Y.; Wang, L. Review on Load Transfer Mechanisms of Asphalt Mixture Meso-Structure. Materials 2023, 16, 1280. [Google Scholar] [CrossRef] [PubMed]
- Wang, S.; Miao, Y.; Wang, L. Investigation of the force evolution in aggregate blend compaction process and the effect of elongated and flat particles using DEM. Constr. Build. Mater. 2020, 258, 119674. [Google Scholar] [CrossRef]
- Liang, Z.; Xing, C.; Tan, Y.; Liu, B.; Wang, W. Investigation of three-dimensional aggregate contact evolution using an enhanced image segmentation algorithm. Constr. Build. Mater. 2025, 468, 140371. [Google Scholar] [CrossRef]
- Yu, L.; You, Z. Visualization and Simulation of Asphalt Concrete with Randomly Generated Three-Dimensional Models. J. Comput. Civ. Eng. 2009, 23, 340–347. [Google Scholar] [CrossRef]
- Chang, M.; Sheng, Y.; Niu, X.; Zhang, J.; Wang, X. Mesoscopic Analysis on Force Chains of Contact Force and Displacement Field Among Particles in Asphalt Mixture. Mater. Rep. 2015, 29, 153–156. [Google Scholar]
- Chang, M.; Huang, P.; Pei, J.; Zhang, J. Quantitative Analysis on Evolution and Distribution of Force Chain for Asphalt Mixture Using Discrete Element Method. Mater. Rep. 2017, 31, 155–159. [Google Scholar] [CrossRef]
- Chang, M.; Pei, J.; Huang, P.; Xiong, R. Analysis on the Distribution Probability of Force Chain of Contact Force Among Granular Matter Considering Gradation. Mater. Rep. 2018, 32, 3618–3622. [Google Scholar] [CrossRef]
- Tan, Y.; Wang, W.; Xu, Y.; Xing, C.; Hu, J.; Li, S.; Dai, M. Investigation into the force chain transmission mechanism of asphalt mixture under indirect tensile mode. Constr. Build. Mater. 2024, 411, 134500. [Google Scholar] [CrossRef]
- Wei, X.; Sun, Y.; Gong, H.; Li, Y.; Chen, J. 3D identification and characterization of force chains in asphalt concrete based on continuum mesomechanics. Comput. Struct. 2024, 297, 107329. [Google Scholar] [CrossRef]
- Shi, C.; Qian, G.; Yu, H.; Zhu, X.; Yuan, M.; Dai, W.; Ge, J.; Zheng, X. Research on the evolution of aggregate skeleton characteristics of asphalt mixture under uniaxial compression loading. Constr. Build. Mater. 2024, 413, 134769. [Google Scholar] [CrossRef]
- Hui, Y.; Ma, P.; Xu, M.; Liu, H.; Cao, D.; Cui, X.; Liu, Y. Aggregate stress contribution in asphalt mixtures with the splitting tests based on the three-dimensional (3D) discrete element method (DEM). Mater. Res. Express 2025, 12, 035602. [Google Scholar] [CrossRef]
- Yu, W.; Wang, S.; Miao, Y. Characterizing force-chain network in aggregate blend using discrete element method and complex network theory. Constr. Build. Mater. 2023, 400, 132724. [Google Scholar] [CrossRef]
- Kruyt, N.P. On weak and strong contact force networks in granular materials. Int. J. Solids Struct. 2016, 92–93, 135–140. [Google Scholar] [CrossRef]
- Voivret, C.; Radjai, F.; Delenne, J.Y.; El, Y.M. Multiscale force networks in highly polydisperse granular media. Phys. Rev. Lett. 2009, 102, 178001. [Google Scholar] [CrossRef]
- Mueth, D.M.; Jaeger, H.M.; Nagel, S.R. Force distribution in a granular medium. Phys. Rev. E Stat. Phys. Plasmas Fluids Relat. Interdiscip. Top. 1998, 57, 3164–3169. [Google Scholar] [CrossRef]
- Sun, Q.; Wang, G. Force Distribution in Static Granular Matter in Two Dimensions. Acta Phys. Sin. 2008, 57, 4667–4674. [Google Scholar] [CrossRef]
- Sun, Q.; Jin, F.; Wang, G.; Zhang, G. Force Chains in a Uniaxially Compressed Static Granular Matter in 2D. Acta Phys. Sin. 2010, 59, 30–37. [Google Scholar] [CrossRef]
- Feng, X.; Zhang, G.; Sun, Q. Effects of Size Polydispersity on Mechanical and Geometrical Properties of Granular System. Acta Phys. Sin. 2013, 62, 305–309. [Google Scholar] [CrossRef]
- Danylenko, V.A.; Mykulyak, S.V.; Polyakovskyi, V.O.; Kulich, V.V.; Oleynik, I.I. Force distribution in a granular medium under dynamic loading. Phys. Rev. E 2017, 96, 12906. [Google Scholar] [CrossRef]
- Kondic, L.; Kramár, M.; Kovalčinová, L.; Mischaikow, K.; Radjai, F.; Nezamabadi, S.; Luding, S.; Delenne, J.Y. Evolution of force networks in dense granular matter close to jamming. EPJ Web Conf. 2017, 140, 15014. [Google Scholar] [CrossRef]
- Yu, W.; Wang, S.; Miao, Y. Analysis of the internal contact characteristics of aggregate blend using discrete element method. Constr. Build. Mater. 2024, 438, 137302. [Google Scholar] [CrossRef]
- Yu, W.; Wang, S.; Gong, Z.; Miao, Y. Effect of compaction degree on the topological characteristics of force chain network (FCN) in aggregate blend. Constr. Build. Mater. 2024, 419, 135554. [Google Scholar] [CrossRef]
- Liu, G.; Huang, T.; Liu, Z.; Jiang, N. Evaluation of affinity between aggregate skeleton topology and rutting performance of asphalt mixture based on network theory. Constr. Build. Mater. 2025, 458, 139647. [Google Scholar] [CrossRef]
- Yang, Y.; Chen, Y.; Li, B.; Yang, Y. Micro-Scale Fracture Characteristics of Emulsified Asphalt Cold Recycled Mixture Based on Discrete Element Method. Coatings 2024, 14, 1436. [Google Scholar] [CrossRef]
- Liu, Y.; You, Z.; Li, L.; Wang, W. Review on advances in modeling and simulation of stone-based paving materials. Constr. Build. Mater. 2013, 43, 408–417. [Google Scholar] [CrossRef]
- Liu, Y.; Dai, Q.; You, Z. Viscoelastic Model for Discrete Element Simulation of Asphalt Mixtures. J. Eng. Mech. 2009, 135, 324–333. [Google Scholar] [CrossRef]
- Ma, T.; Zhang, D.; Zhang, Y.; Zhao, Y.; Huang, X. Effect of air voids on the high-temperature creep behavior of asphalt mixture based on three-dimensional discrete element modeling. Mater. Des. 2016, 89, 304–313. [Google Scholar] [CrossRef]
- Ma, T.; Zhang, D.; Zhang, Y.; Hong, J. Micromechanical response of aggregate skeleton within asphalt mixture based on virtual simulation of wheel tracking test. Constr. Build. Mater. 2016, 111, 153–163. [Google Scholar] [CrossRef]
- Ma, T.; Wang, H.; Zhang, D.; Zhang, Y. Heterogeneity effect of mechanical property on creep behavior of asphalt mixture based on micromechanical modeling and virtual creep test. Mech. Mater. 2017, 104, 49–59. [Google Scholar] [CrossRef]
- Kim, H.; Wagoner, M.P.; Buttlar, W.G. Numerical fracture analysis on the specimen size dependency of asphalt concrete using a cohesive softening model. Constr. Build. Mater. 2009, 23, 2112–2120. [Google Scholar] [CrossRef]
- Zhu, X.; Yu, H.; Qian, G.; Yao, D.; Dai, W.; Zhang, H.; Li, J.; Zhong, H. Evaluation of asphalt mixture micromechanical behavior evolution in the failure process based on Discrete Element Method. Case Stud. Constr. Mater. 2023, 18, e1773. [Google Scholar] [CrossRef]
- Xiao, M.; Chen, Y.; Feng, H.; Huang, T.; Xiong, K.; Zhu, Y. Evaluation of Fatigue Behavior of Asphalt Field Cores Using Discrete Element Modeling. Materials 2024, 17, 3108. [Google Scholar] [CrossRef]
- Xue, B.; Que, Y.; Pei, J.; Ma, X.; Wang, D.; Yuan, Y.; Zhang, H. A state-of-the-art review of discrete element method for asphalt mixtures: Model generation methods, contact constitutive models and application directions. Constr. Build. Mater. 2024, 414, 134842. [Google Scholar] [CrossRef]
- Shi, L.; Wang, D.; Xu, C.; Jie, H. Investigation into Meso Performance of Asphalt Mixture Skeleton Based on Discrete Element Method. J. South China Univ. Technol. (Nat. Sci. Ed.) 2015, 43, 50–56. [Google Scholar] [CrossRef]
- Liu, W.; Gao, Y. Discrete element modeling of migration and evolution rules of coarse aggregates in the static compaction process. J. Southeast Univ. (Engl. Ed.) 2016, 32, 85–92. [Google Scholar] [CrossRef]
- Chen, J.; Huang, B.; Chen, F.; Shu, X. Application of discrete element method to Superpave gyratory compaction. Road Mater. Pavement Des. 2012, 13, 480–500. [Google Scholar] [CrossRef]
- Gong, F.; Liu, Y.; Zhou, X.; You, Z. Lab assessment and discrete element modeling of asphalt mixture during compaction with elongated and flat coarse aggregates. Constr. Build. Mater. 2018, 182, 573–579. [Google Scholar] [CrossRef]
- Gong, F.; Zhou, X.; You, Z.; Liu, Y.; Chen, S. Using discrete element models to track movement of coarse aggregates during compaction of asphalt mixture. Constr. Build. Mater. 2018, 189, 338–351. [Google Scholar] [CrossRef]
- Chen, F.; Jelagin, D.; Partl, M.N. Experimental and numerical analysis of asphalt flow in a slump test. Road Mater. Pavement 2019, 20 (Suppl. 1), S446–S461. [Google Scholar] [CrossRef]
- Wang, S.; Diao, W.; Miao, Y.; Wang, J.; Xu, J.; Yu, W.; Wang, L. Investigation of force evolution and movement characteristics of aggregate particles in asphalt mixture during compaction. Constr. Build. Mater. 2025, 479, 141481. [Google Scholar] [CrossRef]
- JTG F40-2004; Tehnical Specifications for Construction of Highway Asphalt Pavements. Chinese Ministry of Communications: Beijing, China, 2005.
- Ge, H.; Quezada, J.C.; Le Houerou, V.; Chazallon, C. Three-dimensional FEM–DEM coupling simulation for analysis of asphalt mixture responses under rolling tire loads. Constr. Build. Mater. 2023, 369, 130615. [Google Scholar] [CrossRef]
- Al Khateeb, L.; Anupam, K.; Erkens, S.; Scarpas, T. Micromechanical simulation of porous asphalt mixture compaction using discrete element method (DEM). Constr. Build. Mater. 2021, 301, 124305. [Google Scholar] [CrossRef]
- Miao, Y.; Yu, W.; Wu, J.; Wang, S.; Wang, L. Feasibility of one side 3-D scanning for characterizing aggregate shape. Int. J. Pavement Res. Technol. 2019, 12, 197–205. [Google Scholar] [CrossRef]
- Xue, B.; Pei, J.; Zhou, B.; Zhang, J.; Li, R.; Guo, F. Using random heterogeneous DEM model to simulate the SCB fracture behavior of asphalt concrete. Constr. Build. Mater. 2020, 236, 117580. [Google Scholar] [CrossRef]
- Wang, S.; Miao, Y.; Wang, L. Effect of grain size composition on mechanical performance requirement for particles in aggregate blend based on photoelastic method. Constr. Build. Mater. 2023, 363, 129808. [Google Scholar] [CrossRef]

| Sieve Size (mm) | Percent Passing (%) | |||
|---|---|---|---|---|
| SMA13 | SMA16 | OGFC13 | OGFC16 | |
| 19 | - | 100 | - | 100 |
| 16 | 100 | 95.8 | 100 | 96.4 |
| 13.2 | 93.2 | 74.7 | 94.9 | 79.3 |
| 9.5 | 61.3 | 55.3 | 70.5 | 57.9 |
| 4.75 | 25.8 | 25.9 | 22.1 | 22.9 |
| 2.36 | 19.9 | 20.4 | 14.4 | 16.0 |
| 1.18 | 16.0 | 17.2 | 9.8 | 11.2 |
| 0.6 | 13.7 | 14.6 | 7.2 | 8.4 |
| 0.3 | 12.2 | 13.1 | 5.4 | 6.6 |
| 0.15 | 10.6 | 11.4 | 4.4 | 5.4 |
| 0.075 | 9.8 | 10.4 | 3.8 | 4.7 |
| Optimal asphalt–aggregate ratio | 6.0% | 5.9% | 4.4% | 5.2% |
| Aggregates | Size (mm) | Bulk Density (g/cm3) |
|---|---|---|
| Coarse aggregates | 16–19 | 2.892 |
| 13.2–16 | 2.829 | |
| 9.5–13.2 | 2.764 | |
| 4.75–9.5 | 2.762 | |
| 2.36–4.75 | 2.751 | |
| Fine aggregates | 1.18–2.36 | 2.700 |
| 0.6–1.18 | 2.682 | |
| 0.3–0.6 | 2.602 | |
| 0.15–0.3 | 2.751 | |
| 0.075–0.15 | 2.651 | |
| Mineral Powder | <0.075 | 2.806 |
| Asphalt Mixtures | E1 (MPa) | E2 (MPa) | (MPa·s) | (MPa·s) |
|---|---|---|---|---|
| SMA16 | 183.4 | 10.5 | 161.3 | 20.3 |
| SMA13 | 79.6 | 3.7 | 18.2 | 6.8 |
| OGFC16 | 153.9 | 6.8 | 102.0 | 20.3 |
| OGFC13 | 223.0 | 20.1 | 101.2 | 1.63 |
| Asphalt Mixture | Key Parameters | |
|---|---|---|
| Distribution Characteristics | Topology Characteristics | |
| SMA16 | Average contact force () | Average clustering coefficient (C) Average edge betweenness () Average path length (L) |
| SMA13 | ||
| OGFC16 | ||
| OGFC13 | ||
Disclaimer/Publisher’s Note: The statements, opinions and data contained in all publications are solely those of the individual author(s) and contributor(s) and not of MDPI and/or the editor(s). MDPI and/or the editor(s) disclaim responsibility for any injury to people or property resulting from any ideas, methods, instructions or products referred to in the content. |
© 2025 by the authors. Licensee MDPI, Basel, Switzerland. This article is an open access article distributed under the terms and conditions of the Creative Commons Attribution (CC BY) license (https://creativecommons.org/licenses/by/4.0/).
Share and Cite
Wang, S.; Wang, J.; Wang, J.; Xu, J.; Miao, Y.; Ma, Q.; Wang, L.; Liu, T. Characterization of Force Distribution and Force Chain Topology in Asphalt Mixtures Using the Discrete Element Method. Materials 2025, 18, 2347. https://doi.org/10.3390/ma18102347
Wang S, Wang J, Wang J, Xu J, Miao Y, Ma Q, Wang L, Liu T. Characterization of Force Distribution and Force Chain Topology in Asphalt Mixtures Using the Discrete Element Method. Materials. 2025; 18(10):2347. https://doi.org/10.3390/ma18102347
Chicago/Turabian StyleWang, Sudi, Jianxia Wang, Jie Wang, Jian Xu, Yinghao Miao, Qing Ma, Linbing Wang, and Tao Liu. 2025. "Characterization of Force Distribution and Force Chain Topology in Asphalt Mixtures Using the Discrete Element Method" Materials 18, no. 10: 2347. https://doi.org/10.3390/ma18102347
APA StyleWang, S., Wang, J., Wang, J., Xu, J., Miao, Y., Ma, Q., Wang, L., & Liu, T. (2025). Characterization of Force Distribution and Force Chain Topology in Asphalt Mixtures Using the Discrete Element Method. Materials, 18(10), 2347. https://doi.org/10.3390/ma18102347