
Mechanical Properties of Fully Recycled Aggregate Concrete Reinforced with Steel Fiber and Polypropylene Fiber


Abstract
1. Introduction
2. Experiment
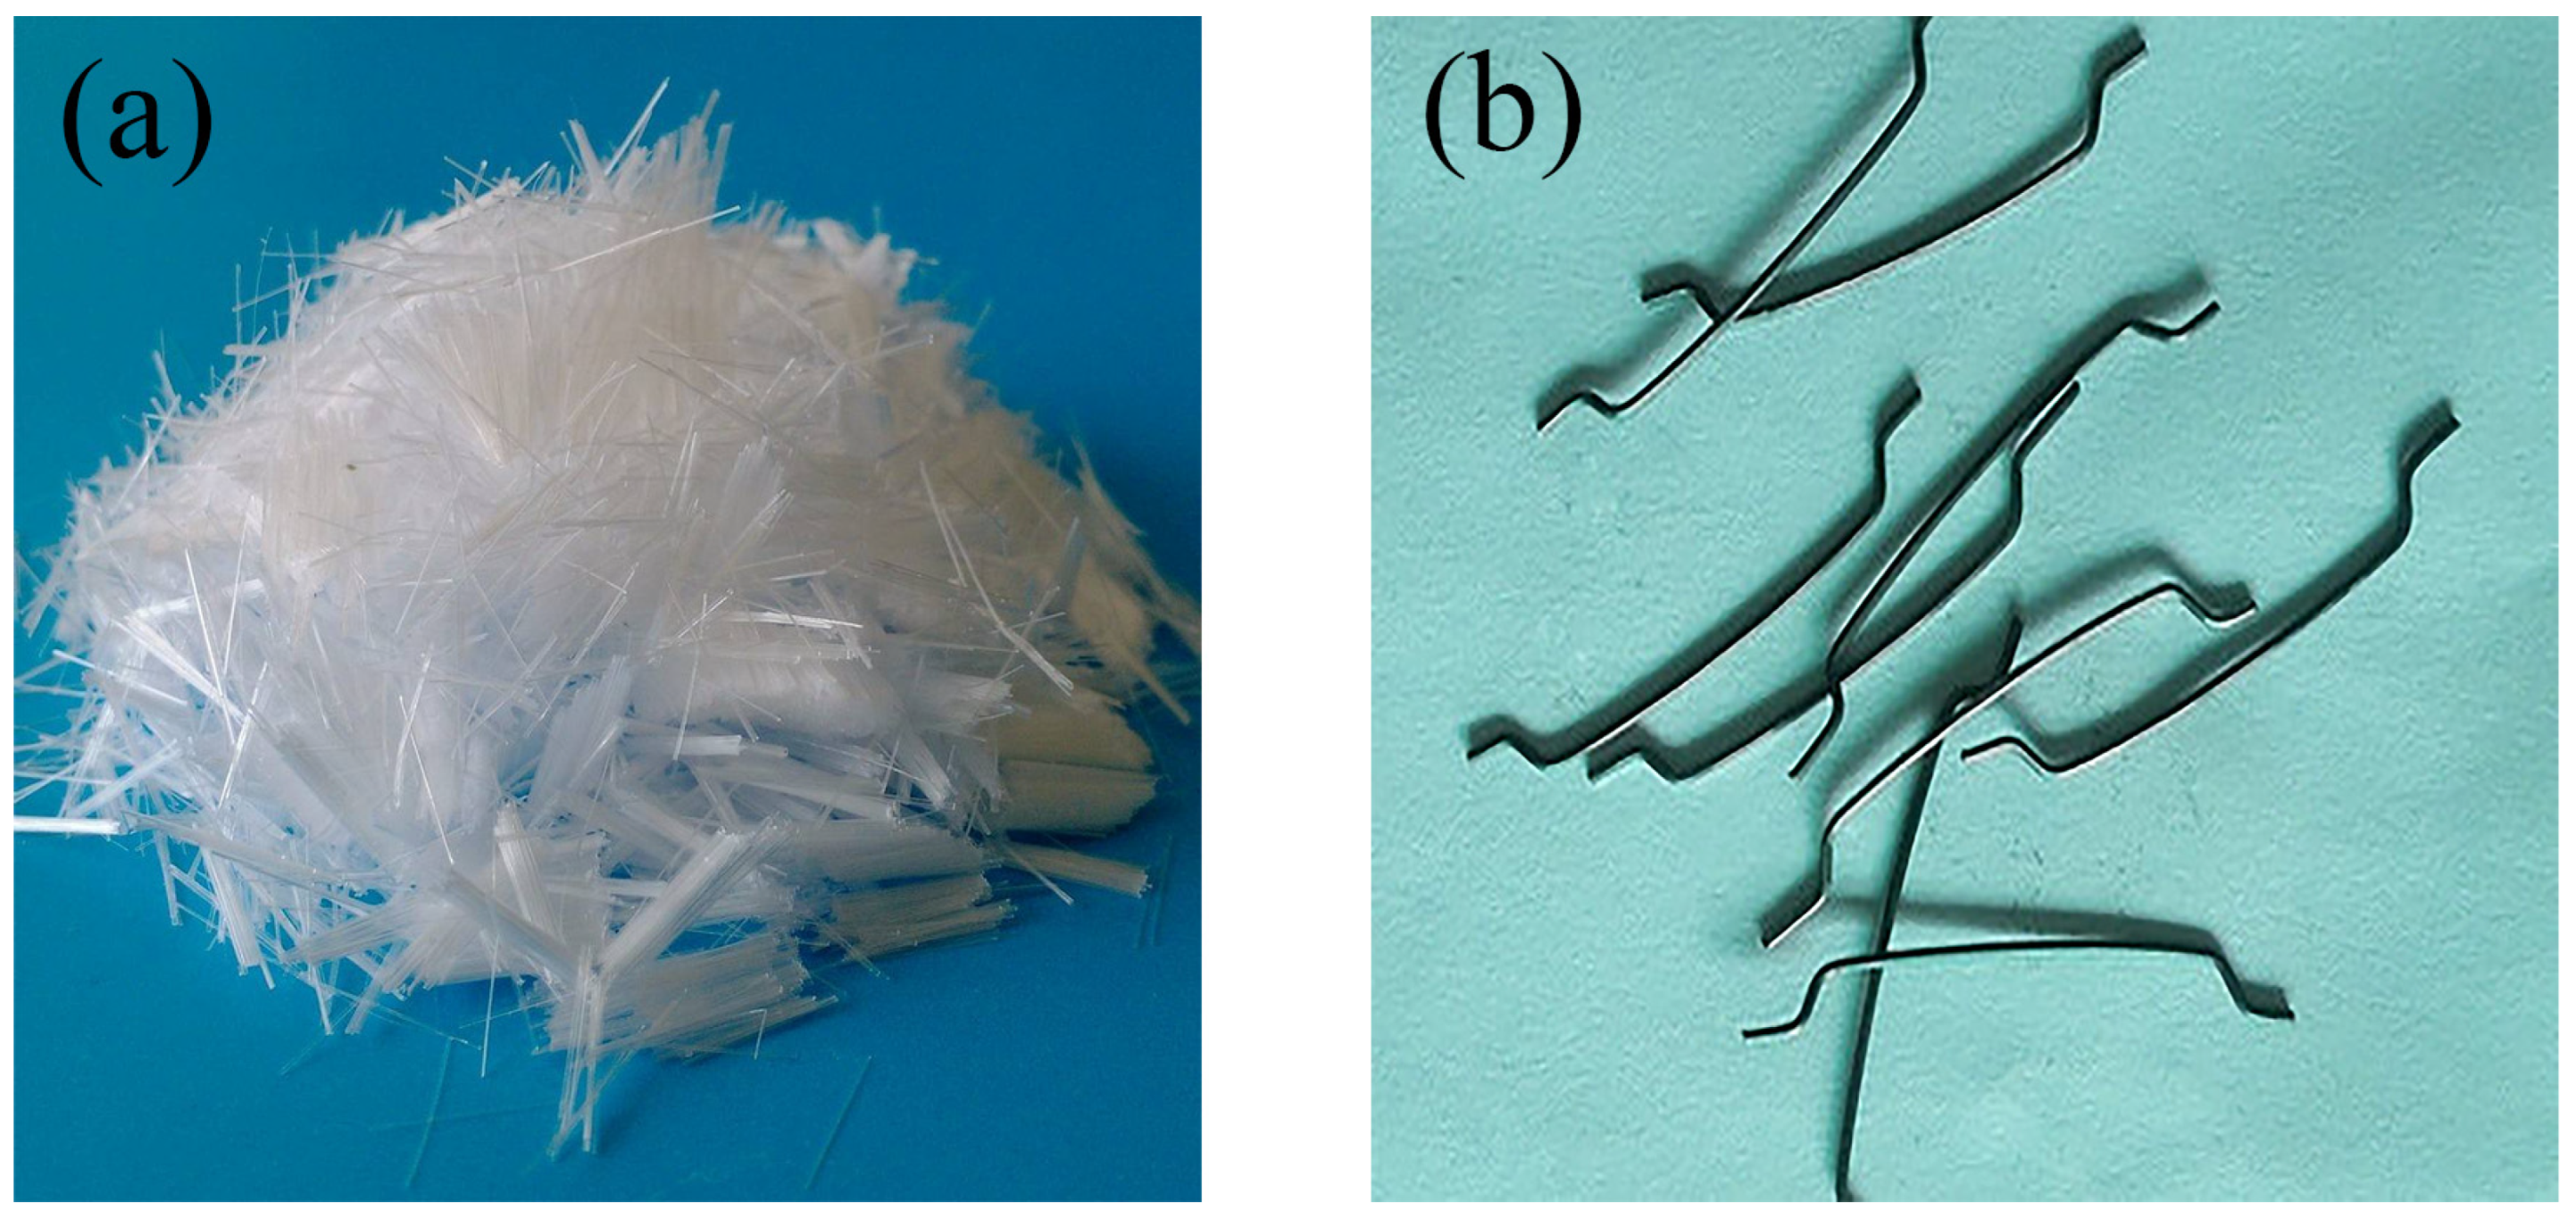
2.1. Materials
2.2. Mixture Proportions
2.3. Experiment and Methodology
3. Test Results and Discussion
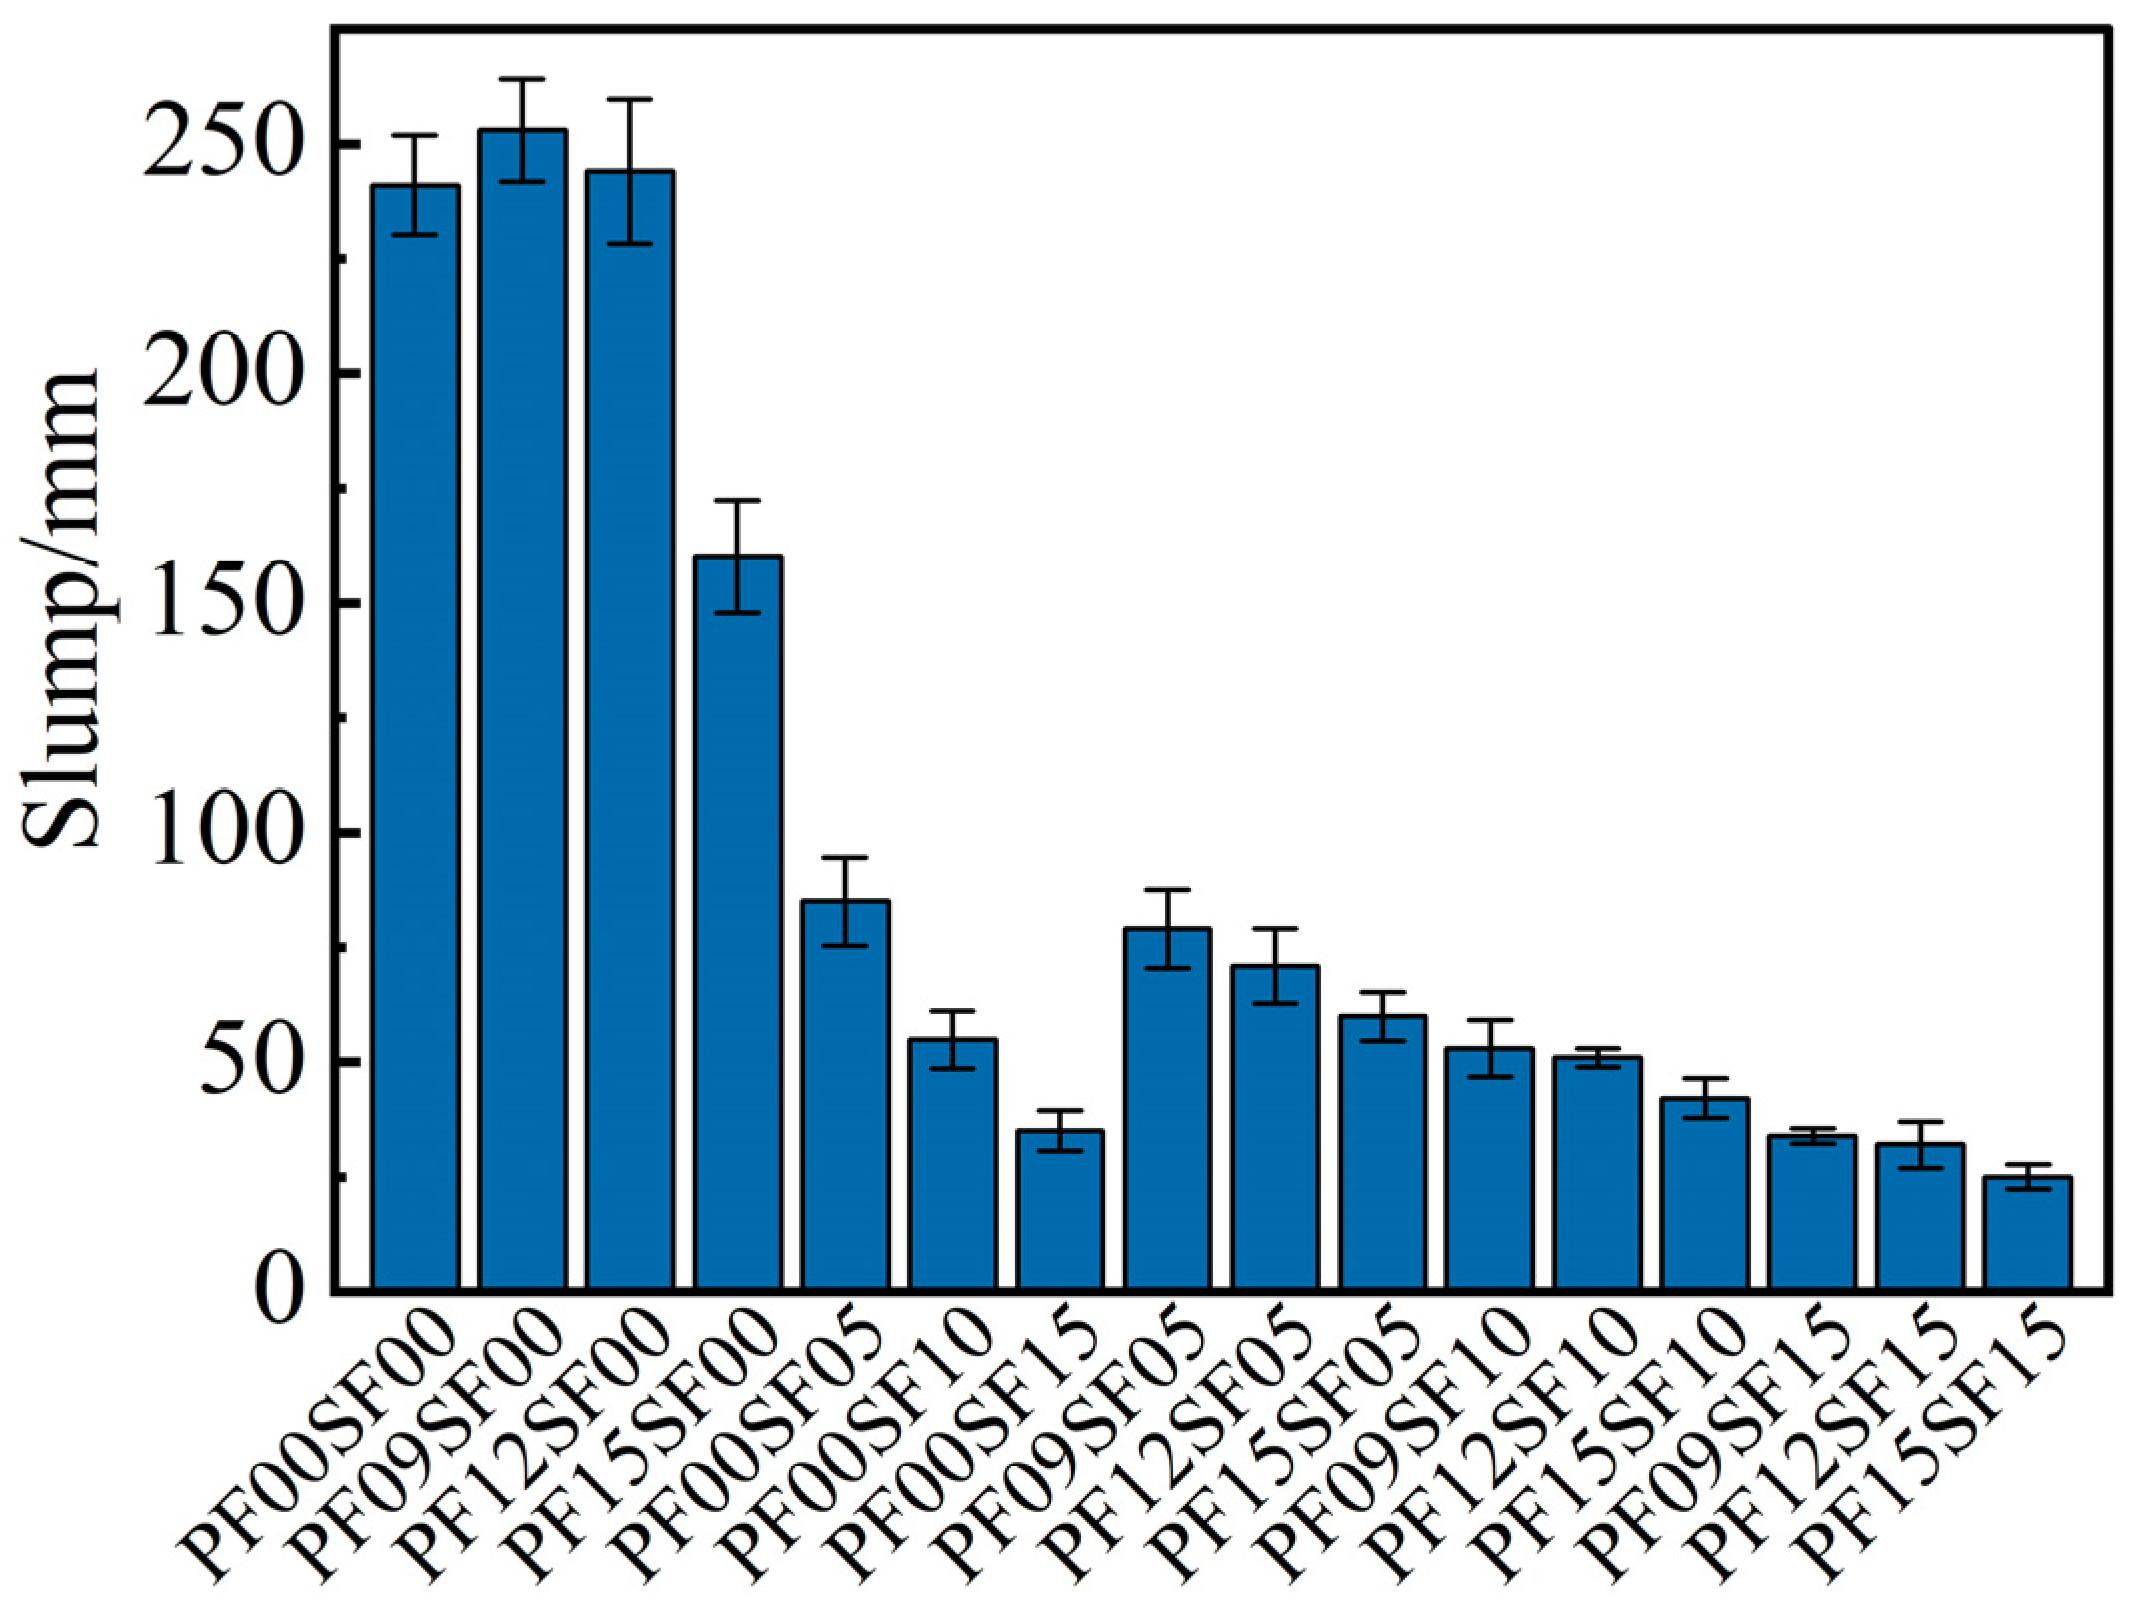
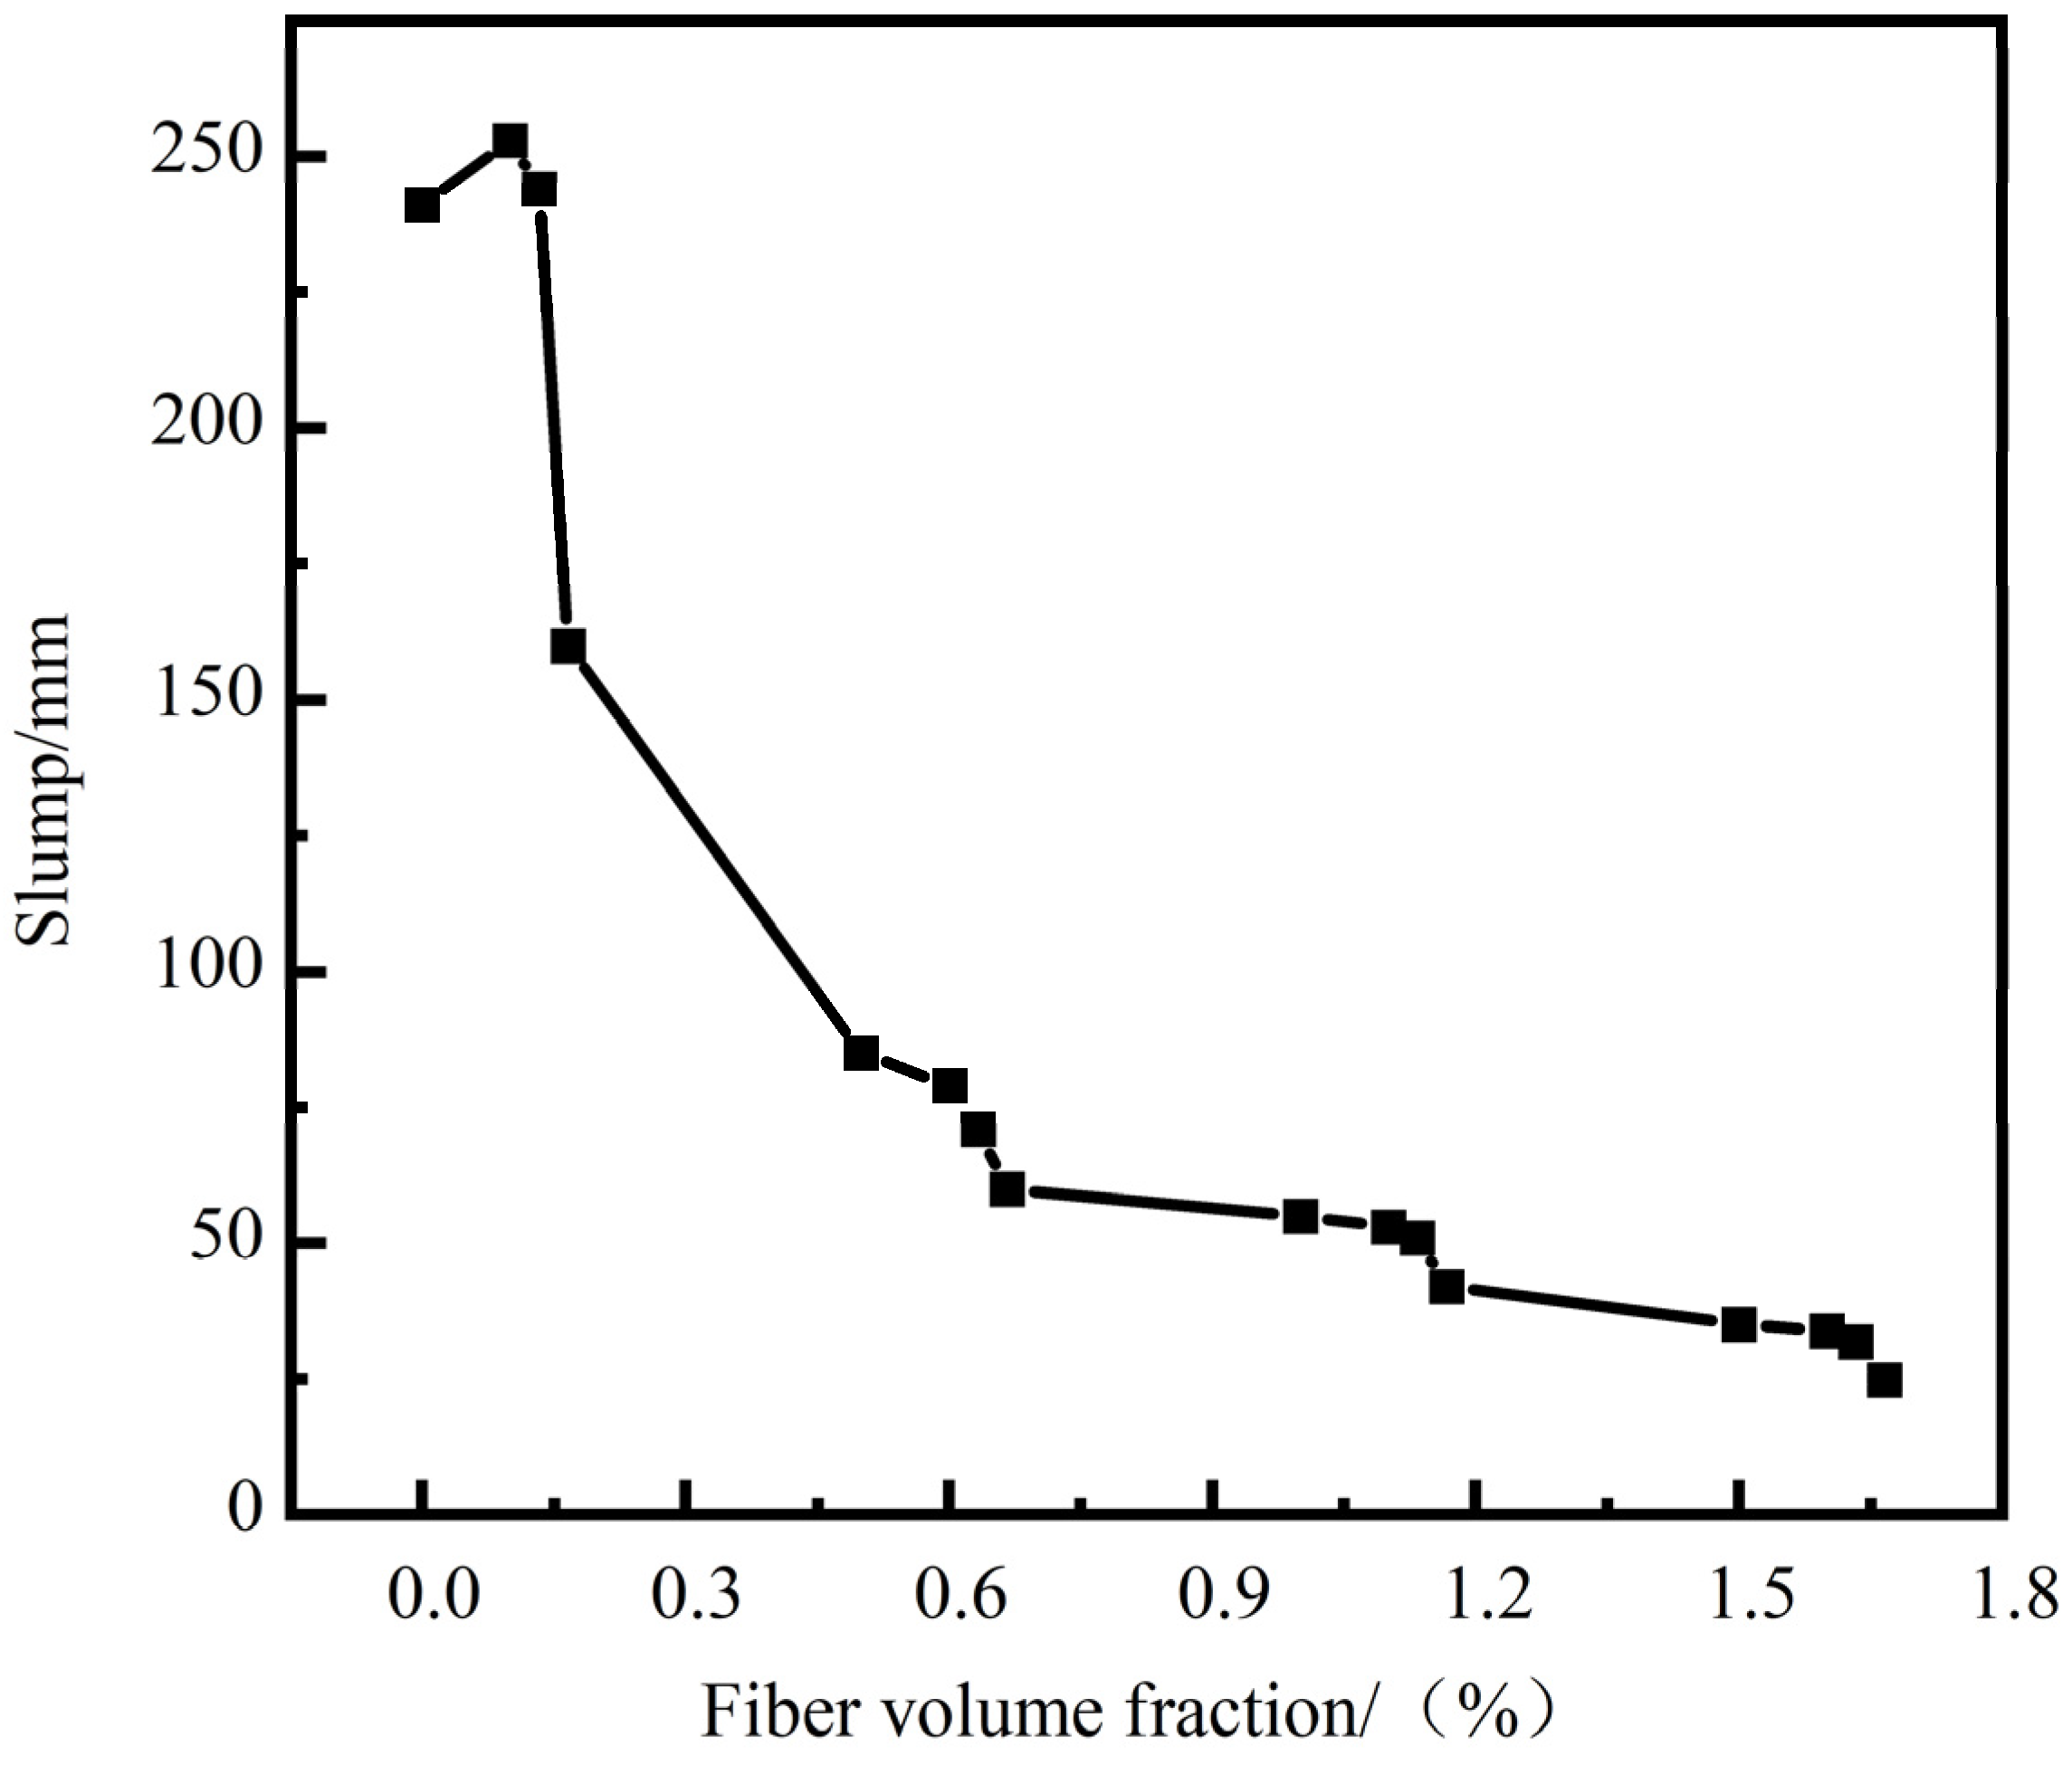
3.1. Slump
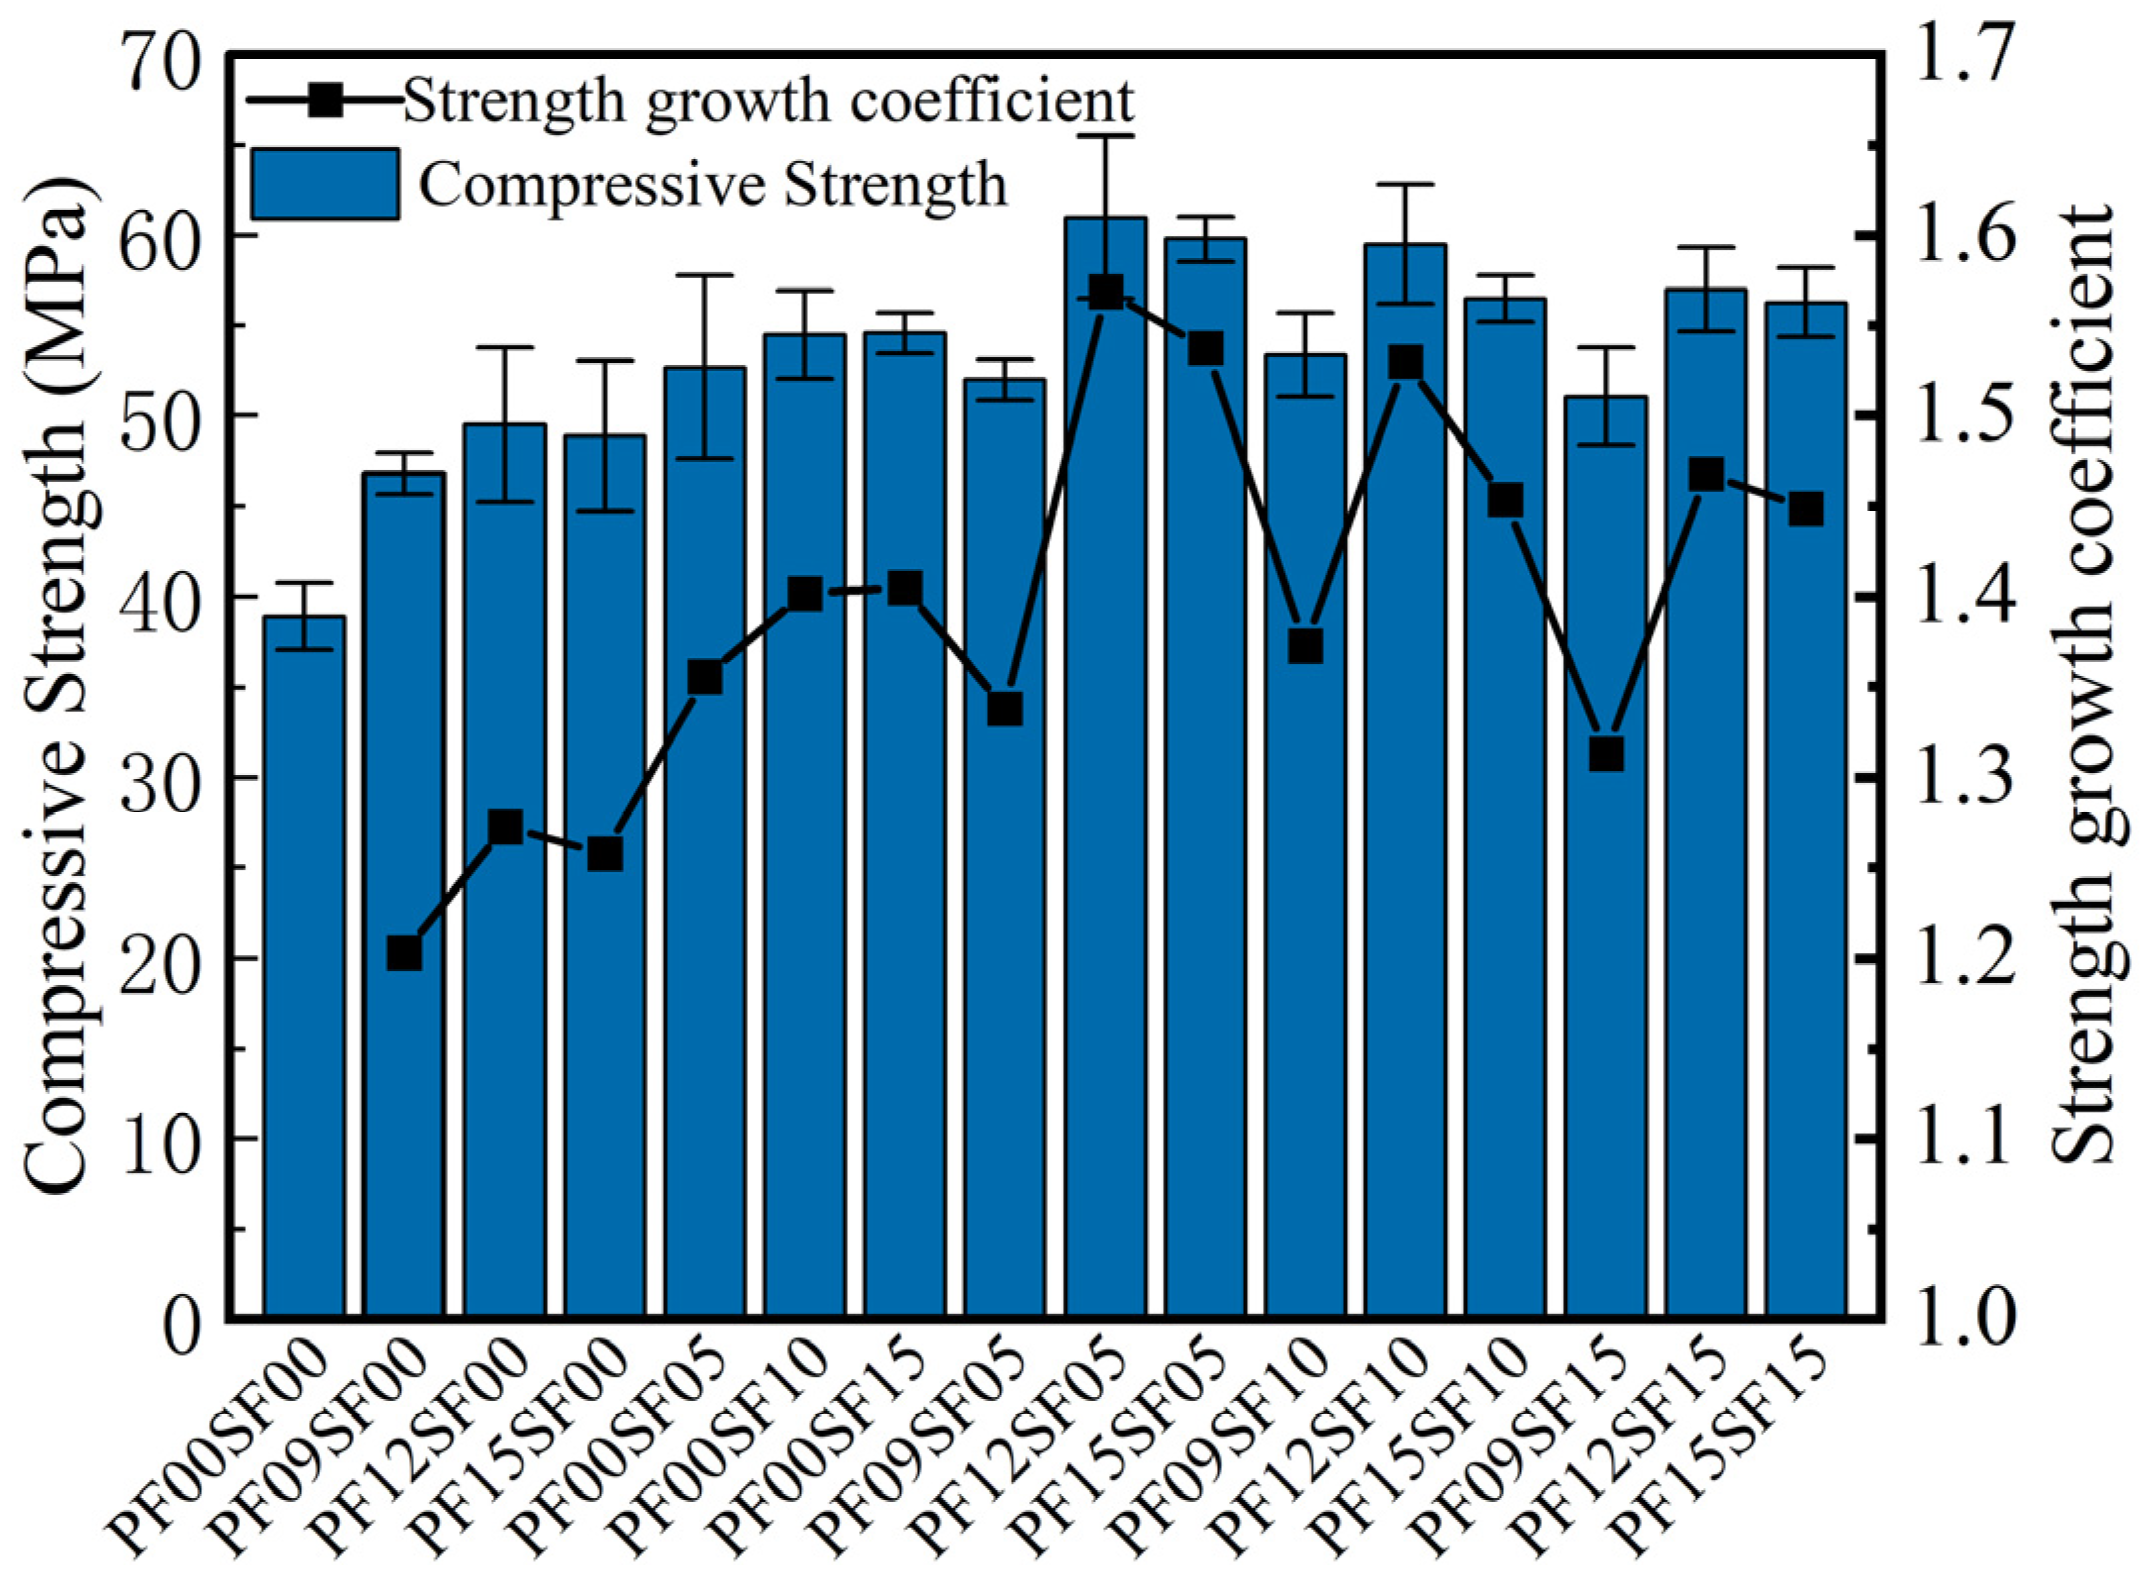
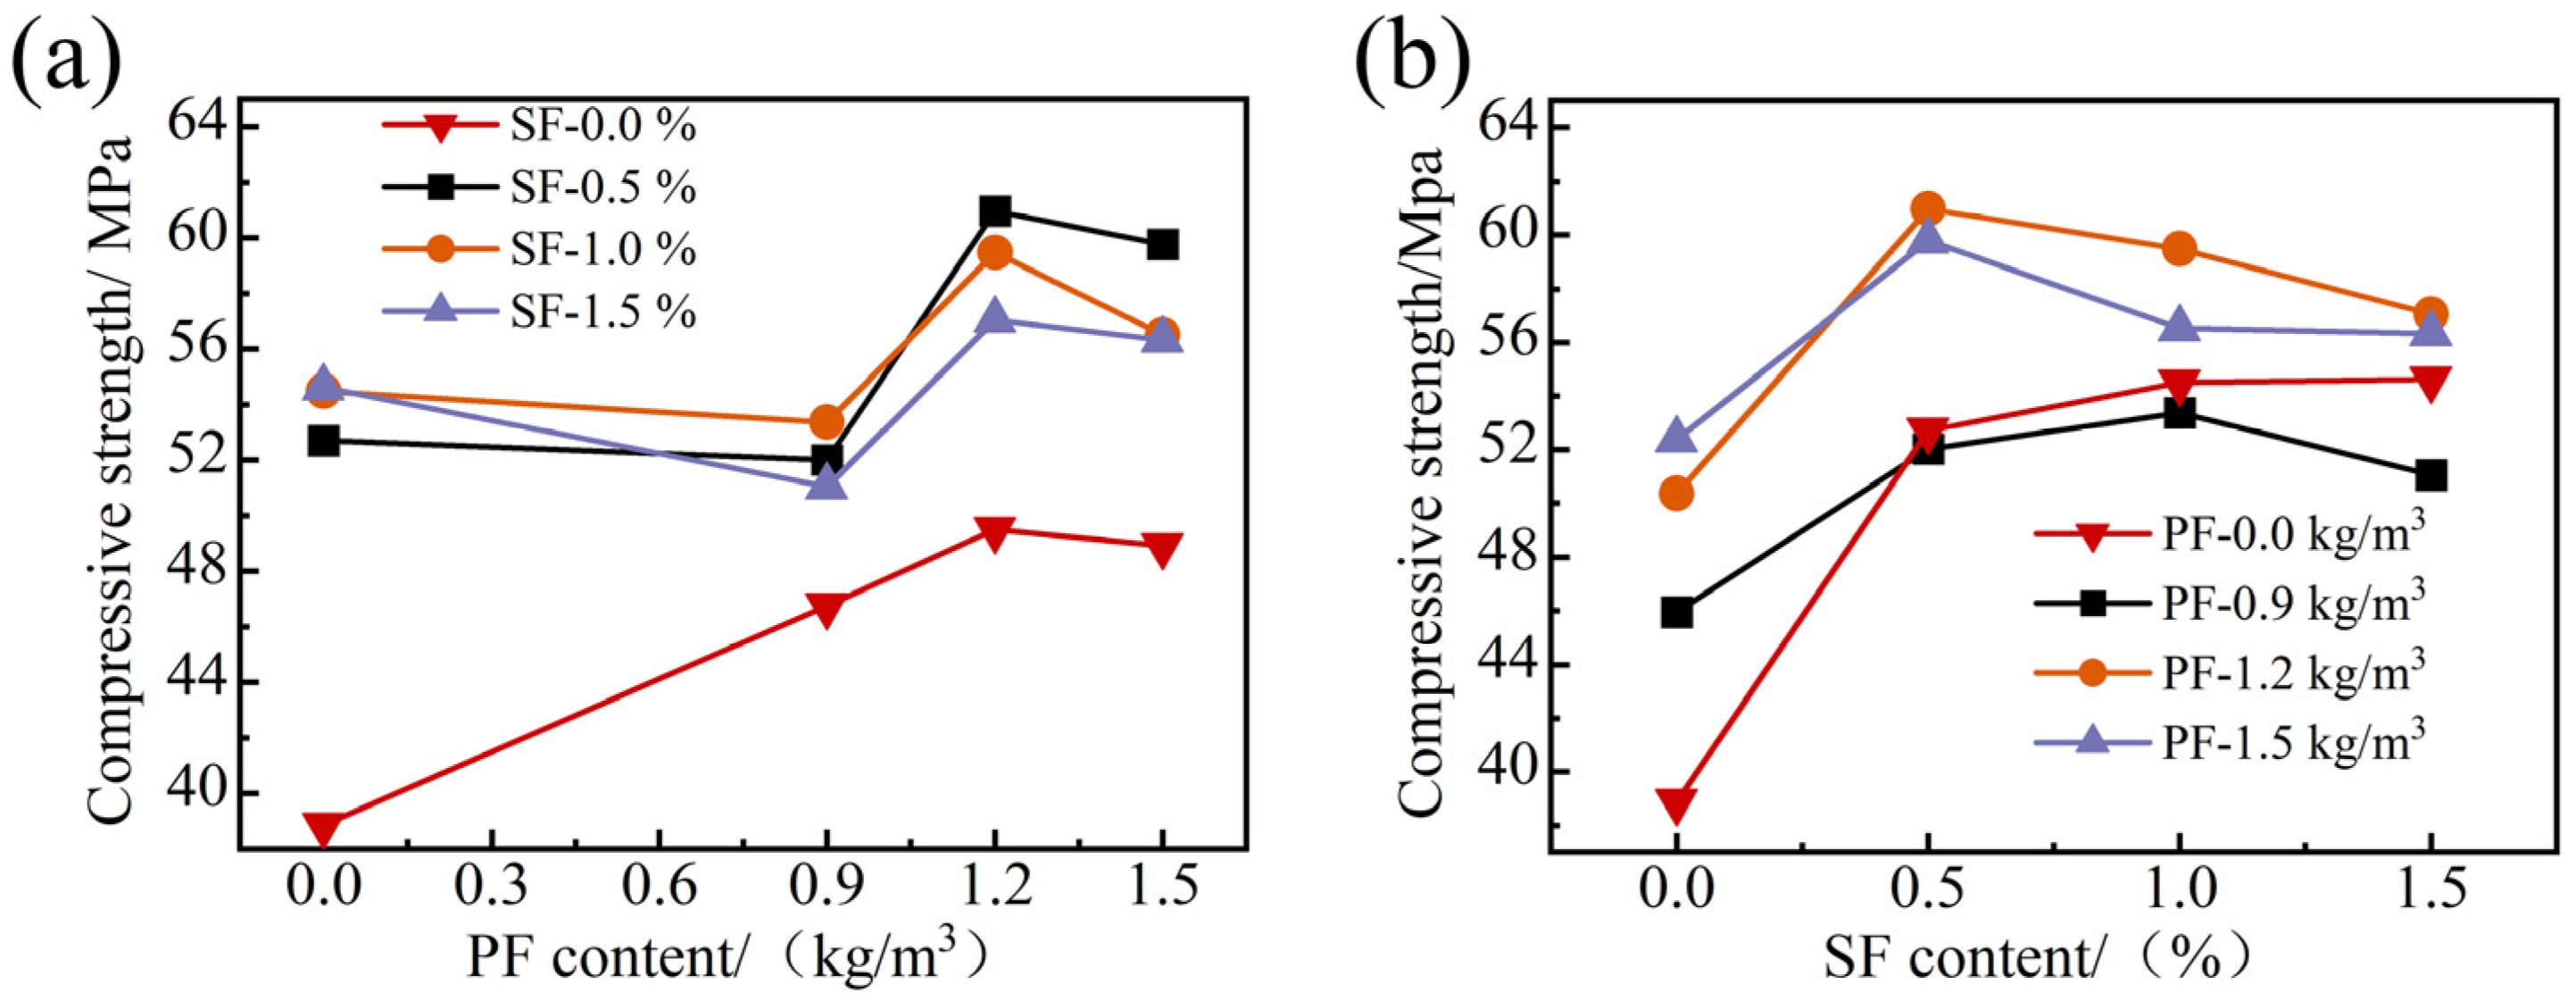
3.2. Cube Compressive Strength
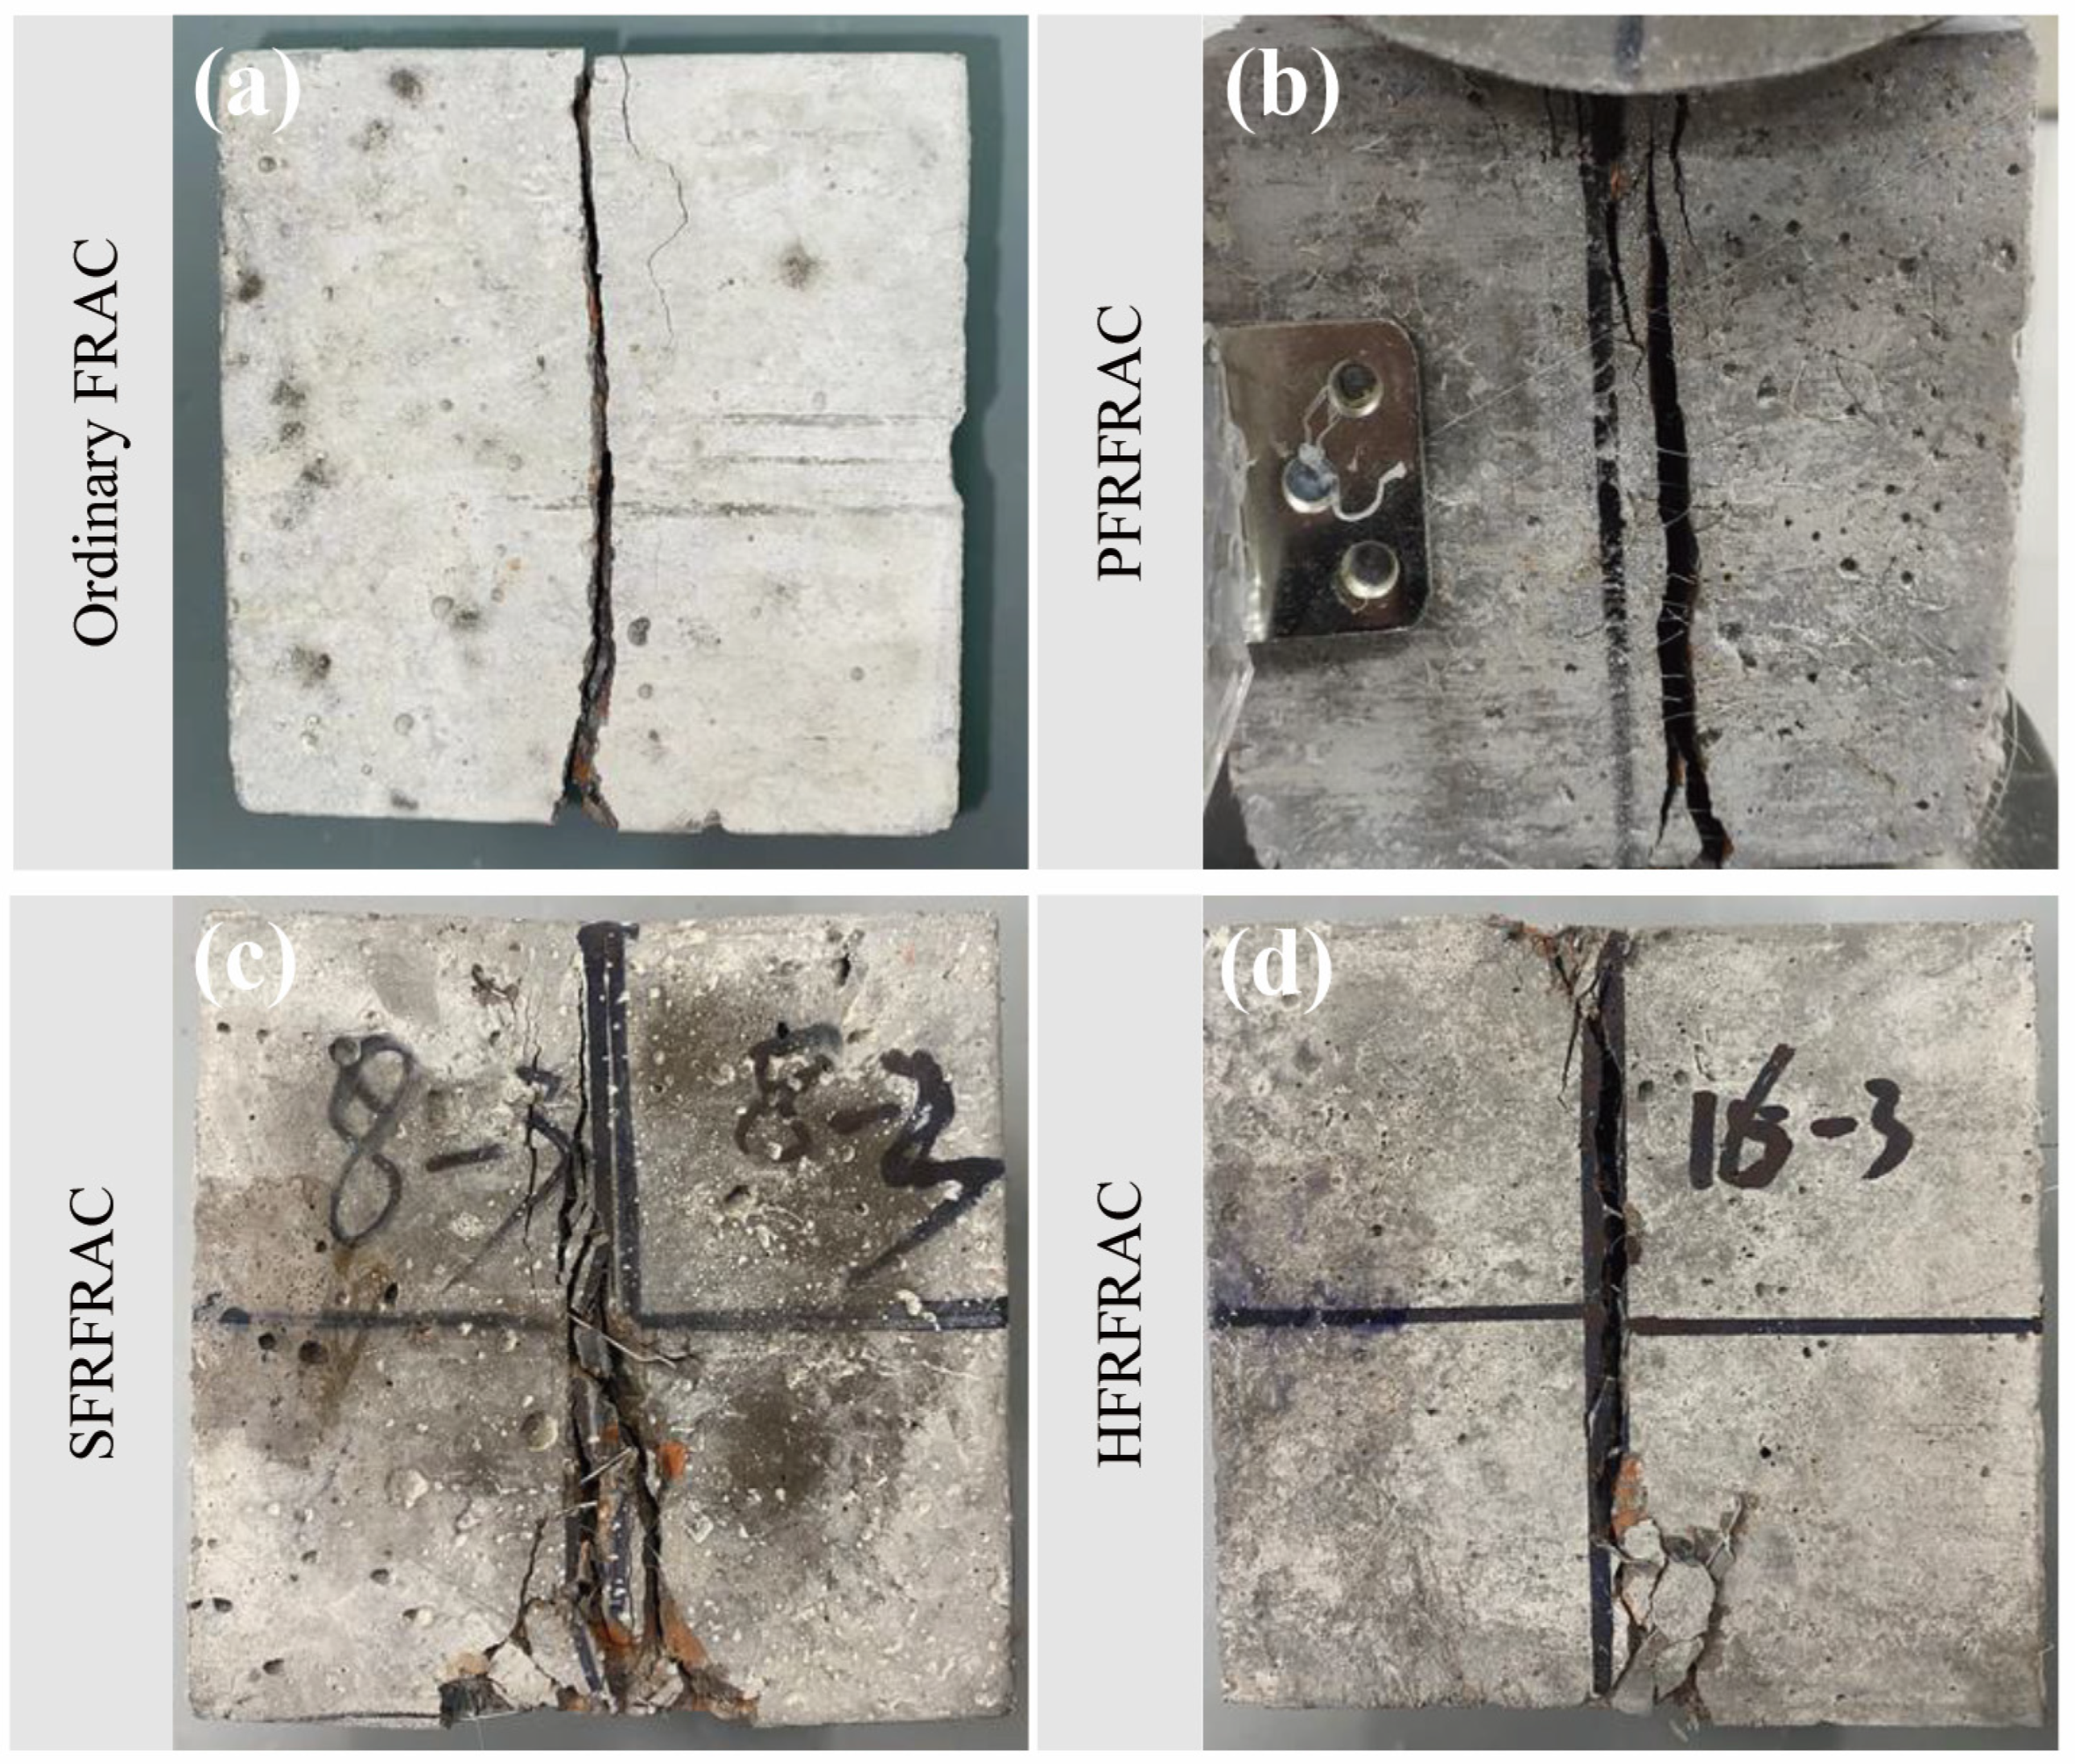
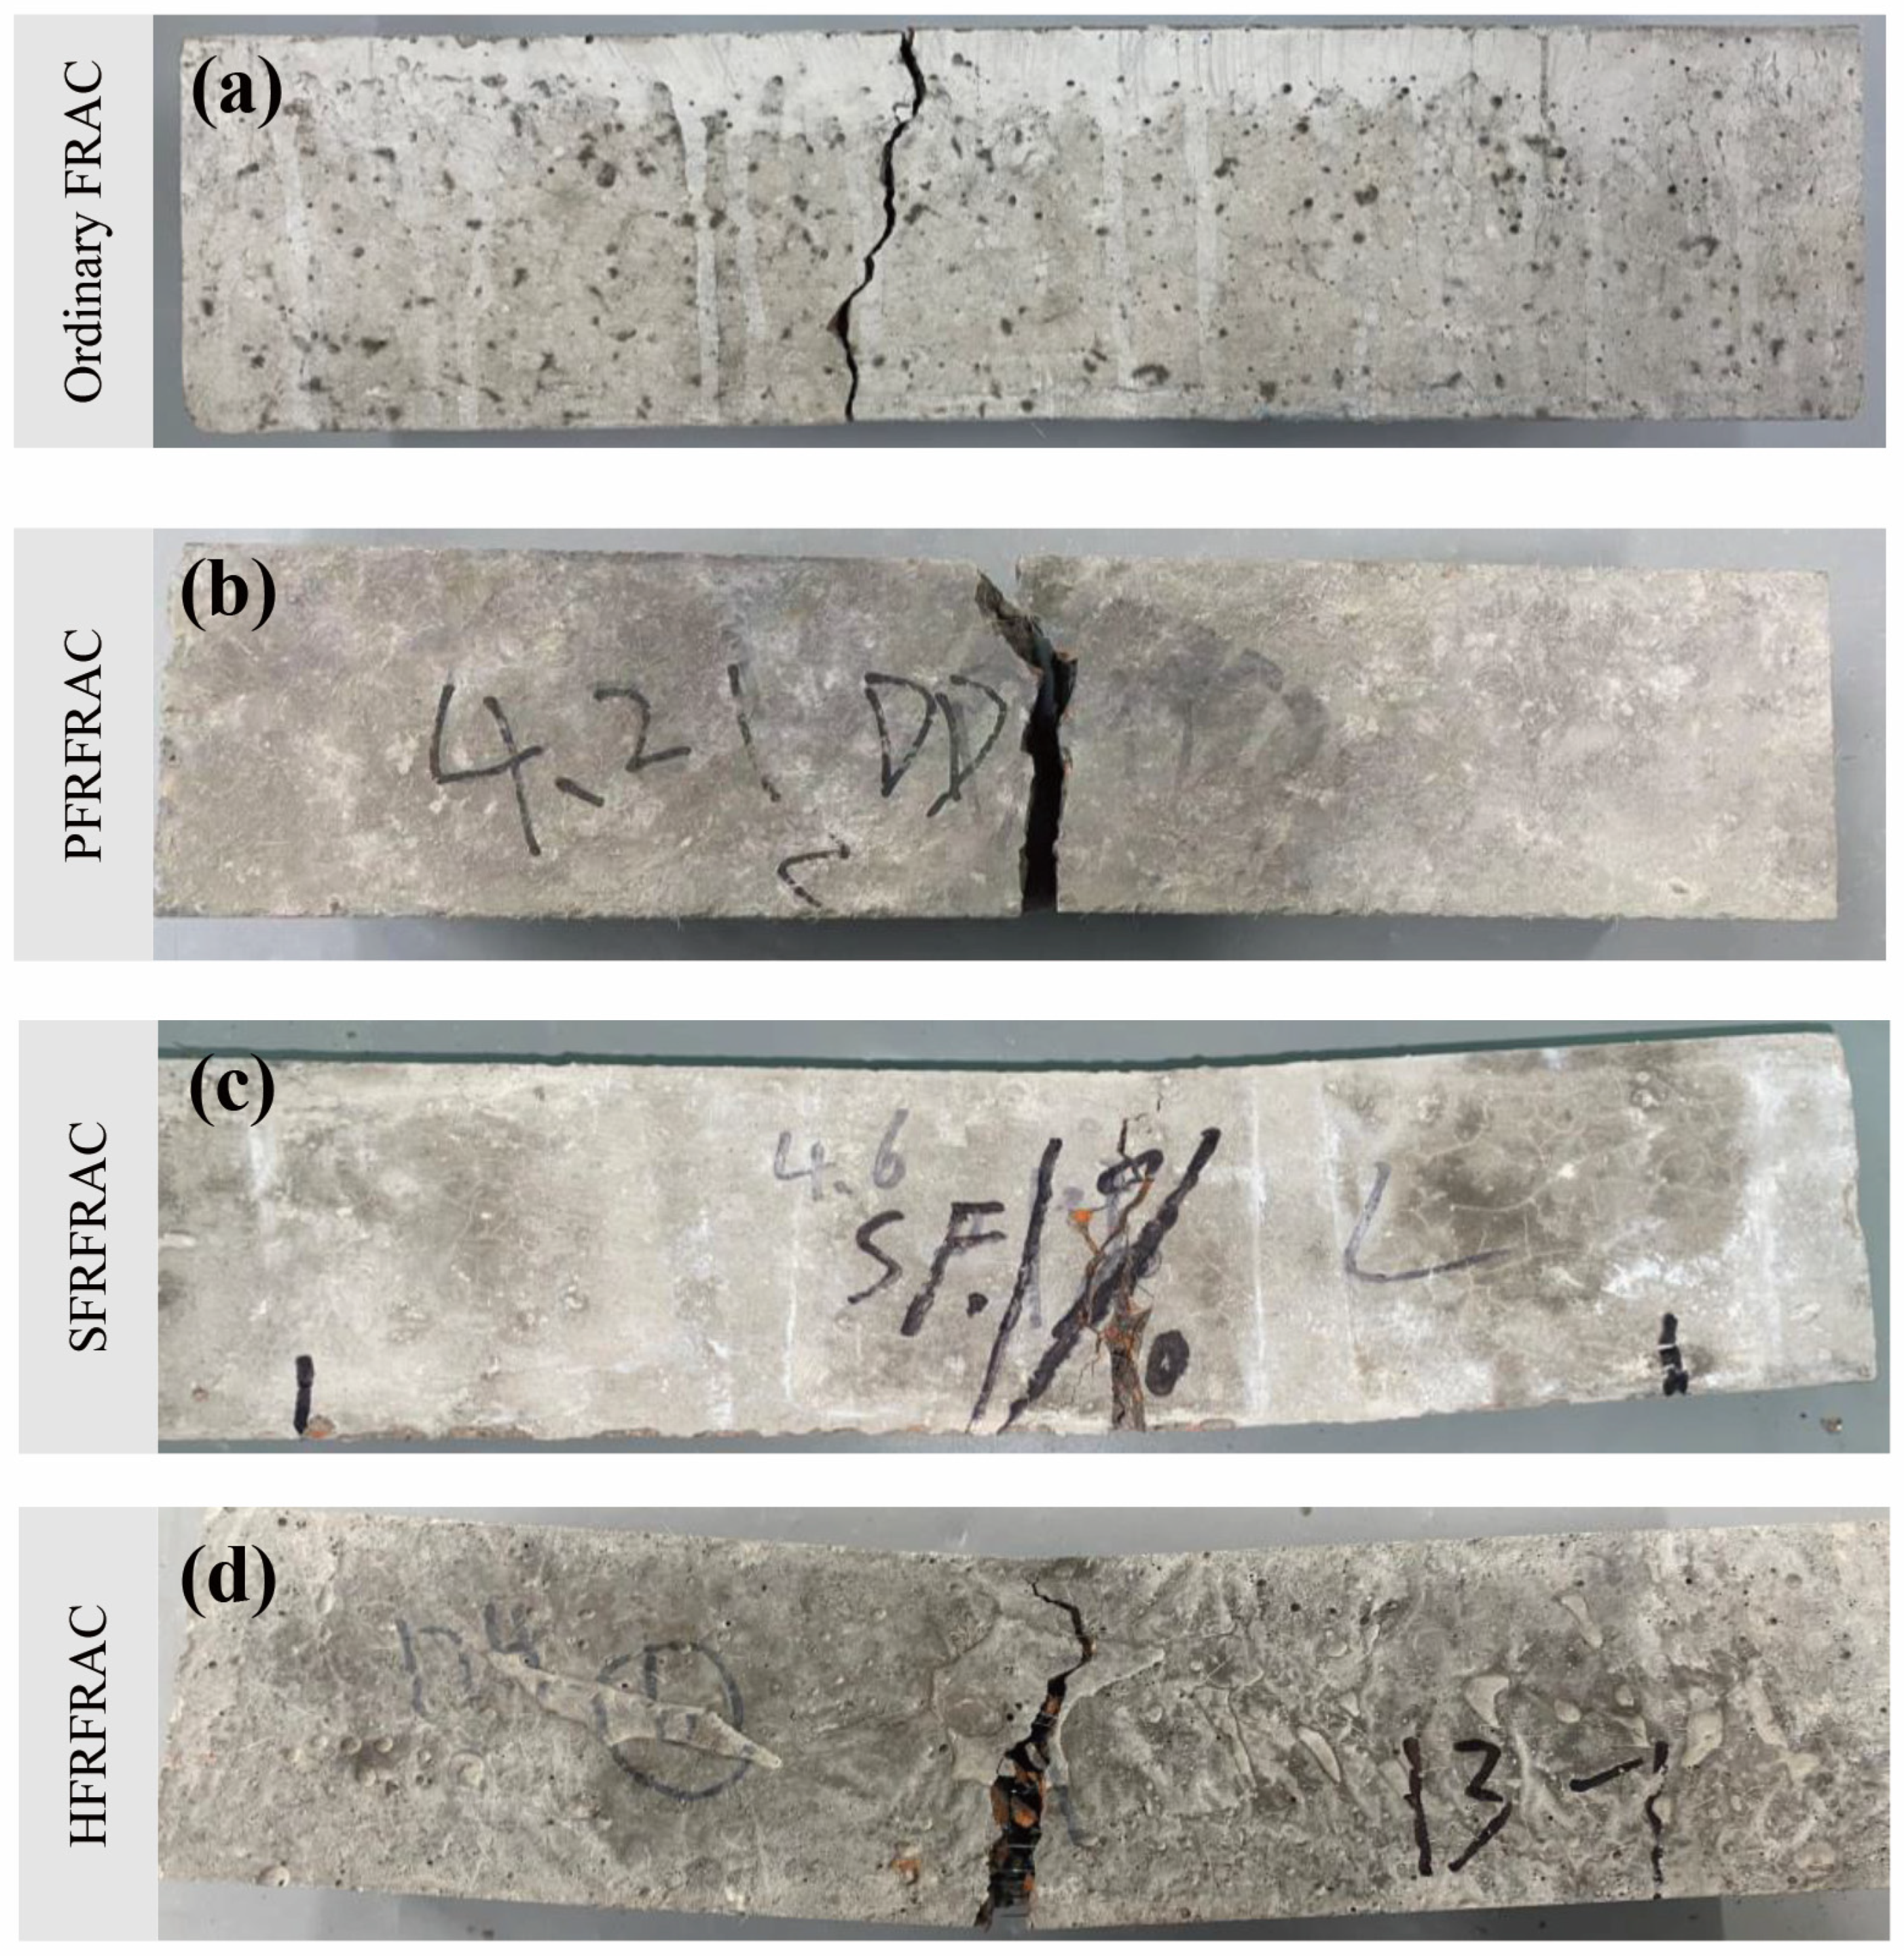
3.2.1. Failure Morphology
3.2.2. Fiber Effect
3.3. Splitting Tensile Performance
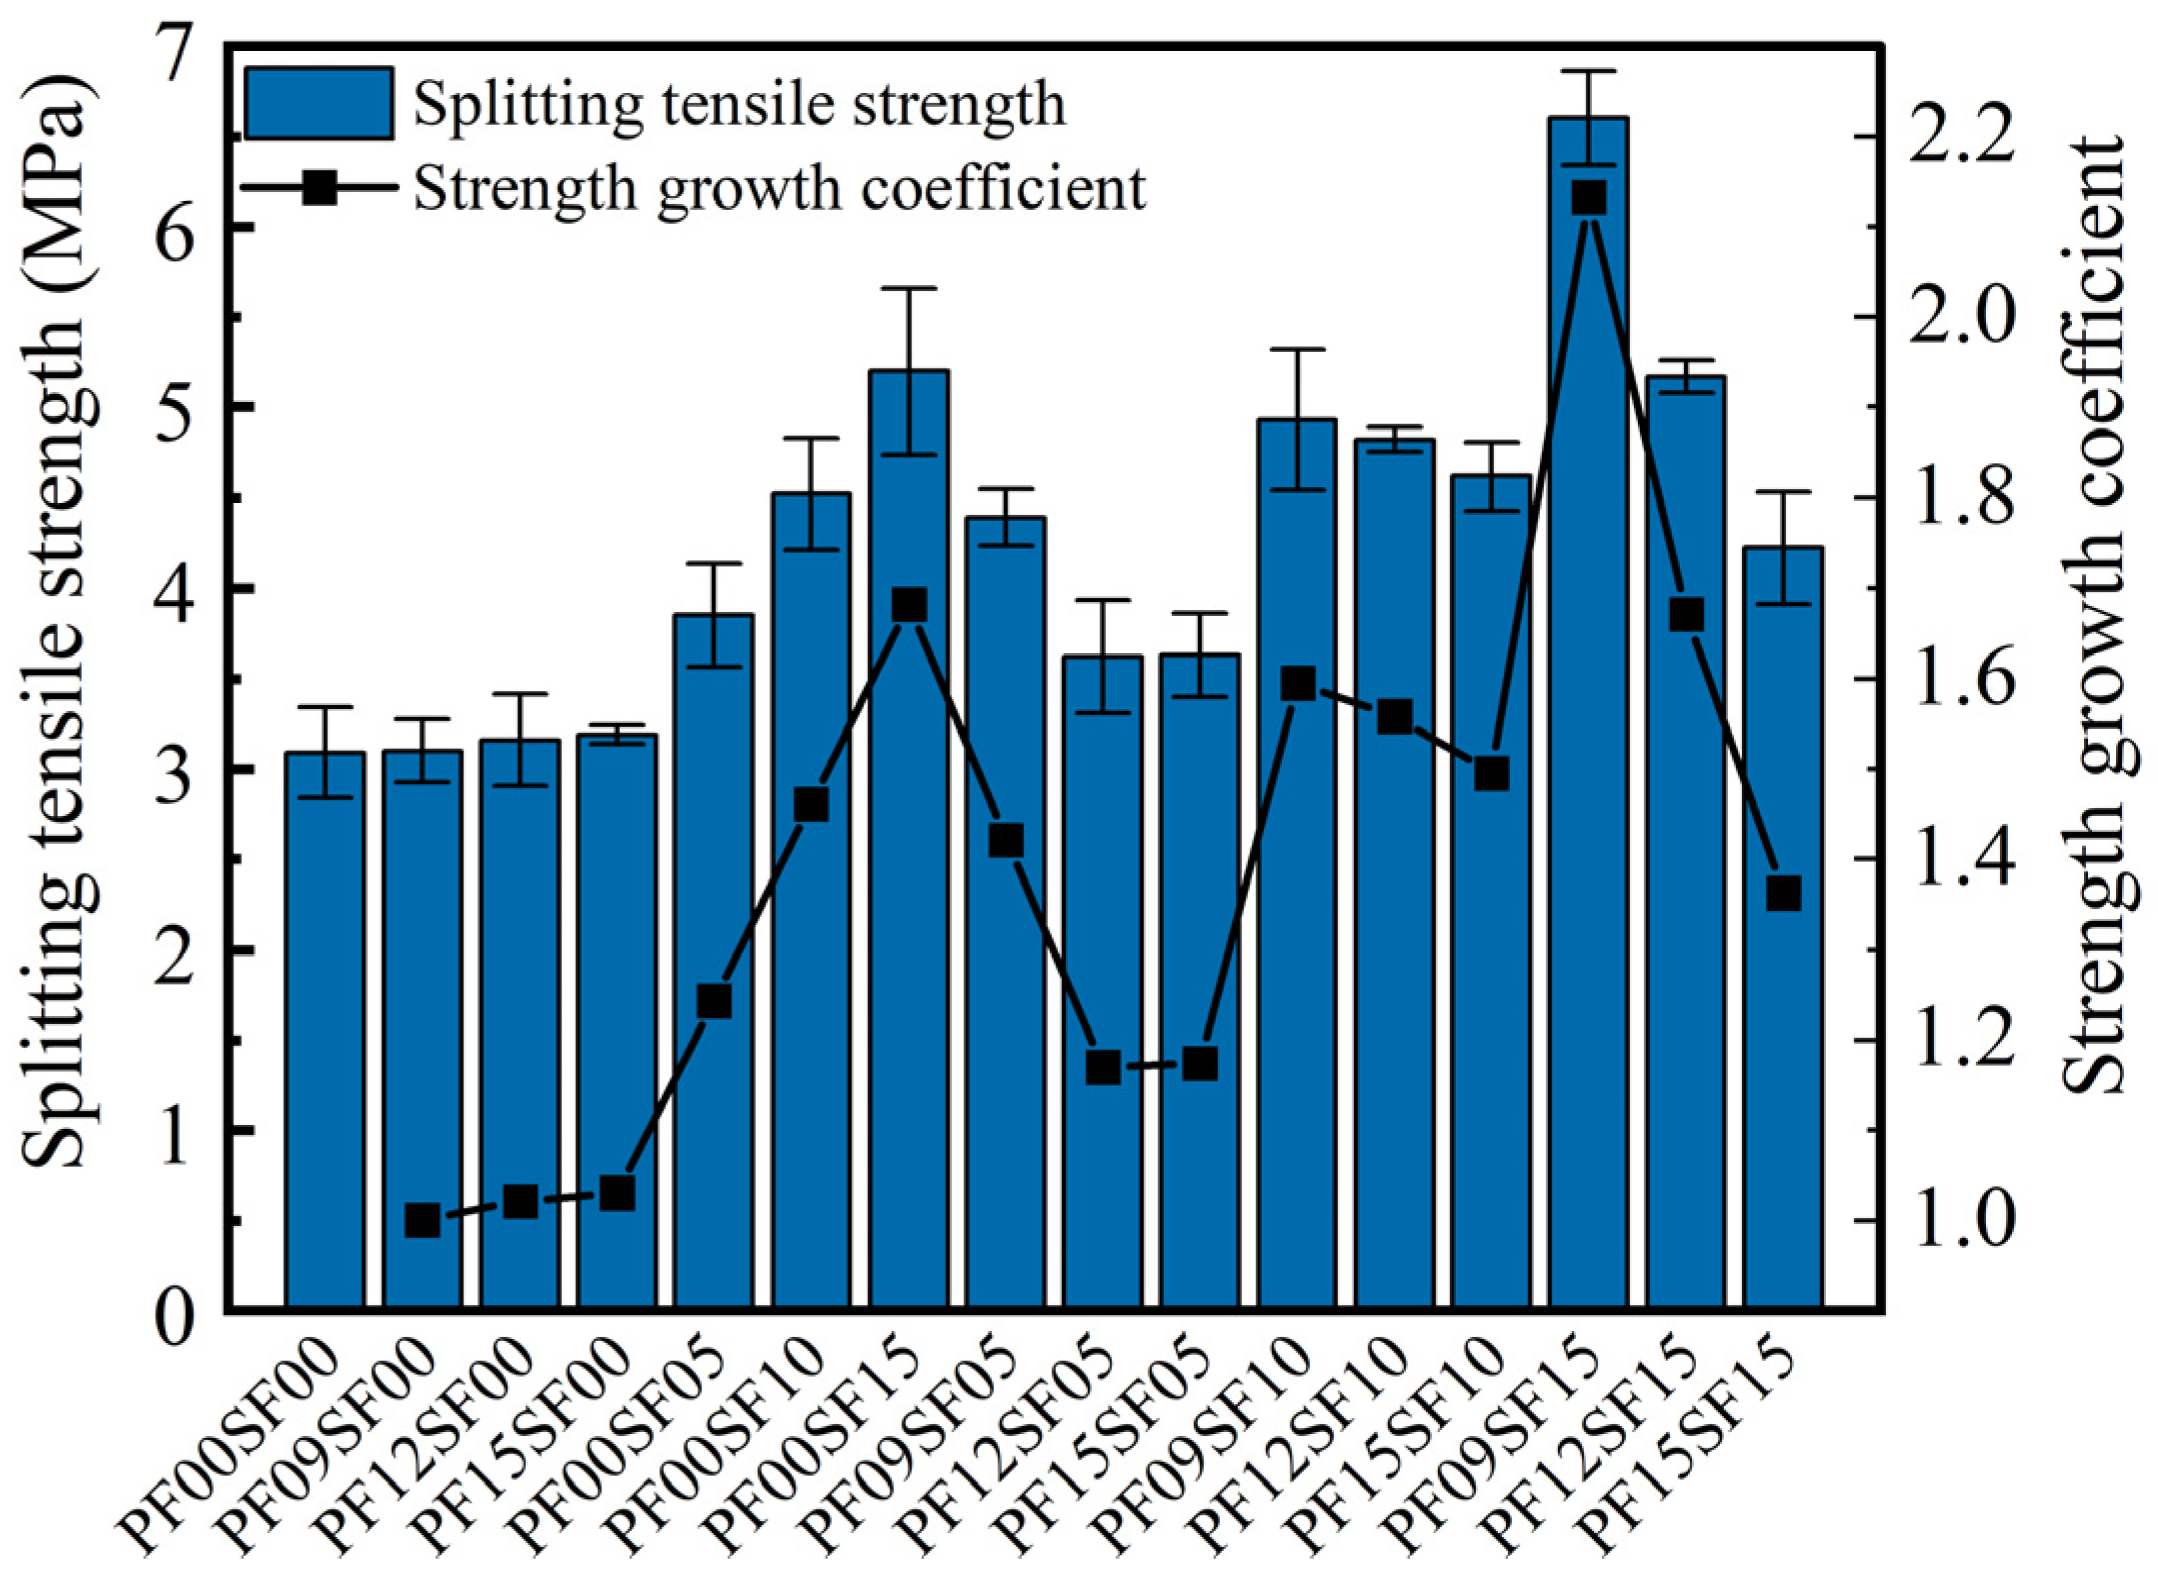
3.3.1. Splitting Tensile Strength
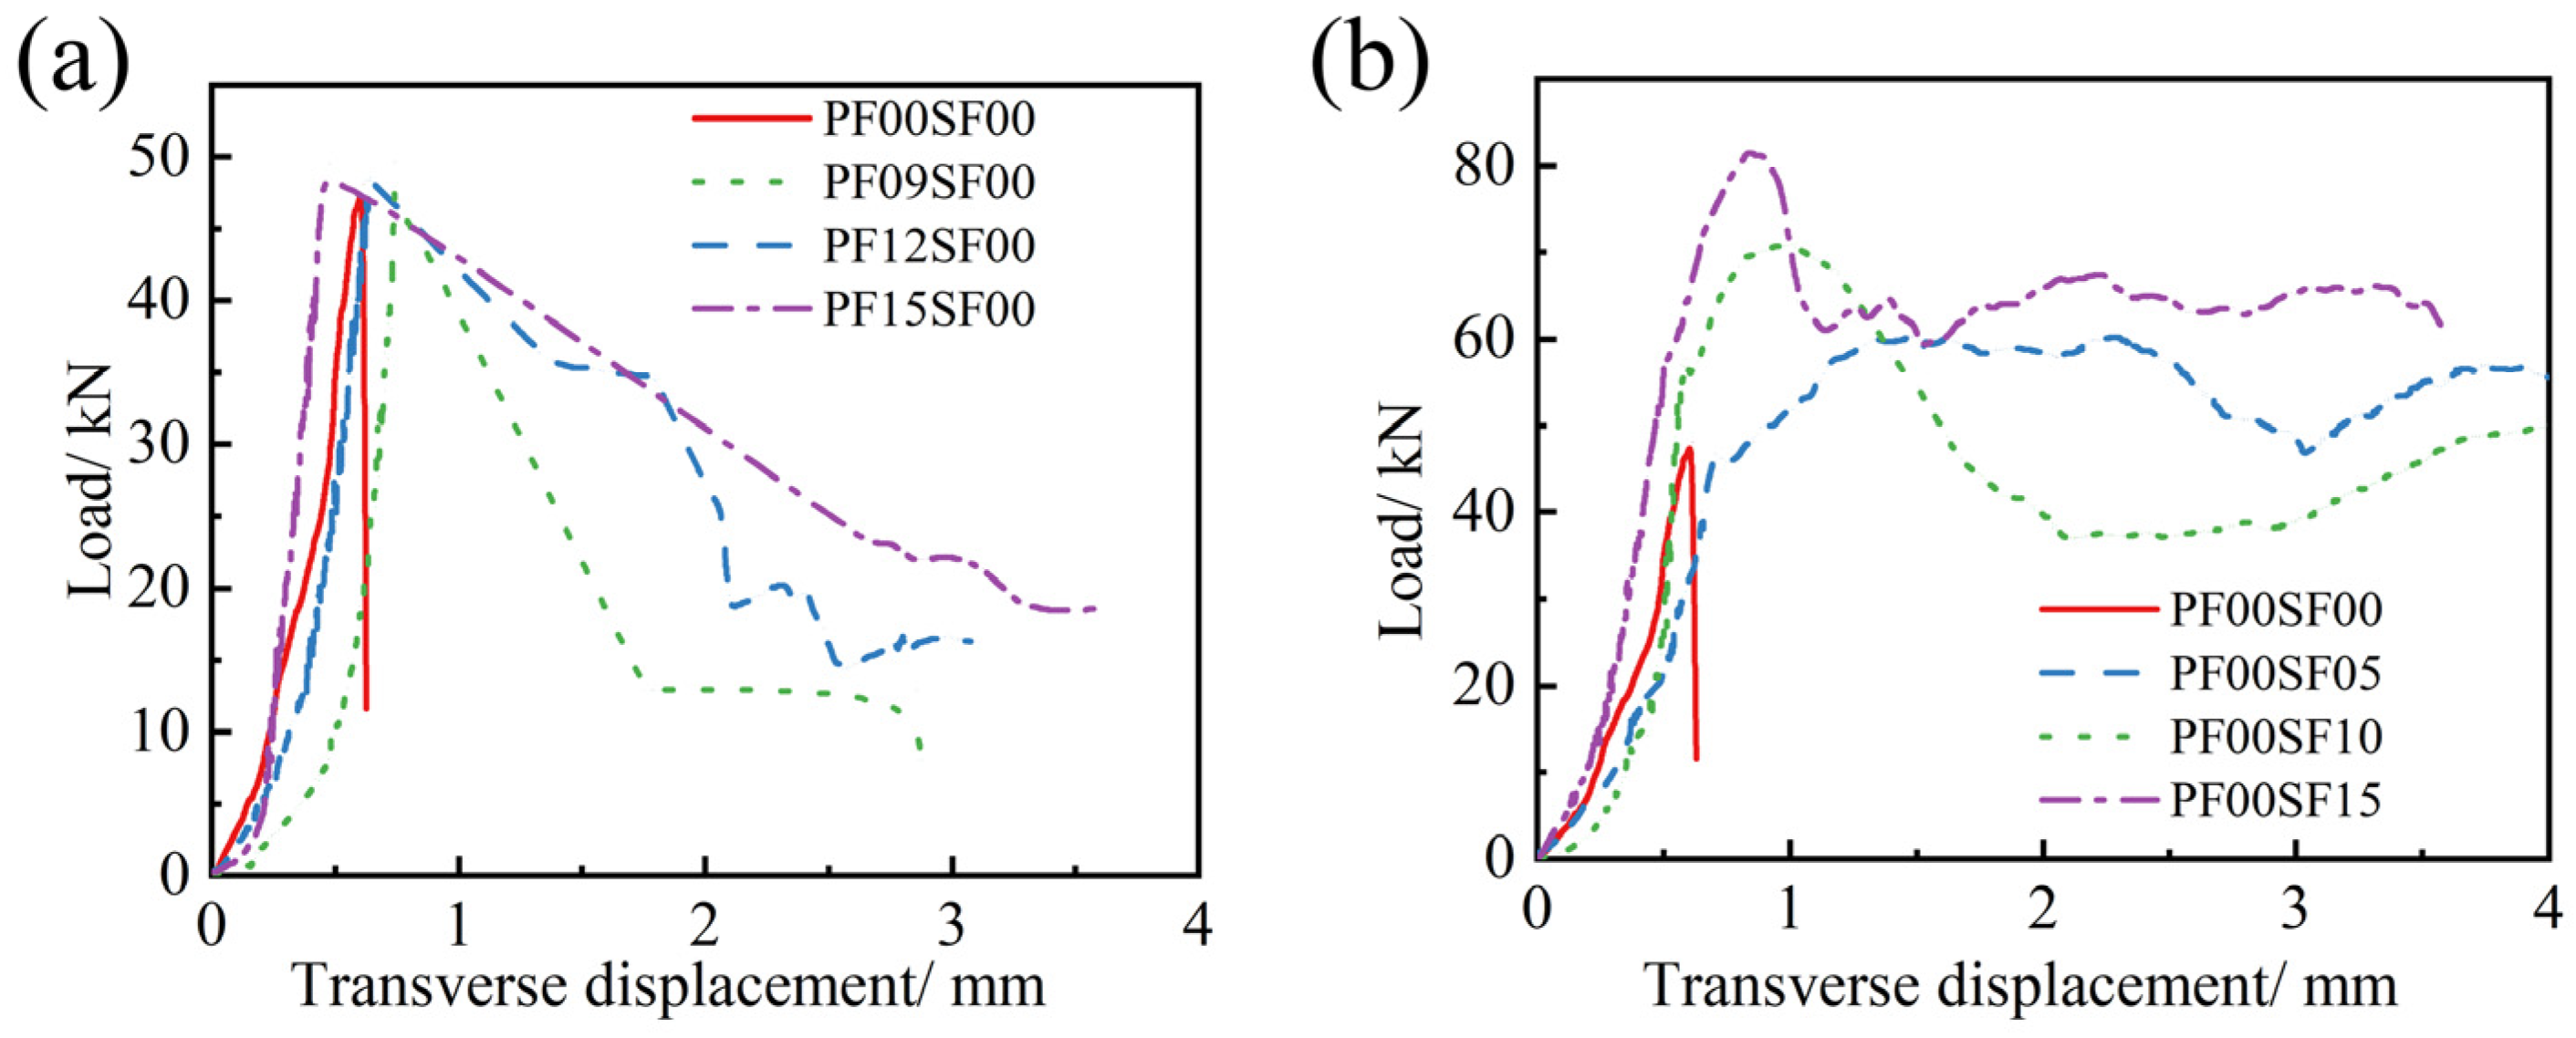
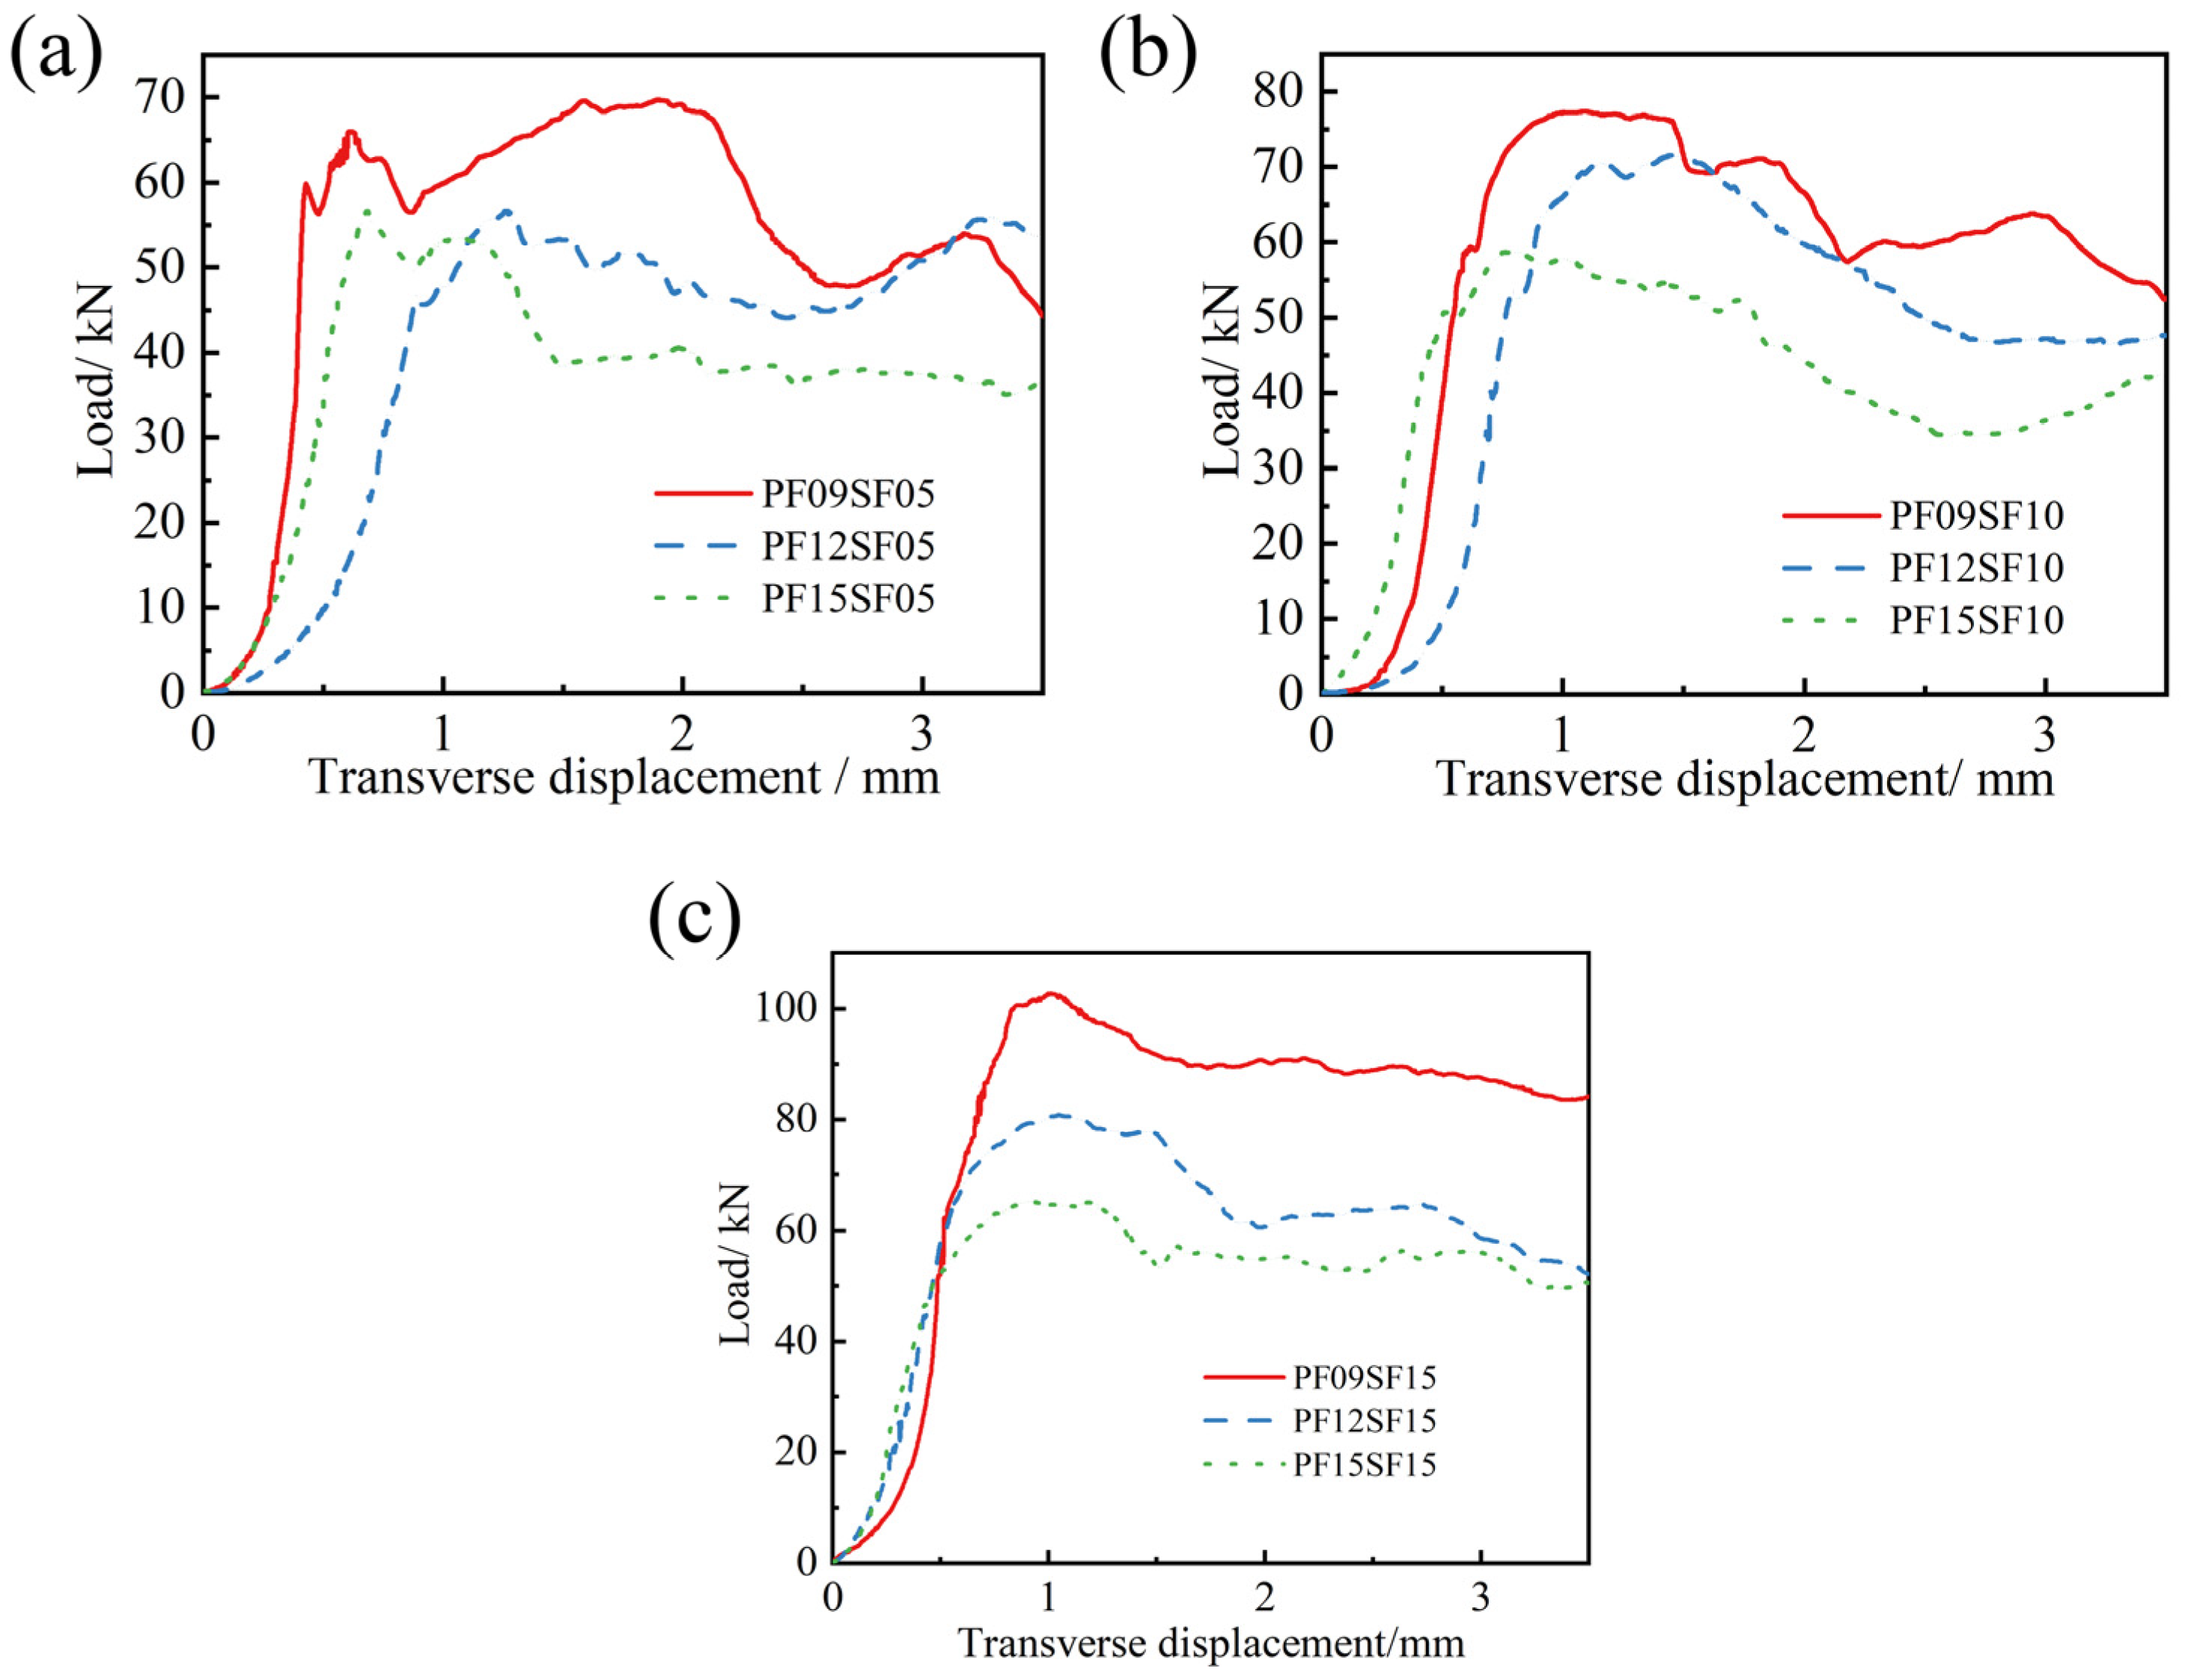
3.3.2. Load–Displacement Curve
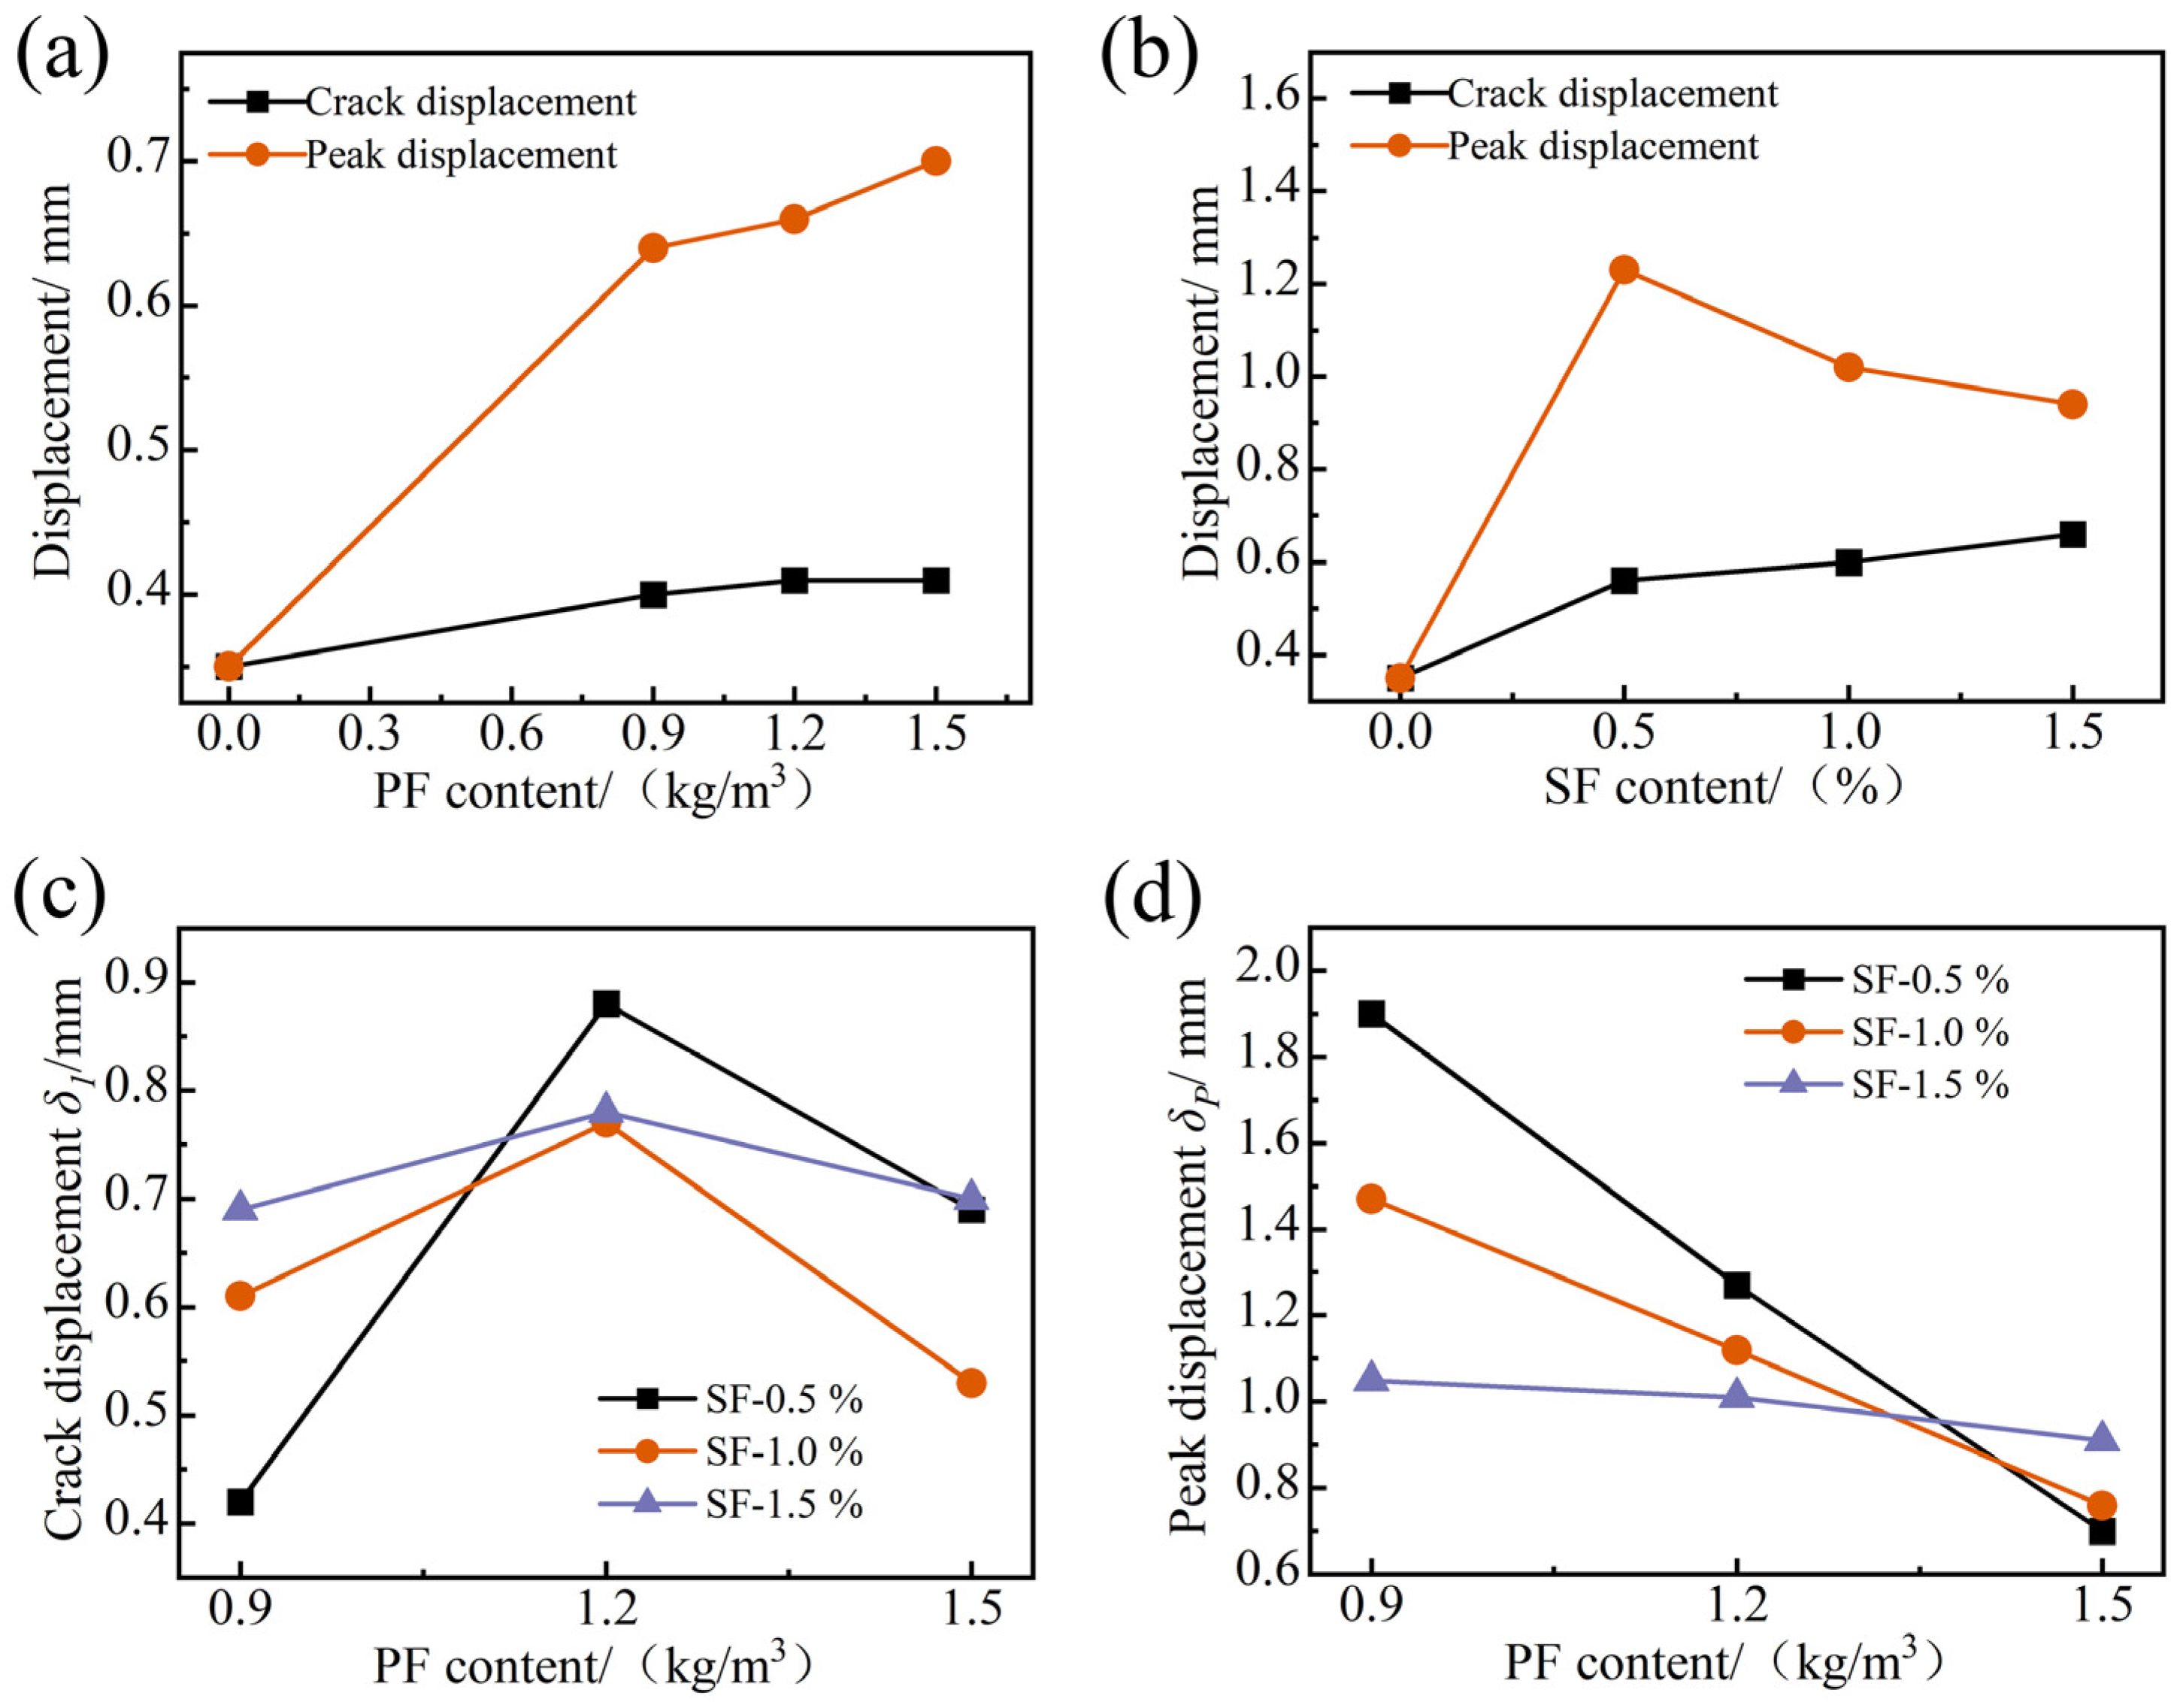
3.3.3. Transverse Displacement
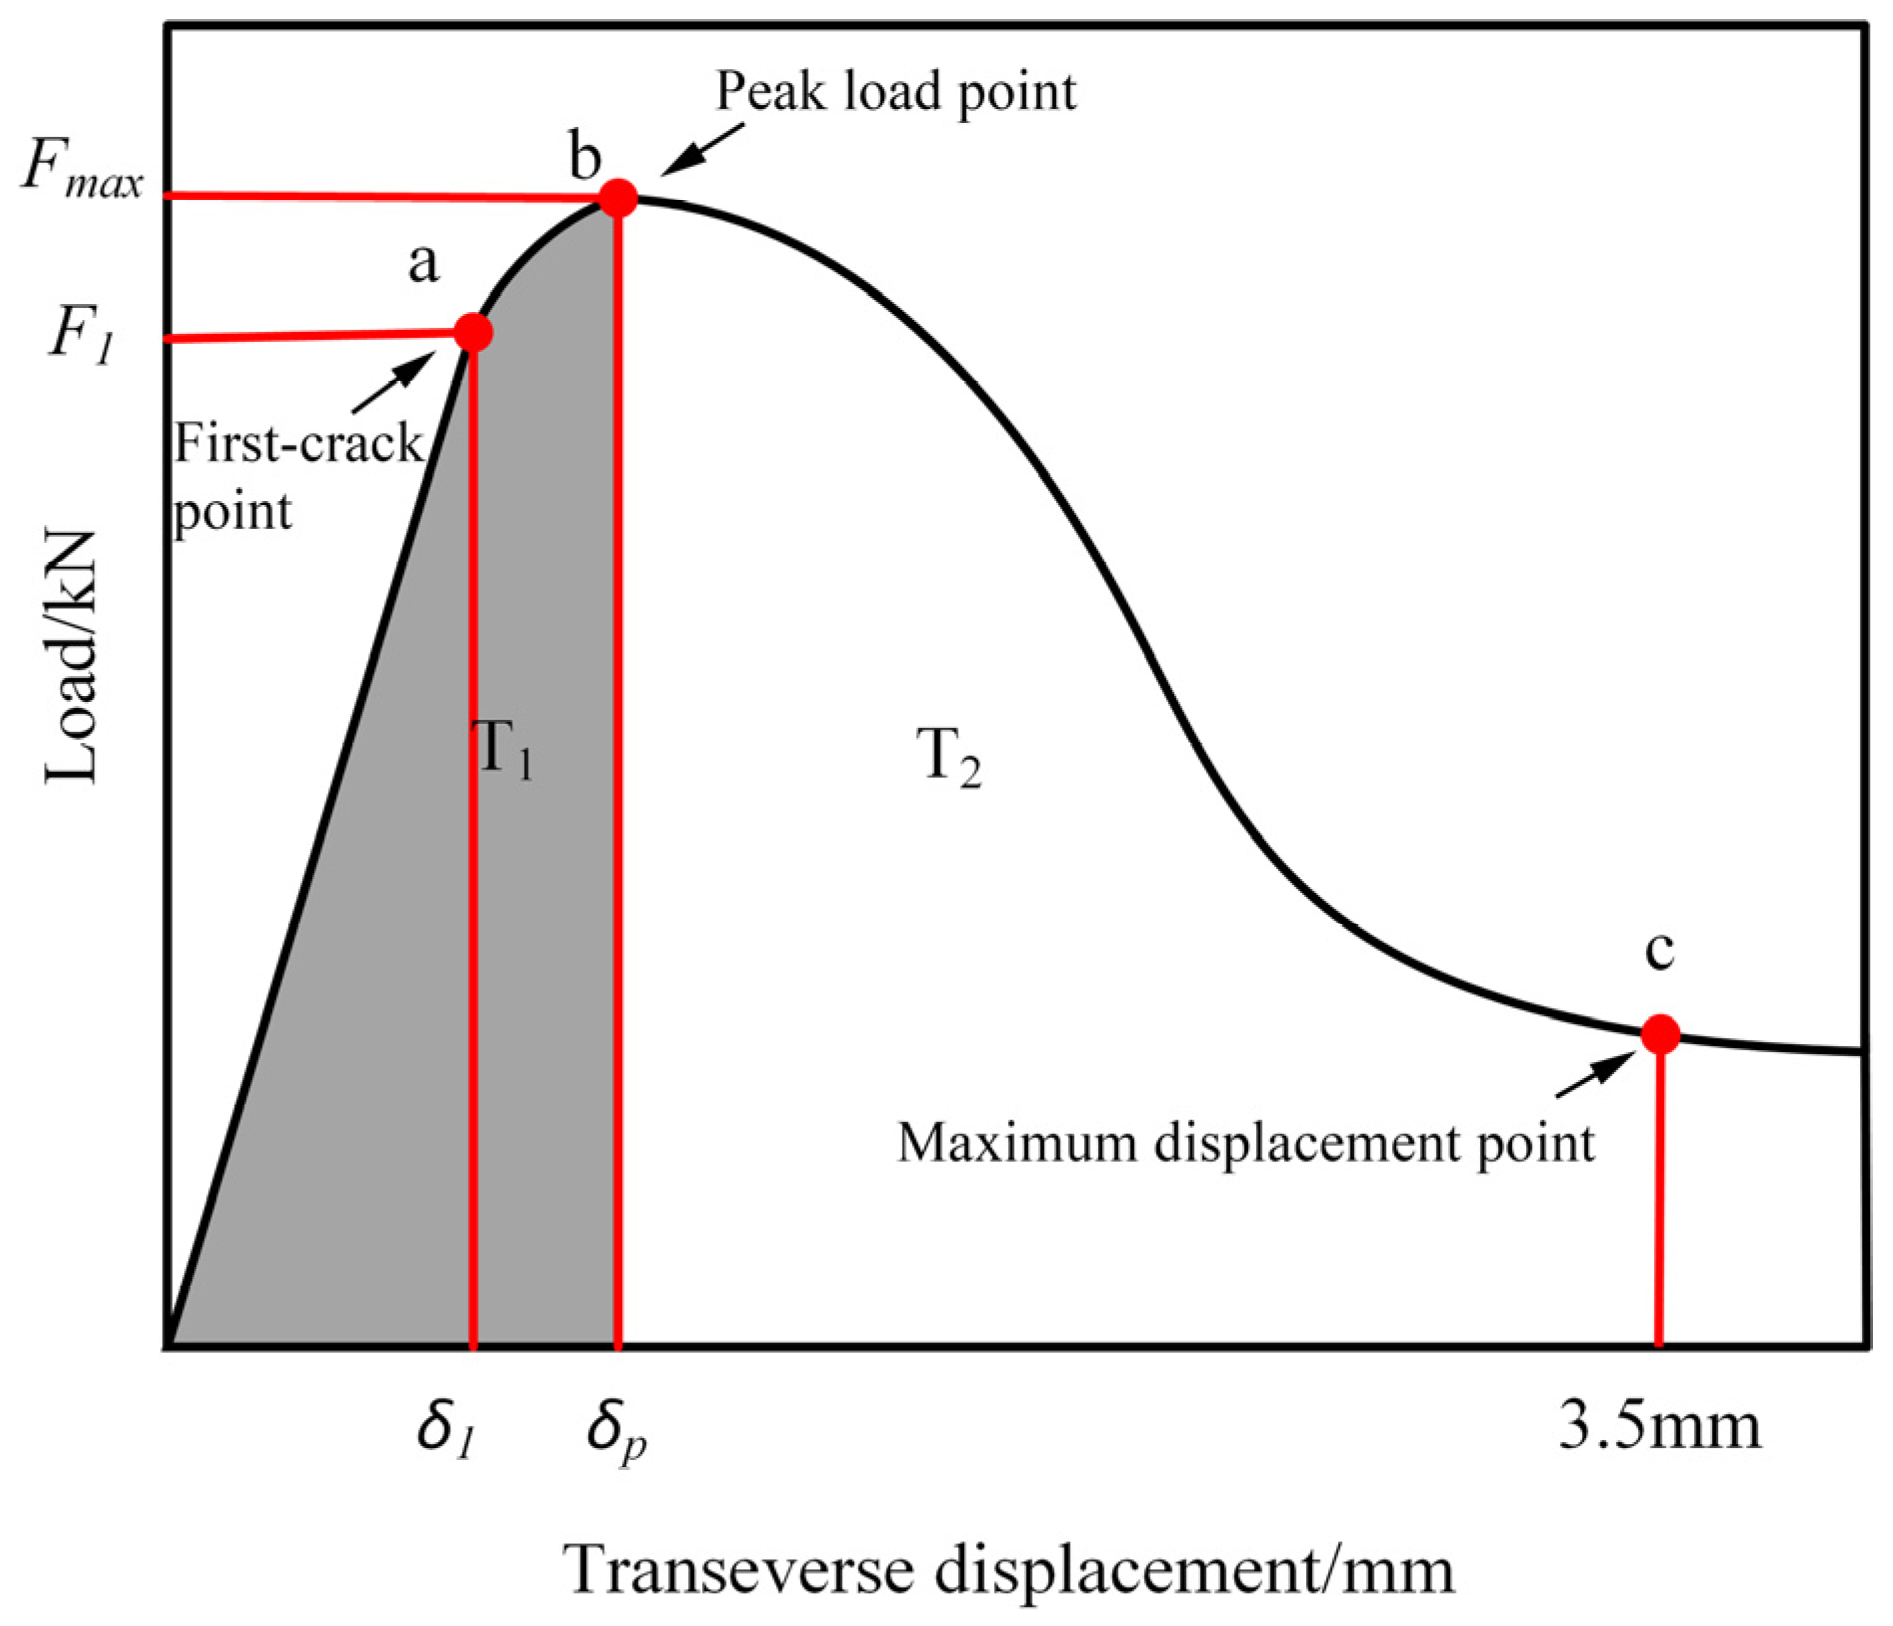
3.3.4. Tensile Toughness
3.4. Flexural Performance
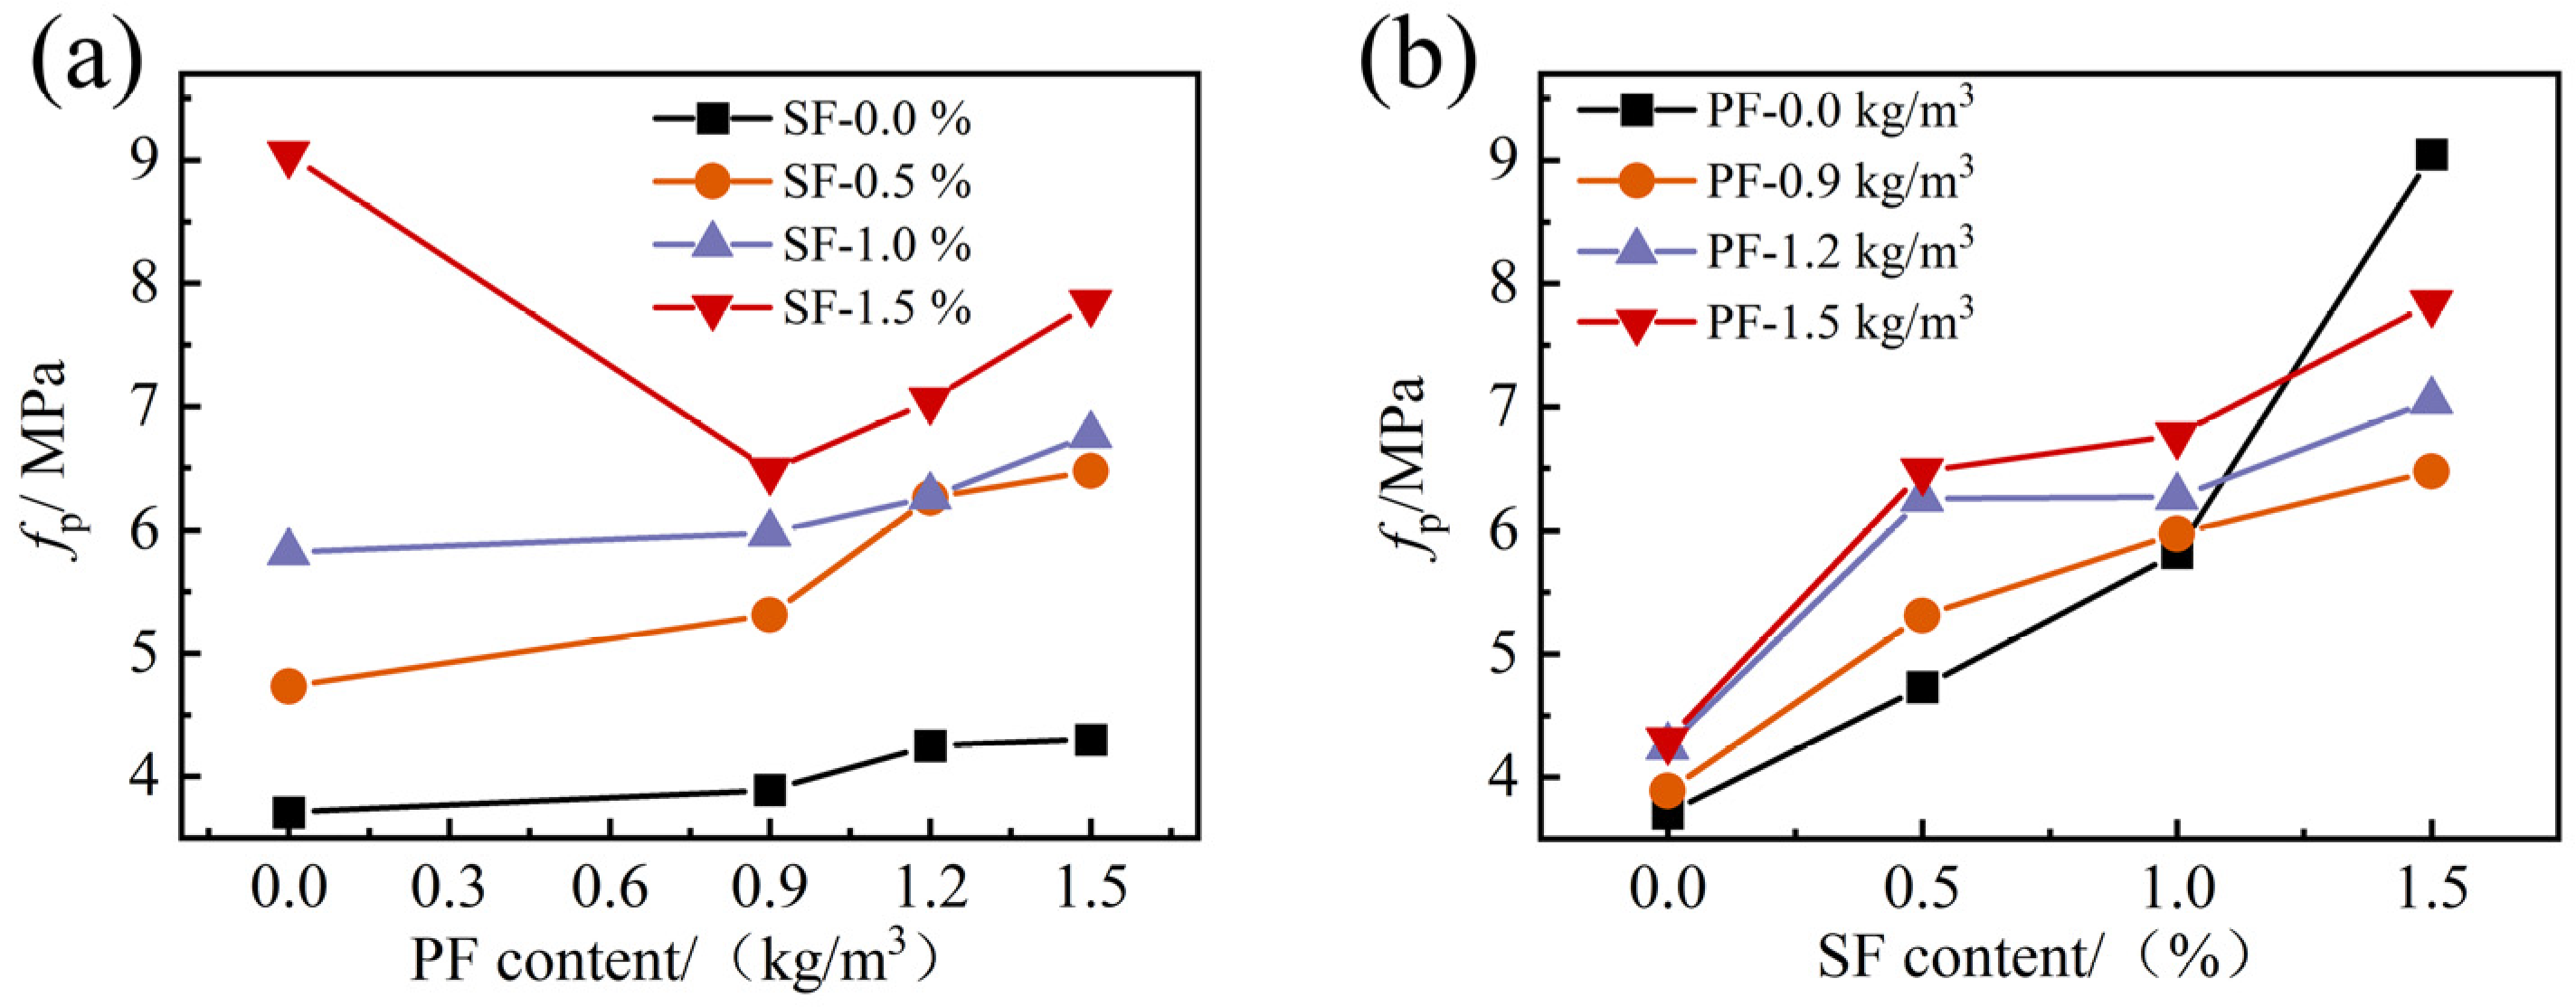
3.4.1. Peak Flexural Strength
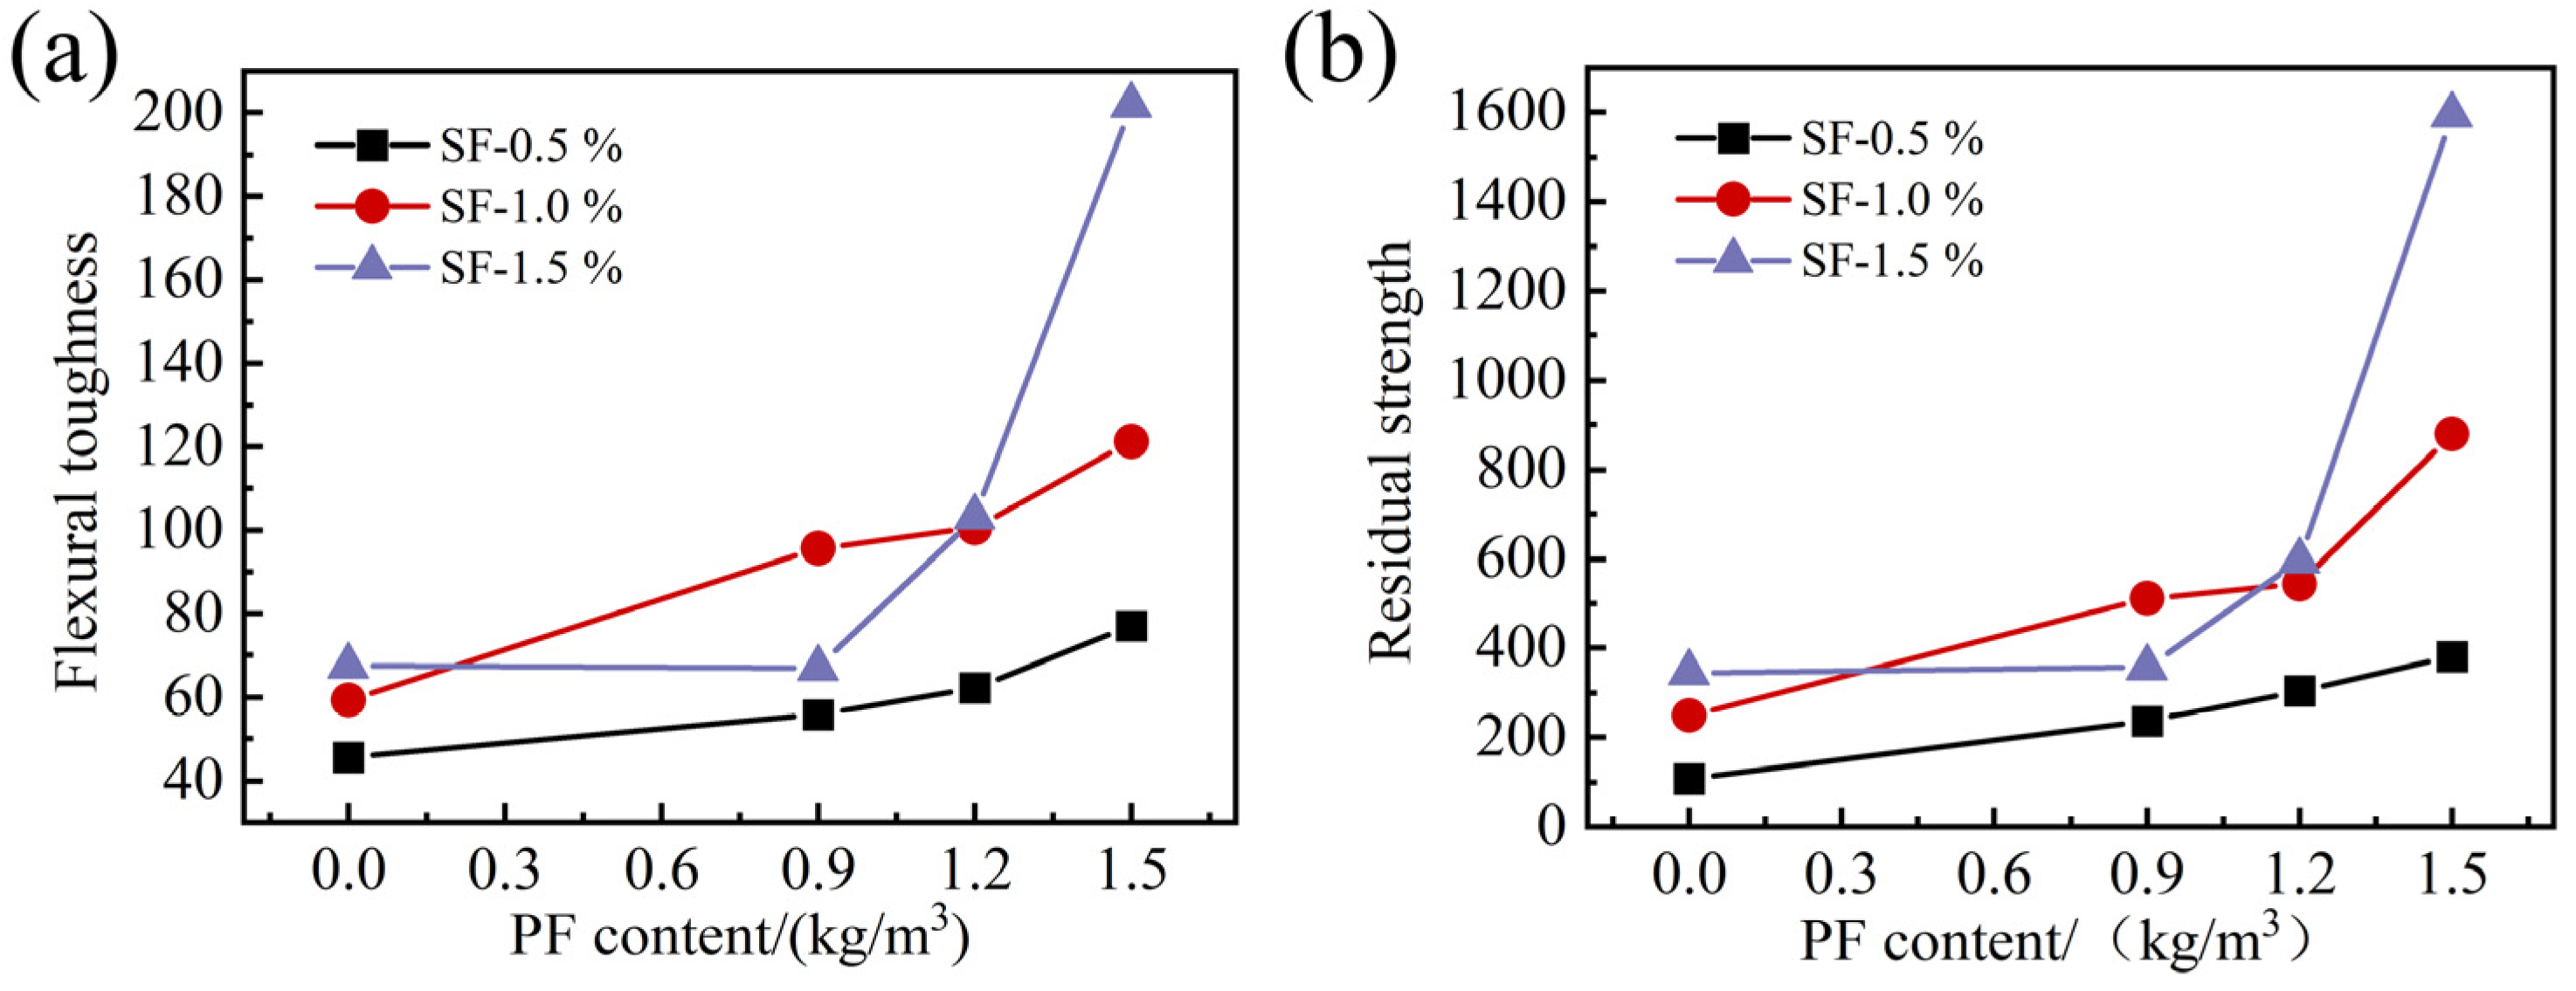
3.4.2. Residual Flexural Strength
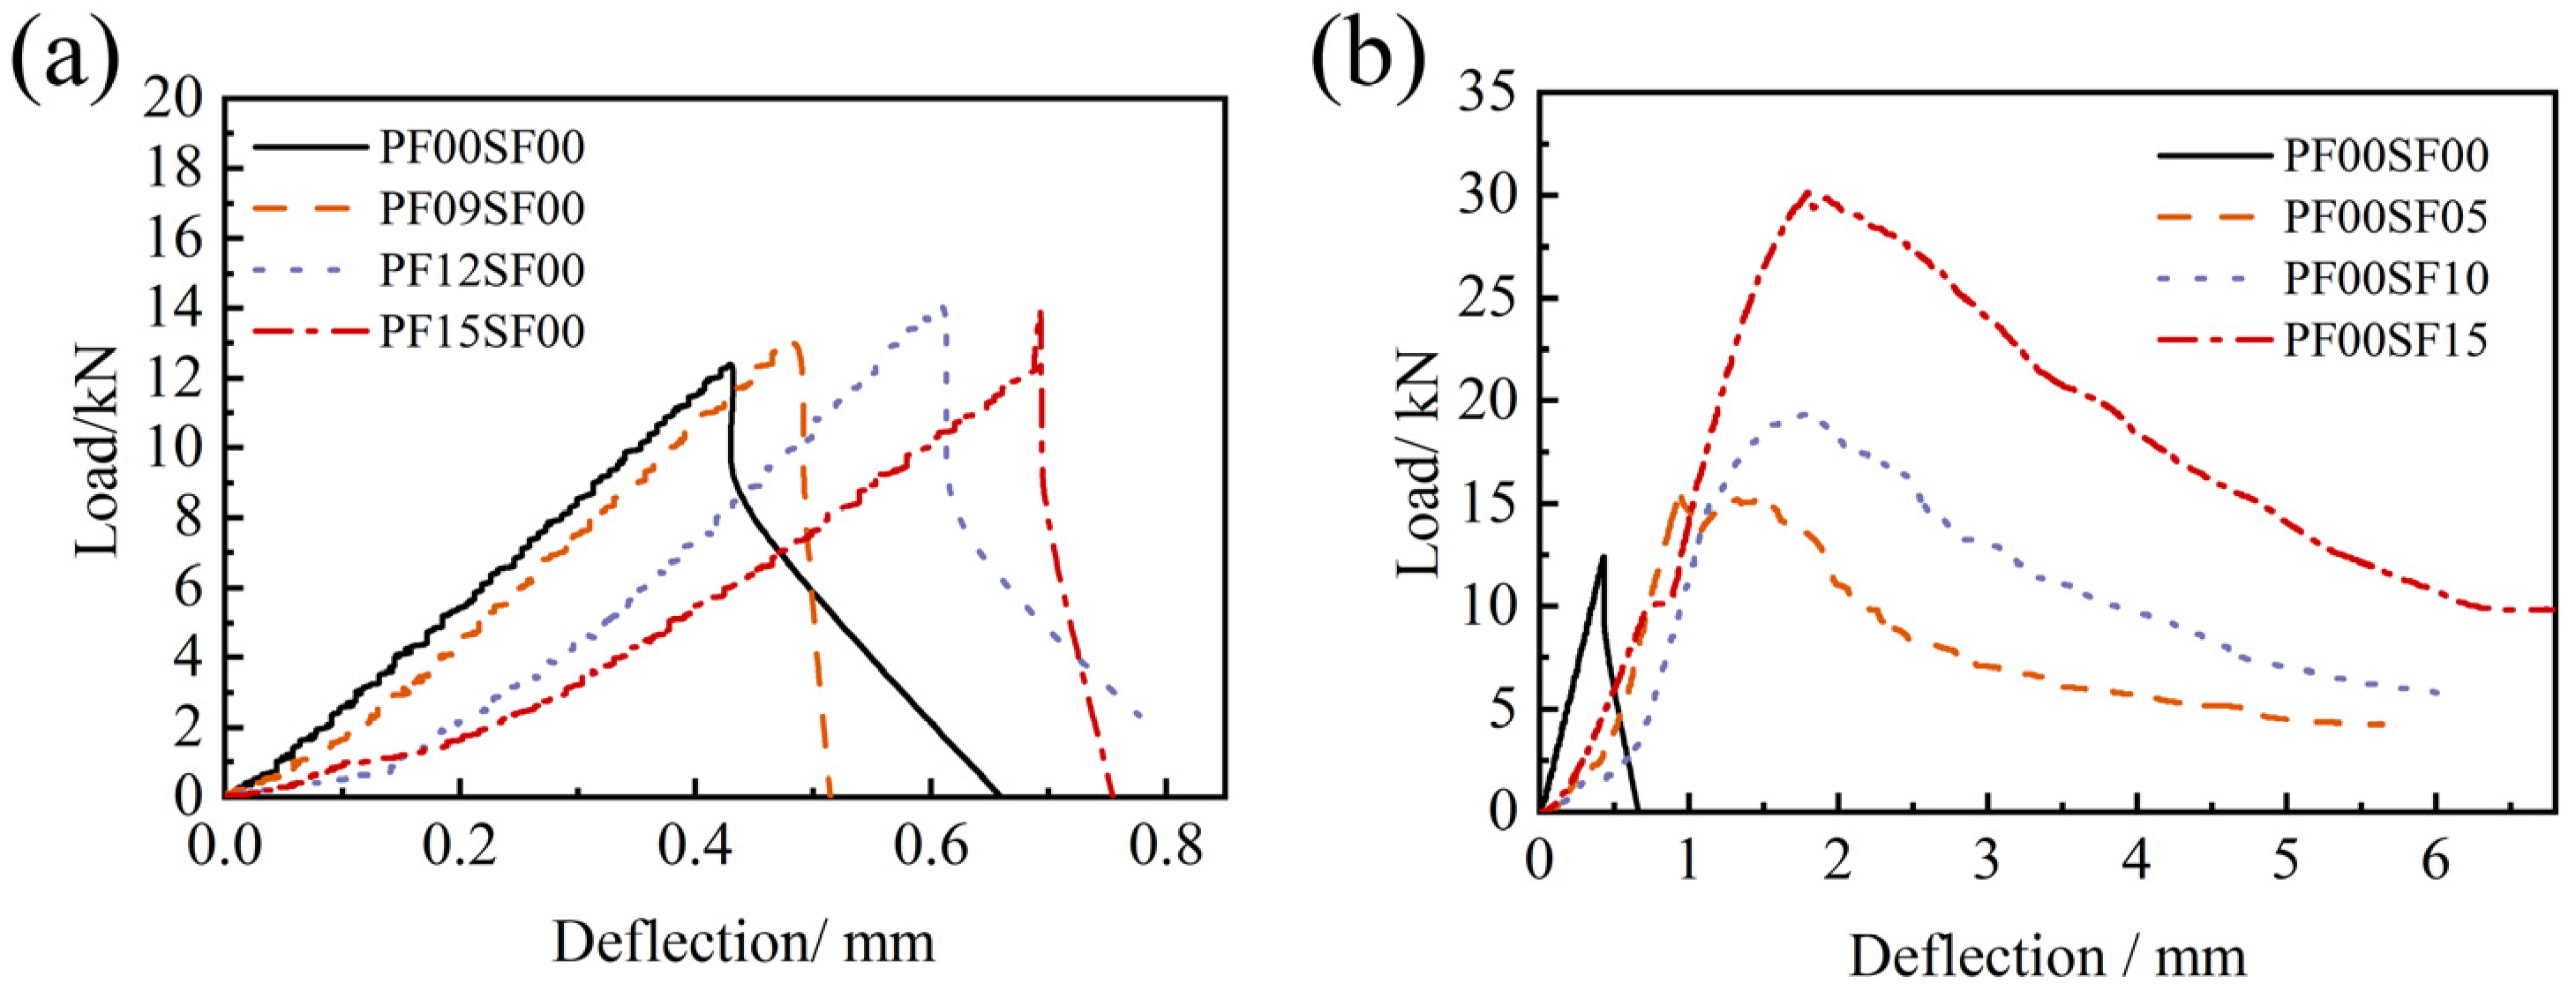
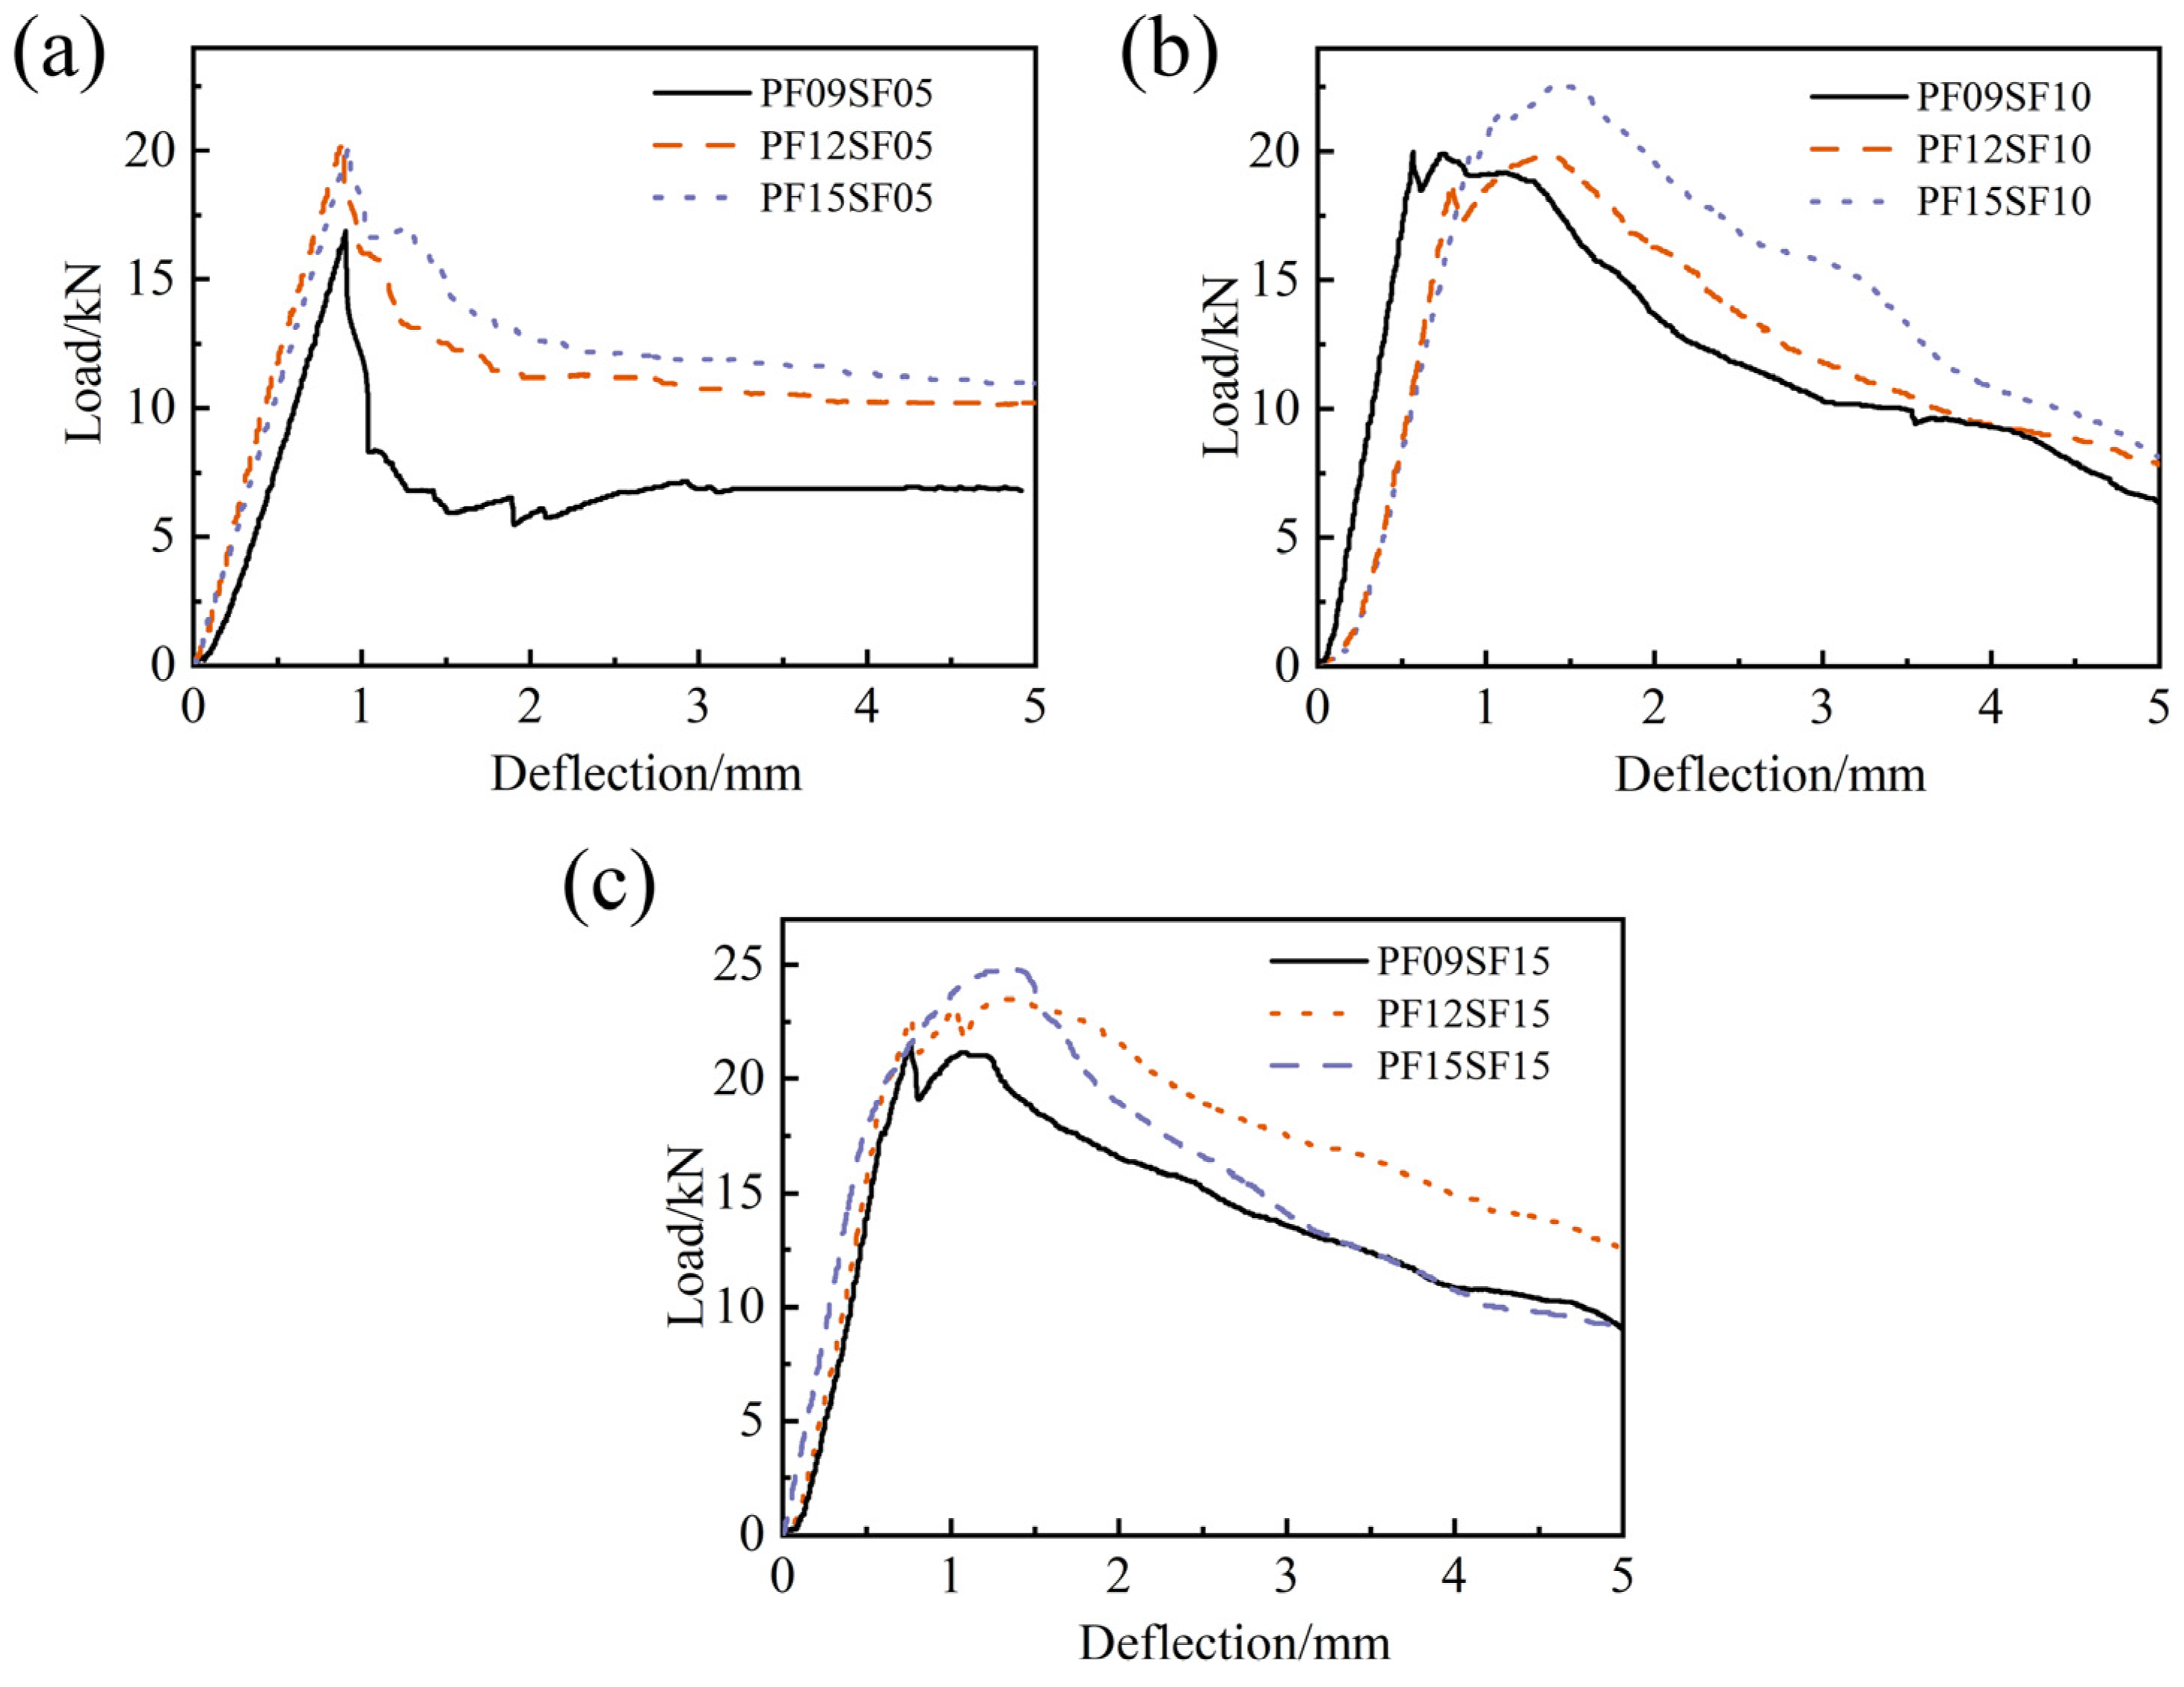
3.4.3. Load–Deflection Curve
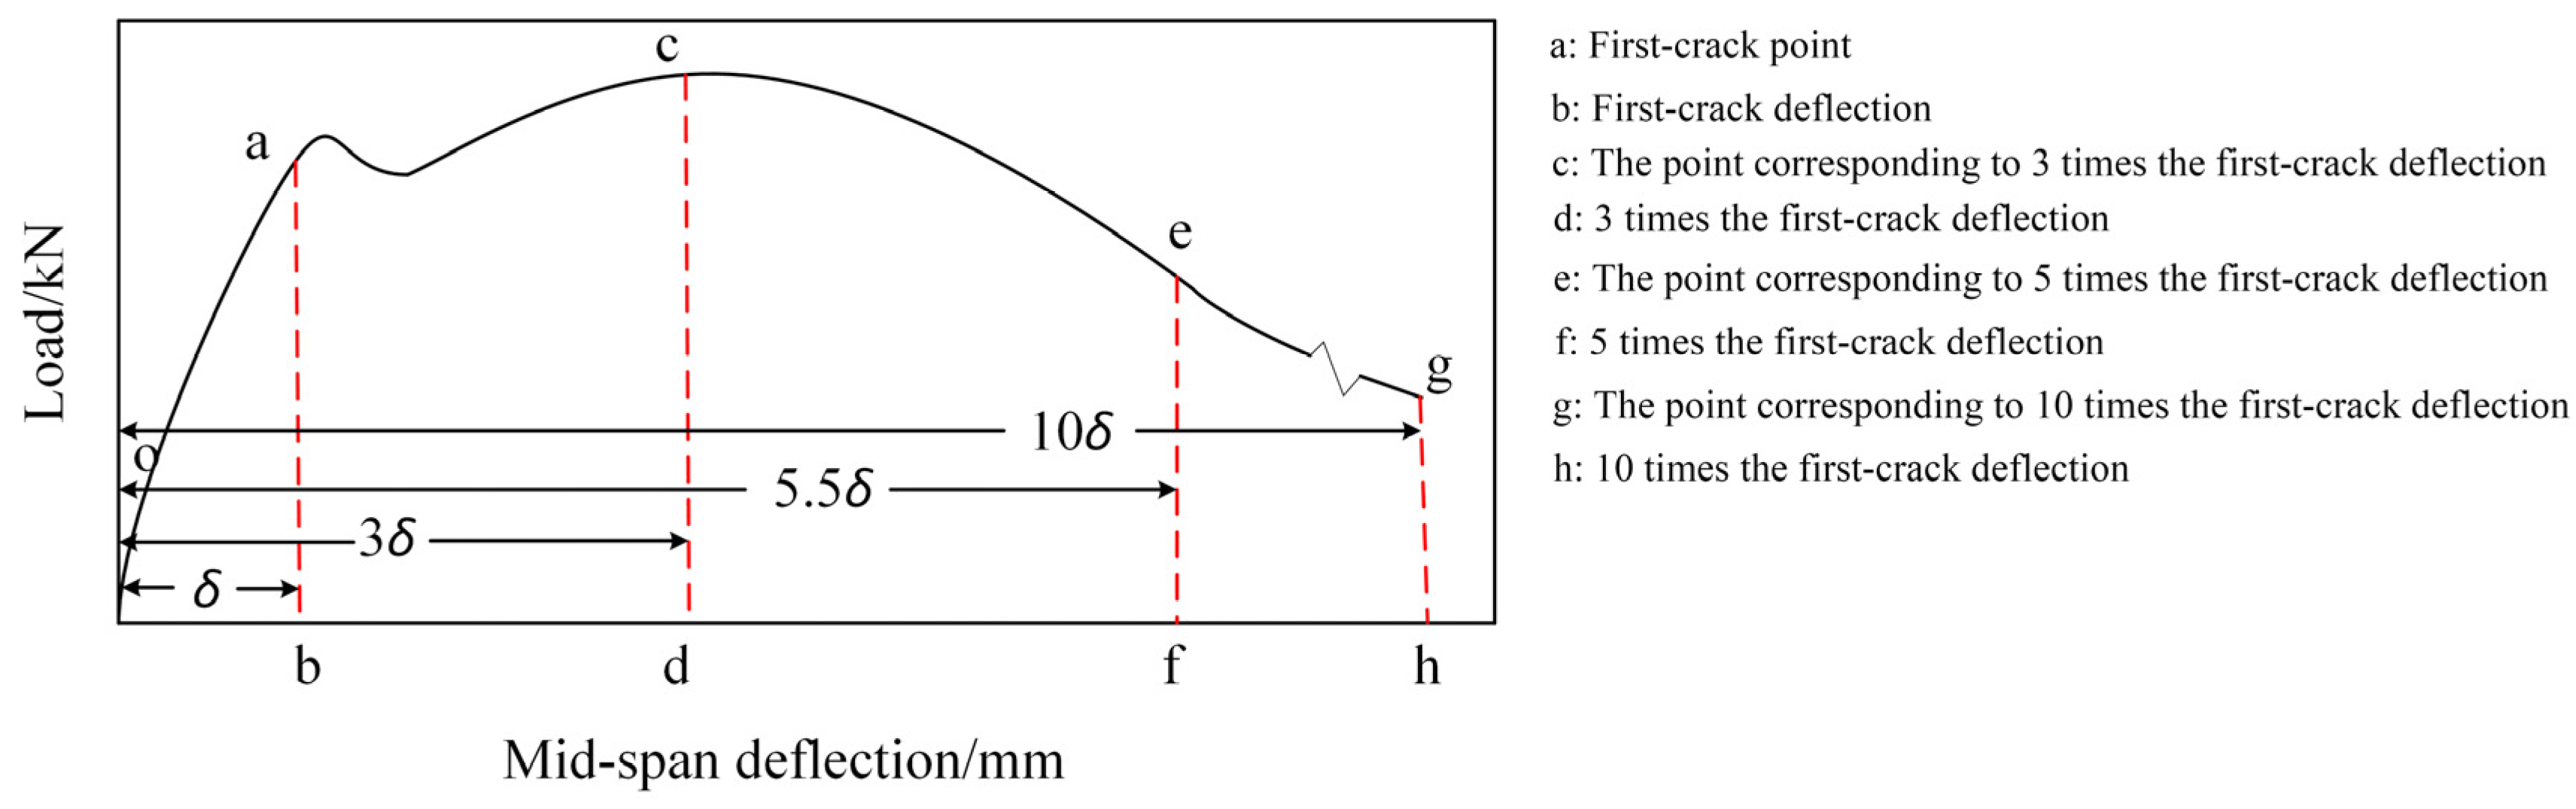
3.4.4. Flexural Toughness
4. Conclusions
Author Contributions
Funding
Institutional Review Board Statement
Informed Consent Statement
Data Availability Statement
Conflicts of Interest
References
- Wang, D.Y.; Lu, C.X.; Zhu, Z.M.; Zhang, Z.Y.; Liu, S.Y.; Ji, Y.C.; Xing, Z.Q. Mechanical performance of recycled aggregate concrete in green civil engineering: Review. Case Stud. Constr. Mat. 2023, 19, e02384. [Google Scholar] [CrossRef]
- Salgado, F.D.; Silva, F.D. Recycled aggregates from construction and demolition waste towards an application on structural concrete: A review. J. Build. Eng. 2022, 52, 104452. [Google Scholar] [CrossRef]
- Kim, J. Influence of quality of recycled aggregates on the mechanical properties of recycled aggregate concretes: An overview. Constr. Build. Mater. 2022, 328, 127071. [Google Scholar] [CrossRef]
- Wang, B.; Yan, L.; Fu, Q.; Kasal, B. A Comprehensive Review on Recycled Aggregate and Recycled Aggregate Concrete. Resour. Conserv. Recycl. 2021, 171, 105565. [Google Scholar] [CrossRef]
- Zhang, L.; Shen, H.; Xu, K.; Huang, W.; Wang, Y.; Chen, M.; Han, B. Effect of ceramic waste tile as a fine aggregate on the mechanical properties of low-carbon ultrahigh performance concrete. Constr. Build. Mater. 2023, 370, 130595. [Google Scholar] [CrossRef]
- Yuan, S.; Li, K.; Luo, J.; Zhu, Z.; Zeng, Y.; Dong, J.; Liang, W.; Zhang, F. Effects of brick-concrete aggregates on the mechanical properties of basalt fiber reinforced recycled waste concrete. J. Build. Eng. 2023, 80, 108023. [Google Scholar] [CrossRef]
- Sabbrojjaman, M.; Liu, Y.; Tafsirojjaman, T. A comparative review on the utilisation of recycled waste glass, ceramic and rubber as fine aggregate on high performance concrete: Mechanical and durability properties. Dev. Built Environ. 2024, 17, 100371. [Google Scholar] [CrossRef]
- Momeen Ul Islam, M.; Li, J.; Roychand, R.; Saberian, M. Investigation of durability properties for structural lightweight concrete with discarded vehicle tire rubbers: A study for the complete replacement of conventional coarse aggregates. Constr. Build. Mater. 2023, 369, 130634. [Google Scholar] [CrossRef]
- Islam, M.J.; Shahjalal, M.; Haque, N.M.A. Mechanical and durability properties of concrete with recycled polypropylene waste plastic as a partial replacement of coarse aggregate. J. Build. Eng. 2022, 54, 104597. [Google Scholar] [CrossRef]
- Algourdin, N.; Pliya, P.; Beaucour, A.L.; Noumowé, A.; di Coste, D. Effect of fine and coarse recycled aggregates on high-temperature behaviour and residual properties of concrete. Constr. Build. Mater. 2022, 341, 127847. [Google Scholar] [CrossRef]
- Adessina, A.; Ben Fraj, A.; Barthélémy, J.F.; Chateau, C.; Garnier, D. Experimental and micromechanical investigation on the mechanical and durability properties of recycled aggregates concrete. Cem. Concr. Res. 2019, 126, 105900. [Google Scholar] [CrossRef]
- Guo, M.H.; Grondin, F.; Loukili, A. Numerical method to model the creep of recycled aggregate concrete by considering the old attached mortar. Cem. Concr. Res. 2019, 118, 14–24. [Google Scholar] [CrossRef]
- Tang, W.C.; Khavarian, M.; Yousefi, A.; Chan, R.W.K.; Cui, H.Z. Influence of Surface Treatment of Recycled Aggregates on Mechanical Properties and Bond Strength of Self-Compacting Concrete. Sustainability 2019, 11, 4182. [Google Scholar] [CrossRef]
- Ngohpok, C.; Sata, V.; Satiennam, T.; Klungboonkrong, P.; Chindaprasirt, P. Mechanical Properties, Thermal Conductivity, and Sound Absorption of Pervious Concrete Containing Recycled Concrete and Bottom Ash Aggregates. Ksce J. Civ. Eng. 2018, 22, 1369–1376. [Google Scholar] [CrossRef]
- Carneiro, J.A.; Lima, P.R.L.; Leite, M.B.; Toledo, R.D. Compressive stress-strain behavior of steel fiber reinforced-recycled aggregate concrete. Cem. Concr. Comp. 2014, 46, 65–72. [Google Scholar] [CrossRef]
- Afroughsabet, V.; Biolzi, L.; Ozbakkaloglu, T.K. Influence of double hooked-end steel fibers and slag on mechanical and durability properties of high performance recycled aggregate concrete. Compos. Struct. 2017, 181, 273–284. [Google Scholar] [CrossRef]
- Wang, J.; Li, Y.; Qiu, Z.; Zhang, Y. Experimental research on compressive properties of recycling polypropylene (PP) fiber recycled coarse aggregate concrete. J. Build. Eng. 2023, 76, 107403. [Google Scholar] [CrossRef]
- Ye, P.; Chen, Z.; Su, W. Mechanical properties of fully recycled coarse aggregate concrete with polypropylene fiber. Case Stud. Constr. Mater. 2022, 17, e01352. [Google Scholar] [CrossRef]
- Das, C.S.; Dey, T.; Dandapat, R.; Mukharjee, B.B.; Kumar, J. Performance evaluation of polypropylene fibre reinforced recycled aggregate concrete. Constr. Build. Mater. 2018, 189, 649–659. [Google Scholar] [CrossRef]
- Wang, D.H.; Ju, Y.Z.; Shen, H.; Xu, L.B. Mechanical properties of high performance concrete reinforced with basalt fiber and polypropylene fiber. Constr. Build. Mater. 2019, 197, 464–473. [Google Scholar] [CrossRef]
- Wei, H.; Wu, T.; Yang, X. Properties of Lightweight Aggregate Concrete Reinforced with Carbon and/or Polypropylene Fibers. Materials 2020, 13, 640. [Google Scholar] [CrossRef]
- Lin, J.X.; Song, Y.; Xie, Z.H.; Guo, Y.C.; Yuan, B.; Zeng, J.J.; Wei, X. Static and dynamic mechanical behavior of engineered cementitious composites with PP and PVA fibers. J. Build. Eng. 2020, 29, 101097. [Google Scholar] [CrossRef]
- Htet, P.; Chen, W.; Hao, H.; Shaikh, F. Influence of micro basalt and recycled macro polypropylene hybrid fibre on physical and mechanical properties of recycled aggregate concrete. J. Build. Eng. 2023, 76, 107083. [Google Scholar] [CrossRef]
- Du, X.Q.; Li, Y.L.; Si, Z.; Huang, L.Z.; Chen, X.G. Effects of basalt fiber and polyvinyl alcohol fiber on the properties of recycled aggregate concrete and optimization of fiber contents. Constr. Build. Mater. 2022, 340, 127646. [Google Scholar] [CrossRef]
- He, W.C.; Kong, X.Q.; Fu, Y.; Zhou, C.; Zheng, Z.Y. Experimental investigation on the mechanical properties and microstructure of hybrid fiber reinforced recycled aggregate concrete. Constr. Build. Mater. 2020, 261, 120488. [Google Scholar] [CrossRef]
- Mohseni, E.; Saadati, R.; Kordbacheh, N.; Parpinchi, Z.S.; Tang, W.C. Engineering and microstructural assessment of fibre-reinforced self-compacting concrete containing recycled coarse aggregate. J. Clean. Prod. 2017, 168, 605–613. [Google Scholar] [CrossRef]
- Sharma, R.; Senthil, K. An investigation on mechanical and microstructural properties of hybrid fiber reinforced concrete with manufactured sand and recycled coarse aggregate. J. Build. Eng. 2023, 69, 106236. [Google Scholar] [CrossRef]
- Ding, D.; Zhang, L.; Zhao, J.; Li, C.; Wang, Z. Effects of air-entraining agent and polypropylene fiber on the mechanical properties, autogenous shrinkage, and fracture properties of fully recycled aggregate concrete. Front. Mater. 2022, 9, 1049304. [Google Scholar] [CrossRef]
- Li, G.; Zhang, L.; Zhao, F.; Tang, J. Acoustic Emission Characteristics and Damage Mechanisms Investigation of Basalt Fiber Concrete with Recycled Aggregate. Materials 2020, 13, 4009. [Google Scholar] [CrossRef]
- CS (Chinese Standard) GB/T 50081-2019; Standard Test Method for Mechanical Properties of Ordinary Concrete. Ministry of Construction of the People’s Republic of China: Beijing, China, 2019. (In Chinese)
- CS (Chinese Standard) JG/T 472-2015; Steel Fiber Reinforced Concrete. Ministry of Housing and Urban-Rural Development of the People’s Republic of China: Beijing, China, 2015. (In Chinese)
- Algin, Z.; Ozen, M. The properties of chopped basalt fibre reinforced self-compacting concrete. Constr. Build. Mater. 2018, 186, 678–685. [Google Scholar] [CrossRef]
- Aslani, F.; Liu, Y.N.; Wang, Y. Flexural and toughness properties of NiTi shape memory alloy, polypropylene and steel fibres in self-compacting concrete. J. Intel. Mat. Syst. Str. 2020, 31, 3–16. [Google Scholar] [CrossRef]
- Banthia, N.; Gupta, R. Influence of polypropylene fiber geometry on plastic shrinkage cracking in concrete. Cem. Concr. Res. 2006, 36, 1263–1267. [Google Scholar] [CrossRef]
- Song, P.S.; Hwang, S.; Sheu, B.C. Strength properties of nylon- and polypropylene-fiber-reinforced concretes. Cem. Concr. Res. 2005, 35, 1546–1550. [Google Scholar] [CrossRef]
- Hsie, M.; Tu, C.; Song, P.S. Mechanical properties of polypropylene hybrid fiber-reinforced concrete. Mat. Sci. Eng. A-Struct. 2008, 494, 153–157. [Google Scholar] [CrossRef]
- Banthia, N.; Gupta, R. Hybrid fiber reinforced concrete (HyFRC): Fiber synergy in high strength matrices. Mater. Struct. 2004, 37, 707–716. [Google Scholar] [CrossRef]
- Caggiano, A.; Gambarelli, S.; Martinelli, E.; Nisticò, N.; Pepe, M. Experimental characterization of the post-cracking response in Hybrid Steel/Polypropylene Fiber-Reinforced Concrete. Constr. Build. Mater. 2016, 125, 1035–1043. [Google Scholar] [CrossRef]
- Zia, A.; Ali, M. Behavior of fiber reinforced concrete for controlling the rate of cracking in canal-lining. Constr. Build. Mater. 2017, 155, 726–739. [Google Scholar] [CrossRef]
- Gao, D.; Wang, F. Effects of recycled fine aggregate and steel fiber on compressive and splitting tensile properties of concrete. J. Build. Eng. 2021, 44, 102631. [Google Scholar] [CrossRef]
- Khan, M.; Ali, M. Use of glass and nylon fibers in concrete for controlling early age micro cracking in bridge decks. Constr. Build. Mater. 2016, 125, 800–808. [Google Scholar] [CrossRef]
- ASTM C1609/C1609M; Standard Test Method for Flexural Performance of Fiber-Reinforced Concrete. American Society for Testing and Materials: West Conshohocken, PA, USA, 2019.
- ASTM C1018-97; Standard Test Method for Flexural Toughness and First-Crack Strength of Fiber-Reinforced Concrete. American Society for Testing and Materials: West Conshohocken, PA, USA, 1997.


| Index | Specific Surface Area (m2/kg) | Setting Time (min) | Loss on Ignition (%) | Compressive Strength (MPa) | Flexural Strength (MPa) | |||
|---|---|---|---|---|---|---|---|---|
| Initial Setting | Final Setting | 3 d | 28 d | 3 d | 28 d | |||
| Test results | 345 | 230 | 280 | 2.81 | 23.5 | 44.8 | 5.6 | 8.5 |
| Index | Fineness Modulus | Bulk Density (kg/m3) | Moisture Content (%) | SO3 (%) | Water Demand Ratio |
|---|---|---|---|---|---|
| Test result | 5.692 | 1120 | 0.10 | 0.933 | 92 |
| Components (%) | SiO2 | CaO | Al2O3 | Fe2O3 | MgO | SO3 | K2O | TiO2 |
|---|---|---|---|---|---|---|---|---|
| Cement | 27.73 | 46.31 | 13.54 | 3.09 | 3.09 | 2.82 | 0.984 | 0.688 |
| Fly ash | 54.74 | 3.36 | 33.33 | 2.30 | 0.867 | 0.933 | 2.21 | 1.01 |
| Sieve size (mm) | 4.75 | 2.36 | 1.18 | 0.6 | 0.3 | 0.15 |
| Cumulative sieve residue (%) | 2 | 35 | 54 | 71 | 81 | 92 |
| Index | Apparent Density (kg/m3) | Crushing Index | Water Absorption Rate (%) | Mud Content (%) |
|---|---|---|---|---|
| Test result | 2612 | 16.4 | 6.95 | 0.4 |
| Sieve size (mm) | 2.36 | 4.75 | 9.5 | 16 | 19 | 26.5 |
| Cumulative sieve residue (%) | 98.42 | 95.57 | 69.14 | 49.31 | 9.88 | 0 |
| Fiber Types | Length (mm) | Diameter (mm) | Density (kg/m3) | Elastic Modulus (GPa) | Tensile Strength (MPa) |
|---|---|---|---|---|---|
| Steel fiber | 35 | 0.75 | 7800 | 200 | 380 |
| Polypropylene fiber | 9 | 0.05 | 900 | 4.0 | 400 |
| Mixture | Specimen No. | Water | Cement | Fly Ash | Sand | RCA | SP | PF | SF |
|---|---|---|---|---|---|---|---|---|---|
| Ordinary FRAC | PF00SF00 | 200 | 457 | 114 | 628 | 942 | 5.484 | 0 | 0 |
| PFRFRAC | PF09SF00 | 200 | 457 | 114 | 628 | 942 | 5.484 | 0.9 | 0 |
| PF12SF00 | 200 | 457 | 114 | 628 | 942 | 5.484 | 1.2 | 0 | |
| PF15SF00 | 200 | 457 | 114 | 628 | 942 | 5.484 | 1.5 | 0 | |
| SFRFRAC | PF00SF05 | 200 | 457 | 114 | 623 | 935 | 5.484 | 0 | 39 |
| PF00SF10 | 200 | 457 | 114 | 618 | 927 | 5.484 | 0 | 78 | |
| PF00SF15 | 200 | 457 | 114 | 613 | 920 | 5.484 | 0 | 117 | |
| HFRFRAC | PF09SF05 | 200 | 457 | 114 | 623 | 935 | 5.484 | 0.9 | 39 |
| PF12SF05 | 200 | 457 | 114 | 623 | 935 | 5.484 | 1.2 | 39 | |
| PF15SF05 | 200 | 457 | 114 | 623 | 935 | 5.484 | 1.5 | 39 | |
| PF09SF10 | 200 | 457 | 114 | 618 | 927 | 5.484 | 0.9 | 78 | |
| PF12SF10 | 200 | 457 | 114 | 618 | 927 | 5.484 | 1.2 | 78 | |
| PF15SF10 | 200 | 457 | 114 | 618 | 927 | 5.484 | 1.5 | 78 | |
| PF09SF15 | 200 | 457 | 114 | 613 | 920 | 5.484 | 0.9 | 117 | |
| PF12SF15 | 200 | 457 | 114 | 613 | 920 | 5.484 | 1.2 | 117 | |
| PF15SF15 | 200 | 457 | 114 | 613 | 920 | 5.484 | 1.5 | 117 |
| Specimen No. | /MPa | /MPa | /mm | /mm | /MPa | /MPa |
|---|---|---|---|---|---|---|
| PF00SF00 | - | 3.71 ± 0.26 | - | 0.43 ± 0.03 | - | - |
| PF09SF00 | - | 3.89 ± 0.05 | - | 0.48 ± 0.05 | - | - |
| PF12SF00 | - | 4.25 ± 0.22 | - | 0.61 ± 0.03 | - | - |
| PF15SF00 | - | 4.30 ± 0.32 | - | 0.69 ± 0.01 | - | - |
| PF00SF05 | 2.22 ± 0.12 | 4.73 ± 0.17 | 0.30 ± 0.02 | 0.95 ± 0.03 | 1.19 ± 0.08 | 3.31 ± 0.10 |
| PF00SF10 | 2.83 ± 0.31 | 5.82 ± 0.41 | 0.51 ± 0.07 | 1.70 ± 0.08 | 1.56 ± 0.03 | 5.44 ± 0.06 |
| PF00SF15 | 3.96 ± 0.20 | 9.05 ± 0.23 | 0.49 ± 0.06 | 1.74 ± 0.11 | 1.76 ± 0.06 | 8.81 ± 0.09 |
| PF09SF05 | 2.52 ± 0.08 | 5.31 ± 0.06 | 0.37 ± 0.02 | 1.15 ± 0.04 | 1.15 ± 0.08 | 2.12 ± 0.07 |
| PF12SF05 | 3.02 ± 0.18 | 6.26 ± 0.21 | 0.35 ± 0.03 | 1.13 ± 0.03 | 1.78 ± 0.09 | 3.78 ± 0.17 |
| PF15SF05 | 2.98 ± 0.10 | 6.48 ± 0.16 | 0.37 ± 0.04 | 1.17 ± 0.04 | 2.06 ± 0.15 | 4.23 ± 0.10 |
| PF09SF10 | 3.00 ± 0.13 | 5.97 ± 0.13 | 0.18 ± 0.02 | 0.85 ± 0.06 | 2.53 ± 0.04 | 4.10 ± 0.26 |
| PF12SF10 | 2.82 ± 0.15 | 6.27 ± 0.38 | 0.26 ± 0.04 | 1.34 ± 0.11 | 2.55 ± 0.03 | 4.91 ± 0.04 |
| PF15SF10 | 2.90 ± 0.18 | 6.77 ± 0.21 | 0.30 ± 0.03 | 1.41 ± 0.03 | 3.08 ± 0.11 | 5.86 ± 0.07 |
| PF09SF15 | 3.40 ± 0.16 | 6.48 ± 0.16 | 0.19 ± 0.01 | 1.12 ± 0.01 | 3.02 ± 0.09 | 4.95 ± 0.19 |
| PF12SF15 | 2.66 ± 0.17 | 7.05 ± 0.22 | 0.25 ± 0.01 | 1.42 ± 0.06 | 4.16 ± 0.11 | 6.65 ± 0.11 |
| PF15SF15 | 3.19 ± 0.20 | 7.84 ± 0.25 | 0.29 ± 0.02 | 1.61 ± 0.09 | 4.67 ± 0.08 | 6.96 ± 0.34 |
| Specimen No. | |||||
|---|---|---|---|---|---|
| PF00SF05 | 9.25 | 34.66 | 45.43 | 508.2 | 107.7 |
| PF00SF10 | 9.84 | 34.35 | 59.32 | 490.2 | 249.7 |
| PF00SF15 | 11.92 | 32.88 | 67.45 | 419.2 | 345.7 |
| PF09SF05 | 14.67 | 32.19 | 55.85 | 350.4 | 236.6 |
| PF12SF05 | 12.21 | 31.60 | 62.13 | 387.8 | 305.3 |
| PF15SF05 | 14.00 | 38.82 | 76.92 | 496.4 | 381.0 |
| PF09SF10 | 13.17 | 44.54 | 95.69 | 627.4 | 511.5 |
| PF12SF10 | 13.55 | 46.13 | 100.53 | 651.6 | 544.0 |
| PF15SF10 | 13.79 | 33.30 | 121.23 | 390.2 | 879.3 |
| PF09SF15 | 12.63 | 31.23 | 66.88 | 372.0 | 356.5 |
| PF12SF15 | 12.10 | 43.63 | 103.20 | 630.6 | 595.7 |
| PF15SF15 | 13.46 | 42.40 | 201.84 | 578.8 | 1594.4 |
Disclaimer/Publisher’s Note: The statements, opinions and data contained in all publications are solely those of the individual author(s) and contributor(s) and not of MDPI and/or the editor(s). MDPI and/or the editor(s) disclaim responsibility for any injury to people or property resulting from any ideas, methods, instructions or products referred to in the content. |
© 2024 by the authors. Licensee MDPI, Basel, Switzerland. This article is an open access article distributed under the terms and conditions of the Creative Commons Attribution (CC BY) license (https://creativecommons.org/licenses/by/4.0/).
Share and Cite
Zhang, L.; Li, X.; Li, C.; Zhao, J.; Cheng, S. Mechanical Properties of Fully Recycled Aggregate Concrete Reinforced with Steel Fiber and Polypropylene Fiber. Materials 2024, 17, 1156. https://doi.org/10.3390/ma17051156
Zhang L, Li X, Li C, Zhao J, Cheng S. Mechanical Properties of Fully Recycled Aggregate Concrete Reinforced with Steel Fiber and Polypropylene Fiber. Materials. 2024; 17(5):1156. https://doi.org/10.3390/ma17051156
Chicago/Turabian StyleZhang, Lijuan, Xiang Li, Changbin Li, Jun Zhao, and Shengzhao Cheng. 2024. "Mechanical Properties of Fully Recycled Aggregate Concrete Reinforced with Steel Fiber and Polypropylene Fiber" Materials 17, no. 5: 1156. https://doi.org/10.3390/ma17051156
APA StyleZhang, L., Li, X., Li, C., Zhao, J., & Cheng, S. (2024). Mechanical Properties of Fully Recycled Aggregate Concrete Reinforced with Steel Fiber and Polypropylene Fiber. Materials, 17(5), 1156. https://doi.org/10.3390/ma17051156