
Fatigue Behaviors of Joints between Steel Girders with Corrugated Webs and Top RC Slabs under Transverse Bending Moments


Abstract
:1. Introduction
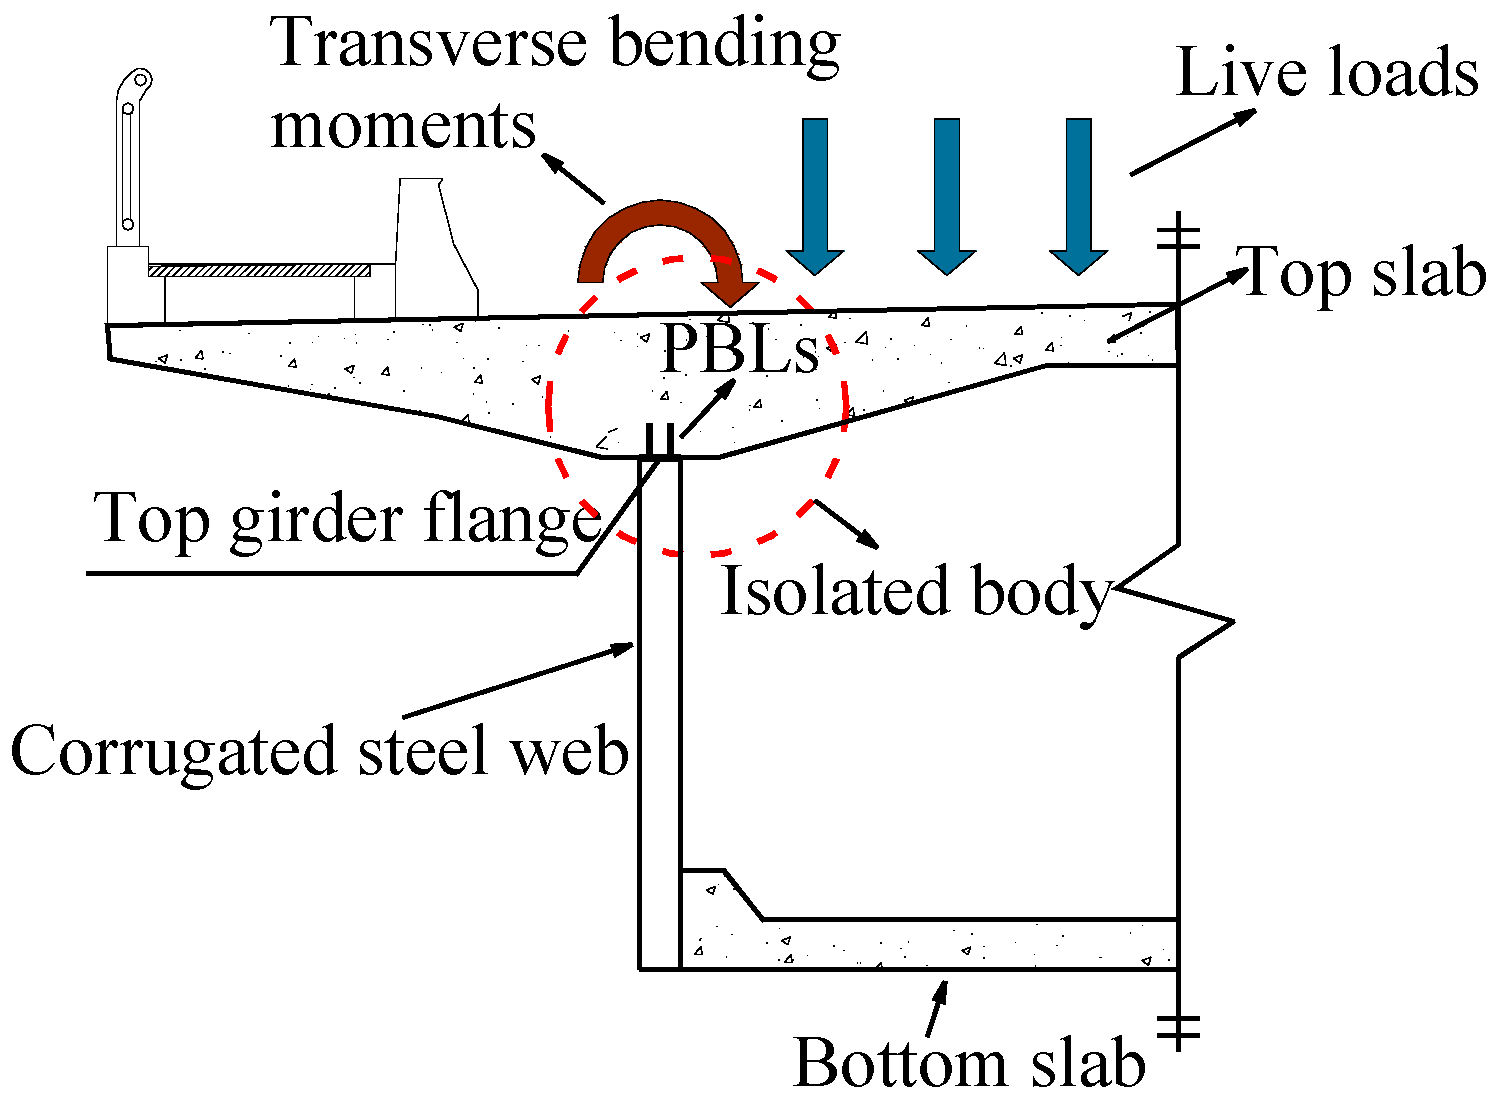
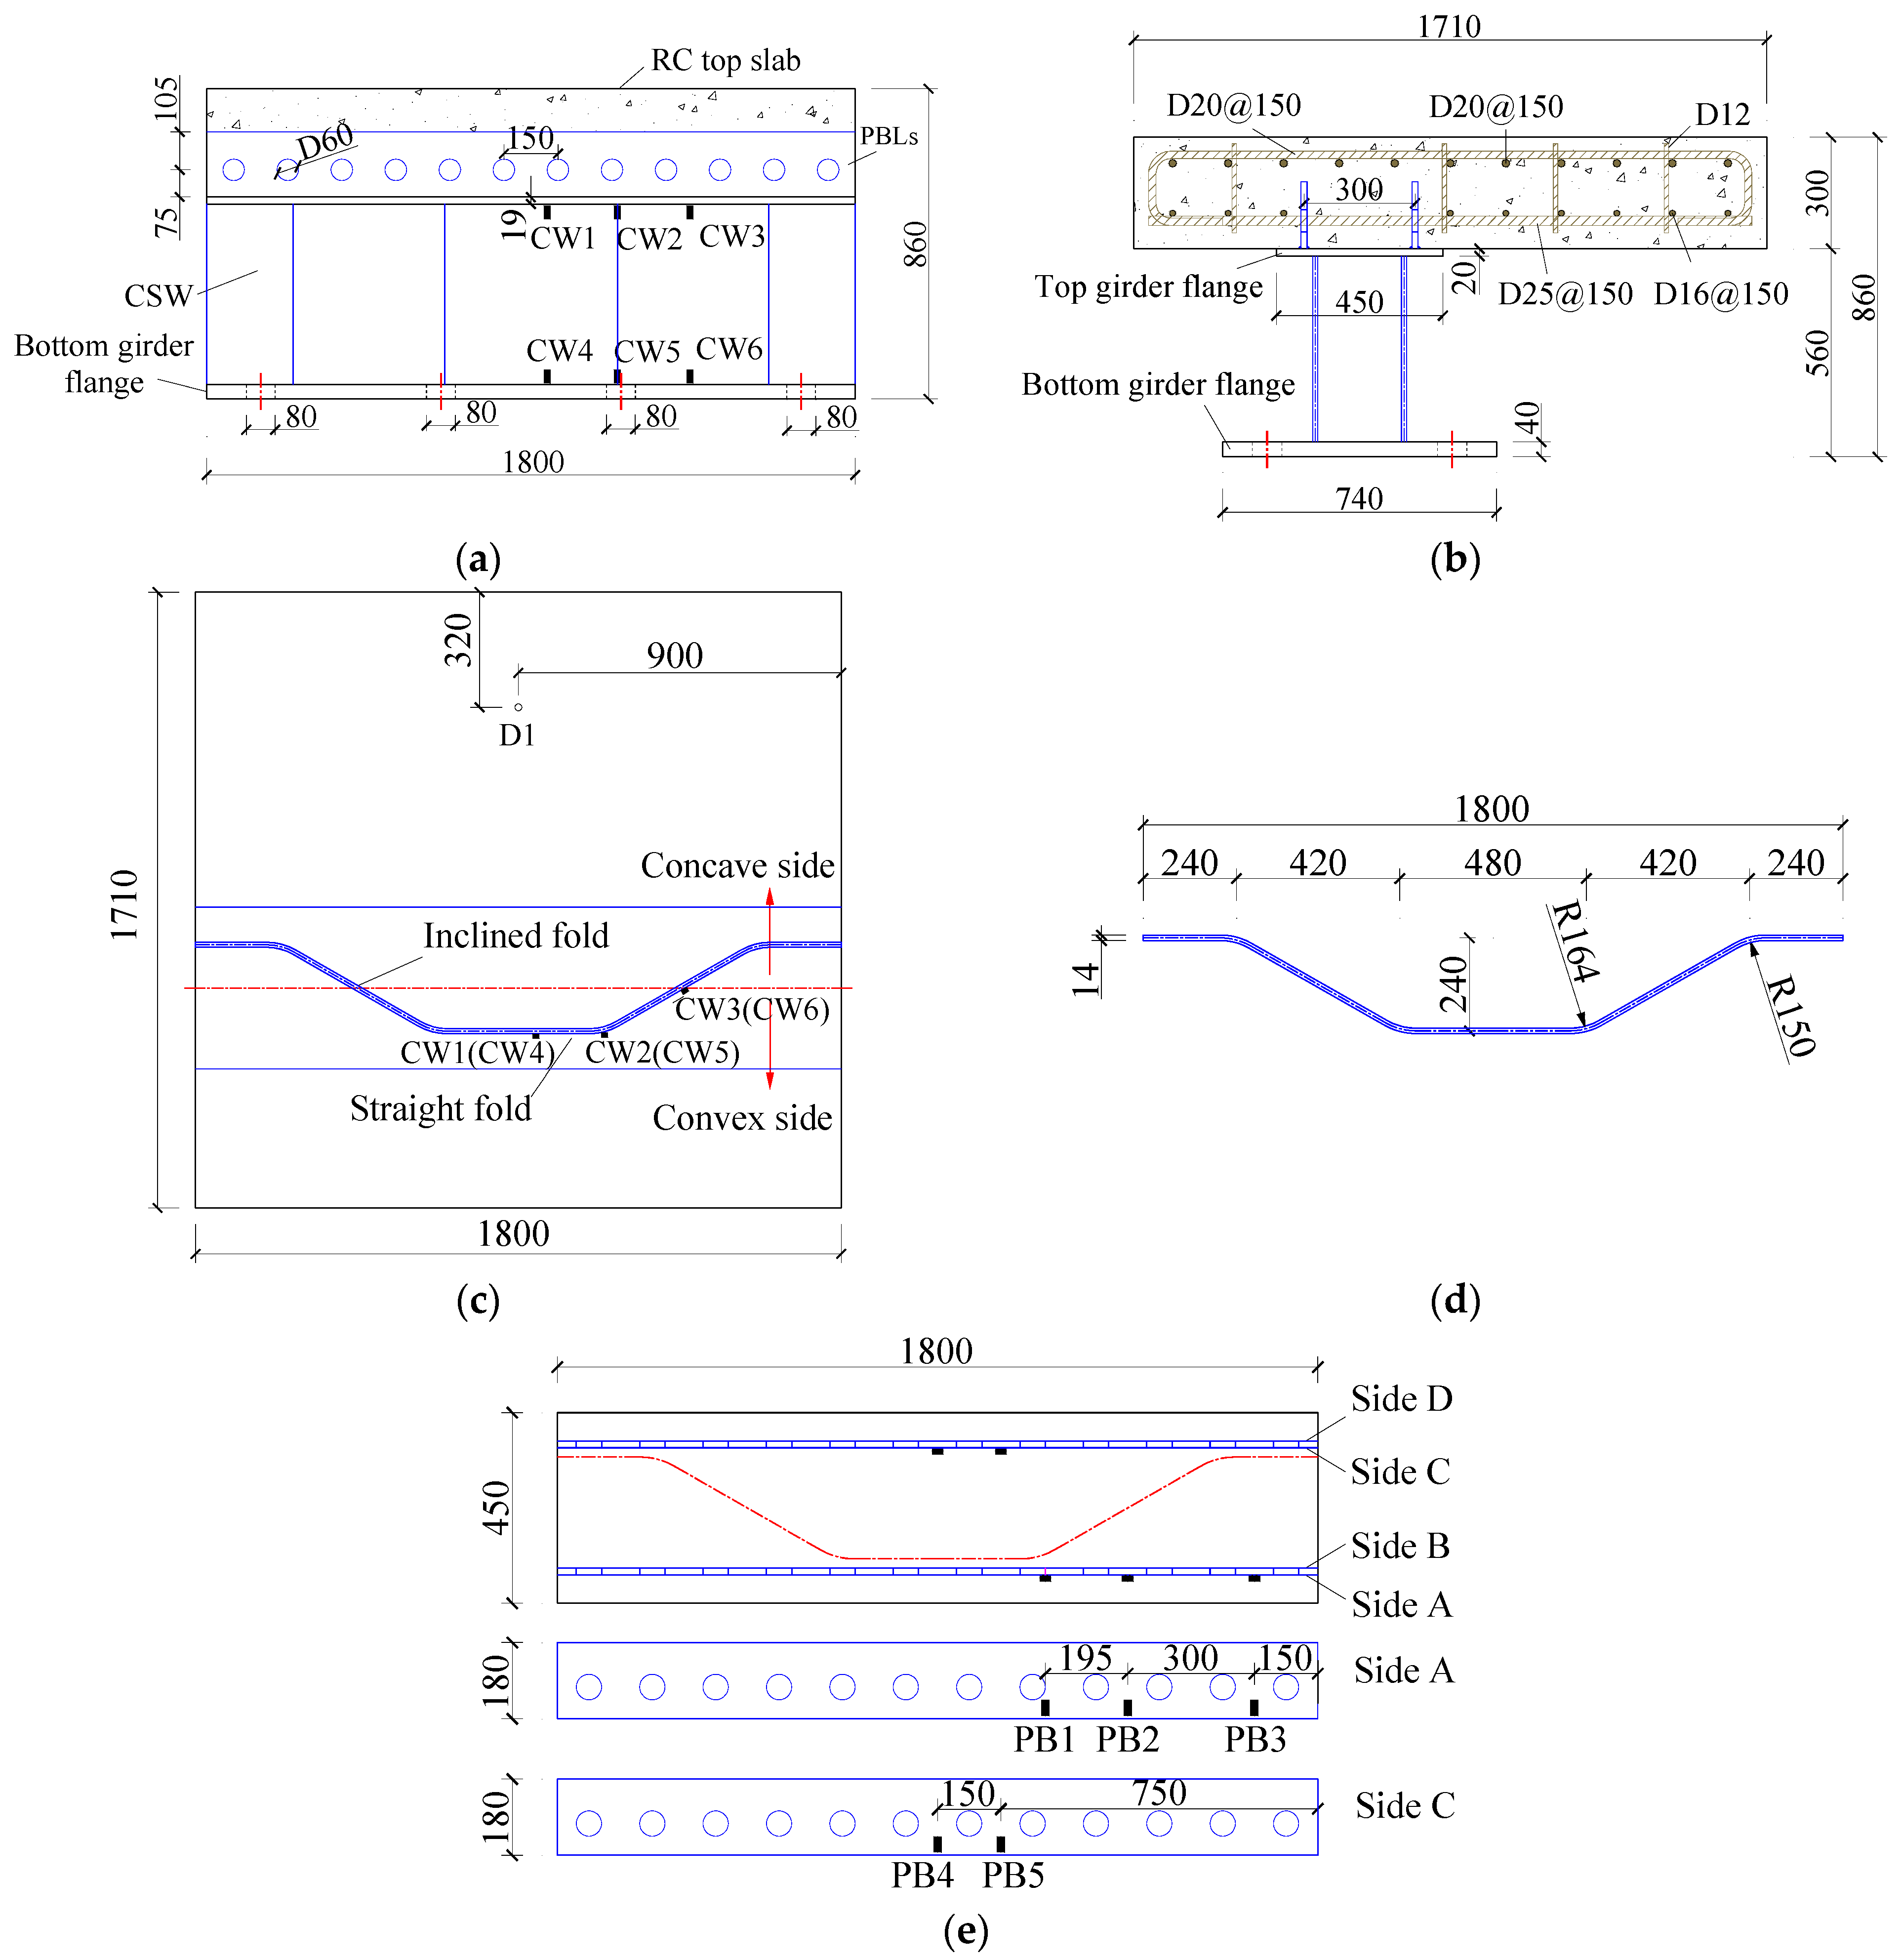
2. Test Design
2.1. Specimen Design and Materials
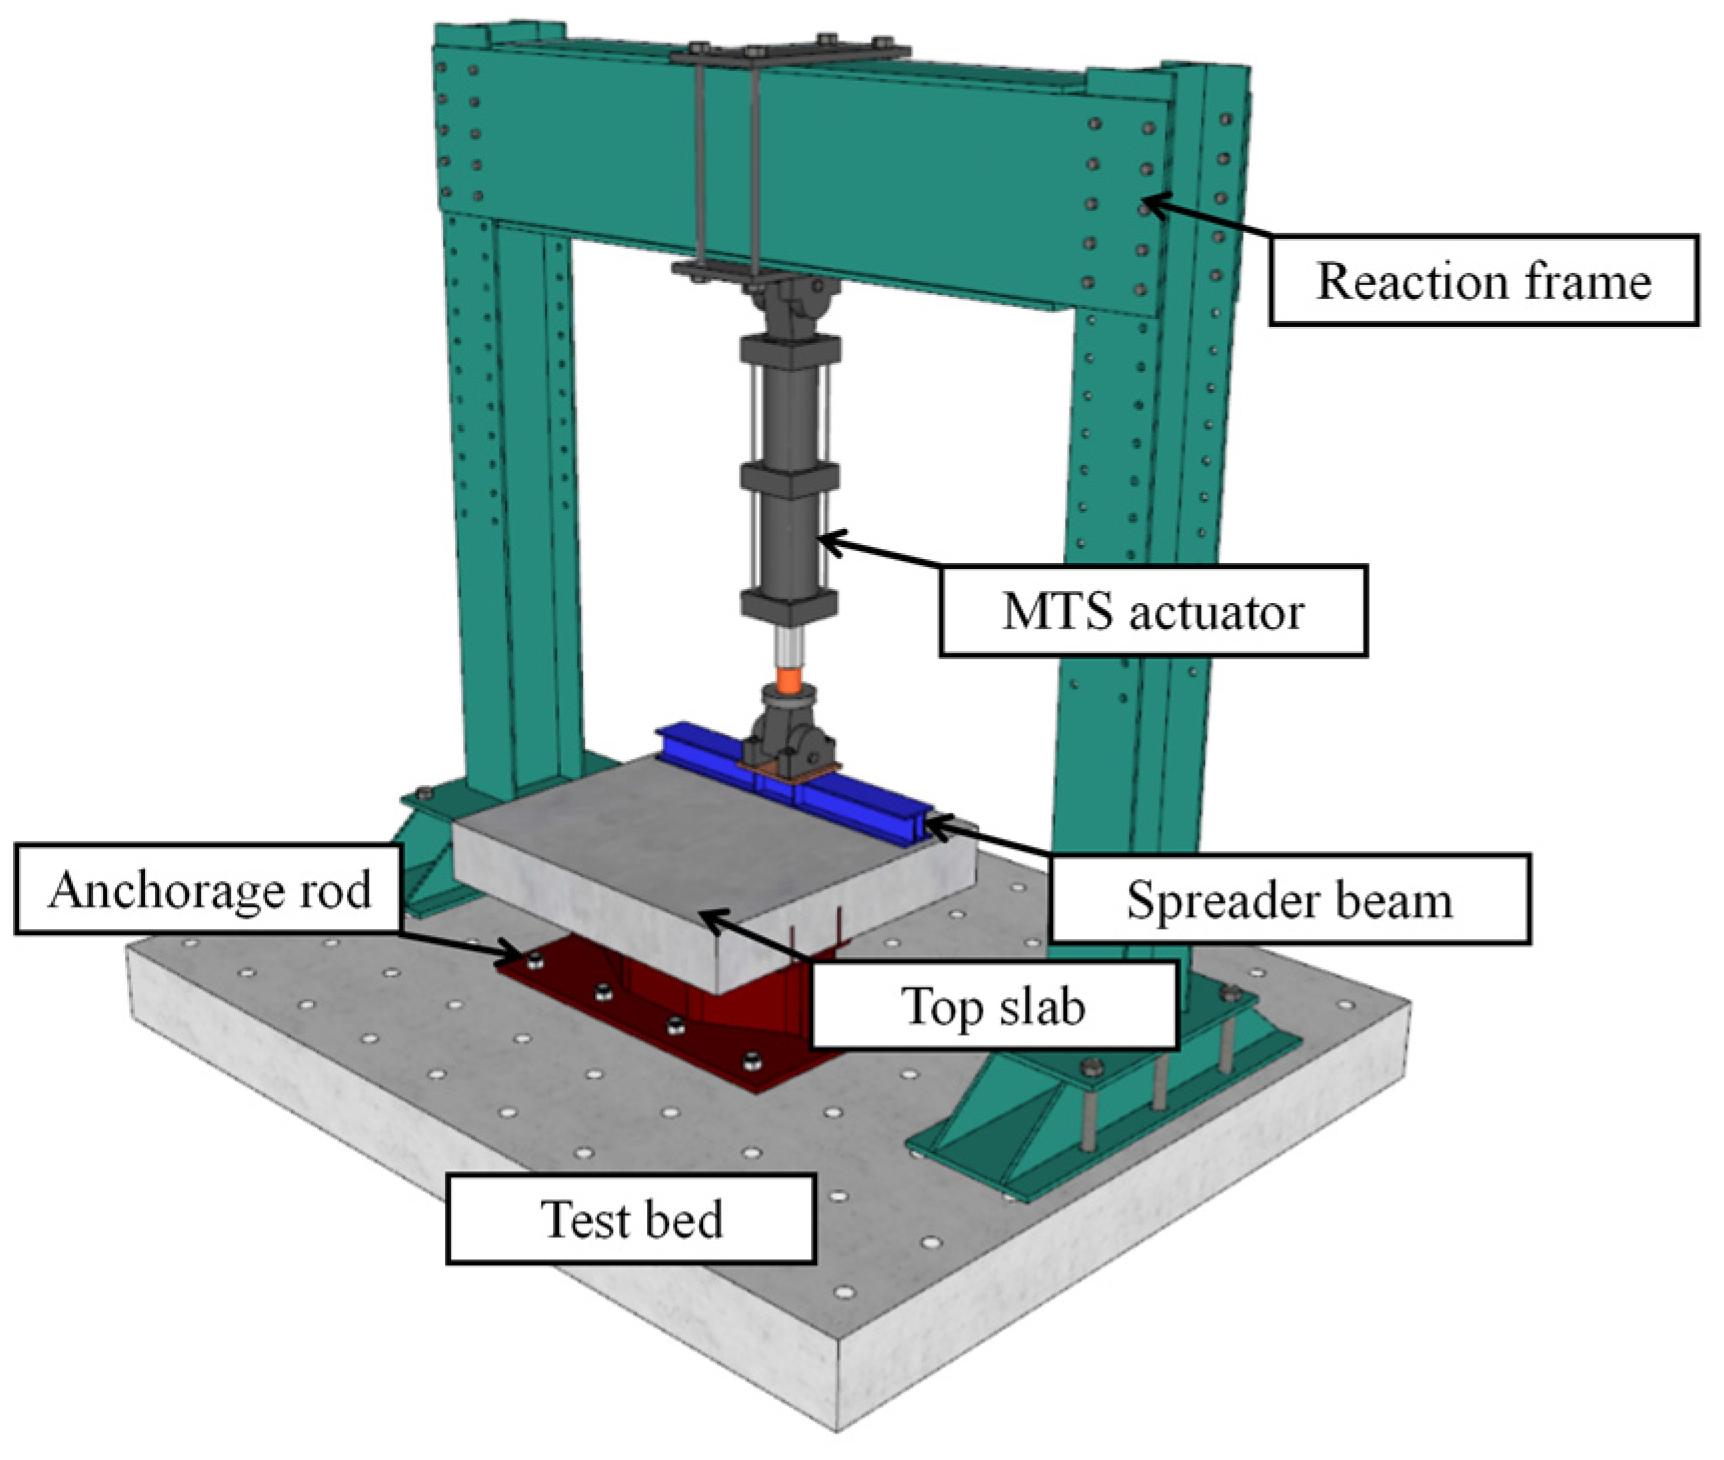
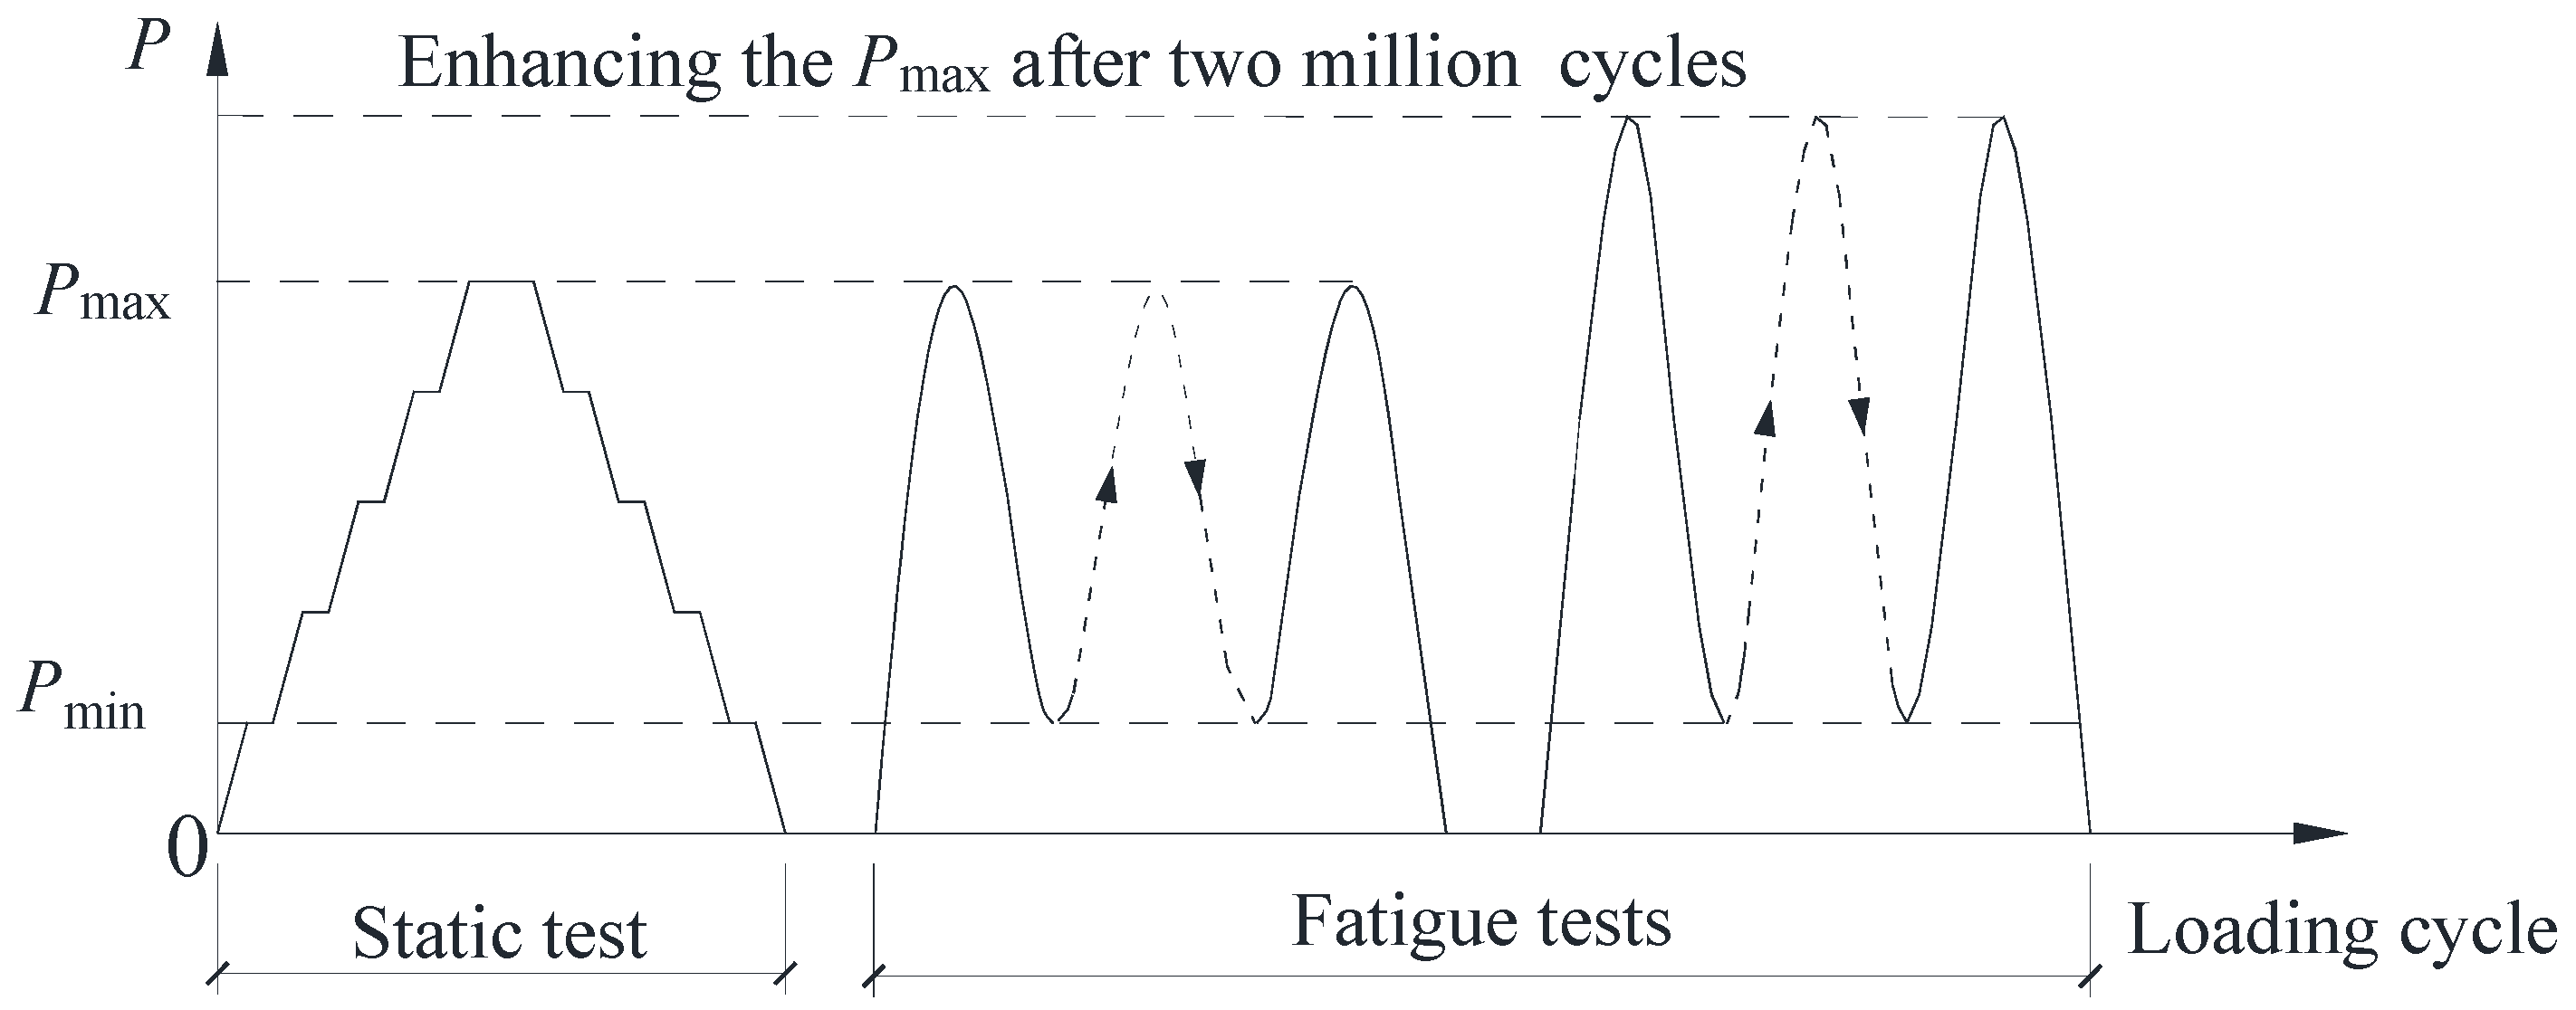
2.2. Test Setup and Loading Scheme
3. Experimental Results and Discussion
3.1. Observations during the Fatigue Loading Procedure
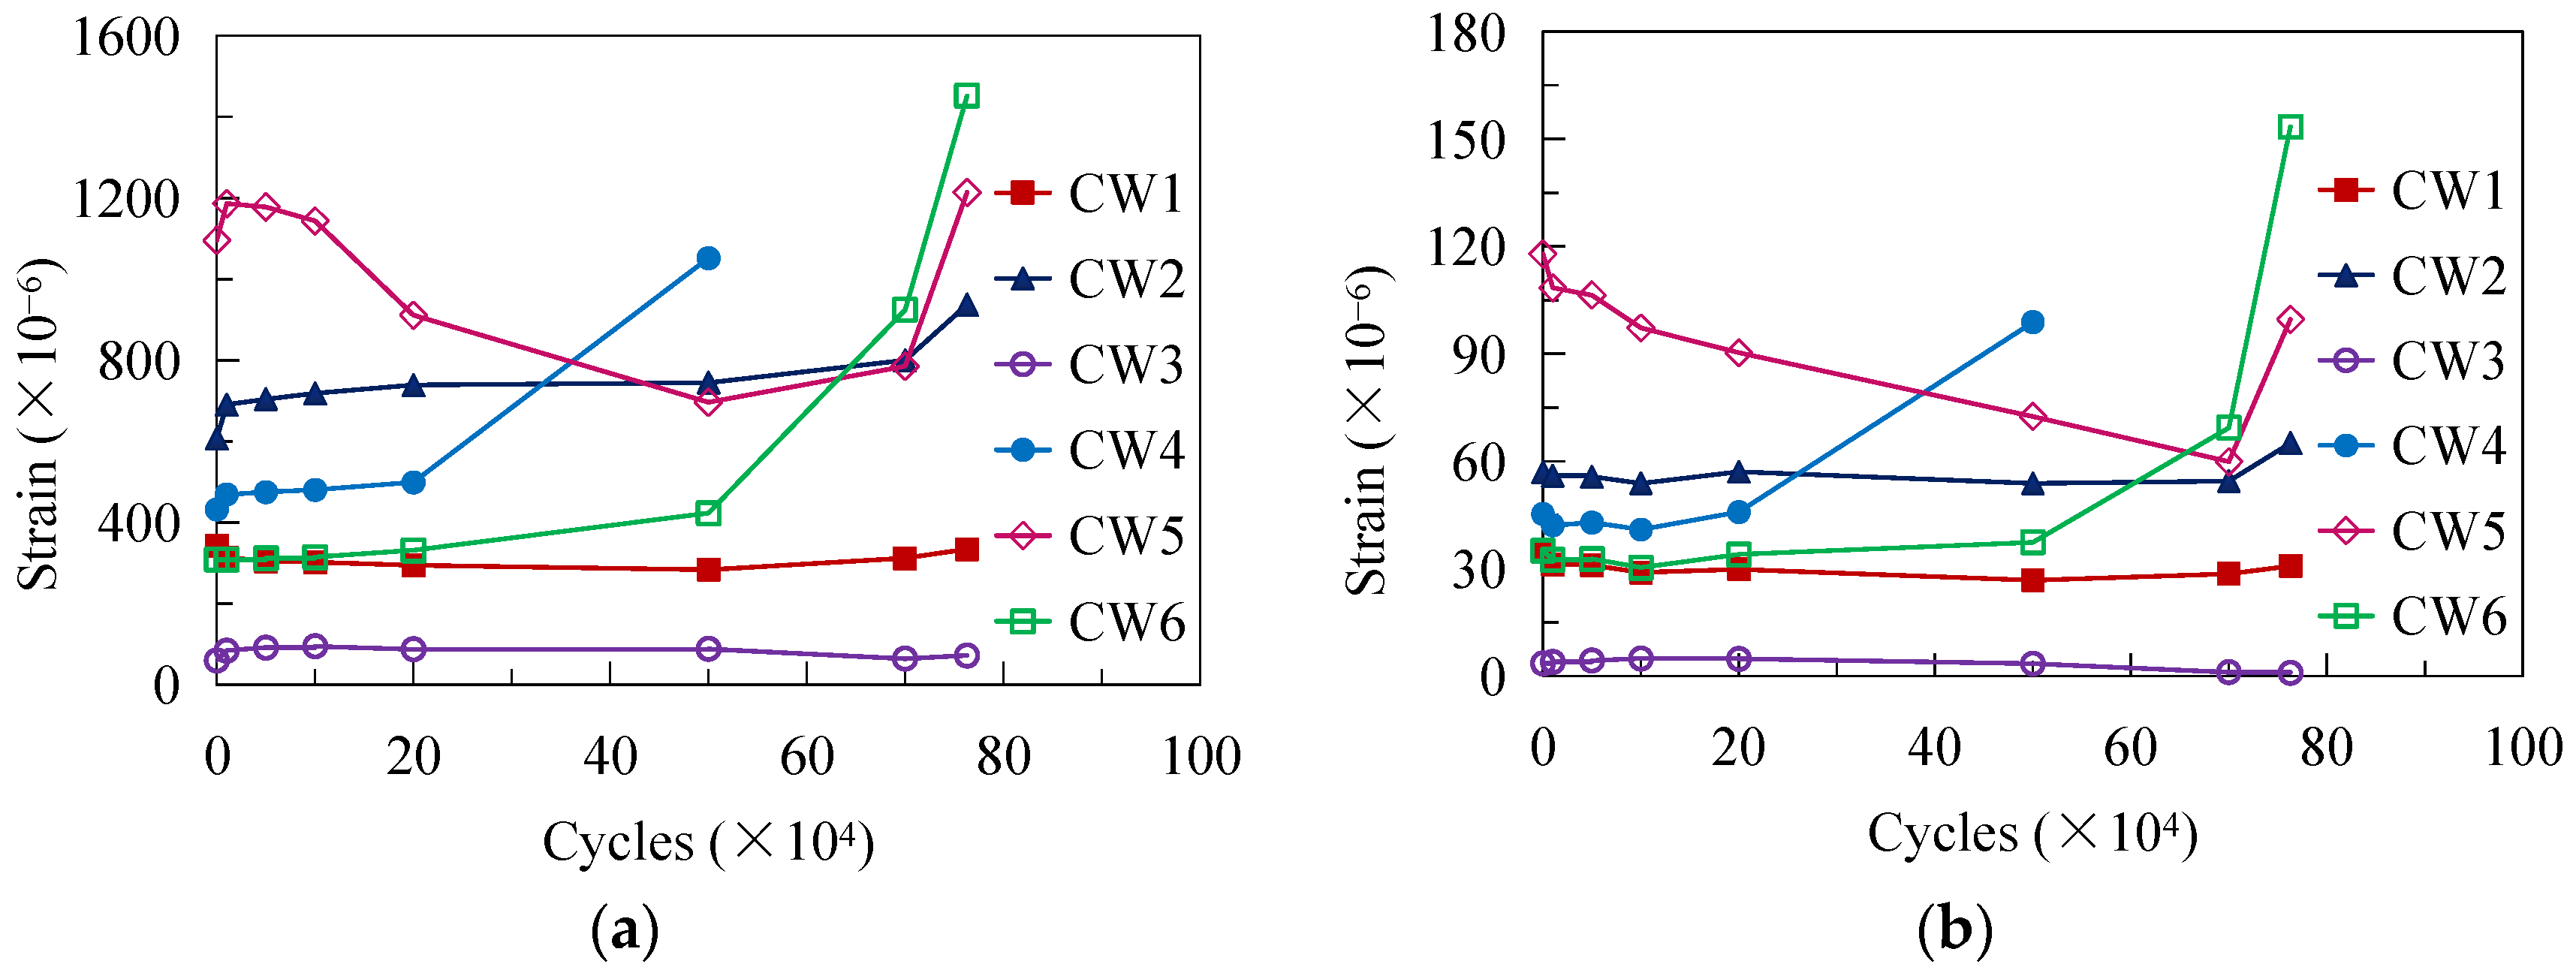
3.2. Strain Development of the CSW
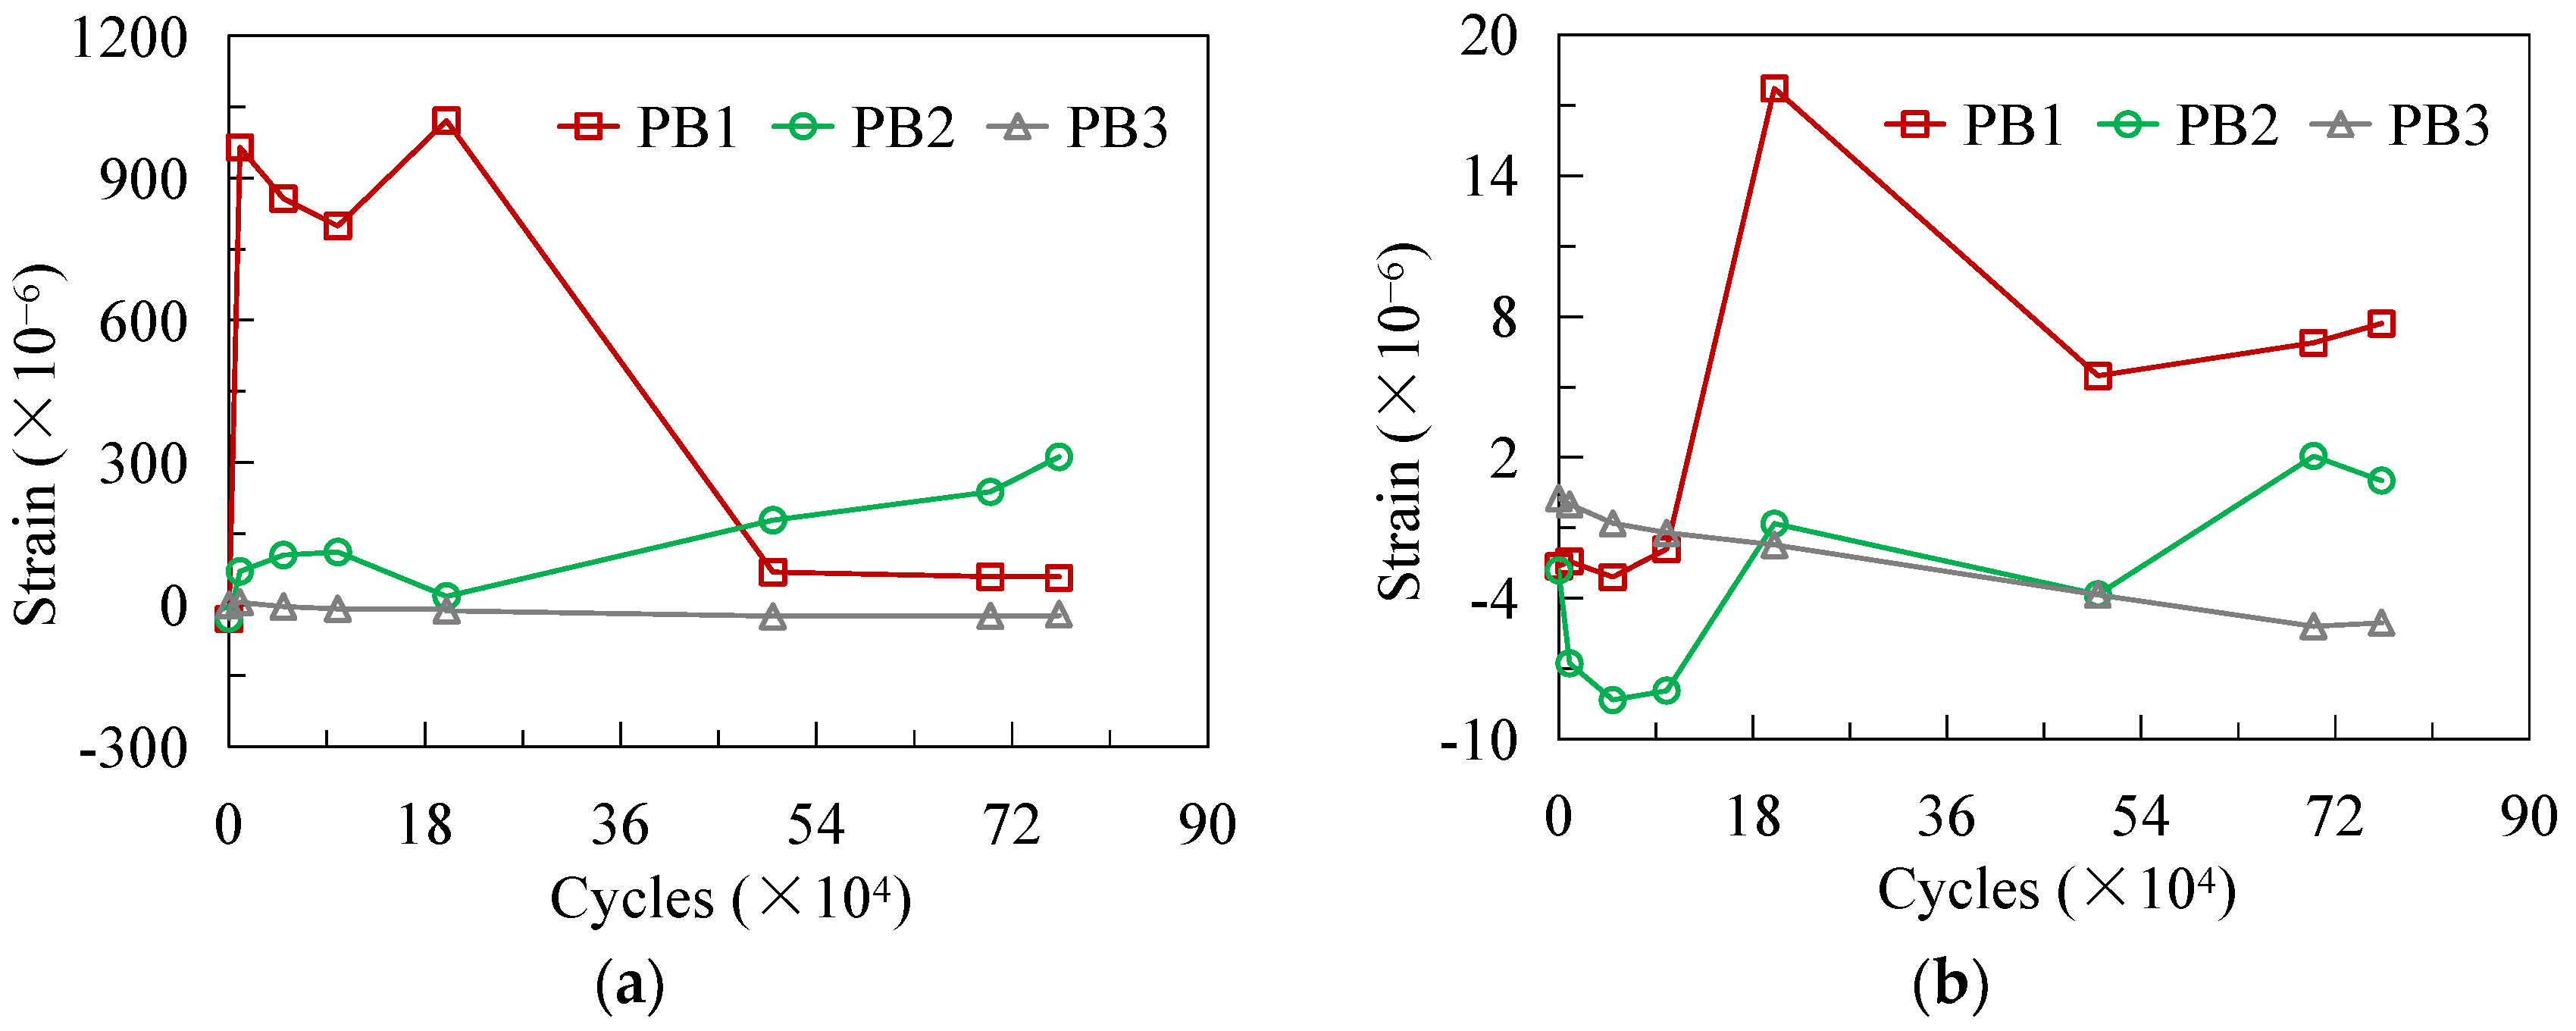
3.3. Strain of PBL Connectors
3.4. Degeneration of Flexural Stiffness of the Joint
3.5. Assessment of Fatigue Lives
4. Finite Element Modeling Method
4.1. Modeling Methods
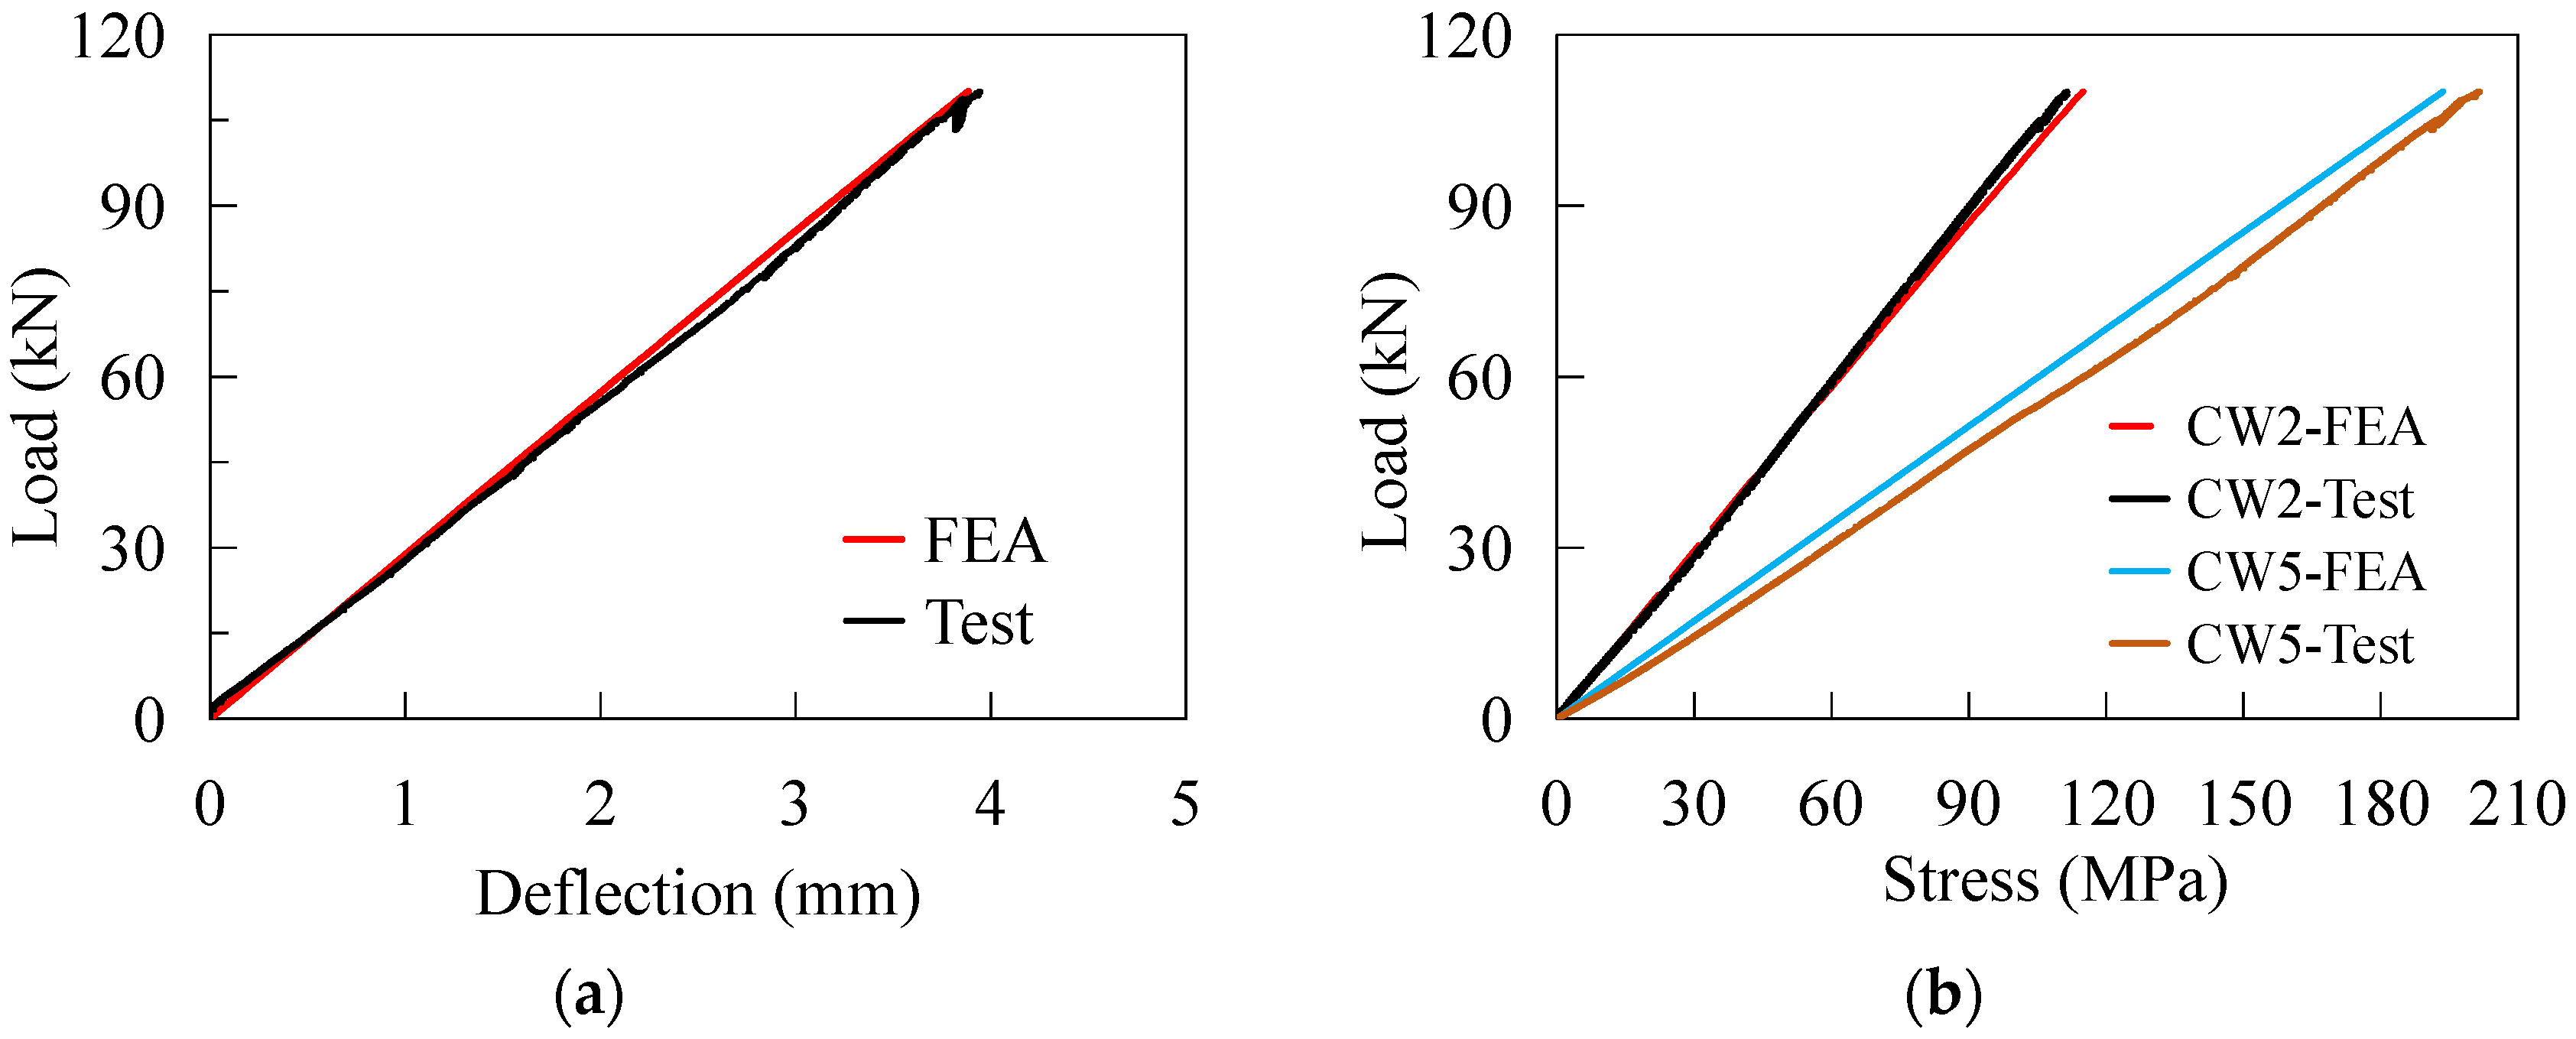
4.2. Validation of Numerical Results
5. Parametric Analysis
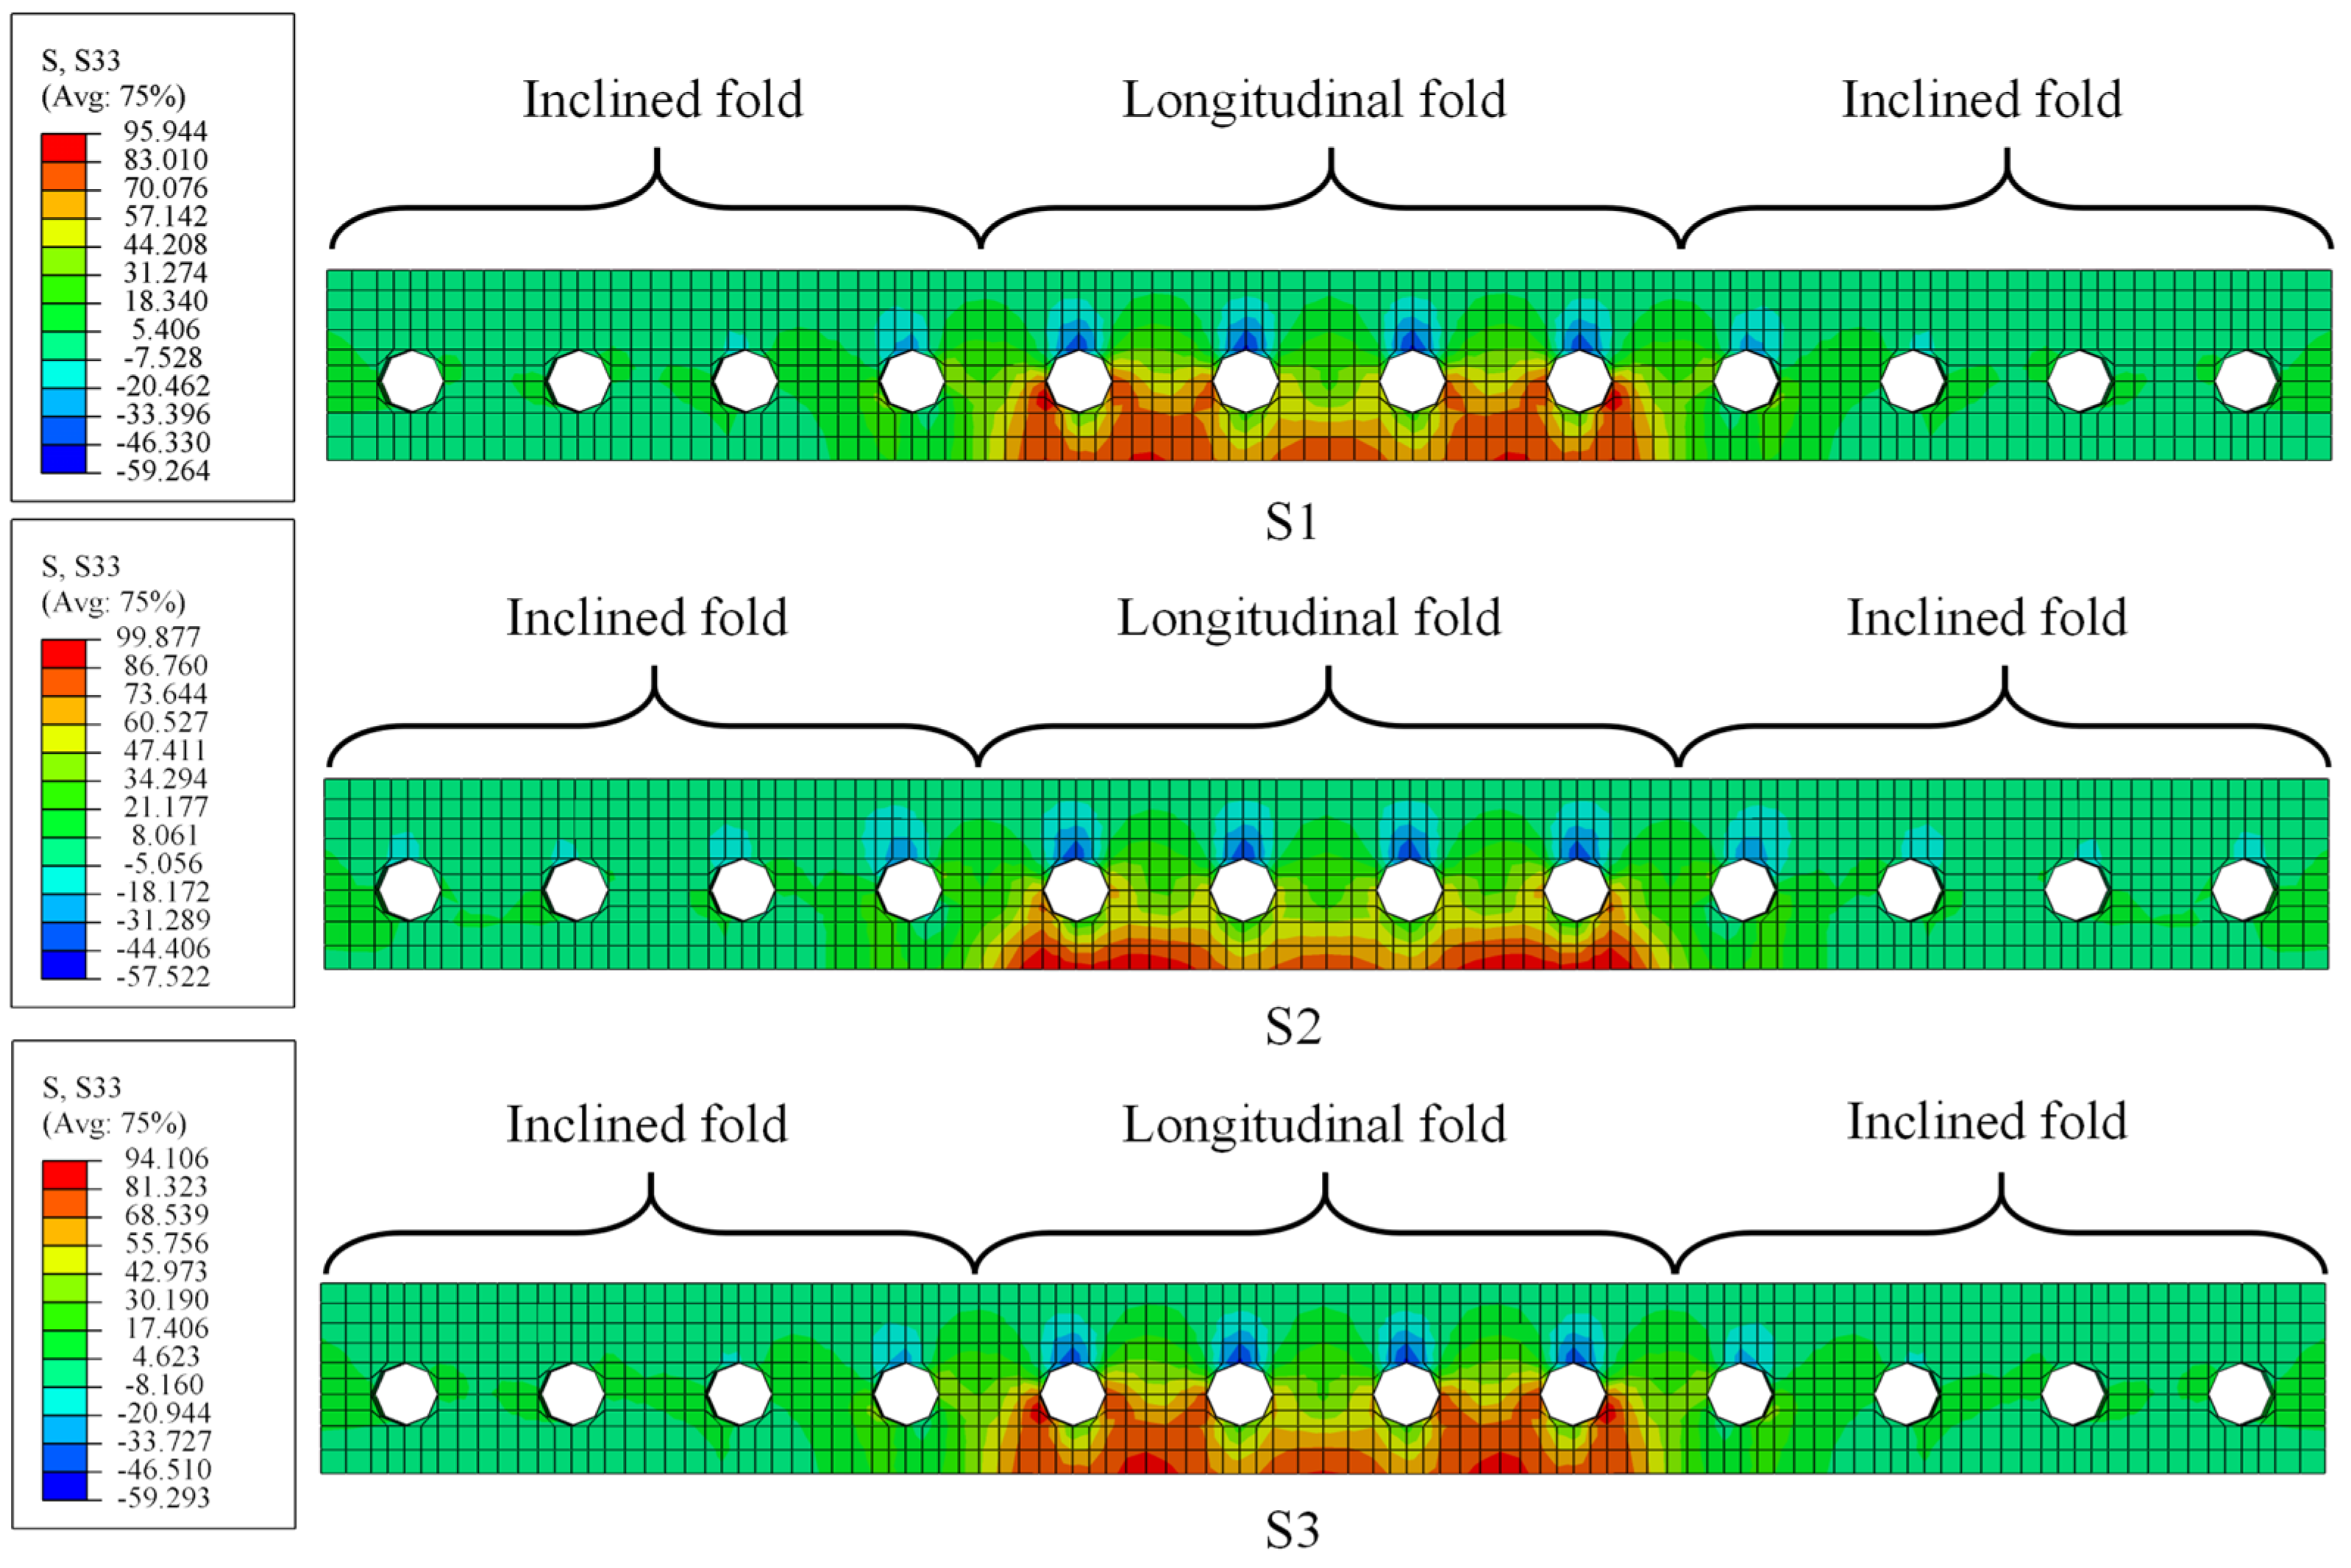
5.1. Discussion of Stress Distribution for PBL
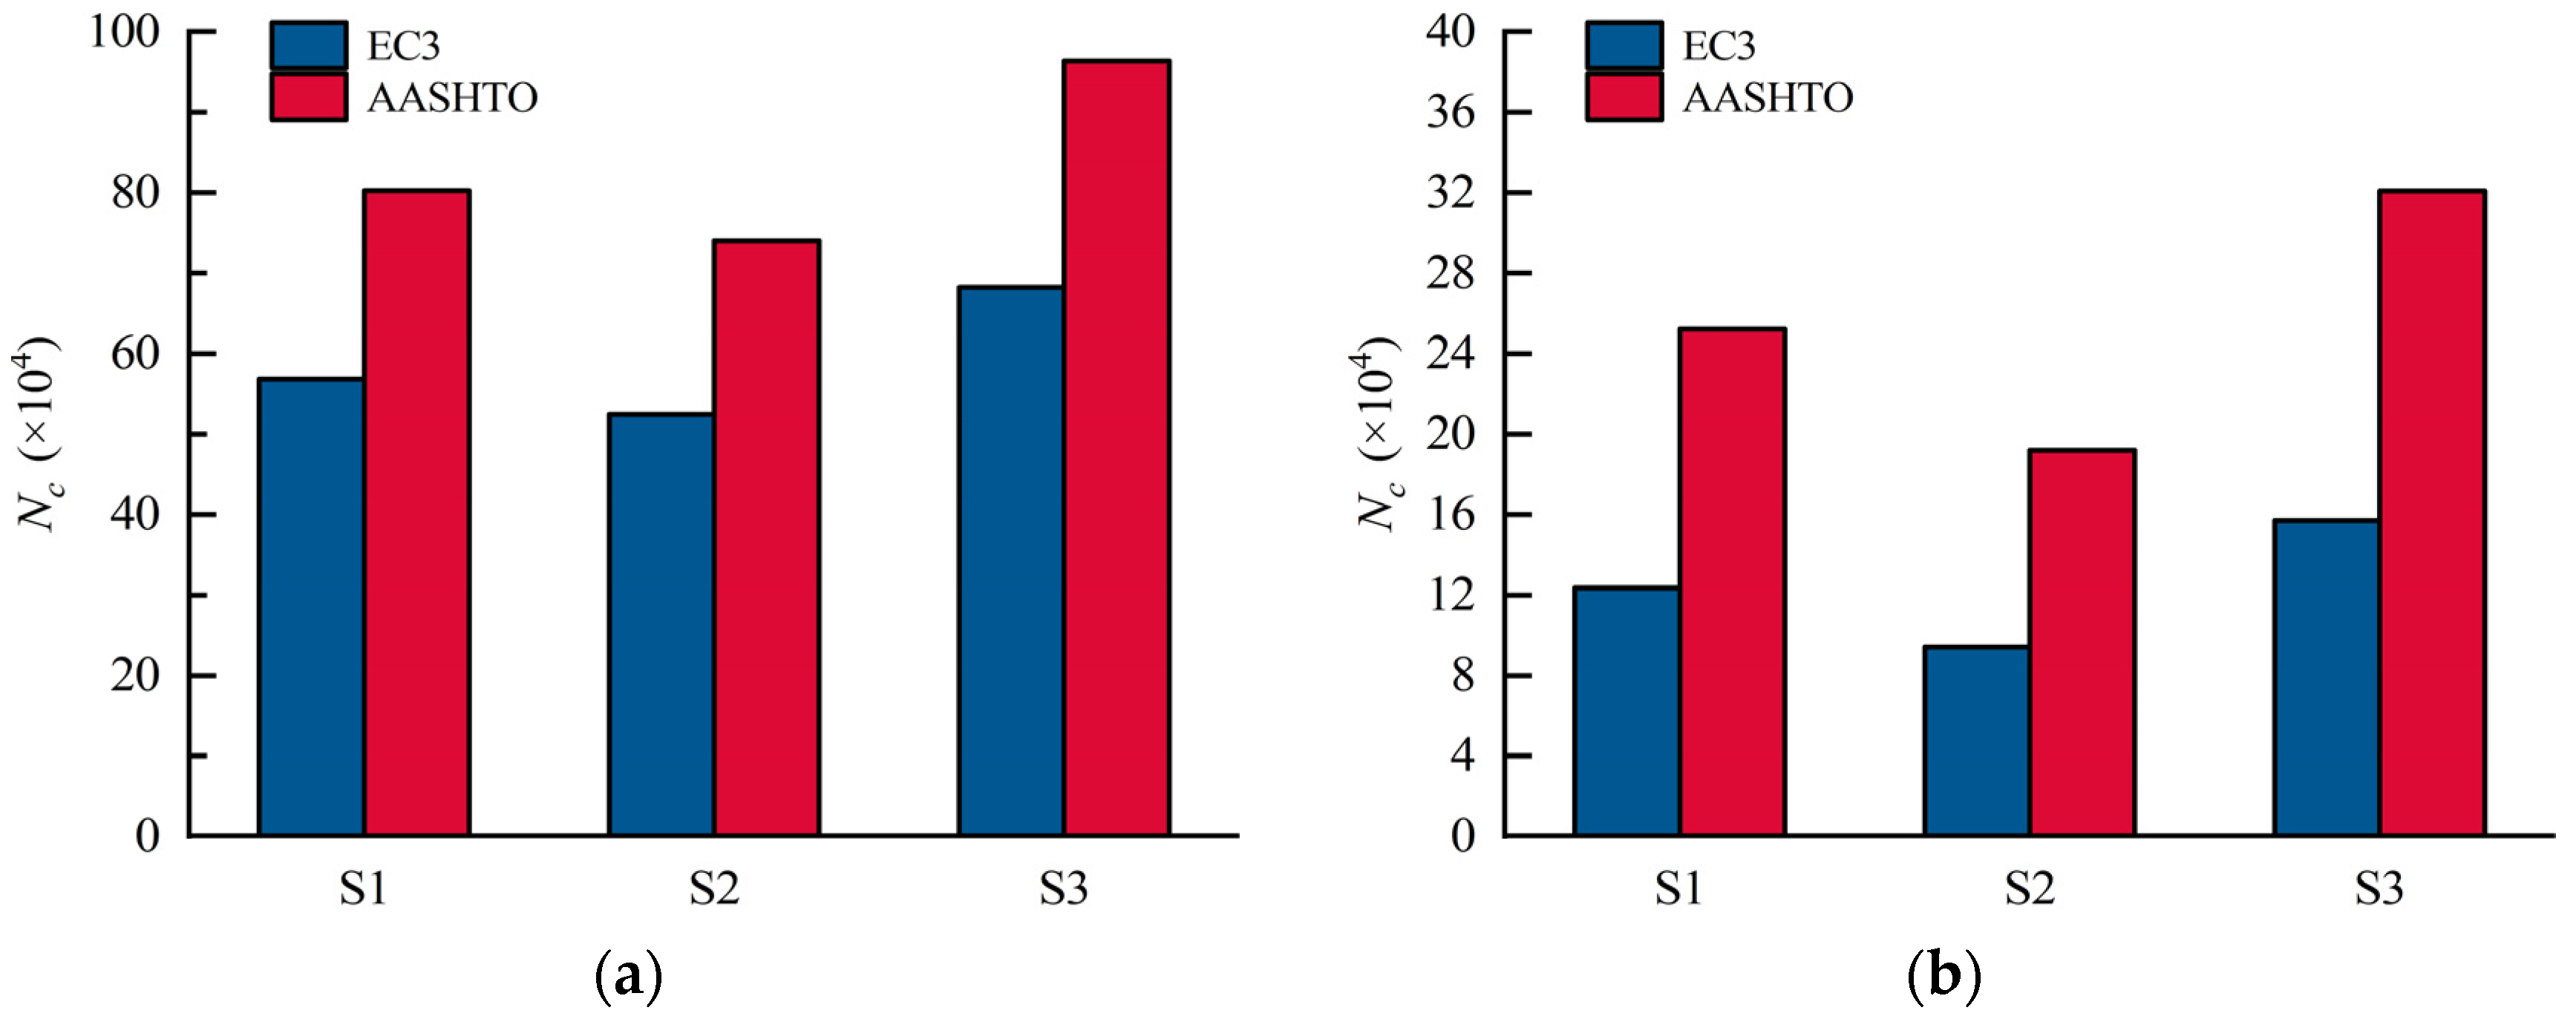
5.2. Optimization of Fatigue Design
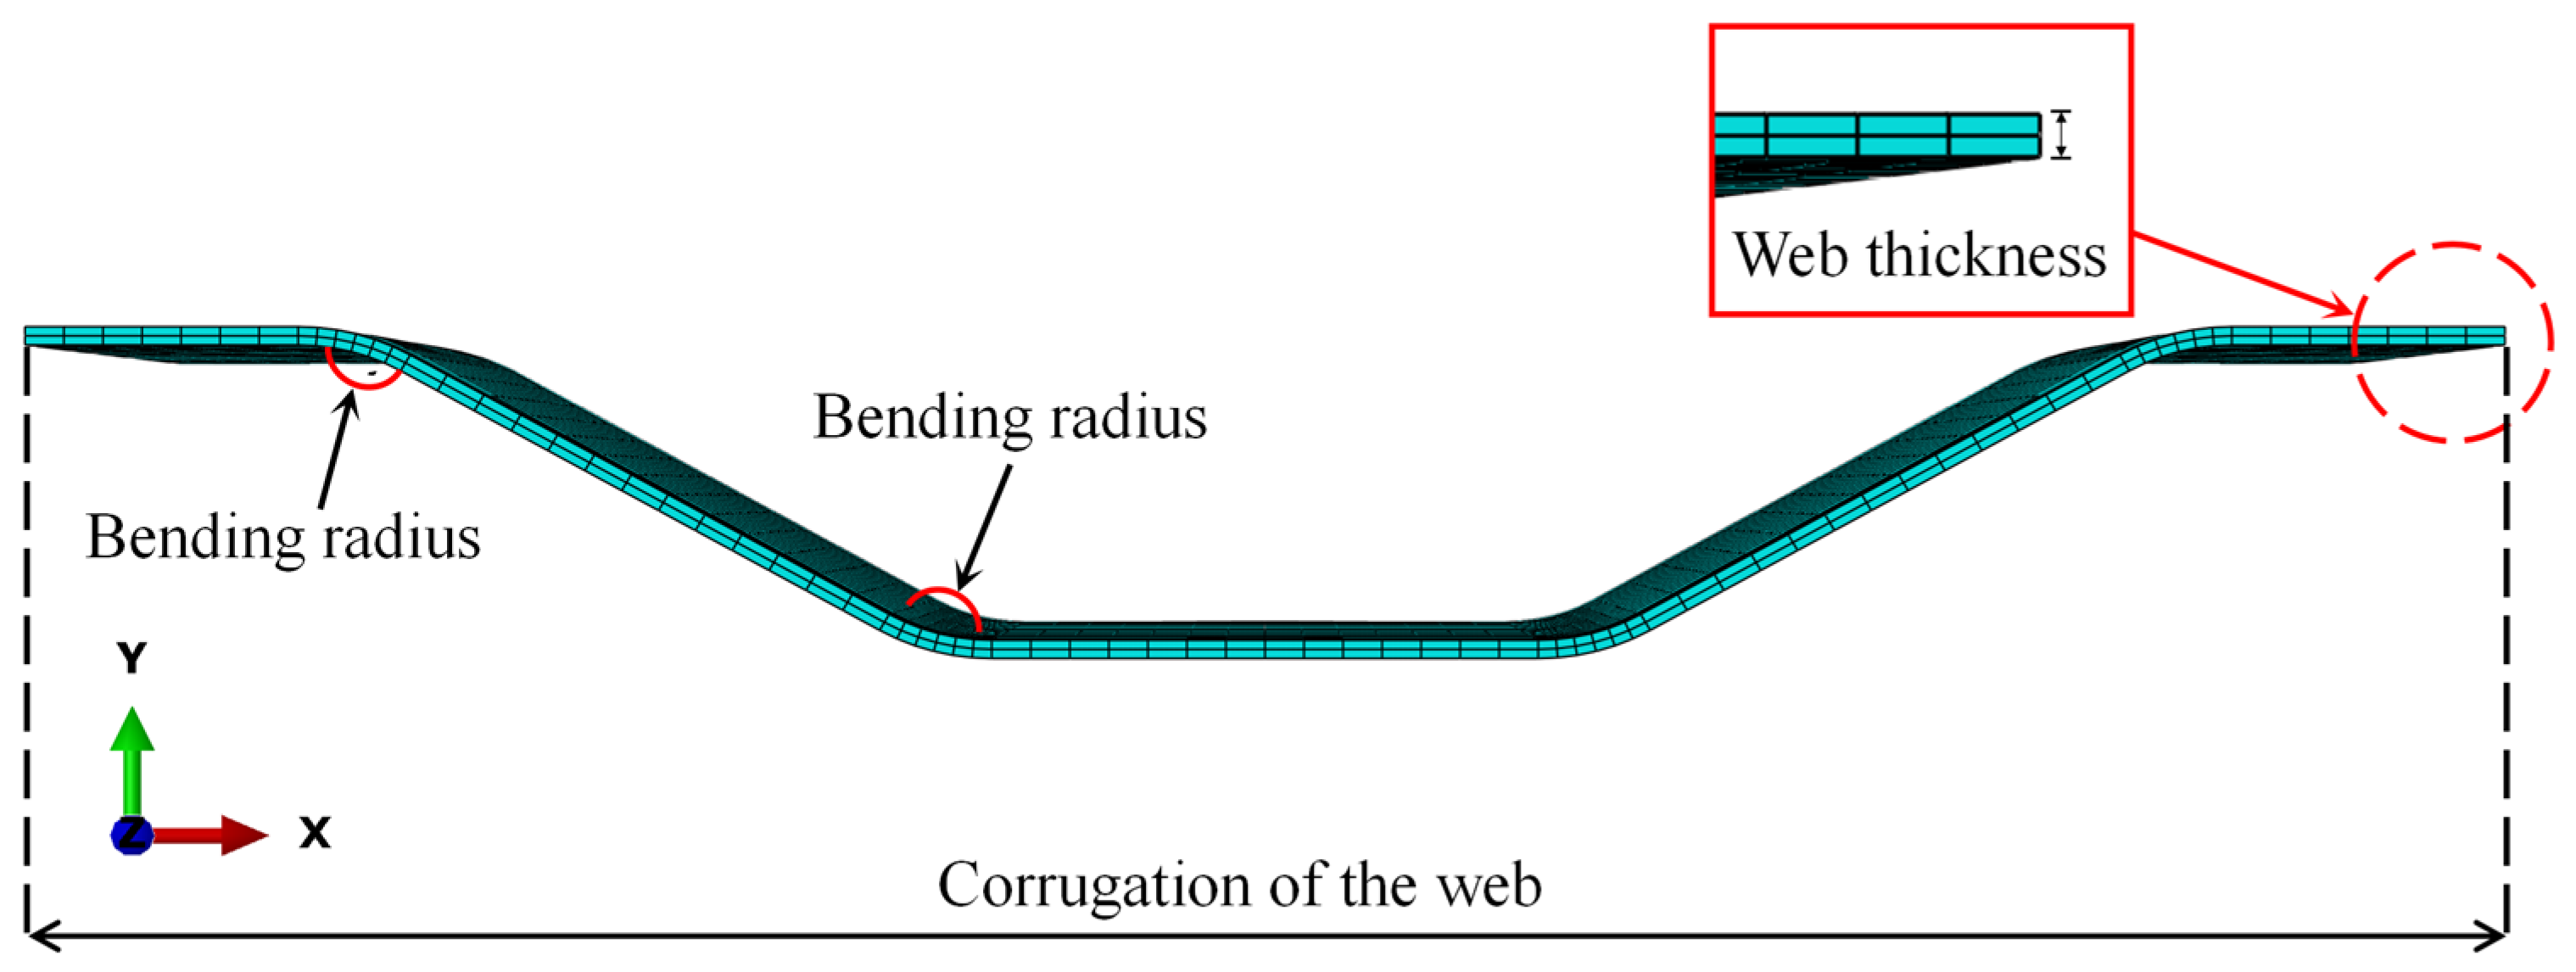
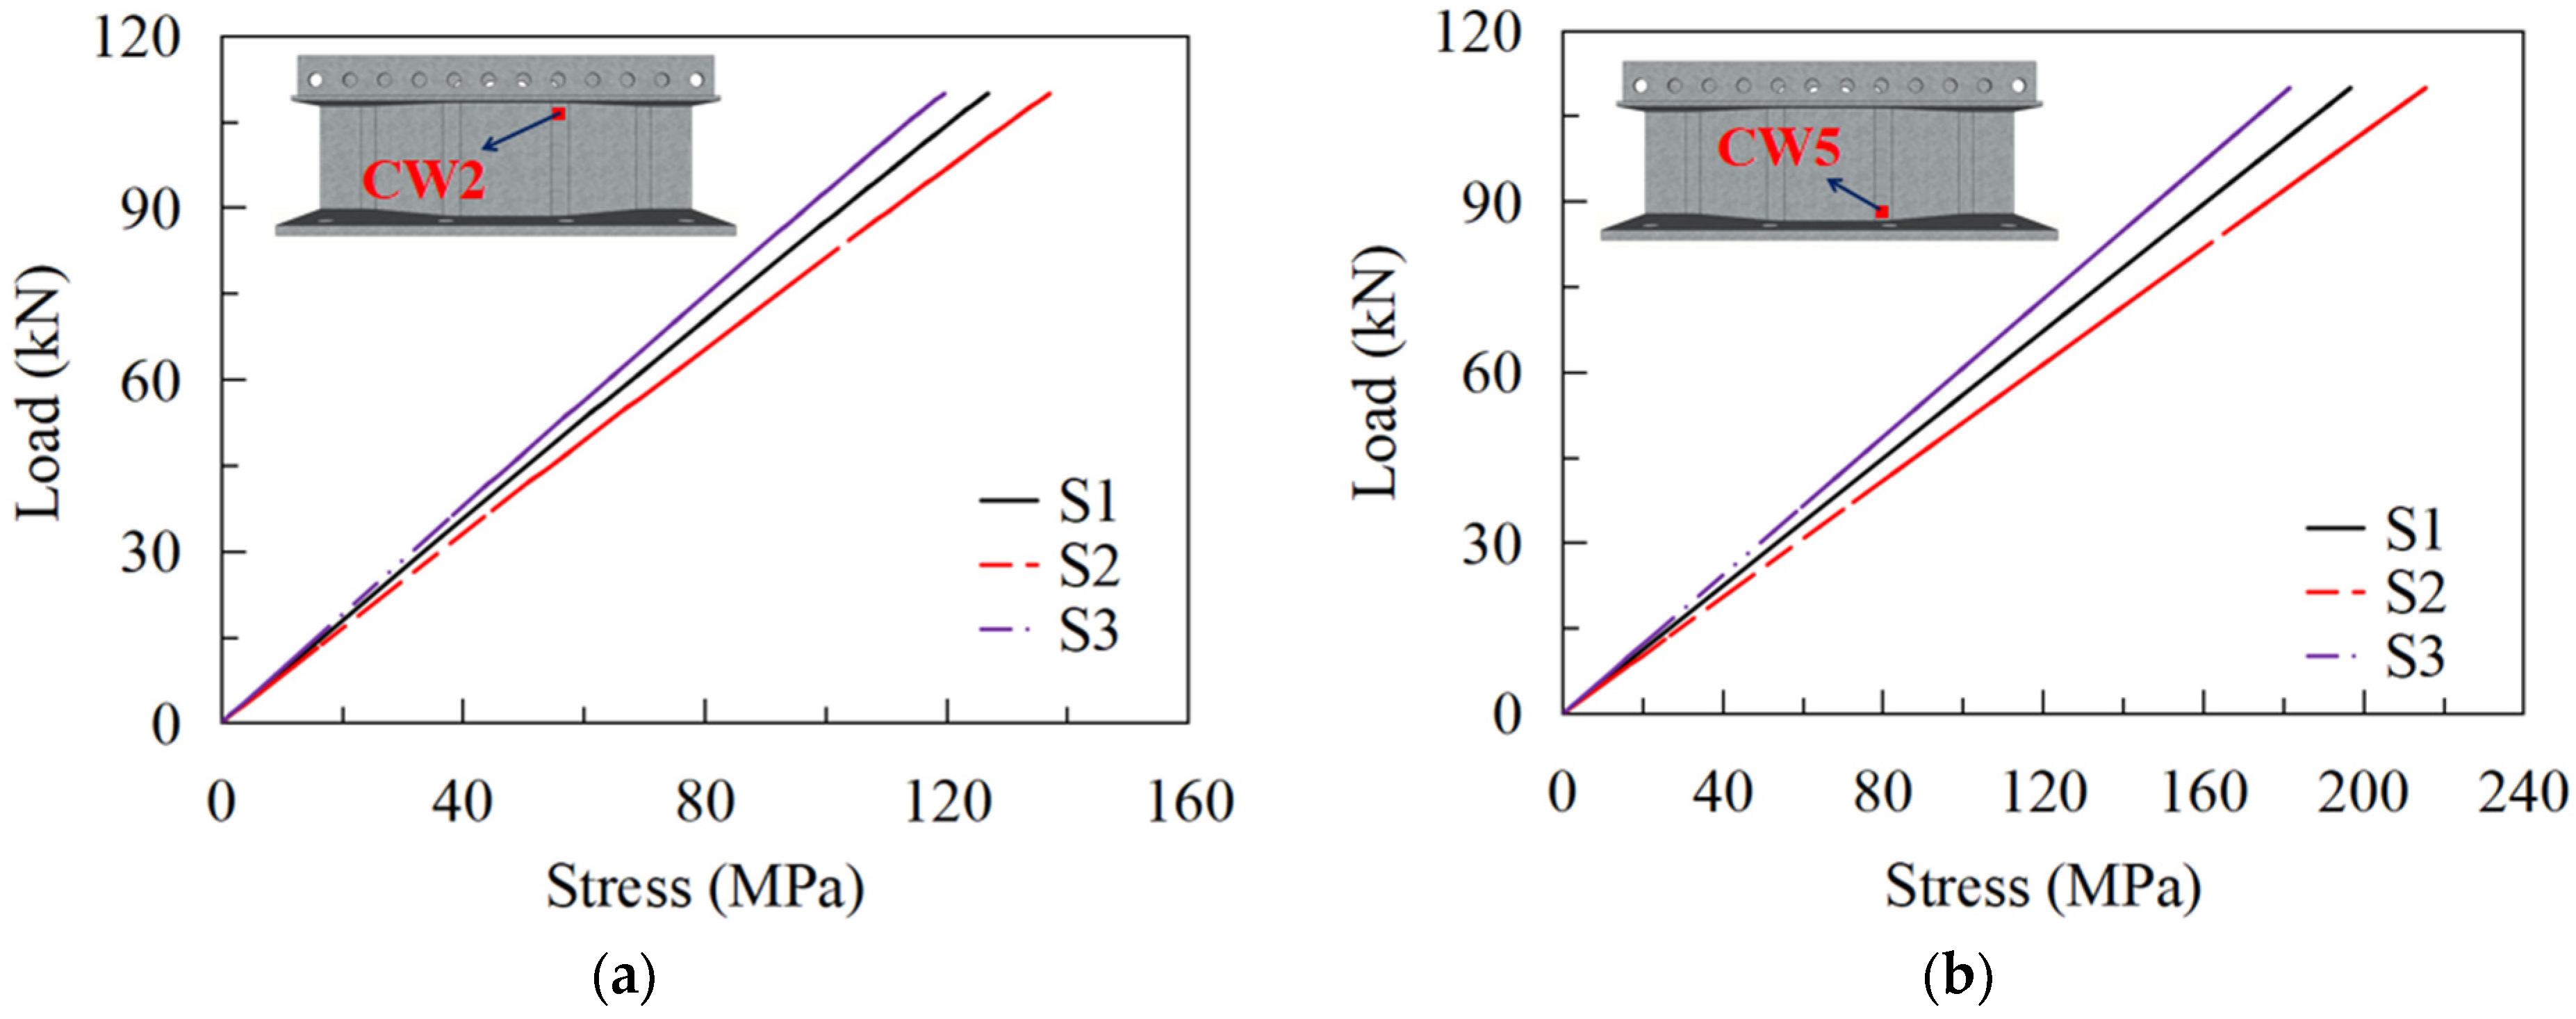
5.2.1. Effects of the Bend Radii of CSWs
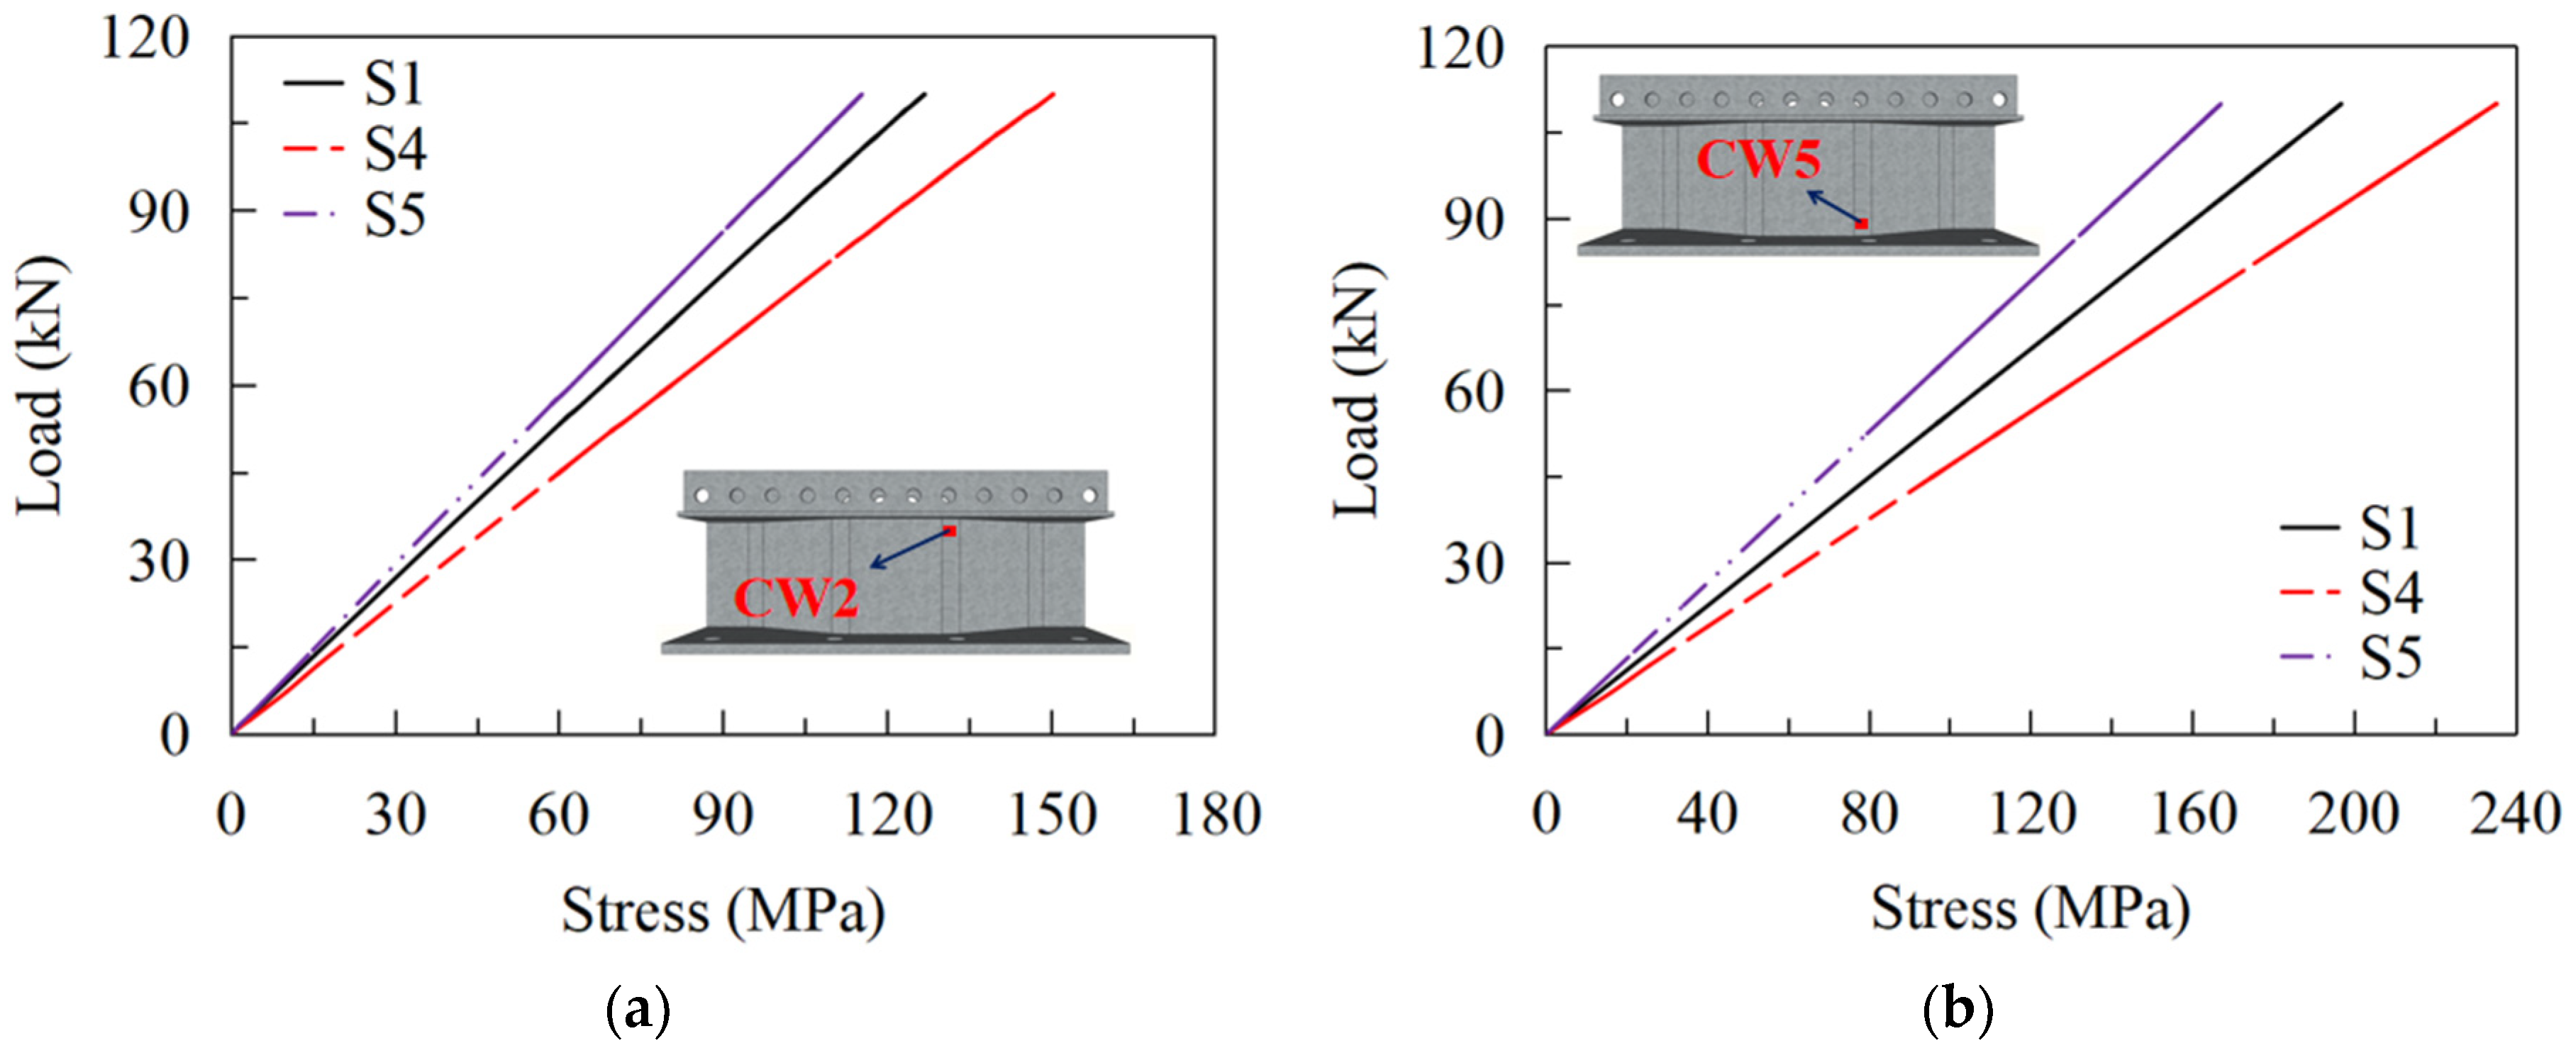
5.2.2. Effects of the Web Thickness
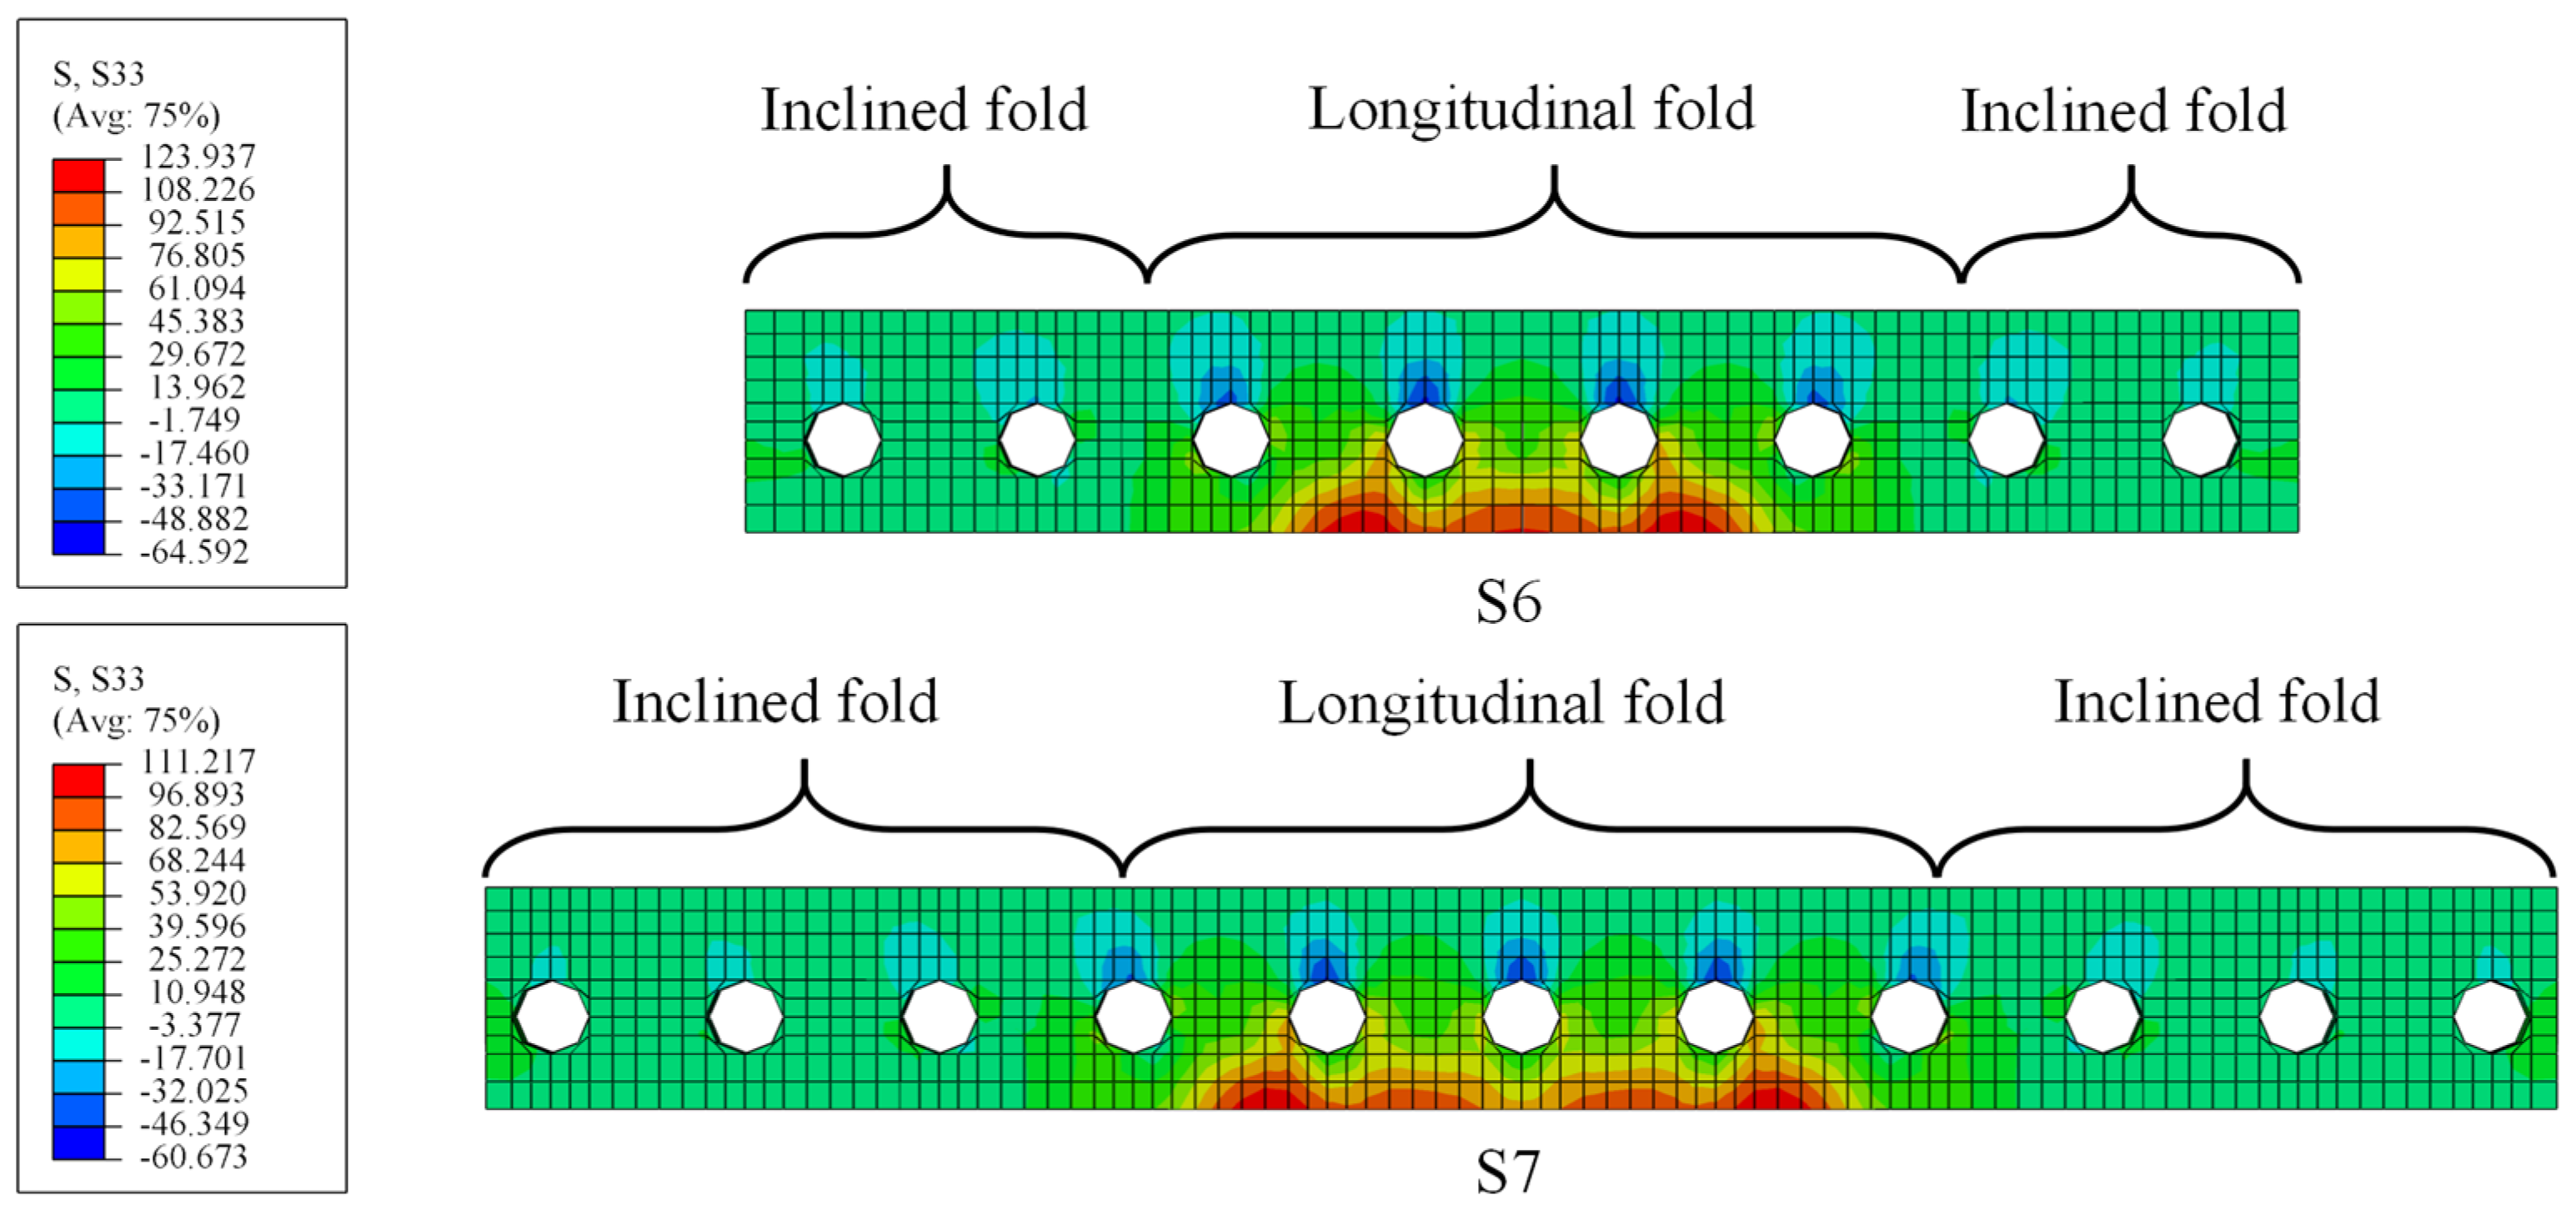
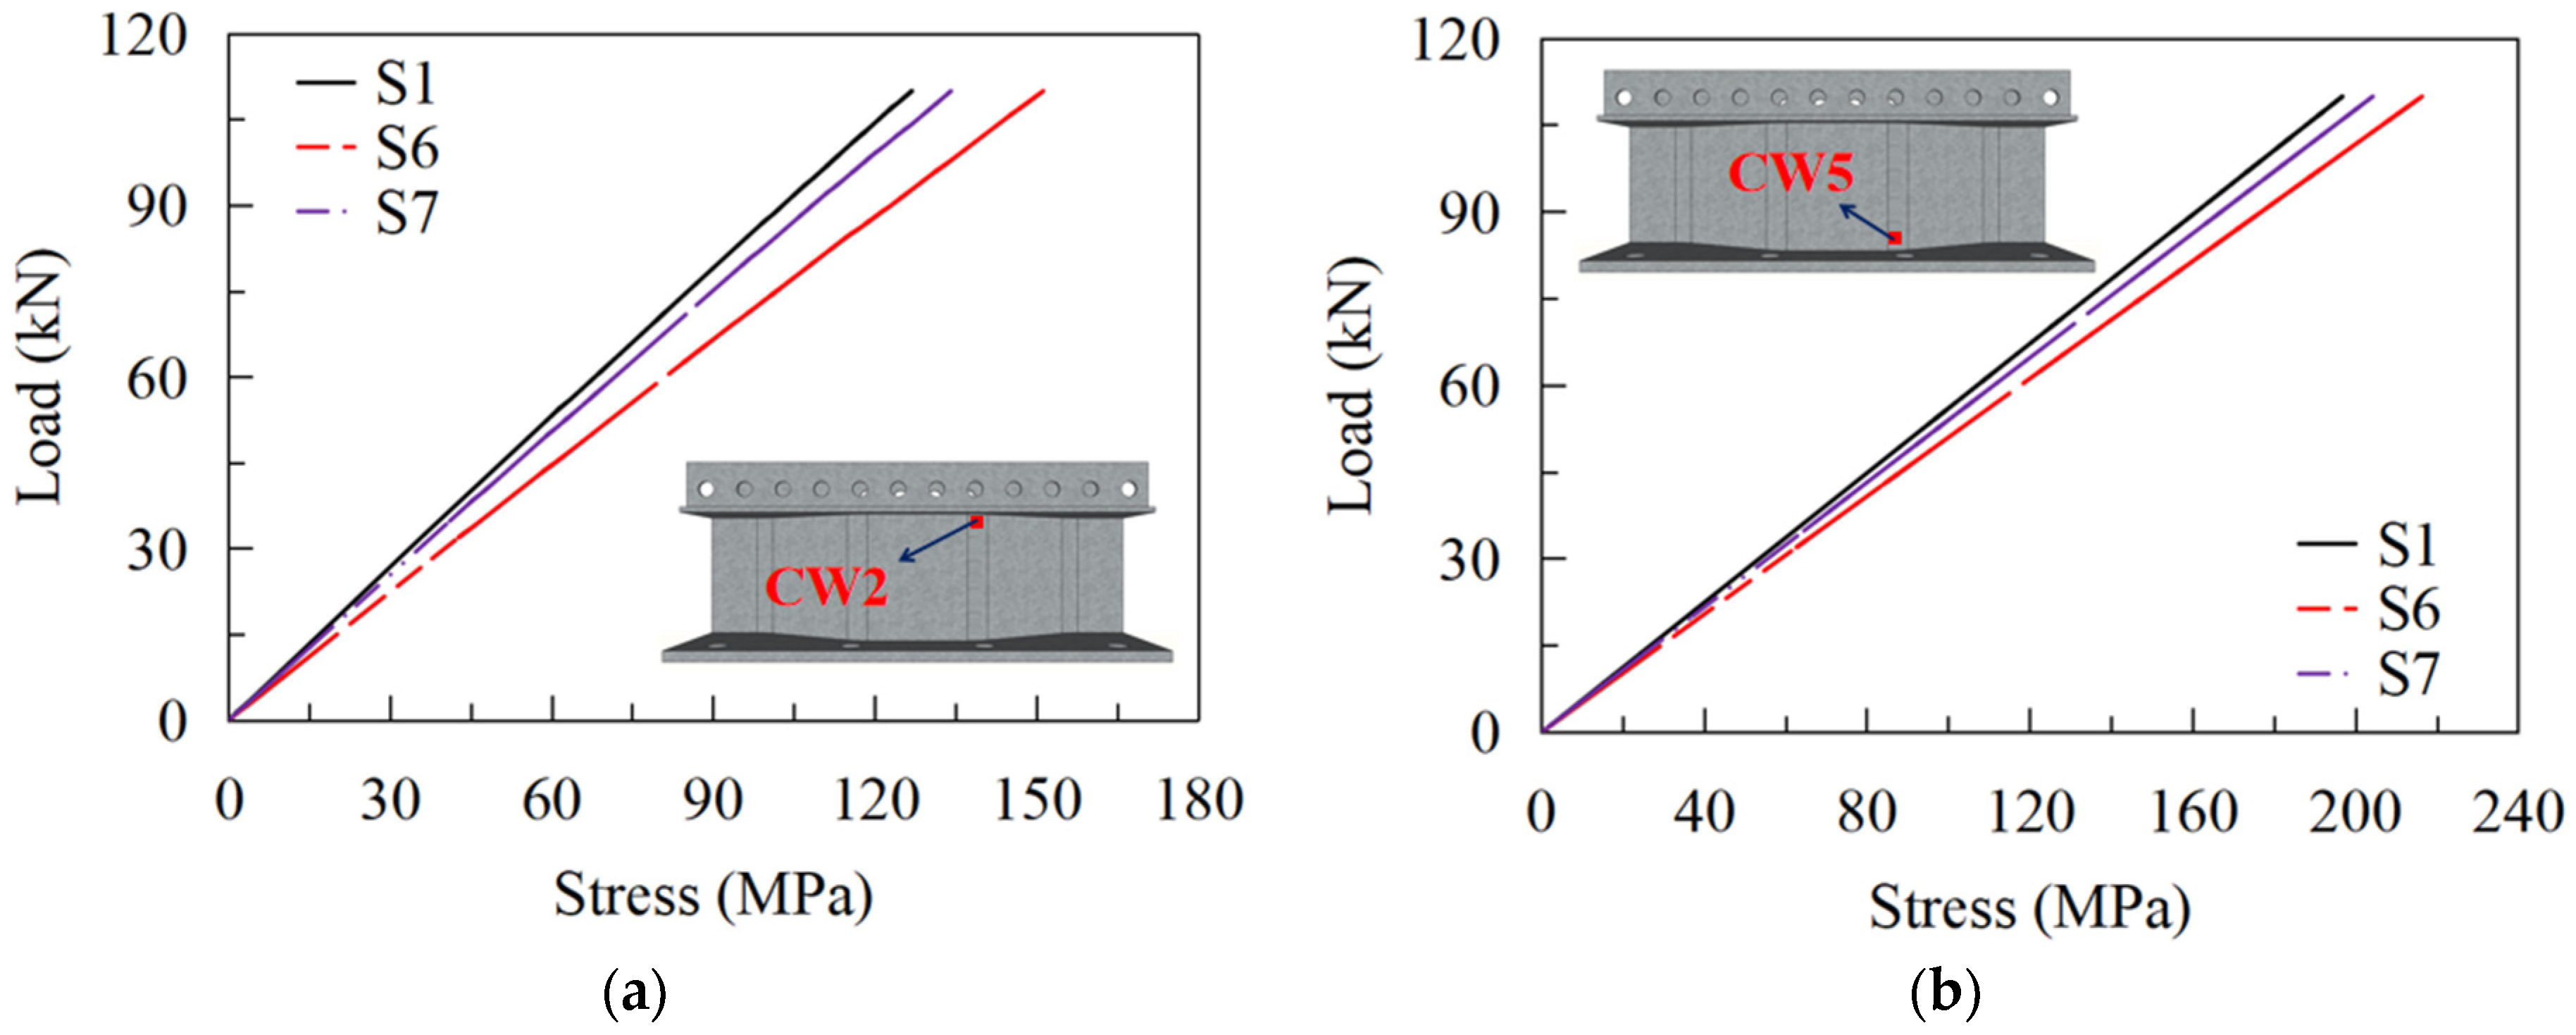
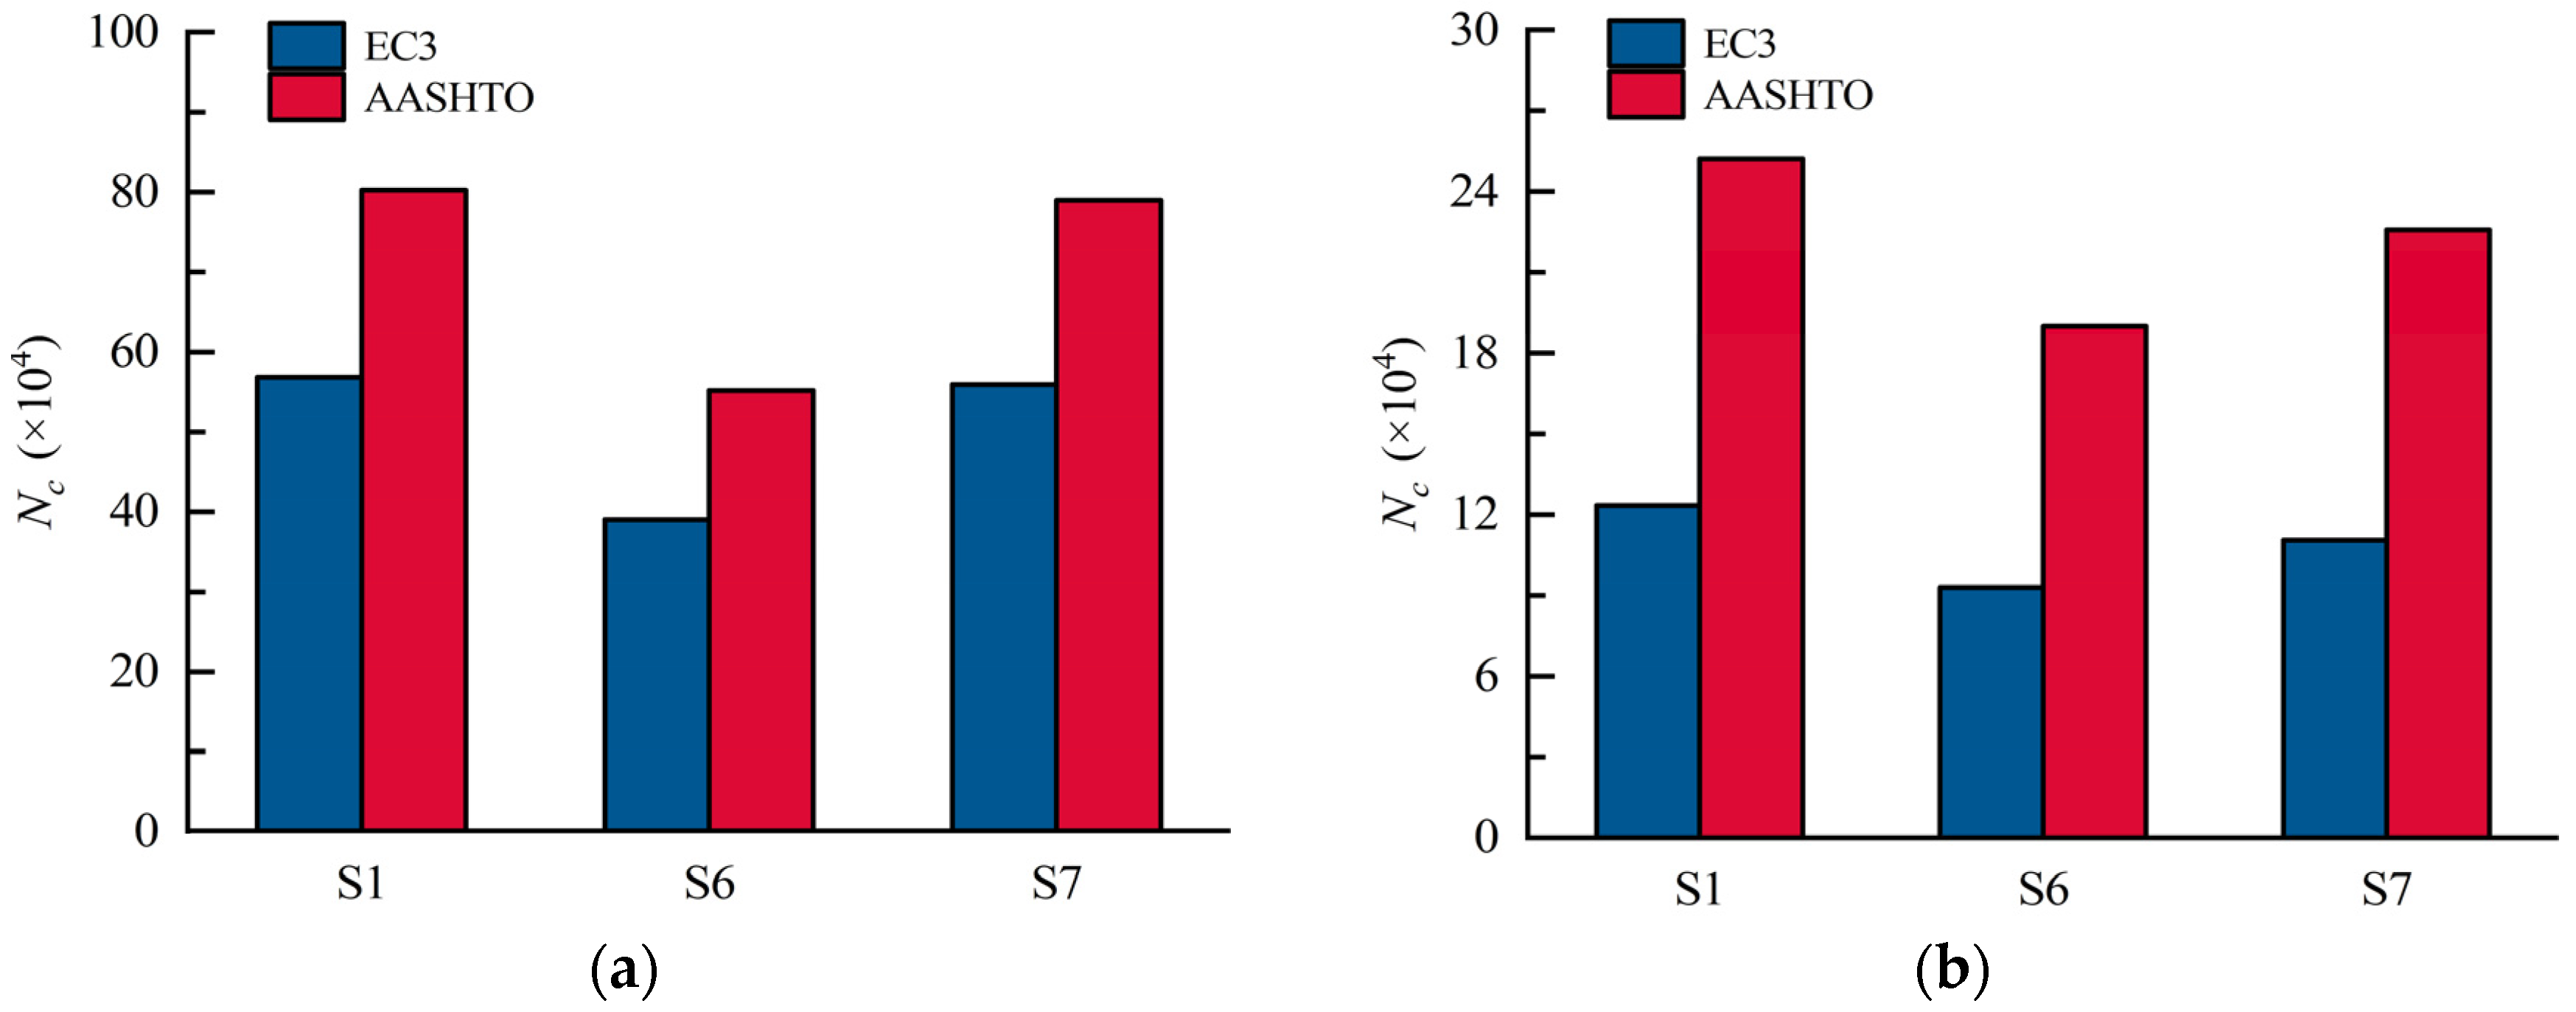
5.2.3. Effects of the Corrugations of the Web
6. Conclusions
- (1)
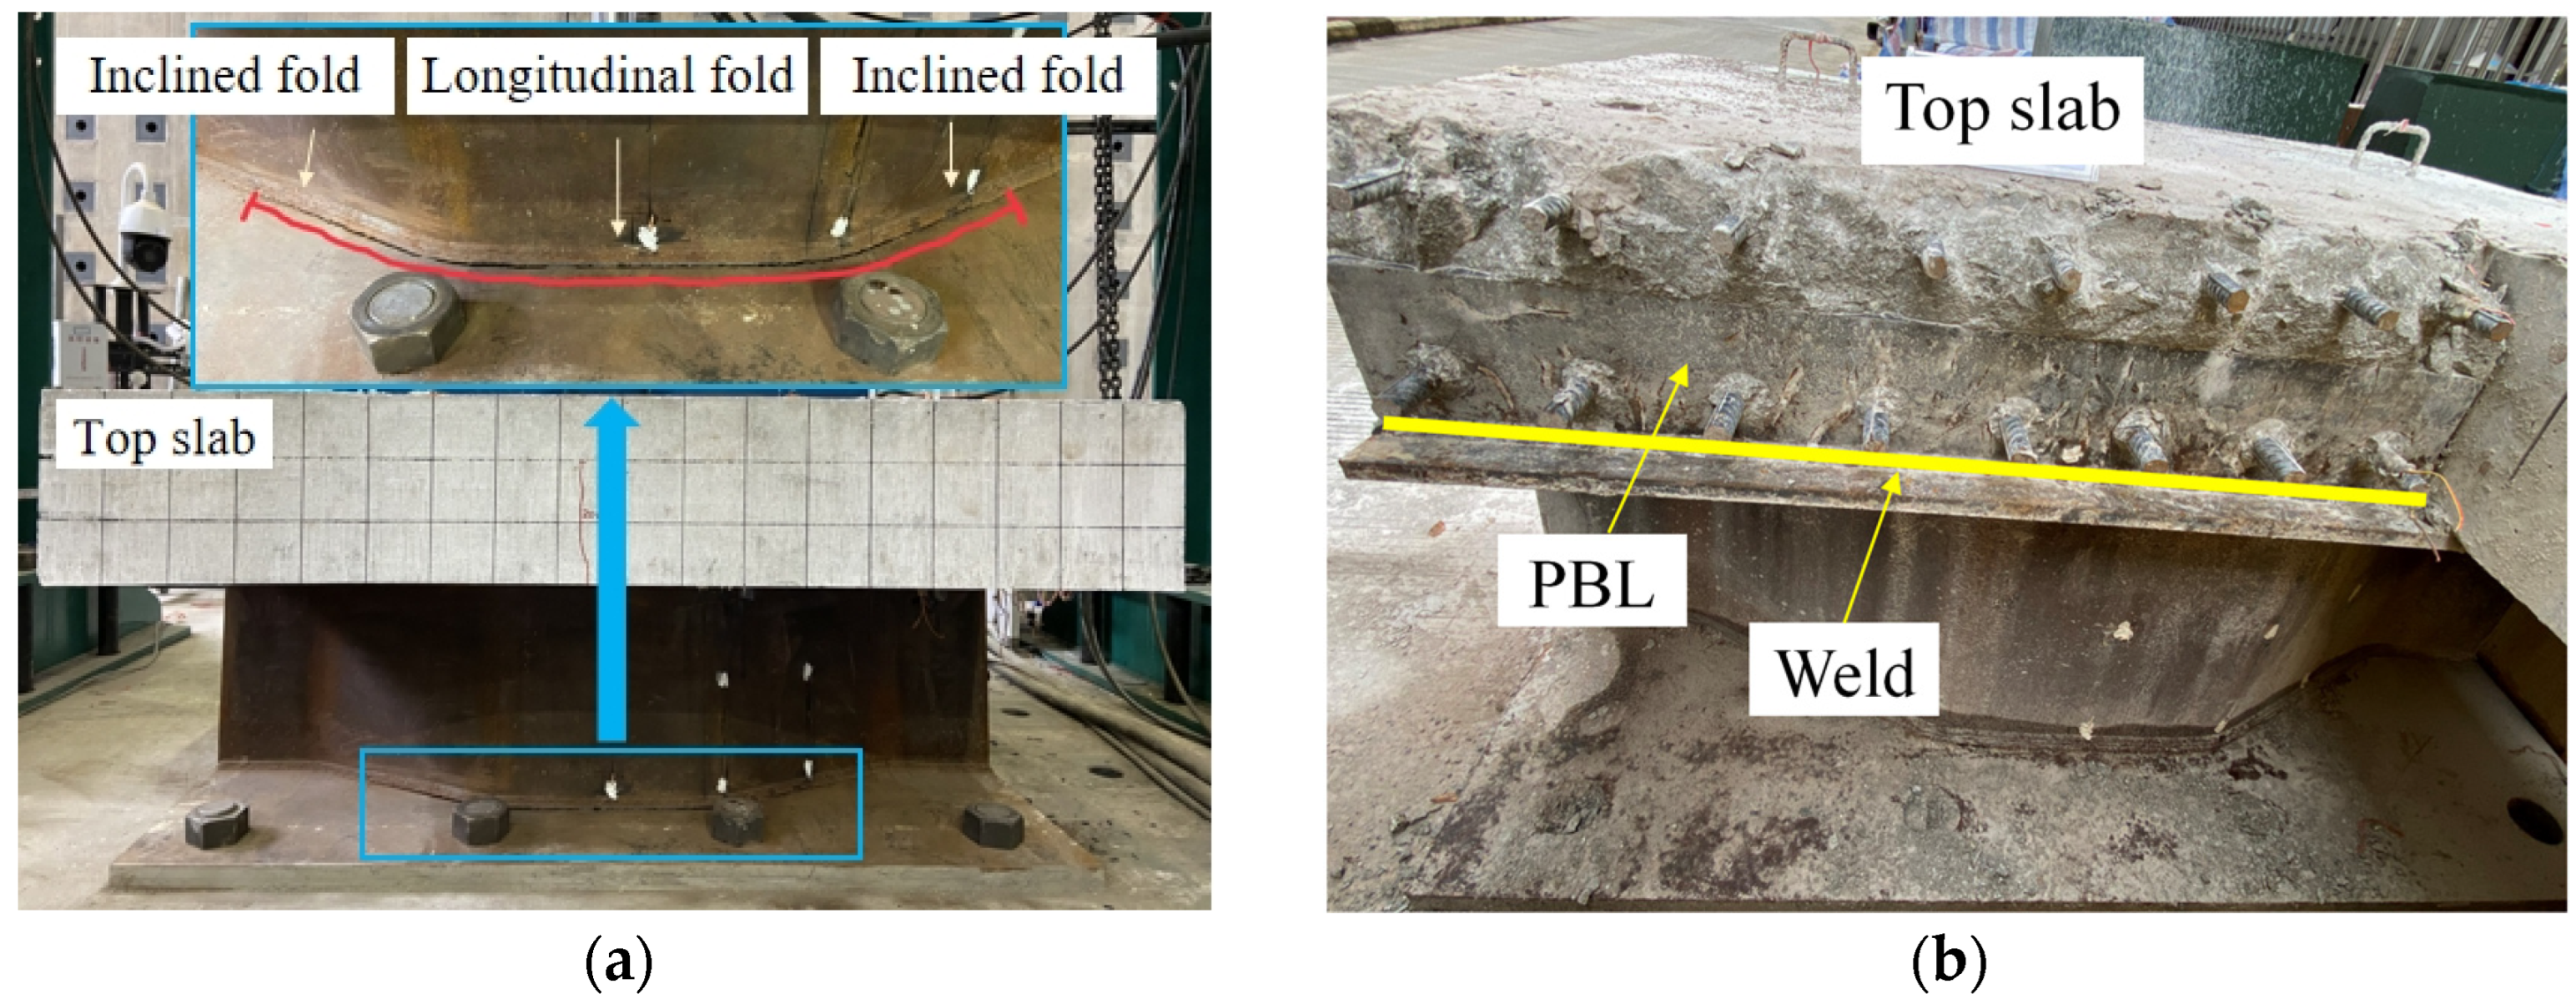
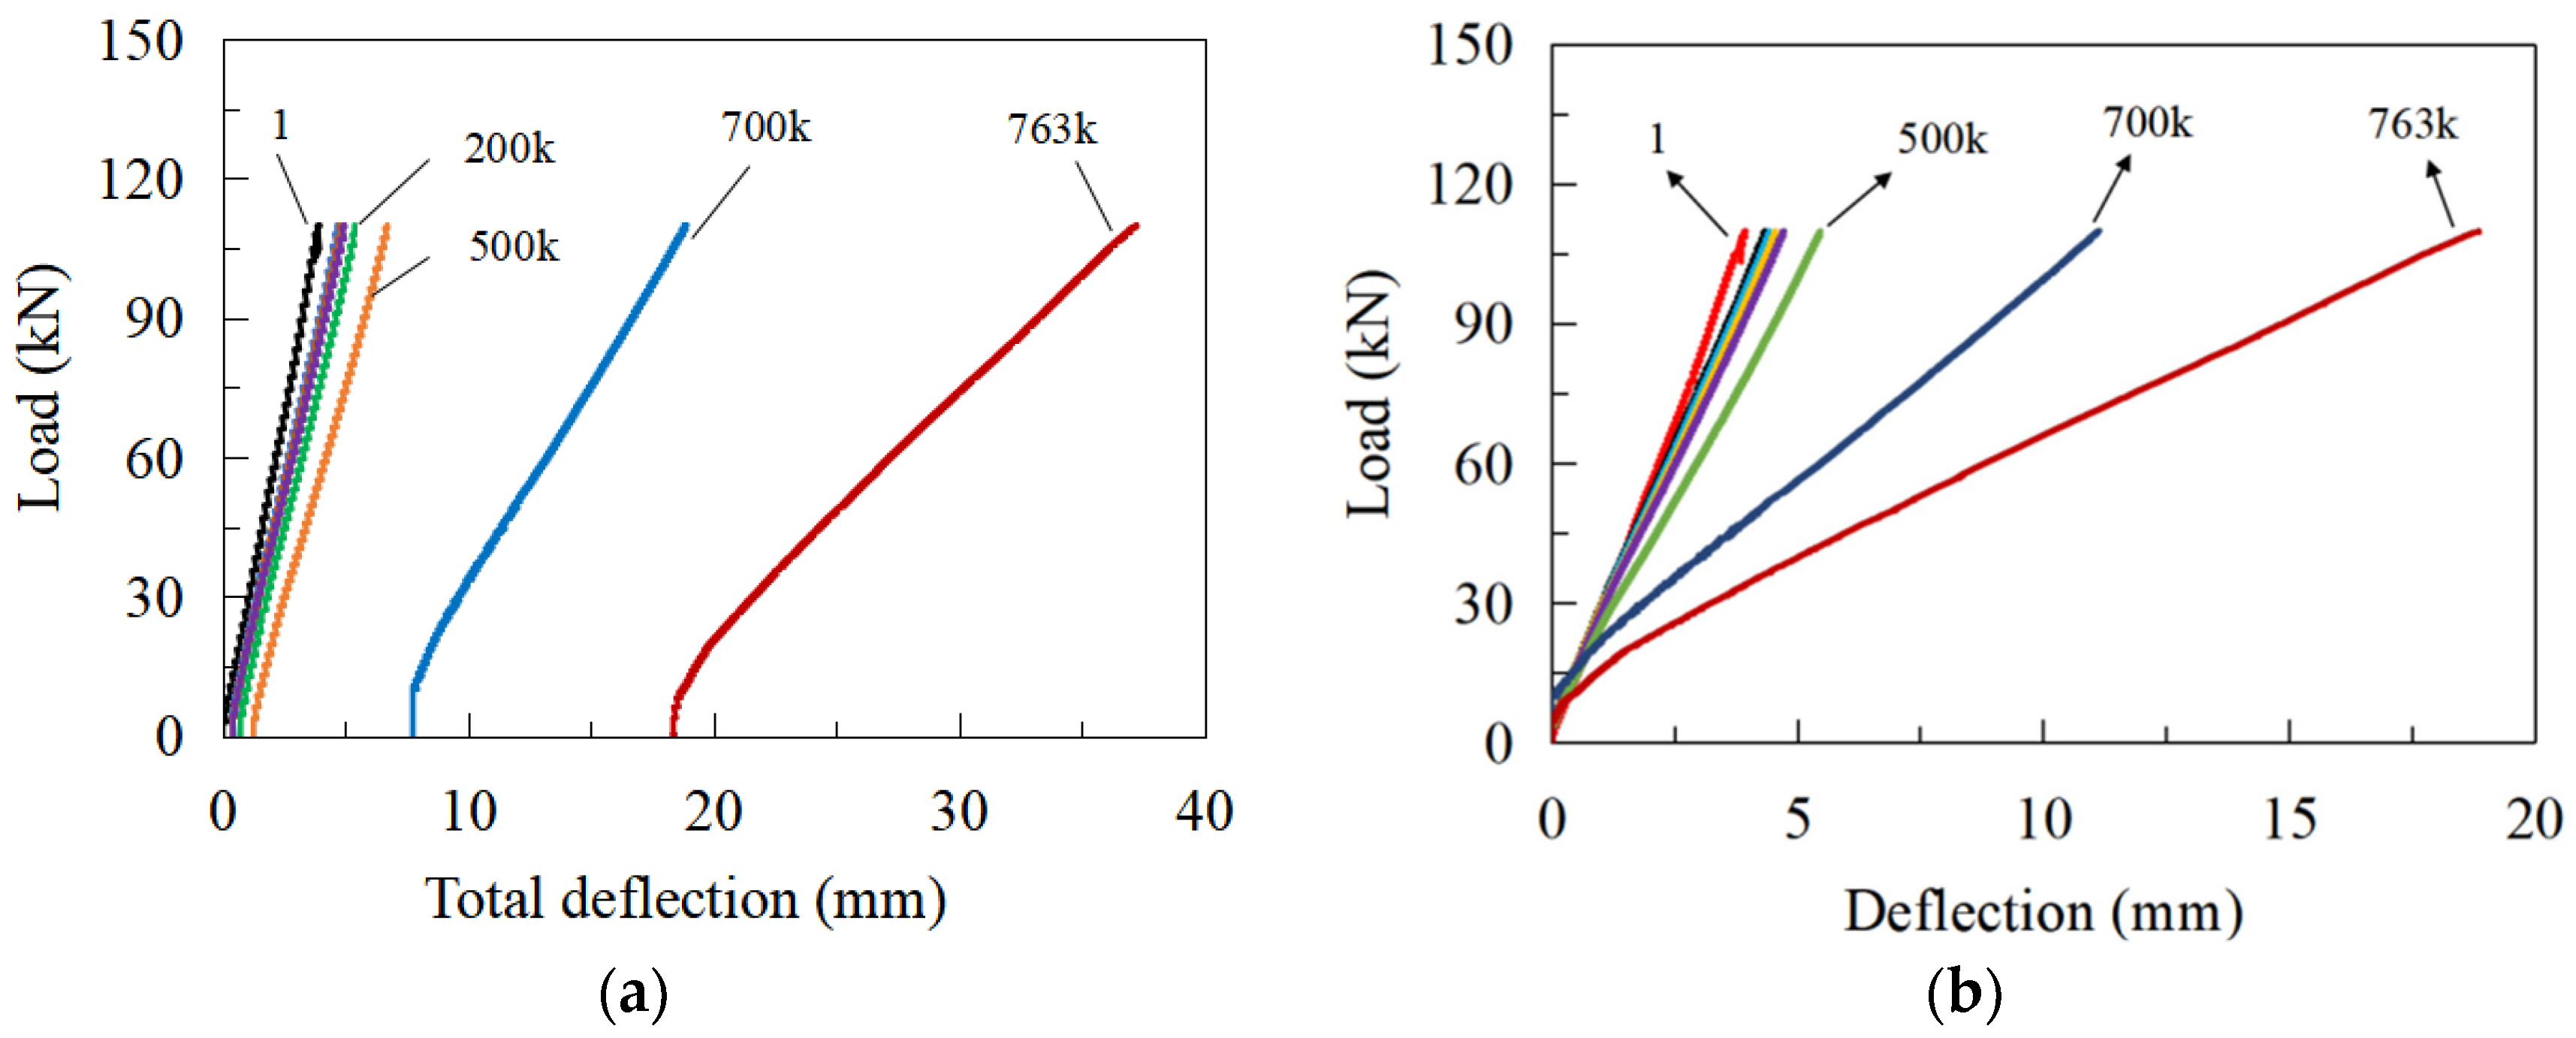
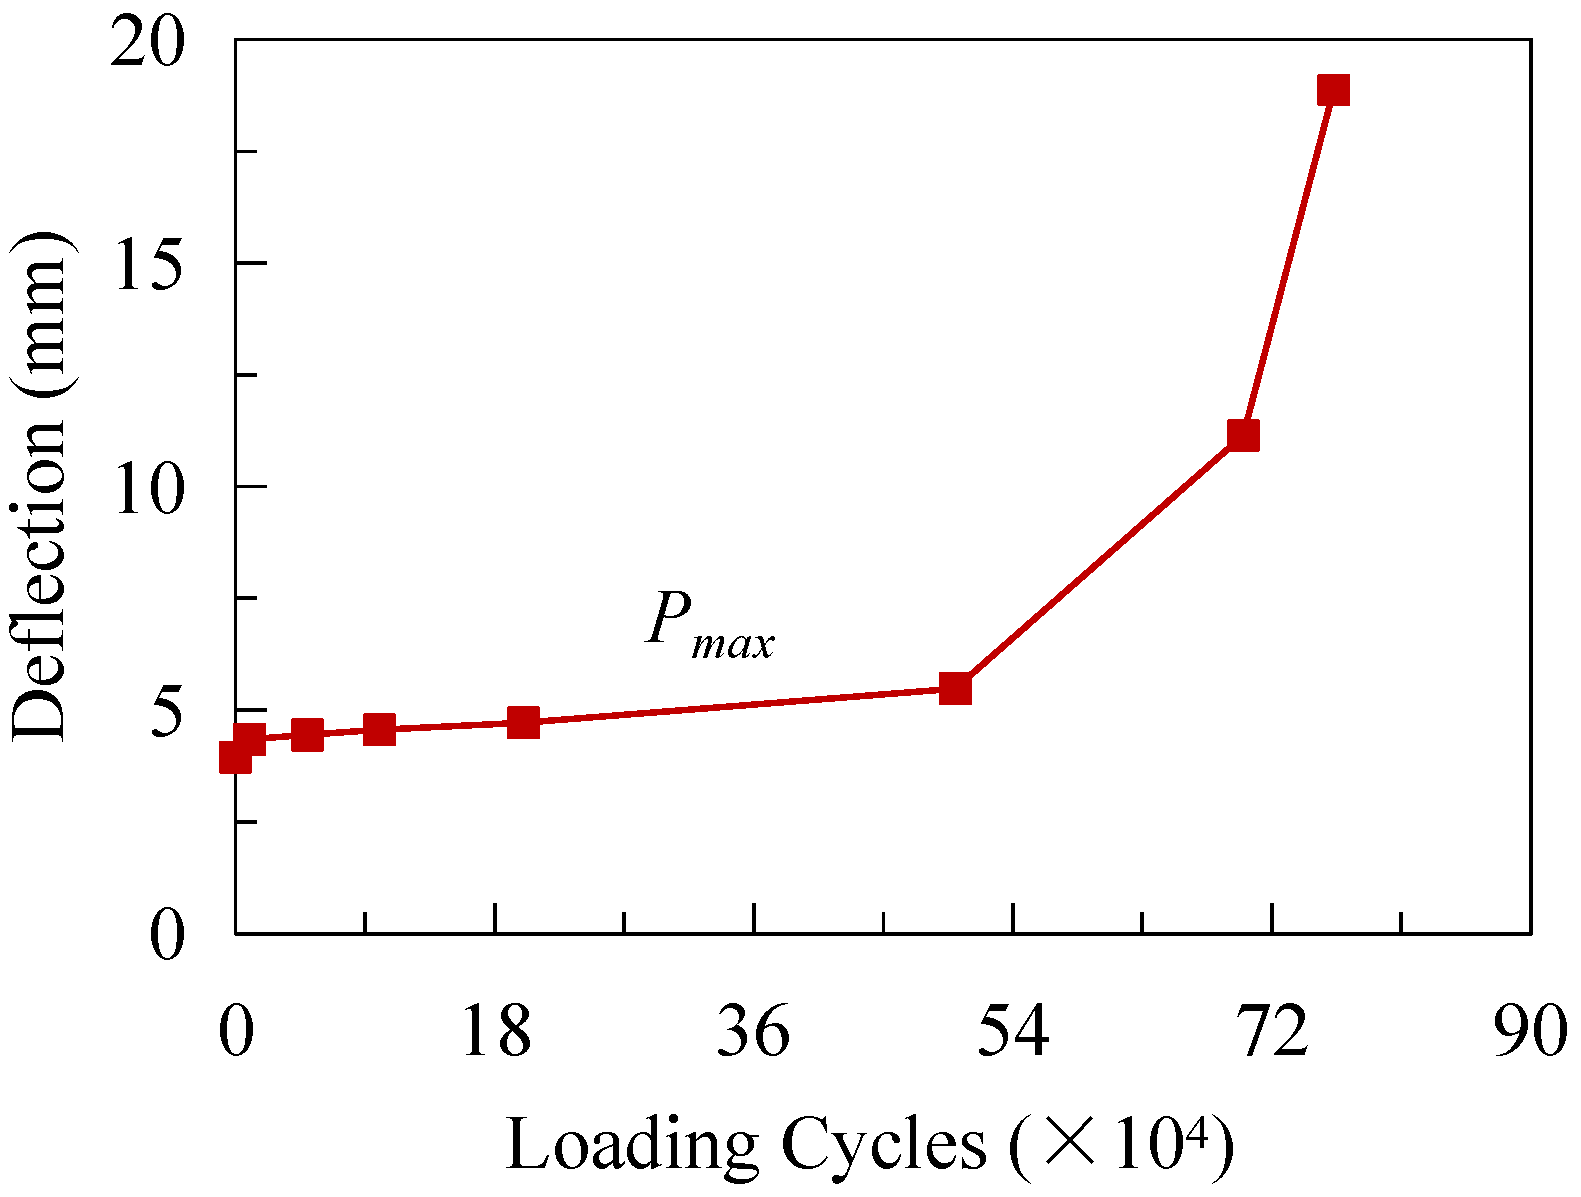
- The weld joining the bottom girder flange and the CSW initially cracked at the bend regions between the longitudinal and inclined folds of the CSW after 5 × 10⁵ loading cycles during the fatigue test. The crack gradually propagated from the longitudinal fold to the two adjacent inclined folds. Stress on the steel girder was redistributed with the accumulation of fatigue damage, and the vertical deflection of the top slab gradually increased due to the degradation of the flexural stiffness, which could be used as an indicator to assess the accumulation of fatigue damage.
- (2)
- The constructional details 1–3 comprised in the tested joint all suffered 7.63 × 10⁵ cyclic loading and no fatigue damage was observed, while initial fatigue failure was found for detail 4 after 5 × 10⁵ loading cycles. It demonstrates that the actual fatigue lives of the four details are longer than the calculated lives in the prediction methods provided by EC3 and AASHTO. As only one joint specimen was tested, the fatigue performance of details involved in the joints needs to be validated by more experimental results.
- (3)
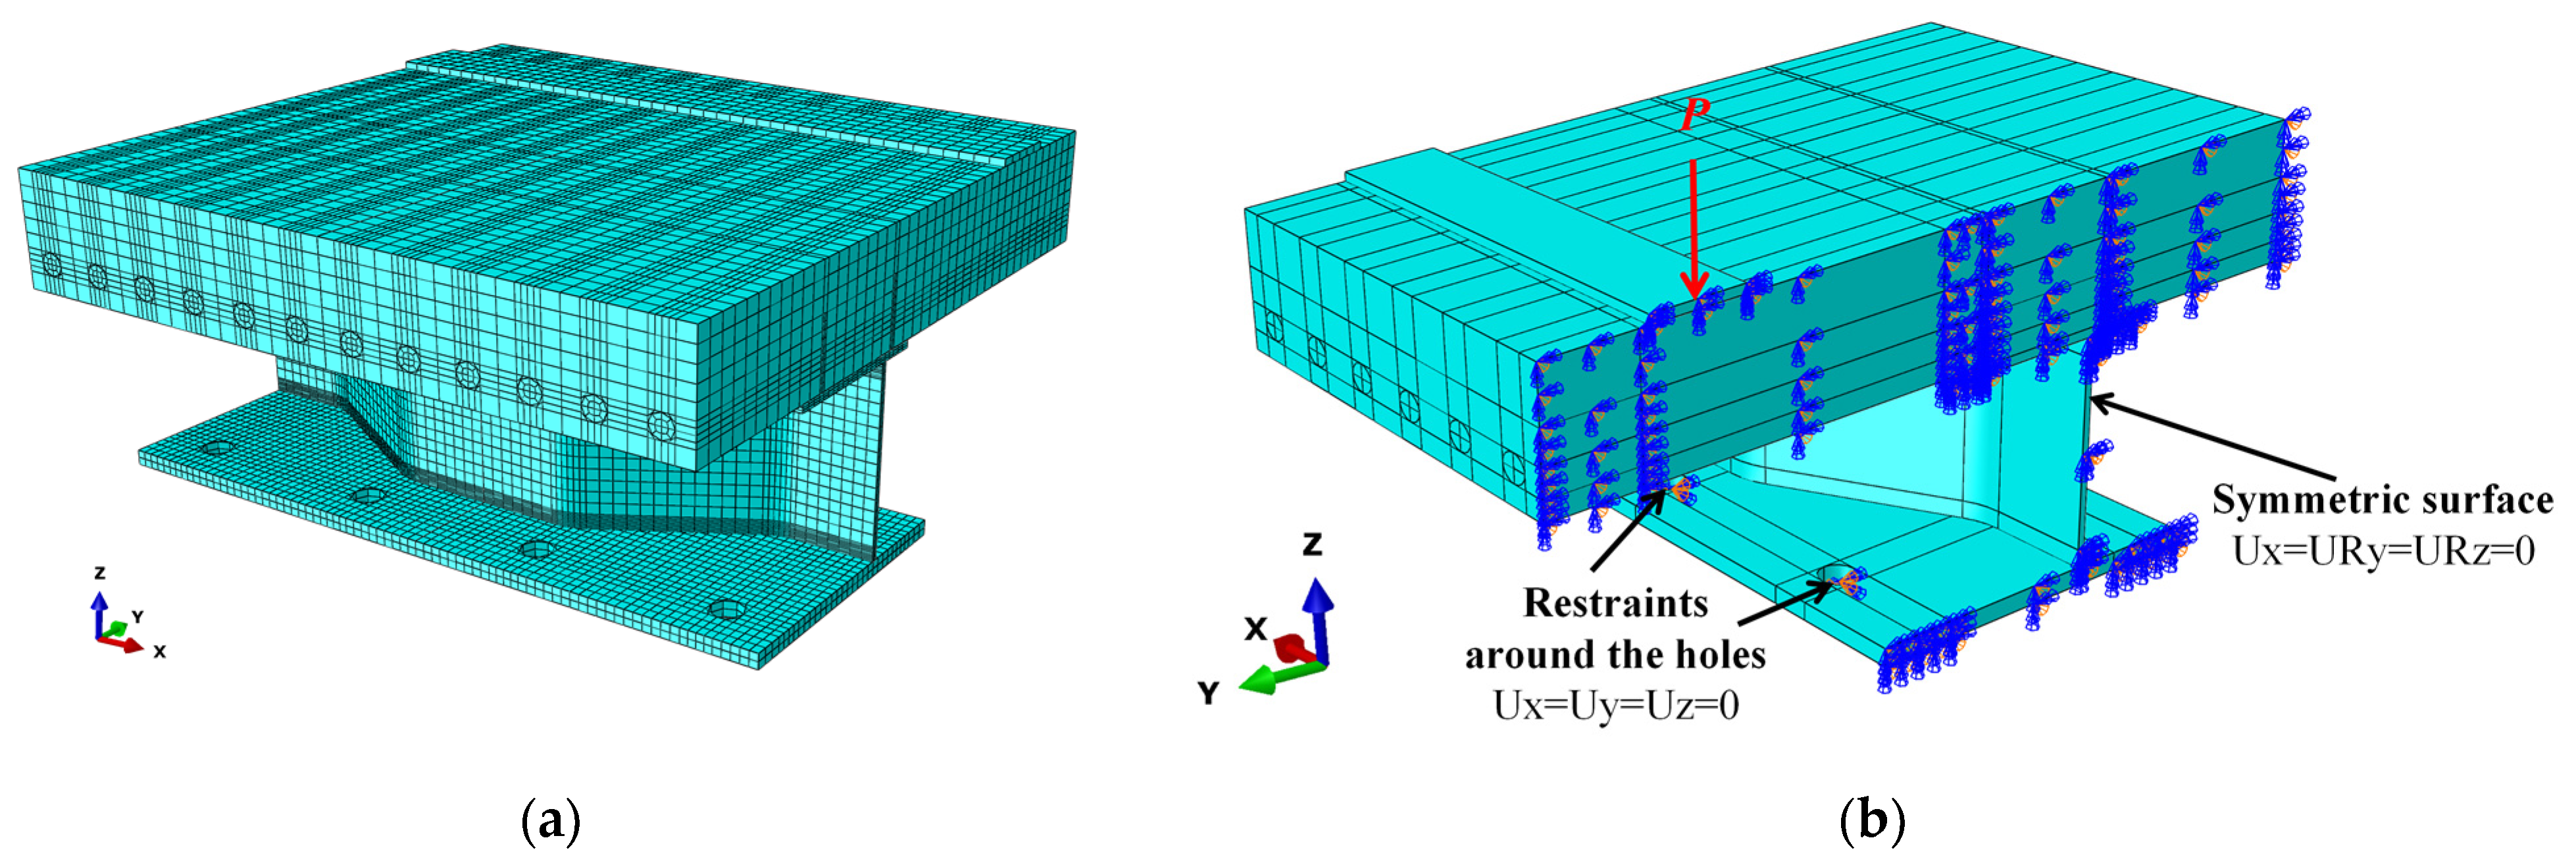
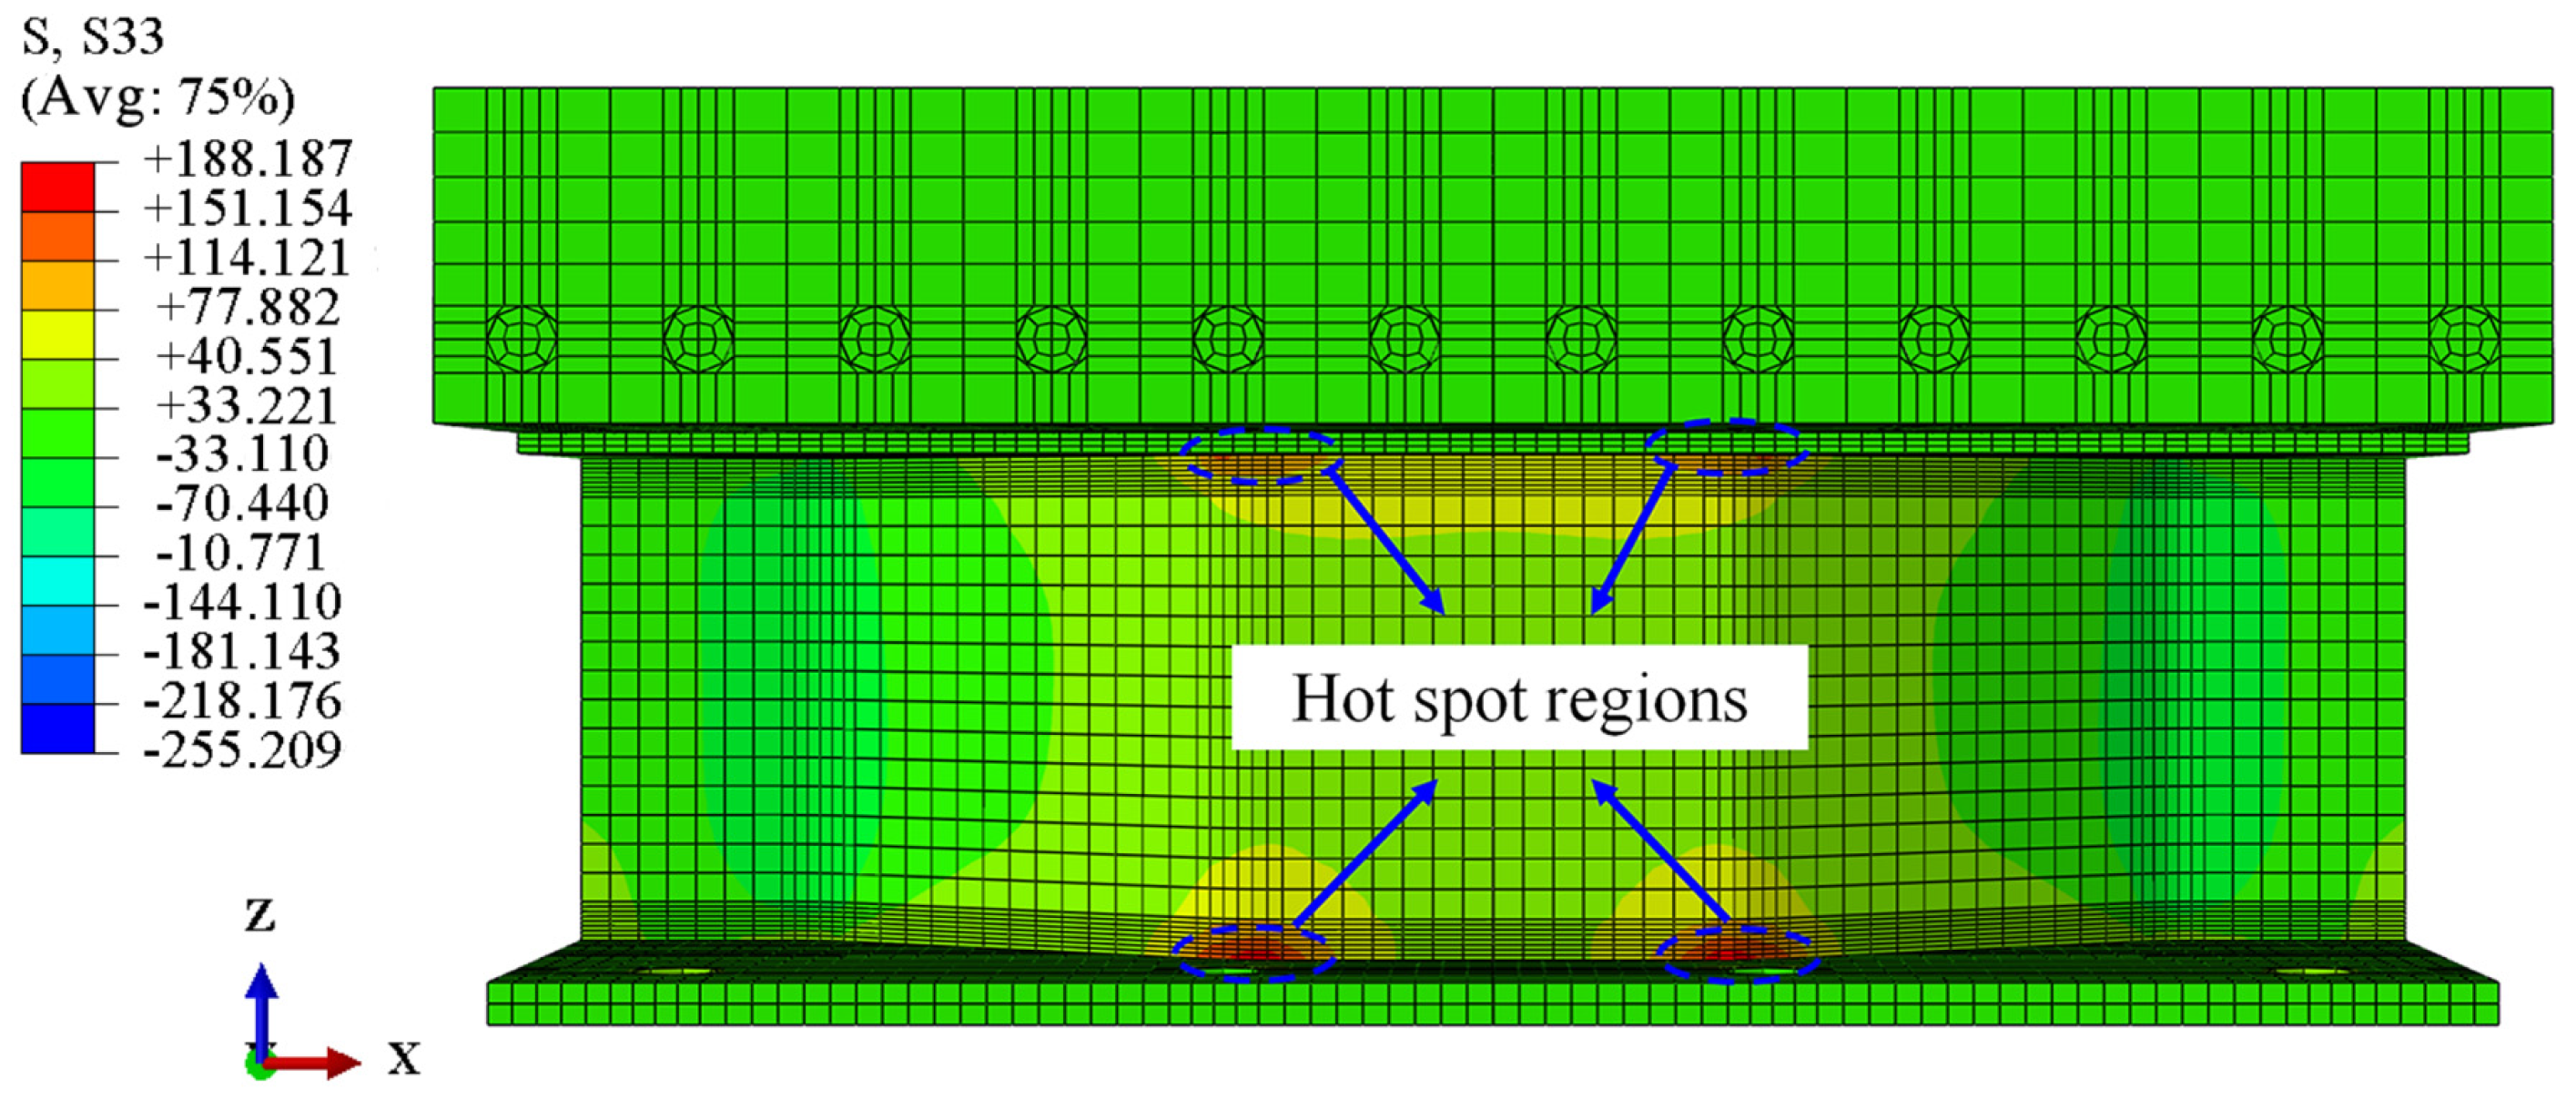
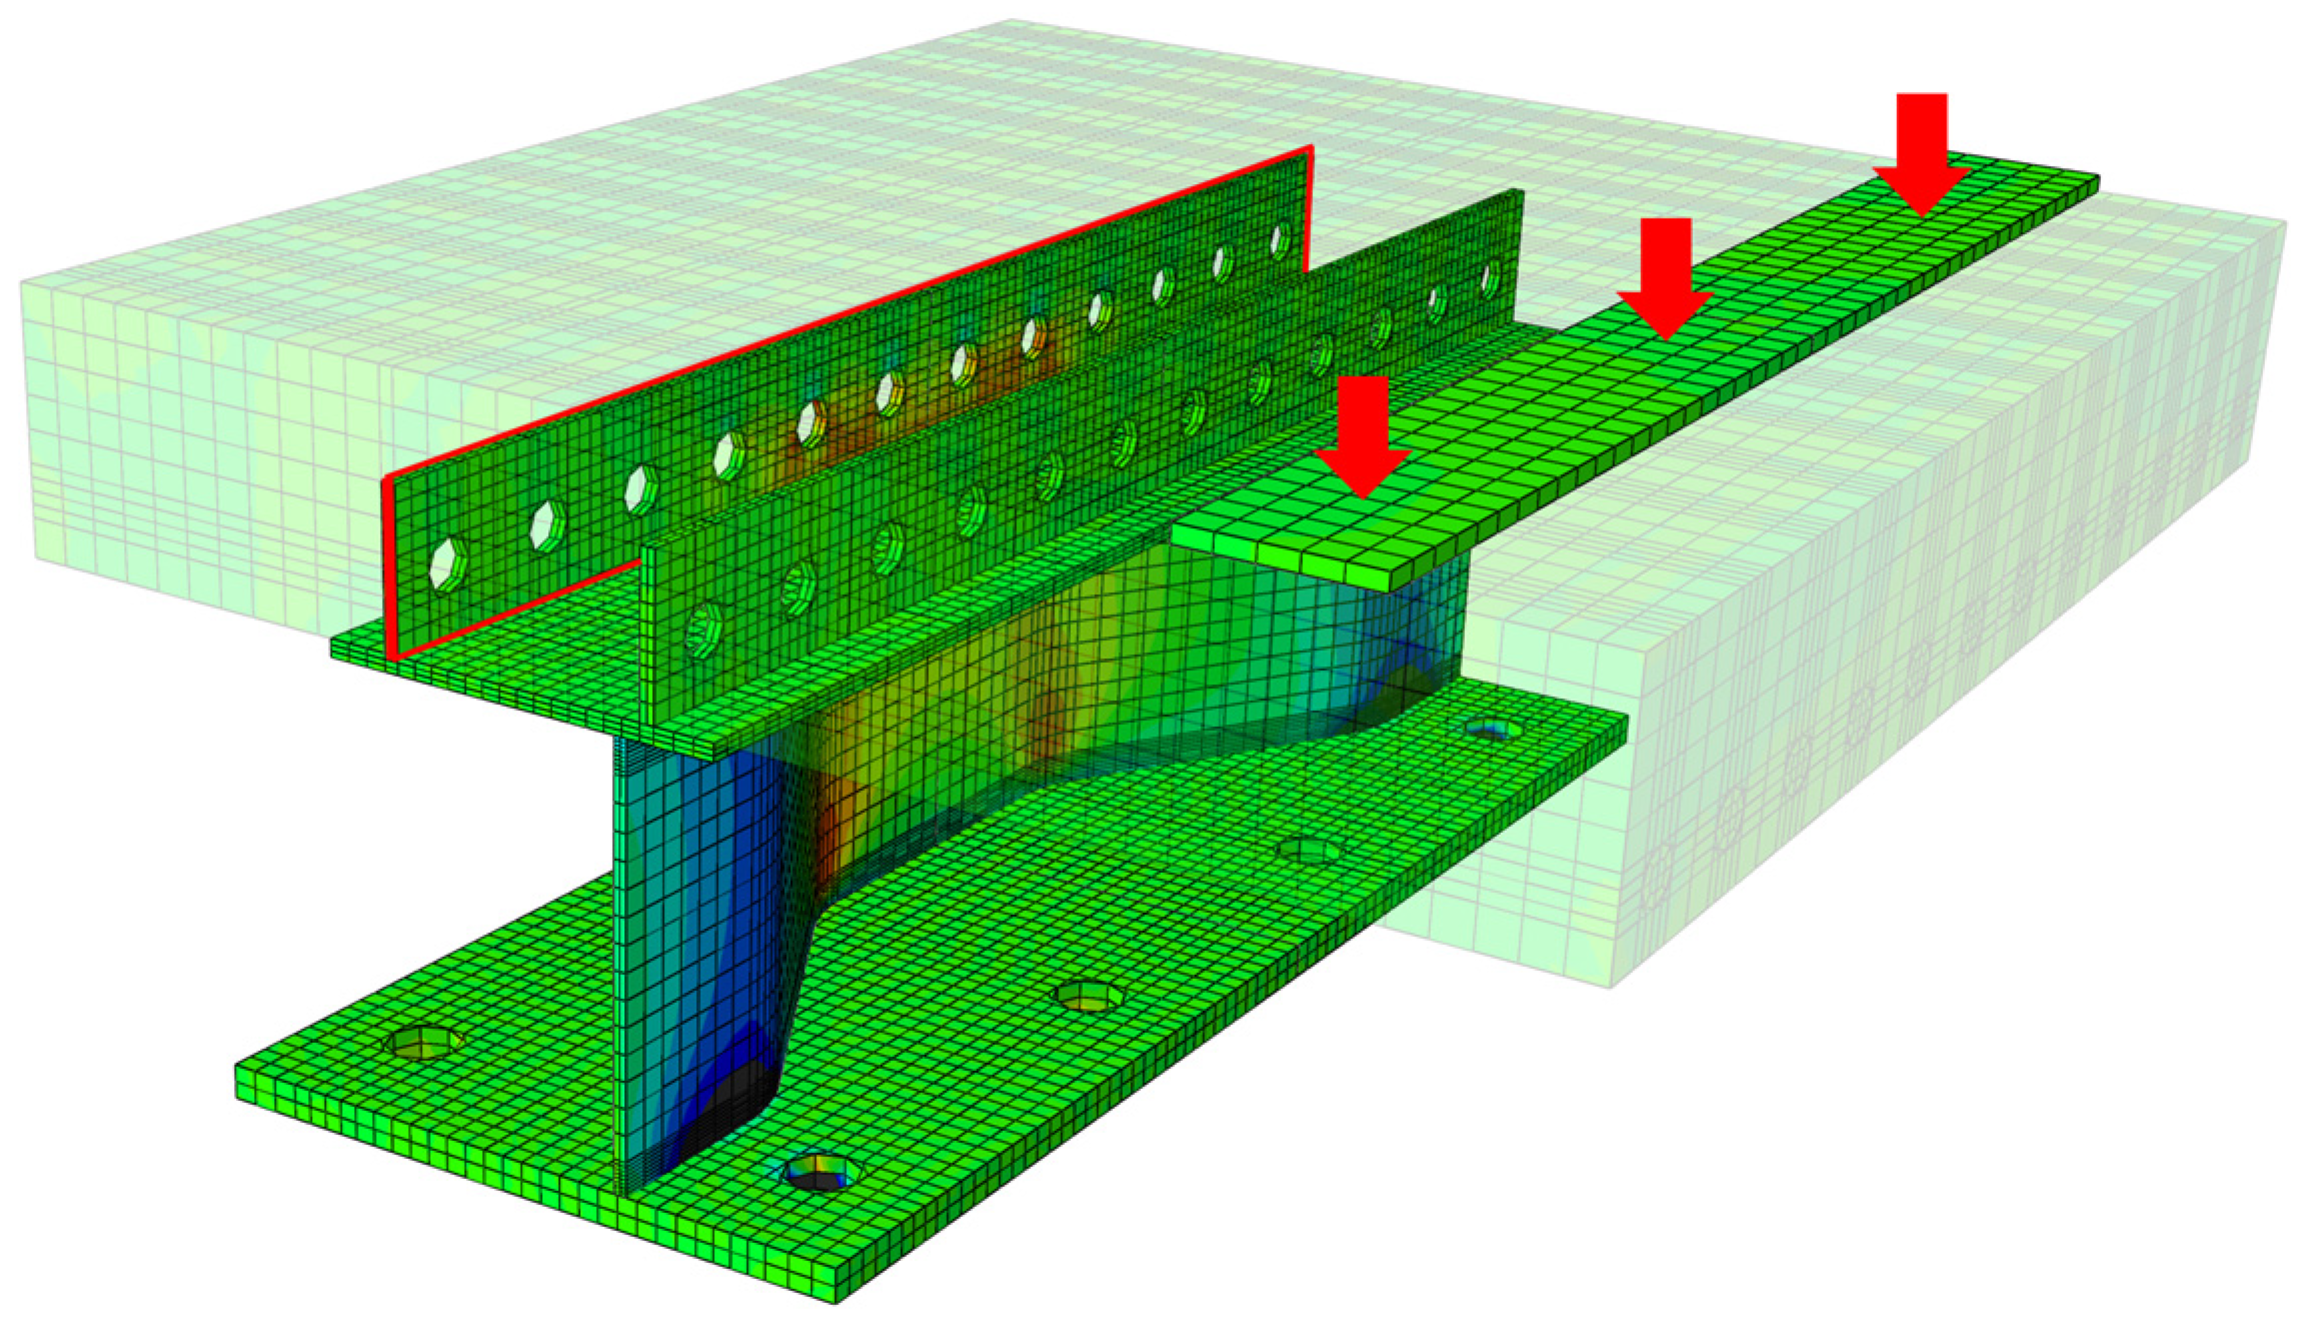
- FE models were built referring to the tested specimen. The PBL located in the tensile regions mainly suffered uplift forces according to the numerical analysis, and stress concentration is most pronounced on the PBL just above the longitudinal fold of the web. The maximum stresses of the CSWs are concentratedly distributed within the longitudinal fold near the top and bottom girder flanges. As fatigue failure is most likely to first occur in the hot spot regions, more attention should be paid to the stress status in these regions in fatigue design.
- (4)
- Numerical analysis results show that increasing the web thickness is beneficial to reducing the stress ranges in the hot spot regions. Meanwhile, the stress range in the hot spot regions and the maximum stress of the PBL decrease with the increasing bend radii of CSWs. Greater web corrugations will improve the fatigue resistance and reduce the maximum stress of the PBL, while this advantageous effect becomes limited when the web corrugation is greater than 1600 mm.
Author Contributions
Funding
Institutional Review Board Statement
Informed Consent Statement
Data Availability Statement
Acknowledgments
Conflicts of Interest
References
- Farzampour, A.; Laman, J.A.; Mofid, M. Behavior prediction of corrugated steel plate shear walls with openings. J. Constr. Steel Res. 2015, 114, 258–268. [Google Scholar] [CrossRef]
- Farzampour, A.; Mansouri, I.; Lee, C.H.; Sim, H.B.; Hu, J.W. Analysis and design recommendations for corrugated steel plate shear walls with a reduced beam section. Thin. Wall. Sruct. 2018, 132, 658–666. [Google Scholar] [CrossRef]
- Zhang, Z.; Zou, P.; Deng, E.F.; Ye, Z.; Tang, Y.; Li, F.R. Experimental study on prefabricated composite box girder bridge with corrugated steel webs. J. Constr. Steel Res. 2022, 201, 107753. [Google Scholar] [CrossRef]
- Chen, Y.Y.; Dong, J.C.; Xu, T.H. Composite box girder with corrugated steel webs and trusses—A new type of bridge structure. Eng. Struct. 2018, 16, 354–362. [Google Scholar] [CrossRef]
- Elkais, A.A.; Hassanein, M.F.; El-Boghdadi, M.H. Numerical investigation on the nonlinear shear behaviour of high-strength steel tapered corrugated web bridge girders. Eng. Struct. 2017, 134, 358–375. [Google Scholar] [CrossRef]
- Elkais, A.A.; Hassanein, M.F.; El-Boghdadi, M.H. Lateral-torsional buckling strength and behaviour of high-strength steel corrugated web girders for bridge construction. Thin-Walled Struct. 2018, 122, 112–123. [Google Scholar] [CrossRef]
- He, J.; Wang, S.; Liu, Y.; Dai, L.; Lyu, Z.; Li, C.; Xin, H.; Tan, C. The development of composite bridges with corrugated steel webs in China. Proc. Inst. Civ. Eng.-Bridge Eng. 2021, 174, 28–44. [Google Scholar] [CrossRef]
- Li, G.Q.; Luo, X.F.; Sun, F.F. Experimental investigation on fatigue performance of welded H-beam with corrugated webs. J. Build. Struct. 2012, 33, 96–103. [Google Scholar]
- Wang, Z.; Wang, Q. Fatigue assessment of welds joining corrugated steel webs to flange plates. Eng. Struct. 2014, 73, 1–12. [Google Scholar] [CrossRef]
- Peng, K. Experimental and Theoretical Study on the Fatigue Performance of Composite Girders with Corrugated Steel Webs. Ph.D. Thesis, HNU, Changsha, China, 2018. (In Chinese). [Google Scholar]
- Ebrahimi Motlagh, H.R.; Rahai, A. Prediction of long-Term prestress loss in prestressed concrete beam with corrugated steel web. Int. J. Civ. Eng. 2022, 20, 1309–1325. [Google Scholar] [CrossRef]
- Ibrahim, S.A.; El-Dakhakhni, W.W.; Elgaaly, M. Fatigue of corrugated-web plate girders: Experimental study. J. Struct. Eng. 2006, 132, 1371–1380. [Google Scholar] [CrossRef]
- Sause, R.; Abbas, H.H.; Driver, R.G.; Anami, K.; Fisher, J.W. Fatigue life of girders with trapezoidal corrugated webs. J. Struct. Eng. 2006, 132, 1070–1078. [Google Scholar] [CrossRef]
- Xu, J.; Sun, H.; Cai, S.; Sun, W.; Zhang, B. Fatigue testing and analysis of I-girders with trapezoidal corrugated webs. Eng. Struct. 2019, 196, 109344. [Google Scholar] [CrossRef]
- Tu, B.; Cai, S.Y.; Li, J.; Liu, H. Fatigue assessment of a full-scale composite box-girder with corrugated-steel-webs and concrete-filled-tubular flange. J. Constr. Steel Res. 2021, 183, 106768. [Google Scholar] [CrossRef]
- Wang, Z.Y.; Zhou, X.; Liu, Z. Panting fatigue of trapezoidal corrugated steel webs with mixed-mode cracks. Int. J. Steel Struct. 2021, 21, 576–589. [Google Scholar] [CrossRef]
- Wang, Z.Y.; Zhou, X.F.; Liu, Z.F.; Wang, Q.Y. Fatigue behaviour of composite girders with concrete-filled tubular flanges and corrugated webs-experimental study. Eng. Struct. 2021, 241, 112416. [Google Scholar] [CrossRef]
- Wang, Z.; Tan, L.; Wang, Q. Fatigue strength evaluation of welded structural details in corrugated steel web girders. J. Int. J. Steel Struct. 2013, 13, 707–721. [Google Scholar] [CrossRef]
- Zhao, Y.; Liu, H.; Cai, S.; Sun, H. Mixed-mode fatigue crack growth analysis of I-shaped steel girders with trapezoidal corrugated-webs. J. Int. J. Steel Struct. 2022, 190, 107153. [Google Scholar] [CrossRef]
- EN 1993-1-9-2005; Eurocode3: Design of Steel Structures Part 1.9: Fatigue. European Committee for Standardization (CEN): Brussels, Belgium, 2005.
- AASHTO LRFD SI 2017; AASHTO LRFD Bridge Design Specifications. American Association of State Highway and Transportation Officials (AASHTO): Washington, DC, USA, 2017.
- Yang, T.; Chen, X.B.; Zhang, Y.; Li, X.; Han, Z.Q. Numerical analysis on collapse performance of post-tensioned concrete frames with post-tensioning BFRP bars under an interior-column-removal scenario. Structures 2022, 41, 1288–1300. [Google Scholar] [CrossRef]
- Yang, T.; Xie, R.T. Flexural behaviors of prefabricated composite beams with segmented precast concrete slabs. J. Constr. Steel Res. 2023, 201, 107692. [Google Scholar] [CrossRef]


| Design Codes | Detail ID | Detail Category | Δσ1 (MPa) | Nc (×104) | Na (×104) |
|---|---|---|---|---|---|
| EC3 | 1 | 125 | 27 | ∞ | 76.3 |
| 2 | 80 | 127 | 49.9 | 76.3 | |
| 3 | 80 | 154 | 28.0 | 76.3 | |
| 4 | 71 | 197 | 9.3 | 50.0 * | |
| AASHTO | 1 | B | 27 | ∞ | 76.3 |
| 2 | C | 127 | 70.6 | 76.3 | |
| 3 | C | 154 | 39.6 | 76.3 | |
| 4 | C | 197 | 18.9 | 50.0 * |
| ID | Bending Radius of the CSW (mm) | Web Thickness (mm) | Corrugations of the Web (mm) |
|---|---|---|---|
| S1 | 150 | 14 | 1800 |
| S2 | 100 | 14 | 1800 |
| S3 | 200 | 14 | 1800 |
| S4 | 150 | 10 | 1800 |
| S5 | 150 | 18 | 1800 |
| S6 | 150 | 14 | 1200 |
| S7 | 150 | 14 | 1600 |
| Codes | Detail ID | Detail Category | ΔσL (MPa) | Δσ (MPa) | ||||||
|---|---|---|---|---|---|---|---|---|---|---|
| S1 | S2 | S3 | S4 | S5 | S6 | S7 | ||||
| EC3 | 1 | 125 | 51 | 30 | 31 | 32 | 45 | 23 | 49 | 38 |
| 2 | 80 | 32 | 122 | 125 | 114 | 144 | 105 | 138 | 122 | |
| 3 | 80 | 32 | 59 | 66 | 58 | 62 | 55 | 93 | 77 | |
| 4 | 71 | 29 | 179 | 196 | 165 | 214 | 152 | 197 | 186 | |
| AASHTO | 1 | B | 110 | 30 | 31 | 32 | 45 | 23 | 49 | 38 |
| 2 | C | 69 | 122 | 125 | 114 | 144 | 105 | 138 | 122 | |
| 3 | C | 69 | 59 | 66 | 58 | 62 | 55 | 93 | 77 | |
| 4 | C | 69 | 179 | 196 | 165 | 214 | 152 | 197 | 186 | |
Disclaimer/Publisher’s Note: The statements, opinions and data contained in all publications are solely those of the individual author(s) and contributor(s) and not of MDPI and/or the editor(s). MDPI and/or the editor(s) disclaim responsibility for any injury to people or property resulting from any ideas, methods, instructions or products referred to in the content. |
© 2023 by the authors. Licensee MDPI, Basel, Switzerland. This article is an open access article distributed under the terms and conditions of the Creative Commons Attribution (CC BY) license (https://creativecommons.org/licenses/by/4.0/).
Share and Cite
Zhang, Y.; Yang, T.; Luo, T.; Chen, M.; Chen, X. Fatigue Behaviors of Joints between Steel Girders with Corrugated Webs and Top RC Slabs under Transverse Bending Moments. Materials 2023, 16, 2427. https://doi.org/10.3390/ma16062427
Zhang Y, Yang T, Luo T, Chen M, Chen X. Fatigue Behaviors of Joints between Steel Girders with Corrugated Webs and Top RC Slabs under Transverse Bending Moments. Materials. 2023; 16(6):2427. https://doi.org/10.3390/ma16062427
Chicago/Turabian StyleZhang, Yun, Tao Yang, Tingyi Luo, Mingyu Chen, and Xiaobin Chen. 2023. "Fatigue Behaviors of Joints between Steel Girders with Corrugated Webs and Top RC Slabs under Transverse Bending Moments" Materials 16, no. 6: 2427. https://doi.org/10.3390/ma16062427
APA StyleZhang, Y., Yang, T., Luo, T., Chen, M., & Chen, X. (2023). Fatigue Behaviors of Joints between Steel Girders with Corrugated Webs and Top RC Slabs under Transverse Bending Moments. Materials, 16(6), 2427. https://doi.org/10.3390/ma16062427