Article

Dispersion and Polishing Mechanism of a Novel CeO2-LaOF-Based Chemical Mechanical Polishing Slurry for Quartz Glass

1
Key Laboratory for Precision and Non-Traditional Machining Technology of Ministry of Education, Dalian University of Technology, Dalian 116024, China
2
School of Mechanical Engineering, Hangzhou Dianzi University, Hangzhou 310018, China
3
School of Mechanical Engineering, Shandong University of Technology, Zibo 255000, China
*
Authors to whom correspondence should be addressed.
Materials 2023, 16(3), 1148; https://doi.org/10.3390/ma16031148
Submission received: 13 December 2022 / Revised: 13 January 2023 / Accepted: 19 January 2023 / Published: 29 January 2023

Abstract

:
Quartz glass shows superior physicochemical properties and is used in modern high technology. Due to its hard and brittle characteristics, traditional polishing slurry mostly uses strong acid, strong alkali, and potent corrosive additives, which cause environmental pollution. Furthermore, the degree of damage reduces service performance of the parts due to the excessive corrosion. Therefore, a novel quartz glass green and efficient non-damaging chemical mechanical polishing slurry was developed, consisting of cerium oxide (CeO2), Lanthanum oxyfluoride (LaOF), potassium pyrophosphate (K4P2O7), sodium N-lauroyl sarcosinate (SNLS), and sodium polyacrylate (PAAS). Among them, LaOF abrasive showed hexahedral morphology, which increased the cutting sites and uniformed the load. The polishing slurry was maintained by two anionic dispersants, namely SNLS and PAAS, to maintain the suspension stability of the slurry, which makes the abrasive in the slurry have a more uniform particle size and a smoother sample surface after polishing. After the orthogonal test, a surface roughness (Sa) of 0.23 nm was obtained in the range of 50 × 50 μm2, which was lower than the current industry rating of 0.9 nm, and obtained a material removal rate (MRR) of 530.52 nm/min.

1. Introduction

Quartz glass is an amorphous form of silicon dioxide (SiO2) [1]. Because of its excellent physical and chemical properties, SiO2 is widely used in military, aerospace, chemical, and optical lens applications [2]. However, due to the low fracture toughness [3], the machining process of quartz glass leads to defects such as chipping, cracking, scratching, and sub-surfacing [4]. To meet the high surface-quality requirement of optical components, processing techniques such as magneto-rheological polishing (MRF) [5,6], jet polishing (JP) [7], ion beam polishing (IBP) [8,9], and chemical mechanical polishing (CMP) [10,11,12] are preferred. CMP can effectively reduce surface roughness (Sa) while eliminating sub-surface damage and has become preferable in the wafer processing industry due to its relatively low cost and simple operation.
During the CMP process [13,14], a softened layer is formed by the chemicals in the polishing slurry on the sample surface. The chemicals are then mechanically removed by soft abrasives to obtain a scratch-free and ultra-smooth surface. The chemical etching process is primarily achieved by using chemicals with strong corrosion and toxicity, such as potassium hydroxide (KOH) [15,16], phenol [17], ammonium hydrogen fluoride [18], and sodium dodecylbenzene sulfonate (SDBS) [19]. For example, a SiO2-based CMP slurry was developed, using Polyvinylpyrrolidone (PVP) as the dispersant, citric acid as the complexing agent, guanidine carbonate as the co-solvent, and KOH [16] to adjust the pH to 11. The polishing tests of quartz glass yielded a material removal rate (MRR) of 169.50 nm/min and a Sa of 0.73 nm. Quartz glass polishing was performed by controlling the degree of aggregation of colloidal cerium dioxide (CeO2) using KOH [15]. A Sa of 0.20 nm was obtained. Polishing tests of the SiO2 wafer were conducted using an acidic SiO2 polishing slurry with a phenol [17] addition. A Sa of 0.19 nm was obtained, along with a MRR of 181.70 nm/min. Quartz glass wafers were also polished with slurry that used ammonium bicarbonate fluoride and hydrogen fluoride (HF) to adjust the pH. The Sa was reduced to ~100 nm, and the visible light transmission reached up to 89% [18]. Though an excellent surface quality was obtained after polishing in the above study, a greener and more environment friendly chemical mechanical polishing slurry, which has comparable polishing performance, is needed for industrial application.
Except for the conventional study of the chemical composition, slurry dispersion has also been a key factor in CMP. A dispersion system configured with the compound of SDBS and PVP exhibited excellent dispersion performance, and the slurry did not settle for 72 h. However, the Sa of quartz glass after polishing using such polishing slurry was ~10 nm. Moreover, it is still unknown how the dispersion performance of the slurry influences the polish performance.
In this study, a novel cerium oxide (CeO2)-Lanthanum oxyfluoride (LaOF)-based composite abrasive polishing slurry was developed based on quartz glass polishing. The polishing slurry consisted of CeO2, Lanthanum oxyfluoride (LaOF), potassium pyrophosphate (K4P2O7), sodium N-lauroyl sarcosinate (SNLS), and sodium polyacrylate (PAAS). SNLS and PAAS formed the dispersion system. Through orthogonal experiments, the best polishing parameters and polishing slurry composition ratios were obtained. The Sa of 0.23 nm was obtained in the 50 × 50 μm2, which was much lower than the Sa of 0.9 nm Sa from the commercial slurry. The MRR was as high as 530.52 nm/min, 77.34% higher than the traditional pure CeO2-based polishing slurry, while the Sa was reduced by 31.04%. The slurry dispersion under different dispersant concentrations was studied using a laser particle sizer, UV absorber, and viscometer. Finally, the CMP mechanism of the presented polishing slurry was analyzed based on X-ray photoelectron spectroscopy (XPS) and Fourier infrared spectroscopy (FTIR).

2. Materials and Methods

2.1. Experimental Materials

The 99.99% pure quartz glass sample pieces (diameter 10 mm, thickness 3 mm) were purchased from Guanghe Quartz Products Co., Ltd., Lianyungang, China. SNLS, PAAS, and K4P2O7 were purchased from Maclean’s Chemical Reagents, with an analytical purity of 98%. CeO2 and LaOF were purchased from Inner Mongolia Guangheyuan Nanotechnology Co, Ordos, China.

2.2. Configuration of Polishing Slurry

The polishing slurry was configured by 0.5 wt% of rare earth abrasives CeO2 and LaOF, 0.5 wt% of dispersants SNLS and PAAS, and the pH was adjusted by K4P2O7 to 9.5. The polishing slurry was configured with OS20-S mechanical stirrer, which came from Beijing Dalong Xingchuang Experimental Instruments JSC, Beijing, China; the OPBM-2 ball mill was used to disperse the polishing slurry, which came from Shenzhen Jitong Technology Development Ltd., Shenzhen, China with zirconium balls as the grinding media. Ultrasonic assisted dispersion with YS0615 ultrasonic cleaner for 30 minutes before polishing, equipment from Shenzhen Yunyi Technology Ltd., Shenzhen, China. An HSC-19T magnetic stirrer was used for continuous stirring during the polishing process, with equipment from Qunan Experimental Instruments (JOANLAB) Ltd., Huzhou, China. After polishing, the polished samples were rinsed with deionized (DI) water and dried by compressed air.

2.3. CMP Tests

Quartz glass sample pieces were ground using a #1500 diamond abrasive disc and DI water as a grinding solution. This process removed the surface damage caused by the previous machining process on the quartz glass surface and saved time for subsequent CMP processing. The Sa of the quartz glass sample was 22.25 nm after grinding, and the measured area was 100 × 100 μm2. Grinding and polishing are performed using UNIPOL-1200S precision polishing machine from Shenyang Kejing Automation Equipment Ltd., Shenyang, China. The grinding and polishing slurry is supplied using SKZD-4 drip irrigation machine, equipment from Shenyang Kejing Automation Equipment Ltd., Shenyang, China. Polishing tests were performed using a polyurethane polishing pad with a polishing pressure of 40 kPa, a polishing speed of 140 rpm, a polishing slurry flow rate of 2 mL/min, and a polishing time of 20 min.
To obtain the optimal combination of polishing slurry and the polishing process parameters, six factors were tested orthogonally in this test, namely: abrasive concentration, polishing slurry pH, dispersant concentration, pressure, speed, and flow rate of the slurry, as shown in Table 1. For the polishing slurry dispersant concentration, comparative experiments were conducted to study the influence on dispersibility.
The Sa and MRR were selected as the evaluation indices for polishing performance. The equation for calculating MRR can be expressed as:
MRR = Δ m ρ s τ   ×   10 7
where ∆m (g) is the mass difference before and after polishing; ρ is the quartz glass density of 2.2 (g/cm3); s (cm2) is the surface area of the sample piece to be polished; and τ (min) is the polishing time.

2.4. Characterization

The grinding morphology of the polished slurry was examined using a TESCAN MIRA scanning electron microscope at an accelerating voltage of 20 kV. The HITACHI HT7700 transmission electron microscope was used to detect the thickness of the damaged layer before and after polishing of the sample, with an ac-acceleration voltage of 100 kV. The Sa of the samples before and after polishing was measured using an Olympus MX40 optical microscope. A Zygo NewViewTM 9000 white light interferometer was used to measure the roughness of the sample surface before and after polishing. The difference in mass before and after polishing was weighed with an EX224ZH analytical balance to calculate the MRR.
The properties of the polishing slurry were analyzed in terms of particle size and zeta potential. The tests were performed with a Zetasizer Pro particle size analyzer, equipment from Spectris Instrument Systems, Shanghai, China. The non-immersion backscattering (NIBS) technology was used, which allowed for a wider range of sample concentration and particle size application. The viscosity of the polished slurry was tested with a NDJ-8S viscometer with rotor #1, equipment from Shanghai Lixin Bonsey Instrument Technology Co., Ltd., Shanghai, China. UV absorbance of the polished slurry was measured using a UV-2700i UV-Vis spectrophotometer, equipment from Shimadzu Instruments Ltd., Kyoto, Japan.
The valence change of elements in fused silica during polishing was determined using K-Alpha XPS. It was immersed in a 15 wt% K4P2O7 solution for 24 h and dried before the test. The monochromatic X-ray source was realized by using Al Kα radiation (hv = 1486.6 eV) with a spot diameter of 400 μm. The passage energies of the X-ray gun in the full spectrum were 12 kV, 6 mA, and 100 eV. The passage energies of the fine spectrum were 12 kV, 6 mA, and 50 eV. All spectra were calibrated using C1s at 284.8 eV. The XPS data were analyzed using Avantage 5.9 software. Changes in peak functional group vibrations before and after cyclic polishing of the polished slurry were detected using FTIR.

3. Results and Discussion

3.1. Quartz Glass Orthogonal Experiments

Figure 1 shows the quartz glass’s 3D contour and surface morphology before and after grinding. Before grinding, the surface of the quartz glass sample showed extensive scratches. After 5 min of grinding, many surface scratches and brittle fractures were removed. The Sa was reduced from 483.20 nm to 22.25 nm in the measurement area of 100 × 100 μm2. After the grinding process, the surface mainly consisted of ductile scratches, while no significant brittle chipping pits were found. As a result, the sub-surface damage depth was reduced greatly, and the polishing time for the subsequent CMP was minimized.
The shape of the abrasive is an essential factor affecting polishing quality. Figure 2 shows the SEM images of CeO2 and LaOF abrasives [20] and the novel polishing slurry configuration process. CeO2 abrasives were spherical, while the LaOF abrasives are hexahedral [21,22] in morphology. It was considered that more cutting edges or polishing sites were beneficial for the MRR. However, scratches induced on the surface of the dispersion of slurry or size distribution were not uniform. The particle size of both abrasives was 100 nm, and the size distribution for both abrasives was consistent. Therefore, both abrasives induced material removal due to their similar size.
To study how different parameters influenced the polishing performance and obtain the best polishing parameter combination, orthogonal experiments for six influencing factors, namely: abrasive concentration, polishing slurry pH, dispersant concentration, pressure, speed, and flow rate of polishing [23,24,25,26,27,28,29] were conducted. The first three parameters were for the chemical composition in the slurry, while the latter parameters were for the polishing process. It was expected that both chemical components and mechanical processing parameters would have an important effect on the polishing performance. However, there was also a coupling effect between them [30]. The specific data of the orthogonal experiments are shown in Table A1, the surface profile in Figure A1, and the optical morphology in Figure A2.
The surface of all groups has a surface roughness around or under 1 nm, much smaller than the surface roughness after grinding. However, some of the surfaces have defects, such as small scratches and pits, as shown in Figure 3a,b. This might be related to poor dispersion performance when the abrasive concentration was too high, or the dispersant concentration was too low. In such cases, secondary agglomeration was observed, and large particles were formed in the slurry resulting in scratches and pits. Moreover, the orange peel was another defect found in another group, as shown in Figure 3c,d, but the forming machine was different from the scratches. In CMP, if the concentration of the chemical composition was too high, and the chemical etching was too severe, the softened layer did not remove effectively. As a result, further etching into the substrate was initiated, resulting in a rough surface with defects such as the orange peel.
The experimental data on Sa and MRR were obtained from the above orthogonal experiments. Both the Sa and MRR results were considered when deriving the best combination of parameters using the extreme difference analysis [31]. In both cases, the K jm , K jm ¯ and R j were calculated. The order of these factors affecting the polishing and the superior level of each factor were obtained. Finally, by comparing and analyzing the influence of the two test indices, an optimal parameter combination was found in the extreme difference; R j of the jth column is expressed as:
R j   = max ( K j 1 ¯ ,   K j 2 ¯ ,   ,   K jm ¯ ) min   ( K j 1 ¯ ,   K j 2 ¯ ,   ,   K jm ¯ )
where K jm is the sum of the test indices corresponding to the mth level of the factor in the jth column. K jm ¯ is the mean of K jm . The primary and secondary order of the factors [32] can be judged by R j . The data in Table A2 and Table A3 corresponded to the orthogonal experimental polar-difference analysis data for the Sa and MRR test metrics, respectively. The result showed that the order of influence of the factors on Sa was D > E > A > C > B > F. The order of influence on MRR was D > B > E > C > F > A. The factors D (pressure) and E (speed) were the most important factors for both the Sa and the MRR, which is perfectly normal for the polishing process since they were the two main factors that govern all polishing methods according to the Preston formulation.
Figure 4 shows the effect of each factor on Sa and MRR. The overall trend of Sa in Figure 4a decreased and then increased as the abrasive concentration increased. However, the MRR variation trend was the opposite. At the concentration of 0.5 wt%, Sa was 0.42 nm, and MRR was 181.34 nm/min. With an increased abrasive concentration, the number of abrasive grains involved in grinding at the same time increased. Hence, high spots on the quartz glass surface were effectively removed, achieving the goal of reducing Sa and increasing the MRR. However, as the concentration continued to increase, too many abrasive grains entered the gap between the polishing pad and the sample. The average load on each abrasive grit became smaller, and as a result, the MRR decreased. Meanwhile, more abrasives meant a higher polishing heat, and the chemical corrosion effect became greater. As a result, Sa increased accordingly. After that, as the concentration continued to grow, MRR increased again. In this circumstance, the secondary regrouping of abrasives started to take effect as the abrasive concentration was too much for uniform dispersion, forming large particles. These large particles entered the polishing zone and created significant scratches and other defects, while the load on these large particles was much higher than others. As a result, the MRR increased, and the surface became rougher.
In terms of the influence of the chemical composition, as shown in Figure 4b, the Sa first decreased, then increased, and finally decreased as the pH increased, while the MRR had an opposite variation trend. When the pH was 9.5, the Sa was 0.45 nm, and the MRR was 194.20 nm/min. When the pH value increased, the alkaline environment benefited the chemical etching process during the CMP. However, when the pH increased past 10.2, the chemical etching effect was too great, and the softened layer could not be removed effectively. As a result, the Sa became much higher.
Figure 4d,e show that higher polishing pressure and speed were beneficial for the polishing performance in the selected range in this work since the Sa in both factors continued to decrease. However, it was also observed that the MRR experienced a quick drop when the pressure and the speed were at a certain value. In Figure 4f, it was observed that the flow rate of slurry had little influence on both the MRR and Sa. The MRR did experience a large drop during the process, but after that, the MRR was almost at the same level even though the flow rate doubled. It was observed that a larger flow rate effectively removed the polishing chips from the polishing zone and supplied fresh and new abrasives into the polishing zone. However, the effect on MRR or Sa was minimal. On the other hand, it was considered that the new slurry at room temperature could also carry away some of the polishing heat, resulting in a drop in the CMP efficiency and thus the decreasing MRR.
The analysis above showed that the optimal level for Sa was A2 B2 C3 D5 E5 F5. However, when both levels were considered, the most optimal combination of the two tests was A2 B2 C3 D5 E5 F1, which was a 0.5 wt% abrasive concentration, pH 9.5, 0.5 wt% dispersant concentration, 40 kPa polishing pressure, 140 rpm polishing speed, and 2 mL/min polishing slurry flow rate. Repeated experiments at the same conditions were also performed on the optimum combination from the orthogonal experimental analysis to verify the results. Figure 5 shows the Sa and morphology after polishing with the optimal combination. Polished surfaces were smooth and free of surface flaws such as scratches and pits, and the Sa was as low as 0.23 nm.
Cross-sectional TEM images of the quartz glass before and after polishing are shown in Figure 6. Before CMP, the quartz glass surface layer exhibited cracks with a damaged layer of approximately 172.3 nm (Figure 6a). These cracks were irreversible plastic flow formed by surface compressive stresses during grinding. After the CMP, the microscopic cracks in the surface layer were completely removed, leaving only a dense-lattice layer with a thickness of 4.5 nm (Figure 6b). It was noticed that the TEM images for amorphous materials were rarely taken; therefore, it was still unknown what this layer was. From the TEM image, it was observed that there was no significant difference in the structure between the thin layer and the base material, which indicated that it was a structural compression deformation. It is well known that the open network of fused silica can temporarily store energy through network contraction, called densification. Such behavior cannot recover spontaneously but can be reversed by annealing to 0.8 Tg (glassification temperature). Another possibility is the plastic flow of the material on the surface was due to shear deformation, which is also a source of plastic deformation but cannot be recovered. It is the first time such a structure was observed under TEM. Future studies should focus on the forming mechanism of such a layer during CMP. Anyhow, no cracks were found on the surface after polishing, and the subsurface damage layer was greatly reduced, which showed the capability of CMP.

3.2. Polishing Slurry Dispersibility Experiment

The dispersibility of the polishing slurry is an important factor affecting polishing quality. Orthogonally influencing factors such as the polishing slurry concentration, pH, and dispersant concentration indicate slurry dispersal. With good dispersion performance, a more uniform particle size can be found in the slurry, and henceforth a lower Sa after polishing and higher MRR can be achieved. A particle size, potential, UV absorbance, and viscosity analysis was carried out for the polishing slurry with the optimum combination configuration following the orthogonal experiment to study the influence of dispersion performance [33,34,35,36,37,38]. The results are shown in Figure 7. The viscosity results are shown in Table 2. The results from the particle size analyzer show that the average particle size of the original polishing slurry was 460.3 nm. D50, the particle size median, was 207.6 nm, and D90 was 266.9 nm, meaning that 90% of the particles were below 266.9 nm. After dispersion, the average particle size of the polished slurry was 173.9 nm, almost one-third that of the original polishing slurry. The D50 was 157.9 nm, and D90 was 243.4 nm. A total of 10% of the original slurry had a size between 266.9 nm and 460.3 nm, which showed that the agglomeration of the abrasive before dispersion was severe. The massive size difference between the largest abrasive was the main cause of defects on polished surfaces with the poorly dispersed slurry, where the polish pressure was not evenly distributed.
The zeta potential decreased from −37.53 mV to −22.65 mV, while the maximum UV absorbance decreased from 1.925 to 0.317. The zeta potential measured the strength of mutual repulsion or attraction between particles. The UV absorbance indicated the dispersion of particles suspended in solution, and its value is proportional to the number of particles dispersed. Thus, by comparing the above result of the two polishing slurries before and after dispersion processing, it was found that the slurry after dispersion had a much better dispersion rate and stability in solution. However, the viscosity increased from 1.13 mPa·S to 5.06 mPa·S due to the addition of the PAAS dispersing agent. PAAS is a high-molecular-weight anionic dispersant. In addition to forming an electrical double layer on the abrasive surface in solution to overcome van der Waals forces between abrasive materials, it formed a spatial resistance at the site in the polishing slurry through its special functional groups, further increasing the stability of the solution.
The polishing slurry of quartz glass was configured according to the above method, and the polishing process consisted of green and environment friendly ingredients. LaOF and CeO2 are light rare earth materials, which do not pollute the environment. SNLS [39,40,41,42] is an amino-acid-like anionic surfactant having good surface activity capability, excellent biodegradability, and corrosion resistance, and is widely used in cosmetics and other fields. PAAS is a high-molecular-weight anionic dispersant [43,44,45]. The compound is approved for use in food additives and has many advantages, such as excellent mechanical properties, stability of fractals, and so on. K4P2O7 serves as a pH control agent [46]. Its continuous hydrolysis in water maintains the pH stability of the solution. K4P2O7 is also an eco-friendly chelating agent that can be used as a remediation of soil drenches to remove heavy metals from the soil. After polishing, only DI water and compressed air are used to clean the samples. Therefore, the entire process and polishing slurry product are green.

3.3. Investigated the Mechanical Chemical Polishing Mechanism of Quartz Glass

The XPS data are shown in Figure 8, and to understand the CMP mechanism of quartz glass, pieces of polished samples were immersed in a solution of K4P2O7 with a concentration of 5 wt% for 24 h.
The first reaction in the solution was the hydrolysis reaction of K4P2O7, which formed an alkali polishing environment. Because K4P2O7 is a strong base and a weak acid salt, it is a conjugate base of the pyrophosphate of tetradecanoic acid. Therefore, without considering K+, the form of ions present in its aqueous solution was theoretically the same as the form of ions present in pyrophosphate in an aqueous solution. Pyrophosphate [46] has an ionization constant of K a 1   = 7.5 × 10⁻¹, K a 2   = 6.2 × 10⁻², K a 3   = 1.7 × 10⁻⁶, K a 4   = 6 × 10⁻⁹. From Equation (3), its constant dissociation pK a was deduced.
pK a = lgK a  
where pK a 1   = 0.1249, pK a 2 = 1.2707, pK a 3 = 5.769, pK a 4 = 8.221. From the Henderson Hasselbach Equation (4), one can then derive the shape of its ion distribution in the solution [47]. The results are given in Figure 9a, where [ A ] and [ HA ] are the corresponding substances’ concentrations, respectively.
pH = pK a + lg [ A ] [ HA ]
K4P2O7 in the solution was completely hydrolyzed at pH 9.5. This corroborated with the XPS data by the presence of large quantities of P2O74− and K+ in the solution. The energy difference of the orbital spin splitting peaks (2p3/2 and 2p1/2) in the P 2p spectrum was about 0.9 eV. Based on the energy positions of the P 2p spectral peaks and the database, it was judged that P is present as P2O74−, and the binding energies of P 2p3/2 and P 2p1/2 are 133.0 eV and 133.9 eV, respectively [48]. The peaks of 2p3/2 and 2p1/2 of K+ in the samples correspond to 293.15 eV and 296.3 eV, respectively [49]. O 1 s could be divided into metal oxides, K2SiO3, SiO2, and H2O components. The binding energies were 530.5, 532.15, 532.8, and 534.3 eV, respectively [50,51,52], where K2SiO3 is related to the K4P2O7 in the sample. In comparison, Si 2p corresponded to the peaks of K2SiO3 and SiO2 with binding energies at 102.55 eV and 103.3 eV, respectively [53,54]. The mountains of K2SiO3 and SiO2 could be correlated with the results of O 1 s. SiO32− was generated by the chemical reaction in the alkaline environment generated by the hydrolysis of K4P2O7. The reaction mechanism for this polishing process is thus as follows.
4 K + + P 2 O 7 4 + H 2 O HP 2 O 7 3 + OH + 4 K +
HP 2 O 7 3 + H 2 O H 2 P 2 O 7 2 + OH
  H 2 P 2 O 7 2 + H 2 O H 3 P 2 O 7 + OH
H 3 P 2 O 7 + H 2 O H 4 P 2 O 7 + OH
SiO 2 + 2 OH H 2 O + SiO 3 2
FTIR spectra were obtained to check the chelating effect of the dispersing agent on the polished products, as shown in Figure 9b. Before polishing, the 2849 cm−1 peak corresponded to the methylene group (CH2) vibration, attributed to SNLS and PAAS [39,43]. The band at 1667 cm−1 corresponded to the amino cation vibration, attributed to SNLS. The band at 1465 cm−1 corresponded to the methyl CH3 and methylene CH2 asymmetric bending vibration, attributed to the SNLS and PAAS. The band at 1286 cm−1 corresponded to the vibration of the pyrophosphate, assigned to the K4P2O7 [55]. The band at 1100 cm−1 corresponded to the C-O stretching vibration, attributed to SNLS and PAAS. After polishing, the corresponding assigned functional groups were observed at 2851 cm−1 corresponding to the methylene (CH2) vibration. The band at 1668 cm−1 corresponded to amino cations. The band at 1464 cm−1 corresponded to the methyl CH3 and the asymmetric flexural vibration of methylene CH2 group. The band at 1285 cm−1 corresponded to the pyrophosphate vibration. The band at 1101 cm−1 corresponded to the C-O stretching vibration. Firstly, OH generated by the hydrolysis of K4P2O7 in the solution provided an environment for polishing alkali. During this process, the quartz glass’s surface reacted with the slurry’s chemical components to generate Si-OH groups. SNLS and PAAS started to form complexes with the products through their special functional groups, leading to fluctuations in their infrared transmittance, as shown in Figure 10.
The mechanism of the quartz glass CMP was deduced from the XPS data and FTIR, as illustrated in Figure 11. First, K4P2O7 was hydrolyzed in the water, providing an alkaline polishing environment. The chemical interaction took place on the surface of SiO2 to produce silicates and Si-OH groups. The special functional groups of SNLS and PAAS in the polishing slurry then formed chelate products along with it. It was eventually mechanically removed by the CeO2 and LaOF rare earth abrasives in the polishing slurry. Since the hardness of both abrasives was lower than SiO2, the soft layer was removed without creating scratches on the polished surface. It was possible to obtain an ultra-smooth quartz glass surface. In the subsequent CMP, this process was repeated to complete the green and efficient low-damage chemical mechanical polishing of quartz glass by the dual action of chemical etching and mechanical removal.

4. Conclusions

This study used CeO2, LaOF, SNLS, PAAS, K4P2O7, and DI water for the polishing slurry setup, which is composed entirely of green ingredients. Only DI water and compressed air were used in the polishing process for cleaning and drying the sample parts. The result of the polishing tests led to the following conclusions:
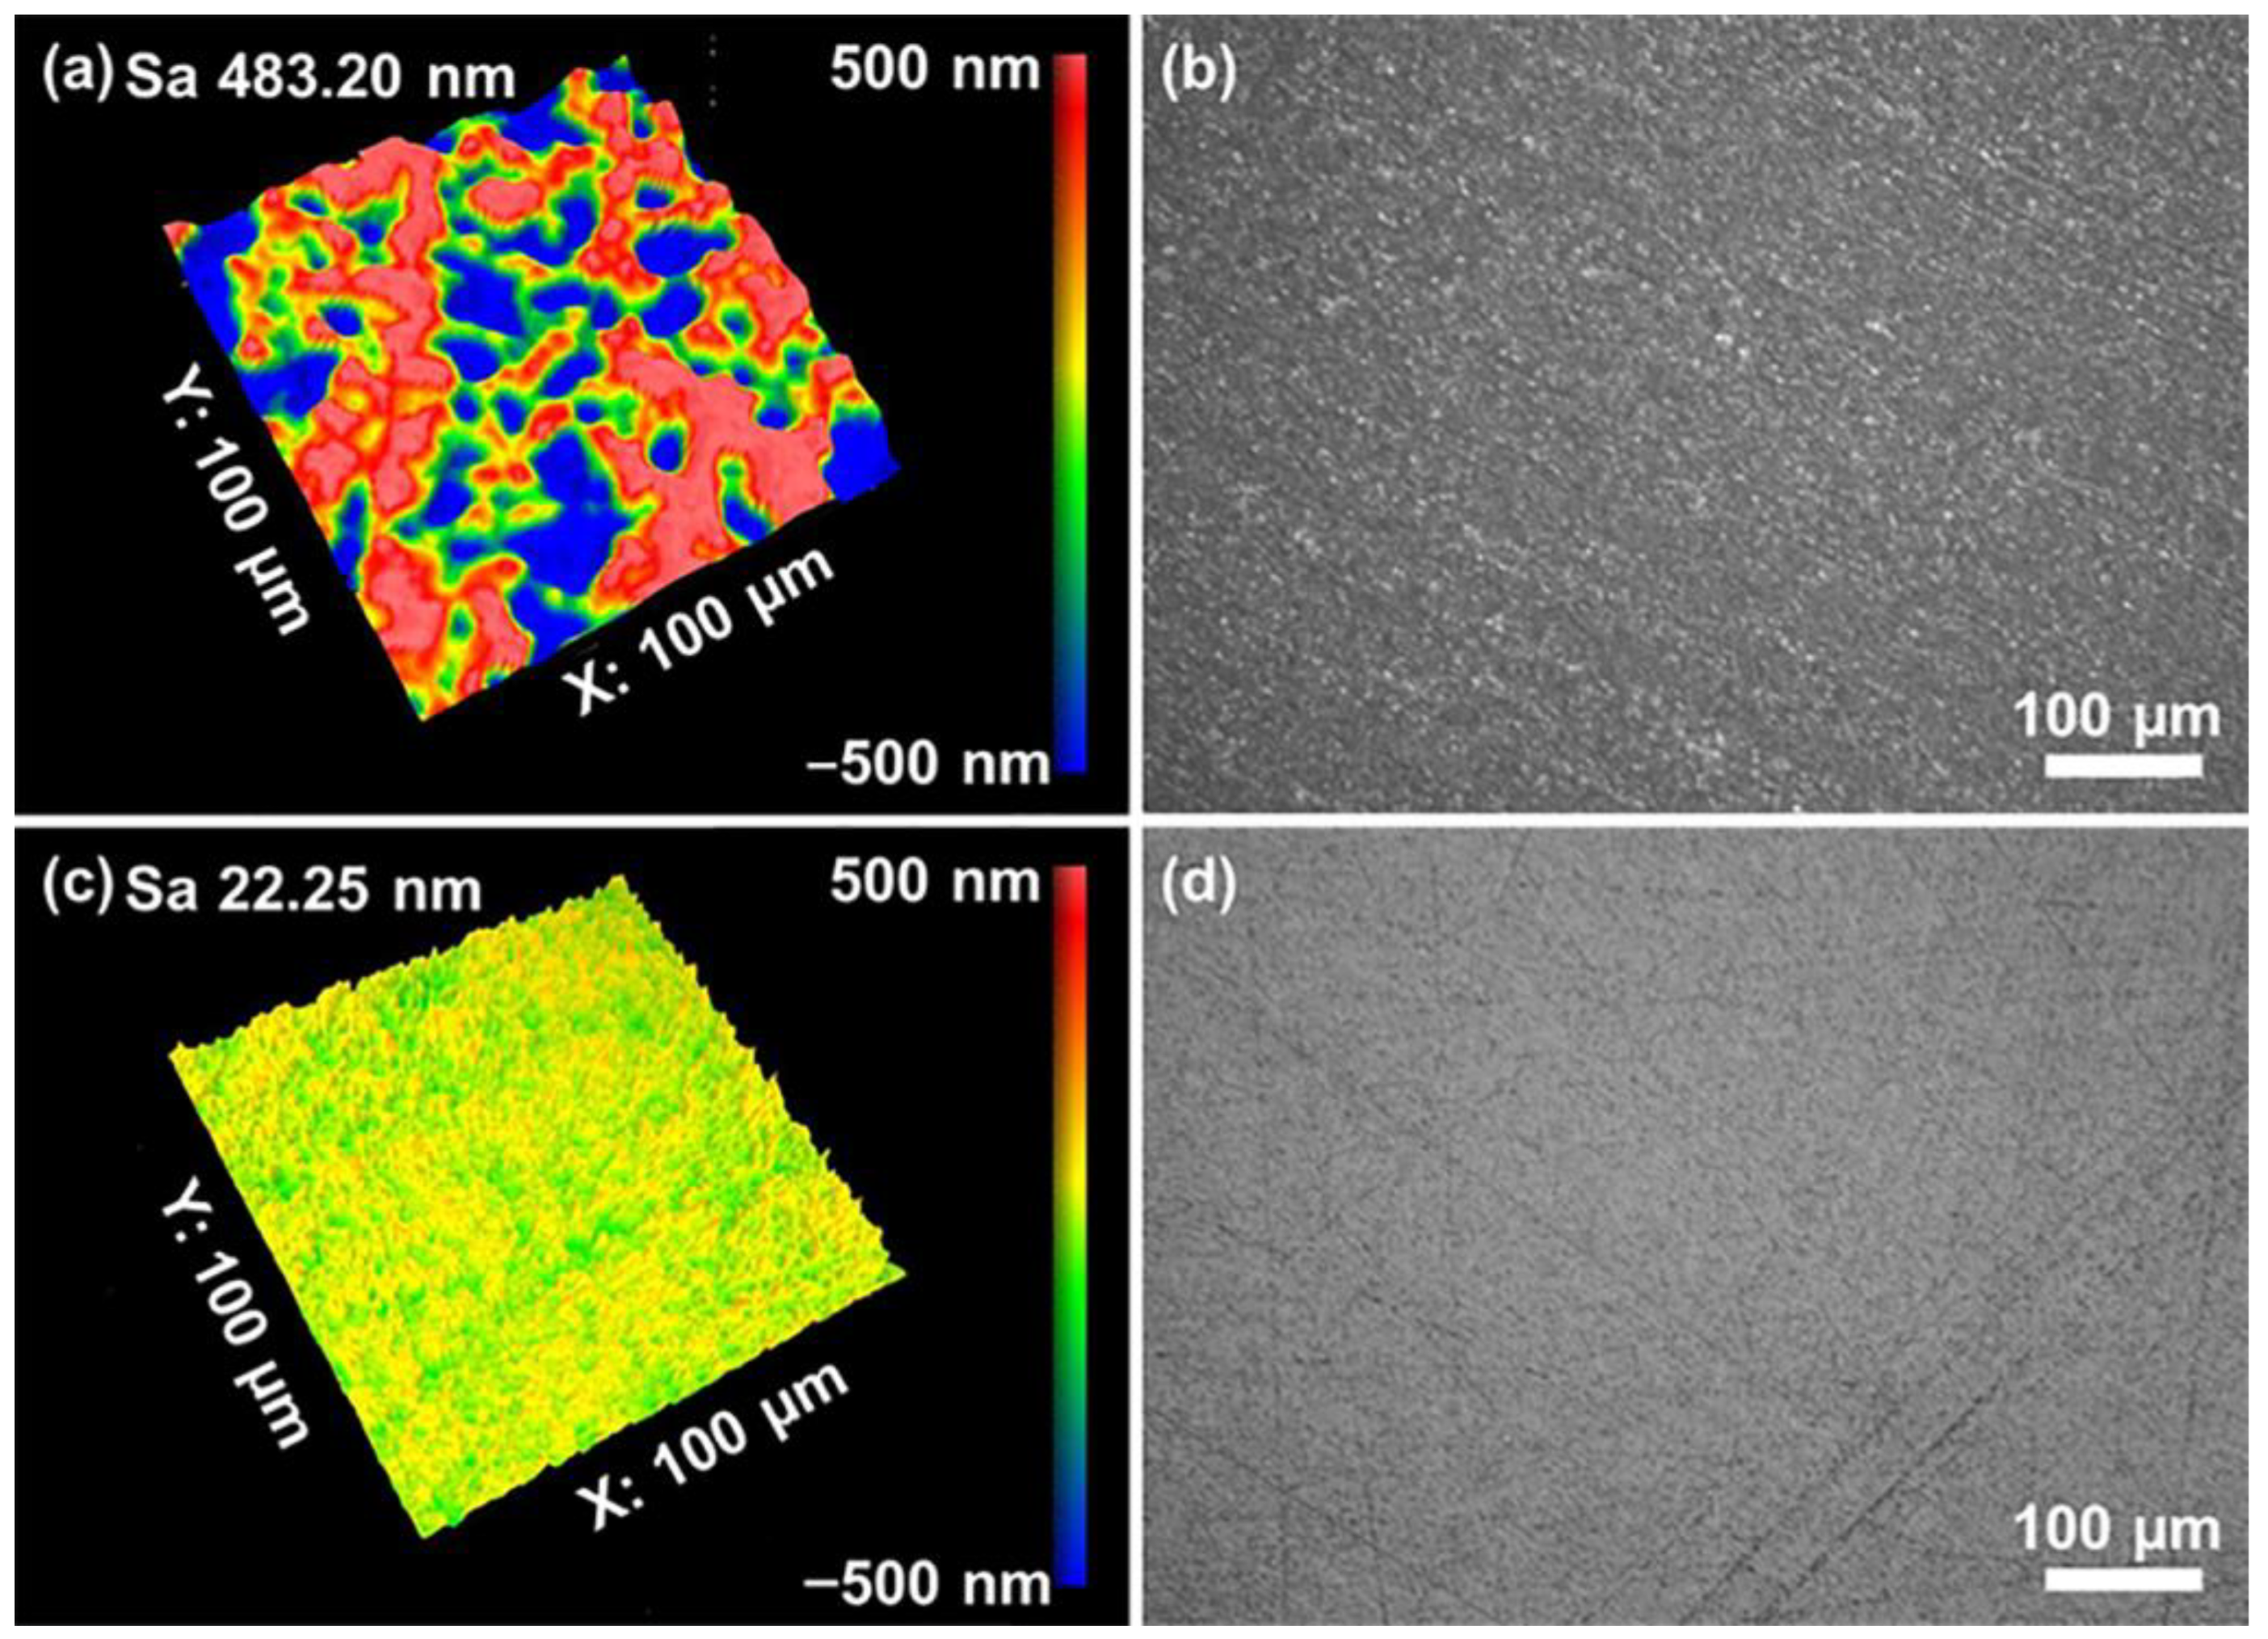
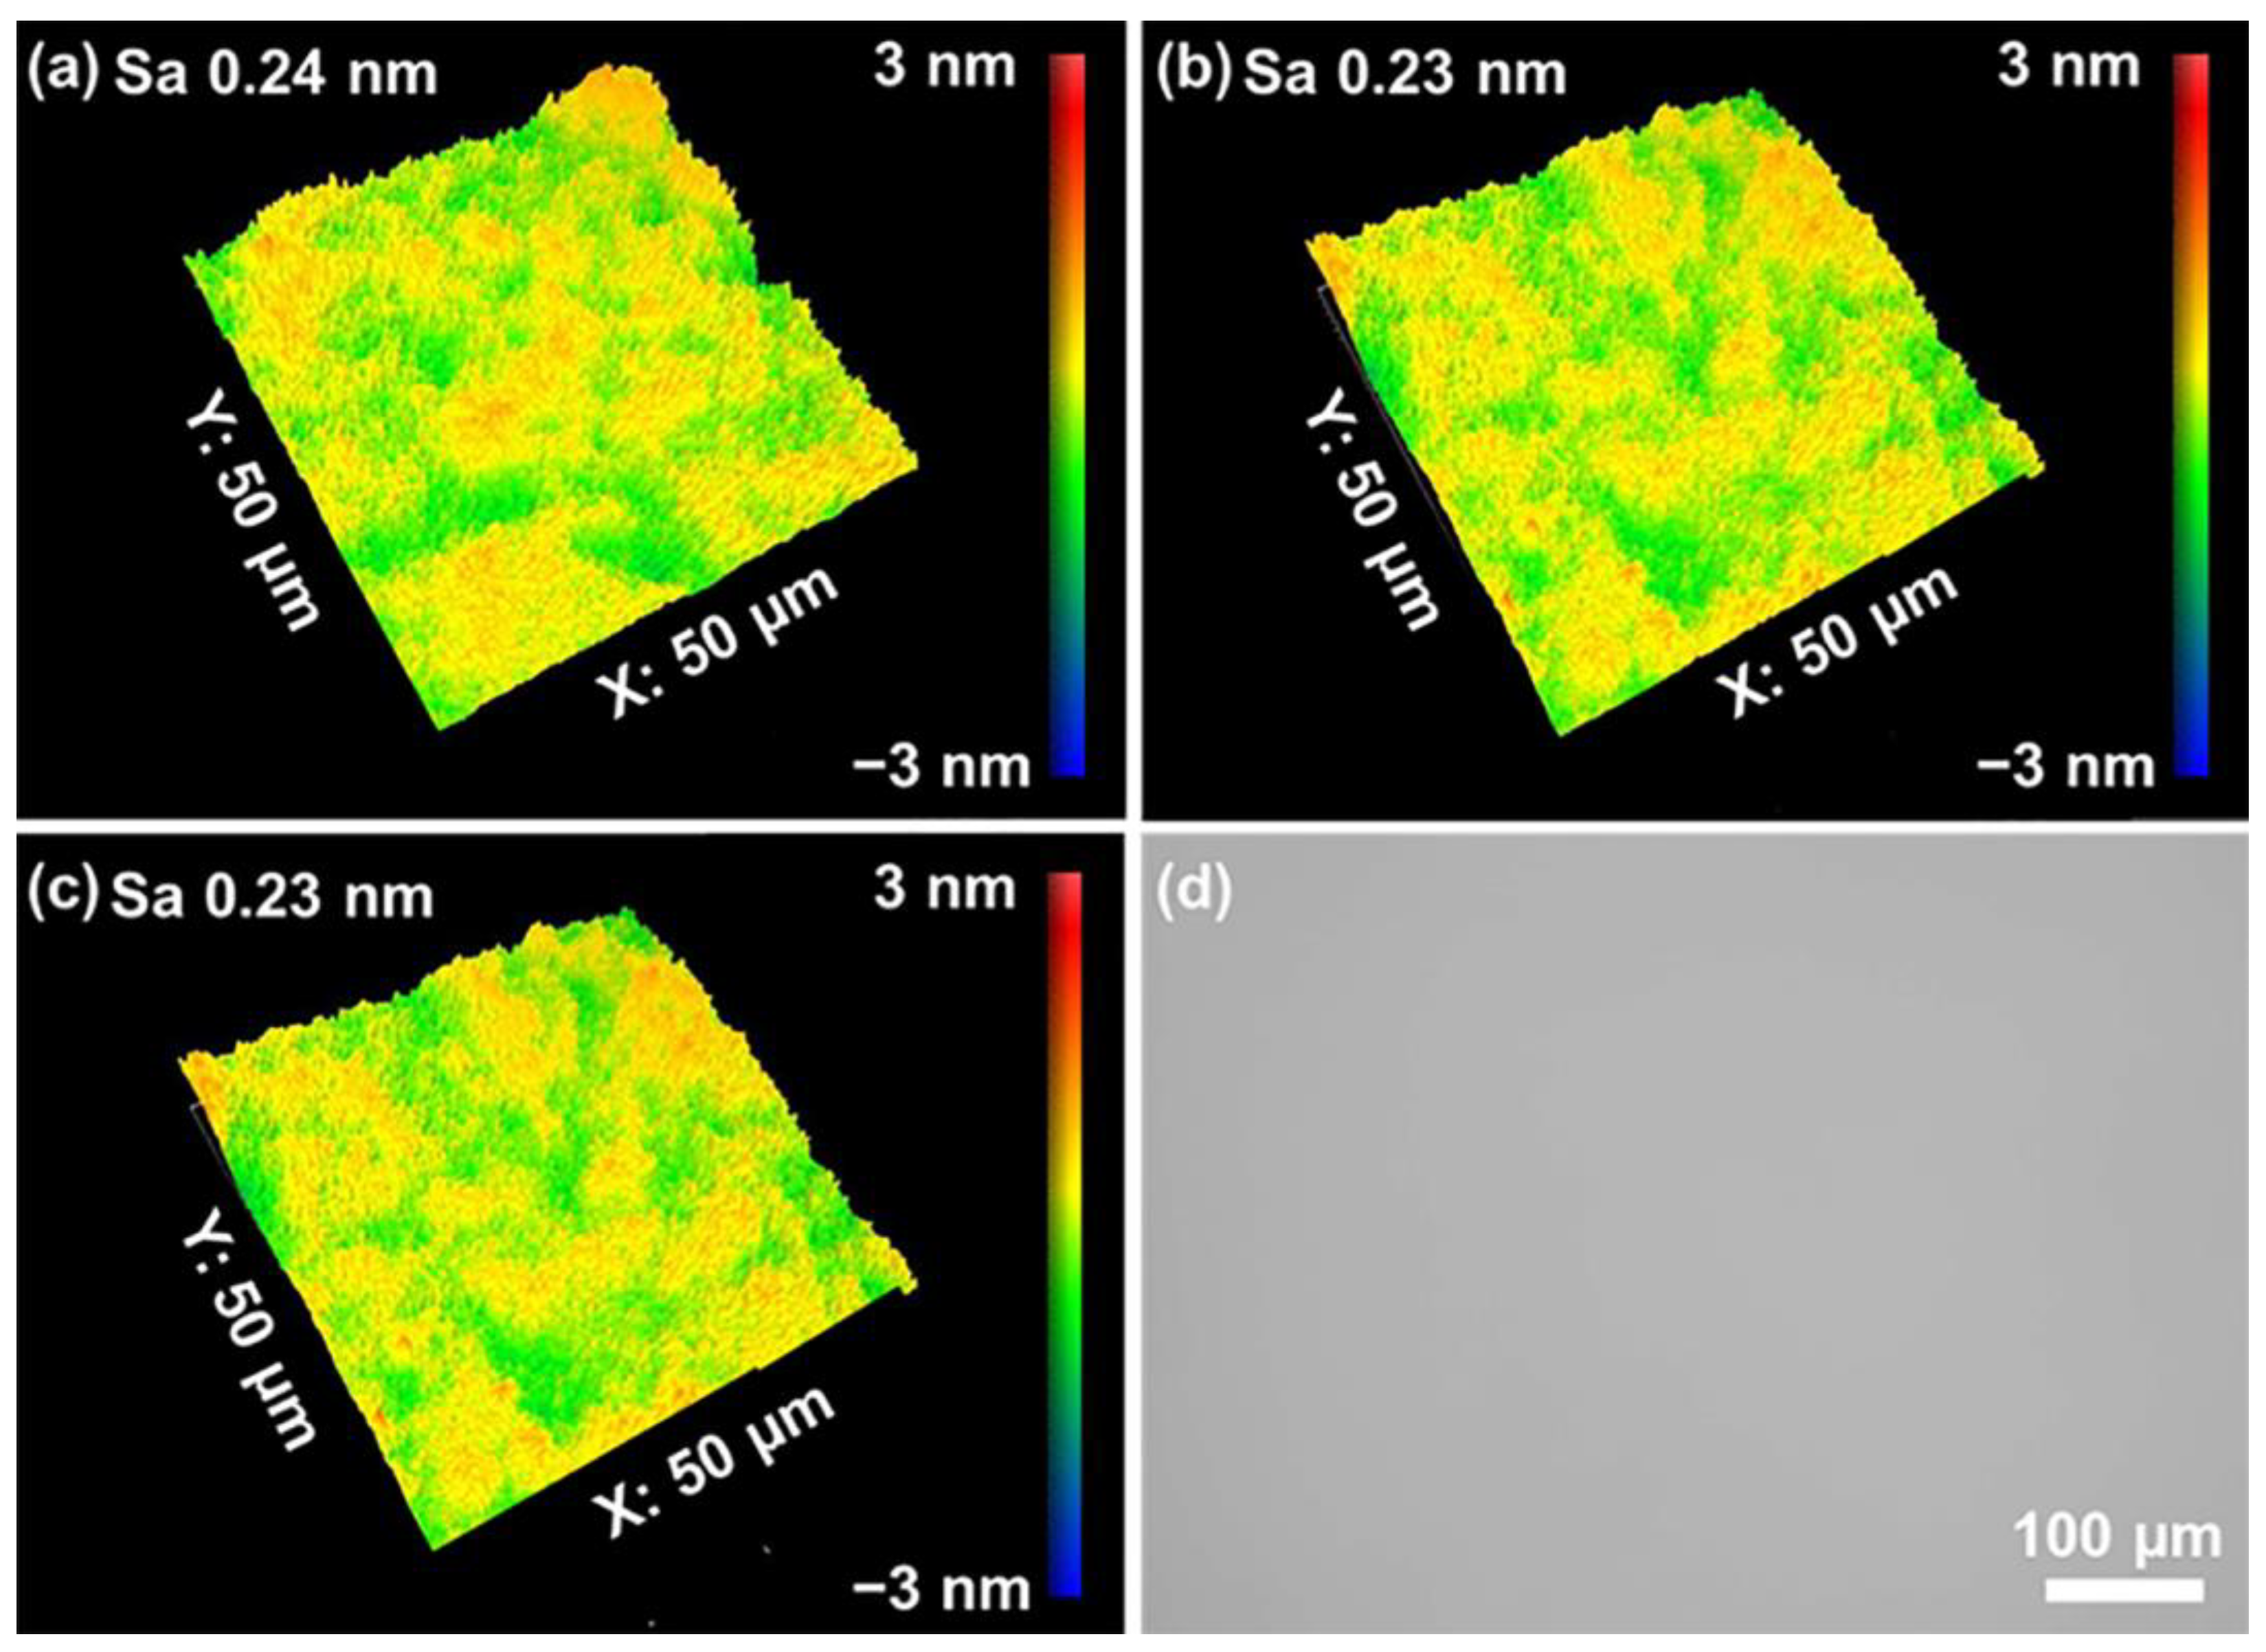
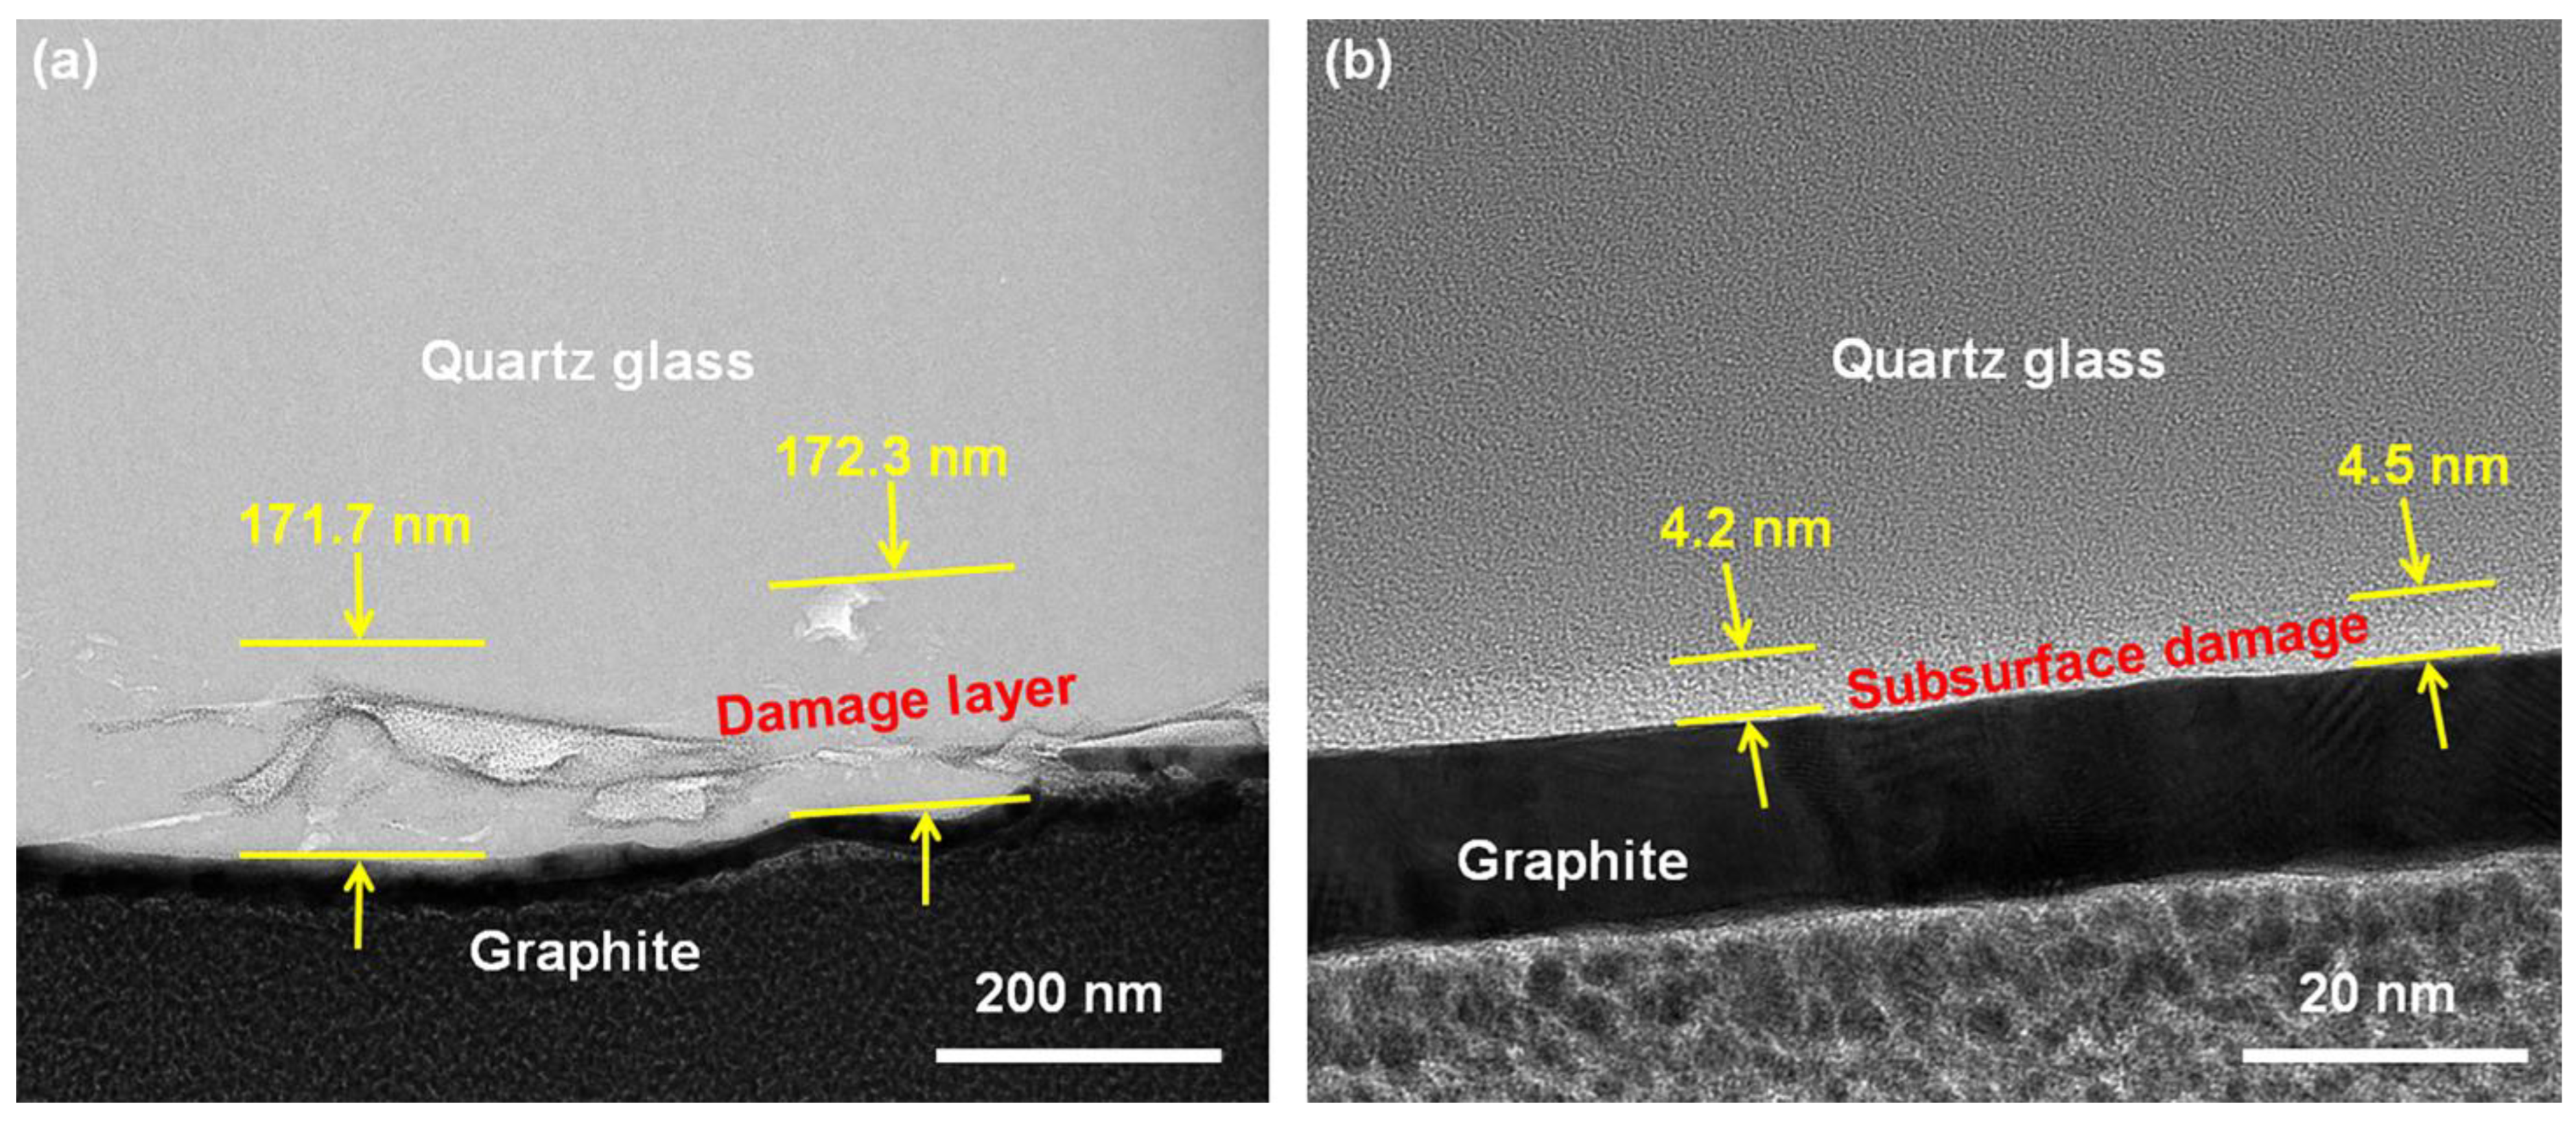
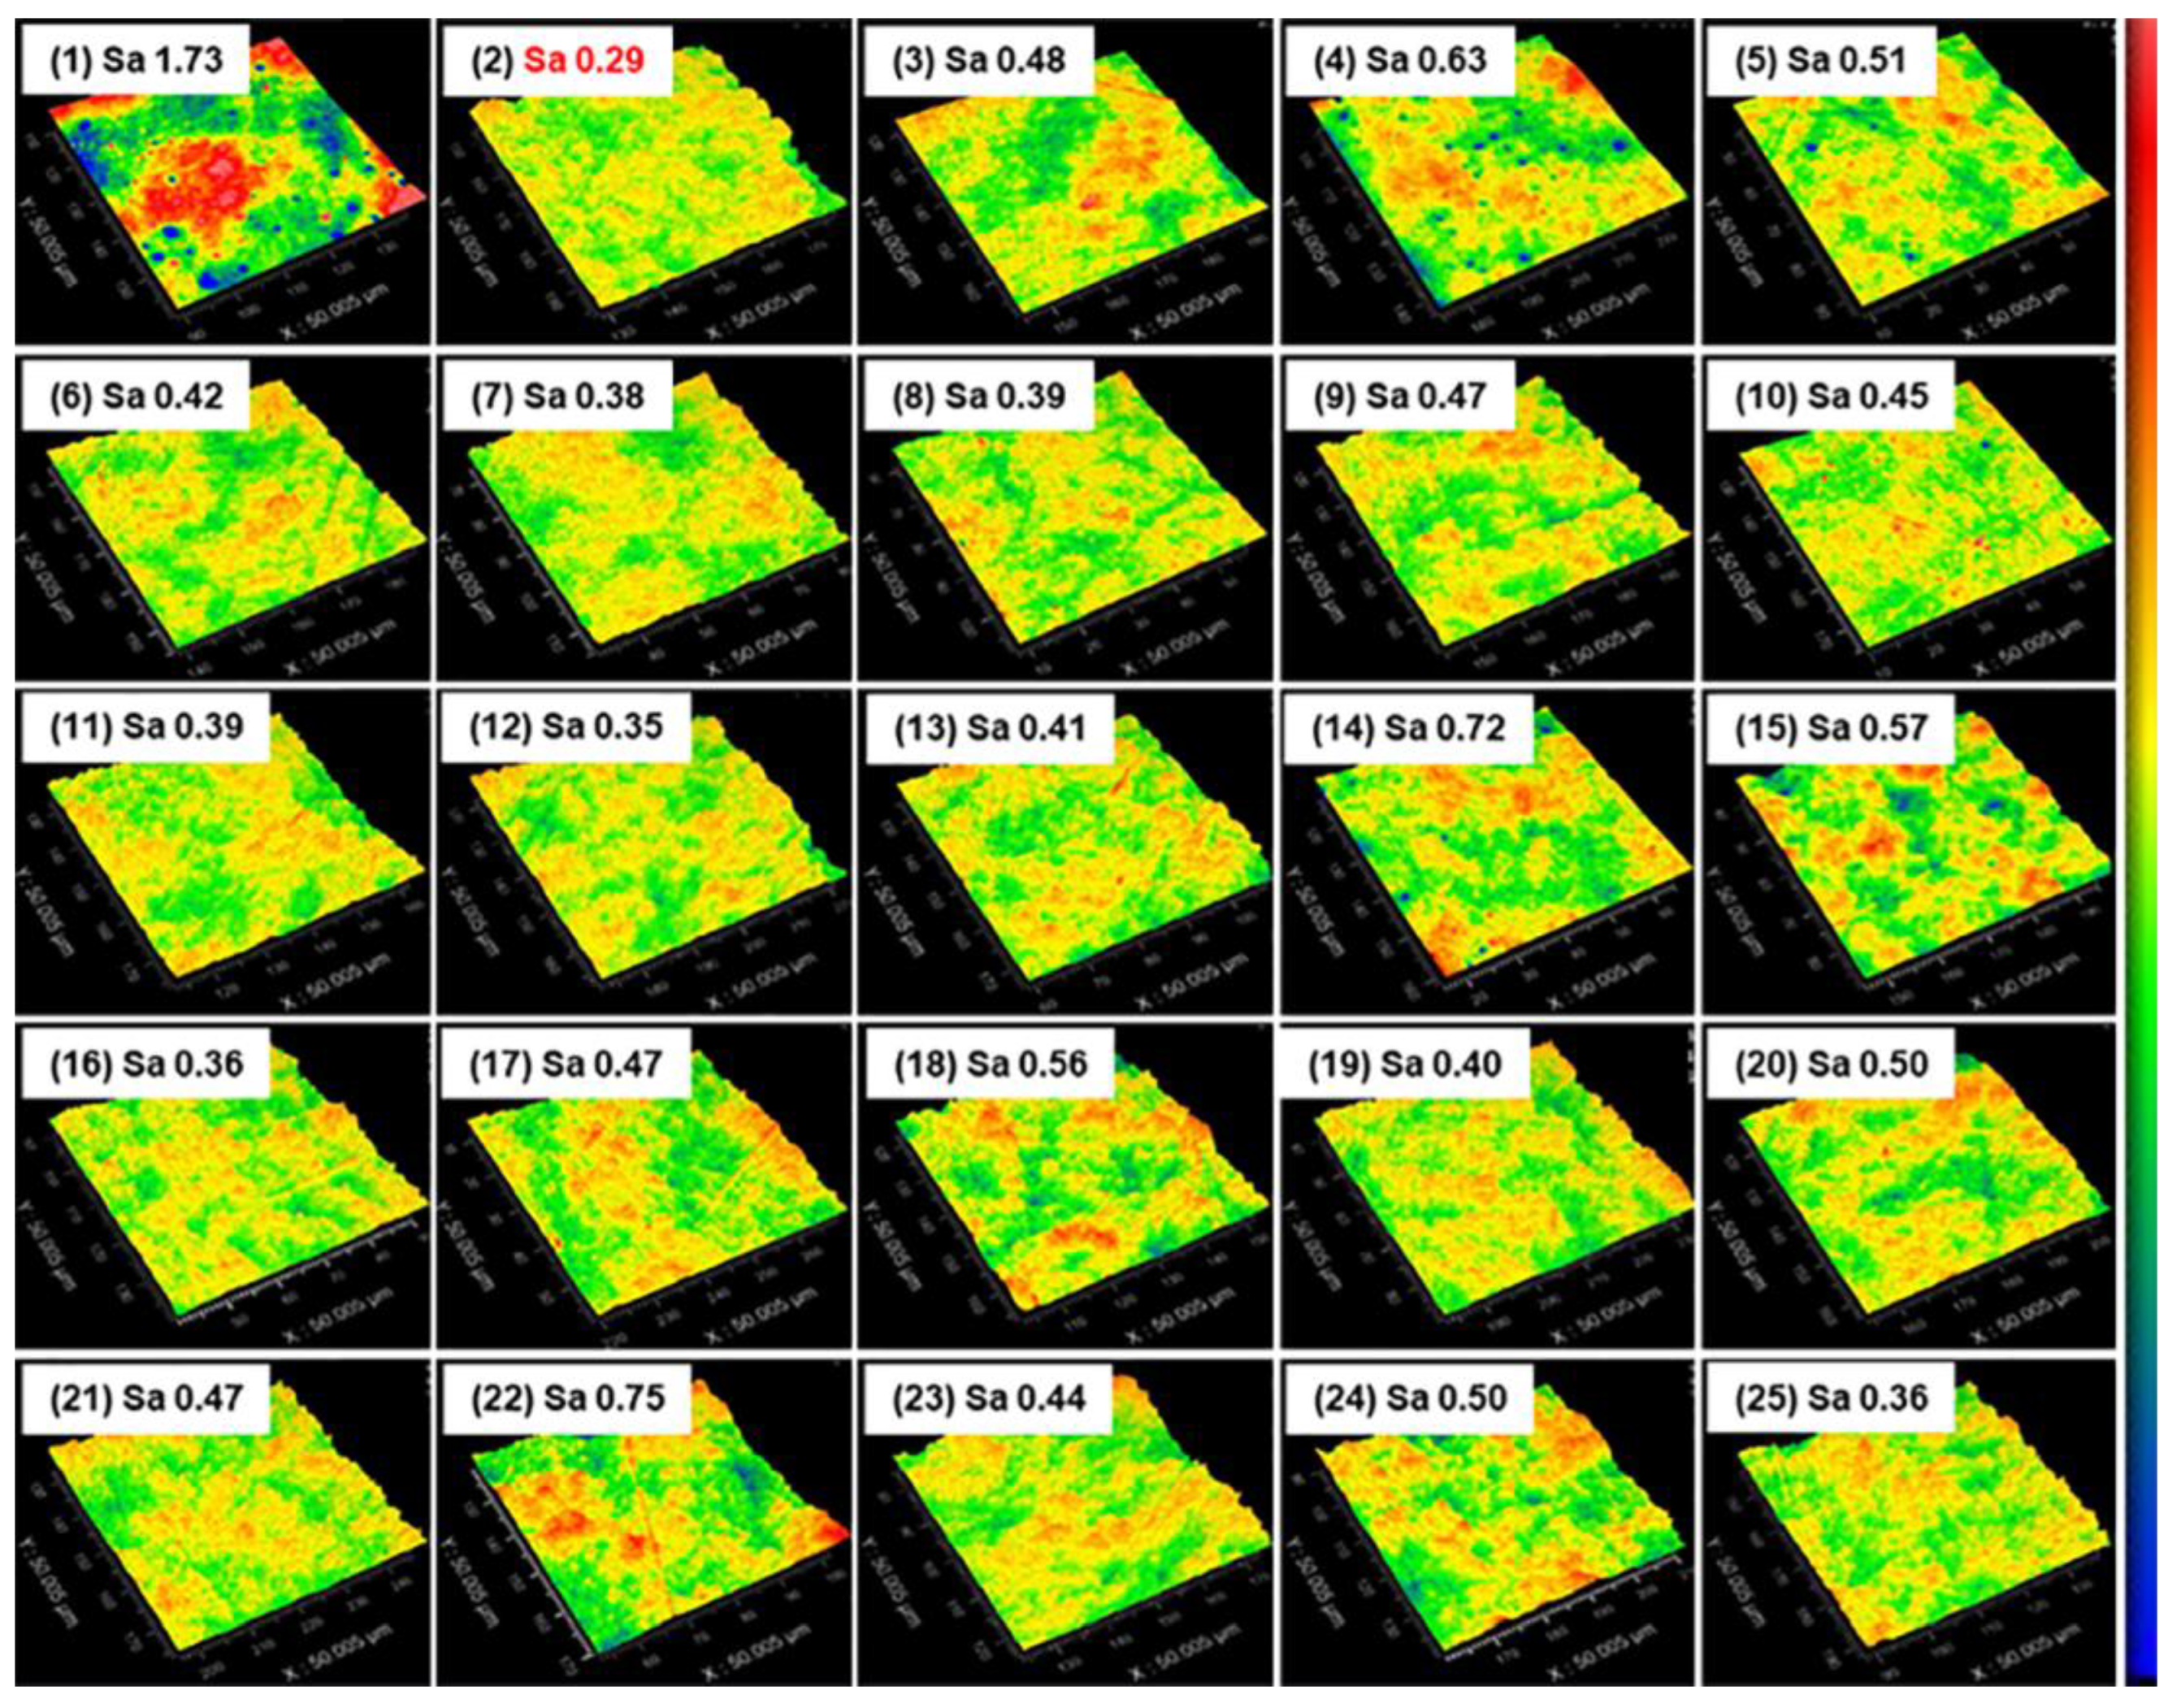
  • Orthogonal testing was used to achieve the best polishing solution formulation for polishing quartz glass. The MRR of the polishing process was 530.52 nm/min, which was higher than the value reported previously. It was possible to achieve a surface roughness of 0.23 nm in the range of 50 × 50 μm2, which was less than the current 0.9 nm reported for commercial abrasives. All cracks and the subsurface damage layer were removed from the surface, leaving a 4.5 nm densified mesh structure.
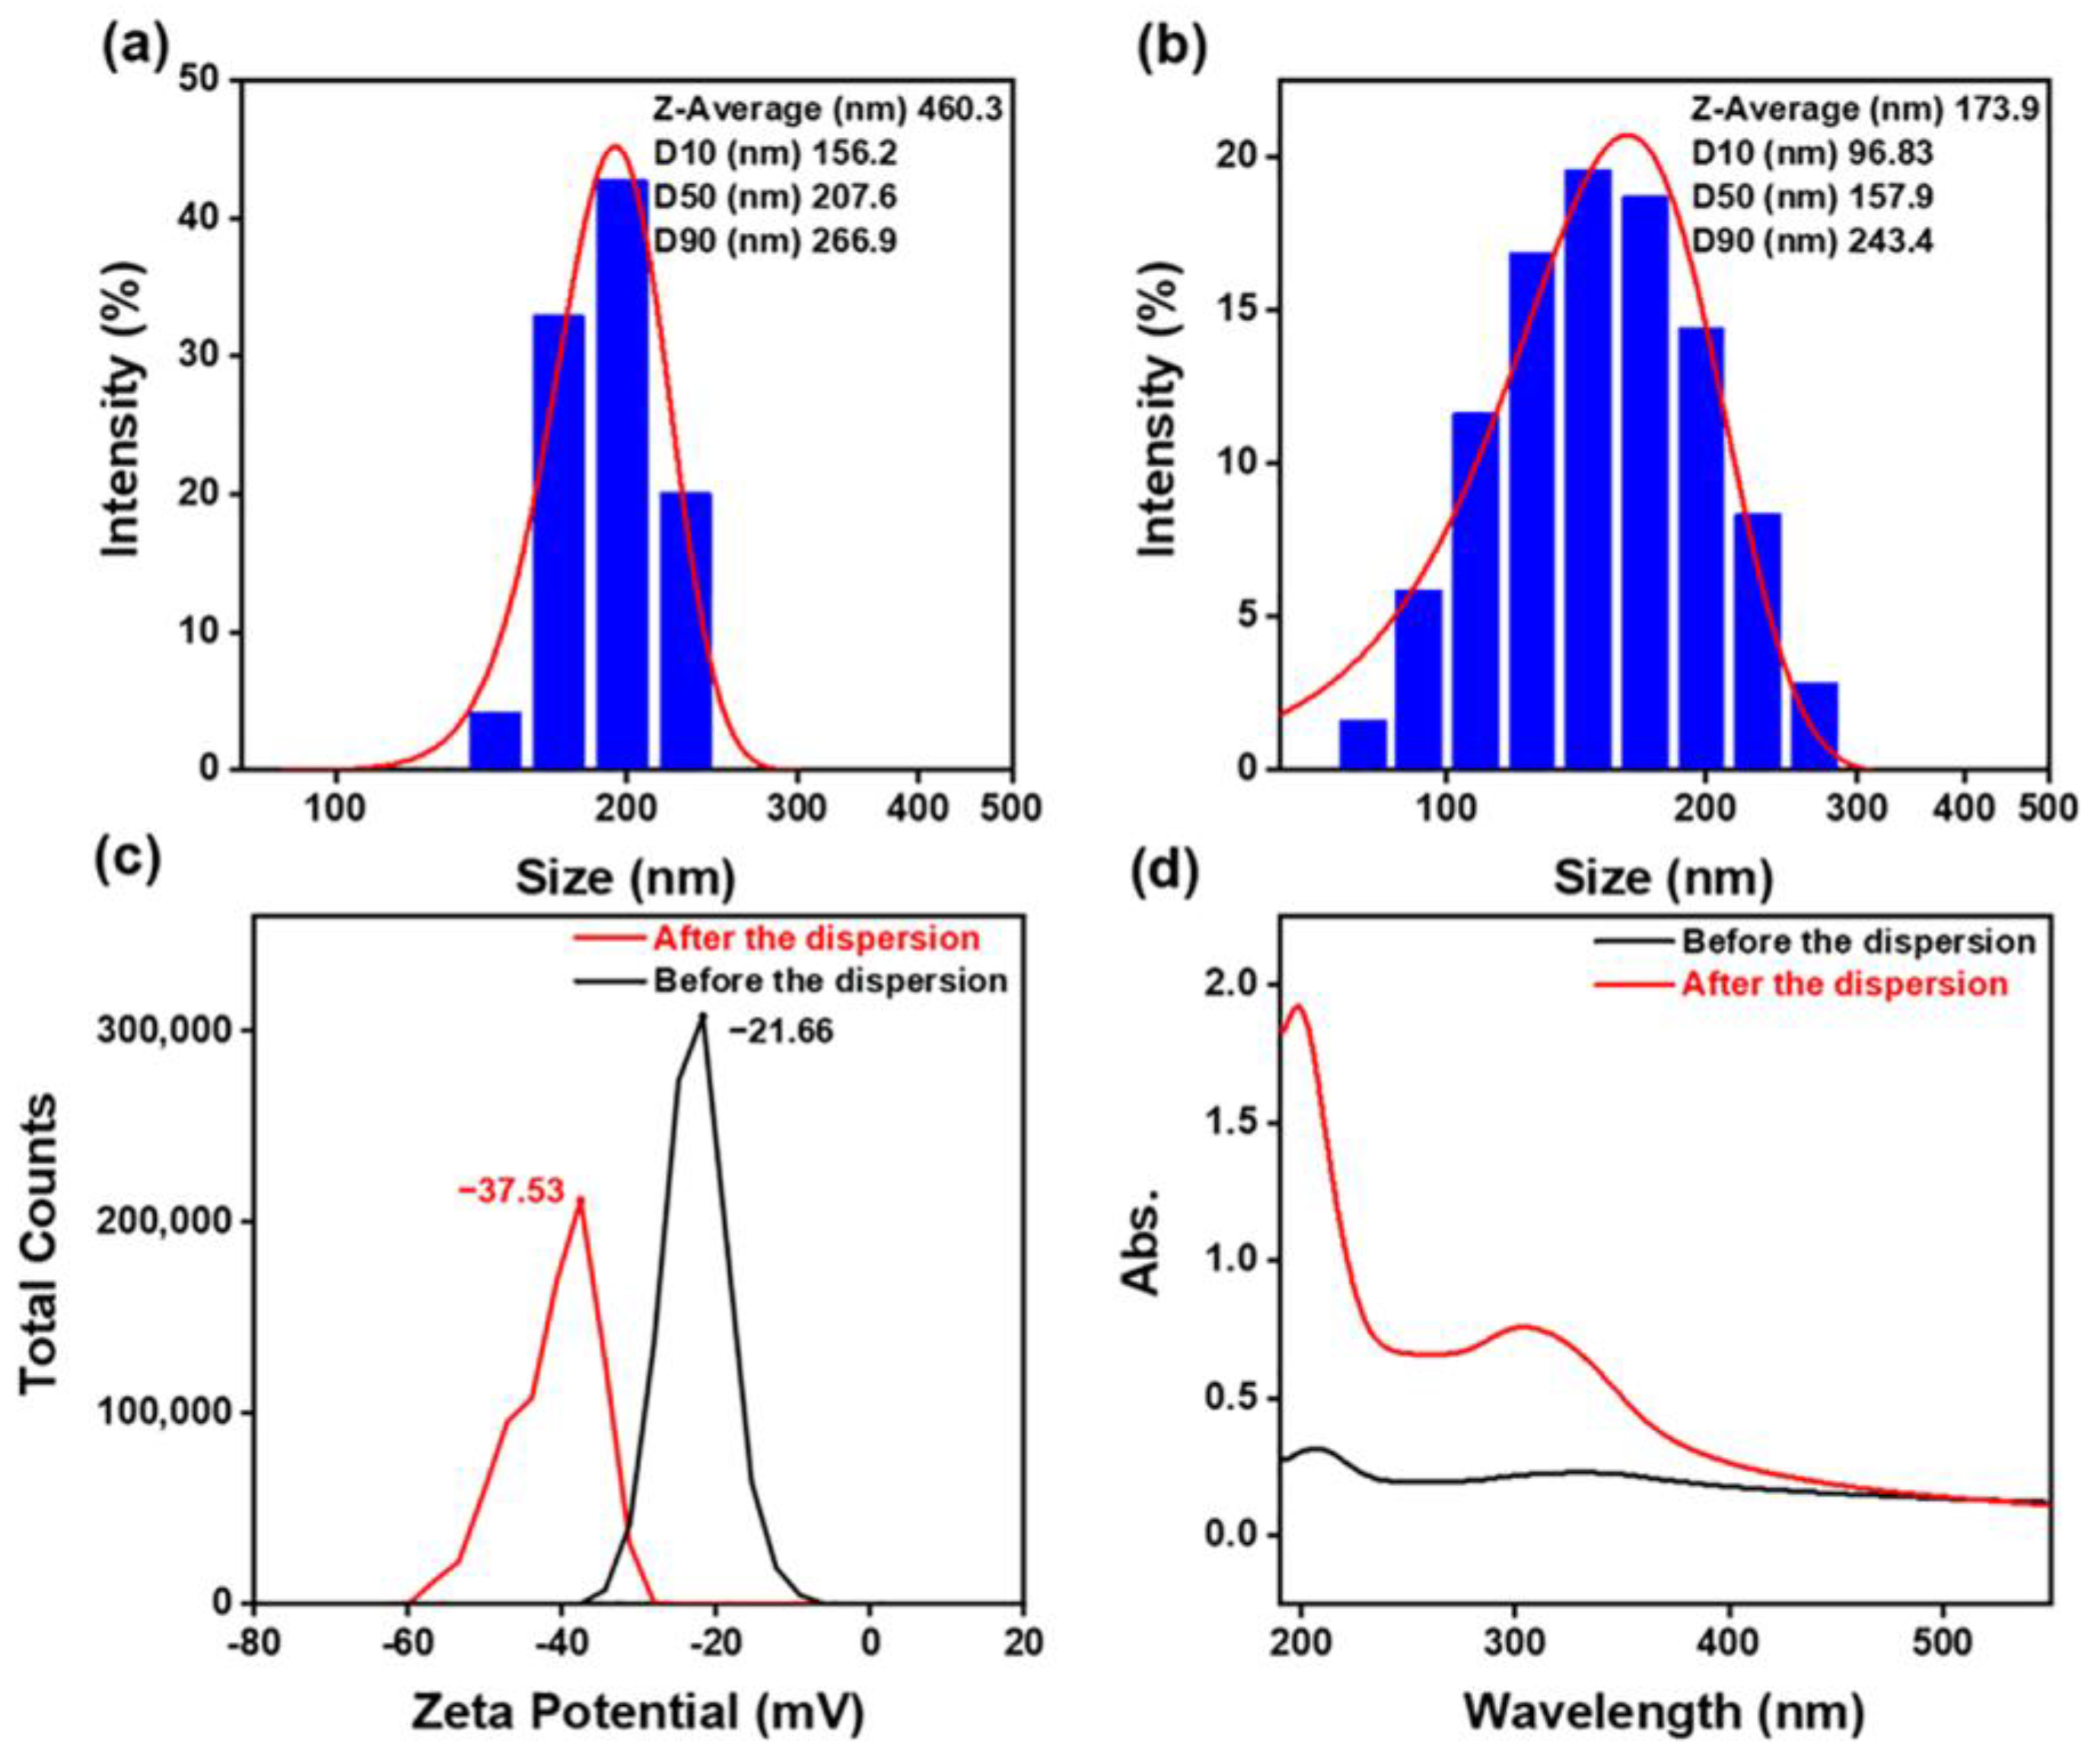
  • Particle size, zeta potential, UV absorbance, and viscosity were tested and analyzed for the polishing slurry before and after dispersion. The polishing slurry with the optimal combination from the orthogonal test had a more uniform particle size, a larger zeta potential, a higher UV absorbance, and a slightly higher viscosity than the untreated polishing slurry, showing that the dispersion is a very important factor for the polishing slurry.
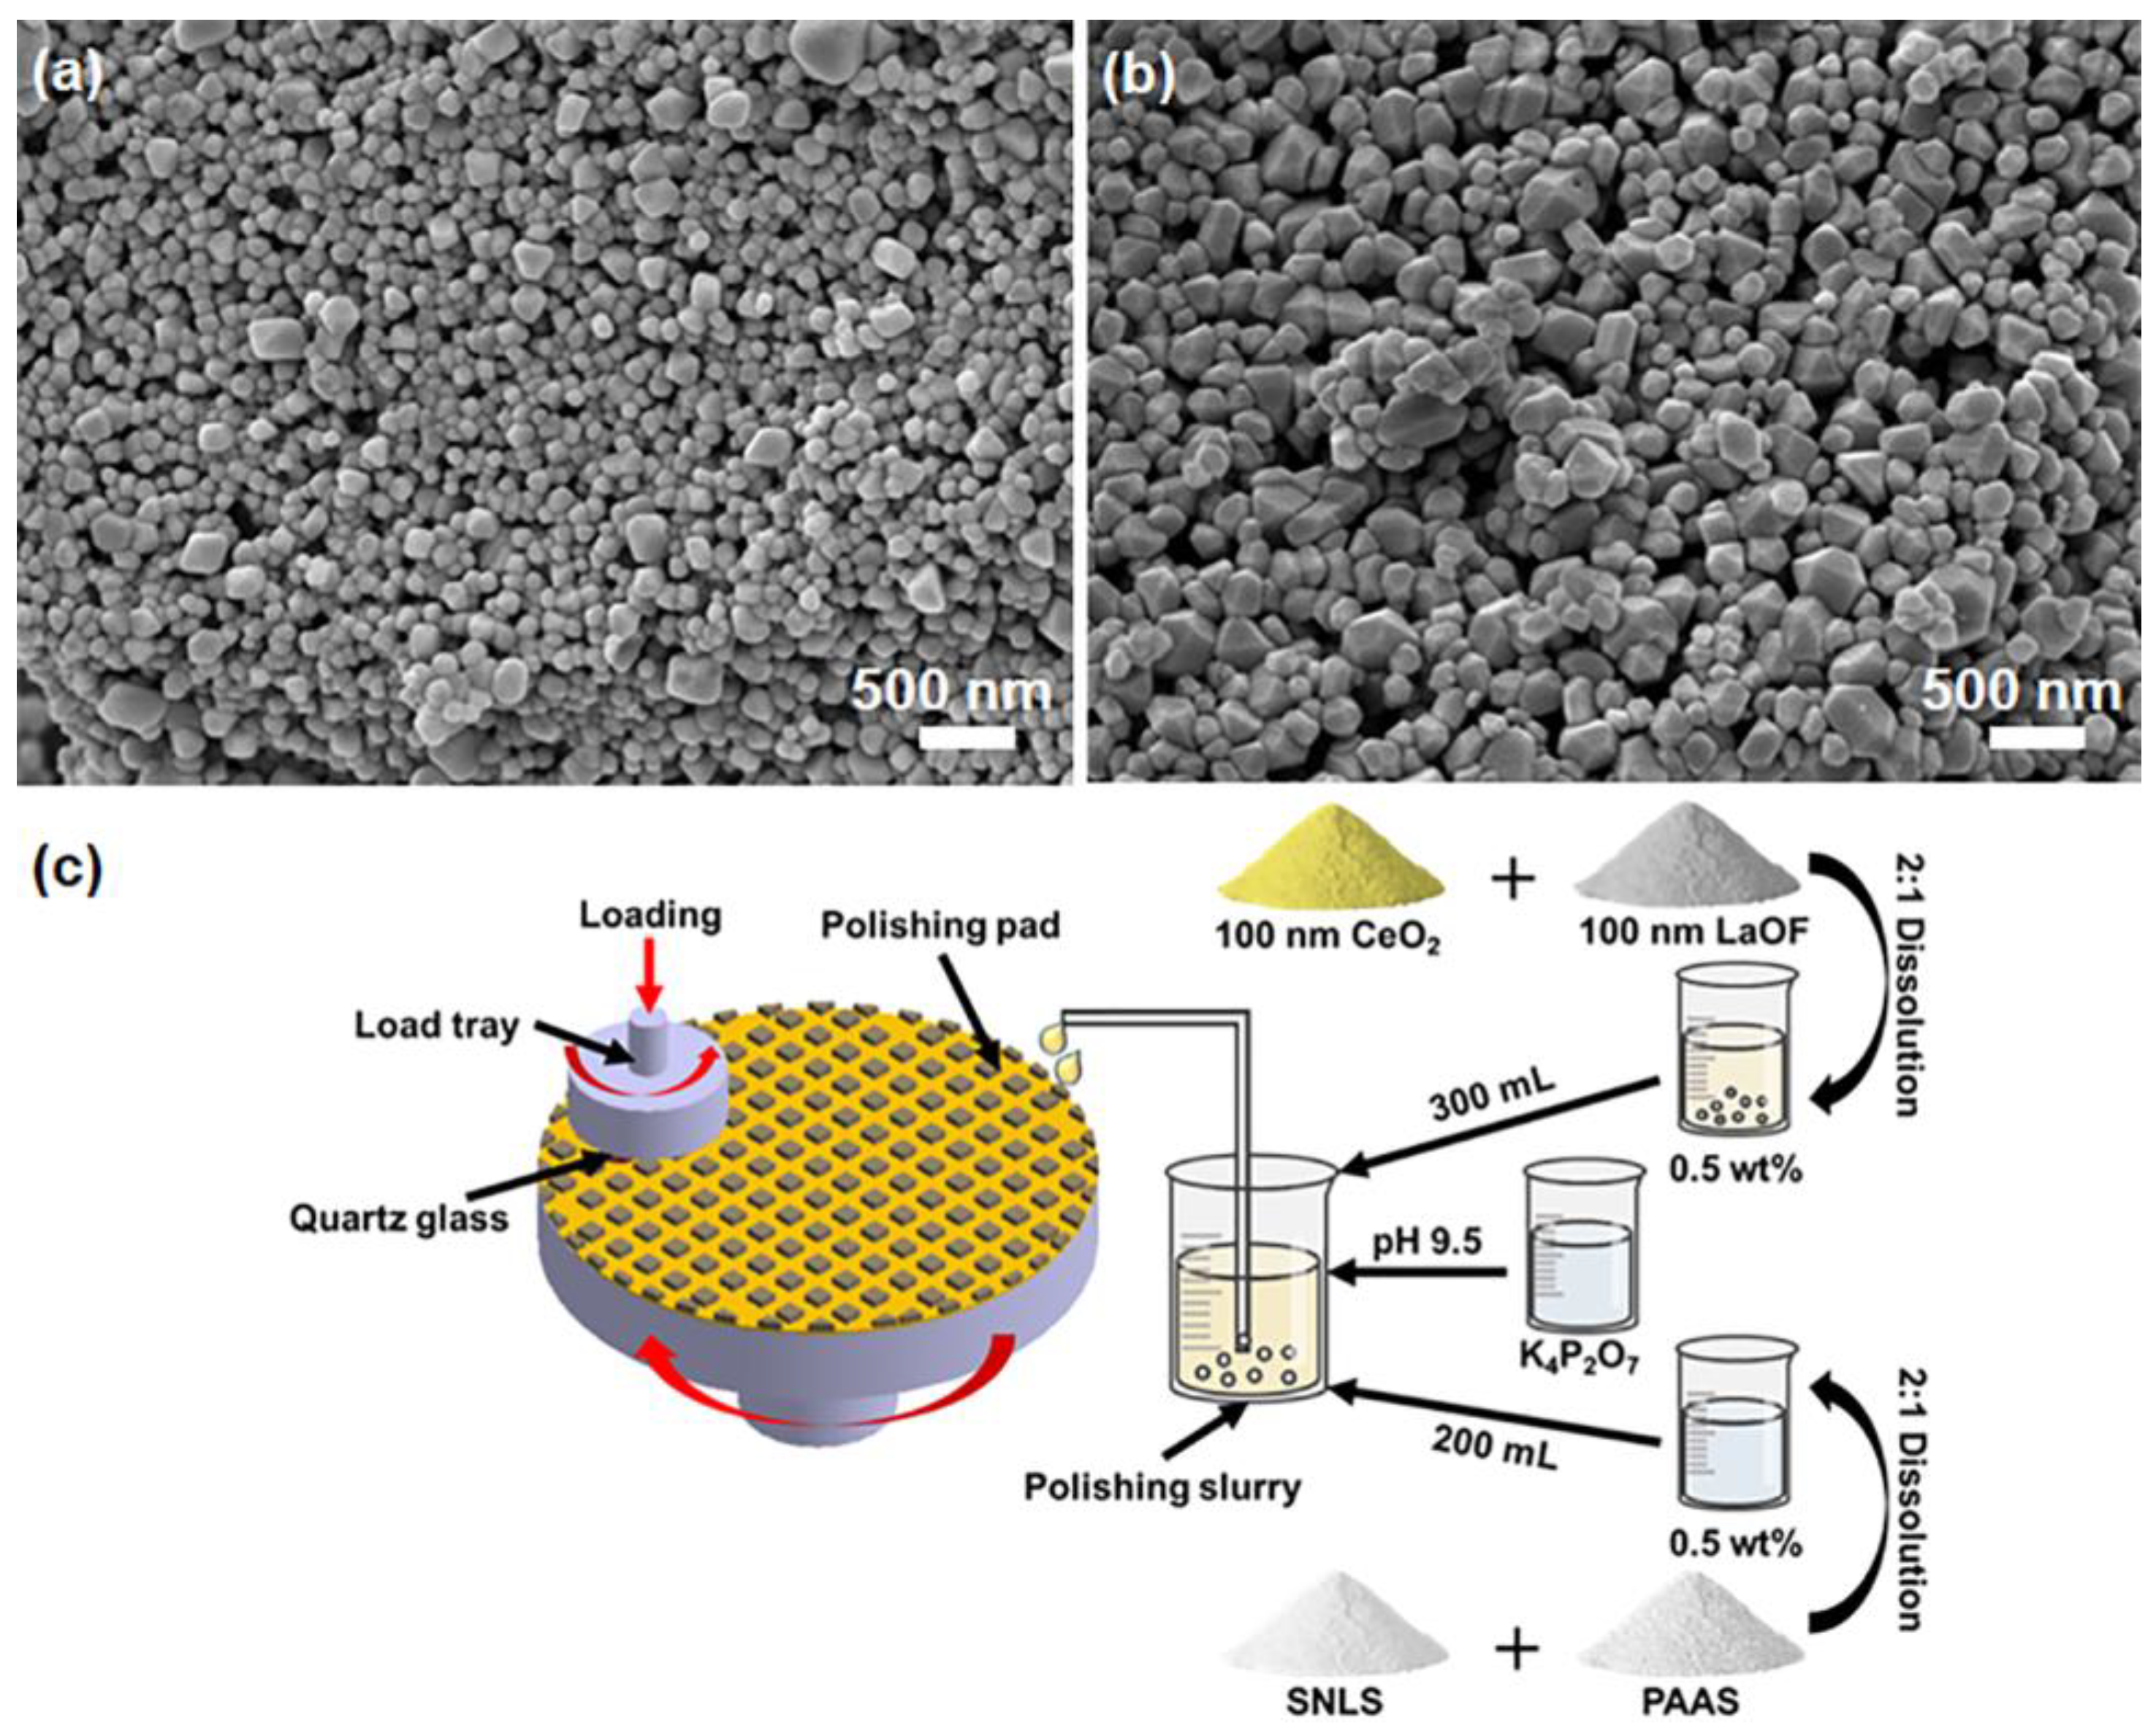
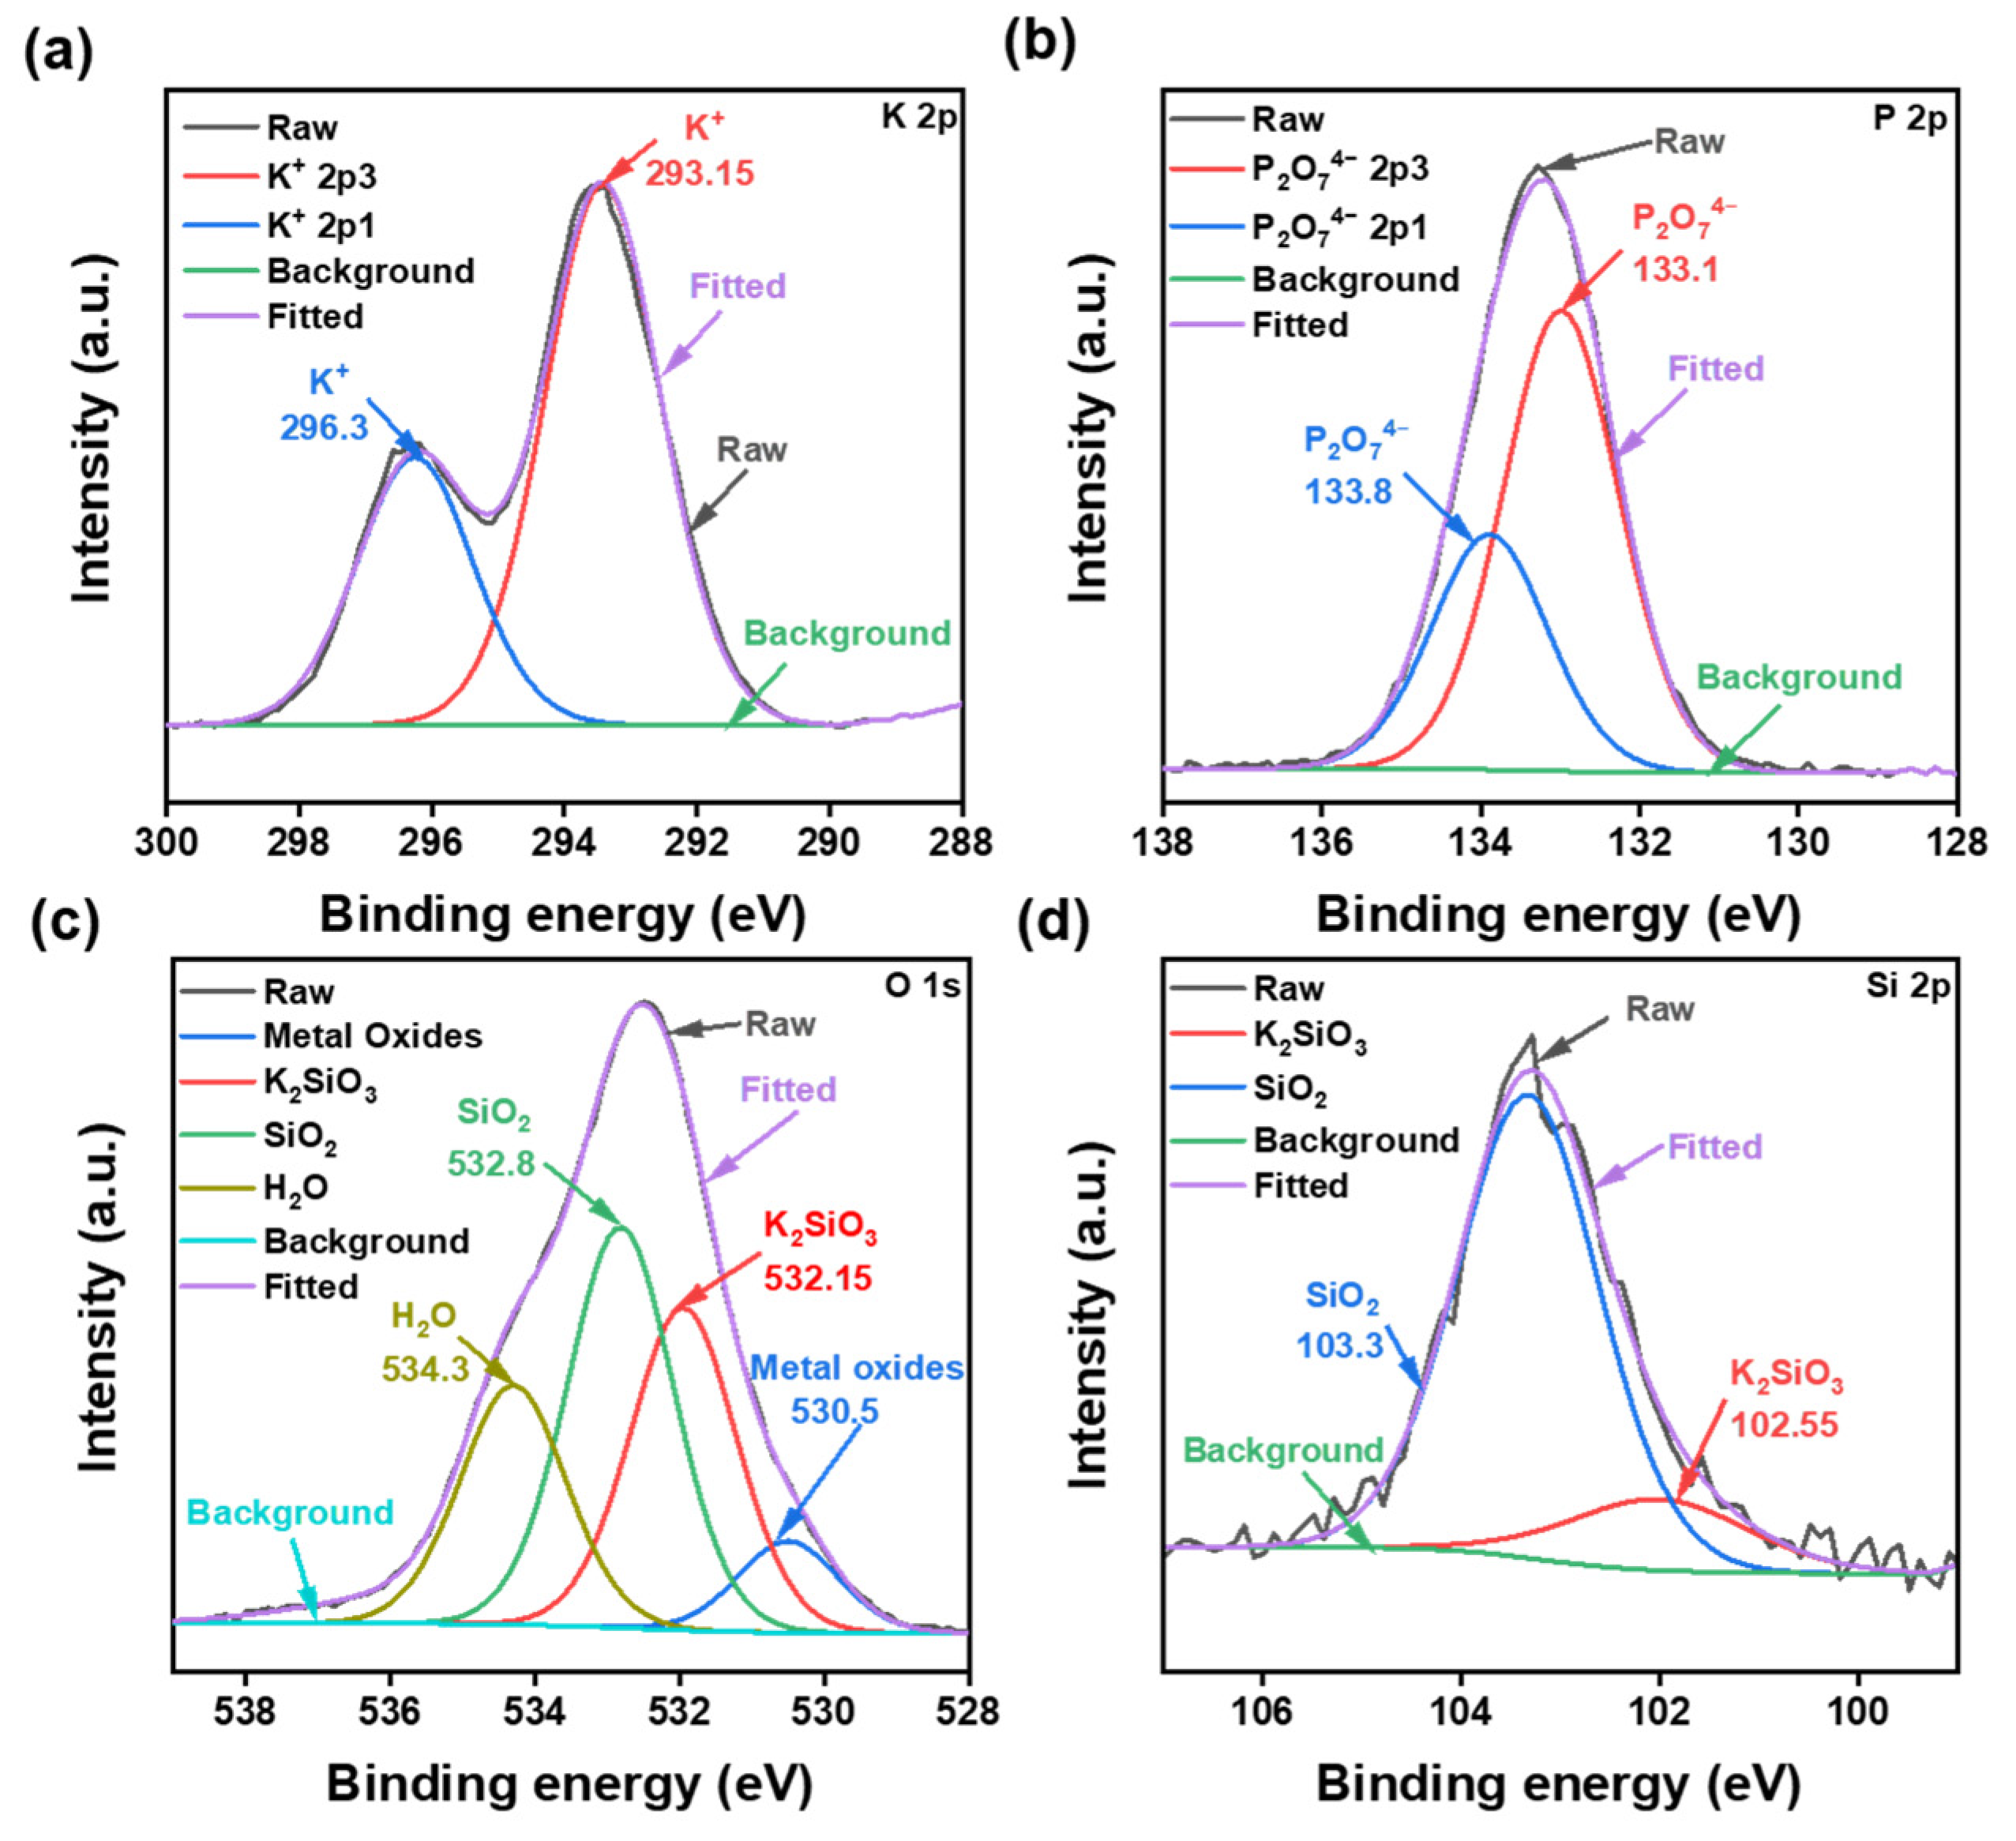
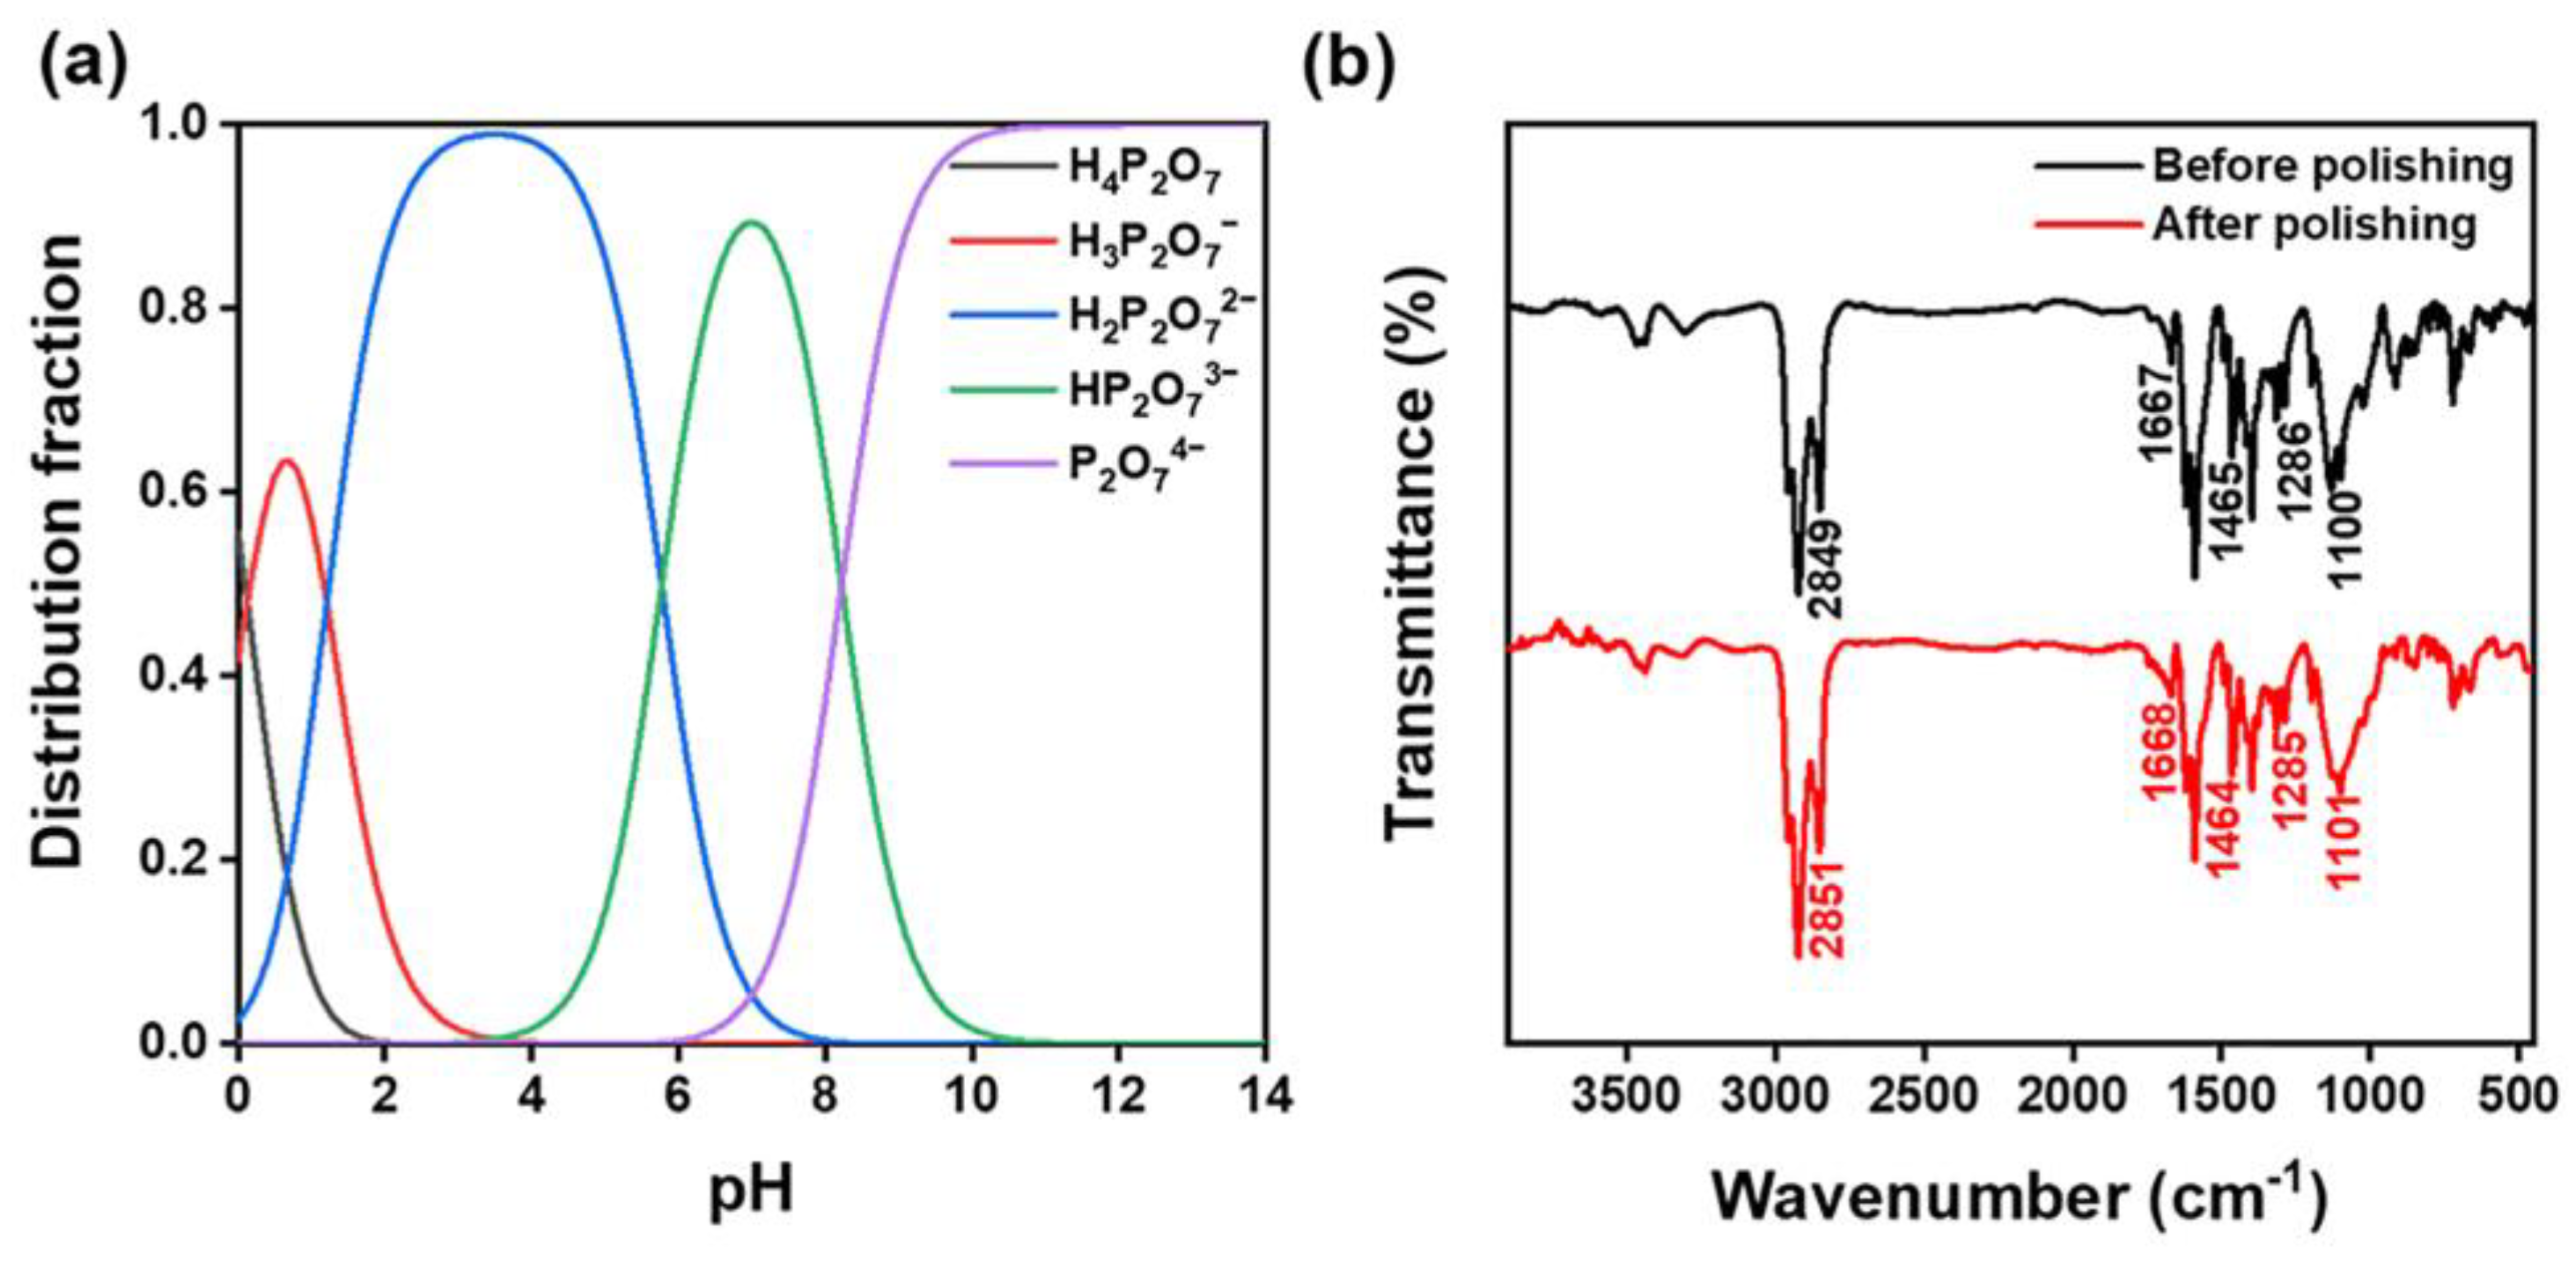
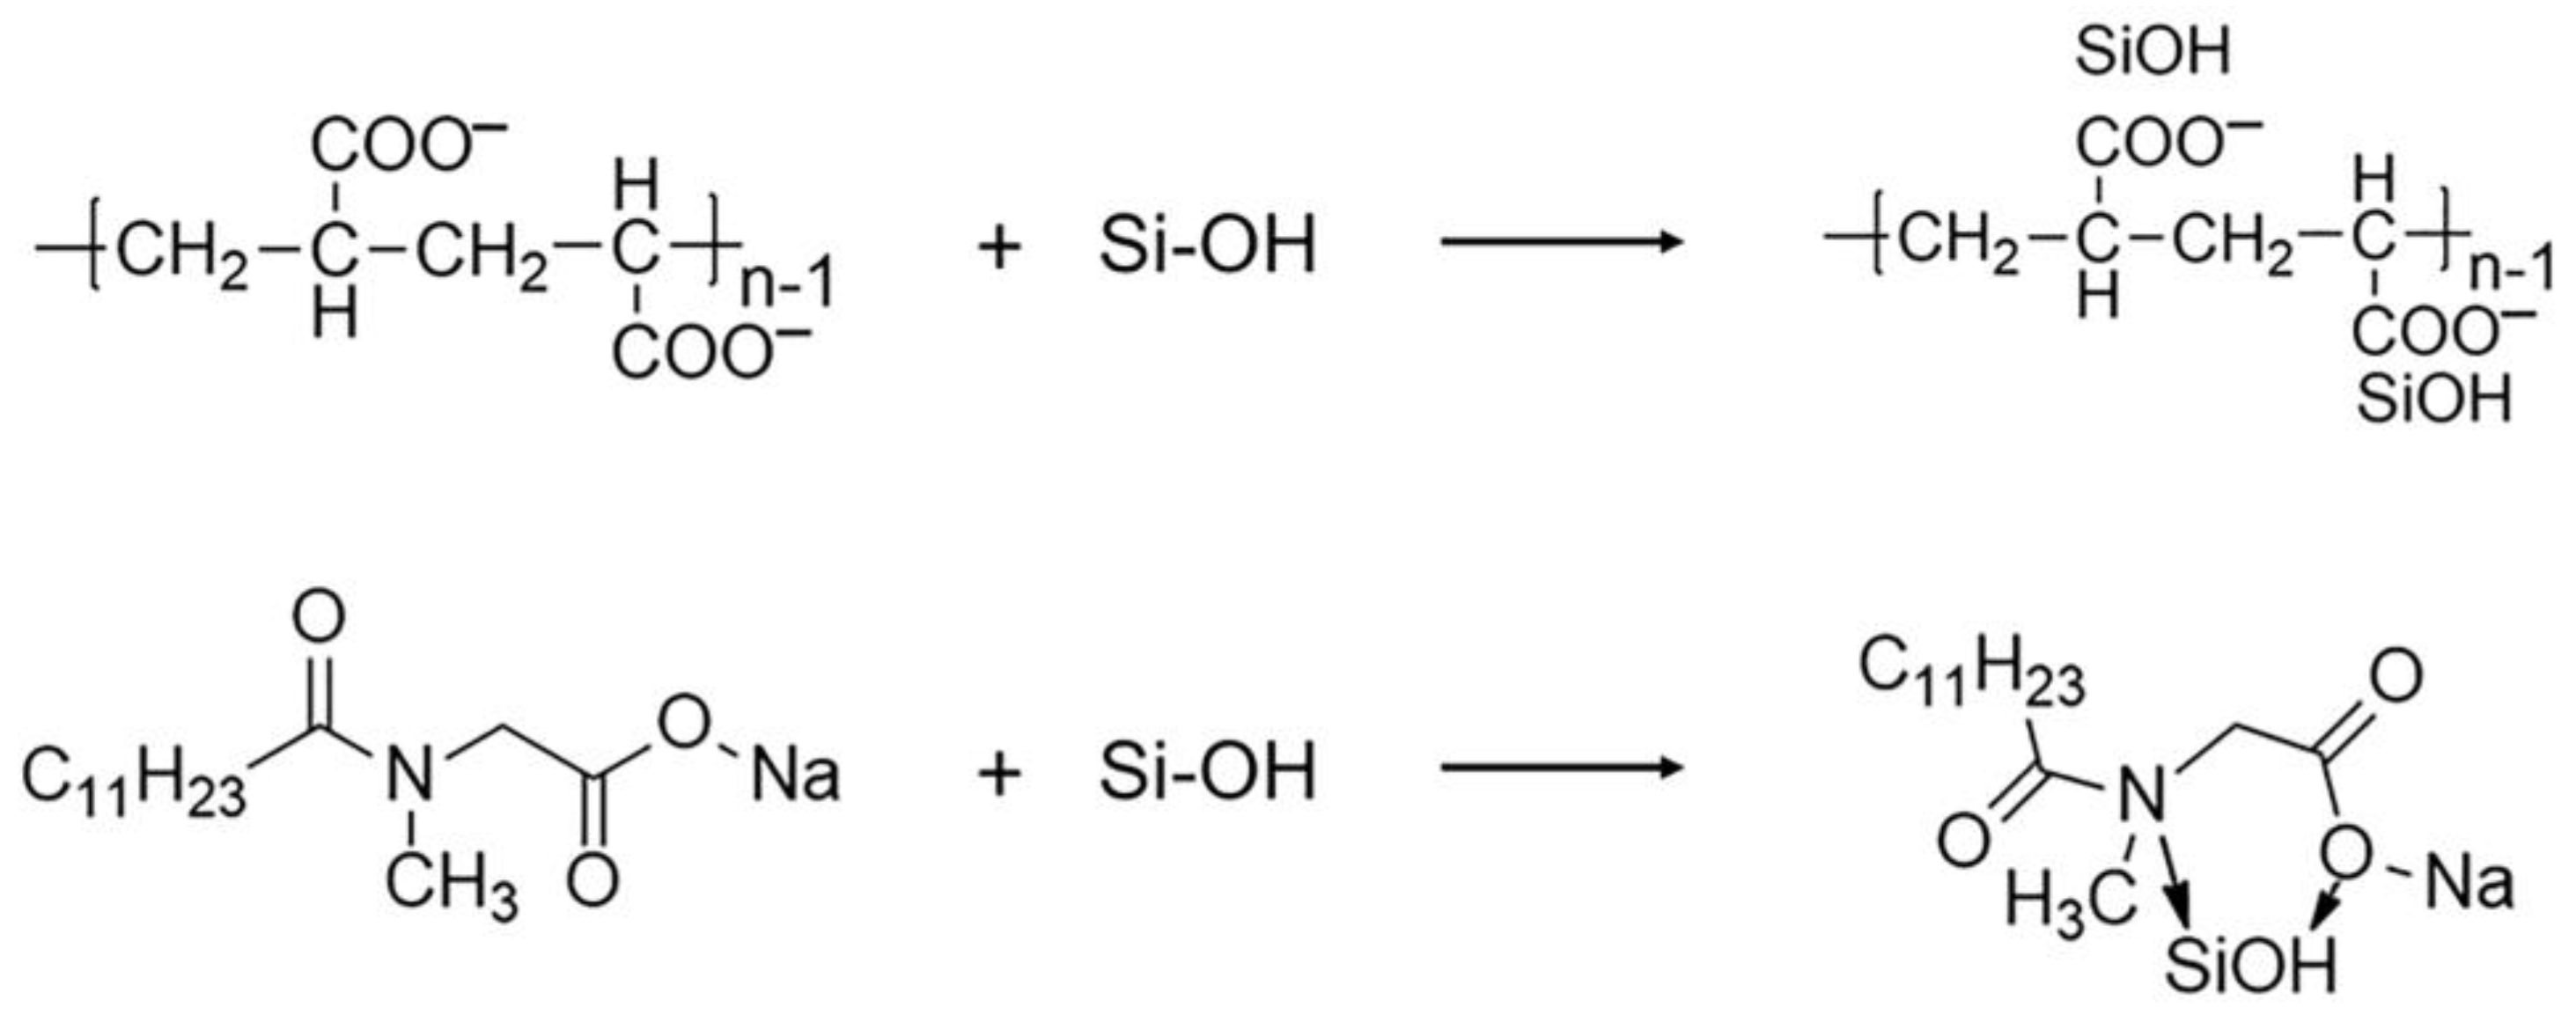
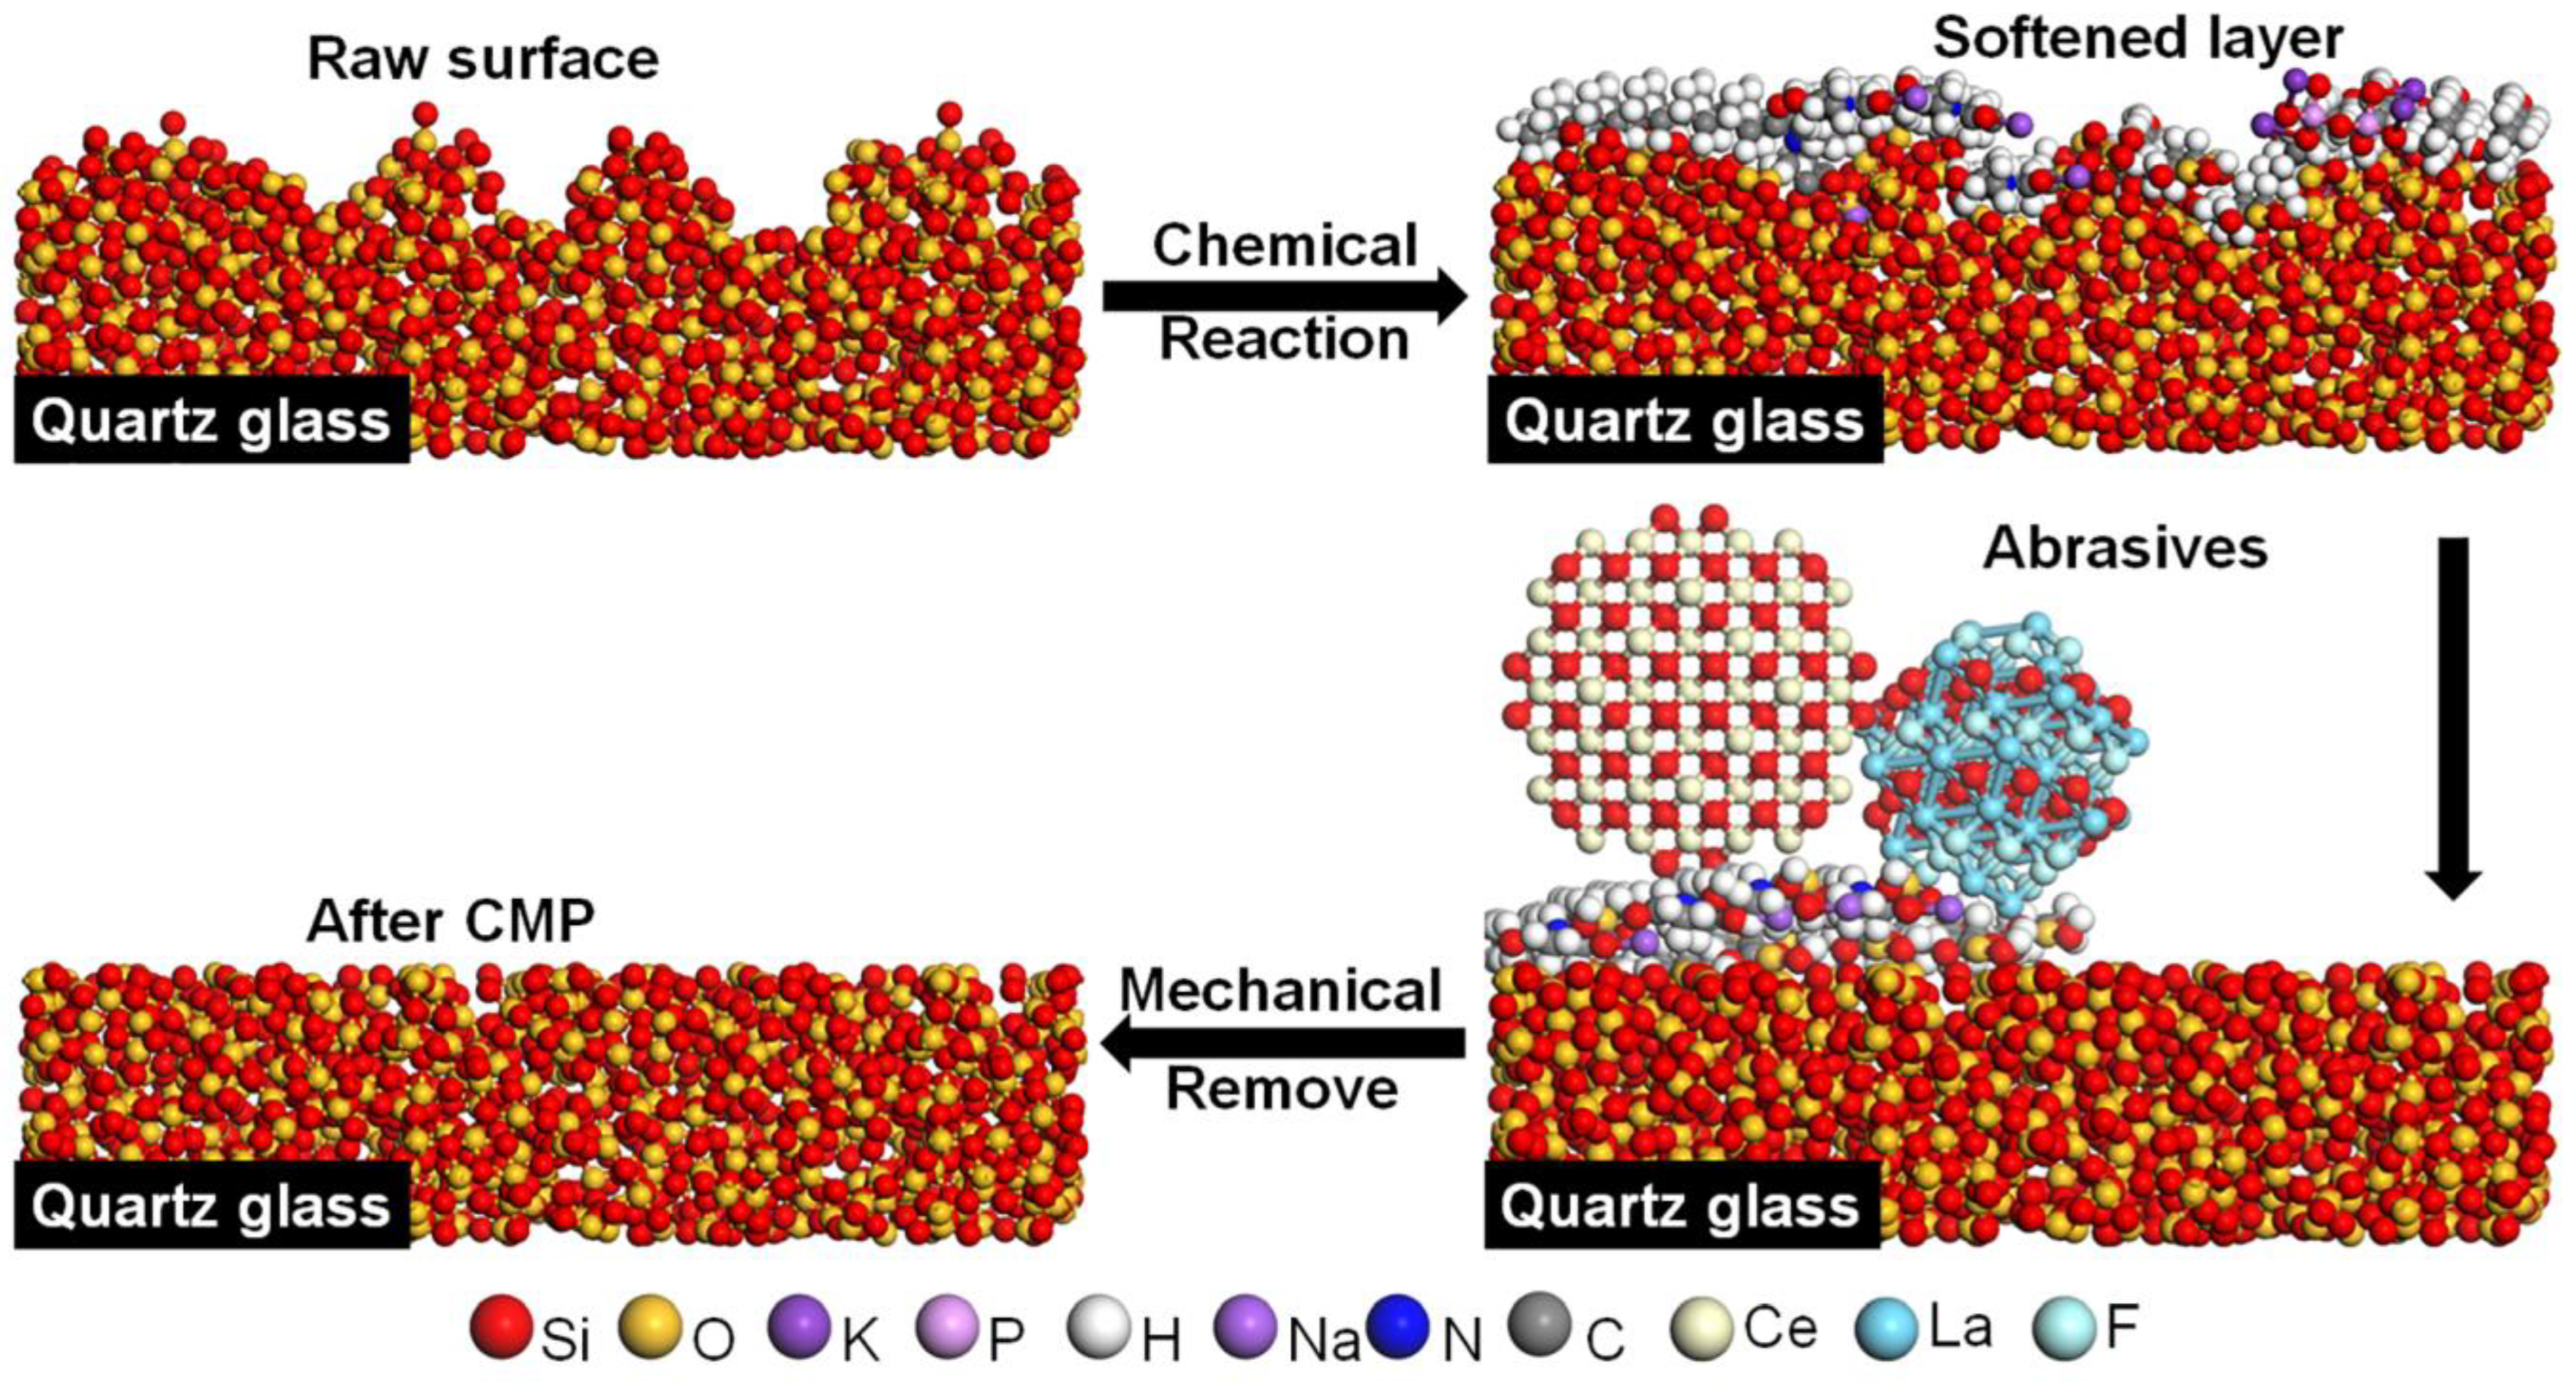
  • XPS and FTIR were used to analyze the polishing mechanism. It was discovered that K4P2O7 continually hydrolyzed in water to release the hydroxyl groups, forming an alkali-polishing environment. Then, SiO2 forms an attenuated layer of Si-OH groups. Due to their high electronegativity, anionic dispersants that are added to the SNLS and PAAS will then form chelate products with them via their polar headgroups. Finally, CeO2 and LaOF abrasives removed the softened layer to obtain quartz glass sample pieces with smooth surfaces.

Author Contributions

Conceptualization, Z.Z. (Zifeng Zhao) and Z.Z. (Zhenyu Zhang); methodology, Z.Z. (Zifeng Zhao); software, H.L., Z.X. and D.L.; validation, Z.Z. (Zifeng Zhao), Z.Z. (Zhenyu Zhang), X.Z., L.L., F.M., H.L., Z.X. and D.L.; formal analysis, Z.Z. (Zifeng Zhao); investigation, Z.Z. (Zifeng Zhao); resources, Z.Z. (Zhenyu Zhang); data curation, Z.Z. (Zifeng Zhao), C.S. and J.F.; writing—original draft preparation, Z.Z. (Zifeng Zhao); writing—review and editing, Z.Z. (Zifeng Zhao), Z.Z. (Zhenyu Zhang), C.S., J.F., F.M. and L.L.; visualization, Z.Z. (Zifeng Zhao); supervision, Z.Z. (Zifeng Zhao), Z.Z. (Zhenyu Zhang) and X.Z.; project administration, Z.Z. (Zhenyu Zhang); funding acquisition, Z.Z. (Zhenyu Zhang) and J.F. All authors have read and agreed to the published version of the manuscript.

Funding

This research was funded by the National Key Research and Development Program of China (2018YFA0703400), the National Natural Science Foundation of China (52142501), the Young Scientists Fund of the National Natural Science Foundation of China (52205447), the Changjiang Scholars Program of Chinese Ministry of Education, the Xinghai Science Funds for Distinguished Young Scholars at Dalian University of Technology, and the Collaborative Innovation Center of Major Machine Manufacturing in Liaoning.

Institutional Review Board Statement

Not applicable.

Informed Consent Statement

Not applicable.

Data Availability Statement

Not applicable.

Acknowledgments

We would want to thank Xin Chen for his help with the experiment design and formal analysis.

Conflicts of Interest

The authors declare no conflict of interest.

Appendix A

Table A1. The orthogonal experimental design and the Sa and MRR results.
No.ABCDEFSaMRR
11(0.25)1(9)1(0.25)1(20)1(60)1(2)1.73273.30
212(9.5)3452(4)0.29138.26
313(10)52(25)43(6)0.48118.96
414(10.2)2(0.35)534(8)0.63168.80
515(10.5)43(30)2(80)5(10)0.5162.70
62(0.5)154(35)3(100)50.42112.53
72222210.38155.94
82345(40)120.39262.04
92413530.4767.52
10253(0.5)14(120)40.45308.66
113(1)14(0.75)25(140)40.39186.48
123215450.35250.79
133333310.41226.67
14345(1)1220.72109.32
153524130.57122.18
164(3)135230.36229.89
174253140.47122.18
184321550.56223.46
194444410.40127.00
204512320.50181.66
215(5)123420.47138.26
225241330.75303.84
235314240.4478.77
245432150.50139.86
255555510.36271.69
Figure A1. Surface morphology of all samples from the orthogonal experiment.
Materials 16 01148 g0a1
Figure A2. Optical microscopic images of the samples from the orthogonal experiment.
Materials 16 01148 g0a2
Table A2. Sa orthogonal data analysis.
FactorsSa (nm)
ABCDEF
kj10.730.670.700.840.730.65
kj20.420.450.520.450.480.47
kj30.490.450.400.460.540.53
kj40.460.540.490.420.430.47
kj50.500.470.490.420.410.47
Rj0.310.230.290.420.320.19
Factor
Priorities
D > E > A > C > B > F
Superior levelA2 B2 C3 D5 E5 F5
Table A3. MRR orthogonal data analysis.
FactorsMRR (nm/min)
ABCDEF
kj1152.40188.09170.41243.72183.91210.92
kj2181.34194.20161.73156.58127.32165.91
kj3179.09181.98208.67123.47198.70168.48
kj4176.84122.50188.41115.75188.73172.98
kj5186.48189.38146.94236.64177.48157.87
Rj34.0871.7061.73127.9771.3853.05
Factor
Priorities
D > B > E > C > F > A
Superior levelA5 B2 C3 D1 E3 F1

References

  1. Kumar, A.; Marcolli, C.; Peter, T. Ice nucleation activity of silicates and aluminosilicates in pure water and aqueous solutions–Part 2: Quartz and amorphous silica. Atmos. Chem. Phys. 2019, 19, 6035–6058. [Google Scholar] [CrossRef] [Green Version]
  2. Krishnan, M.; Nalaskowski, J.W.; Cook, L.M. Chemical Mechanical Planarization: Slurry Chemistry, Materials, and Mechanisms. Chem. Rev. 2010, 110, 178–204. [Google Scholar] [CrossRef]
  3. Rampf, M.; Fisch, M.; Helsch, G.; Deubener, J.; Ritzberger, C.; Hland, W.; Dittmer, M. Quartz-containing glass-ceramics in the SiO2-Li2O-K2O-MgO-CaO-Al2O3-P2O5 system. Int. J. Appl. Glass Sci. 2019, 10, 330–338. [Google Scholar] [CrossRef]
  4. Suratwala, T.; Steele, R.; Feit, M.D.; Wong, L.; Miller, P.; Menapace, J.; Davis, P. Effect of rogue particles on the sub-surface damage of fused silica during grinding/polishing. J. Non-Cryst. Solids 2008, 354, 2023–2037. [Google Scholar] [CrossRef] [Green Version]
  5. Yang, X.-l.; Su, J. Progress of magnetorheological finishing. J. Wuhan Univ. Technol. 2010, 32, 136–139. [Google Scholar]
  6. Xiu, S.C.; Wang, R.S.; Sun, B.W.; Ma, L.; Song, W.L. Preparation and experiment of magnetorheological polishing fluid in reciprocating magnetorheological polishing process. J. Intell. Mater. Syst. Struct. 2018, 29, 125–136. [Google Scholar] [CrossRef] [Green Version]
  7. Fang, H.; Guo, p.; Yu, J. Research on material removal mechanism of fluid jet polishing. Opt. Technol. 2004, 30, 248–250. [Google Scholar]
  8. Lu, Y.; Xie, X.H.; Zhou, L. Design and performance analysis of an ultraprecision ion beam polishing tool. Appl. Opt. 2016, 55, 1544–1550. [Google Scholar] [CrossRef]
  9. Zheng, G.C.; Chen, Q.C.; Nie, J.W.; Li, M.J.; Chen, M.Y. Characterization of plasma polished quartz glass. Vacuum. 2020, 57, 72–76. [Google Scholar]
  10. Zhang, K.-L.; Song, Z.-T.; Zhang, J.-X.; Tan, B.-M.; Liu, Y.-L. Study on preparation and application of silica sol nano-abrasive with large particle for CMP of dielectric in ULSI. Chin. J. Electron Devices 2004, 27, 556–563. [Google Scholar]
  11. Xiaolan, S.; Yukun, L.I.; Nan, J.; Yixin, Q.U.; Guanzhou, O.I.U. Recent development of chemical mechanical polishing. Chem. Ind. Eng. Prog. 2008, 27, 26–31. [Google Scholar]
  12. Seo, E.B.; Park, J.G.; Bae, J.Y.; Park, J.H. Highly Selective Polishing Rate Between a Tungsten Film and a Silicon-Dioxide Film by Using a Malic-Acid Selectivity Agent in Tungsten-Film Chemical-Mechanical Planarization. J. Korean Phys. Soc. 2020, 76, 1127–1132. [Google Scholar] [CrossRef]
  13. Hoshino, T.; Kurata, Y.; Terasaki, Y.; Susa, K. Mechanism of polishing of SiO2 films by CeO2 particles. J. Non-Cryst. Solids 2001, 283, 129–136. [Google Scholar] [CrossRef]
  14. Evans, C.J.; Paul, E.; Dornfeld, D.; Lucca, D.A.; Byrne, G.; Tricard, M.; Klocke, F.; Dambon, O.; Mullany, B.A. Material Removal Mechanisms in Lapping and Polishing. CIRP Ann. 2003, 52, 611–633. [Google Scholar] [CrossRef] [Green Version]
  15. Wakamatsu, K.; Kurokawa, S.; Toyama, T.; Hayashi, T. CMP characteristics of quartz glass substrate by aggregated colloidal ceria slurry. Precis. Eng.-J. Int. Soc. Precis. Eng. Nanotechnol. 2019, 60, 458–464. [Google Scholar] [CrossRef]
  16. Yuan, X.C.; Li, Q.Z.; Yang, S.Y. Development of polishing solution for ultrasonic fine atomization polishing of quartz glass. Lubr. Seal. 2021, 46, 103–108. [Google Scholar]
  17. Shi, X.L.; Chen, G.P.; Xu, L.; Kang, C.X.; Luo, G.H.; Luo, H.M.; Zhou, Y.; Dargusch, M.S.; Pan, G.S. Achieving ultralow surface roughness and high material removal rate in fused silica via a novel acid SiO2 slurry and its chemical-mechanical polishing mechanism. Appl. Surf. Sci. 2020, 500, 8. [Google Scholar] [CrossRef]
  18. Tang, Y.T.; Yang, C.C. Study of chemical polishing process of quartz glass sheet. Opt. Optoelectron. Technol. 2022, 20, 159–164. [Google Scholar]
  19. Guang-Lin, C.; De-Fu, L.; Tao, C.; Yi-Xi, S.J.S.T. Dispersion Stability of CeO2 Nano Particles Polishing Agent and Its Properties in Chemical Mechanical Polishing Process. Surf. Technol. 2016, 45, 187–193. [Google Scholar]
  20. Pei, W.; Zhao, D.; Chen, X.; Wang, X.; Yang, X.; Wang, J.; Li, Z.; Zhou, L. Evolution of the phases and the polishing performance of ceria-based compounds synthesized by a facile calcination method. RSC Adv. 2019, 9, 26996–27001. [Google Scholar] [CrossRef] [Green Version]
  21. Shinn, D.B.; Eick, H.A. Phase analyses of lanthanide oxide fluorides. Inorg. Chem. 1969, 8, 232–235. [Google Scholar] [CrossRef]
  22. Niihara, K.; Yajima, S. Studies of Rare Earth Oxyfluorides in the High-temperature Region. Bull. Chem. Soc. Jpn. 1972, 45, 20–23. [Google Scholar] [CrossRef] [Green Version]
  23. Guo, X.; Yuan, S.; Huang, J.; Chen, C.; Kang, R.; Jin, Z.; Guo, D. Effects of pressure and slurry on removal mechanism during the chemical mechanical polishing of quartz glass using ReaxFF MD. Appl. Surf. Sci. 2020, 505, 144610. [Google Scholar] [CrossRef]
  24. Basim, G.B.; Adler, J.J. Effect of Particle Size of Chemical Mechanical Polishing Slurries for Enhanced Polishing with Minimal Defects. J. Electrochem. Soc. 2000, 147, 3523. [Google Scholar] [CrossRef]
  25. Ramarajan, S.; Li, Y.; Hariharaputhiran, M.; Her, Y.; Babu, S.V. Effect of pH and Ionic Strength on Chemical Mechanical Polishing of Tantalum. J. Gerontol. 2000, 56, M328–M340. [Google Scholar] [CrossRef]
  26. Lin, Z.C.; Ho, C.Y. Analysis and application of grey relation and ANOVA in chemical-mechanical polishing process parameters. Int. J. Adv. Manuf. Technol. 2003, 21, 10–14. [Google Scholar]
  27. Luo, J.F.; Dornfeld, D.A. Effects of abrasive size distribution in chemical mechanical planarization: Modeling and verification. IEEE Trans. Semicond. Manuf. 2003, 16, 469–476. [Google Scholar]
  28. Park, K.H.; Kim, H.J.; Chang, O.M.; Jeong, H.D. Effects of pad properties on material removal in chemical mechanical polishing. J. Mater. Process. Technol. 2007, 187, 73–76. [Google Scholar] [CrossRef]
  29. Guo, X.G.; Huang, J.X.; Yuan, S.; Chen, C.; Jin, Z.J.; Kang, R.K.; Guo, D.M. Effect of surface hydroxylation on ultra-precision machining of quartz glass. Appl. Surf. Sci. 2020, 501, 10. [Google Scholar] [CrossRef]
  30. Zhai, J.; Ni, Z.F.; Li, Q.Z. An Alkaline SiO2 Slurry for Fine Atomizing CMP. In Proceedings of the International Conference on Mechanics, Solid State and Engineering Materials (ICMSSEM), Hangzhou, China, 1–2 September 2011; Trans Tech Publications Ltd.: Hangzhou, China, 2011; pp. 258–261. [Google Scholar]
  31. Cao, M.C.; Zhao, H.Y.; Xie, R.Q.; Zhao, L.Y.; Zhao, S.J.; Bai, J.F. Multiparameter optimization design of chemical mechanical polishing for planar optics. Int. J. Adv. Manuf. Technol. 2021, 113, 2153–2162. [Google Scholar] [CrossRef]
  32. Zhou, Z.Z.; Yuan, J.L.; Lv, B.H.; Zheng, J.J. Study on Pad Conditioning Parameters in Silicon Wafer CMP process. In Proceedings of the 14th Conference of Abrasive Technology in China, Nanjing, China, 26–28 October 2007; Trans Tech Publications Ltd.: Nanjing, China, 2008; pp. 309–313. [Google Scholar]
  33. Lv, W.; Wu, Y.S.; Shi, Y.C.; Li, J.G. Effect of ammonium polyacrylate adsorption on the stability and rheology of TiO2 suspensions. J. Shandong Univ. 2003, 4, 353–356. [Google Scholar]
  34. Tsai, M.S. The study of formation colloidal silica via sodium silicate. Mater. Sci. Eng. B 2004, 106, 52–55. [Google Scholar] [CrossRef]
  35. Li, D.H.; Guo, L.C. Study on the dispersion stability of ultrafine alumina aqueous suspensions. Silic. Bull. 2005, 1, 36–40. [Google Scholar]
  36. Song, X.L.; Wu, X.L.; Qu, P.; Wang, H.B.; Qiu, G.Z. Study on the factors influencing the dispersion stability performance of nano-SiO2 and the mechanism of action. Silic. Bull. 2005, 1, 3–7. [Google Scholar]
  37. Zhou, X.M.; Li, B.W.; Li, Y.X.; Xu, X.L. Study on surface electrical properties and suspension dispersion stability of high cerium polishing powder. Rare Earths 2007, 1, 12–16. [Google Scholar]
  38. Hua, C.X. Study on the Flow Characteristics of Polishing Solution in Chemical Mechanical Polishing. Master’s Thesis, Nanjing University of Aeronautics and Astronautics, Nanjing, China, 2017. [Google Scholar]
  39. Li, H.; Li, S.F. Synthesis study of sodium N-lauroyl sarcosinate. J. Xiamen Univ. 2005, 3, 386–389. [Google Scholar]
  40. Li, S.F.; Li, H. Corrosion inhibition properties of sodium N-lauroyl sarcosinate and its complexes. Corros. Sci. Prot. Technol. 2008, 4, 289–291. [Google Scholar]
  41. Cui, J. Synthesis and Properties of Sodium N-Lauroyl Sarcosinate. Master’s Thesis, Jiangnan University, Wuxi, China, 2018. [Google Scholar]
  42. Tao, L.M.; Wang, J.J.; Zhang, W.J.; Jiang, Z.Y.; Sun, W.; Gao, Z.Y.; Wang, C.; Wu, S.H.; Hu, Y. Selective separation of fluorite and calcite by sodium lauroyl sarcosinate and its mechanism of action. Chin. J. Nonferrous Met. 2022, 32, 1810–1820. [Google Scholar]
  43. Niu, Y.X.; Wang, Y.; Wang, E.D.; Fu, J.F. Effect of sodium polyacrylate on the stability performance of nano-SiO2 dispersion. J. Northeast. Univ. 2008, 11, 1641–1644. [Google Scholar]
  44. Liu, Y.L. Effect of dispersant on the stability of ultrafine CeO2 polishing solution. Diam. Abras. Eng. 2011, 31, 59–62. [Google Scholar]
  45. Wang, W.; Zhang, B.; Shi, Y.; Zhou, D.; Wang, R. Improvement in dispersion stability of alumina suspensions and corresponding chemical mechanical polishing performance. Appl. Surf. Sci. 2022, 597, 153703. [Google Scholar] [CrossRef]
  46. Chu, Y. Production and analytical studies of potassium pyrophosphate for foodstuffs. China Water Transp. 2007, 12, 85–87. [Google Scholar]
  47. Wang, M.M.; Lv, W.Y.; Yao, K.; Ding, L.; Wang, Y.H.; Wang, P.P. Leaching remediation of copper-contaminated soil with potassium pyrophosphate. J. Environ. Eng. 2017, 11, 1211–1216. [Google Scholar]
  48. de Levie, R. The Henderson-Hasselbalch equation: Its history and limitations. J. Chem. Educ. 2003, 80, 146. [Google Scholar] [CrossRef] [Green Version]
  49. Morgan, W.E.; Van Wazer, J.R. Binding energy shifts in the x-ray photoelectron spectra of a series of related Group IVa compounds. J. Phys. Chem. 1973, 77, 964–969. [Google Scholar] [CrossRef]
  50. Andersson, S.L.T.; Scurrell, M.S. Infrared And Esca Studies Of A Heterogenized Rhodium Carbonylation Catalyst. J. Catal. 1979, 59, 340–356. [Google Scholar]
  51. Chen, J.R.; Chao, H.Y.; Lin, Y.L.; Yang, I.J.; Oung, J.C.; Pan, F.M. Studies on Carbon-Steel Corrosion in Molybdate and Silicate Solutions as Corrosion-Inhibitors. Surf. Sci. 1991, 247, 352–359. [Google Scholar] [CrossRef]
  52. Williams, C.T.; Takoudis, C.G.; Weaver, M.J. Methanol oxidation on rhodium as probed by surface-enhanced Raman and mass spectroscopies: Adsorbate stability, reactivity, and catalytic relevance. J. Phys. Chem. B 1998, 102, 406–416. [Google Scholar] [CrossRef]
  53. Cardinaud, C.; Turban, G. Mechanistic Studies of the Initial-Stages of Etching of Si and SiO2 in A Chf3 Plasma. Appl. Surf. Sci. 1990, 45, 109–120. [Google Scholar] [CrossRef]
  54. Cros, A.; Saoudi, R.; Hollinger, G.; Hewett, C.A.; Lau, S.S. An x-ray photoemission spectroscopy investigation of oxides grown on Au x Si 1 x layers. J. Appl. Phys. 1990, 67, 1826–1830. [Google Scholar] [CrossRef]
  55. Zhang, L.; Yan, C.W.; Qu, Q.; Tong, J.Y.; Cao, C.N. Study on the protection of TiO2-K2SiO3 inorganic coatings for Ag used in space. Acta Chim. Sin. 2003, 61, 1369–1374. [Google Scholar]
Figure 1. Surface morphology of quartz glass (a,b) before and (c,d) after grinding.
Materials 16 01148 g001
Figure 2. SEM image of (a) cerium oxide abrasive; (b) lanthanum fluoride oxide abrasive; (c) the configuration of the polishing slurry and the polishing process schematic.
Materials 16 01148 g002
Figure 3. (a,b) Surface defects like scratches and pits; (c,d) Orange peel defects due to excessive corrosion.
Materials 16 01148 g003
Figure 4. Effect of (a) abrasive concentration, (b) pH, (c) dispersant concentration, (d) polishing pressure, (e) polishing speed, and (f) polishing slurry flow rate on Sa and MRR in orthogonal experiments.
Materials 16 01148 g004
Figure 5. (ac) The surface morphology and surface roughness on three random spots; and (d) an optical image of the polished sample.
Materials 16 01148 g005
Figure 6. TEM cross-section of quartz glass (a) before polishing; (b) after polishing.
Materials 16 01148 g006
Figure 7. (a,b) Comparison of particle size of polishing slurry before and after dispersion; (c) comparison of zeta potential of polishing slurry before and after dispersion; (d) comparison of UV absorbance of polishing slurry before and after dispersion.
Materials 16 01148 g007
Figure 8. XPS fine spectra of quartz glass after immersion test. (a) K 2p, containing two peaks near 296.3 and 293.15 for K+; (b) P 2p, containing two peaks near 133.1 and 133.8 for P2O74−; (c) O 1s, containing four peaks near 532.8 for SiO2, 532.15 for K2SiO3, 534.3 for H2O and 530.5 for Metal oxides; (d) Si 2p, containing two peaks of 103.3 for SiO2 and 102.55 for K2SiO3.
Materials 16 01148 g008
Figure 9. (a) Potassium pyrophosphate ion morphology distribution, (b) FTIR result of the slurry before and after polishing.
Materials 16 01148 g009
Figure 10. Dispersant chelation reaction with softened layer.
Materials 16 01148 g010
Figure 11. Chemical mechanical polishing mechanism of the slurry in this work.
Materials 16 01148 g011
Table 1. L56 orthogonal experiment factor level table.
No.FactorsLevels
12335
AAbrasive concentration (wt%)0.250.5135
BPolishing solution pH value99.51010.210.5
CDispersant concentration (wt%)0.250.350.50.751
DPolishing pressure (kPa)2025303540
EPolishing speed (rpm)6080100120140
FPolishing fluid flow rate (mL/min)246810
Table 2. Comparison of the viscosity of the polishing slurry before and after dispersion.
IndexBefore the DispersionAfter the Dispersion
Viscosity (mPa·S)1.135.06
Rotor (#)00
Rotational speed (rpm)6060
Torque (%)11.350.6
Disclaimer/Publisher’s Note: The statements, opinions and data contained in all publications are solely those of the individual author(s) and contributor(s) and not of MDPI and/or the editor(s). MDPI and/or the editor(s) disclaim responsibility for any injury to people or property resulting from any ideas, methods, instructions or products referred to in the content.

