Abstract
AlSi10Mg has a good forming ability and has been widely accepted as an optimal material for selective laser melting (SLM). However, the strength and elongation of unmodified AlSi10Mg are insufficient, which limits its application in the space industry. In this paper, yttrium oxide (Y2O3) nanoparticles modified AlSi10Mg composites that were manufactured using SLM. The effects of Y2O3 nanoparticles (0~2 wt.% addition) on the microstructure and mechanical properties of AlSi10Mg alloys were investigated. An ultimate tensile strength of 500.3 MPa, a yield strength of 322.3 MPa, an elongation of 9.7%, a good friction coefficient of 0.43, and a wear rate of (3.40 ± 0.09) ×10−4 mm3·N−1·m−1 were obtained with the addition of 0.5 wt.% Y2O3 nanoparticles, and all these parameters were higher than those of the SLMed AlSi10Mg alloy. The microhardness of the composite with 1.0 wt.% Y2O3 reached 145.6 HV0.1, which is an increase of approximately 22% compared to the unreinforced AlSi10Mg. The improvement of tensile properties can mainly be attributed to Orowan strengthening, fine grain strengthening, and load-bearing strengthening. The results show that adding an appropriate amount of Y2O3 nanoparticles can significantly improve the properties of the SLMed AlSi10Mg alloy.
1. Introduction
Additive manufacturing is a potentially disruptive technology across multiple industries, including automotive, biomedical, and aerospace [1]. The principle of additive manufacturing is to accumulate materials point by point on the surfaces and solidify them into bodies layer by layer [2], enabling the formation of complex parts [3] and increasing product customization [4]. As a dominant AM technology, SLM is highly appreciated for its relatively low surface roughness, high geometric accuracy, and good mechanical properties [5,6]. Based on previously established CAD data, SLM selectively melts a fixed-thickness powder layer on the solidified powder bed, and quickly, layer by layer, produces three-dimensional parts with complex shapes [7,8].
AlSi10Mg belongs to the Al-Si series of aluminum alloys. It has many advantages, such as high specific strength, good thermal conductivity, small thermal expansion coefficient, and excellent casting and welding performance, and it is widely applied in the military, automotive, aerospace, and medical industries [9,10,11]. Although Al-Si alloys have a good forming ability, their strength and elongation are insufficient, which limits their application in the space industry. Therefore, researchers often introduce nanoparticles to obtain a better performance from Al-Si alloys.
Currently, there is much research on preparing AlSi10Mg alloys by adding nanoparticles, such as LaB6 [12], CNTs [13,14], GNPs [15], TiC [16], TiB2 [17], SiC [18], Al2O3 [19], AlN [20], BN [21], and TiN [22], to improve mechanical properties. Tan et al. [12] used an edge-to-edge model (E2EM) to study the crystallographic match between Al and other nanoparticles. It was discovered that LaB6 is a good candidate as a grain-refining agent, and the LaB6-doped AlSi10Mg alloy showed excellent isotropic mechanical properties due to grain refinement and homogeneous organization. Jiang et al. [13] fabricated AlSi10Mg composites containing 1 wt.% CNTs by the ultrasonic stirring of a solution, and the tensile strength reached 499 MPa, which was about 20% higher than without CNTs addition. Tiwari et al. [15] added GNPs to AlSi10Mg powder, and the tensile strength and microhardness of the composites increased by ~20% and ~30%, respectively, by SLM. Gu et al. [16] produced a new ring-mounted TiC at the grain boundaries of the matrix by SLM, and the tensile strength was enhanced without reducing the elongation. However, very little research was reported on the overall improvement of the mechanical properties of aluminum-based nanocomposites, which implies that it is essential to search for a novel nanoparticulate material that can provide an overall enhancement of the mechanical properties.
Rare earth oxides such as Y2O3 are considered perfect chemical modifiers for Al-Si alloys, since the ratio of atomic radius of Y relative to that of Si is very close to 1.646. The mechanism of silicon modification in aluminum–silicon alloys is impurity-induced twinning [23]. In Moussa’s study, it was discovered that the addition of small amounts of Y2O3 nanoparticles to Al-Si alloys can reduce the grain size of α-Al and enhance the strength and plasticity of cast samples [24]. Utilizing the refinement and modification mechanism related to the twinning of {111}, the fracture mode gradually transfers from cleavage transgranular fracture to the ductile-brittle fracture mode. Moreover, Y2O3 was applied to improve the properties of 316L [25], pure tungsten [26], Inconel 625 [27], and other materials processed by SLM, further proving its effectiveness as an oxide dispersion strengthening addition. However, the effect of Y2O3 nanoparticles on the organization and mechanical properties of AlSi10Mg alloys has not been explored yet. Whether the same grain refinement effect can be achieved for AlSi10Mg is still unknown. Therefore, it is important to investigate the enhancement capability and the strengthening mechanism of Y2O3 nanoparticles for the AlSi10Mg alloys.
In this study, AlSi10Mg alloys specimens were printed by SLM, adding 0 to 2 wt.% of Y2O3 nanoparticles. To investigate the effect of the addition of Y2O3 nanoparticles on the microstructure and mechanical properties, the phase composition, microstructure, grain size, and crystallographic texture of the SLMed specimens were analyzed by XRD, SEM, and EBSD, respectively. Ultimate tensile strength, elongation, yield strength, Vickers hardness, coefficient of friction, and wear rate were also measured.
2. Materials and Methods
2.1. Materials
A gas-atomized AlSi10Mg powder (Jiangsu Vilory Advanced Materials Technology Co., Ltd., Xuzhou, China, the composition is shown in Table 1) with a particle size ranging from 15 to 53 μm (Figure 1a) and commercial nano-Y2O3 (Beijing Zhongke Yannuo Advanced Materials Technology Co., Ltd., Beijing, China) was used as raw materials. It should be noticed that the nano Y2O3 we purchased were in the form of clustered powders as shown in Figure 1b, but the true particle size of Y2O3 is around 50 nm, as shown in Figure 1c. The A QM-QX2 planetary ball mill (Nanjing Laibu Laboratory Equipment Technology Co., Ltd., Nanjing, China) was used to uniformly disperse Y2O3 nanoparticles on the surface of the AlSi10Mg powder. The powder mixture was sealed in stainless steel bowls with a ball-to-powder ratio of 3:1. The rotation rate was set at 250 rpm with a total milling time of 4 h. An interval of 10 min was set after each 20 min of milling in order to avoid overheating of powder. The mixed powder was put in a vacuum drying oven, dried at 120 °C for 3 h, and sealed in a vacuum bag for further use. The micro-morphology of the composite powder after ball milling is shown in Figure 2, indicating that the sphericity of the AlSi10Mg powder is still relatively preserved after ball milling. Y2O3 is easily observed on the powder surfaces. The elemental distribution mapping of Y shows that the Y2O3 nanoparticles are uniformly distributed on the surface of AlSi10Mg powder after ball milling (Figure 2c–f).

Table 1.
Chemical composition of the AlSi10Mg powder (wt.%).
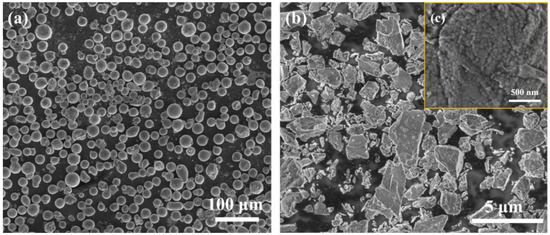
Figure 1.
SEM images of (a) AlSi10Mg powder, (b) Y2O3 clustered powder, and (c) nano Y2O3 particles that form the clustered powder.

Figure 2.
SEM image showing the morphology of (a) AlSi10Mg power and (b) 0.5 wt.% Y2O3-AlSi10Mg power. The orange arrows point to the Y2O3 nanoparticles. EDS mapping showing the elemental distribution of (c) Al, (d) Si, (e) Y, and (f) O on the particle surface.
2.2. SLM Process
The AlSi10Mg and x wt.%Y2O3-AlSi10Mg samples were manufactured using an independently developed SLM system (as shown in Figure 3a) using a fiber laser with a power of 500 W, 1064 nm continuous wavelength, and a laser spot diameter of 75 μm (YLR-500 fiber laser, IPG/Germany). To prevent powder oxidation, we performed the SLM process at argon pressure p < 0.1 MPa. After the atmosphere was stabilized, the gas flow was controlled at 15 l/min. The optimized SLM parameter combinations were set as follows: laser power (P) = 200 W, hatching distance (H) = 0.12 mm, laser scanning speed (V) = 1200 mm/s, and layer thickness (L) = 0.02 mm. The optimized SLM parameter combinations are shown in Table 2. The scan direction angle between neighboring layers was 67°. Cubic specimens with a side length of 10 mm were fabricated for the microstructural analysis. The relative density analysis of the sample was performed using Archimedes’ principle. For simplicity, the SLMed AlSi10Mg samples were named S0, and the composite samples with 0.5, 1.0, 1.5, and 2.0 wt.% nano-Y2O3 were named S1, S2, S3, and S4, respectively (Table 3).
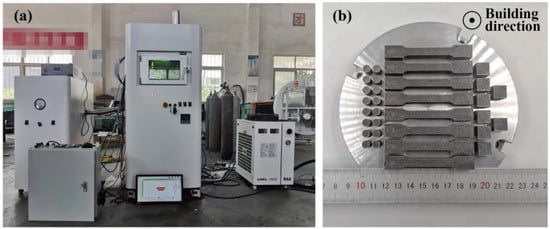
Figure 3.
(a) The photograph of SLM printer, (b) the samples printed on AlSi10Mg substrate.

Table 2.
The optimized SLM parameter combinations.

Table 3.
Composition of the mixture powder (wt.%) and relative density (%) of different samples.
2.3. Microstructure Characterization
The microtopography of the AlSi10Mg/nano-Y2O3 powders and the microstructure of the SLMed specimens were characterized by an Olympus optical microscopy (OM, BX53M, Olympus, Tokyo, Japan) and a JEOL JSM-IT800SHL scanning electron microscope. The SLMed specimens were pre-treated using mechanical grinding, polished using standard metallographic methods, and then etched by Keller’s reagent (1 mL HF, 1.5 mL HCl, 2.5 mL HNO3, and 95 mL H2O). The phase composition of the specimens was analyzed using PANalytical X-ray diffraction with a step size of 0.02° and the 2θ range from 20 to 90°. The grain size and texture of the composites were analyzed by electron backscatter diffraction (EBSD).
2.4. Mechanical Tests
The printing direction of all specimens are shown in Figure 3b. All specimens are removed from the substrate by Wire Electrical Discharge Machining. Before mechanical tests, all specimens were pre-treated using mechanically grinding and polished using standard metallographic methods. According to the ASTM E8 standard, specimens for the mechanical tensile test were machined into flat tensile coupons with a pitch length of 25 mm, a width of 6 mm, and a thickness of 2 mm (Figure 4). Room-temperature tensile tests were operated on a tensile testing machine (C45, MTS, Minnesota, USA) with a constant extension rate of 1 mm/min at room temperature. To ensure accurate measurement of strain in tensile tests, an extensometer was used. At least three samples for each parameter were printed and all tests were conducted three times, and the average value was taken as the final result. The Vickers hardness (HV) of the samples was measured with an HVS-1000A microhardness tester (Laizhou Huayin Test Instrument Co., Ltd., Yantai, China) at room temperature with a load of 0.98 N and a duration time of 15 s. The wear/tribological properties of the specimens were evaluated by a CF-I reciprocating tribometer (Lanzhou ZhongKe KaiHua Sci. and Technol. Co., Ltd., Lanzhou, China). The tribometer was equipped with a silicon nitride ball with a diameter of 6 mm. The friction unit was slid at a speed of 0.05 m/s for 30 min under 5 N load. The track of the friction pair was 5 mm. Each specimen was first polished and then conducted for three different runs. The coefficient of friction (COF) was recorded during the tests. The wear volume (V) of different parts was calculated by a MT-500 probe type abrasion mark measuring instrument (Lanzhou ZhongKe KaiHua Sci. and Technol. Co., Ltd., Lanzhou, China). The wear rate (ω) was identified by ω = V/WL, where W was the contact load applied in the test and L was the sliding distance.
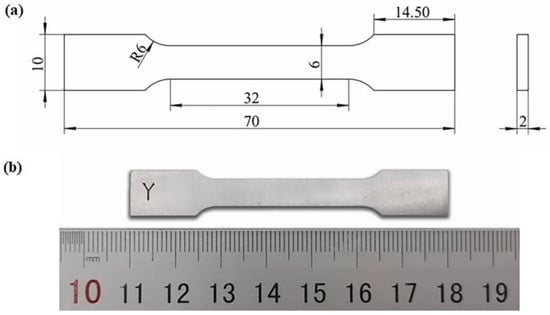
Figure 4.
(a) Dimensions of the tensile test sample (mm) and (b) the image of the polished coupon.
3. Results and Discussion
3.1. Phase Composition and Microstructural Characterization
Figure 5 shows the X-ray diffraction patterns (XRD) of the SLMed AlSi10Mg and Y2O3-AlSi10Mg specimens. All of the samples have similar diffraction peaks, containing the main peaks of the face-centered cubic (FCC) α-Al and eutectic Si phases. Si is supersaturated and precipitates in the Al matrix because of the rapid cooling during the SLM process. In addition, the Al3Y phase can be found in SLMed Y2O3-AlSi10Mg samples. The diffraction peaks of (111) and (200) of Si are similar in intensity, which can be observed in Figure 4a. The other samples have a preferred orientation, and the strongest diffraction peak for all of them (200). The diffraction peaks are locally amplified to analyze the variation in the α-Al matrix phase (Figure 4b). The careful comparison indicates that the diffraction peak corresponding to the α-Al in the SLMed Y2O3-AlSi10Mg specimens has a slight shift to the left compared with the SLMed AlSi10Mg, and the shift increases with the nano-Y2O3 content. According to the following Bragg formula in Equation (1) and the crystallographic relationship in Equation (2), the following is the case:
where θ denotes the diffraction angle, dhkl represents the crystal plane spacing, λ is the X-ray wavelength, h, k, and l are the Miller indices of the crystal, and a is the lattice constant. It can be inferred that when the diffraction peak shifts to the left, the lattice constant becomes larger.
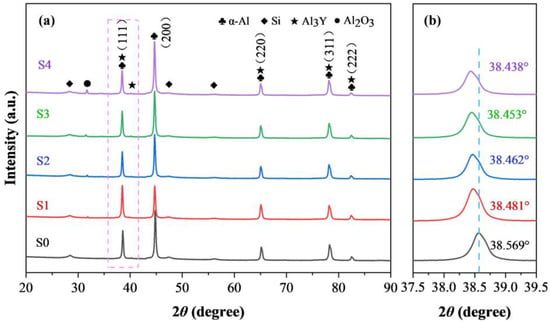
Figure 5.
XRD patterns of (a) all samples and (b) magnification of the selected local areas in (a).
Figure 6 shows the typical microstructure of SLM samples. As shown in Figure 6a–e, the SLMed samples have overlapping fish-scale molten pools. The molten pool of the SLM samples is randomly distributed and their size is uneven. Under the same process parameters, the relative density first increases and then decreases with the yttrium oxide content, as shown in Table 3. The maximum relative density is 99.45% when 0.5 wt.% Y2O3 nanoparticles are added. The SEM image of the longitudinal section further visualizes the details of the microstructure of the SLM samples, as shown in Figure 7. The boundaries of the molten pool trajectory are visible. The alloy’s microstructure consists of a cell-like Al matrix (dark phase) and a fibrous eutectic silicon grid (light phase). Thus, the main reason for the occurrence of fibrous Si is the rapid solidification during SLM [14]. Inside the molten pool, cell-like dendrites grow toward the center of the molten pool. Two zones can be distinguished according to their morphology and size: a fine cellular zone at the center of the melt pool and a coarse cellular zone at the molten pool boundary [3]. The cells in samples modified by nano-Y2O3 are relatively refined (especially cells at the center of the molten pool) compared to the SLMed samples.
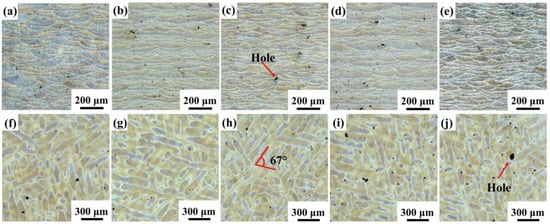
Figure 6.
Optical microscopy images of S0, S1, S2, S3, and S4 samples in the (a–e) longitudinal section and (f–j) cross section; (a,f) S0; (b,g) S1; (c,h) S2; (d,i) S3; (e,j) S4.
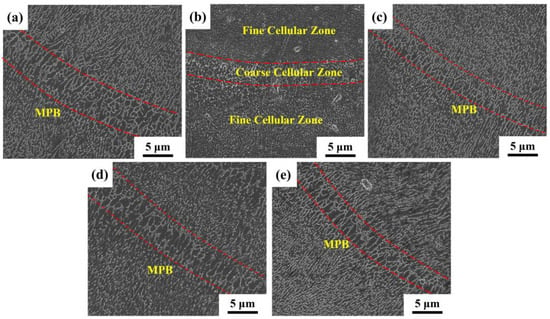
Figure 7.
SEM images of SLMed samples: (a) S0; (b) S1; (c) S2; (d) S3; (e) S4.
The cooling and solidification mode of the molten pool mainly depends on the time when the powder is in contact with the laser, and the temperature gradient G and the crystal growth rate R are the two factors affecting the grain growth morphology in the molten pool [8,28]. The G is the temperature difference over a certain distance dT/dx and varies over the time and place inside the melt pool. The R depends on the laser scanning speed and the angle between the laser moving direction and the growth direction of the solidifying material [29]. The G/R ratio determines the microstructural morphology. G × R represents the cooling rate, which determines the fineness of the grains, and the larger the product, the finer the microstructure. According to the Gaussian distribution of laser energy, the degree of undercooling gradually decreases along the cross-section, with a maximum at the center of the molten pool and a minimum at the boundary of the molten pool [30]. Therefore, two distinct areas can be seen in the microstructure of the SLMed specimens.
3.2. Grain Size and Crystallographic Texture
To further investigate the microstructure characteristics, S0, S1, and S4 samples are treated with EBSD as shown in Figure 8, which reveals a significant difference between the SLMed Y2O3-AlSi10Mg specimens with different Y2O3 contents. Using IPF (inverse pole figure) as a reference, it can be found that most of the grains in Figure 9a–c have the crystal orientations of (001), (101), and (111). As shown in Figure 8a, the grain morphology of specimen S0 exhibits obvious heterogeneity. In addition, the coarse columnar grains are almost parallel to the building direction. The maximal intensity of the pole figures of the S0 reaches 4.19, as revealed in Figure 9a, which indicates that the SLMed AlSi10Mg alloy has a strong texture. After adding 0.5 wt.% Y2O3 nanoparticles, many small grains nucleated. The IPF color, as shown in Figure 9c, indicates that the equiaxed grains of S1 are randomly oriented. The maximal intensity of the S1 pole figures is only 1.55, which indicates that S1 has almost no texture, as shown in Figure 9b. The molten pool boundary inside S1 is difficult to distinguish due to the high homogeneity of grain morphology. Figure 9b shows that S4 has fine equiaxed crystals, small columnar crystals, and coarse equiaxed crystals. Meanwhile, the highest intensity of the S4 pole figures is 3.25.
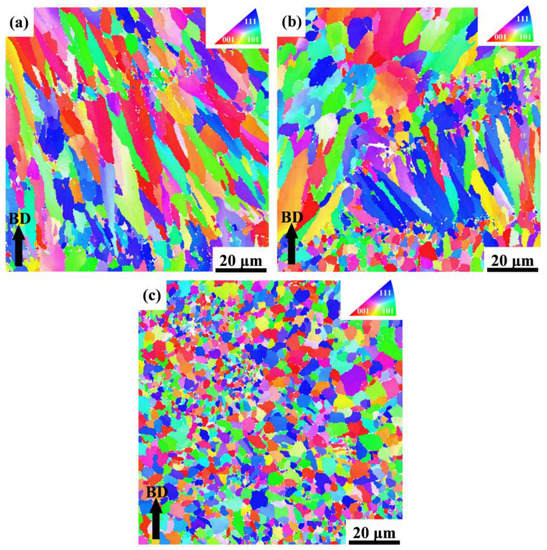
Figure 8.
EBSD orientation maps of the Al grains across their building direction in (a) S0, (b) S4, and (c) S1. The IPF color code represents the grain orientation.
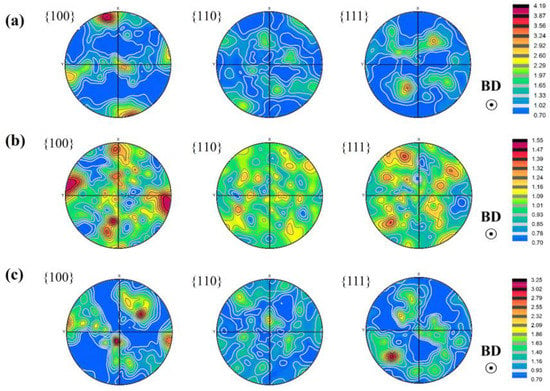
Figure 9.
Pole figures of the longitudinal direction: (a) S0, (b) S1, (c) S4.
The effect of the Y2O3 content on the grain size of the Y2O3-AlSi10Mg composite specimens is investigated further. The detailed exploration is based on the EBSD orientation mappings, and the resulting statistics are shown in Figure 10a,c,e. The average grain size of the SLMed Y2O3-AlSi10Mg specimens with different Y2O3 contents (0 wt.%, 0.5 wt.%, and 2.0 wt.%) is 1.742, 0.873, and 1.118 μm. Grain boundary angle misorientation is also an important indicator of the microstructural characteristics of materials [22]. The grain boundary angles can be segmented into high-angle grain boundaries (HAGBs > 15°) and low-angle grain boundaries (LAGBs < 15°). Figure 10b,d,f, shows the grain boundary misorientation distribution of S0, S1, and S4, respectively. The volume fractions of the HAGBs in S0, S1, and S4 are 34.4, 64.9, and 54.8%, respectively. In the framework of classical dislocation models, LAGBs can be described in terms of dislocation density [31]. The volume fraction of the LAGBs is proportional to the dislocation density.
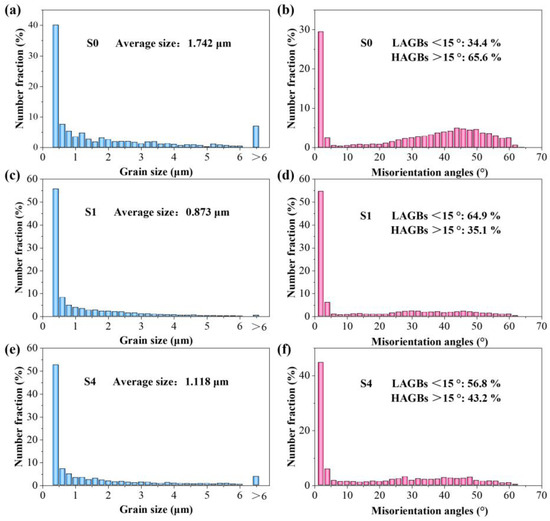
Figure 10.
Grain size distribution statistics (a,c,e) and grain boundary misorientation angles distribution statistics (b,d,f); (a,b) S0; (c,d) S1; (e,f) S4.
The grain refinement ability of yttrium oxide is also verified by the edge-to-edge model (E2EM). The E2EM established by Zhang and Kelly was originally used to test the actual atomic matching at the interface between two phases, and in recent years, it has been used to find a grain refining agent that promotes the heterogeneous nucleation of grains in alloys [32,33,34]. The model is based on the assumption that the orientation relationship of any two phases is determined by the minimum interfacial strain energy, and the two phases are atomically matched to minimize the strain energy. It calculates the orientation relationships between two phases based on the lattice constant, crystal structure, and atomic position data. To obtain the best matching relationship, the atom matching direction must be carried out along the dense and sub-dense crystal directions, and the interatomic spacing misfit (fr) must be less than 10%. These crystal directions are called matching directions, and two pairs of matching crystal directions can uniquely determine a pair of crystal faces, and if the interplanar spacing mismatch (fd) is also less than 10%, the particle can serve as a heterogeneous nucleation core of the matrix [12].
Al has a lattice constant of 0.405 nm and is a face-centered cubic (fcc) structure [28]. It contains three possible close-packed or nearly close-packed directions: <110>Al, <100>Al, and <112>Al, and three close and nearly close-packed planes: {111} Al, {200} Al, and {220} Al. Y2O3 has a cubic structure with a lattice parameter of 1.06 nm. There are three potential close-packed directions: <110>Y2O3, <100> Y2O3, and<112> Y2O3. {222} Y2O3, {400} Y2O3, and {440} Y2O3 are the close and nearly close-packed planes for Y2O3. There are two direction pairs, <100>Al//<110> Y2O3 and <112>Al//<100> Y2O3, with the fr value of 7.46% and 6.85%, respectively, which are both less than 10%. Further, the valid close-packed plane pairs include {200}Al//{044}Y2O3, with an fd value of 7.47%. According to the E2EM crystallographic geometric model, the final predictive orientation relationship between Y2O3 and Al matrix is as follows:
[100]Al//[110]Y2O3, (200)Al//(044)Y2O3
According to the E2EM model, the interplanar spacing mismatch and the interatomic spacing misfit of the orientation relationships between Y2O3 and Al matrix are presented in Figure 11. The calculated values are less than 10%. Therefore, the Y2O3 nanoparticles can be used as effective grain refiners. A large number of Y2O3 nanoparticles can supply substantial heterogeneous nucleation sites for α-Al, which can effectively facilitate the nucleation of α-Al grains. As shown in Figure 8, the EBSD images illustrate the significant refinement of alloy grains doped with Y2O3 nanoparticles compared to undoped AlSi10Mg alloys.

Figure 11.
Schematic diagram of the interplanar spacing mismatch and the interatomic spacing misfit between Y2O3 and Al.
3.3. Mechanical Properties
Figure 12 depicts the tensile properties of the SLM-processed AlSi10Mg and Y2O3-AlSi10Mg alloys at room temperature. The data of the ultimate tensile strength (UTS), elongation to failure (El), yield strength (YS), and Vickers hardness (HV0.1) are listed in Table 4. The SLM-processed AlSi10Mg alloy has an ultimate tensile strength of 431.2 MPa, yield strength of 264.4 MPa, and an elongation of 7%. After adding 0.5 wt.% of nano-Y2O3 particles, the S1 sample exhibits an ultimate tensile strength of 500.3 MPa, an elongation of 9.7%, and a yield strength of 322.3 Mpa. In general, using optimal processing parameters, the SLM-fabricated Y2O3-AlSi10Mg specimen exhibits considerably higher strength than the unreinforced AlSi10Mg alloy specimen. The UTS of S1 is increased by 16% compared to S0, and the yield strength and elongation are also improved. With the increase in the nanoparticles content, the microhardness first increases and then decreases, as shown in Table 4. When 1.0 wt.% Y2O3 nanoparticles is added, the microhardness is up to 145.6 HV0.1, which is 21.8% higher than the 119.5 HV0.1 of S0.
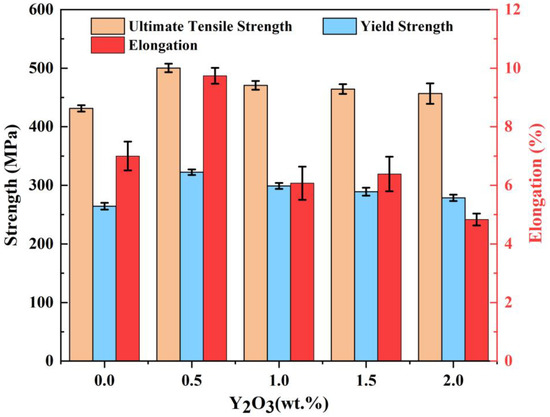
Figure 12.
Ultimate tensile strength, yield strength, and elongation data of the SLMed AlSi10Mg and Y2O3-AlSi10Mg alloy.

Table 4.
Mechanical properties of SLM-processed specimens.
The S1 sample exhibits great ultimate tensile strength (500.3 MPa), which is 69.1 MPa higher than that of the S0 sample, as shown in Table 4. The high strength of SLMed Y2O3-AlSi10Mg samples can mainly owe to Orowan strengthening, fine grain strengthening, and load-bearing strengthening.
The Orowan strengthening, caused by the resistance of tightly packed hard particles to the dislocation passing, is a very important item in the aluminum alloy strengthening mechanism [35]. For reinforced particles with an average diameter of 5 μm or larger, that mechanism is not a major factor. In contrast, the Orowan strengthening is more pronounced when highly dispersed nanoparticles are present in the aluminum matrix [36]. It has been established that insoluble nanoparticles in the matrix can significantly improve the ability to hinder dislocations, even for only a small volume fraction. For composites containing nanoparticles, this is usually explained by the Orowan strengthening mechanism:
where dp and Vp are the size of the Y2O3 nanoparticles (~50 nm) and the volume fraction (~0.938 vol%) of S1, respectively. The term b is the Burgers vector (~0.286 nm), and Gm is the shear modulus of the matrix (~26.5 GPa for Al). The result of the calculated ΔσOrowan is 79.3 MPa.
We all know that the grain boundary strength is stronger than that of grains [37]. The finer the Al matrix grain, the more the grain boundaries, impeding dislocation motion. According to the Hall–Petch formula [38], when the grain size decreases and the grain boundary increases, the strength of the material increases.
where d denotes the average grain size of metal, and k means the material constant. According to previous studies, the k for the Al alloy is set to 50 MPa μm1/2 [39]. As shown in Figure 9, the average grain sizes of S0 and S1 are 1.742 and 0.873 μm. The calculated ΔσHall-Petch is 15.6 MPa.
The contribution of the load-bearing strengthening to the strength of the nanocomposites (ΔσLoad) can be expressed as follows [40]:
where σm is the YS of the AlSi10Mg alloy matrix (264.4 MPa). Vp is the volume fraction of the nano-Y2O3. The result of the calculated ΔσLoad is 3.72 MPa. Therefore, the enhancement in tensile strength in this study can be illustrated as follows:
The calculated total theoretical increment of the YS (Δσ = 98.62 MPa) is higher than the actual yield strength enhancement (67.9 MPa) due to the presence of holes, and the calculated theoretical increment does not reflect the actual enhancement of nano-Y2O3. It is worth noting that the tensile strength does not increase with the addition of Y2O3 nanoparticles. The effect of relative density of SLMed samples on the mechanical and microstructural properties of the final produced component (e.g., tensile strength, defects formation, fracture toughness, friction and wear) is undeniable [41,42,43]. The elimination of pores is necessary for obtaining simultaneously enhanced strength and ductility. Therefore, the reason for the decrease in the strength increment of S2, S3, and S4 is that the porosity increases with respect to the nano-Y2O3 content.
To better comprehend the fracture mechanism of the SLMed Y2O3-AlSi10Mg specimens, the fracture morphology of S0, S1, S2, S3, and S4 are analyzed by SEM. As shown in Figure 13a–e, all samples can observe the cleavage planes and dimples from the fractography, revealing a mixed fracture pattern of ductile and brittle fracture. The high-magnification SEM of the fracture morphology is shown in Figure 13f–j, and it can be observed that there are some ligament fossae with a size less than 0.5 μm on the fracture surface, and that the shape of the dimples is regular, but the depth is different. Deep and dense dimples indicate the high elongation of S1, as shown in Figure 13g. As the Y2O3 content increases, some holes appear, which leads to an elongation decrease.
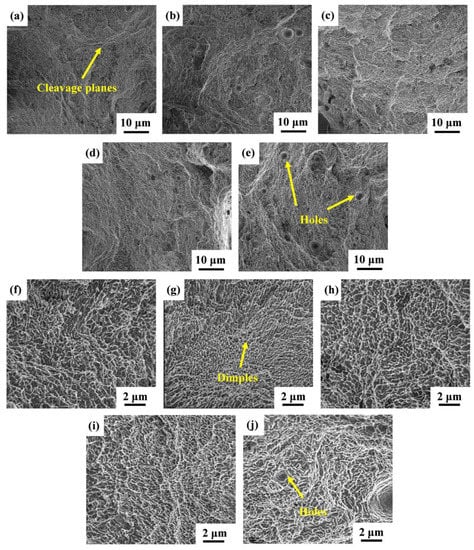
Figure 13.
SEM images of fracture surfaces: (a,f) for S0; (b,g) for S1; (c,h) for S2; (d,i) for S3; (e,j) for S4.
Figure 14 shows the coefficient of friction (COF) and the corresponding wear rate of the AlSi10Mg and Y2O3-AlSi10Mg alloys. The COFs of Y2O3-AlSi10Mg composites are higher than those of AlSi10Mg specimens in the initial stage, but the COFs are lower than that of AlSi10Mg specimens in the steady state. The COF and wear rate of the AlSi10Mg are 0.68 and (5.59 ± 0.15) × 10−4 mm3·N−1·m−1, concurrently, and the COF curve exhibits a certain fluctuation. With the addition of Y2O3 nanoparticles, the wear first decreases and then increases. When adding 0.5 wt.% Y2O3 nanoparticles, the COF of the composites decreases from 0.68 to 0.43, and the wear rate is also significantly reduced, from (5.59 ± 0.15) × 10−4 mm3·N−1·m−1 to (3.40 ± 0.09) × 10−4 mm3·N−1·m−1. The COF curve of Y2O3-AlSi10Mg alloys is relatively stable.
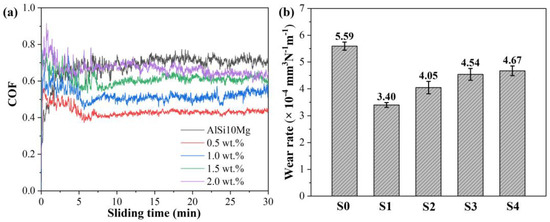
Figure 14.
Wear properties of the SLMed part: Coefficient of friction (a) and the wear rate (b).
To further investigate the friction and wear mechanism, the wear surface topography was inspected and is shown in Figure 15a–e. For the S0, the worn surface showed deep grooves and debris (Figure 15a). Therefore, a combined mechanism of abrasive and adhesive wear dominated, showing a relatively high average COF of ~0.709 and a high wear rate of (5.59 ± 0.15) × 10−4 mm3·N−1·m−1 for S0. For the S1 and S2, small delamination and pits are observed on the smooth worn surface, revealing a weak wear behavior in this case, and implying that the dominant wear mechanism has changed to the adhesion of a strain-hardened tribolayer. Owing to their high hardness, a high-density of hard reinforcements dispersed in the soft matrix can effectively limit further material removal in the course of the wear process [44]. However, the COF of the S4 increased to 0.65, and the resultant wear rate also increased slightly to (4.67 ± 0.18) × 10−4 mm3·N−1·m−1. The decrease in tribological performance in this instance was ascribed to the decrease in density and the grain coarsening (Figure 8b), which will easily cause material delamination during sliding, resulting in the spalling of the worn surface and attendant-limited wear resistance.
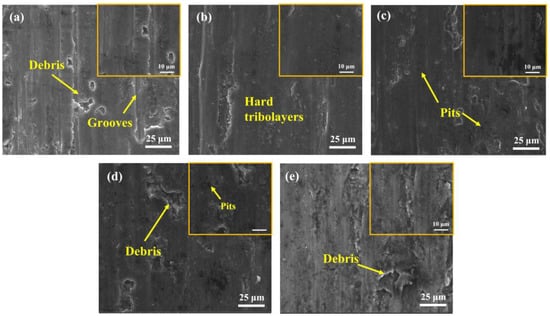
Figure 15.
Wear surface morphologies of (a) S0; (b) S1; (c) S2; (d) S3; (e) S4.
4. Conclusions
The AlSi10Mg composites modified with Y2O3 nanoparticles were prepared by SLM. The effect of nano-Y2O3 particles (0−2 wt.% addition) on the microstructure and mechanical properties of AlSi10Mg alloy was studied under the same process parameters. The main conclusions are as follows:
- Adding 0.5 wt.% Y2O3 nanoparticles can significantly refine the grains from 1.742 to 0.873 μm, but further addition of Y2O3 nanoparticles will result in a grain size increase and the decrease in the relative density;
- The optimal nano-Y2O3 particle addition level is 0.5 wt.%, with a higher ultimate tensile strength of 500.3 MPa, a yield strength of 322.3 MPa, and an elongation of 9.7%. Both the Orowan strengthening effect and the load-bearing strengthening effect show that the addition of nano-Y2O3 is beneficial to the grain refinement. However, since the grain size gradually increases and the relative density decreases as the addition level of Y2O3 passes 1 wt%, the strength of the material also experiences a decrease;
- The wear resistance of the Y2O3-AlSi10Mg nanocomposites is improved compared to that of the AlSi10Mg alloy. When adding 0.5 wt.% Y2O3 nanoparticles, the wear rate is about 39% lower than that of the AlSi10Mg alloys, but when the addition of Y2O3 increases, the wear performance gradually decreases.
Author Contributions
Conceptualization, F.Z., Z.Z. and Q.G.; methodology, F.Z., Z.Z. and Q.G.; investigation, X.H., F.M. and L.L.; formal analysis, X.H., J.F. and F.M.; data curation, B.L., X.Z. and L.L.; writing-original draft preparation, F.Z., Q.G., B.L. and J.F.; writing-review and editing, F.Z., X.Z. and L.L.; supervision, Z.Z. All authors have read and agreed to the published version of the manuscript.
Funding
This research was funded by the National Key Research and Development Program of China (2018YFA0703400), the Young Scientists Fund of the National Natural Science Foundation of China (52205447), Changjiang Scholars Program of Chinese Ministry of Education, the Xinghai Science Funds for Distinguished Young Scholars at Dalian University of Technology and the Collaborative Innovation Center of Major Machine Manufacturing in Liaoning.
Institutional Review Board Statement
Not applicable.
Informed Consent Statement
Not applicable.
Data Availability Statement
Not applicable.
Conflicts of Interest
The authors declare no conflict of interest.
References
- Martin, J.H.; Yahata, B.D.; Hundley, J.M.; Mayer, J.A.; Schaedler, T.A.; Pollock, T.M. 3D printing of high-strength aluminium alloys. Nature 2017, 549, 365–369. [Google Scholar] [CrossRef] [PubMed]
- Fayazfar, H.; Salarian, M.; Rogalsky, A.; Sarker, D.; Russo, P.; Paserin, V.; Toyserkani, E. A critical review of powder-based additive manufacturing of ferrous alloys: Process parameters, microstructure and mechanical properties. Mater. Des. 2018, 144, 98–128. [Google Scholar] [CrossRef]
- Liu, X.H.; Zhao, C.C.; Zhou, X.; Shen, Z.J.; Liu, W. Microstructure of selective laser melted AlSi10Mg alloy. Mater. Des. 2019, 168, 107677. [Google Scholar] [CrossRef]
- Han, C.J.; Fang, Q.H.; Shi, Y.S.; Tor, S.B.; Chua, C.K.; Zhou, K. Recent Advances on High-Entropy Alloys for 3D Printing. Adv. Mater. 2020, 32, 1903855. [Google Scholar] [CrossRef] [PubMed]
- Bartolomeu, F.; Buciumeanu, M.; Pinto, E.; Alves, N.; Carvalho, O.; Silva, F.S.; Miranda, G. 316L stainless steel mechanical and tribological behavior-A comparison between selective laser melting, hot pressing and conventional casting. Addit. Manuf. 2017, 16, 81–89. [Google Scholar] [CrossRef]
- Liang, L.; Xu, M.F.; Chen, Y.H.; Zhang, T.M.; Tong, W.; Liu, H.T.; Wang, H.J.; Li, H.X. Effect of welding thermal treat-ment on the microstructure and mechanical properties of nickel-based superalloy fabricated by selective laser melting. Mater. Sci. Eng. A-Struct. 2021, 819, 16. [Google Scholar] [CrossRef]
- Yu, W.H.; Sing, S.L.; Chua, C.K.; Tian, X.L. Influence of re-melting on surface roughness and porosity of AlSi10Mg parts fabricated by selective laser melting. J. Alloy. Compd. 2019, 792, 574–581. [Google Scholar] [CrossRef]
- Abedi, H.R.; Hanzaki, A.Z.; Azami, M.; Kahnooji, M.; Rahmatabadi, D. The high temperature flow behavior of additively manufactured Inconel 625 superalloy. Mater. Res. Express 2019, 6, 15. [Google Scholar] [CrossRef]
- Hadadzadeh, A.; Baxter, C.; Amirkhiz, B.S.; Mohammadi, M. Strengthening mechanisms in direct metal laser sintered AlSi10Mg: Comparison between virgin and recycled powders. Addit. Manuf. 2018, 23, 108–120. [Google Scholar] [CrossRef]
- Read, N.; Wang, W.; Essa, K.; Attallah, M.M. Selective laser melting of AlSi10Mg alloy: Process optimisation and mechanical properties development. Mater. Des. 2015, 65, 417–424. [Google Scholar] [CrossRef]
- Kim, D.K.; Woo, W.; Hwang, J.H.; An, K.; Choi, S.H. Stress partitioning behavior of an AlSi10Mg alloy produced by selective laser melting during tensile deformation using in situ neutron diffraction. J. Alloy. Compd. 2016, 686, 281–286. [Google Scholar] [CrossRef]
- Tan, Q.Y.; Zhang, J.Q.; Mo, N.; Fan, Z.Q.; Yin, Y.; Bermingham, M.; Liu, Y.G.; Huang, H.; Zhang, M.X. A novel method to 3D-print fine-grained AlSi10Mg alloy with isotropic properties via inoculation with LaB6 nanoparticles. Addit. Manuf. 2020, 32, 101034. [Google Scholar] [CrossRef]
- Jiang, L.Y.; Liu, T.T.; Zhang, C.D.; Zhang, K.; Li, M.C.; Ma, T.; Liao, W.H. Preparation and mechanical properties of CNTs-AlSi10Mg composite fabricated via selective laser melting. Mater. Sci. Eng. A 2018, 734, 171–177. [Google Scholar] [CrossRef]
- Luo, S.X.; Li, R.F.; He, P.Y.; Yue, H.Y.; Gu, J.Y. Investigation on the Microstructure and Mechanical Properties of CNTs-AlSi10Mg Composites Fabricated by Selective Laser Melting. Materials 2021, 14, 838. [Google Scholar] [CrossRef]
- Tiwari, J.K.; Mandal, A.; Sathish, N.; Agrawal, A.K.; Srivastava, A.K. Investigation of porosity, microstructure and mechanical properties of additively manufactured graphene reinforced AlSi10Mg composite. Addit. Manuf. 2020, 33, 101095. [Google Scholar] [CrossRef]
- Gu, D.D.; Wang, H.Q.; Dai, D.H.; Yuan, P.P.; Meiners, W.; Poprawe, R. Rapid fabrication of Al-based bulk-form nanocomposites with novel reinforcement and enhanced performance by selective laser melting. Scr. Mater. 2015, 96, 25–28. [Google Scholar] [CrossRef]
- Li, X.P.; Ji, G.; Chen, Z.; Addad, A.; Wu, Y.; Wang, H.W.; Vleugels, J.; Van Humbeeck, J.; Kruth, J.P. Selective laser melting of nano-TiB2 decorated AlSi10Mg alloy with high fracture strength and ductility. Acta Mater. 2017, 129, 183–193. [Google Scholar] [CrossRef]
- Wang, Z.Y.; Zhuo, L.C.; Yin, E.H.; Zhao, Z. Microstructure evolution and properties of nanoparticulate SiC modified AlSi10Mg alloys. Mater. Sci. Eng. A 2021, 808, 140864. [Google Scholar] [CrossRef]
- Zhu, S.; Song, S.; Chen, Y.; Zhao, F.; Yang, W.; Li, Z.; Shi, Y.; Yu, S. Effect of in-situ Al2O3 on tensile strength and ductility of AlSi10Mg alloy fabricated by selective laser melting. Mater. Lett. 2022, 308, 131108. [Google Scholar] [CrossRef]
- Dai, D.H.; Gu, D.D.; Xia, M.J.; Ma, C.L.; Chen, H.Y.; Zhao, T.; Hong, C.; Gasser, A.; Poprawe, R. Melt spreading behavior, microstructure evolution and wear resistance of selective laser melting additive manufactured AlN/AlSi10Mg nanocomposite. Surf. Coat. Technol. 2018, 349, 279–288. [Google Scholar] [CrossRef]
- Konopatsky, A.S.; Kvashnin, D.G.; Corthay, S.; Boyarintsev, I.; Firestein, K.L.; Orekhov, A.; Arkharova, N.; Golberg, D.V.; Shtansky, D.V. Microstructure evolution during AlSi10Mg molten alloy/BN microflake interactions in metal matrix composites obtained through 3D printing. J. Alloy. Compd. 2021, 859, 157765. [Google Scholar] [CrossRef]
- Gao, C.F.; Xiao, Z.Y.; Liu, Z.Q.; Zhu, Q.L.; Zhang, W.W. Selective laser melting of nano-TiN modified AlSi10Mg composite powder with low laser reflectivity. Mater. Lett. 2019, 236, 362–365. [Google Scholar] [CrossRef]
- Kong, D.C.; Dong, C.F.; Ni, X.Q.; Liang, Z.; Li, X.G. In-situ observation of asymmetrical deformation around inclusion in a heterogeneous additively manufactured 316L stainless steel. J. Mater. Sci. Technol. 2021, 89, 133–140. [Google Scholar] [CrossRef]
- Moussa, M.E.; El-Hadad, S.; Khalifa, W. Influence of chemical modification by Y2O3 on eutectic Si characteristics and tensile properties of A356 alloy. Trans. Nonferrous Met. Soc. China 2019, 29, 1365–1374. [Google Scholar] [CrossRef]
- Hu, Z.P.; Guan, K.; Qian, Z.; Dong, J.; Wu, J.; Ma, Z.Q. Simultaneous enhancement of strength and ductility in selective laser melting manufactured 316L alloy by employing Y2O3 coated spherical powder as precursor. J. Alloy. Compd. 2022, 899, 163262. [Google Scholar] [CrossRef]
- Hu, Z.P.; Zhao, Y.N.; Guan, K.; Wang, Z.M.; Ma, Z.Q. Pure tungsten and oxide dispersion strengthened tungsten manufactured by selective laser melting: Microstructure and cracking mechanism. Addit. Manuf. 2020, 36, 101579. [Google Scholar] [CrossRef]
- Li, M.H.; Wang, L.L.; Yang, H.O.; Zhang, S.Y.; Lin, X.; Huang, W.D. Microstructure and mechanical properties of Y2O3 strengthened Inconel 625 alloy fabricated by selective laser melting. Mater. Sci. Eng. A 2022, 854, 143813. [Google Scholar] [CrossRef]
- Li, W.; Li, S.; Liu, J.; Zhang, A.; Zhou, Y.; Wei, Q.S.; Yan, C.Z.; Shi, Y.S. Effect of heat treatment on AlSi10Mg alloy fabricated by selective laser melting: Microstructure evolution, mechanical properties and fracture mechanism. Mater. Sci. Eng. A 2016, 663, 116–125. [Google Scholar] [CrossRef]
- Trevisan, F.; Calignano, F.; Lorusso, M.; Pakkanen, J.; Aversa, A.; Ambrosio, E.P.; Lombardi, M.; Fino, P.; Manfredi, D. On the Selective Laser Melting (SLM) of the AlSi10Mg Alloy: Process, Microstructure, and Mechanical Properties. Materials 2017, 10, 76. [Google Scholar] [CrossRef]
- Shen, H.; Yan, J.; Niu, X. Thermo-Fluid-Dynamic Modeling of the Melt Pool during Selective Laser Melting for AZ91D Magnesium Alloy. Materials 2020, 13, 4157. [Google Scholar] [CrossRef]
- Gao, Y.; Jin, Z.H. Interaction between lattice dislocations and low-angle grain boundaries in Ni via molecular dynamics simulations. Mol. Simul. 2017, 43, 1172–1178. [Google Scholar] [CrossRef]
- Zhang, M.X.; Kelly, P.M. Crystallographic features of phase transformations in solids. Prog. Mater. Sci. 2009, 54, 1101–1170. [Google Scholar] [CrossRef]
- Xiao, Y.K.; Chen, H.; Bian, Z.Y.; Sun, T.T.; Ding, H.; Yang, Q.; Wu, Y.; Lian, Q.; Chen, Z.; Wang, H.W. Enhancing strength and ductility of AlSi10Mg fabricated by selective laser melting by TiB2 nanoparticles. J. Mater. Sci. Technol. 2022, 109, 254–266. [Google Scholar] [CrossRef]
- Jing, L.J.; Pan, Y.; Lu, T.; Pi, J.H.; Gu, T.F. Nucleation potency prediction of LaB6 with E2EM model and its influence on microstructure and tensile properties of Al-7Si-0.3Mg alloy. Trans. Nonferrous Met. Soc. China 2018, 28, 1687–1694. [Google Scholar] [CrossRef]
- Zhang, Z.; Chen, D.L. Consideration of Orowan strengthening effect in particulate-reinforced metal matrix nanocomposites: A model for predicting their yield strength. Scr. Mater. 2006, 54, 1321–1326. [Google Scholar] [CrossRef]
- Fan, Z.H.; Yan, X.C.; Fu, Z.Y.; Niu, B.; Chen, J.F.; Hu, Y.J.; Chang, C.; Yi, J.L. In situ formation of D022-Al3Ti during selective laser melting of nano-TiC/AlSi10Mg alloy prepared by electrostatic self-assembly. Vacuum 2021, 188, 110179. [Google Scholar] [CrossRef]
- Liu, Y.X.; Wang, R.C.; Peng, C.Q.; Cai, Z.Y.; Zhou, Z.H.; Li, X.G.; Cao, X.Y. Microstructural evolution and mechanical performance of in-situ TiB2/AlSi10Mg composite manufactured by selective laser melting. J. Alloy. Compd. 2021, 853, 157287. [Google Scholar] [CrossRef]
- Hansen, N. Hall-Petch relation and boundary strengthening. Scr. Mater. 2004, 51, 801–806. [Google Scholar] [CrossRef]
- Gutierrez-Urrutia, I.; Munoz-Morris, M.A.; Morris, D.G. Contribution of microstructural parameters to strengthening in an ultrafine-grained Al-7% Si alloy processed by severe deformation. Acta Mater. 2007, 55, 1319–1330. [Google Scholar] [CrossRef]
- AlMangour, B.; Kim, Y.-K.; Grzesiak, D.; Lee, K.-A. Novel TiB2-reinforced 316L stainless steel nanocomposites with excellent room-and high-temperature yield strength developed by additive manufacturing. Compos. Pt. B-Eng. 2019, 156, 51–63. [Google Scholar] [CrossRef]
- Ahmadi, M.; Tabary, S.; Rahmatabadi, D.; Ebrahimi, M.S.; Abrinia, K.; Hashemi, R. Review of selective laser melting of magnesium alloys: Advantages, microstructure and mechanical characterizations, defects, challenges, and applications. J. Mater. Res. Technol-JMRT 2022, 19, 1537–1562. [Google Scholar] [CrossRef]
- Zhang, B.Y.; Wang, Z.T.; Yu, H.; Ning, Y.Q. Microstructural origin and control mechanism of the mixed grain structure in Ni-based superalloys. J. Alloy. Compd. 2022, 900, 11. [Google Scholar] [CrossRef]
- Xie, J.L.; Chen, Y.H.; Yin, L.M.; Zhang, T.M.; Wang, S.L.; Wang, L.T. Microstructure and mechanical properties of ultrasonic spot welding TiNi/Ti6Al4V dissimilar materials using pure Al coating. J. Manuf. Process. 2021, 64, 473–480. [Google Scholar] [CrossRef]
- Xi, L.X.; Guo, S.; Gu, D.D.; Guo, M.; Lin, K.J. Microstructure development, tribological property and underlying mechanism of laser additive manufactured submicro-TiB2 reinforced Al-based composites. J. Alloy. Compd. 2020, 819, 9. [Google Scholar] [CrossRef]
Disclaimer/Publisher’s Note: The statements, opinions and data contained in all publications are solely those of the individual author(s) and contributor(s) and not of MDPI and/or the editor(s). MDPI and/or the editor(s) disclaim responsibility for any injury to people or property resulting from any ideas, methods, instructions or products referred to in the content. |
© 2023 by the authors. Licensee MDPI, Basel, Switzerland. This article is an open access article distributed under the terms and conditions of the Creative Commons Attribution (CC BY) license (https://creativecommons.org/licenses/by/4.0/).