1. Introduction
The oxygen converter lined with MgO-C refractory materials is one of the two main units used to prepare ferroalloy for secondary metallurgy processing. It is estimated that the amount of steel produced by the converter process is currently about 50% of heated steel [
1].
The high process temperatures, changing chemical composition of the slag, and turbulent flow of the heterophase metallic-ceramic liquid caused by blowing oxygen into it, make the working conditions of the refractories in the oxygen converter very variable. The wear process of refractories is dominated by the cyclic processes of oxidation of the carbon part of MgO-C type refractories, dissolution, and abrasion of the near-surface parts of materials, caused by penetration of the liquid alloy [
2,
3].
The problem of modeling the wear of the refractory materials under the influence of different metallurgical factors has been discussed by various authors [
4,
5,
6,
7,
8].
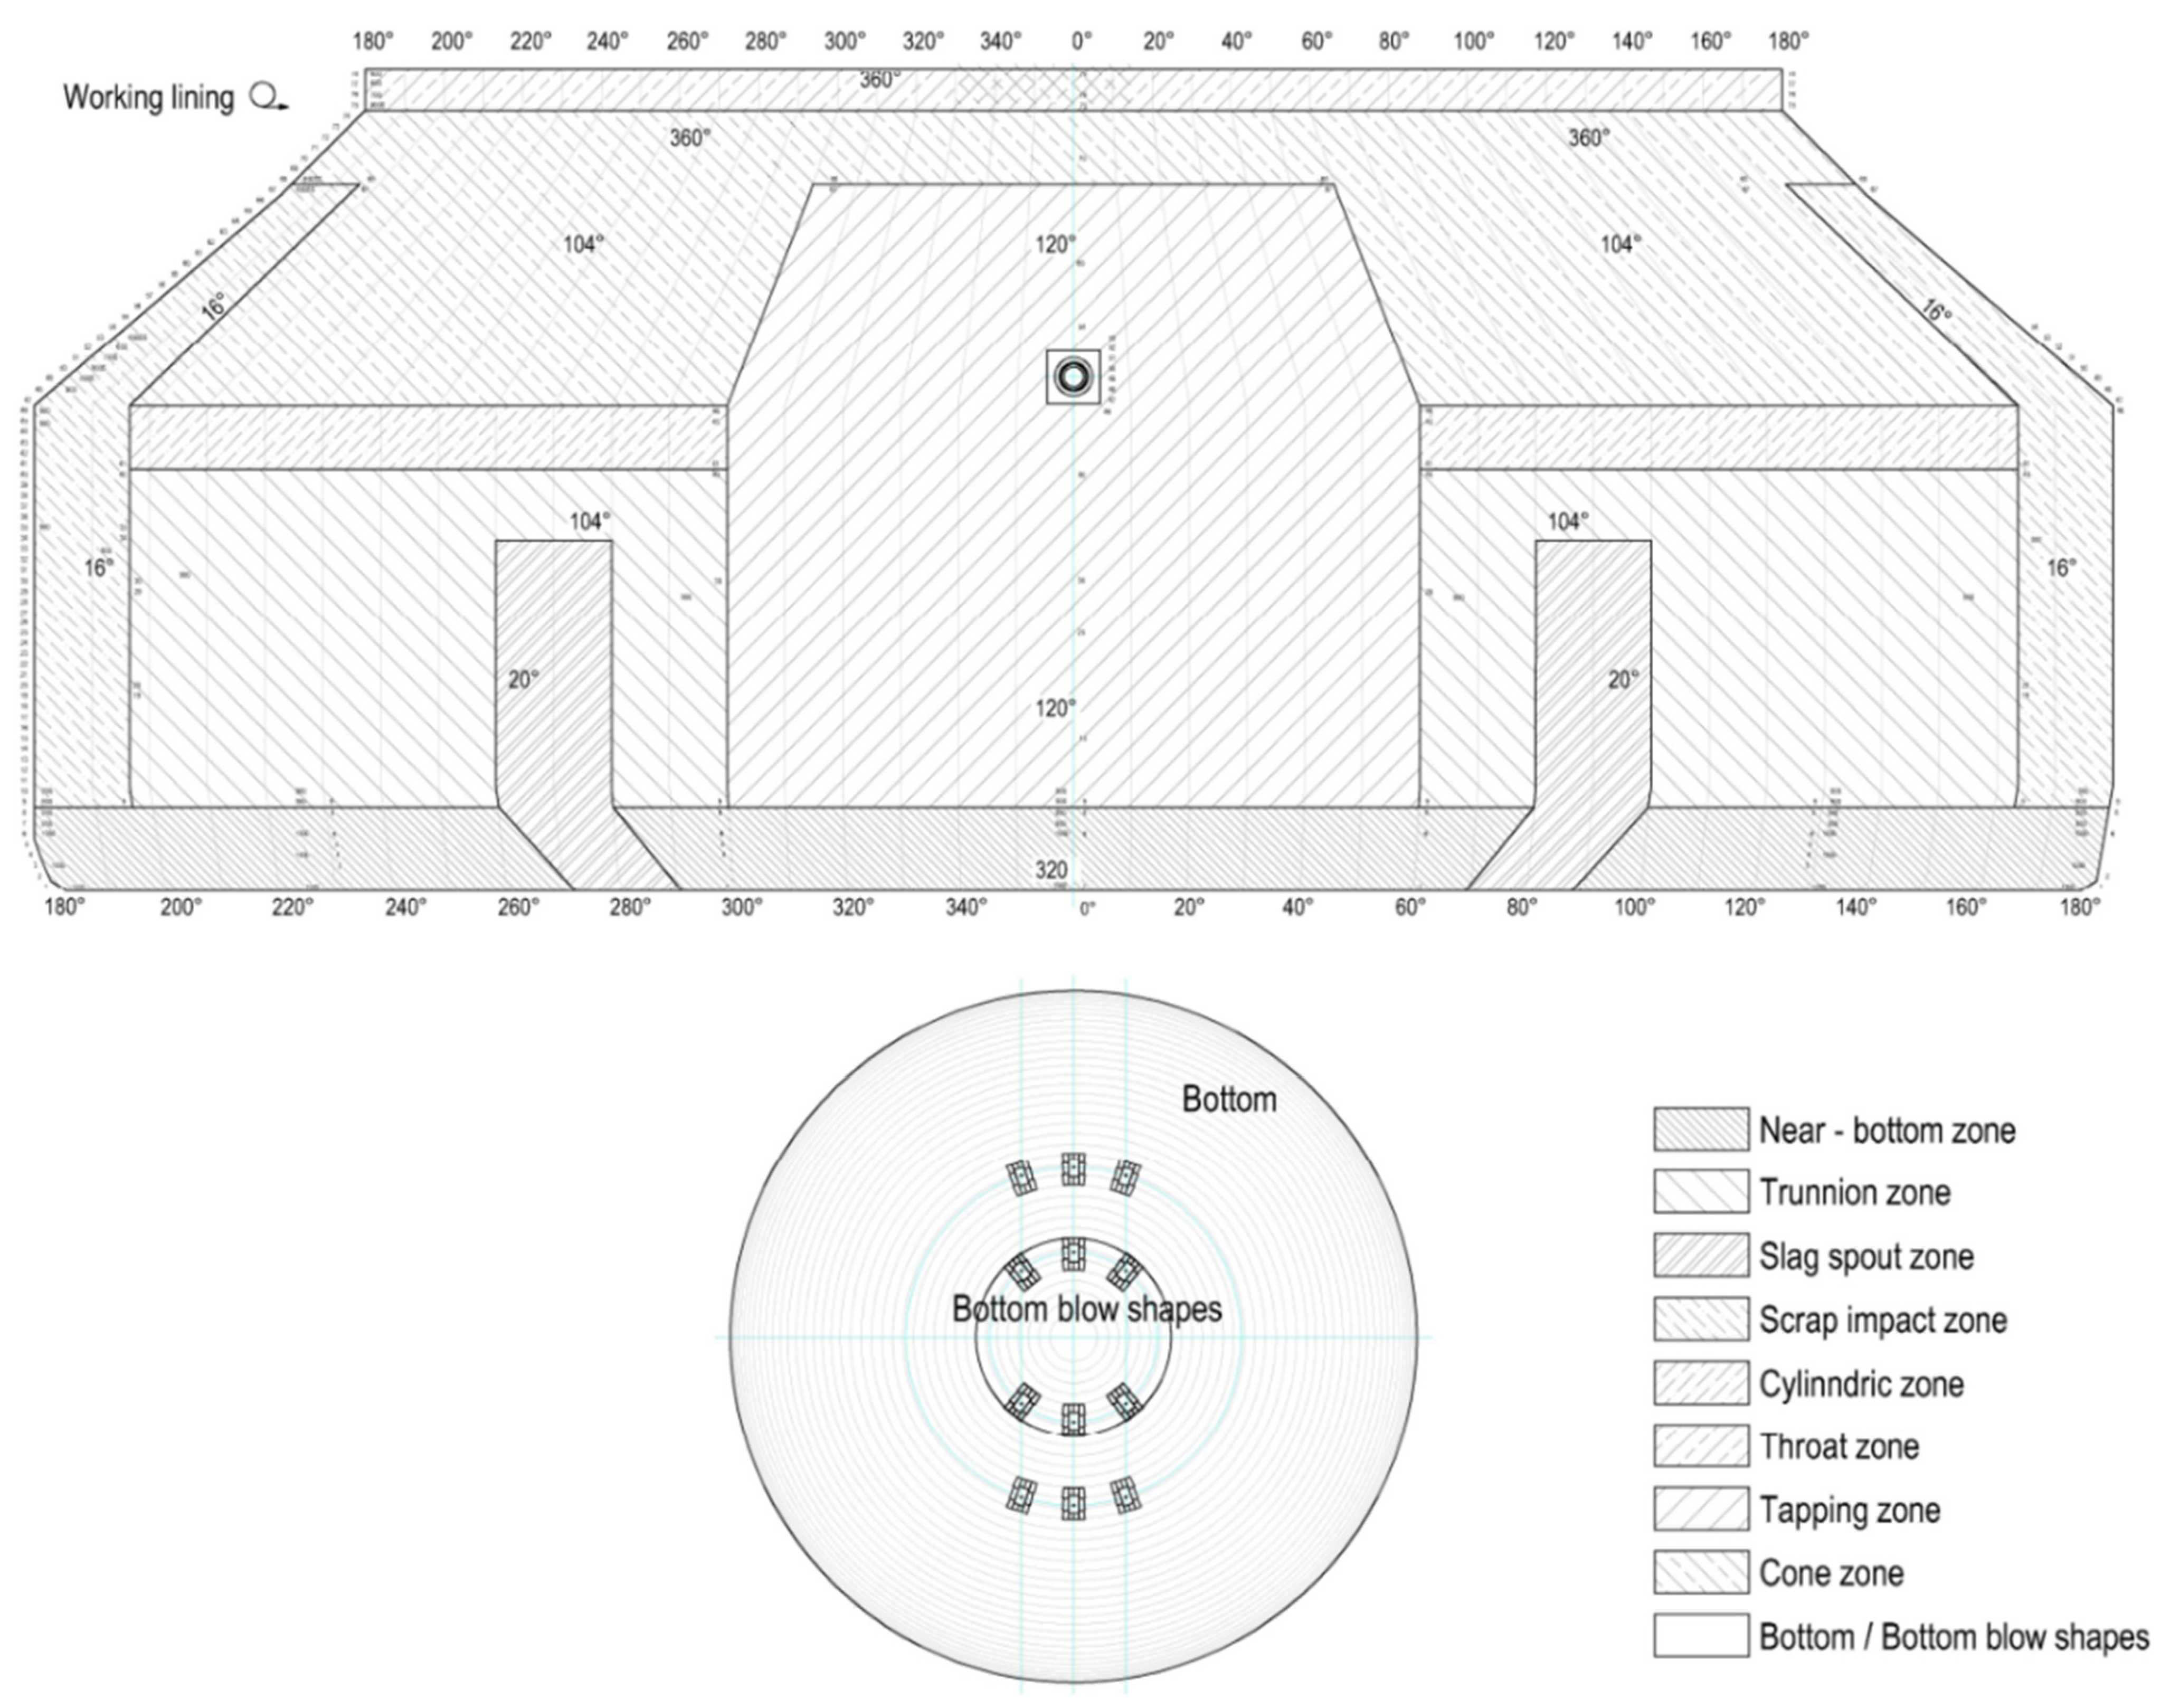
In oxygen converters, intensive oxidation of the carbon, silicon, phosphorus, and manganese contained in the batch results in uneven wear of the refractory lining. For this reason, refractories are lined in the converter in a zoned manner, as shown in
Figure 1. In the refractory lining zones with particularly unfavorable effects from corrosive factors, the best quality refractories are used. The greatest wear zone of the refractory lining in the oxygen converter is the so-called slag spout zone. The slag spout zone consists of two areas in the converter (left and right trunnion), lying symmetrically in relation to the taphole and with difficult access for maintenance of the refractory lining.
In the slag spout zone, the thermal and chemical loads are mainly concentrated during the converter campaign. An exception is the initial stage, which usually lasts until about the hundredth heat, where thermomechanical loads caused by thermal stresses generally dominate.
The purpose of the paper is to present the possibility of applying Bayesian modelling in predicting the ranges of reliability of the unit wear rate of the refractory oxygen converter lining in the slag spout zone during the converter campaign. At the same time, the assumed values of the a priori distribution of the wear rate value result from the known metallurgical working conditions, to which the MgO-C material of the MC 95/10 type is exposed to. The result of the calculations presented in the article is the a posteriori distribution of the wear rate, from which the desired range of reliability of this rate, treated in the calculations as a random variable, is calculated. This paper also gives a procedure for predicting the unit wear rate value of the refractory lining in the slag spout zone of an oxygen converter.
2. Materials and Methods
The subject of the study is unit wear rate of the spout refractory lining of an oxygen converter type TBM (Thyssen bottom metallurgy), with a nominal load capacity of 350 tons. The converter completed 2063 heats and was shut down due to the wear of the spout zone’s refractory lining. The converter was operated from August 2018 to January 2019. A high purity MgO-C material bonded with pitch was used in the slag spout zone. The material is classified according to PN-EN ISO 10081-3:2006 (classification of dense shaped refractory products—Part 3: basic products containing from 7 percent to 50 percent residual carbon) as type MC 95/10. Its chemical composition determined by WD XRF technique based on PN-EN ISO 26845:2009 (Chemical analysis of Refractory products by XRF—Fused cast bead method) is presented in
Table 1.
Shaped bricks made of the refractory material were formed on a hydraulic press with a unit pressure of over 1200 bar. The slag spout zone was lined with a combination of 90/80 and 90/20 flat wedges. The dimensions of the wedges are: 900 × 100 × 190/110 mm and 900 × 100 × 160/140 mm. The initial thickness of the working lining in the slag spout zone was 900 mm.
The converter is not equipped with a slag splashing installation. During the campaign, however, the refractory lining of the converter was maintained by gunning and slagging. The chemical compositions of the slags were typical for the converter process. Spectrometric, oxide chemical analysis of samples collected (n = 1459) during the campaign showed an average content of MgO, CaO, SiO2, Fe2O3, Al2O3 of 6.33 wt.%, 46.85 wt.%, 13.22 wt.%, 15.67 wt.%, 1.26 wt.%, respectively. The average basicity of the slag was about 3.74.
The wear rate of a refractory lining is usually expressed by the material wear rate per heat. The material loss depends on many process factors and on the properties of the lining material in a given zone. The unit wear rate of refractory materials is the basis for assessing the economic efficiency of the used materials, measured by the unit cost of steel production. The result of the lining thickness control, especially in the final stage of the converter operation, is the basis of the decision to end the equipment’s operation. On the basis of the measurements made during the campaign, decisions are also made on gunning and/or slagging the working lining of the oxygen converter.
Measurements of the residual thickness of the lining are made with a laser device. The device is placed in front of the empty converter in the slag spout position, so that a concentrated photon beam can scan the inside of the device. Before starting the converter campaign, a baseline measurement of the refractory lining is taken as a reference for the residual thickness measurements of the refractory working lining. The baseline measurement for subsequent measurements of the residual working thickness of the lining is taken at the converter’s safety lining. The safety lining is installed behind the working layer and provides refractory protection of the converter against liquid steel leakage when the working lining is already heavily worn. Safety linings are usually made of burnt magnesia materials type M90 or M95 (PN-EN ISO 10081-2:2006 (classification of dense shaped refractory products—Part 2: basic products containing less than 7% residual carbon). The frequency of the residual thickness measurements is dependent on the availability of the device (converter) and the condition of its refractory working lining. The results of the measurements, in the form of wear maps with values of residual thickness in all zones, constitute the basis for assessment of the condition of the refractory lining, qualifying the converter for further operation. The unit wear rate of the refractory materials is calculated from the residual thicknesses measured during the converter’s campaign, as the difference of the consecutively measured residual thicknesses of the refractory lining related to the difference in the number of heats, and dividing these measurements according to the formula:
where w
i—unit wear rate, G—laser-measured residual thickness, i and k are the number of successive heats for which measurements have been made, where i > k.
In the calculation part of the paper, Bayesian inference was used. This allows the use of
a priori information (often called initial belief), resulting from knowledge of the research problem and the knowledge of the given phenomenon, in order to obtain
a posteriori information (often called empirical probability, outcome), obtained using the likelihood function. This methodology is based on Bayes’ theorem of conditional probability, known from probability calculus [
9,
10,
11]:
where
,
are conditional probabilities, and
are probabilities of events A and B. Bayes’ theorem for a continuous probability distribution has the form [
12]:
The derivation of the formulas for the mean value and parameters’ precision of the a
posteriori distribution when the
a priori distribution is a normal distribution, and the observed data obtained from a normal distribution is given, for example, in [
6]. These quantities are expressed by Equations (4) and (5):
where
is the precision, σ—standard deviation, n—number of measurements of analyzed quantity,
—consecutive measurement, τ
0—assumed precision of the distribution, indices zero denote hyperparameters of the distribution that result from
a priori knowledge of the problem. In another notation, without the use of the quantity called precision, formulas for the mean value and variance of
a posteriori distribution are derived, e.g., in the work [
13].
3. Results
The averaged results of the laser measurements of the wear of the oxygen converter’s refractory lining in the slag spout zone (left and right spout) are shown in
Figure 2.
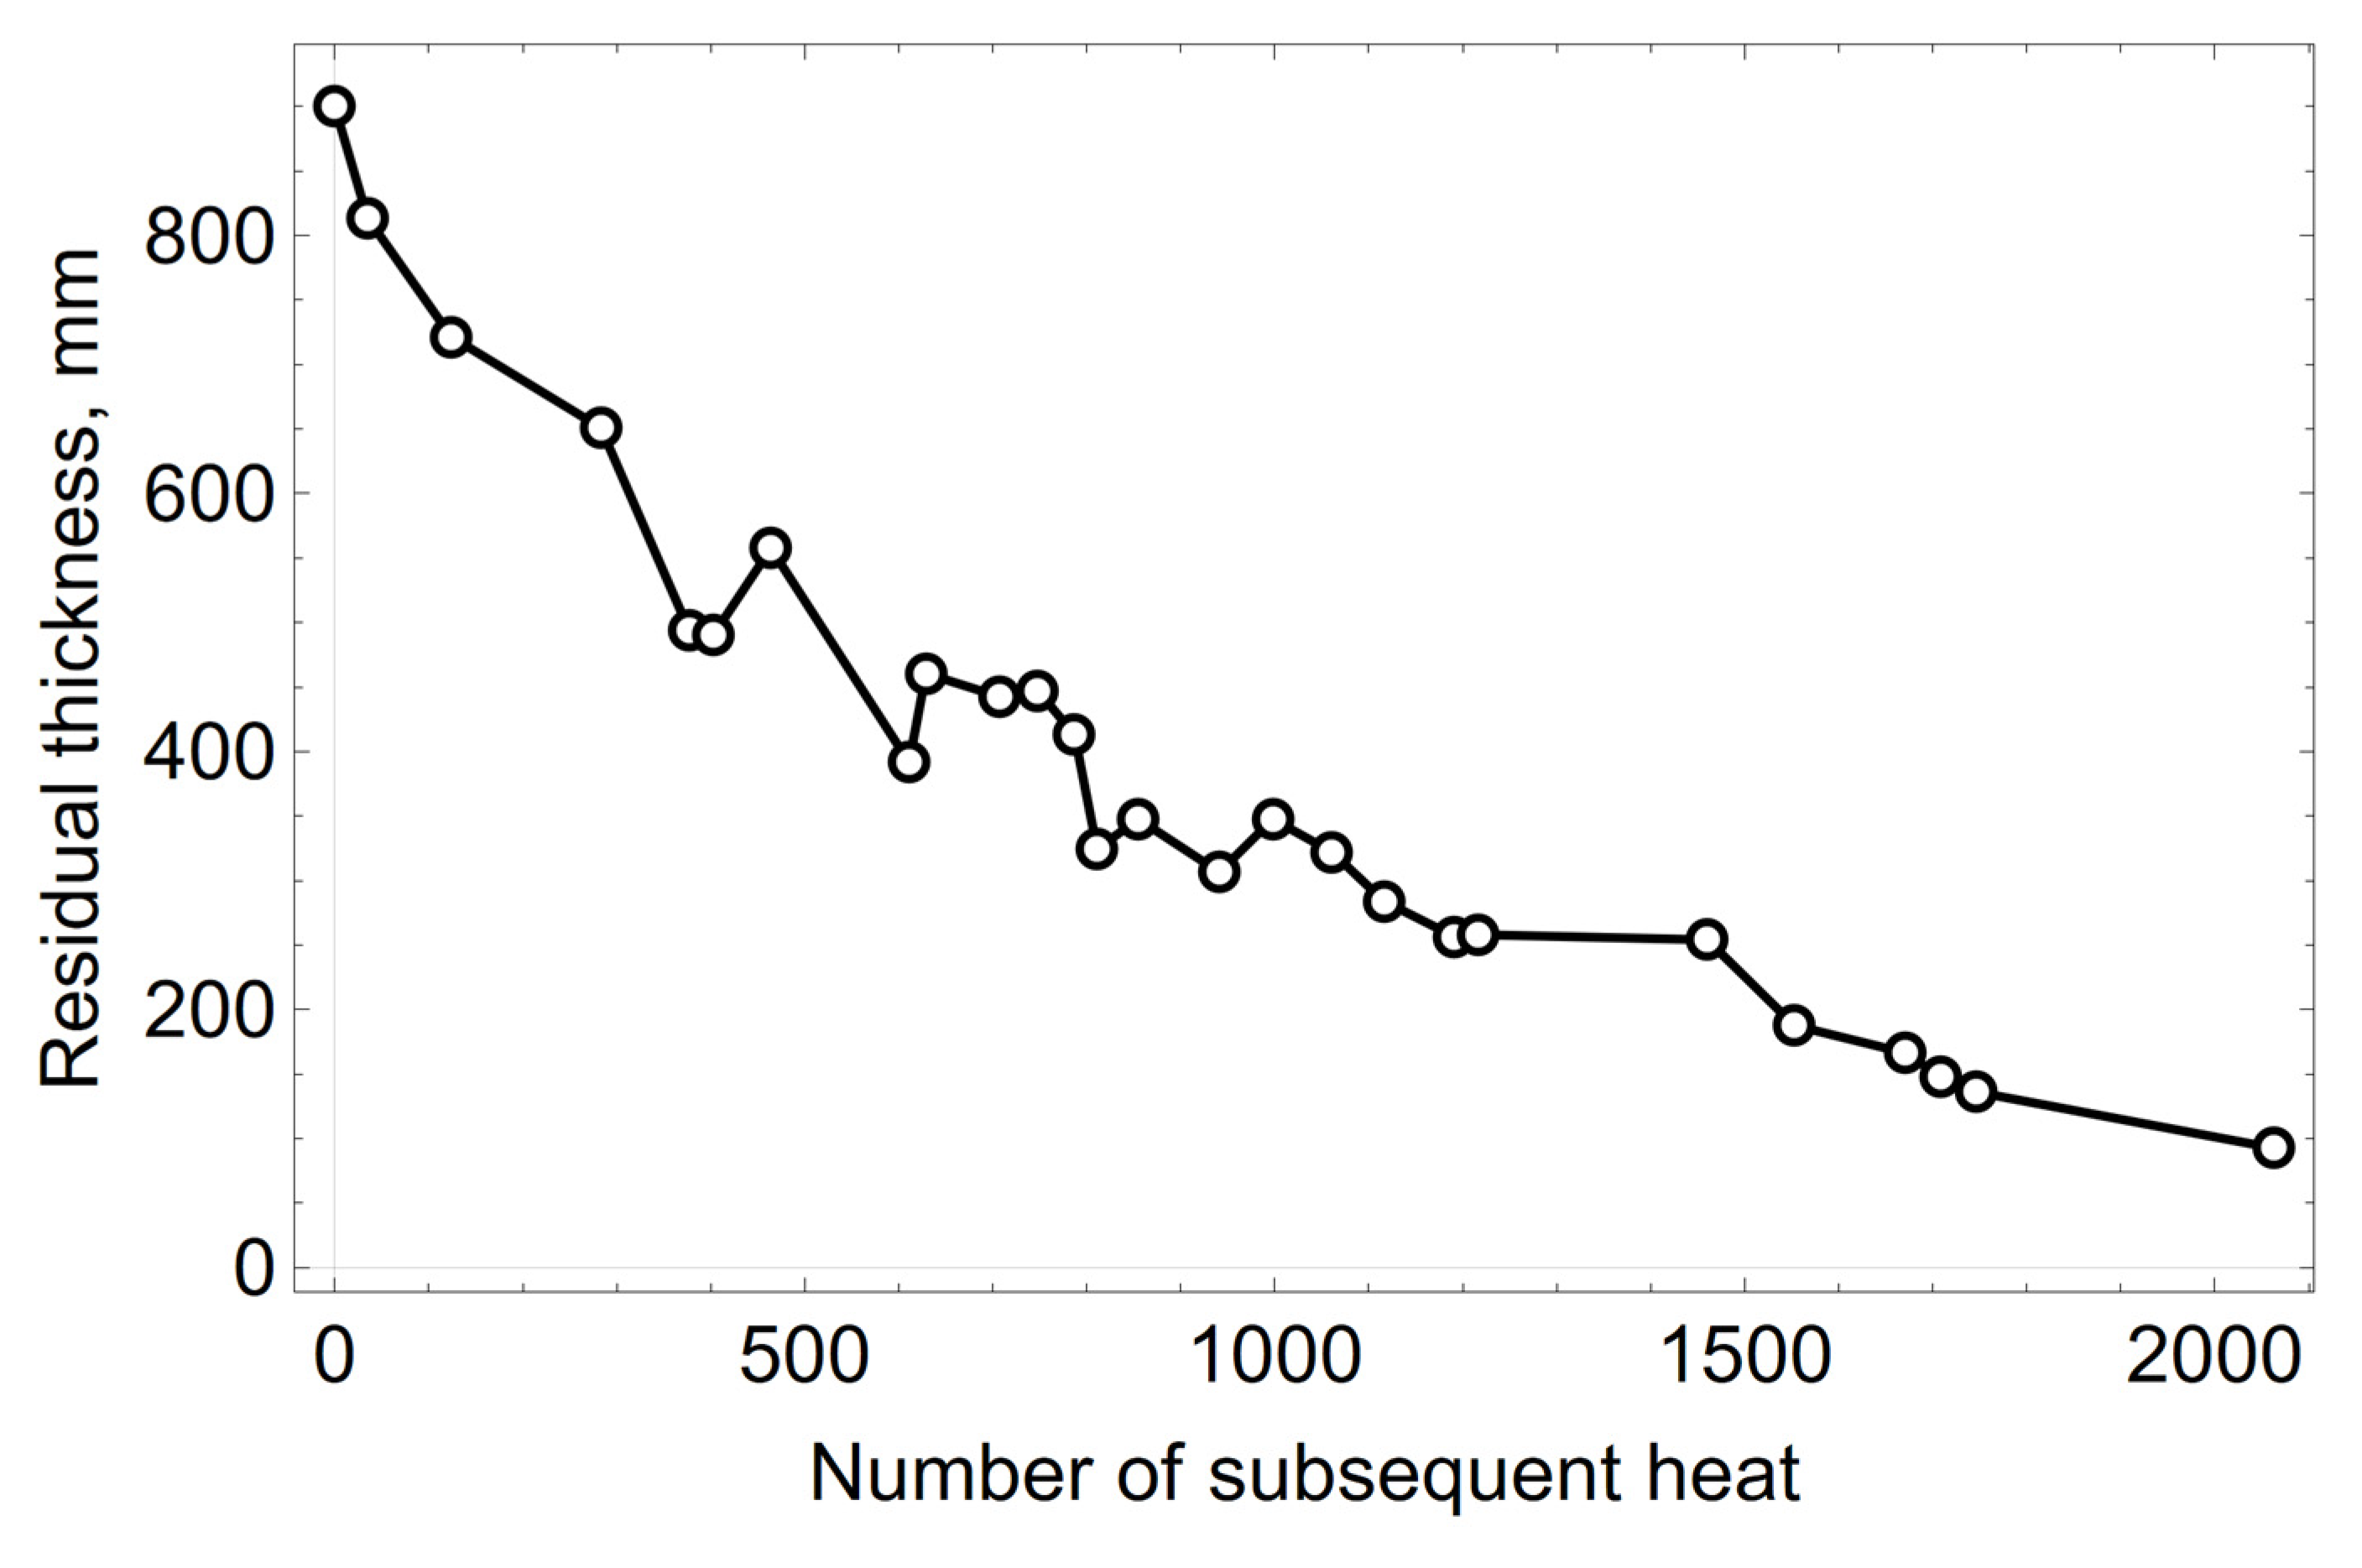
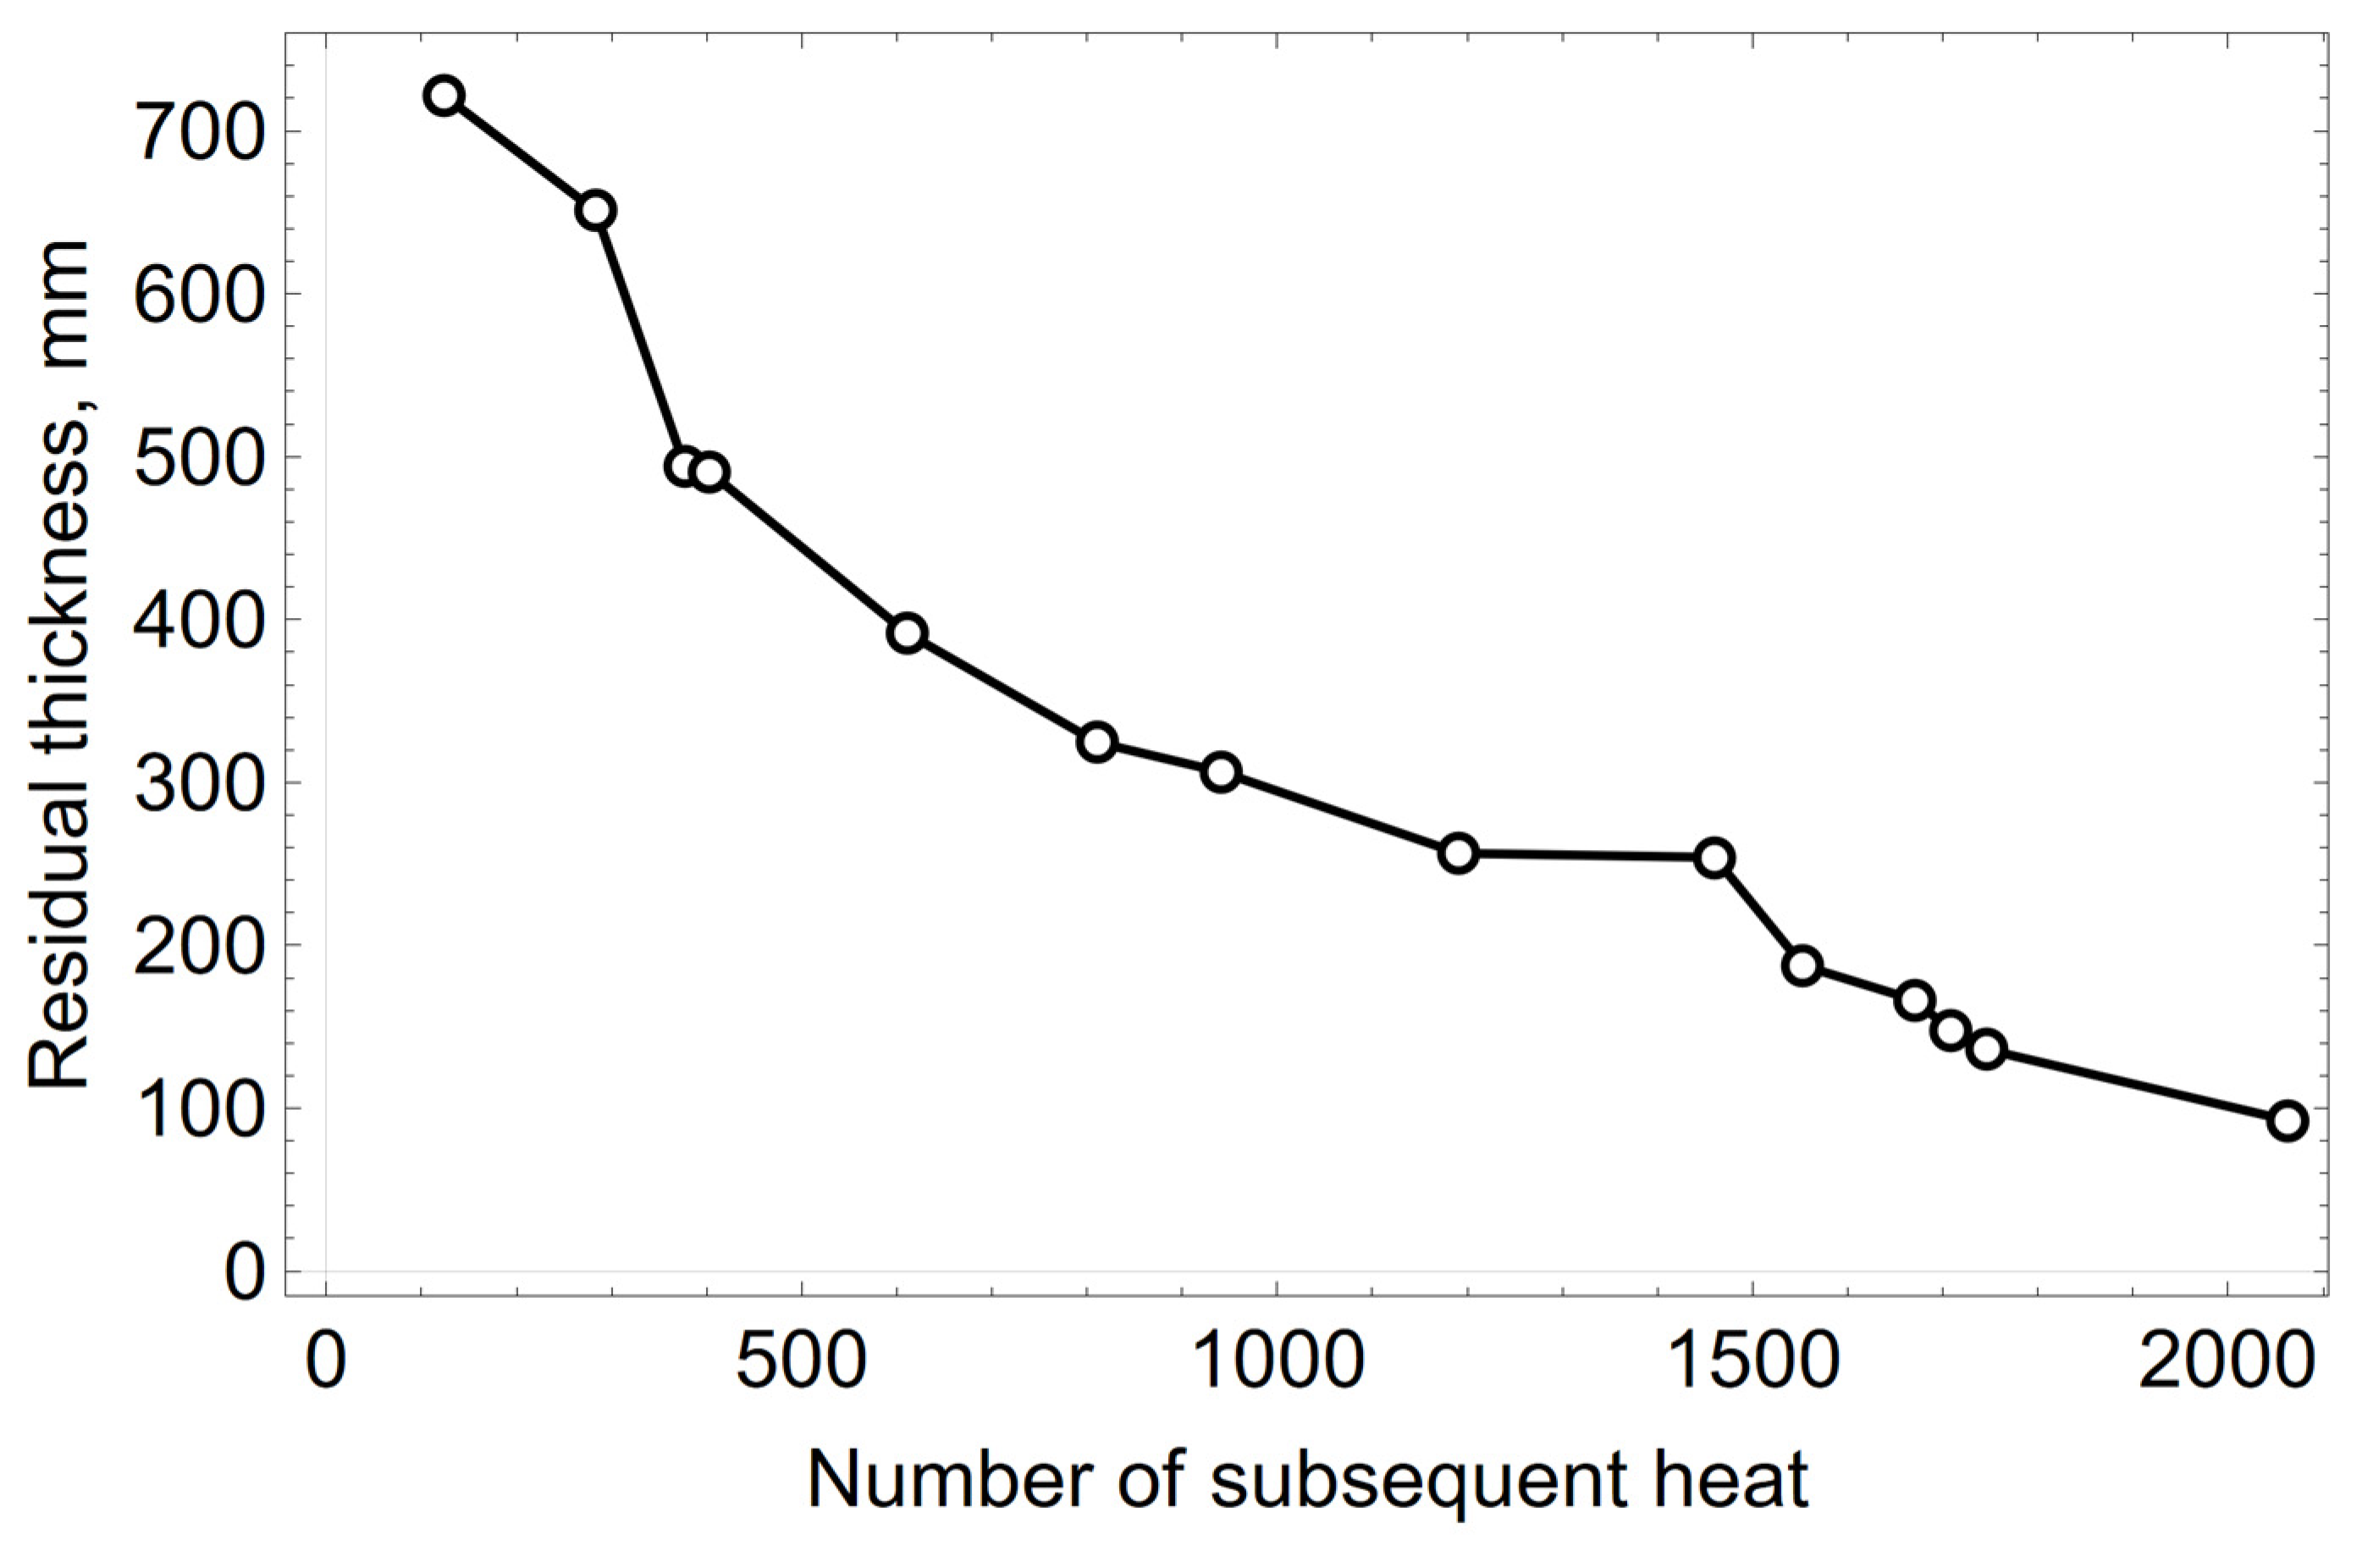
The thickness of the refractory lining of the converter decreases over time. The points visible in
Figure 2, where an increase in the thickness of the lining was found, come from measurements taken after maintenance (repair) of the converter’s refractory lining, using auxiliary materials. This means that, in order to protect the refractory lining, a layer of material, in the form of refractory gunning masses and/or processed slag partially saturated with MgO, had been applied to the walls of the converter, which reduces the wear rate of the working lining. In the following calculations, the thickness measurements of the refractory lining for which an increasing residual thickness was observed compared to the previous measurement were not considered. Measurements made at the beginning of the campaign were also not taken into account. The high loss of the refractory lining, expressed by the loss of the refractory material in the slag spout zone, amounted to 182 mm in the initial period of the converter operation, till the 123th heat. As already mentioned, this was connected with thermomechanical loads. Therefore, for further calculations the measured data from the 124th heat and onwards were adopted. The corrected curve of the residual thickness measurements is shown in
Figure 3.
The wear rate values of the spout zone’s refractory lining for the cases considered in the graph shown in
Figure 3 are as follows: w
n = 443, 1670, 135, 476, 335, 138, 200, 9, 715, 179, 487, 316, and 137 µm heat
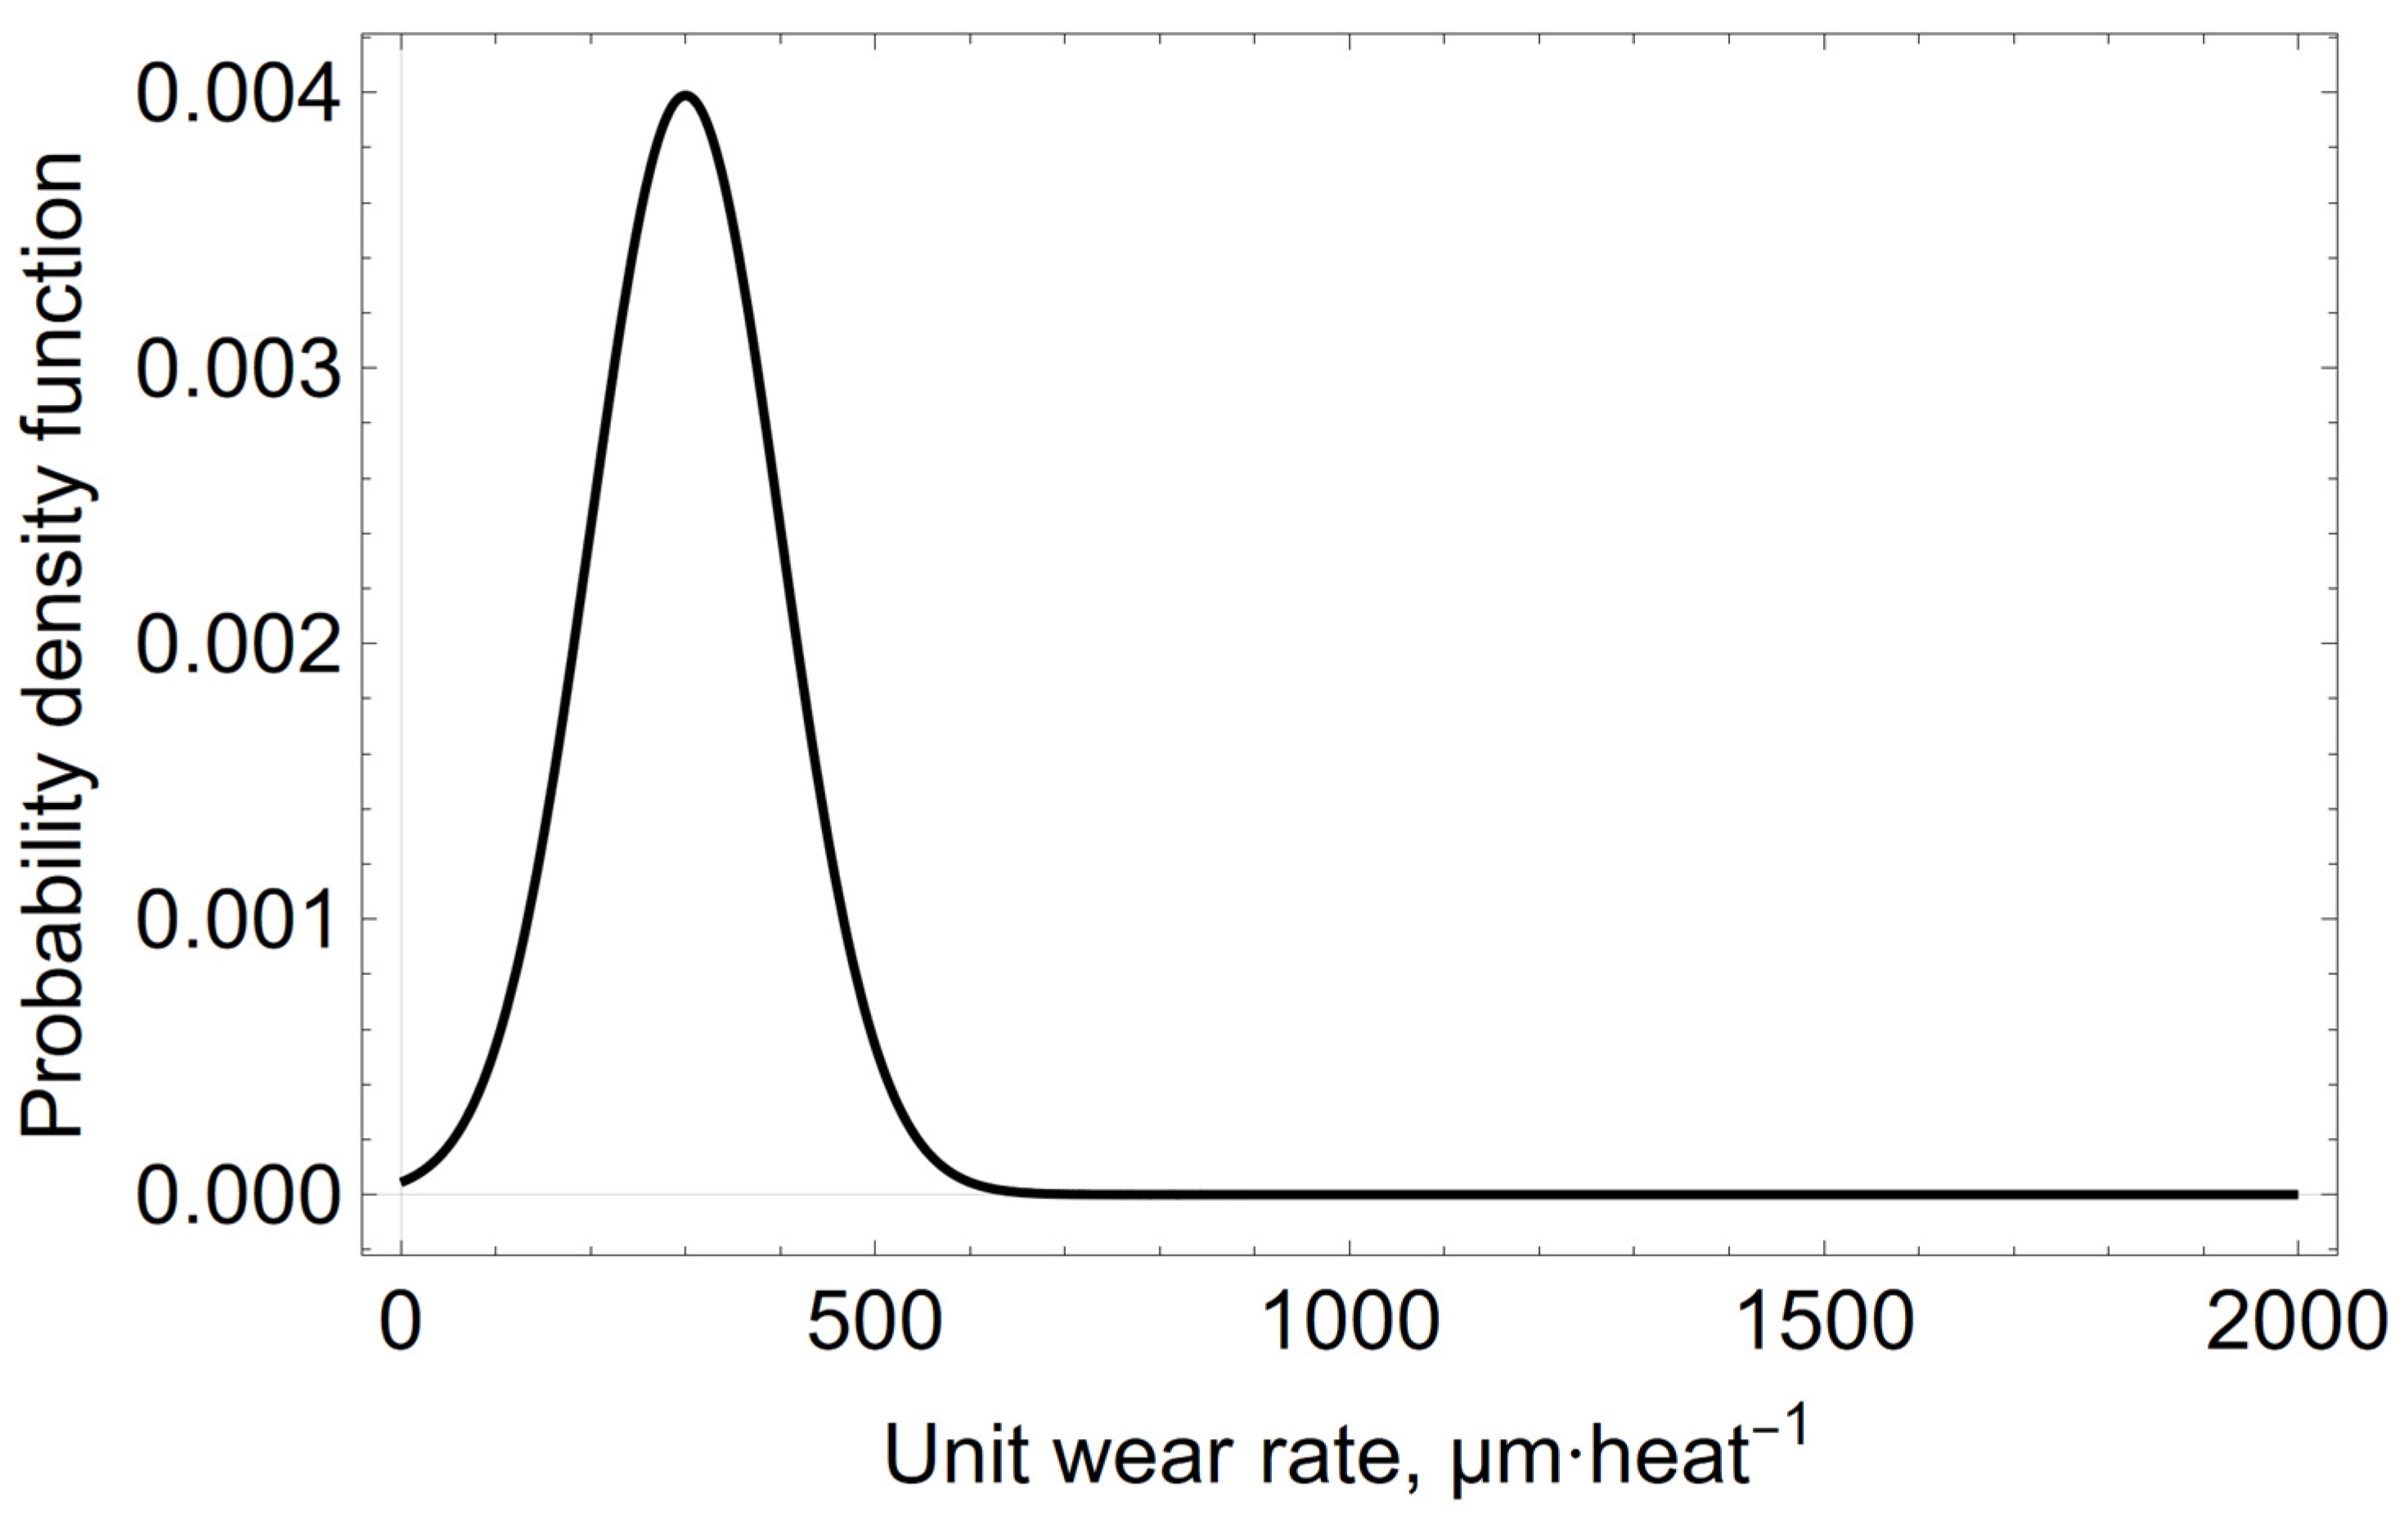
−1, where n = 1, …, 13. From the data analysis of the previous converter campaigns, it is believed that the average wear rate in the campaign will be μ
0 = 300 µm heat
−1, with the standard deviation σ
0 = 100 µm heat
−1. The
a priori distribution of the unit wear rate values of the refractory lining expressed by the normal distribution for the assumed assumptions is presented in
Figure 4.
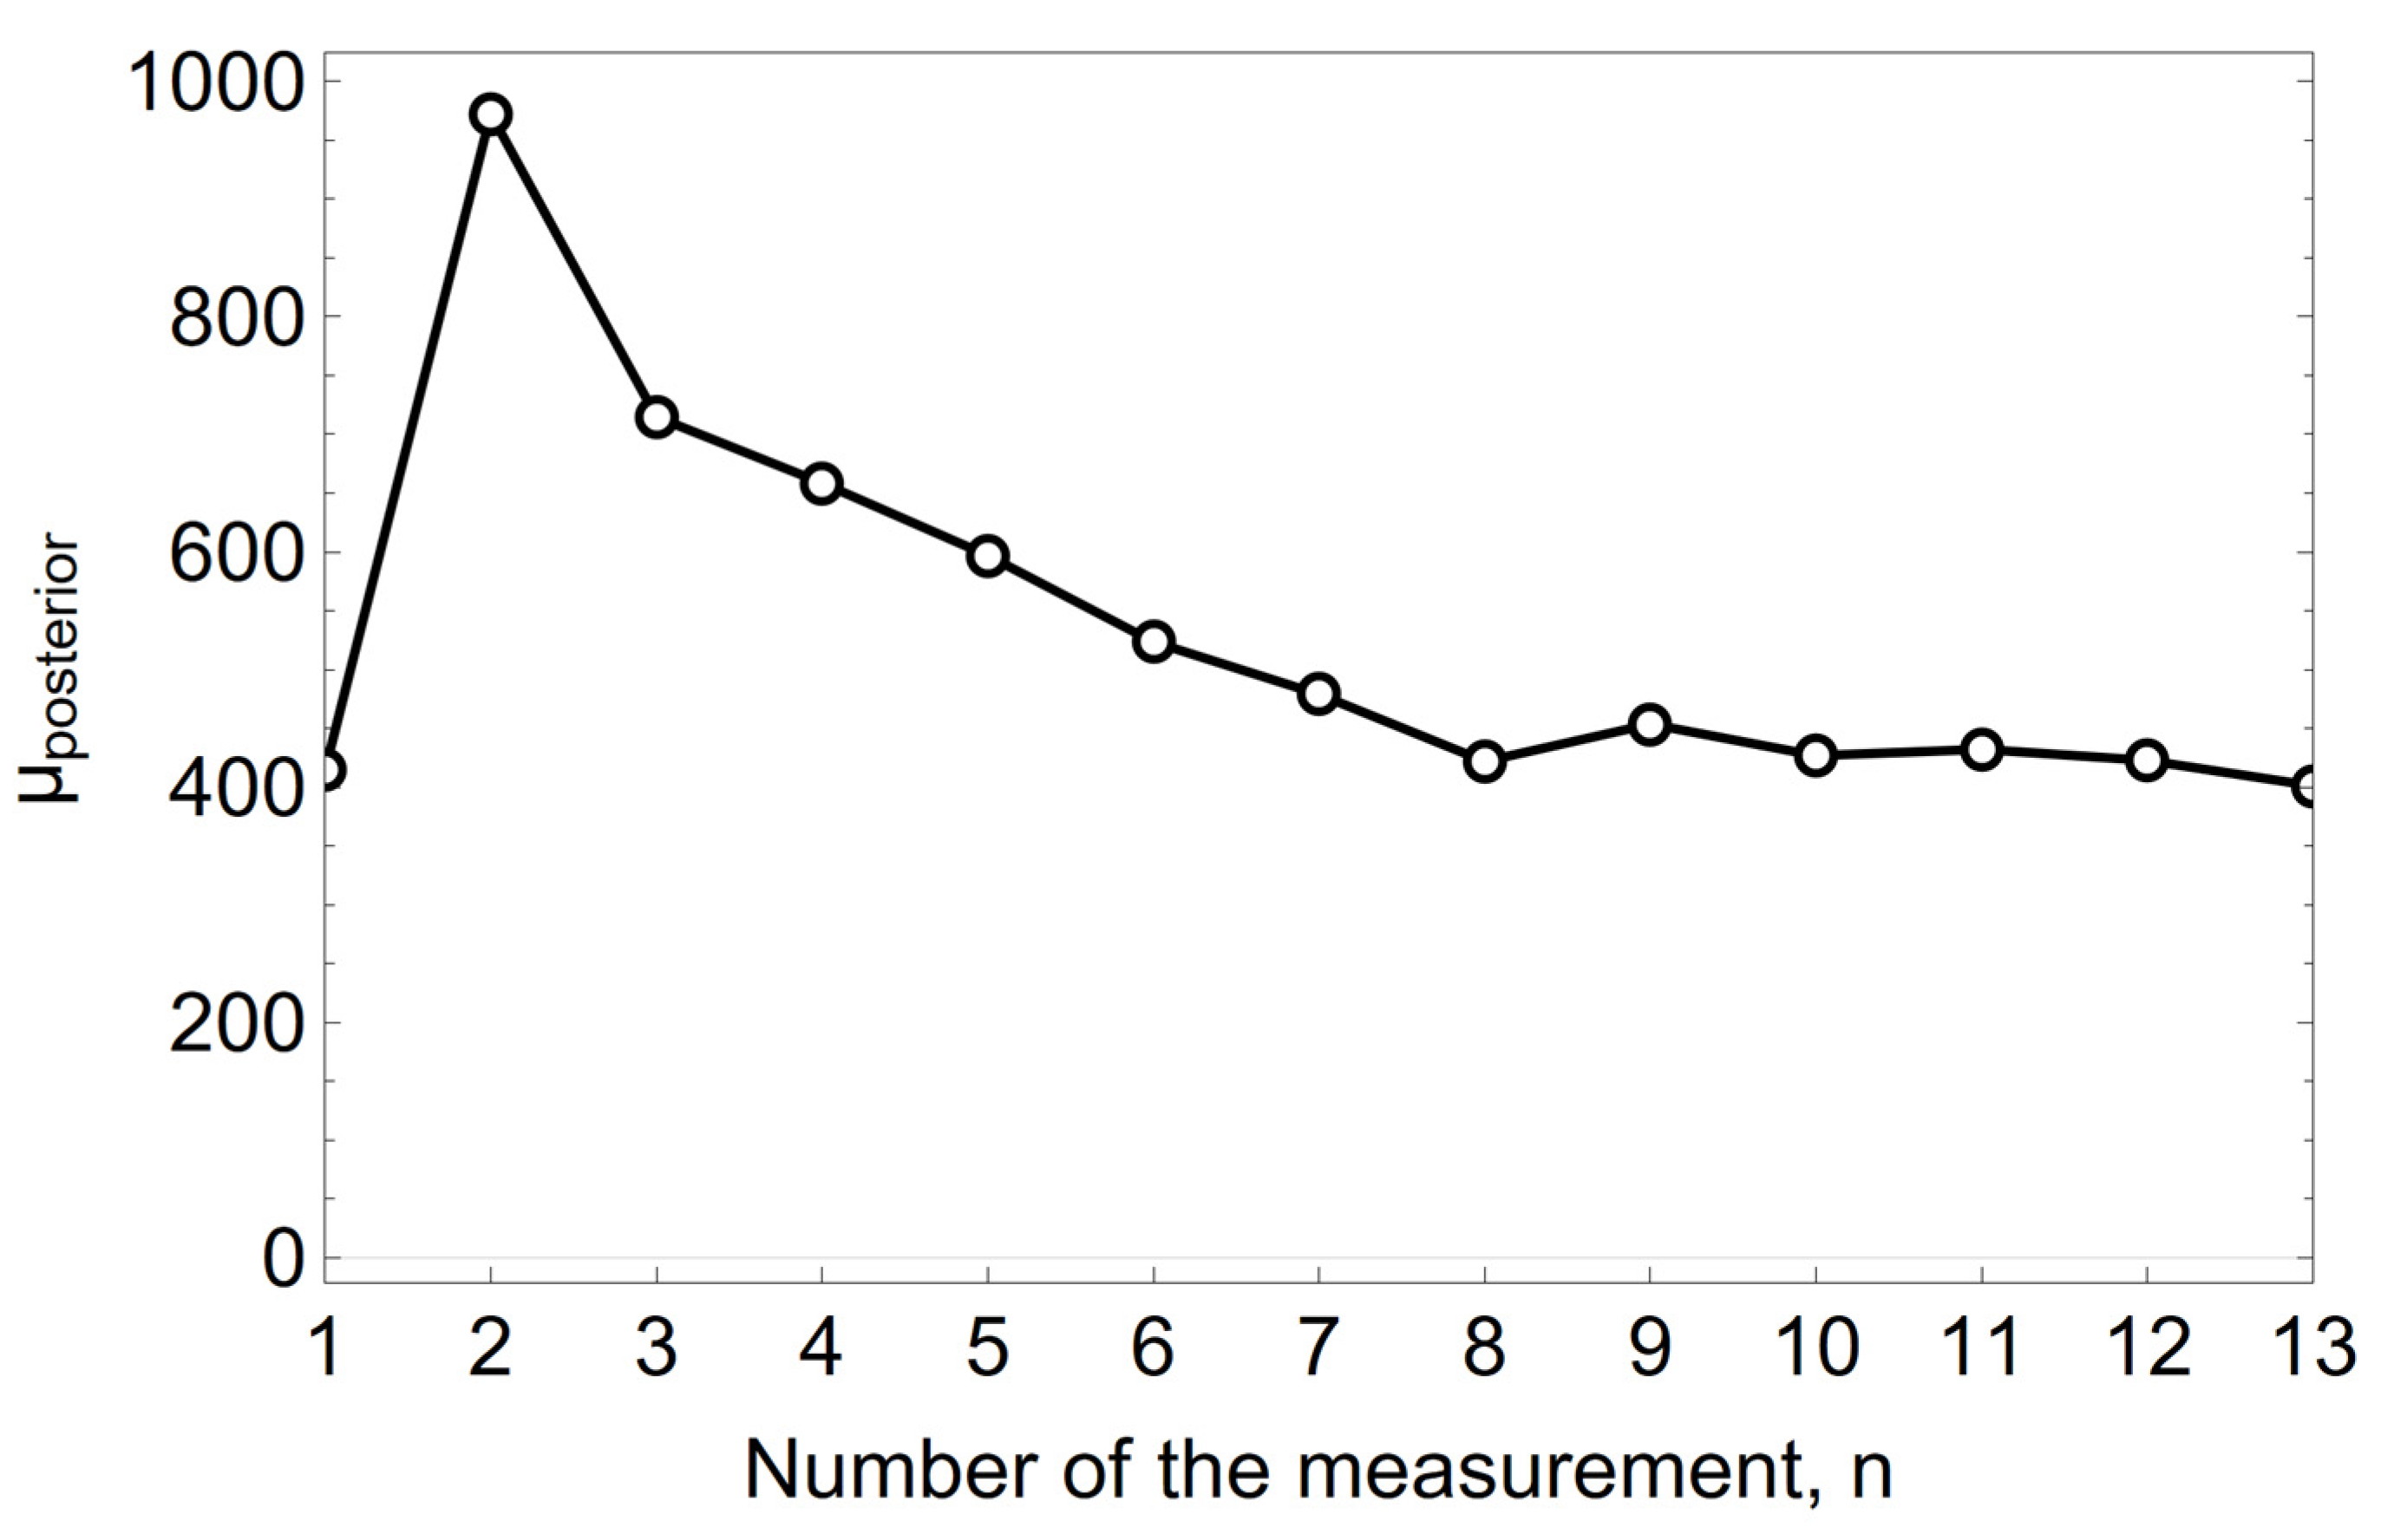
The mean value of the
a posteriori normal distribution for the conjugate solution, assuming the normality of the
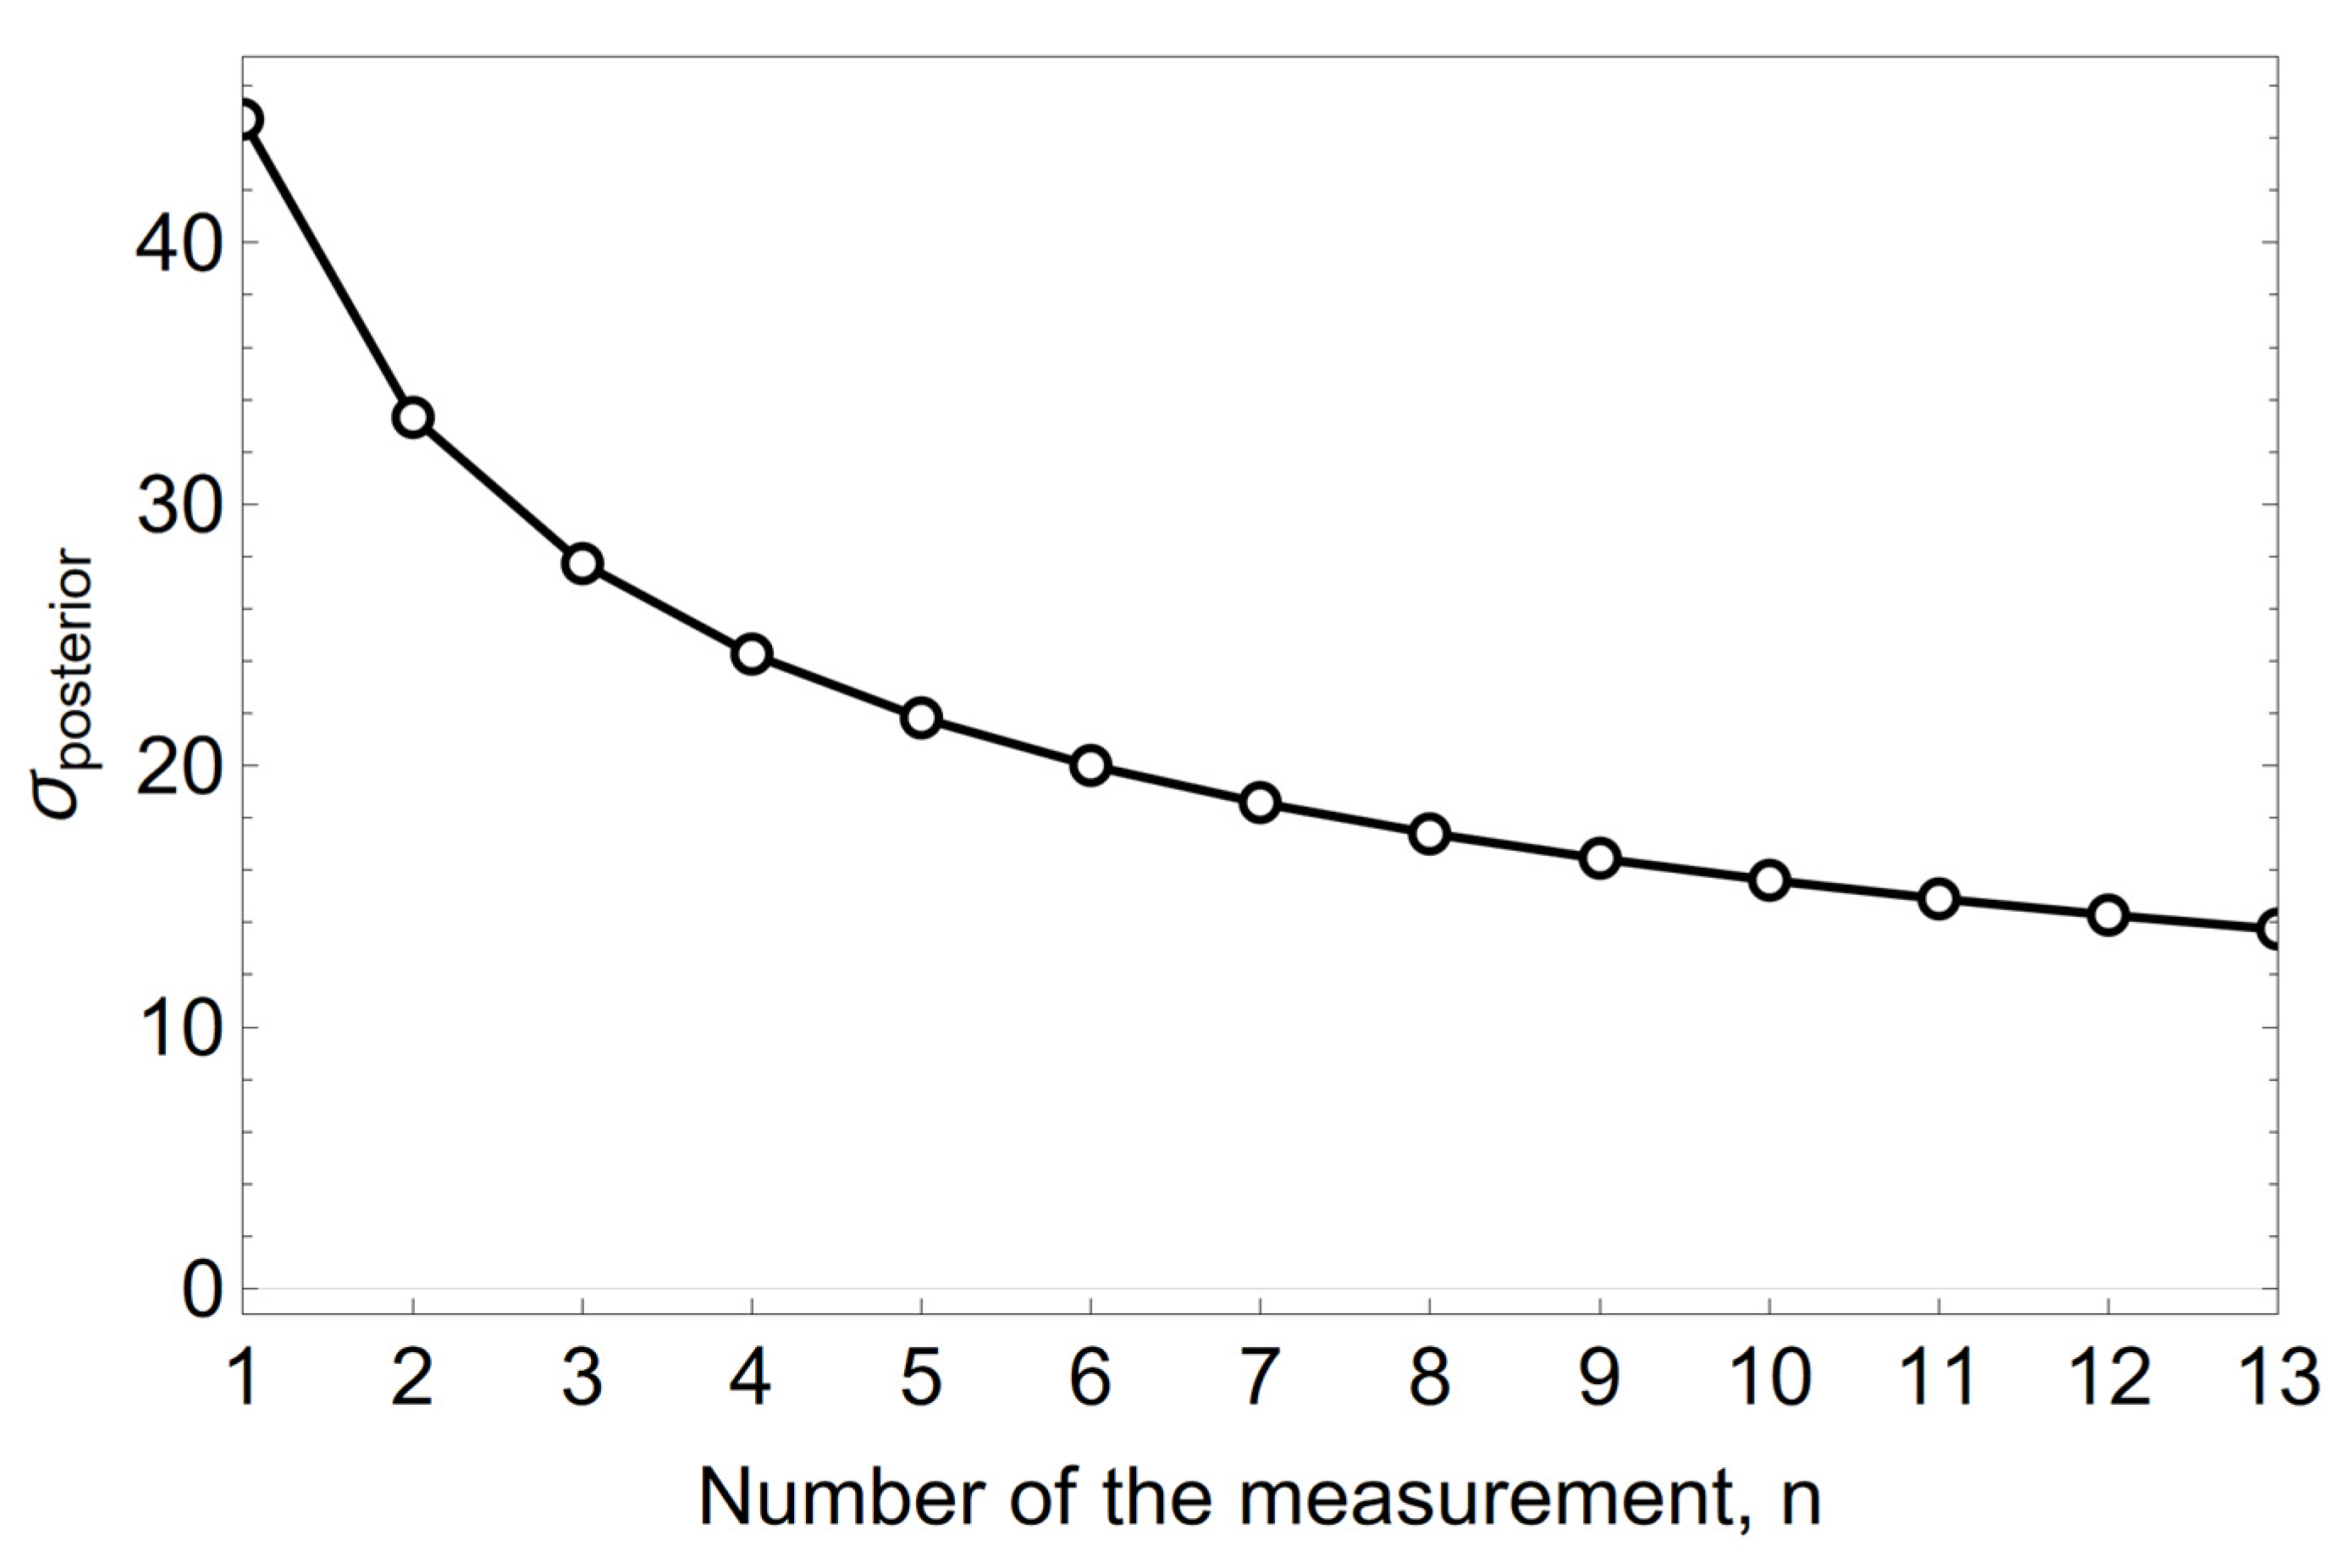
a priori distribution, is calculated according to Formulas (1) and (4). The precision, which is the inverse of the variance σ
2, is expressed by Formula (5). For a known standard deviation σ = 50 µm heat
−1 and with the hyperparameters of the
a priori distribution being μ
0 = 300 µm heat
−1 and
σ0 = 100 µm heat
−1, the values of μ
aposteriori and τ
aposteriori calculated from Formulas (4) and (5) for successive measurements are shown in
Figure 5 and
Figure 6.
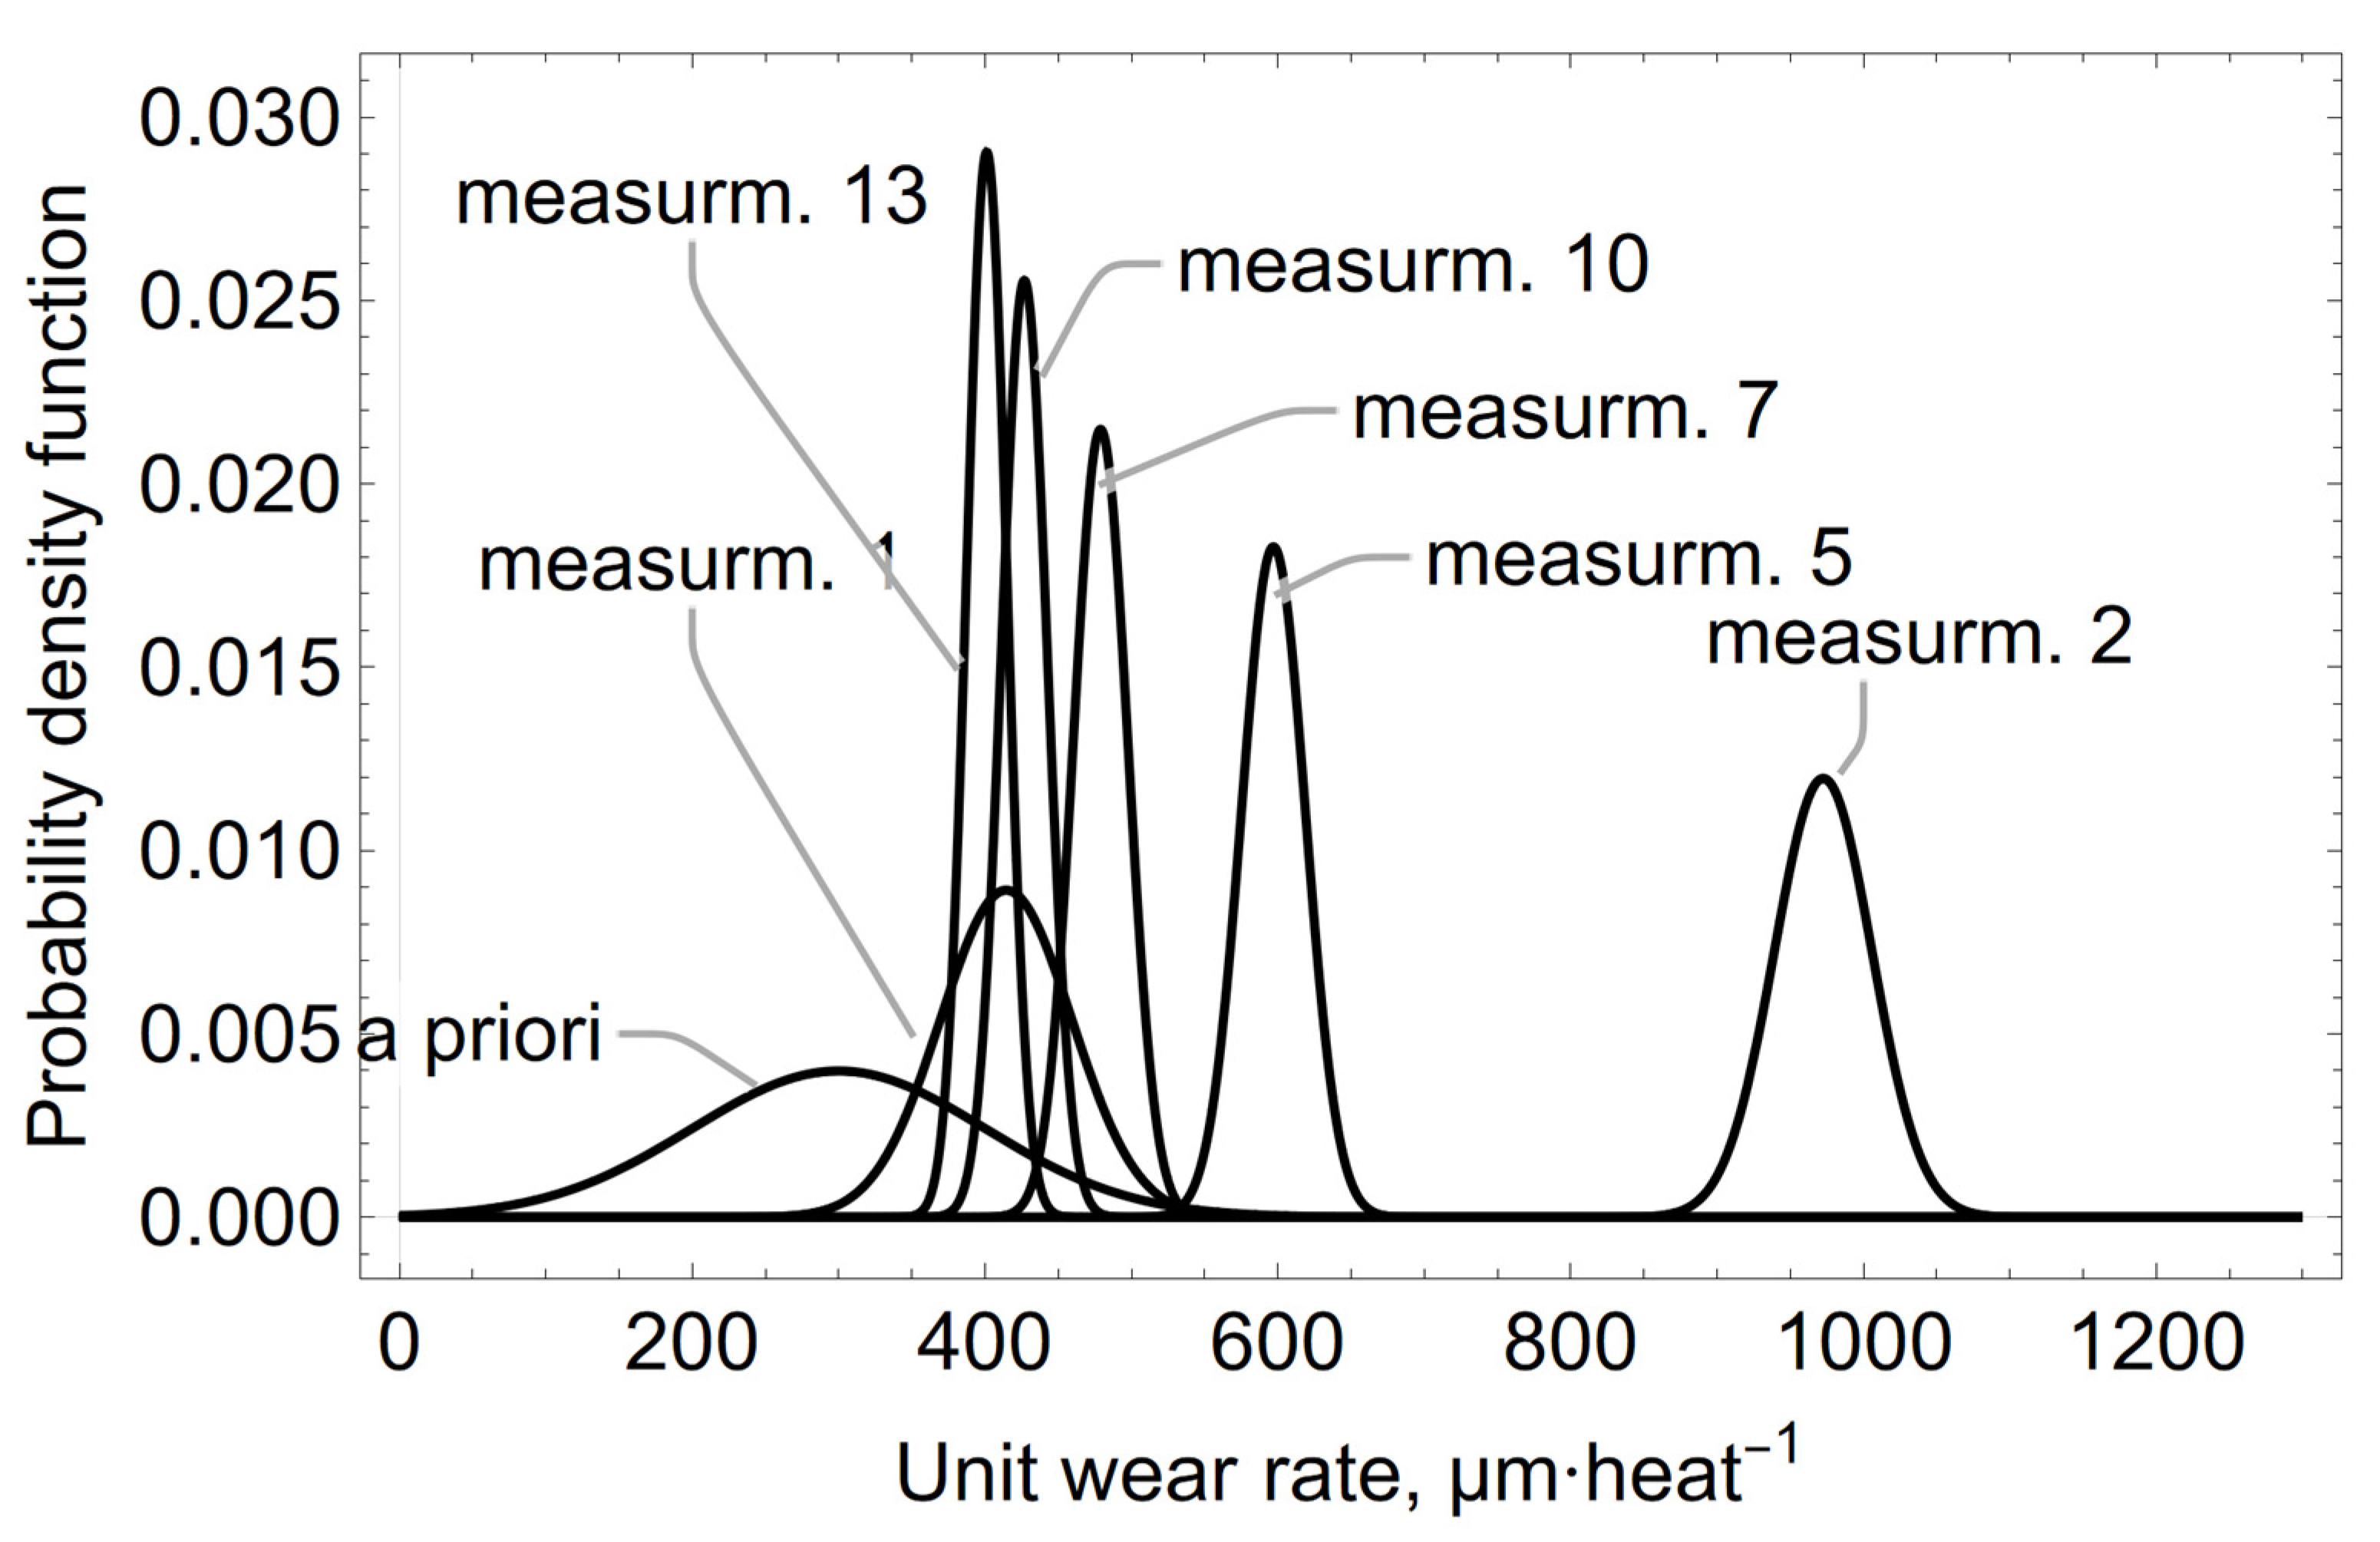
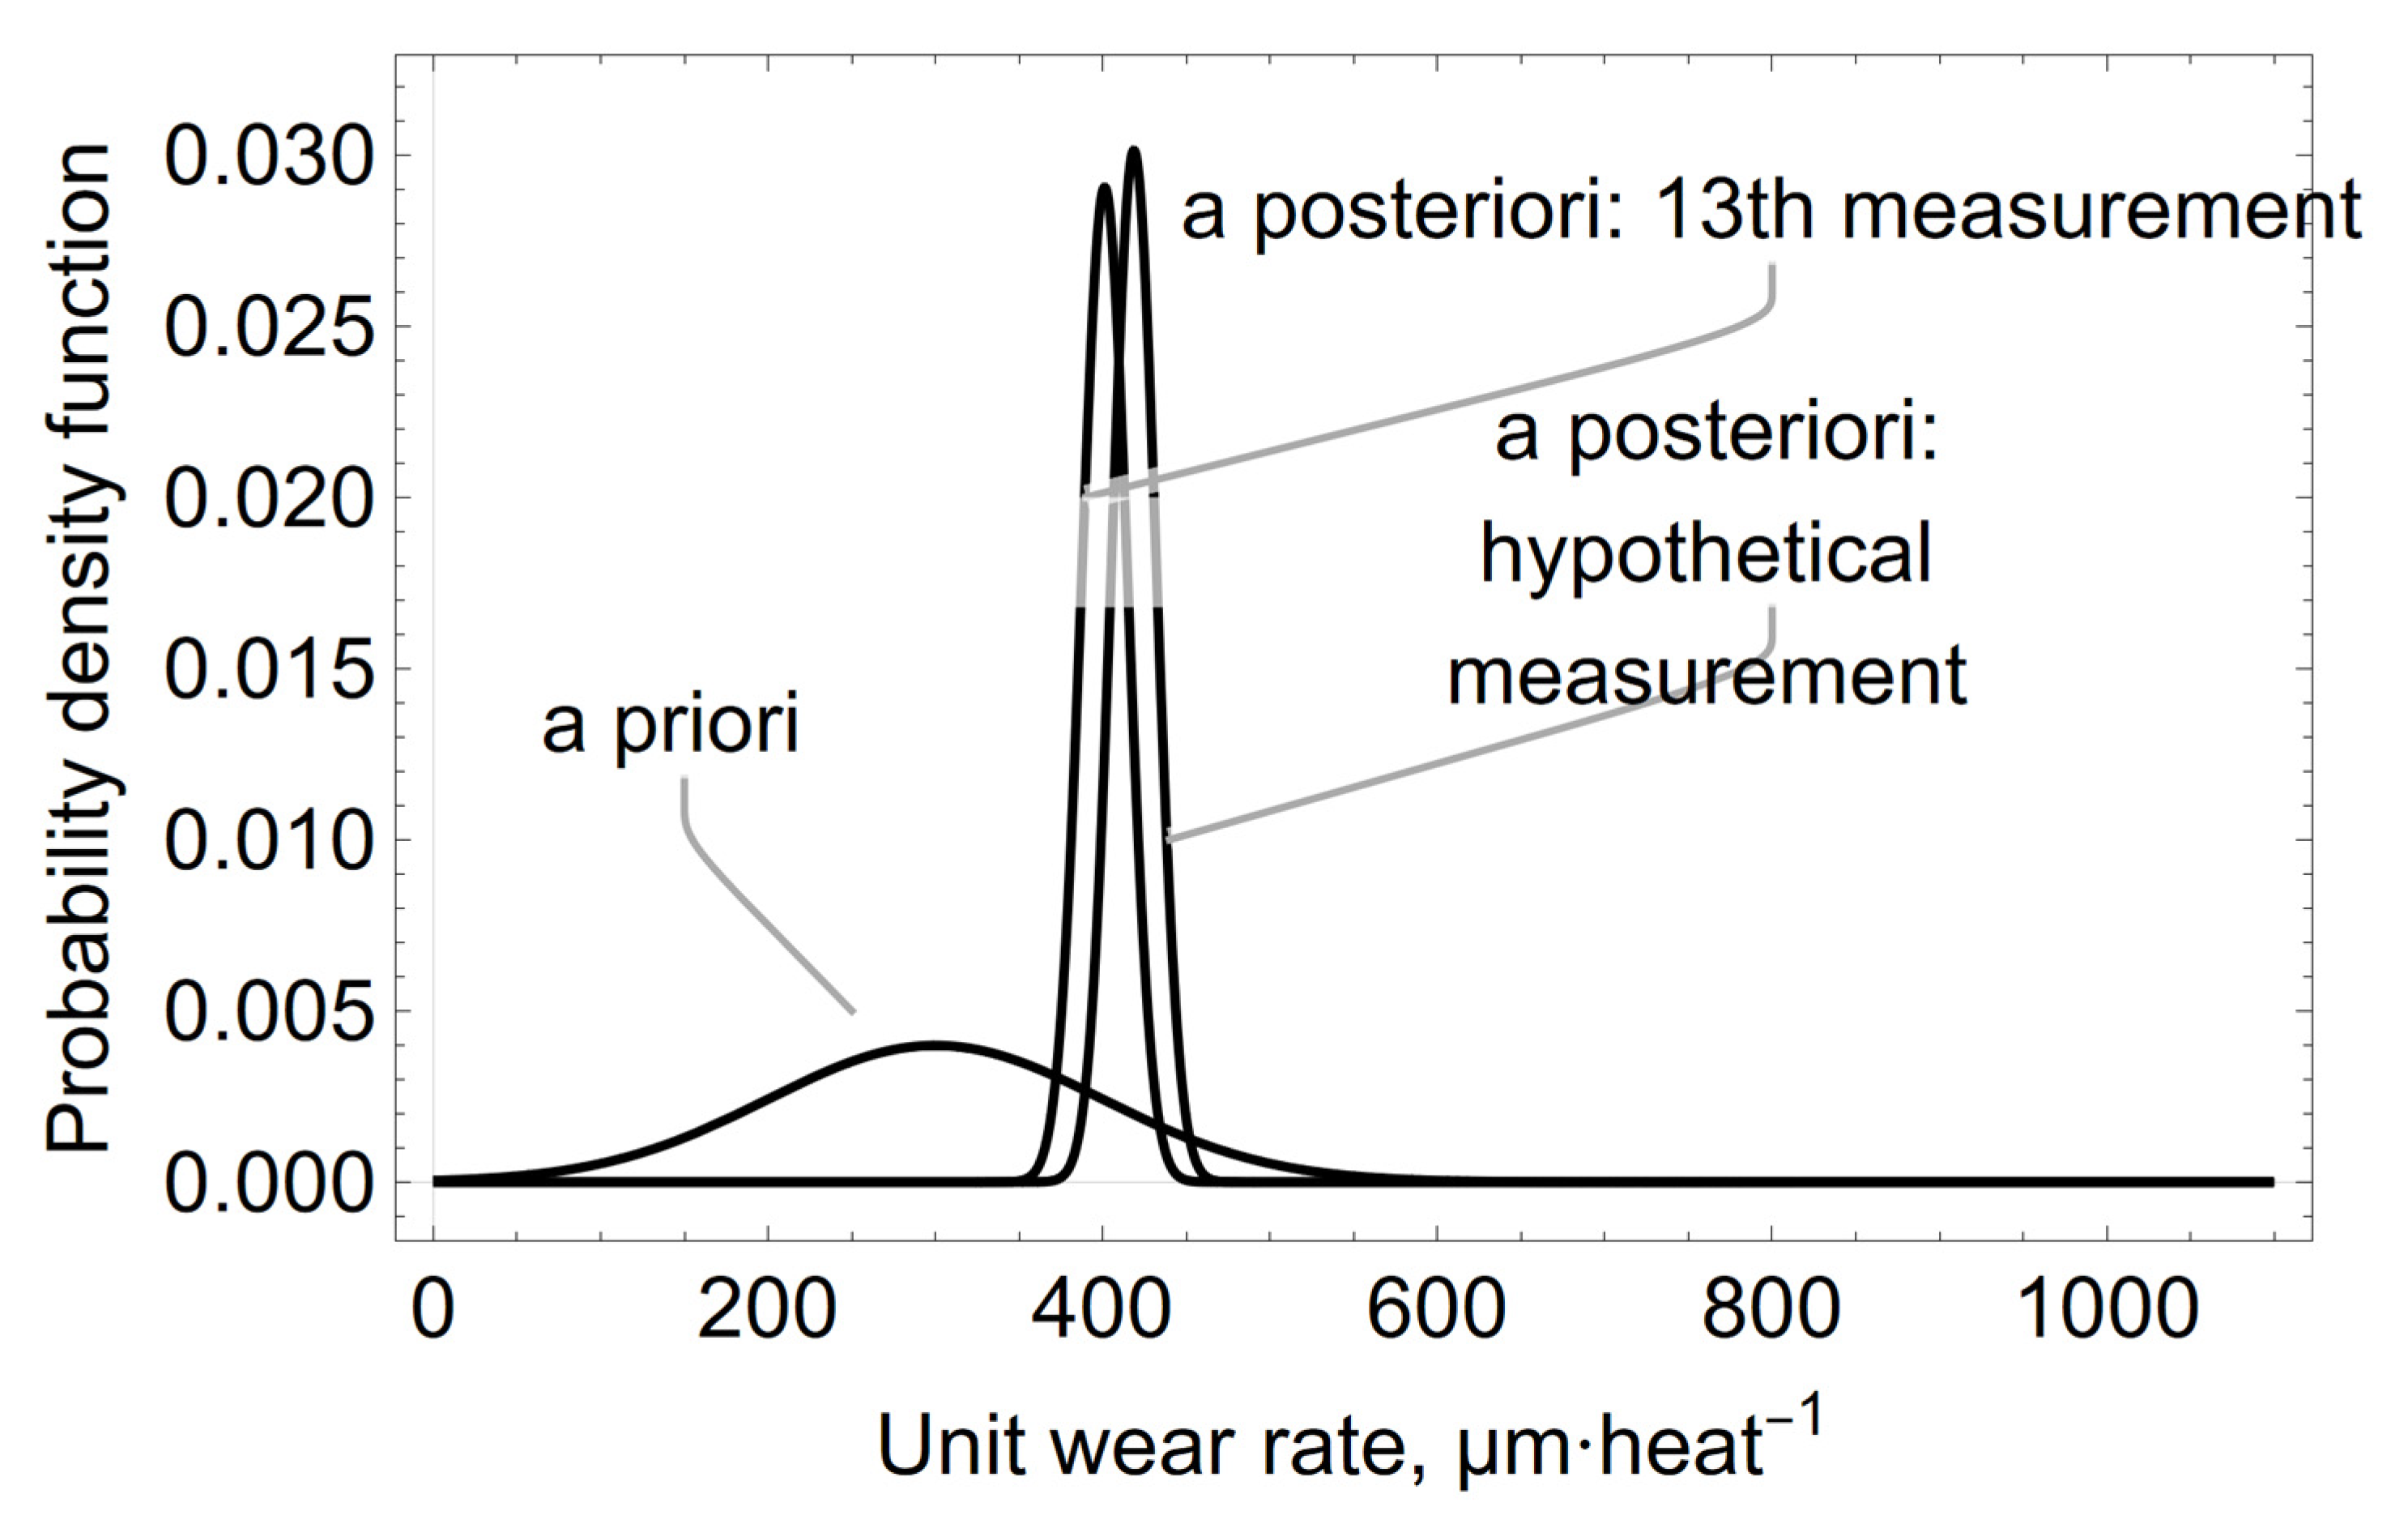
The evolution of the
a posteriori distribution of the average refractory wear rate of the spout zone, calculated from Equations (4) and (5) for 13 consecutive rate measurements, is shown in
Figure 7.
The obtained results allow the calculation of credible intervals for the random variable µm heat
−1, which are equivalent to the confidence intervals in the frequency approach to statistical inference. Thus, the average unit wear rate of refractories after 13 measurements is μ = 401.23 µm heat
−1, standard deviation σ = 13.74 µm heat
−1. The calculated quantiles of the unit wear rate for
a posteriori distribution are shown in
Table 2.
The resulting a posteriori distribution for the Bayesian inference can be used as a starting point for further calculations, e.g., to forecast the wear rate. With the new results, a new confidence interval can be calculated, as well as a new mean value and standard deviation of the a posteriori distribution.
The calculations above were carried out using conjugated solutions, where the a priori distribution and the likelihood function were expressed by normal distributions. The result of the calculation, in the form of an a posteriori probability distribution of the unit refractory wear rate value, also belongs to the class of normal probability distributions of random variables.
These calculations were verified using the R software and one of the libraries supporting Bayesian inference. In contrast to the conjugated solution, the use of the Monte Carlo method based on Markov chains involves the generation of random samples from
a posteriori distributions, together with the approximation of their characteristics. The results obtained using the MCMCpack library and the Monte Carlo algorithm [
14,
15,
16], sampling in a Markov chains sequence for 10,000 samples, can be obtained using the following R code:
library(MCMCpack)
#data
w = c(443, 1670, 135, 476, 335, 138, 200, 9, 715, 179, 487, 316, 137)
#known standard deviation
sigma2 = 50^2
# hyperparameters of the apriori distribution
mu0 = 300
tau20 = 100^2
# function call to calculate the distribution of aposteriori
set.seed(1234)
posterior <− MCnormalnormal(y, sigma2 = sigma2, mu0 = mu0, tau20 = tau20, 10,000)
# summary of results
summary(posterior)
quantile(posterior, c(0.025,0.5,0.975))
mean(posterior)
# apriori and aposteriori distribution diagram
plot(posterior)
grid <- seq(0,1300,0.5)
plot(grid, dnorm(grid, 300, 100), type = “l”, col = “red”, lwd = 3, ylim = c(0,0.03),
xlab = “mu”, ylab = “density”)
lines(density(posterior), col = “blue”, lwd = 3)
legend(‘topright’, c(“prior”, “posterior”), lwd = 3, col = c(“red”, “blue”)) |
The results obtained using the R code and the MCMCpack library are:
- -
average wear rate of 401.22 µm heat−1,
- -
95% confidence interval: [374.77, 427.86] µm heat−1.
The accuracy of the calculations was also checked using the “MetropolisHastingsSequence” function [
17] available in the repository of additional functions of the Wolfram language [
18]. The calculations performed with the use of Wolfram Mathematica version 12.31 allowed obtaining the 95% confidence interval of the unit refractory wear rate in the slag spout zone of the converter, being:
Both ranges are insignificantly different.
The unit wear rate value of the above described refractory lining of the oxygen converter treated as a random variable was experimentally verified after the oxygen converter’s campaigns, which were in operation between February 2019 and November 2019. The mean value of the unit wear rate was calculated as µ = 420 µm heat−1, and this is within the above calculated confidence ranges.
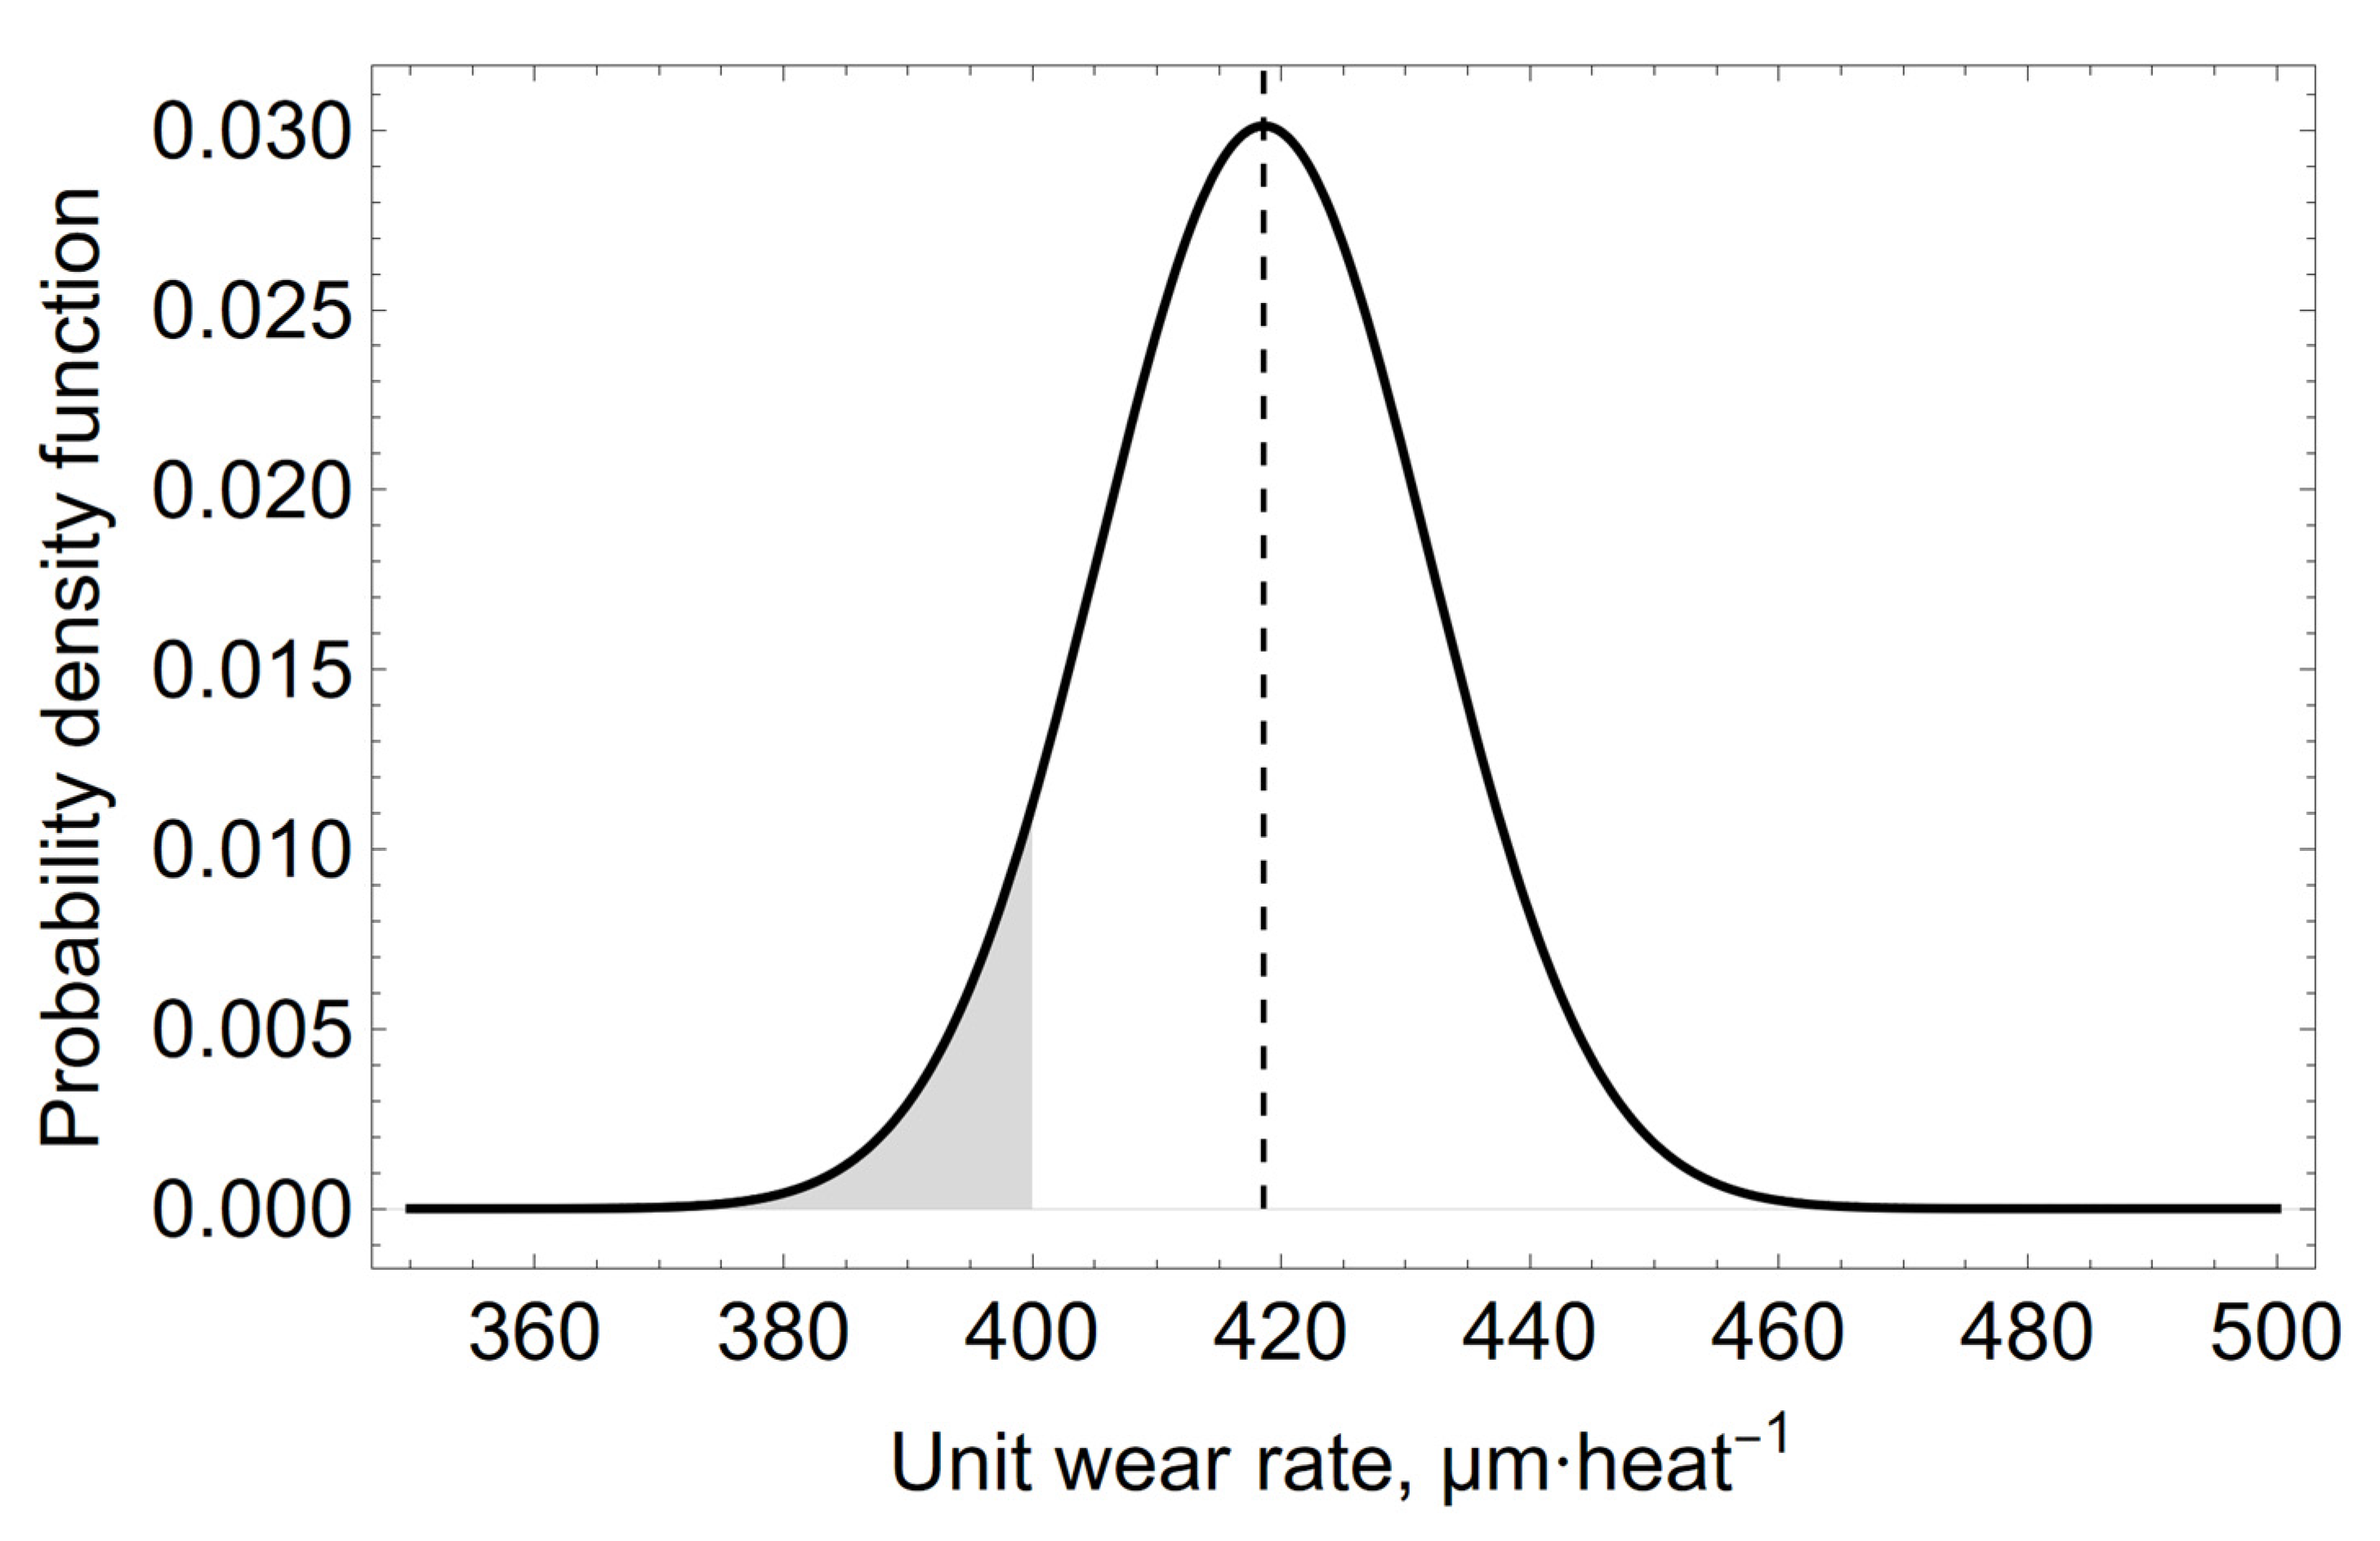
In order to predict the value of the unit wear rate of the refractory lining in the slag spout zone of the oxygen converter, it was assumed that the hypothetical 14th measurement result of the residual thickness of the residual lining would be
xp = 650 µm heat
−1 then, using Formulas (4) and (5) for i = 14 and n = 14, new mean values of the unit wear rate and its standard deviation were calculated. The new
a posteriori distribution is shown in
Figure 8.
The predicted mean value of the unit wear rate and the standard deviation will be
μp = 418.6 µm heat
−1 and σ
p = 13.1 µm heat
−1, respectively. The calculated quantiles of the unit wear rate for the predicted
a posteriori distribution calculated in µm·heat
−1 are shown in
Table 3.
A question that is important for converter users is, what is the probability for the specific wear rate to be, for example, less than 400 µm heat
−1. After using a hypothetical 14th measurement of the specific wear rate (
xp = 650 µm heat
−1) in the calculation and determining the form of its
a posteriori distribution, the probability that the specific wear rate will be less than 400 µm heat
−1 is less than 8%, as shown in
Figure 9 by the shaded area under the probability density distribution curve.
4. Discussion
The Bayesian evolution of the mean value of μ µm heat
−1 unit wear rate of the refractory material MC 95/10 in the spout zone, shown in form of graphs in
Figure 5,
Figure 6 and
Figure 7, illustrates the effect of changing the
a priori distribution and the likelihood function on changing the
a posteriori distribution by changing the mean value of the distribution and reducing its variance as the information from the measurement-sampling increases.
Subsequent iterations in the model calculations, carried out by increasing the sample amount (measurements), updated the knowledge of the distribution probability of the value of the unit refractory wear rate in the slag spout zone and its variance.
The results predicting the mean and distribution variance of the unit wear rate value of the steel converter’s refractory lining, obtained assuming the value
xp = 650 µm heat
−1 of the hypothetical 14th measurement, indicate a change in the parameters of the predicted probability distribution to the values of μ
p = 418.6 µm heat
−1 and σ
p = 13.1 µm heat
−1. The results shown in [
4,
5,
6,
7,
8] cannot be directly compared with the above mentioned results, because they relate to other materials, devices, and research methodologies. The results of the measurements and calculations included in this article extend the range of data concerning the wear of refractory linings in oxygen converters.
The method of searching for an answer to the question of the probability of obtaining a value contained in a given range of values of the unit wear rate of a refractory lining is reduced to finding the size of the area under the curve of the forecast probability density distribution of the unit wear rate of a refractory material.
The choice of Bayesian statistics for forecasting the unit wear rate of MgO-C materials type MC 95/10 in the slag spout zone of an oxygen converter was dictated by the variety and complexity of factors affecting the decision to terminate the converter campaign. Making such a decision is conditioned, both by the laser measurement results of the residual refractory lining thickness of the converter, and by visual assessment of the condition of the converter’s refractory lining, which may vary depending on the operating experience of the people making the decision to stop the converter’s operation.
5. Conclusions
From the analysis of the carried out experiment and the calculations performed according to the rules of Bayesian statistics, the following conclusions are drawn:
From the experience gained during the long-term operation of the steel-producing oxygen converter, it was found that the value of the unit wear rate of the refractory material in the slag spout zone of the steel-producing oxygen converter is subject to a posteriori normal distribution, with the exemplary parameters: mean value µ= 401.23 µ heat−1, standard deviation σ = 13.74 µm heat−1.
The mean value of the unit wear rate during the oxygen converter’s campaigns between February and November 2019 was verified experimentally and was calculated as 420 µm heat−1, which is within the calculated confidence interval 375.7 ≤ µaposterior ≤ 428.2 µm heat−1.
The calculated results of the forecasted distribution of the unit wear rate value of the refractory material give valuable operational and cost information, which is important for steelmakers, as well as for refractory material manufacturers.
From a prediction point of view, of the value distribution of the refractory unit wear rate, it would be beneficial to distribute the successive measurements of the residual thickness of the refractory lining in the slag spout zone evenly over the course of the converter campaign.
This model allows the creation of “what if” scenarios, which can also be helpful in estimating the cost of a planned converter campaign.


