
Localized Corrosion Occurrence in Low-Carbon Steel Pipe Caused by Microstructural Inhomogeneity

 , , , ,
Abstract
:1. Introduction
2. Materials and Methods
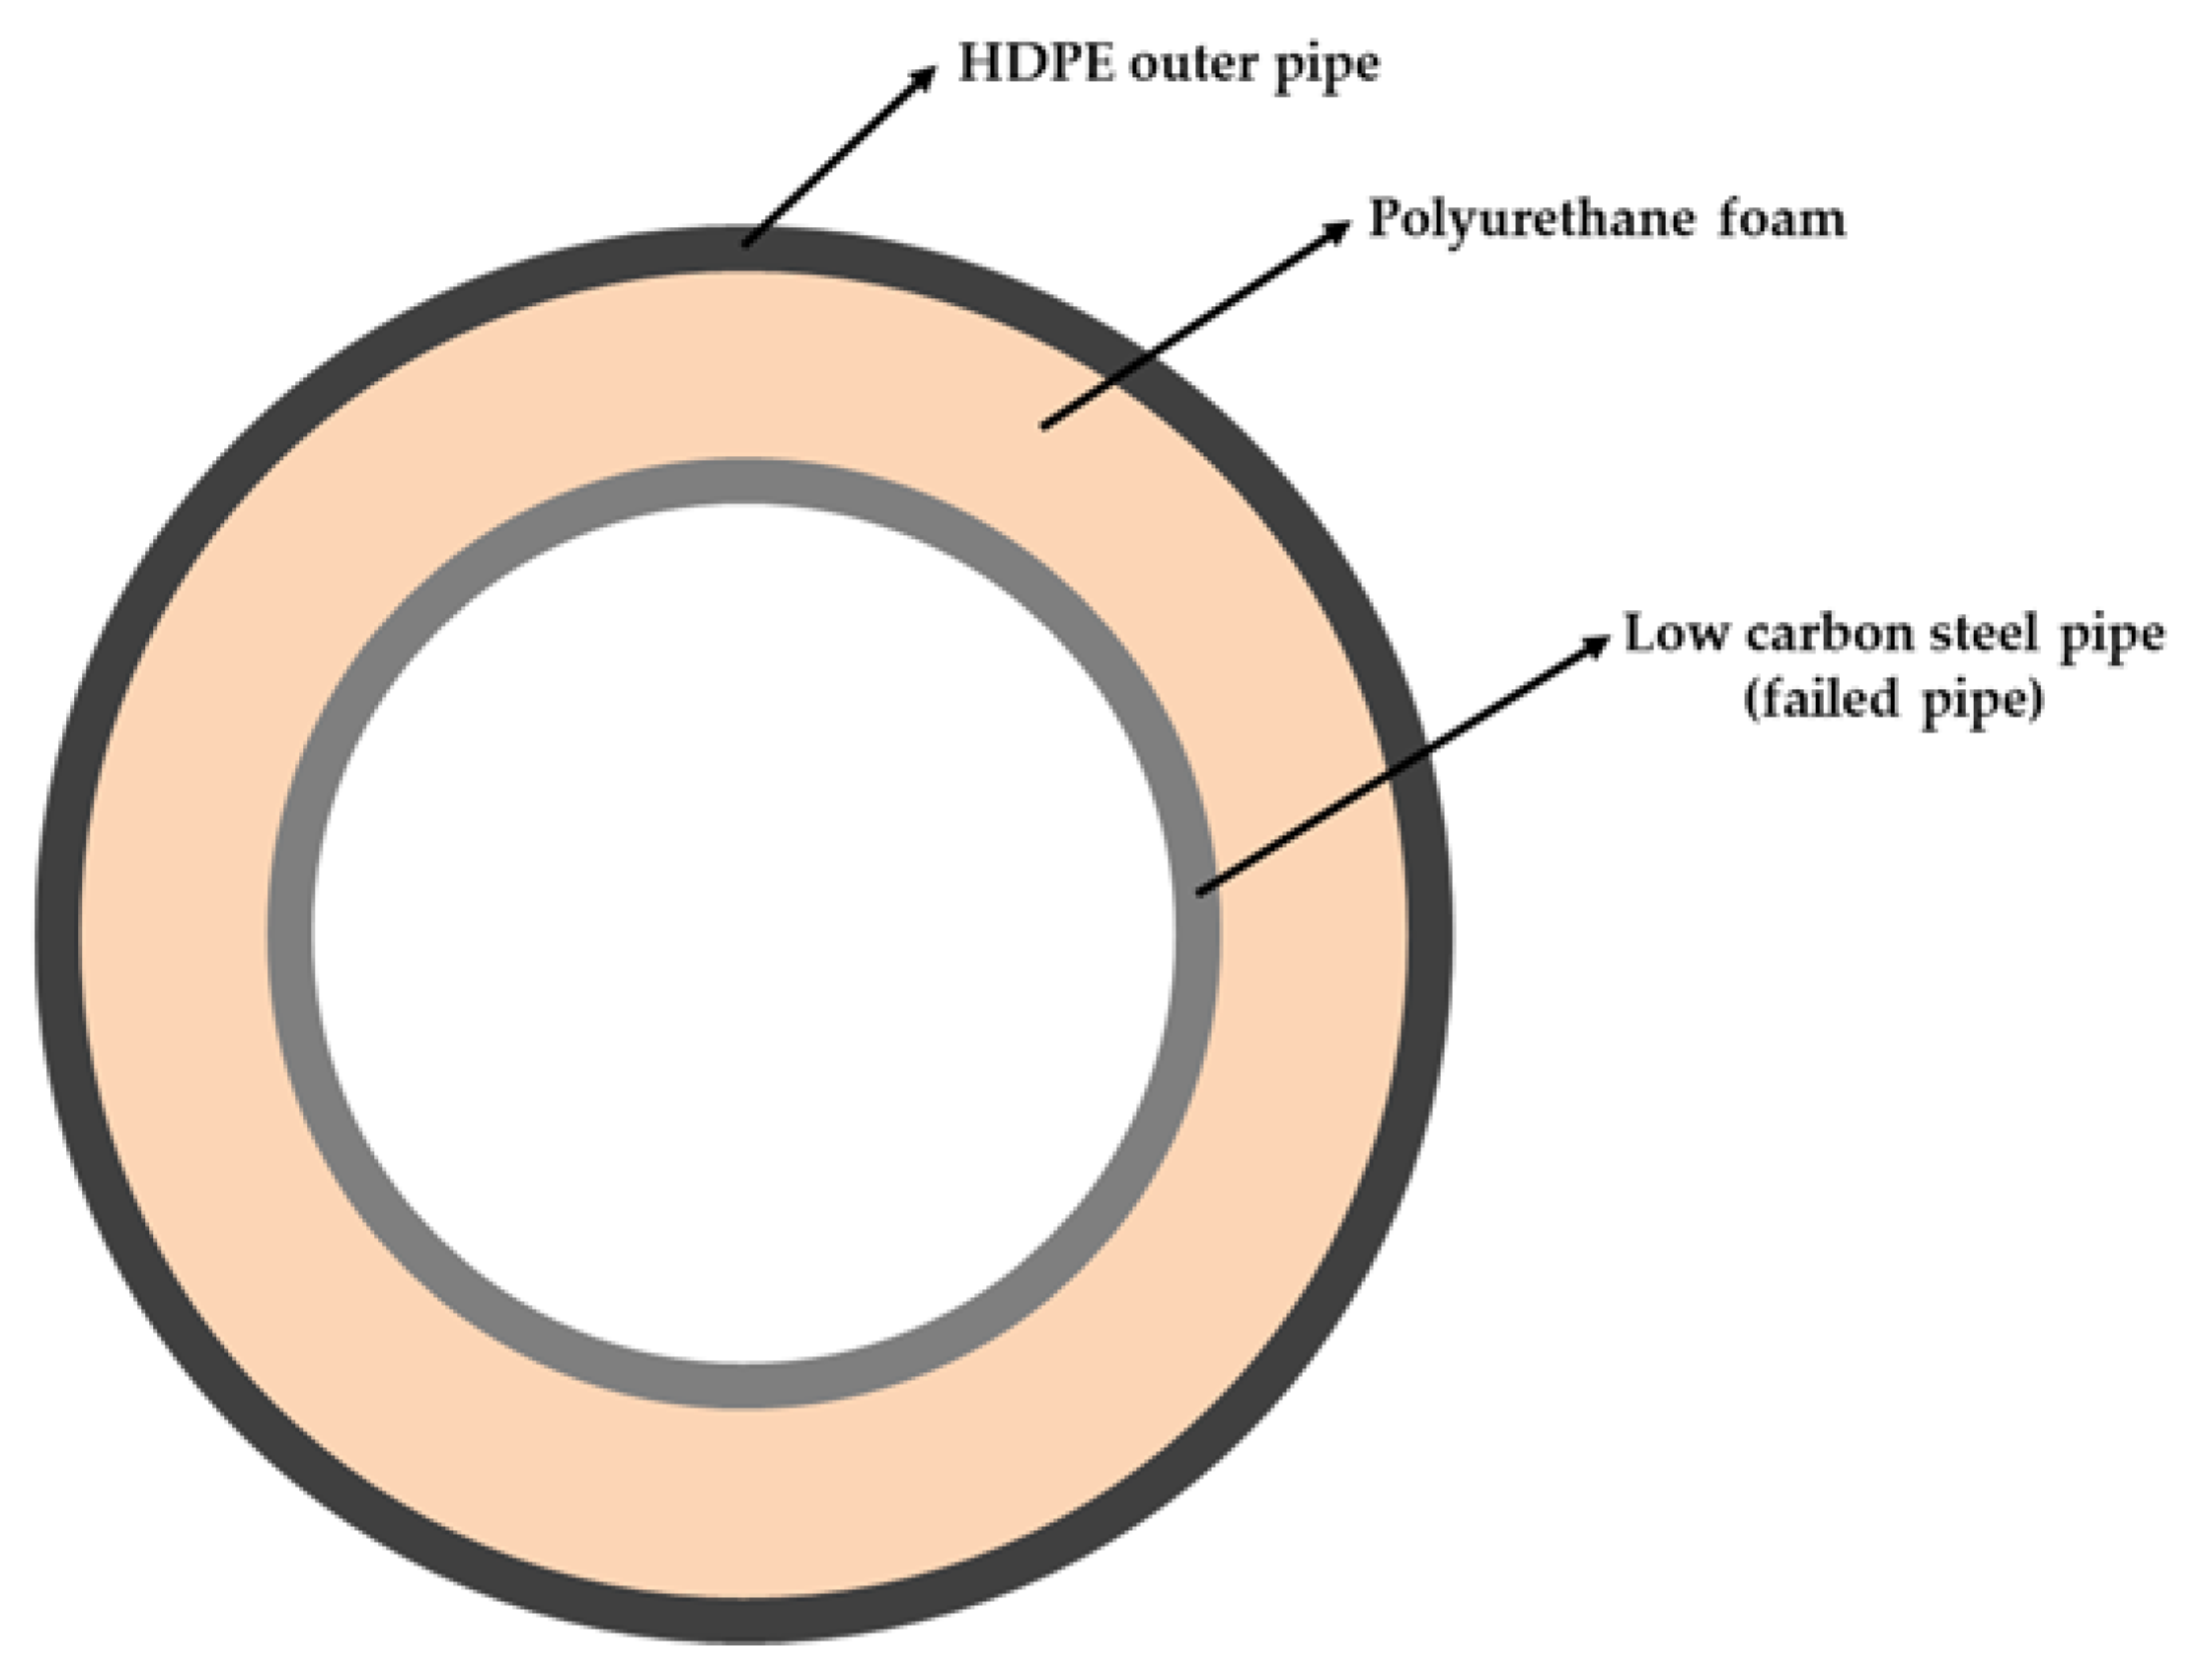
2.1. Description of the Pipeline
2.2. Metallurgical Analyses
2.3. Electrochemical Tests
3. Results and Discussion
3.1. Chemical Composition Analysis of the Low-Carbon Steel Pipe
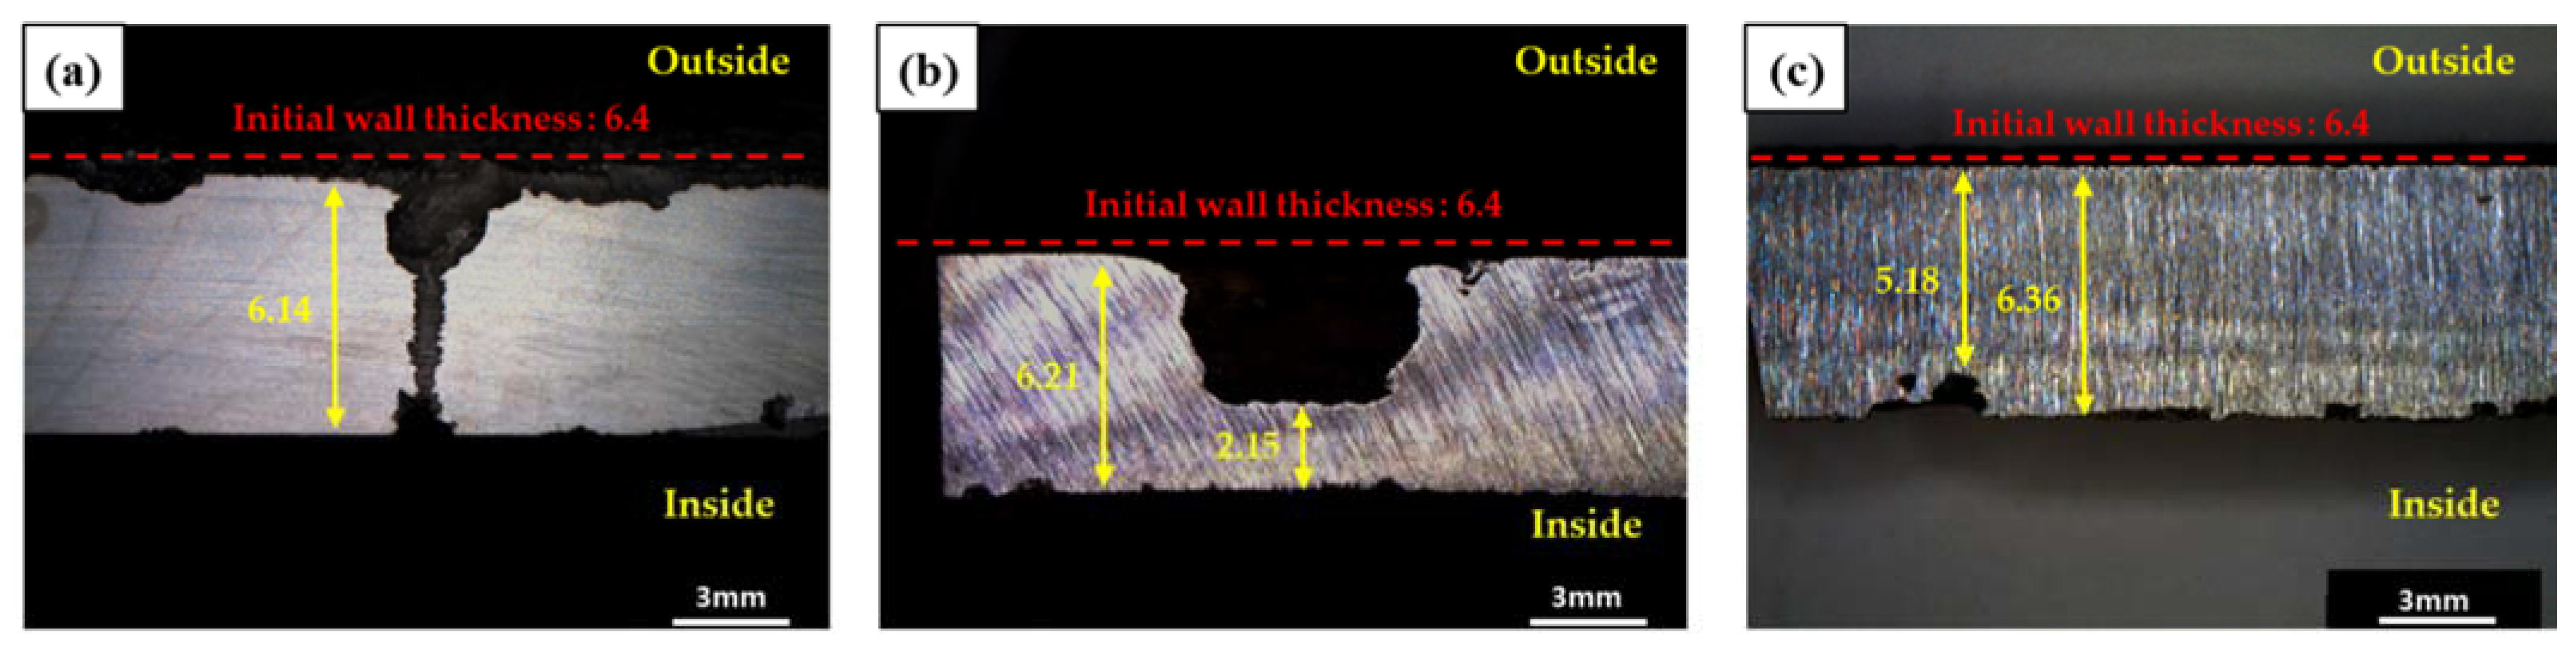
3.2. Visual and Macroscopic Inspections
3.3. Metallographic Examinations and Atomic Force Microscopy
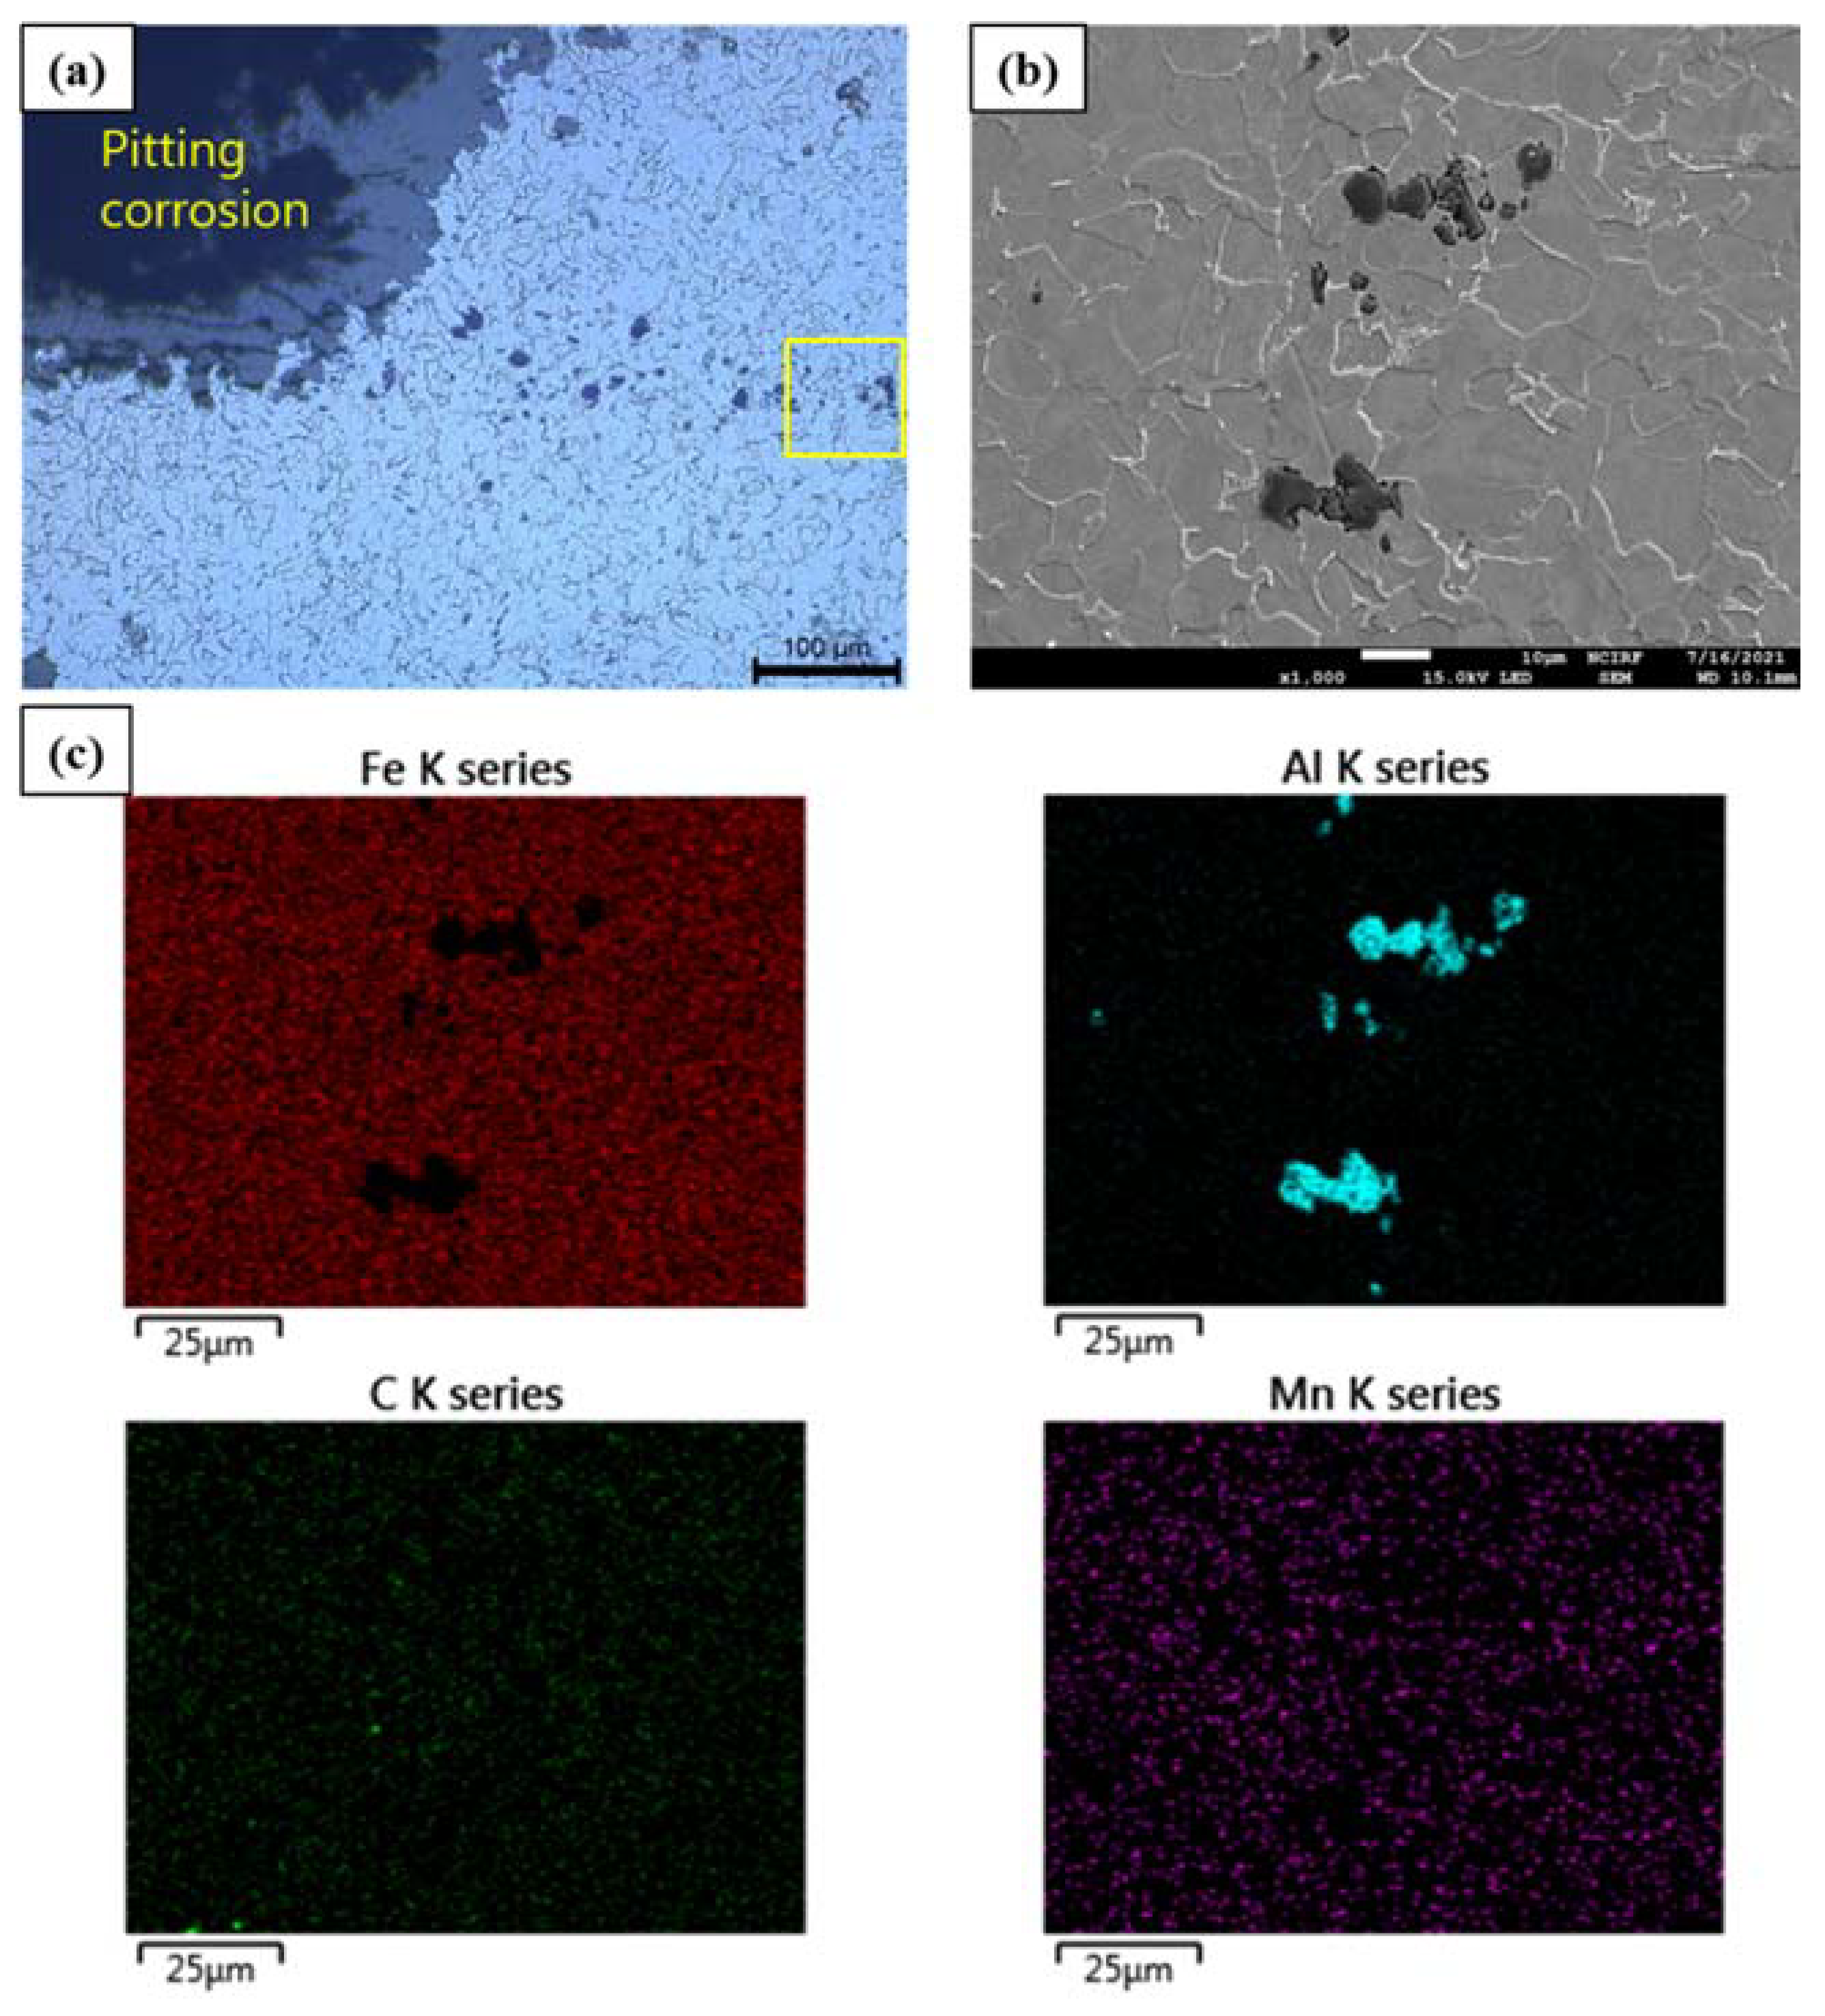
3.4. Microscopic Analyses
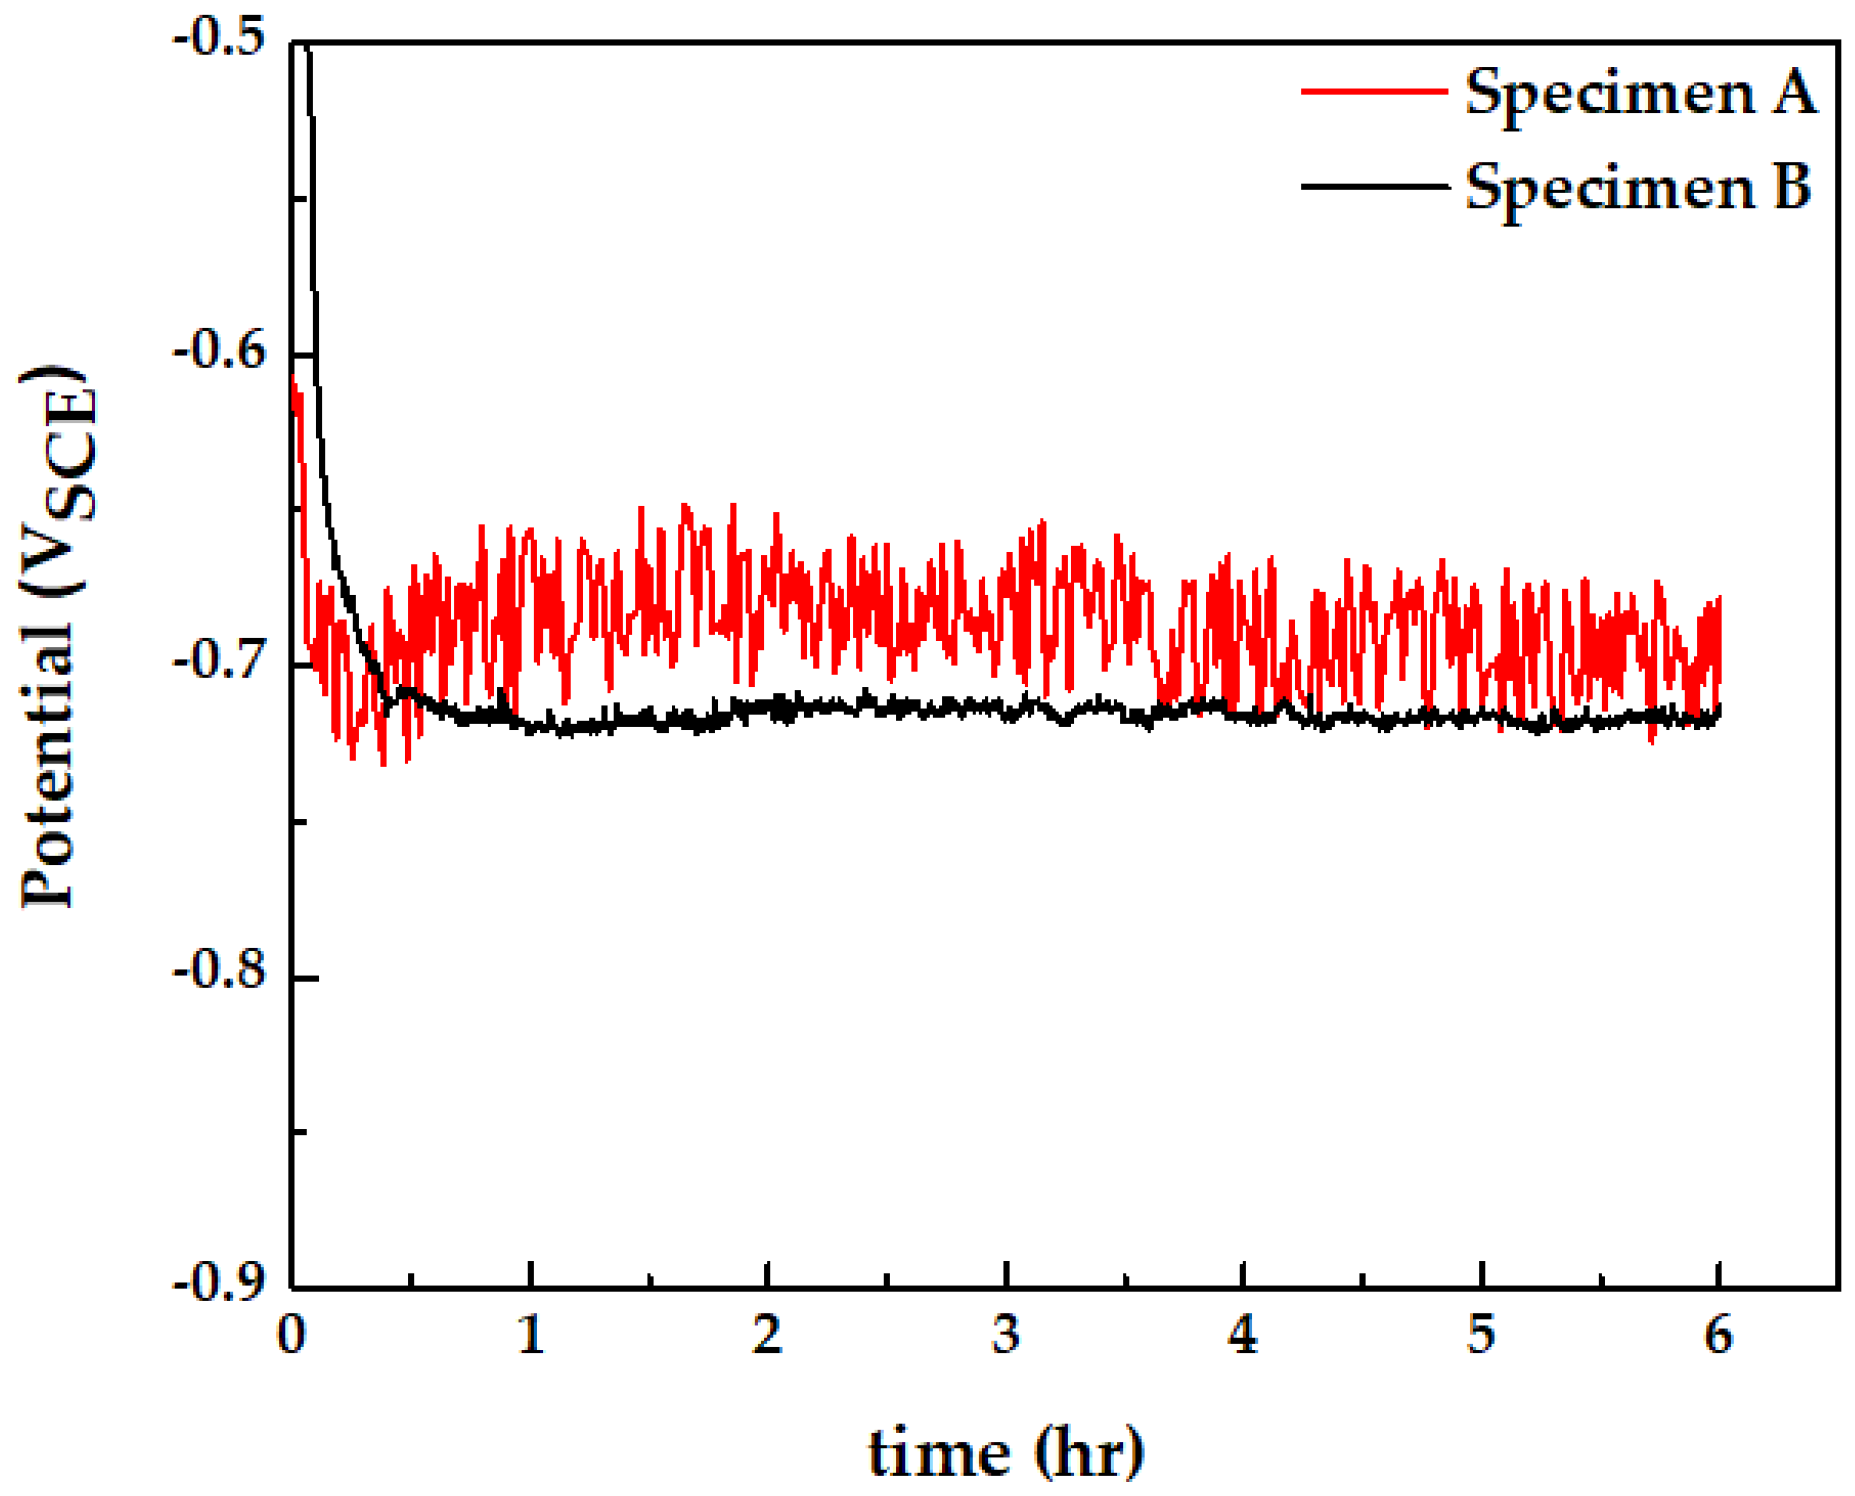
3.5. Open-Circuit Potential Measurement
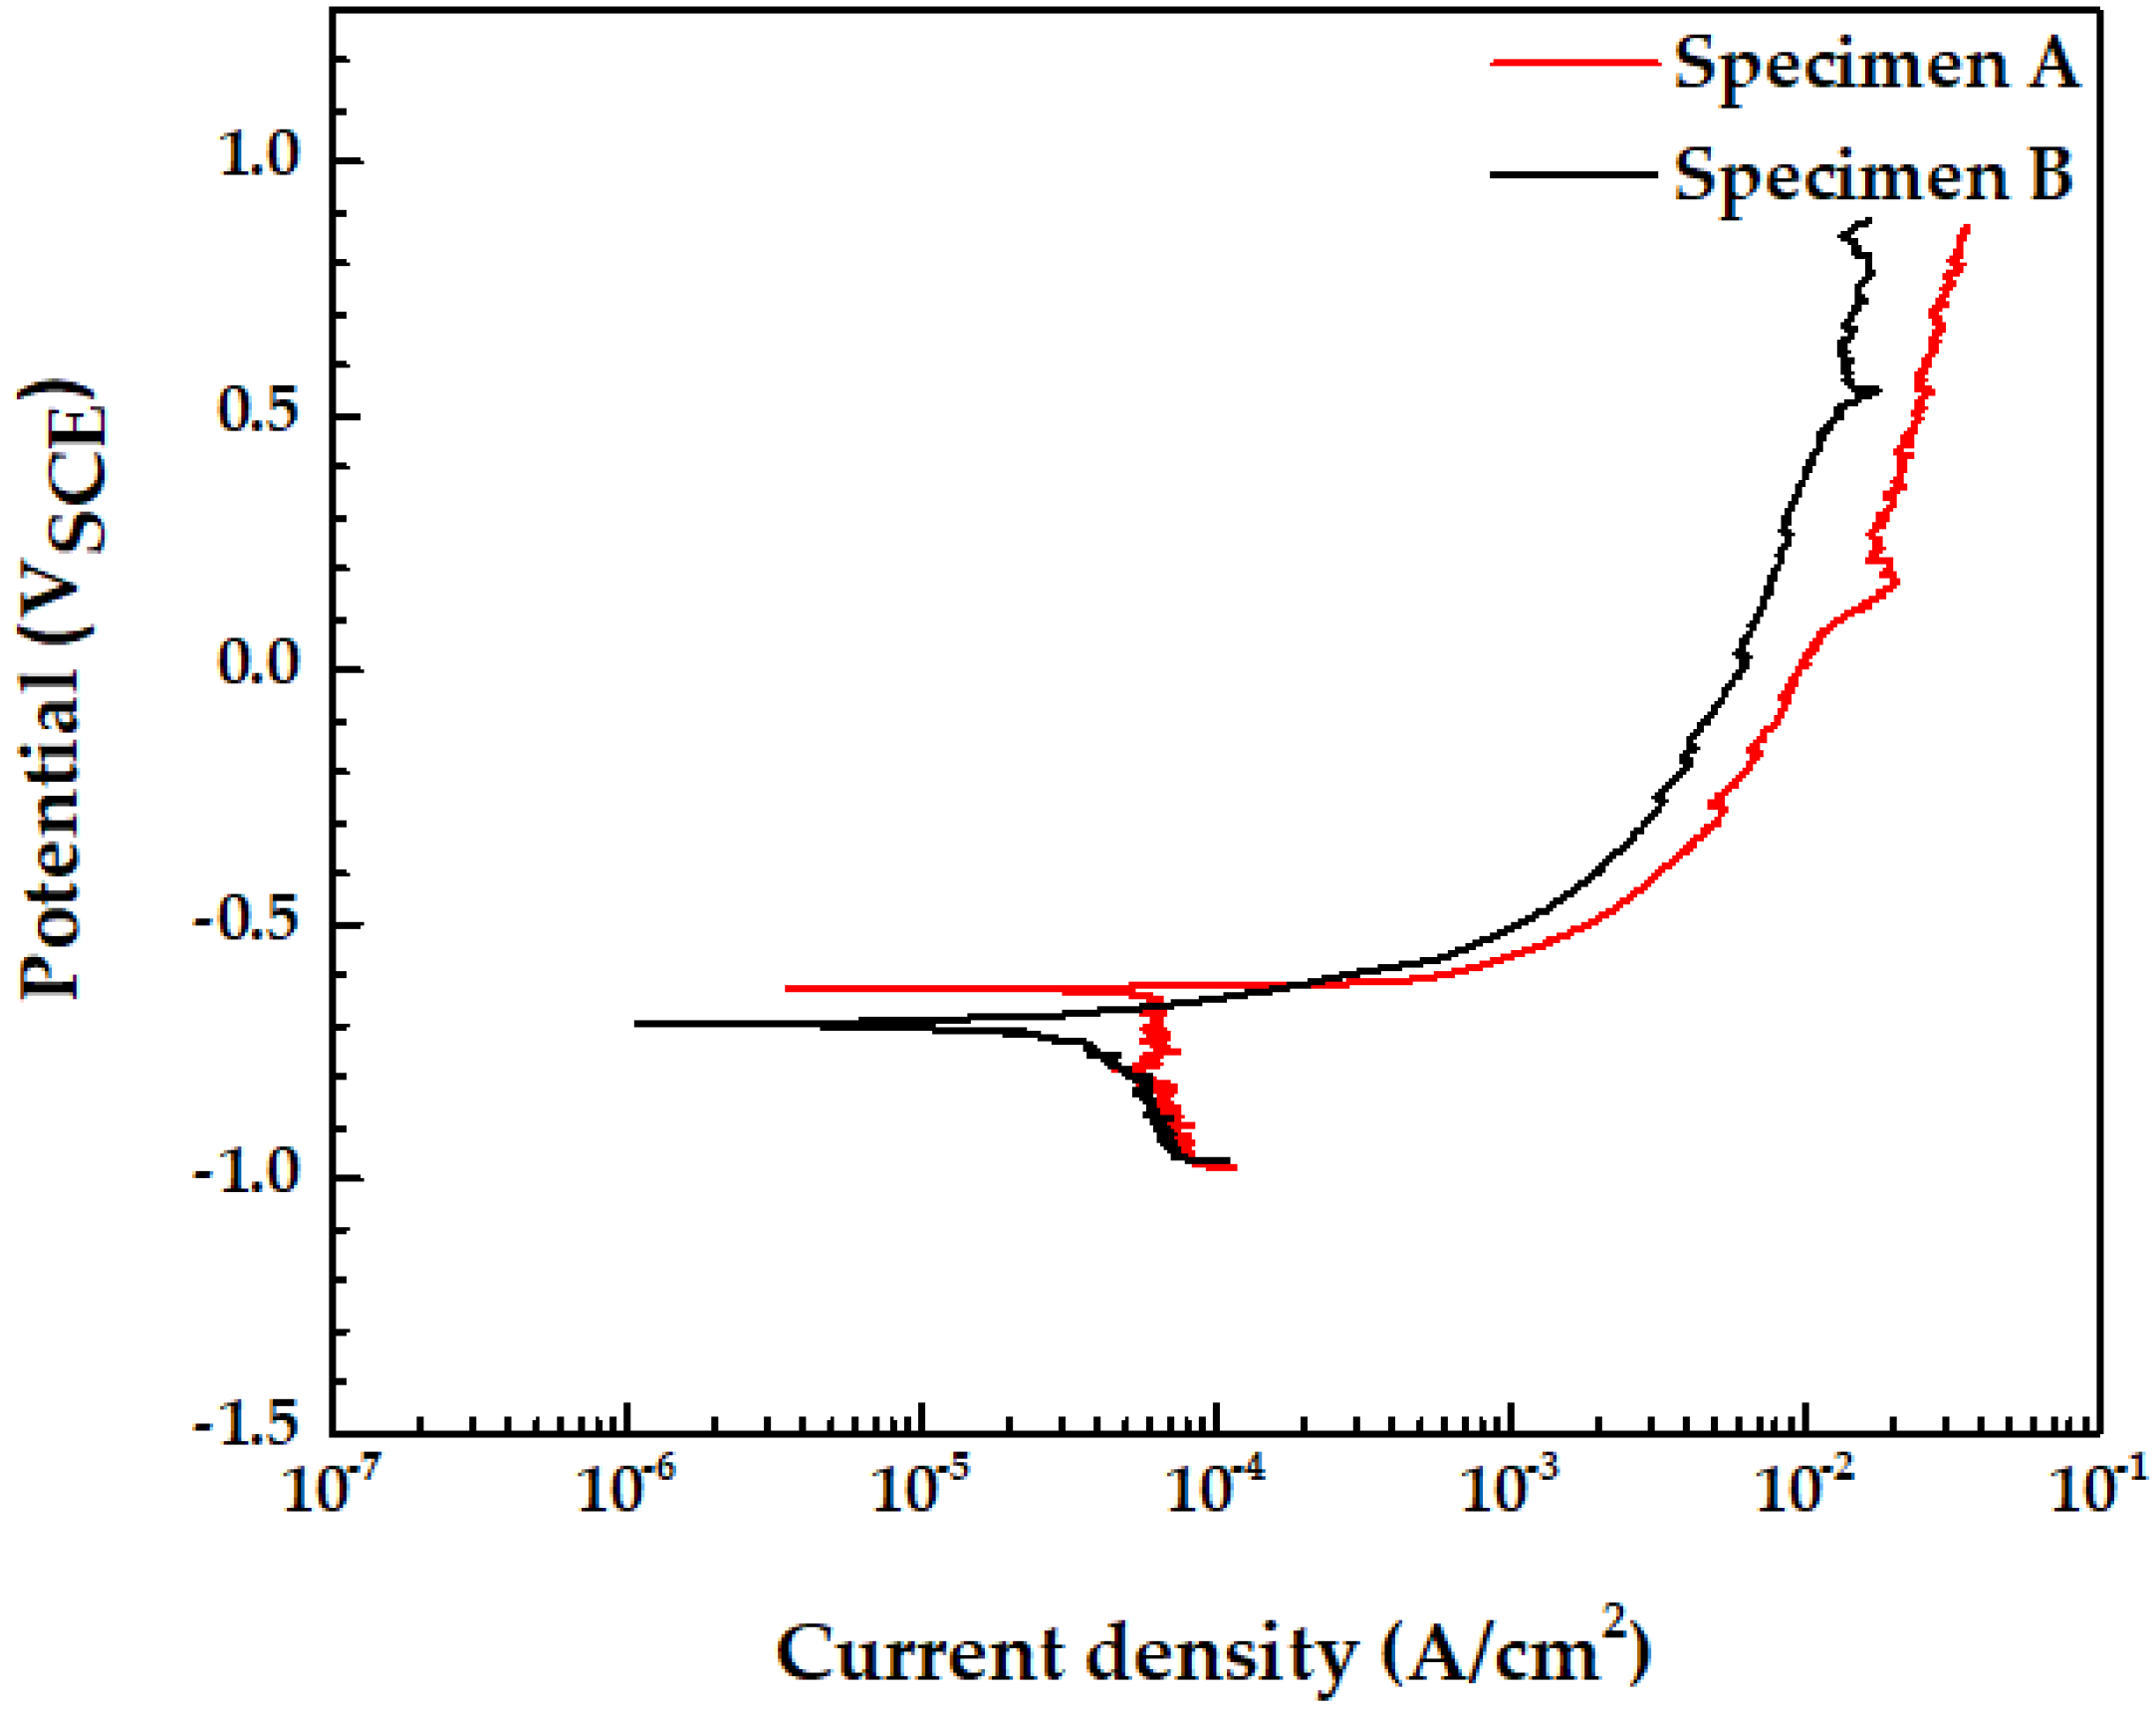
3.6. Potentiodynamic Polarization Test
3.7. Galvanostatic Polarization Test
3.8. Mechanism
4. Conclusions
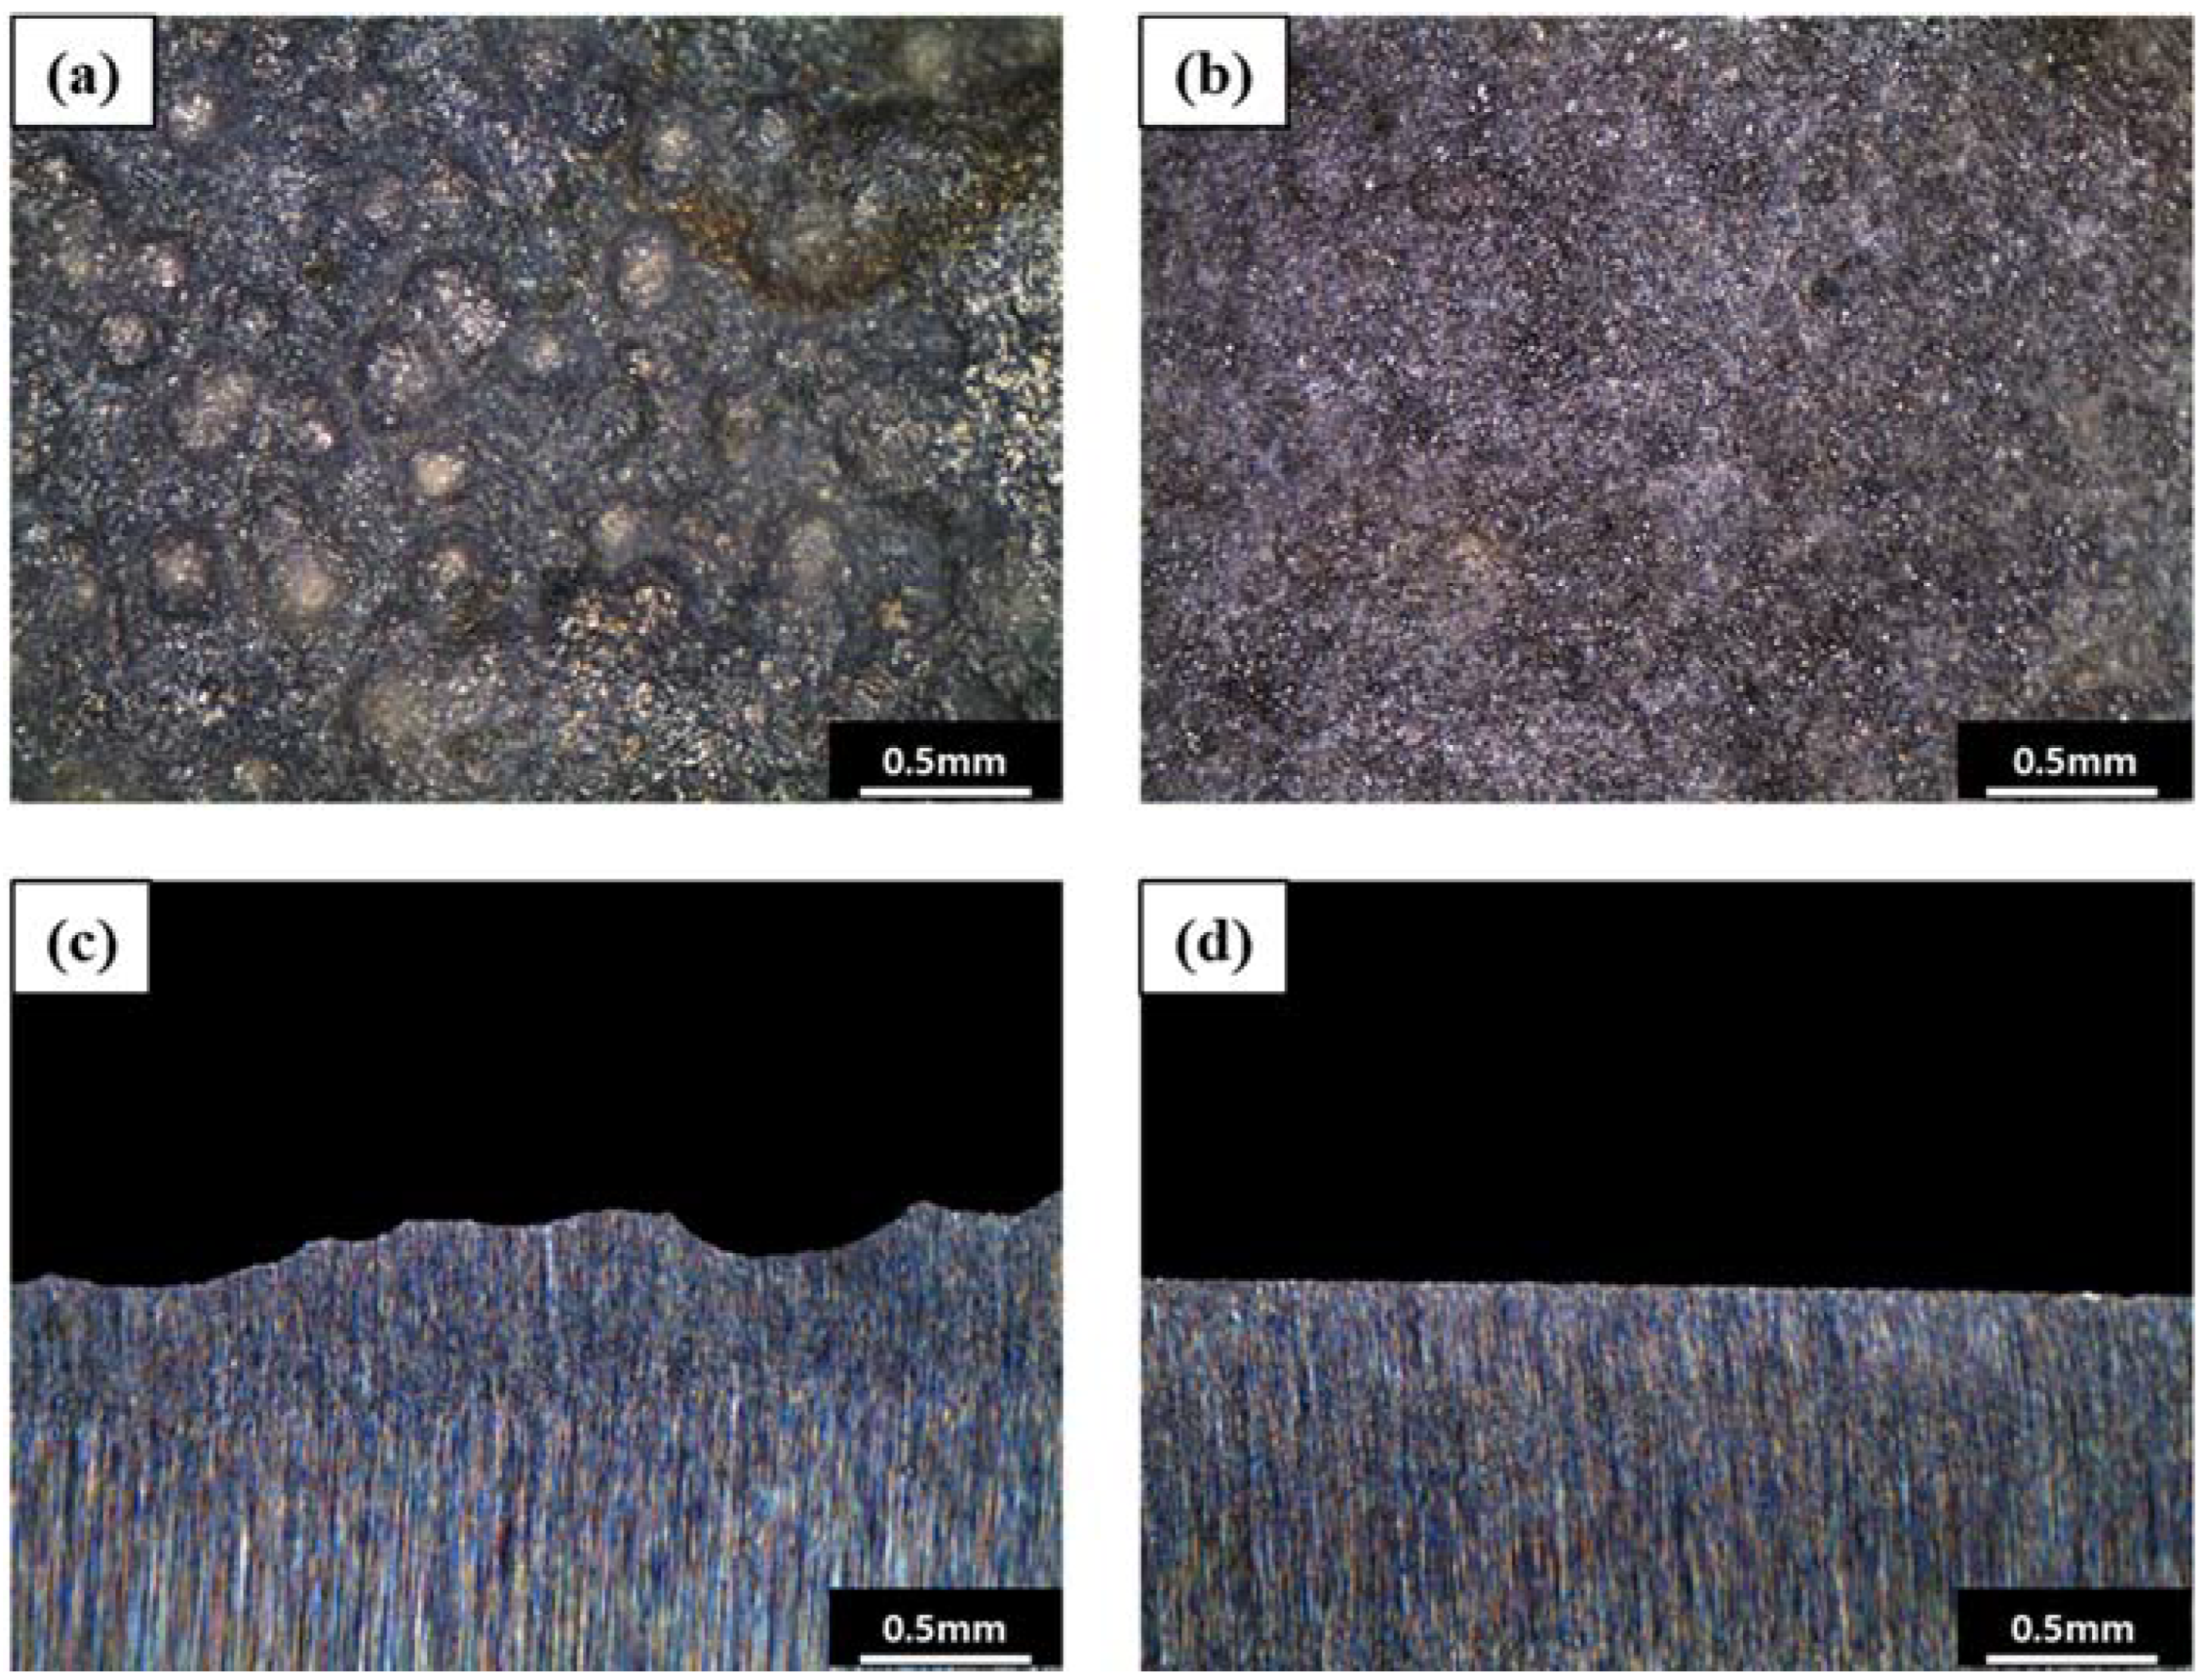
- Leakage occurred in the form of pitting corrosion, which was observed both inside and outside of the failed pipe. In particular, severe pitting corrosion occurred on the outside of the pipe, exposed to the soil environment. Al inclusions and a larger phase fraction of pearlite were observed near the leaking section. Crevice corrosion occurred in the microcrevice around the Al inclusions, and the large phase of pearlite around Al inclusions accelerated the localized corrosion in the microcrevice. Localized corrosion was accelerated near the Al inclusions and the large fraction of pearlite in the groundwater environment outside of the pipe, resulting in the pipe’s failure.
- The corrosion rate of the specimen taken where the pitting corrosion was present in the failed pipe was approximately double that of the specimen taken from the uniform corrosion part of the failed pipe. Furthermore, the corrosion type was similar to that observed in the actual failed pipe. This confirms the pipe failure had been caused by Al inclusions and the inhomogeneity of the pearlite.
5. Recommendations
- It is recommended that the uniform distribution of fine-sized pearlite and Al inclusions be produced through proper liquid steel homogenization and heat treatment during the steelmaking process.
- It is recommended that a standard for the chemical composition of Al be established within the existing KS D 3562 standard.
Author Contributions
Funding
Institutional Review Board Statement
Informed Consent Statement
Data Availability Statement
Conflicts of Interest
References
- Kim, Y.-S.; Kim, J.-G. Failure analysis of a thermally insulated pipeline in a district heating system. Eng. Fail. Anal. 2018, 83, 193–206. [Google Scholar] [CrossRef]
- Song, S.-J.; Cho, S.; Kim, W.-C.; Kim, J.-G. Failure analysis of electric-heater tube for heat-storage tank. Eng. Fail. Anal. 2018, 87, 69–79. [Google Scholar] [CrossRef]
- Benonysson, A.; Bøhm, B.; Ravn, H.F. Operational optimization in a district heating system. Energy Convers. Manag. 1995, 36, 297–314. [Google Scholar] [CrossRef]
- Lee, J.; Han, S.; Kim, K.; Kim, H.; Lee, U. Failure analysis of carbon steel pipes used for underground condensate pipeline in the power station. Eng. Fail. Anal. 2013, 34, 300–307. [Google Scholar] [CrossRef]
- Lee, D.Y.; Kim, W.C.; Kim, J.G. Effect of nitrite concentration on the corrosion behaviour of carbon steel pipelines in synthetic tap water. Corros. Sci. 2012, 64, 105–114. [Google Scholar] [CrossRef]
- Tavares, S.; Pardal, J.; Mainier, F.; Da Igreja, H.; Barbosa, E.; Rodrigues, C.; Barbosa, C.; Pardal, J. Investigation of the failure in a pipe of produced water from an oil separator due to internal localized corrosion. Eng. Fail. Anal. 2016, 61, 100–107. [Google Scholar] [CrossRef]
- Bolzon, G.; Rivolta, B.; Nykyforchyn, H.; Zvirko, O. Mechanical analysis at different scales of gas pipelines. Eng. Fail. Anal. 2018, 90, 434–439. [Google Scholar] [CrossRef]
- Mohtadi-Bonab, M.; Eskandari, M. A focus on different factors affecting hydrogen induced cracking in oil and natural gas pipeline steel. Eng. Fail. Anal. 2017, 79, 351–360. [Google Scholar] [CrossRef]
- Heyes, A. Oxygen pitting failure of a bagasse boiler tube. Eng. Fail. Anal. 2001, 8, 123–131. [Google Scholar] [CrossRef]
- Duarte, C.A.; Espejo, E.; Martinez, J.C. Failure analysis of the wall tubes of a water-tube boiler. Eng. Fail. Anal. 2017, 79, 704–713. [Google Scholar] [CrossRef]
- Jones, D.A. Principles and Prevention of Corrosion; Prentice Hall: Upper Saddle River, NJ, USA, 1996. [Google Scholar]
- ASTM. A135: Standard Specification for Electric-Resistance-Welded Steel Pipe; ASTM: West Conshohocken, PA, USA, 2014. [Google Scholar]
- KS D. 3562: Carbon Steel Pipes for Pressure Service; KS D: Eumseong, Korea, 2021. [Google Scholar]
- Kim, Y.-S.; Kim, J.-G. Corrosion behavior of pipeline carbon steel under different iron oxide deposits in the district heating system. Metals 2017, 7, 182. [Google Scholar] [CrossRef]
- Hong, M.-S.; So, Y.-S.; Lim, J.-M.; Kim, J.-G. Evaluation of internal corrosion property in district heating pipeline using fracture mechanics and electrochemical acceleration kinetics. J. Ind. Eng. Chem. 2021, 94, 253–263. [Google Scholar] [CrossRef]
- Choi, Y.-S.; Chung, M.-K.; Kim, J.-G. Effects of cyclic stress and insulation on the corrosion fatigue properties of thermally insulated pipeline. Mater. Sci. Eng. A 2004, 384, 47–56. [Google Scholar] [CrossRef]
- Chung, N.-T.; Hong, M.-S.; Kim, J.-G. Optimizing the Required Cathodic Protection Current for Pre-Buried Pipelines Using Electrochemical Acceleration Methods. Materials 2021, 14, 579. [Google Scholar] [CrossRef] [PubMed]
- Katiyar, P.K.; Sangal, S.; Mondal, K. Effect of various phase fraction of bainite, intercritical ferrite, retained austenite and pearlite on the corrosion behavior of multiphase steels. Corros. Sci. 2021, 178, 109043. [Google Scholar]
- Liu, C.; Cheng, X.; Dai, Z.; Liu, R.; Li, Z.; Cui, L.; Chen, M.; Ke, L. Synergistic effect of Al2O3 inclusion and pearlite on the localized corrosion evolution process of carbon steel in marine environment. Materials 2018, 11, 2277. [Google Scholar] [CrossRef] [Green Version]
- Xue, F.; Wei, X.; Dong, J.; Etim, I.-I.N.; Wang, C.; Ke, W. Effect of residual dissolved oxygen on the corrosion behavior of low carbon steel in 0.1 M NaHCO3 solution. J. Mater. Sci. Technol. 2018, 34, 1349–1358. [Google Scholar] [CrossRef]
- Liu, H.; Wei, J.; Dong, J.; Chen, Y.; Wu, Y.; Zhou, Y.; Babu, S.D.; Ke, W. Influence of cementite spheroidization on relieving the micro-galvanic effect of ferrite-pearlite steel in acidic chloride environment. J. Mater. Sci. Technol. 2021, 61, 234–246. [Google Scholar] [CrossRef]
- Katiyar, P.K.; Misra, S.; Mondal, K. Comparative corrosion behavior of five microstructures (pearlite, bainite, spheroidized, martensite, and tempered martensite) made from a high carbon steel. Metall. Mater. Trans. A 2019, 50, 1489–1501. [Google Scholar] [CrossRef]
- Hao, X.; Dong, J.; Etim, I.-I.N.; Wei, J.; Ke, W. Sustained effect of remaining cementite on the corrosion behavior of ferrite-pearlite steel under the simulated bottom plate environment of cargo oil tank. Corros. Sci. 2016, 110, 296–304. [Google Scholar] [CrossRef]
- Sun, C.; Ko, S.-J.; Jung, S.; Wang, C.; Lee, D.; Kim, J.-G.; Kim, Y. Visualization of electrochemical behavior in carbon steel assisted by machine learning. Appl. Surf. Sci. 2021, 563, 150412. [Google Scholar] [CrossRef]
- Katiyar, P.K.; Misra, S.; Mondal, K. Corrosion behavior of annealed steels with different carbon contents (0.002, 0.17, 0.43 and 0.7% C) in freely aerated 3.5% NaCl solution. J. Mater. Eng. Perform. 2019, 28, 4041–4052. [Google Scholar] [CrossRef]
- Väinölä, R.; Holappa, L.; Karvonen, P. Modern steelmaking technology for special steels. J. Mater. Process. Technol. 1995, 53, 453–465. [Google Scholar] [CrossRef]
- Wakoh, M.; Sano, N. Behavior of alumina inclusions just after deoxidation. ISIJ Int. 2007, 47, 627–632. [Google Scholar] [CrossRef] [Green Version]
- Wang, Y.; Cheng, G.; Wu, W.; Li, Y. Role of inclusions in the pitting initiation of pipeline steel and the effect of electron irradiation in SEM. Corros. Sci. 2018, 130, 252–260. [Google Scholar] [CrossRef]
- Villavicencio, J.; Ulloa, N.; Lozada, L.; Moreno, M.; Castro, L. The role of non-metallic Al2O3 inclusions, heat treatments and microstructure on the corrosion resistance of an API 5L X42 steel. J. Mater. Res. Technol. 2020, 9, 5894–5911. [Google Scholar] [CrossRef]
- Wei, J.; Dong, J.; Zhou, Y.; He, X.; Wang, C.; Ke, W. Influence of the secondary phase on micro galvanic corrosion of low carbon bainitic steel in NaCl solution. Mater. Charact. 2018, 139, 401–410. [Google Scholar] [CrossRef]
- Katiyar, P.K.; Misra, S.; Mondal, K. Effect of different cooling rates on the corrosion behavior of high-carbon pearlitic steel. J. Mater. Eng. Perform. 2018, 27, 1753–1762. [Google Scholar] [CrossRef]
- Hao, X.; Dong, J.; Mu, X.; Wei, J.; Wang, C.; Ke, W. Influence of Sn and Mo on corrosion behavior of ferrite-pearlite steel in the simulated bottom plate environment of cargo oil tank. J. Mater. Sci. Technol. 2019, 35, 799–811. [Google Scholar] [CrossRef]
- Kadowaki, M.; Muto, I.; Katayama, H.; Masuda, H.; Sugawara, Y.; Hara, N. Effectiveness of an intercritical heat-treatment on localized corrosion resistance at the microstructural boundaries of medium-carbon steels. Corros. Sci. 2019, 154, 159–177. [Google Scholar] [CrossRef]
- Xia, D.-H.; Song, S.; Behnamian, Y.; Hu, W.; Cheng, Y.F.; Luo, J.-L.; Huet, F. electrochemical noise applied in corrosion science: Theoretical and mathematical models towards quantitative analysis. J. Electrochem. Soc. 2020, 167, 081507. [Google Scholar] [CrossRef]
- Kim, S.K.; Park, I.J.; Lee, D.Y.; Kim, J.G. Influence of surface roughness on the electrochemical behavior of carbon steel. J. Appl. Electrochem. 2013, 43, 507–514. [Google Scholar] [CrossRef]


| pH | NaCl | Mg(OH)2 | CaCO3 | NH4OH |
|---|---|---|---|---|
| 9.5 | 15.01 | 0.48 | 2.65 | 10.28 |
| pH | CaCl2 | MgSO4∙7H2O | NaHCO3 | H2SO4 | HNO3 |
|---|---|---|---|---|---|
| 6.8 | 133.2 | 59.0 | 208.0 | 48.0 | 21.8 |
| Elements | C | Si | Mn | P | S | Al |
|---|---|---|---|---|---|---|
| Failed pipe | 0.08 | 0.02 | 0.42 | 0.011 | 0006 | 0.04 |
| KS D 3562 | 0.25 | 0.35 | 0.30–0.90 | 0.04 | 0.004 | – |
| Pearlite (%) | Ferrite (%) | |
|---|---|---|
| Specimen A | 13.68 ± 0.58 | 86.32 ± 0.58 |
| Specimen B | 5.57 ± 0.34 | 94.43 ± 0.34 |
| Phase | Position | Potential (mV) | Surface Potential Difference (mV) | |
|---|---|---|---|---|
| Mean | Dev | |||
| Pearlite | A | 124.99 | 15.85 | 44.40 |
| Ferrite | B | 80.59 | 13.97 | |
| Cementite in pearlite | C | 147.22 | 13.56 | 34.78 |
| Ferrite in pearlite | D | 112.44 | 13.26 | |
| Ecorr (mVSCE) | icorr (A/cm2) | Corrosion Rate (mm/yr) | |
|---|---|---|---|
| Specimen A | −621.04 | 6.47 × 10⁻⁵ | 0.75 |
| Specimen B | −704.63 | 3.33 × 10⁻⁵ | 0.39 |
Publisher’s Note: MDPI stays neutral with regard to jurisdictional claims in published maps and institutional affiliations. |
© 2022 by the authors. Licensee MDPI, Basel, Switzerland. This article is an open access article distributed under the terms and conditions of the Creative Commons Attribution (CC BY) license (https://creativecommons.org/licenses/by/4.0/).
Share and Cite
Lee, Y.-H.; Kim, G.-I.; Kim, K.-M.; Ko, S.-J.; Kim, W.-C.; Kim, J.-G. Localized Corrosion Occurrence in Low-Carbon Steel Pipe Caused by Microstructural Inhomogeneity. Materials 2022, 15, 1870. https://doi.org/10.3390/ma15051870
Lee Y-H, Kim G-I, Kim K-M, Ko S-J, Kim W-C, Kim J-G. Localized Corrosion Occurrence in Low-Carbon Steel Pipe Caused by Microstructural Inhomogeneity. Materials. 2022; 15(5):1870. https://doi.org/10.3390/ma15051870
Chicago/Turabian StyleLee, Yun-Ho, Geon-Il Kim, Kyung-Min Kim, Sang-Jin Ko, Woo-Cheol Kim, and Jung-Gu Kim. 2022. "Localized Corrosion Occurrence in Low-Carbon Steel Pipe Caused by Microstructural Inhomogeneity" Materials 15, no. 5: 1870. https://doi.org/10.3390/ma15051870
APA StyleLee, Y.-H., Kim, G.-I., Kim, K.-M., Ko, S.-J., Kim, W.-C., & Kim, J.-G. (2022). Localized Corrosion Occurrence in Low-Carbon Steel Pipe Caused by Microstructural Inhomogeneity. Materials, 15(5), 1870. https://doi.org/10.3390/ma15051870