
Effect of Carbon Content and Boronizing Parameters on Growth Kinetics of Boride Layers Obtained on Carbon Steels


Abstract
:1. Introduction
2. Materials and Methods
2.1. Experimental
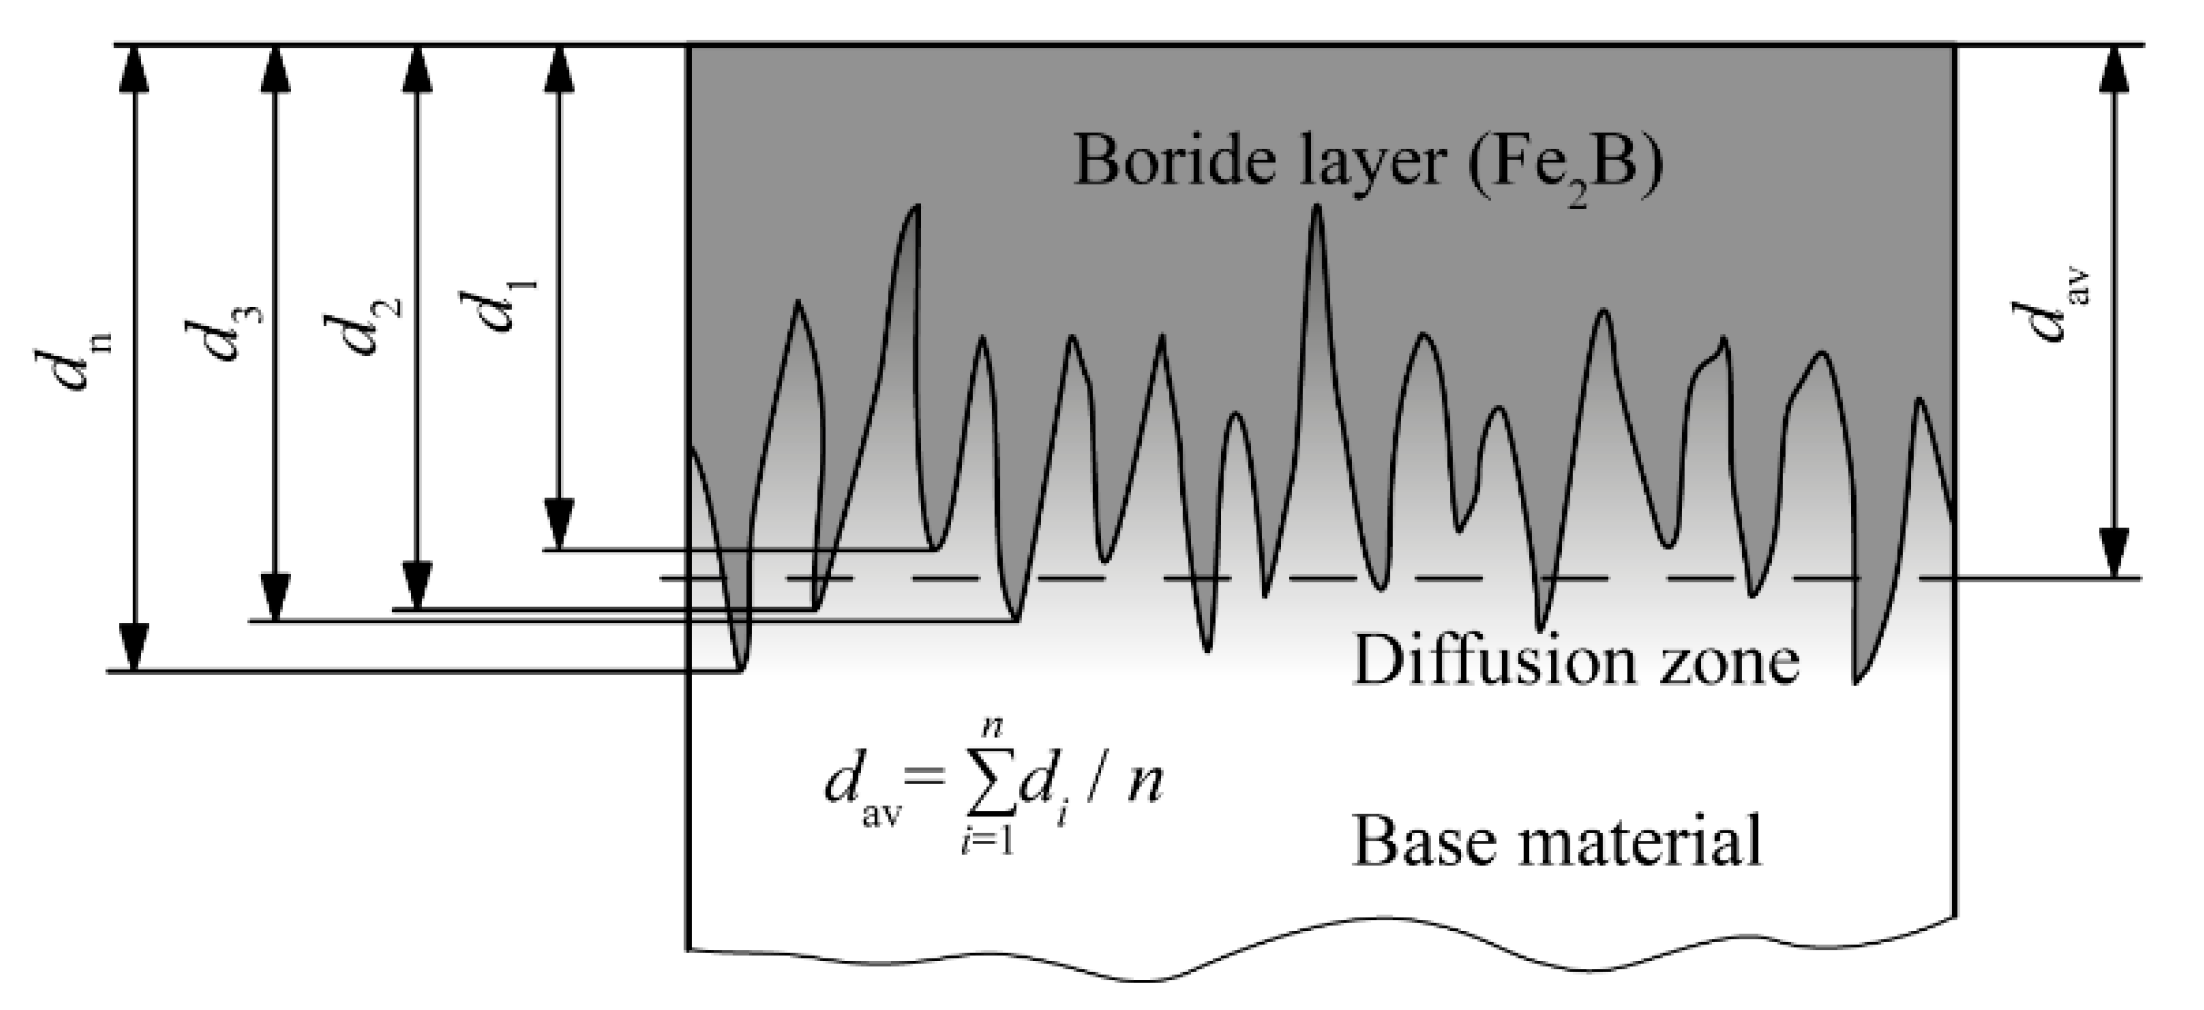
2.2. Kinetic Study
2.3. Statistical Analysis
3. Results
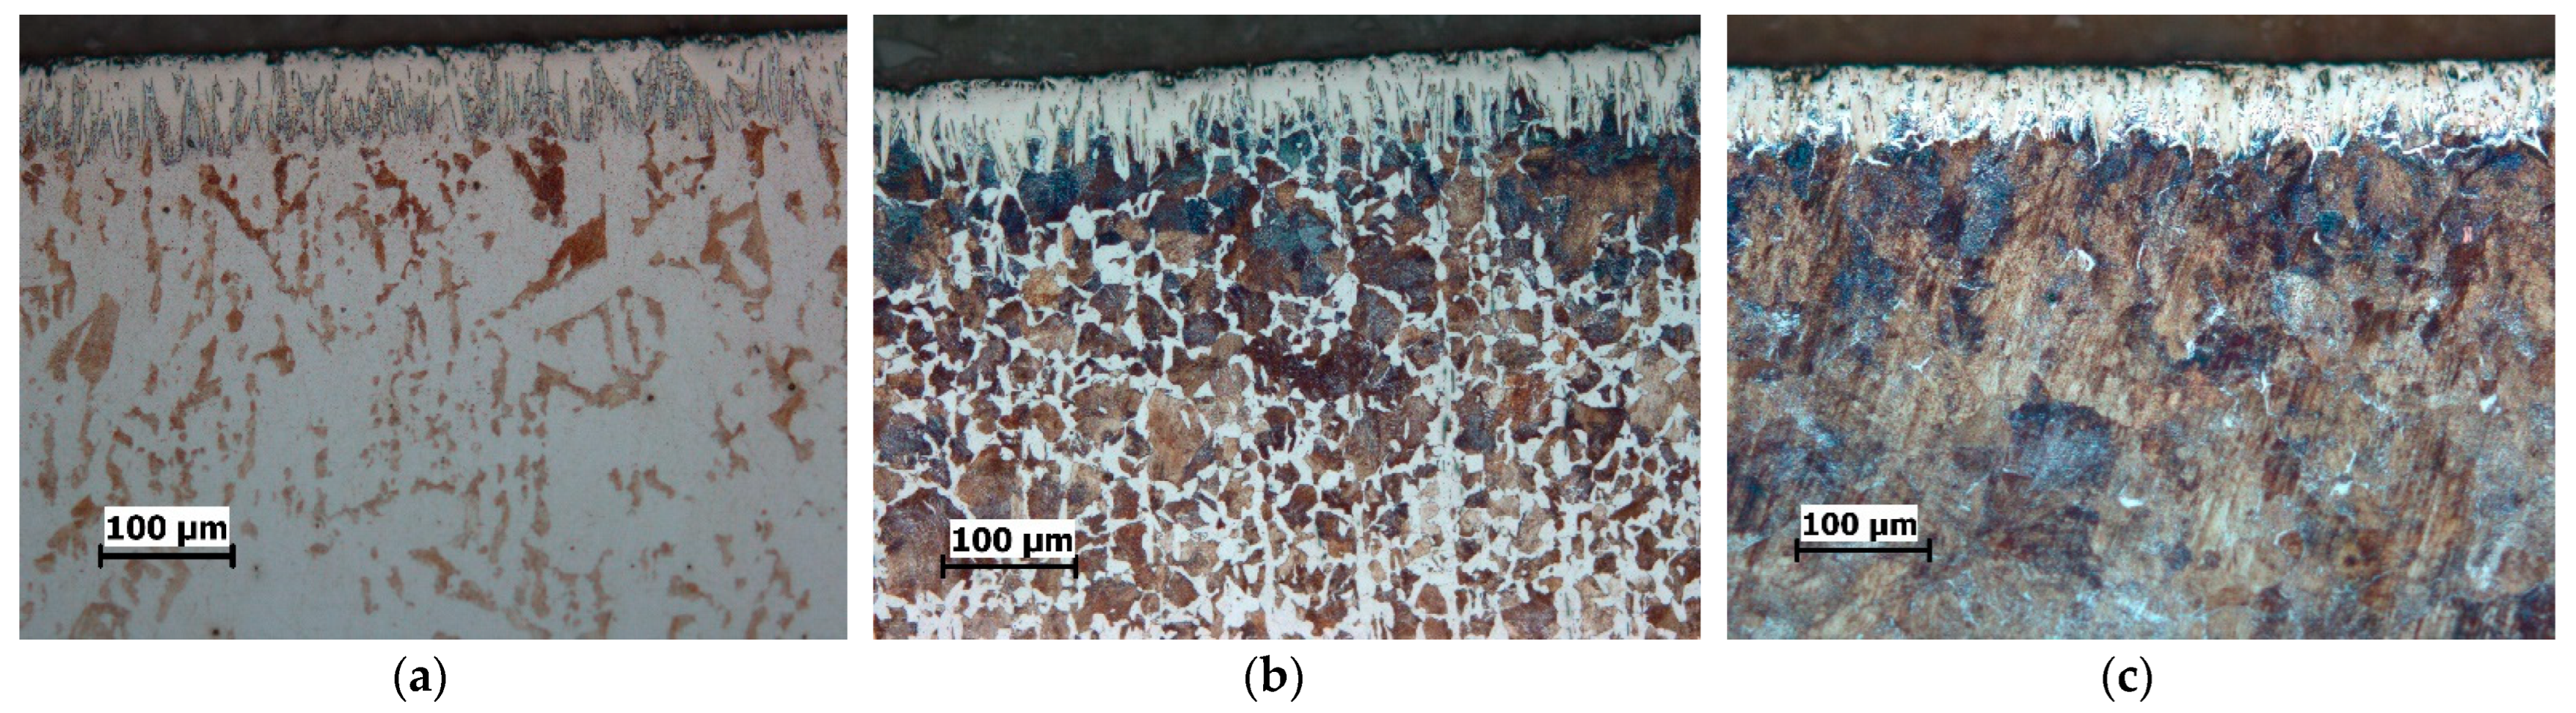
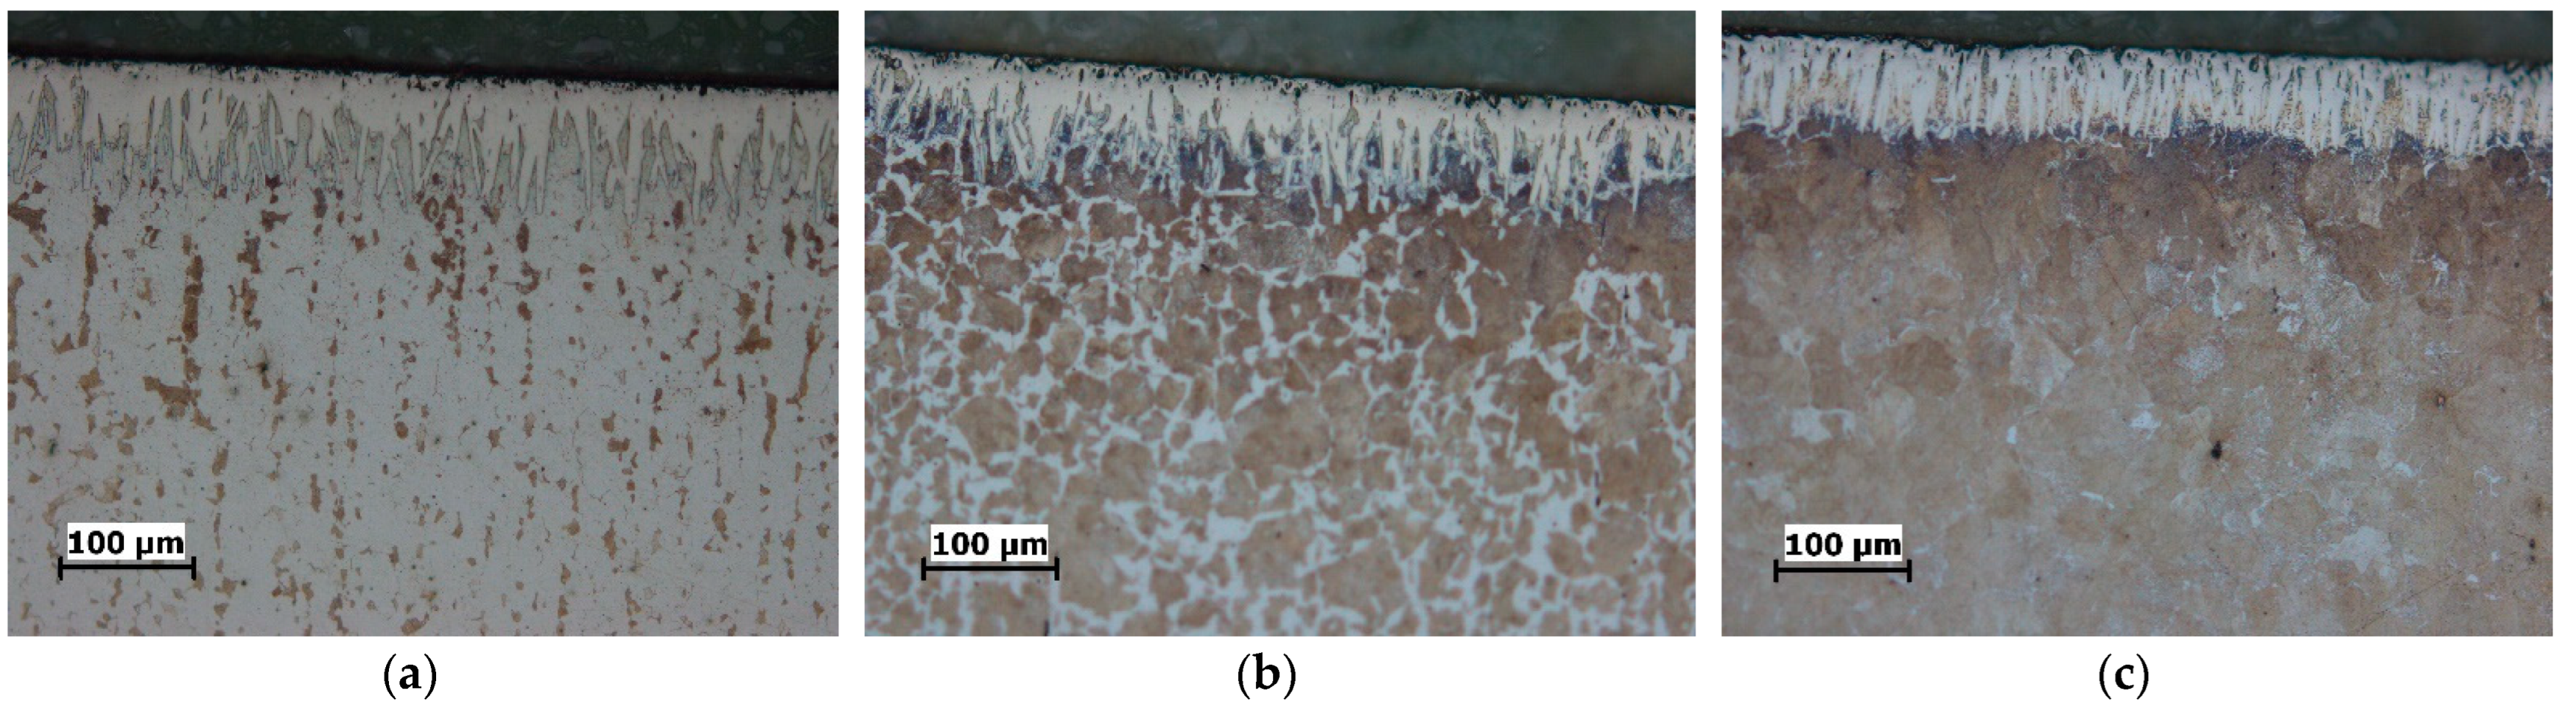
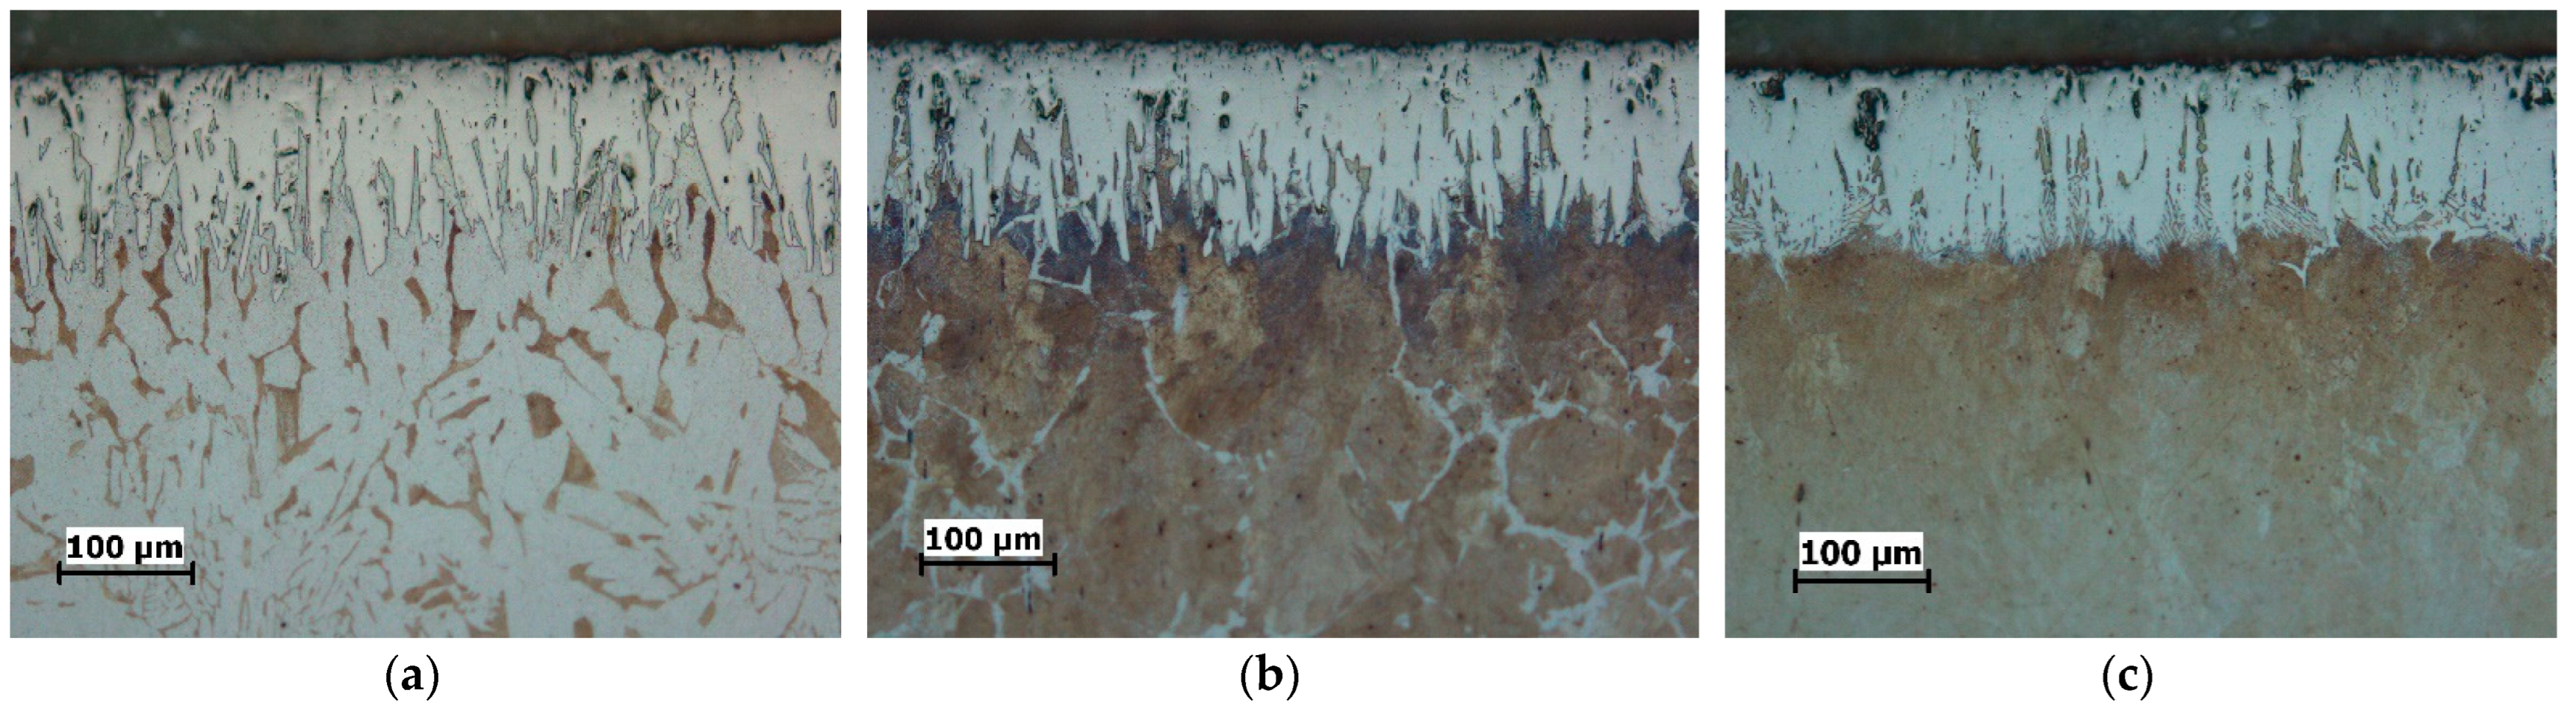
3.1. Microstructure
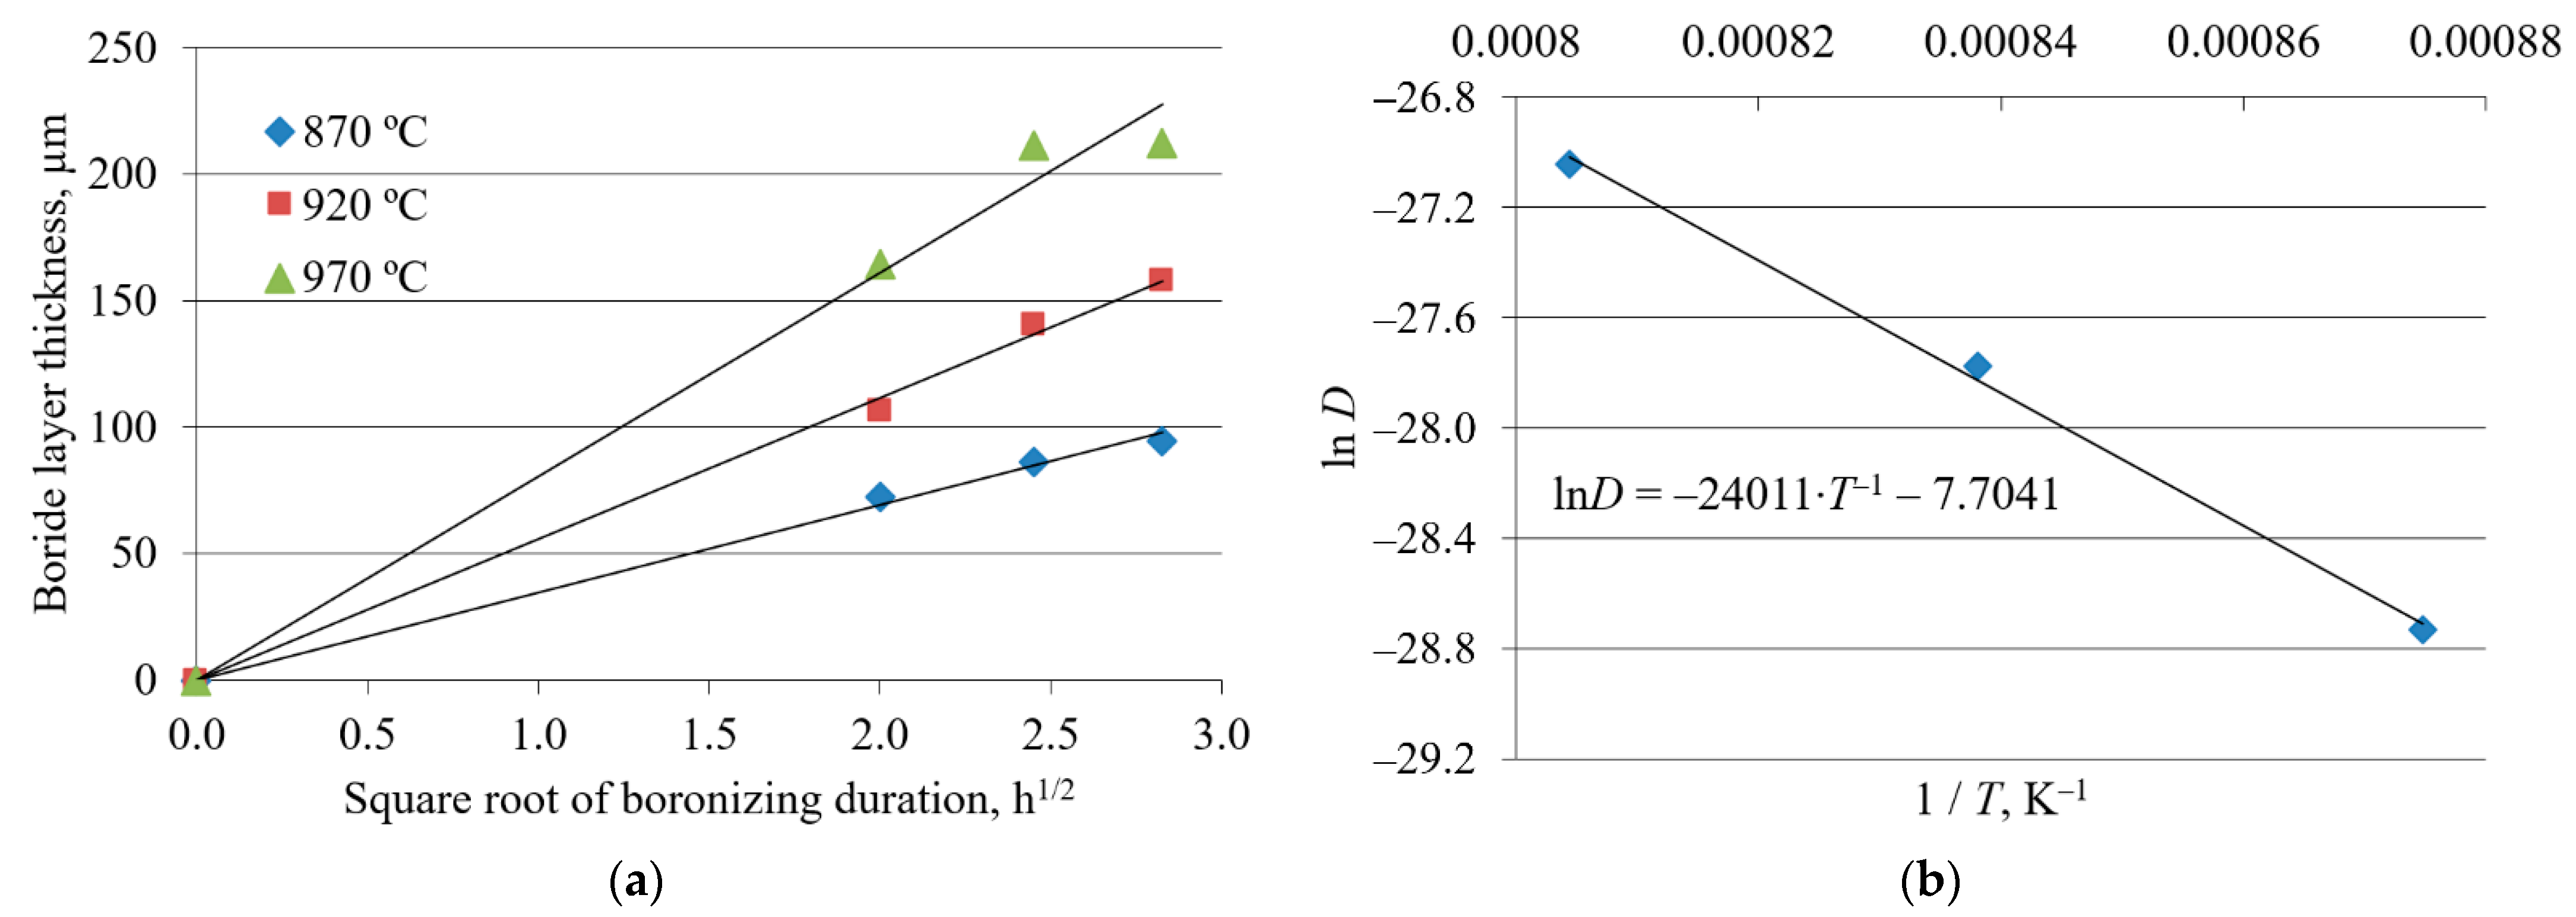
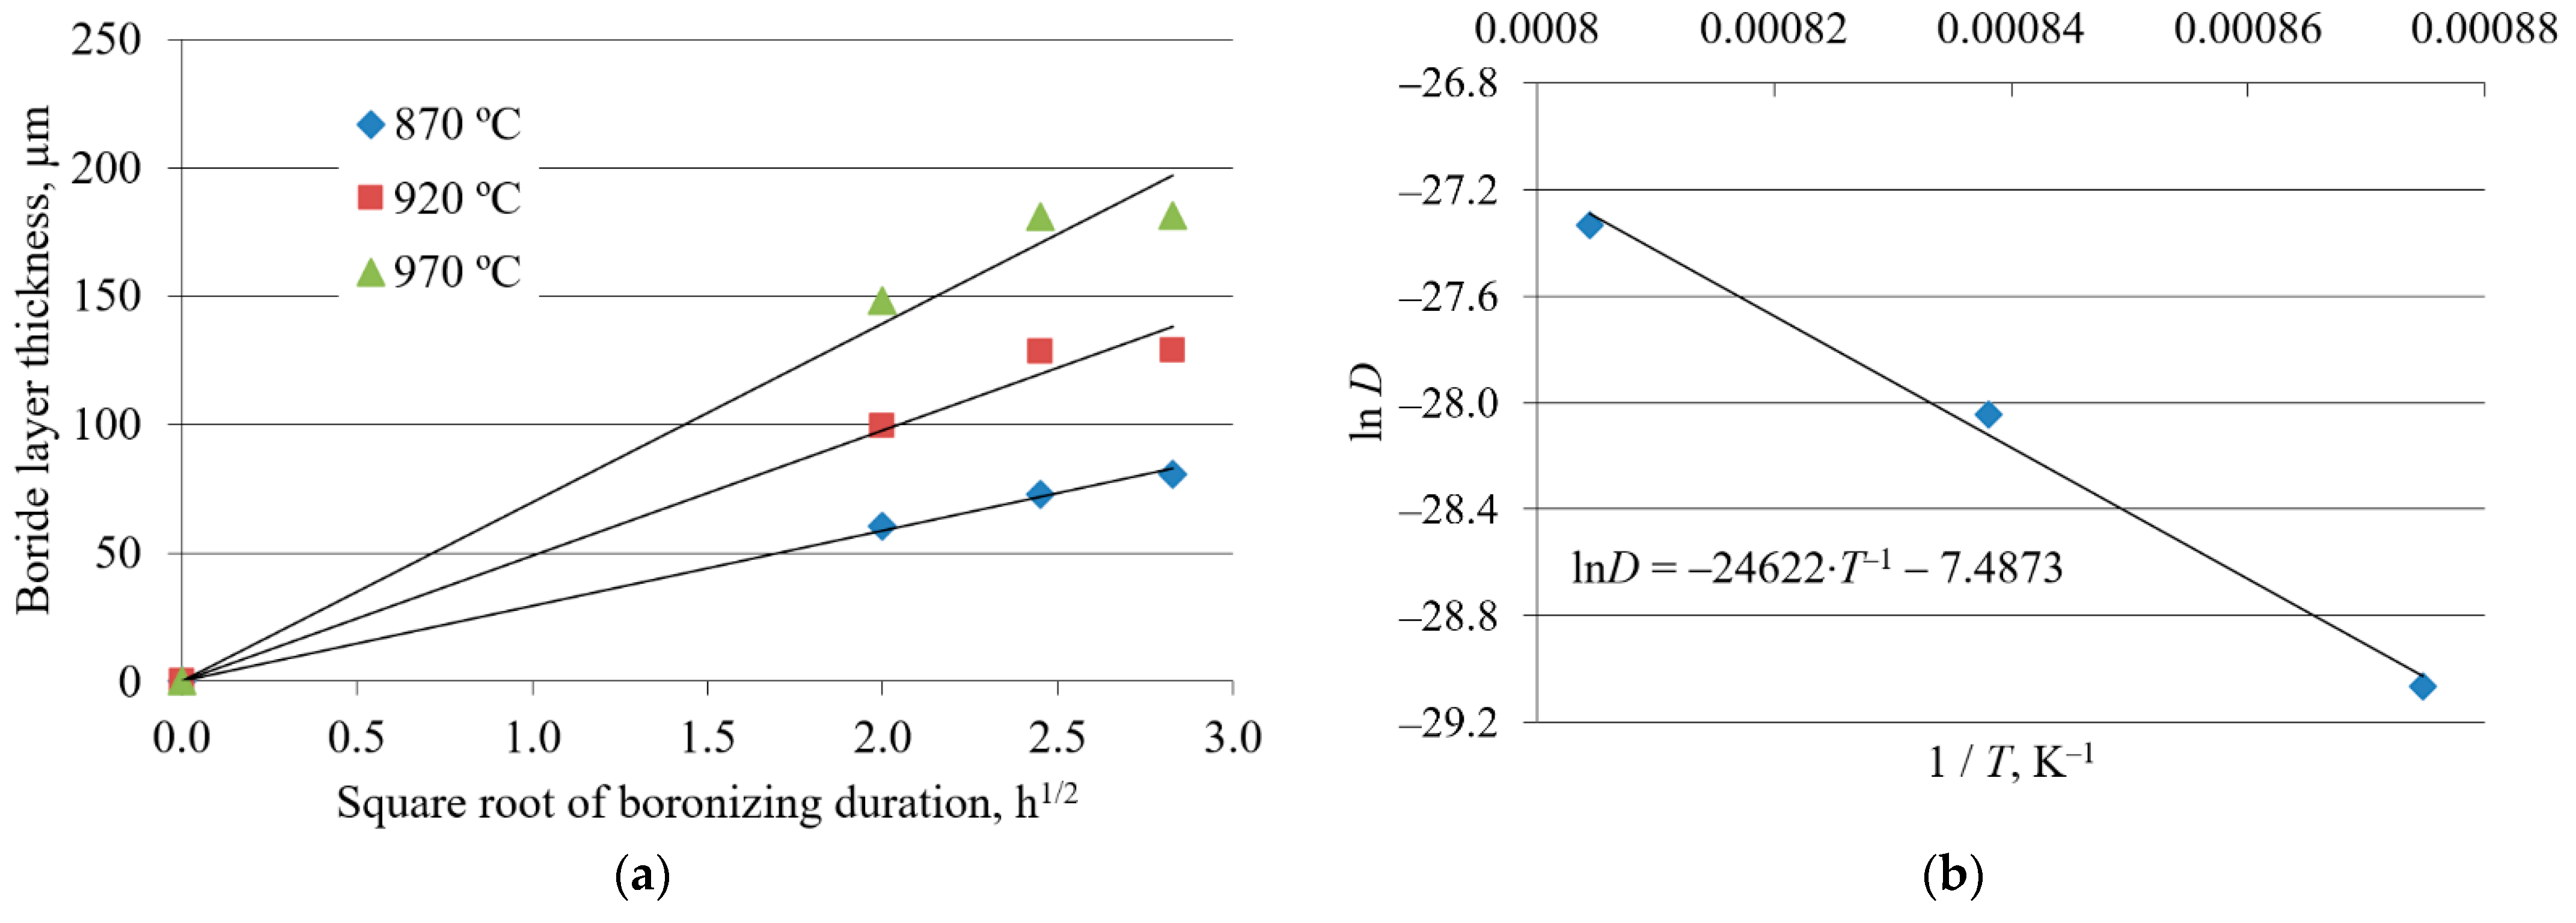
3.2. Boride Layer Growth Kinetics
3.2.1. Results from Previous Studies
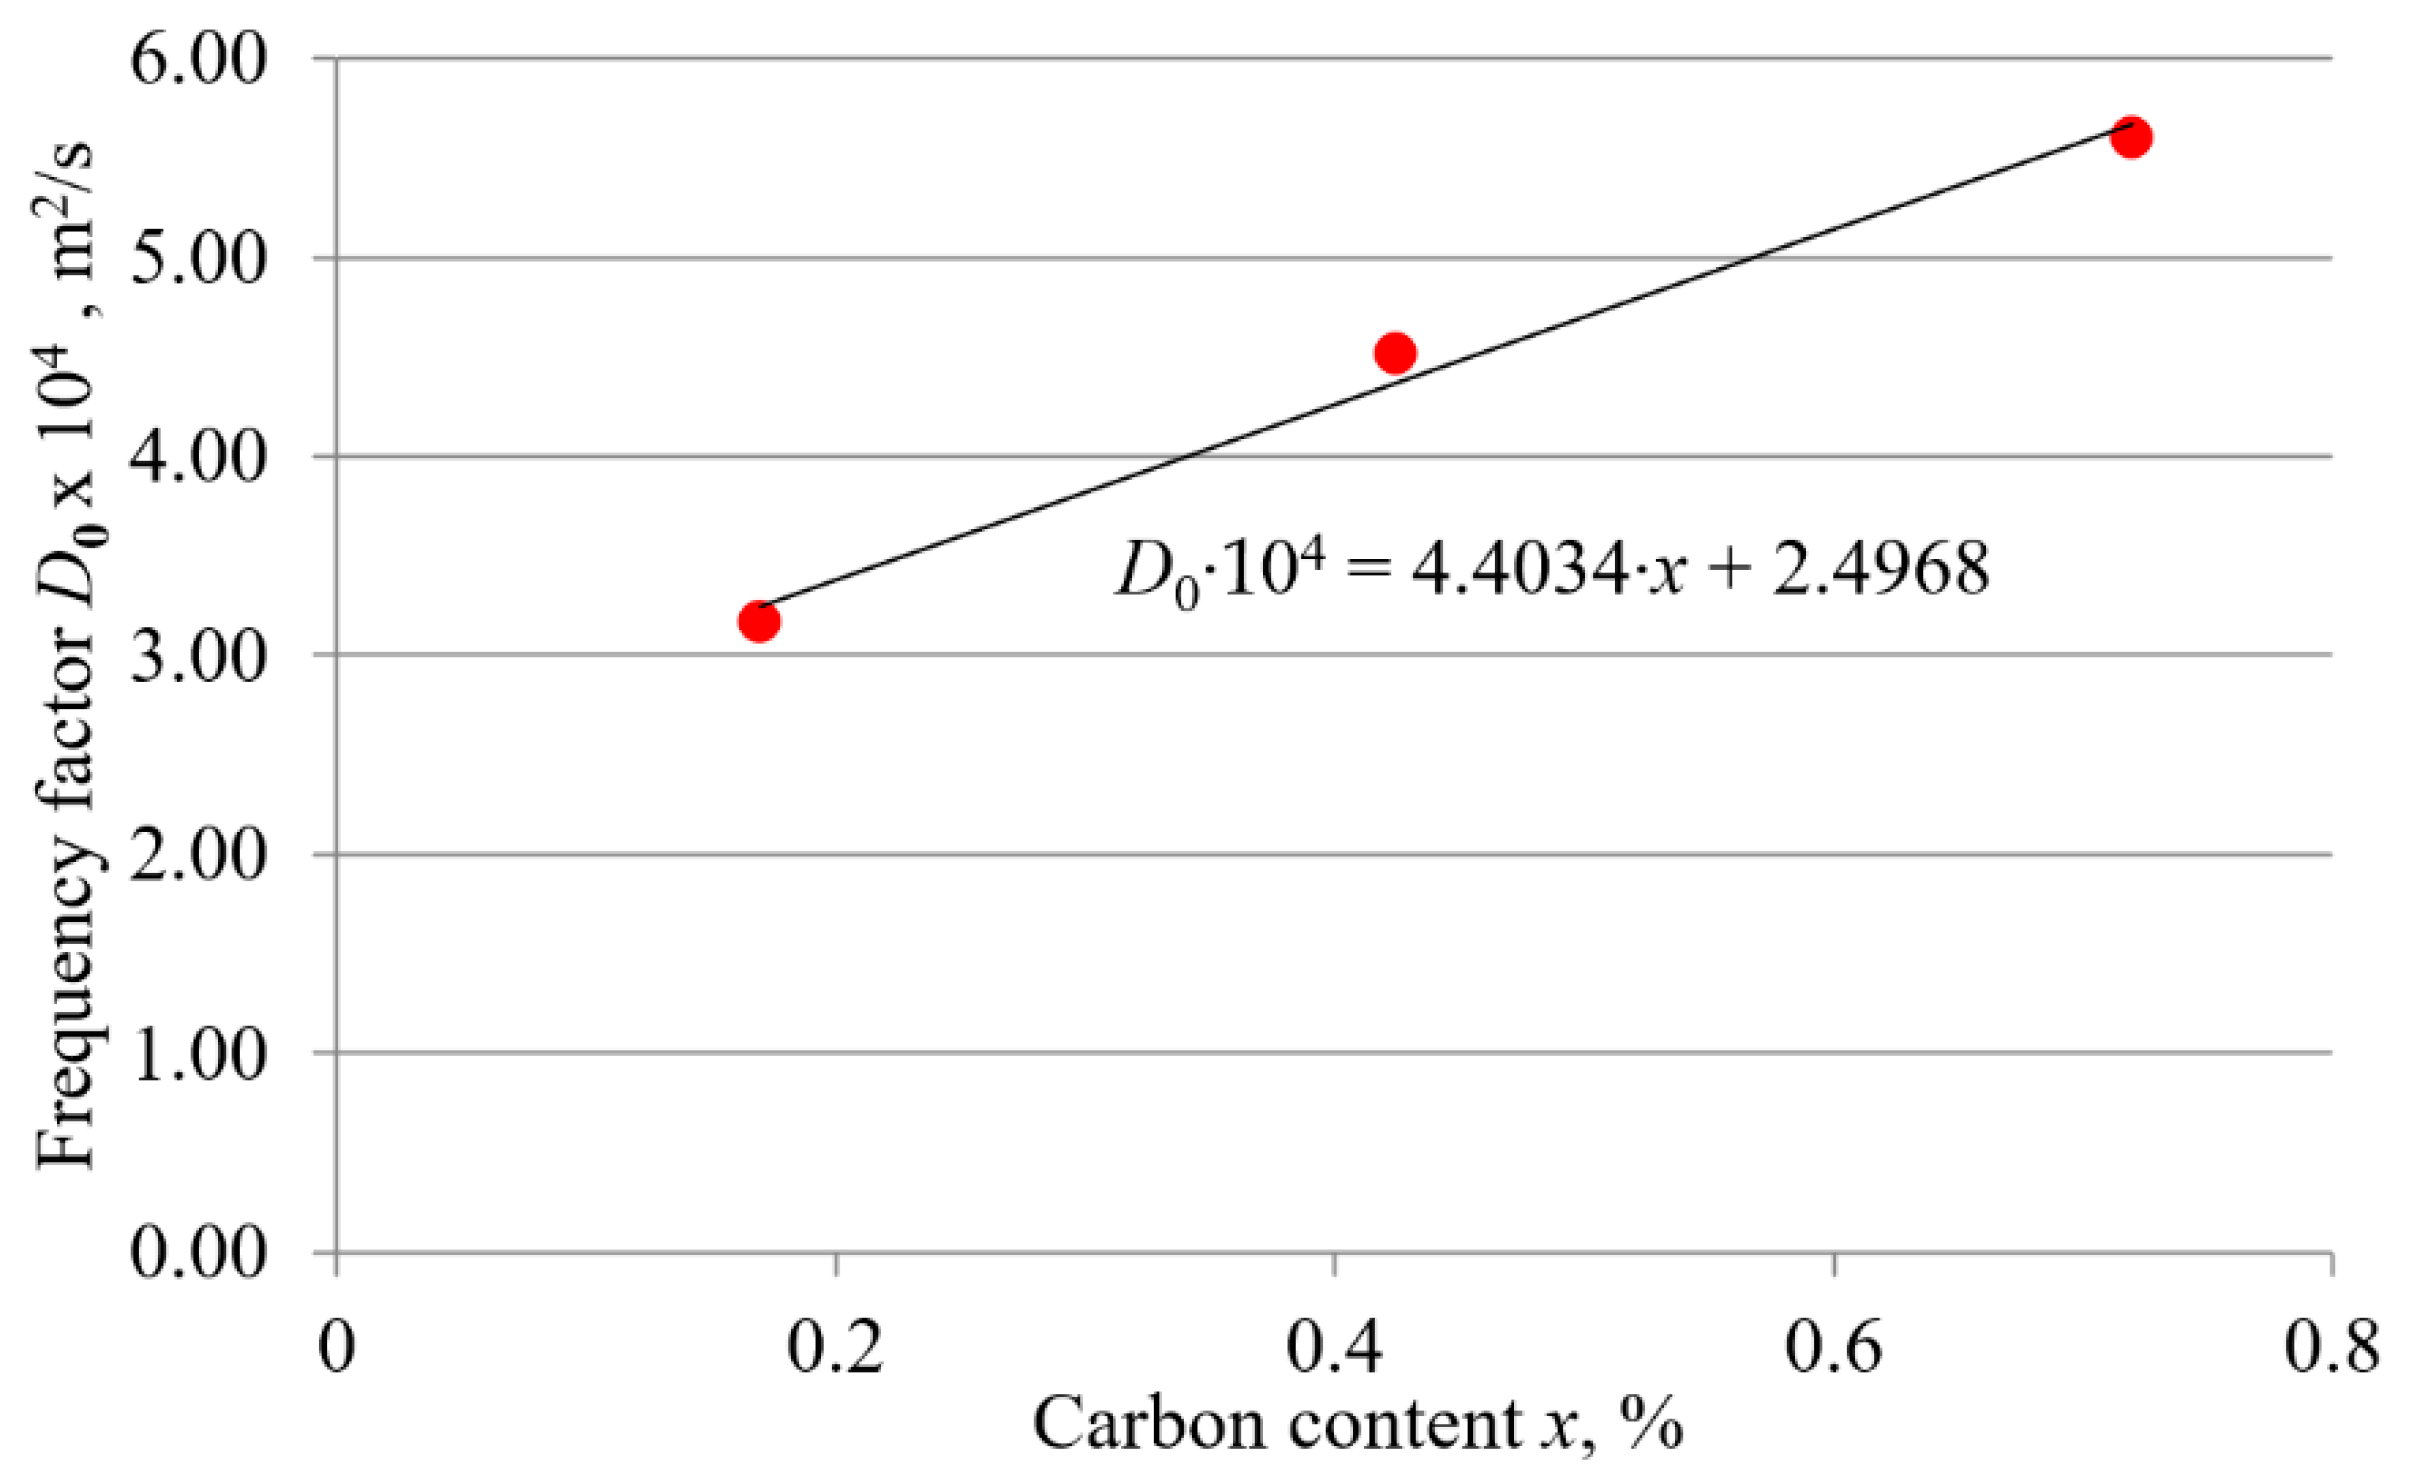
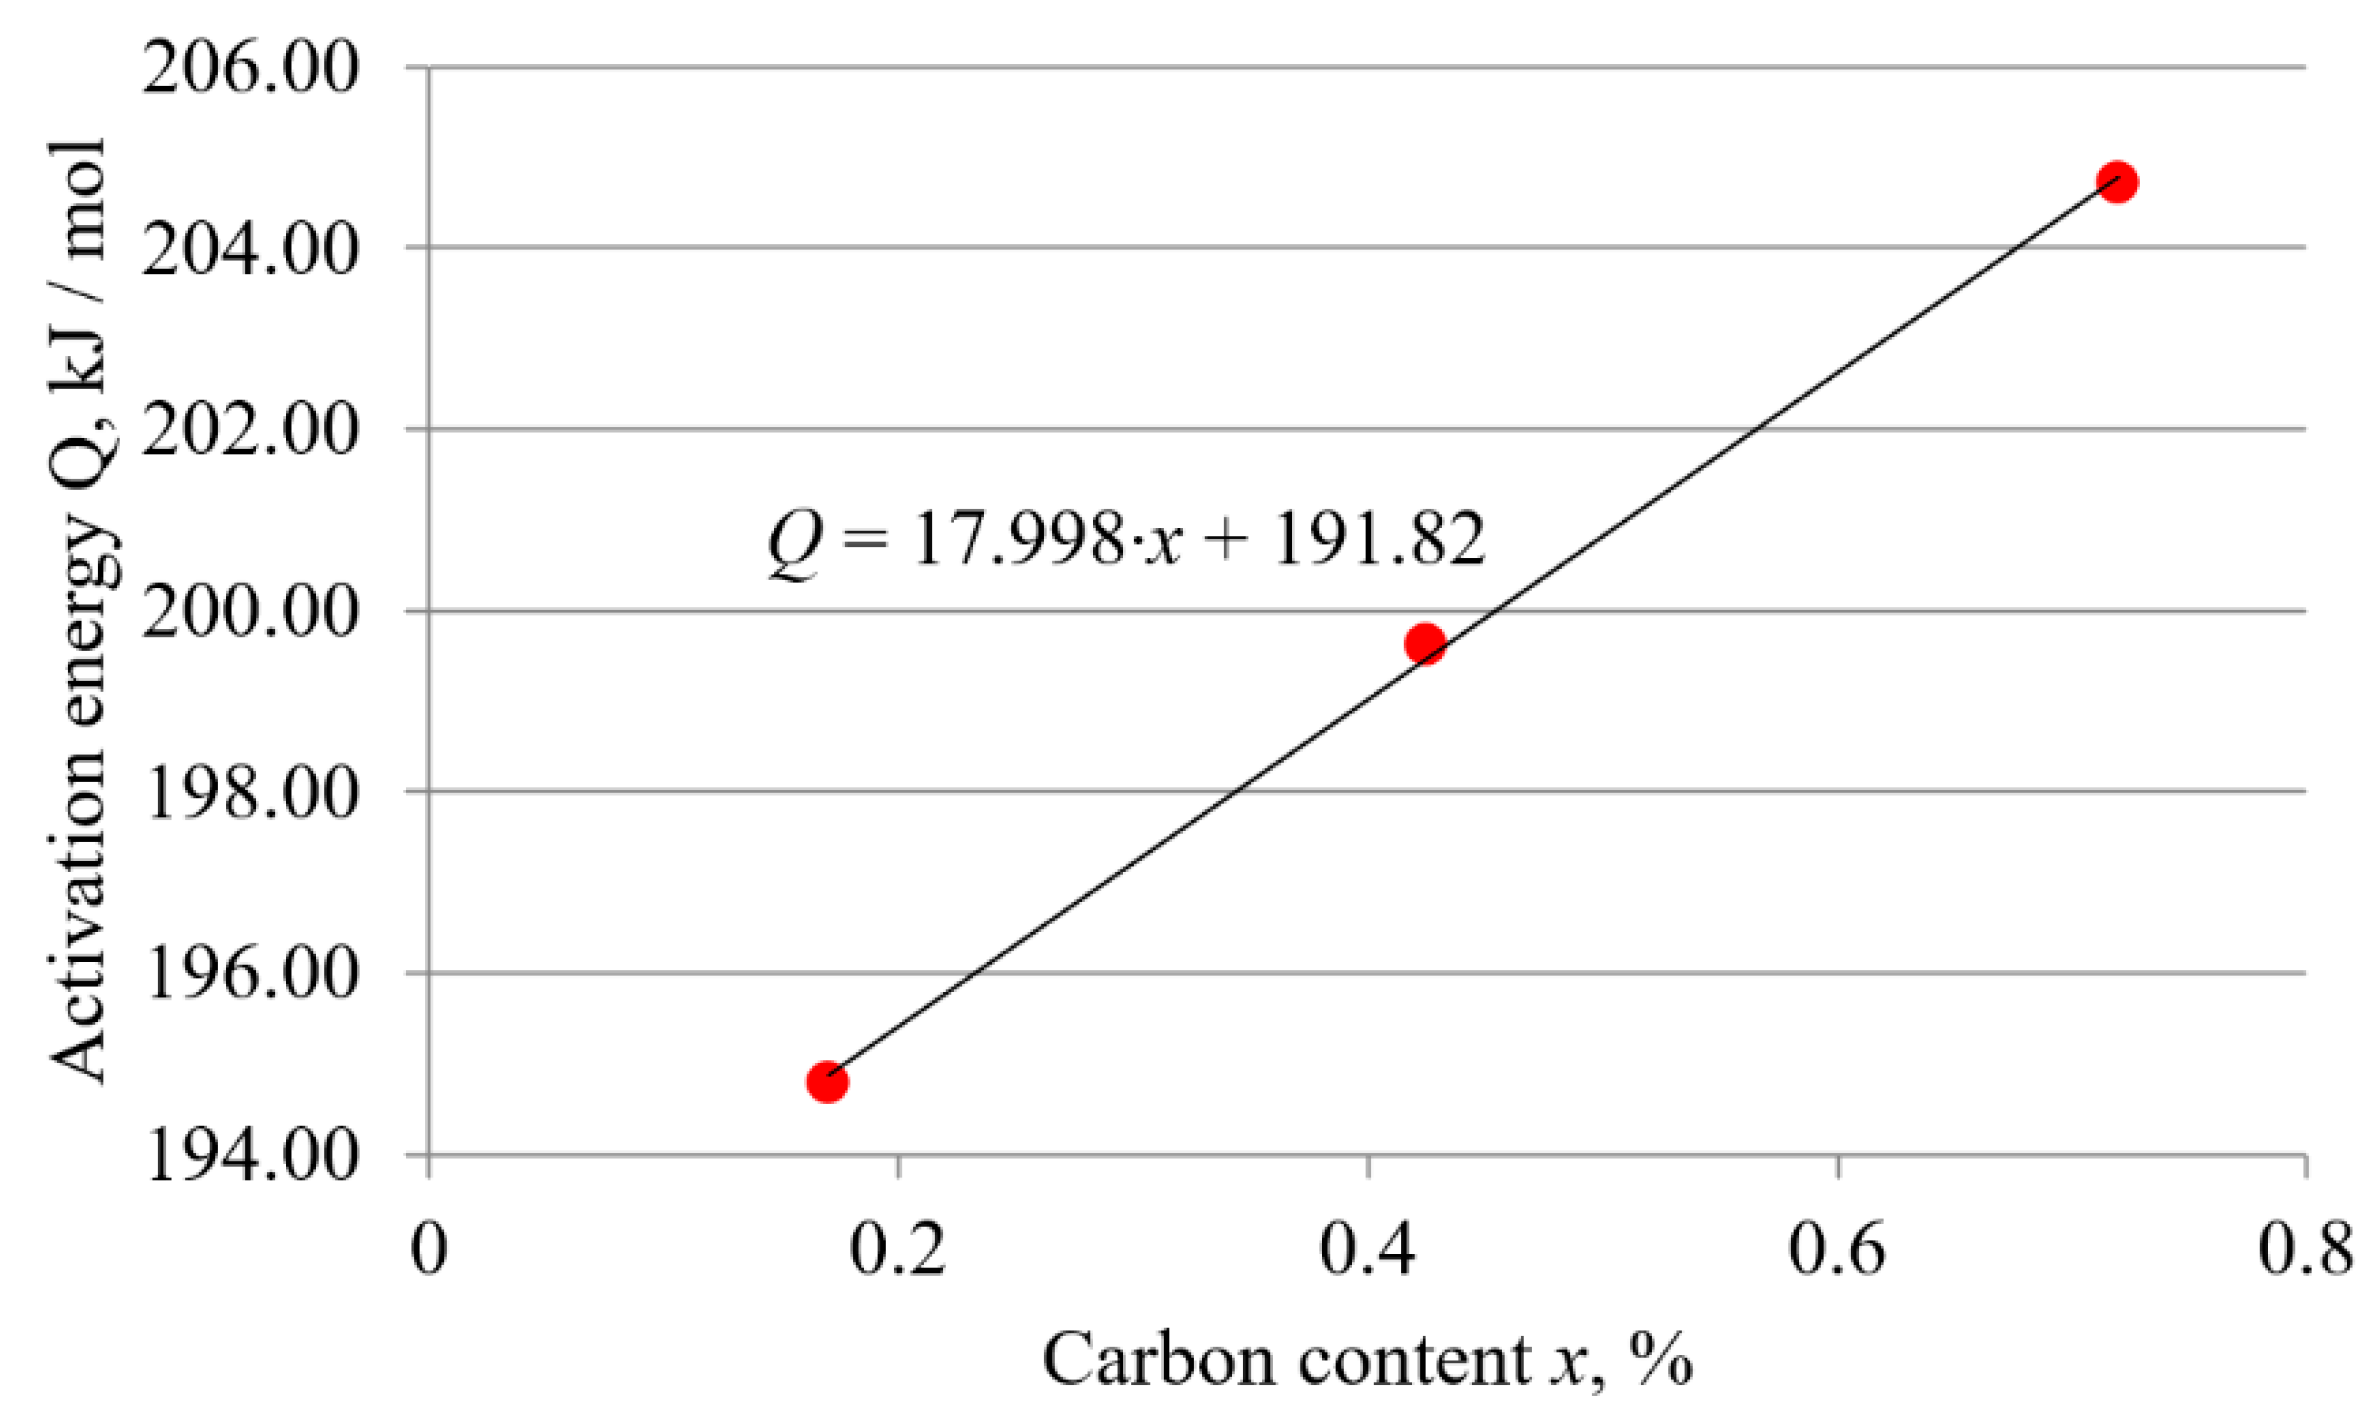
3.2.2. Dependence of the Frequency Factor and the Activation Energy on the Carbon Content
3.3. Statistical Analysis
4. Discussion
5. Conclusions
- The boride layers obtained on all three steels have a characteristic saw-tooth morphology, but the degree of toothness is different. The boride layers on C15 steel exhibit the most pronounced saw-tooth morphology, while the layers on C70W2 exhibit minimal toothness.
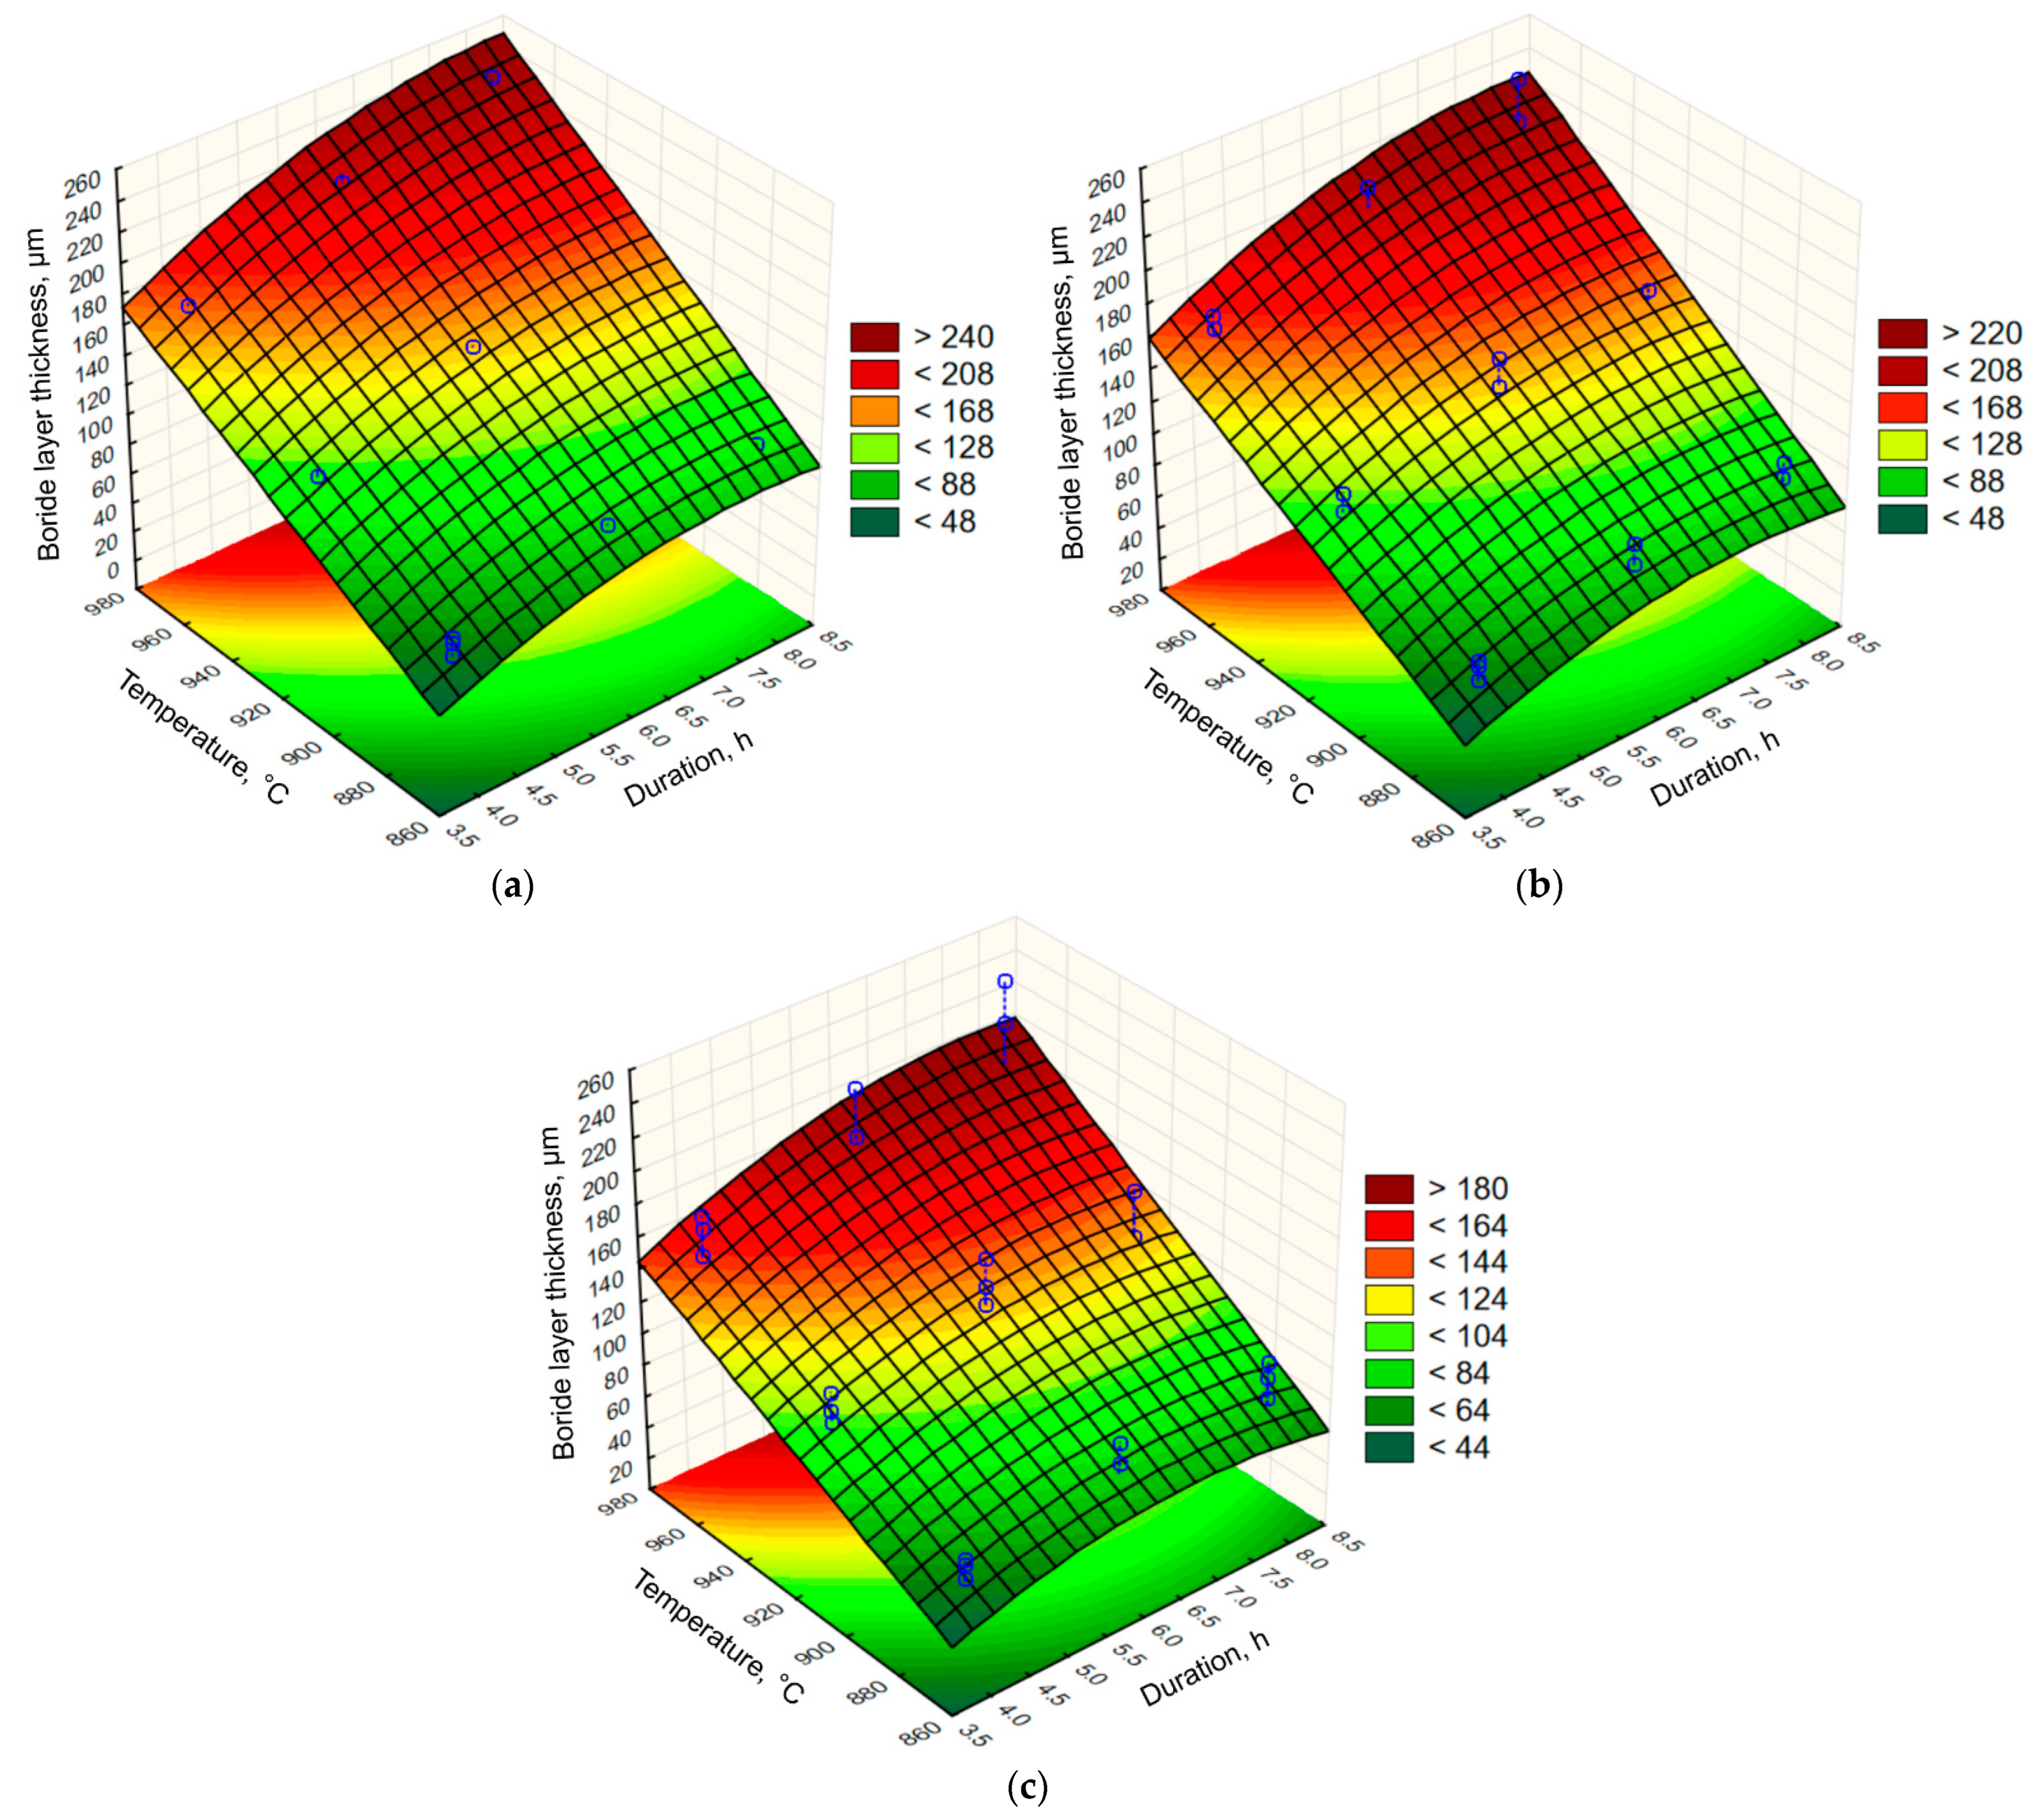
- For all three steels, increasing the boronizing temperature and duration resulted in an increase in boride layer thickness. It was also found that the thickness of the boride layer was strongly dependent on the carbon content of the carbon steel. For the same boronizing parameters, the boride layer thickness decreases as the carbon content of the steel increases. The thickest layers were produced on C15 steel and the thinnest on C70 steel.
- The activation energy and frequency factor depend on the carbon content in the hypoeutectoid carbon steel. Both the activation energy and frequency factor increase linearly with increasing carbon content. The linear relationship confirms that in carbon steels, the influence of chemical composition has a dominant effect on boronizing kinetics. Based on the results, expressions showing the functional relationship between activation energy and carbon content and between frequency factor and carbon content were obtained. The obtained expressions allow the calculation of the activation energy and frequency factor based on the carbon content of hypoeutectoid carbon steel.
- The analysis of variance showed that the influence of boronizing temperature, duration and carbon content of carbon steel on the boride layer thickness are highly statistically significant. The influence of boronizing temperature is strongest, followed by duration and carbon content.
- Regression analysis was performed and through the analysis of variance of the regression model, it was found that the boronizing temperature has the strongest effect on the response, followed by the duration and carbon content. Compared to them, the variable interactions as well as the square of boronizing duration are statistically significant, but have less influence on the boride layer thickness.
- The regression model based on the design of experiment was built to predict the boride layer thickness as a function of the carbon content of the hypoeutectic carbon steel and the boronizing temperature and duration. This model is valid for the boronizing of hypoeutectic carbon steels in the observed temperature and duration range.
Author Contributions
Funding
Institutional Review Board Statement
Informed Consent Statement
Data Availability Statement
Acknowledgments
Conflicts of Interest
References
- Matijević, B. Evaluation of Boride layer growth on carbon steel surfaces. Met. Sci. Heat Treat. 2014, 56, 269–273. [Google Scholar] [CrossRef]
- Balusamy, T.; Sankara Narayanan, T.S.N.; Ravichandran, K.; Song Park, I.; Lee, M.H. Pack boronizing of AISI H11 tool steel: Role of surface mechanical attrition treatment. Vacuum 2013, 97, 36–43. [Google Scholar] [CrossRef]
- Jurci, P.; Hudáková, M. Characterization of microstructure and fracture performance of boronized H11 grade hot-work tool steel. Mater. Perform. Charact. 2020, 9, 20190086. [Google Scholar] [CrossRef]
- Ortiz-Domínguez, M.; Flores-Rentería, M.Á.; Keddam, M.; Elias-Espinosa, M.; Damián-Mejía, O.; Aldana-González, J.I.; Zuno-Silva, J.; Medina-Moreno, S.A.; González-Reyes, J.G. Simulation of growth kinetics of Fe2B layers formed on gray cast iron during the powder-pack boriding. Mater. Tehnol. 2014, 48, 905–916. [Google Scholar]
- Çetin, M.; Günen, A.; Kalkandelen, M.; Karakas, M.S. Microstructural, wear and corrosion characteristics of boronized AISI 904L superaustenitic stainless steel. Vacuum 2021, 187, 110145. [Google Scholar] [CrossRef]
- Erdoğan, A. Investigation of high temperature dry sliding behavior of borided H13 hot work tool steel with nanoboron powder. Surf. Coat. Technol. 2019, 357, 886–895. [Google Scholar] [CrossRef]
- Gök, M.S.; Küçük, Y.; Erdoğan, A.; Öge, M.; Kancad, E.; Günen, A. Dry sliding wear behavior of borided hot-work tool steel at elevated temperatures. Surf. Coat. Technol. 2017, 328, 54–62. [Google Scholar] [CrossRef]
- Panda, J.N.; Wong, B.C.; Medvedovski, E.; Egberts, P. Enhancement of tribo-corrosion performance of carbon steel through boronizing and BN-based coatings. Tribol. Int. 2021, 153, 106666. [Google Scholar] [CrossRef]
- Bican, O.; Bayça, S.U.; Kuleyin, H.; Gümrük, R. Effect of boronizing on operating stability of steel AISI 304L under erosion impact of hard particles. Met. Sci. Heat Treat. 2021, 63, 156–162. [Google Scholar] [CrossRef]
- Kayali, Y. Investigation of diffusion kinetics of borided AISI P20 steel in microwave furnace. Vacuum 2015, 121, 129–134. [Google Scholar] [CrossRef]
- Günen, A. Properties and high temperature dry sliding wear behavior of boronized Inconel 718. Metall. Mater. Trans. A 2019, 51, 927–939. [Google Scholar] [CrossRef]
- Karakaş, M.S.; Günen, A.; Kanca, E.; Yilmaz, E. Boride layer growth kinetics of AISI H13 steel borided with nano-sized powders. Arch. Metall. Mater. 2018, 63, 159–165. [Google Scholar]
- Carrera-Espinoza, R.; Figueroa-López, U.; Martínez-Trinidad, J.; Campos-Silva, I.; Hernández-Sánchez, E.; Motallebzadehd, A. Tribological behavior of borided AISI 1018 steel under linear reciprocating sliding conditions. Wear 2016, 362, 1–7. [Google Scholar] [CrossRef]
- Sahin, S.; Meriç, C. Investigation of the effect of boronizing on cast irons. Mater. Res. Bull. 2002, 37, 971–979. [Google Scholar] [CrossRef]
- Tabur, M.; Izciler, M.; Gul, F.; Karacan, I. Abrasive wear behavior of boronized AISI 8620 steel. Wear 2009, 266, 1106–1112. [Google Scholar] [CrossRef]
- Allaoui, O.; Bouaouadja, N.; Saindernan, G. Characterization of boronized layers on a XC38 steel. Surf. Coat. Technol. 2006, 201, 3475–3482. [Google Scholar] [CrossRef]
- Golubić, S.; Kladarić, I.; Samardžić, I.; Jakovljević, S. The adhesiveness of the PVD coatings on heat treated structural steels. Teh. Vjesn. 2021, 28, 410–415. [Google Scholar]
- Sen, S.; Sen, U.; Bindal, C. An approach to kinetic study of borided steels. Surf. Coat. Technol. 2005, 191, 274–285. [Google Scholar] [CrossRef]
- Béjar, M.A.; Moreno, E. Abrasive wear resistance of boronized carbon and low-alloy steels. J. Mater. Process. Technol. 2006, 173, 352–358. [Google Scholar] [CrossRef]
- Ruiz-Trabolsi, P.A.; Velázquez, J.C.; Orozco-Álvarez, C.; Carrera-Espinoza, R.; Yescas-Hernández, J.A.; González-Arévalo, N.E.; Hernández-Sánchez, E. Kinetics of the boride layers obtained on AISI 1018 steel by considering the amount of matter involved. Coatings 2021, 11, 259. [Google Scholar] [CrossRef]
- Yang, H.; Wu, X.; Cao, G.; Yang, Z. Enhanced boronizing kinetics and high temperature wear resistance of H13 steel with boriding treatment assisted by air blast shot peening. Surf. Coat. Technol. 2016, 307, 506–516. [Google Scholar] [CrossRef]
- Sen, S.; Ozbek, I.; Sen, U.; Bindal, C. Mechanical behavior of borides formed on borided cold work tool steel. Surf. Coat. Technol. 2001, 135, 173–177. [Google Scholar] [CrossRef]
- Hernández-Sánchez, E.; Velázquez, J.C. Kinetics of growth of iron boride layers on a low-carbon steel surface. In Laboratory Unit Operations and Experimental Methods in Chemical Engineering; Basha, O.M., Badie, M., Eds.; IntechOpen: London, UK, 2018; p. 60493. [Google Scholar]
- Campos-Silva, I.; Ortiz-Domínguez, M.; Cimenoglu, H.; Escobar-Galindo, R.; Keddam, M.; Elías-Espinosa, M.; López-Perrusquia, N. Diffusion model for growth of Fe2B layer in pure iron. Surf. Eng. 2011, 27, 189–195. [Google Scholar] [CrossRef]
- Delai, O.; Xia, C.; Shiqiang, L. Growth kinetics of the FeB/Fe2B boride layer on the surface of 4Cr5MoSiV1 steel: Experiments and modelling. J. Mater. Res. Technol. 2021, 11, 1272–1280. [Google Scholar] [CrossRef]
- Kaouka, A.; Allaoui, O.; Keddam, M. Growth kinetics of the boride layers formed on SAE 1035 steel. Mater. Tech. 2013, 101, 705. [Google Scholar] [CrossRef]
- Kartal, G.; Eryilmaz, O.L.; Krumdick, G.; Erdemir, A.; Timura, S. Kinetics of electrochemical boriding of low carbon steel. Appl. Surf. Sci. 2011, 257, 6928–6934. [Google Scholar] [CrossRef]
- Campos, I.; Torres, R.; Ramírez, G.; Ganem, R.; Martínez, J. Growth kinetics of iron boride layers: Dimensional analysis. Appl. Surf. Sci. 2006, 252, 8662–8667. [Google Scholar] [CrossRef]
- Mebarek, B.; Keddam, M. A fuzzy neural network approach for modeling the growth kinetics of FeB and Fe2B layers during the boronizing process. Mater. Tech. 2018, 106, 603. [Google Scholar] [CrossRef]
- Velázquez-Altamirano, J.C.; Torres-Avila, I.P.; Teran-Méndez, G.; Capula-Colindres, S.I.; Cabrera-Sierra, R.; Carrera-Espinoza, R.; Hernández-Sánchez, E. A stochastic model and investigation into the probability distribution of the thickness of boride layers formed on low-carbon steel. Coatings 2019, 9, 756. [Google Scholar] [CrossRef] [Green Version]
- Aydar, A.Y. Utilization of response surface methodology in optimization of extraction of plant materials. In Statistical Approaches with Emphasis on Design of Experiments Applied to Chemical Processes; Silva, V., Ed.; IntechOpen: London, UK, 2018; p. 59209. [Google Scholar]
- Nooraziah, A.; Tiagrajah, V.J. A study on regression model using response surface methodology. Appl. Mech. Mater. 2014, 666, 235–239. [Google Scholar] [CrossRef]
- Arguelles-Ojedaa, J.L.; Márquez-Herrerac, A.; Saldaña-Roblesc, A.L.; Saldaña-Roblesc, A.; Corona-Riveraa, M.A.; Moreno-Palmerin, J. Hardness optimization of boride diffusion layer on ASTM F-75 alloy using response surface methodology. Rev. Mex. Fis. 2017, 63, 76–81. [Google Scholar]
- Yalamaç, E.; Türkmen, İ.; Firtina, Ö. Characterization and kinetic analysis of iron boride layer formed on the GGG 70 ductile cast iron. Trans. Indian Inst. Met. 2021, 74, 1701–1711. [Google Scholar] [CrossRef]
- Türkmen, İ.; Yalamaç, E. Growth of the Fe2B layer on SAE 1020 steel employed a boron source of H 3 BO 3 during the powder-pack boriding method. J. Alloys Compd. 2018, 744, 658–666. [Google Scholar] [CrossRef]
- VillaVelázquez-Mendoza, C.I.; Rodríguez-Mendoza, J.L. Effect of substrate roughness, time and temperature on the processing of iron boride coatings: Experimental and statistical approaches. Int. J. Surf. Sci. Eng. 2014, 8, 71–91. [Google Scholar] [CrossRef]
- Ficici, F.; Kapsiz, M.; Durat, M. Applications of Taguchi design method to study wear behaviour of boronized AISI 1040 steel. Int. J. Phys. Sci. 2011, 6, 237–243. [Google Scholar]
- Zouzou, C.; Keddam, M.; Bouarour, B.; Piasecki, A.; Miklaszewski, A.; Kulka, M. Characterization and boronizing kinetics of EN-GJL-250 lamellar gray cast iron. Ann. Chim.-Sci. Mat. 2020, 44, 23–28. [Google Scholar] [CrossRef]
- Chegroune, R.; Keddam, M.; Nait Abdellah, Z.; Ulker, S.; Taktak, S.; Gunes, I. Characterization and kinetics of plasma-paste-borided AISI 316 steel. Mater. Tehnol. 2016, 50, 263–268. [Google Scholar] [CrossRef]
- Meric, C.; Sahin, S.; Backir, B.; Koksal, N.S. Investigation of the boronizing effect on the abrasive wear behavior in cast irons. Mater. Des. 2006, 27, 751–757. [Google Scholar] [CrossRef]
- Atık, E.; Yunker, U.; Merıç, C. The effects of conventional heat treatment and boronizing on abrasive wear and corrosion of SAE 1010, SAE 1040, D2 and 304 steels. Tribol. Int. 2003, 36, 155–161. [Google Scholar] [CrossRef]
- Campos, I.; Ramírez Sandoval, G.; Figueroa, U.; Martínez, J.; Morales, O. Evaluation of boron mobility on the phases FeB, Fe2B and diffusion zone in AISI 1045 and M2 steels. Appl. Surf. Sci. 2007, 253, 3469–3475. [Google Scholar] [CrossRef]
- Milinović, A.; Krumes, D.; Marković, R. An investigation of boride layers growth kinetics on carbon steels. Teh. Vjesn. 2012, 19, 27–31. [Google Scholar]
- Milinović, A.; Marušić, V.; Samardžić, I. Research into boride layers: Growth kinetics on C45 carbon steel. Metalurgija 2016, 55, 671–674. [Google Scholar]
- Milinović, A.; Krumes, D.; Kladarić, I.; Klarić, Š.; Aračić, S. An investigation of boride layers growth kinetics on C15 steel. In Proceedings of the 16th International Research/Expert Conference “Trends in the Development of Machinery and Associated Technology” TMT2012, Dubai, United Arab Emirates, 10–12 September 2012. [Google Scholar]
- Dinagent. Available online: http://www.dinagent.com/wp-content/uploads/DURFERRIT-program-isporuke.pdf (accessed on 15 February 2022).
- TIBCO Software Inc. Data Science Workbench, Version 14. 2020. Available online: http://tibco.com (accessed on 18 February 2022).
- Pauše, Ž. Uvod u Matematičku Statistiku; Školska Knjiga: Zagreb, Croatia, 1993; pp. 178–342. [Google Scholar]
- Li, C.; Shen, B.; Li, G.; Yang, C. Effect of boronizing temperature and time on microstructure and abrasion wear resistance of Cr12Mn2V2 high chromium cast iron. Surf. Coat. Technol. 2008, 202, 5882–5886. [Google Scholar] [CrossRef]
- Jain, V.; Sundararajan, G. Influence of the pack thickness of the boronizing mixture on the boriding of steel. Surf. Coat. Technol. 2002, 149, 21–26. [Google Scholar] [CrossRef]
- Yu, L.G.; Chen, X.J.; Khor, K.A.; Sundararajan, G. FeB/Fe2B phase transformation during SPS pack-boriding: Boride layer growth kinetics. Acta Mater. 2005, 53, 2361–2368. [Google Scholar] [CrossRef]
- Kayali, Y.; Günes, I.; Ulu, S. Diffusion kinetics of borided AISI 52100 and AISI 440C steels. Vacuum 2012, 86, 1428–1434. [Google Scholar] [CrossRef]
- Ozdemir, O.; Omar, M.A.; Usta, M.; Zeytin, S.; Bindal, C.; Ucisik, A.H. An investigation on boriding kinetics of AISI 316 stainless steel. Vacuum 2009, 83, 175–179. [Google Scholar] [CrossRef]
- Genel, K. Boriding kinetics of H13 steel. Vacuum 2006, 80, 451–457. [Google Scholar] [CrossRef]
- Sen, S.; Sen, U.; Bindal, C. The growth kinetics of borides formed on boronized AISI 4140 steel. Vacuum 2005, 77, 195–202. [Google Scholar] [CrossRef]
- Uslu, I.; Comert, H.; Ipek, M.; Celebi, F.G.; Ozdemir, O.; Bindal, C. A comparison of borides formed on AISI 1040 and AISI P20 steels. Mater. Des. 2007, 28, 1819–1826. [Google Scholar] [CrossRef]
- Genel, K.; Ozbek, I.; Bindal, C. Kinetics of boriding of AISI W1 steel. Mater. Sci. Eng. A 2003, 347, 311–314. [Google Scholar] [CrossRef]


| C | Si | Mn | P | S | Cu | |
|---|---|---|---|---|---|---|
| C15 | 0.17 | 0.24 | 0.38 | 0.023 | 0.005 | 0.04 |
| C45 | 0.425 | 0.255 | 0.78 | 0.013 | 0.035 | - |
| C70W2 | 0.72 | 0.211 | 0.286 | 0.014 | 0.017 | - |
| Boronizing Temperature, °C | Boronizing Duration, h | C15 [43,45] | SD | C45 [44] | SD | C70W2 [43] | SD |
|---|---|---|---|---|---|---|---|
| 870 | 4 | 70 | 10.4 | 73 | 11.5 | 61 | 8.6 |
| 6 | 98 | 16.4 | 86 | 15.9 | 73 | 8.8 | |
| 8 | 104 | 7.8 | 94 | 16.0 | 81 | 9.9 | |
| 920 | 4 | 118 | 13.3 | 107 | 13.3 | 100 | 7.8 |
| 6 | 157 | 12.7 | 140 | 12.3 | 129 | 9.1 | |
| 8 | 158 | 13.5 | 158 | 11.3 | 129 | 10.9 | |
| 970 | 4 | 173 | 12.4 | 165 | 12.0 | 148 | 9.1 |
| 6 | 211 | 19.3 | 211 | 15.5 | 181 | 11.5 | |
| 8 | 239 | 13.3 | 213 | 18.9 | 181 | 10.3 |
| Steel | Frequency Factor D0, m2/s | Activation Energy Q, kJ/mol |
|---|---|---|
| C15 | 3.17 × 10⁻⁴ | 194.80 |
| C45 | 4.51 × 10⁻⁴ | 199.63 |
| C70W2 | 5.6 × 10⁻⁴ | 204.71 |
| Sum of Squares SS | Degrees of Freedom df | Mean Square MS | F-Value | p-Value | Partial eta Squared | |
|---|---|---|---|---|---|---|
| Intercept | 322,940.1 | 1 | 322,940.1 | 3744.233 | 0,000,000 | 0.997 |
| Carbon content | 3334.7 | 1 | 3334.7 | 38.663 | 4.46 × 10⁻⁵ | 0.763 |
| Temperature | 34,816.4 | 2 | 17,408.2 | 201.834 | 5.79 × 10⁻¹⁰ | 0.971 |
| Duration | 4620.8 | 2 | 2310.4 | 26.787 | 3.76 × 10⁻⁵ | 0.817 |
| Error | 1035 | 12 | 86.3 |
| Sum of Squares SS | Degrees of Freedom df | Mean Square MS | F-Value | p-Value | |
|---|---|---|---|---|---|
| (1) Carbon content | 3383.76 | 1 | 3383.76 | 96.556 | 6.97 × 10⁻⁹ |
| (2) Temperature | 53,302.59 | 1 | 53,302.59 | 1521.002 | 1.34 × 10⁻¹⁹ |
| (3) Duration | 6412.00 | 1 | 6412.00 | 182.968 | 3.34 × 10⁻¹¹ |
| Duration 2 | 740.74 | 1 | 740.74 | 21.137 | 1.97 × 10⁻⁴ |
| (1) × (2) | 266.78 | 1 | 266.78 | 7.613 | 1.25 × 10⁻² |
| (1) × (3) | 284.07 | 1 | 284.07 | 8.106 | 1.03 × 10⁻² |
| (2) × (3) | 432.00 | 1 | 432.00 | 12.327 | 2.34 × 10⁻³ |
| Error | 665.84 | 19 | 35.04 | ||
| Total Sum of Squares | 65,844.74 | 26 |
| Material | Boronizing Medium | Activation Energy, kJ/mol | References |
|---|---|---|---|
| AISI 440C | Solid media | 340.4 | [52] |
| AISI 316 | Solid media | 199.0 | [53] |
| AISI 316 | Plasma paste | 250.8 | [39] |
| AISI D2 | Molten salt | 170.0 | [18] |
| AISI H13 | Solid media | 186.2 | [54] |
| AISI H13 | Solid media | 284.2 | [12] |
| AISI 52100 | Solid media | 269.6 | [52] |
| AISI 5140 | Molten salt | 223.0 | [18] |
| AISI 4340 | Molten salt | 234.0 | [18] |
| AISI 4140 | Molten salt | 215.0 | [55] |
| AISI P20 | Solid media | 200.0 | [56] |
| AISI P20 | Solid media | 256.5 | [10] |
| AISI W1 | Solid media | 171.2 | [57] |
| AISI W110 | Solid media | 165.0 | [1] |
| AISI 1045 | Solid media | 186.0 | [1] |
| AISI 1040 | Solid media | 168.0 | [56] |
| SAE 1035 | Molten salt | 227.51 | [26] |
| SAE 1020 | Solid media | 183.15 | [35] |
| AISI 1018 | Solid media | 148.3 | [20] |
| AISI 1018 | Molten salt | 172,8 | [27] |
| AISI 1018 | Molten salt | 172,8 | [27] |
| AISI 1015 | Solid media | 190.0 | [1] |
| Armco iron | Paste | 157.0 | [24] |
Publisher’s Note: MDPI stays neutral with regard to jurisdictional claims in published maps and institutional affiliations. |
© 2022 by the authors. Licensee MDPI, Basel, Switzerland. This article is an open access article distributed under the terms and conditions of the Creative Commons Attribution (CC BY) license (https://creativecommons.org/licenses/by/4.0/).
Share and Cite
Milinović, A.; Marušić, V.; Konjatić, P.; Berić, N. Effect of Carbon Content and Boronizing Parameters on Growth Kinetics of Boride Layers Obtained on Carbon Steels. Materials 2022, 15, 1858. https://doi.org/10.3390/ma15051858
Milinović A, Marušić V, Konjatić P, Berić N. Effect of Carbon Content and Boronizing Parameters on Growth Kinetics of Boride Layers Obtained on Carbon Steels. Materials. 2022; 15(5):1858. https://doi.org/10.3390/ma15051858
Chicago/Turabian StyleMilinović, Andrijana, Vlatko Marušić, Pejo Konjatić, and Nikolina Berić. 2022. "Effect of Carbon Content and Boronizing Parameters on Growth Kinetics of Boride Layers Obtained on Carbon Steels" Materials 15, no. 5: 1858. https://doi.org/10.3390/ma15051858
APA StyleMilinović, A., Marušić, V., Konjatić, P., & Berić, N. (2022). Effect of Carbon Content and Boronizing Parameters on Growth Kinetics of Boride Layers Obtained on Carbon Steels. Materials, 15(5), 1858. https://doi.org/10.3390/ma15051858