Article

Structural and Luminescence Behavior of Nanocrystalline Orthophosphate KMeY(PO4)2: Eu3+ (Me = Ca, Sr) Synthesized by Hydrothermal Method

1
Department of Inorganic Chemistry, Faculty of Production Engineering, Wroclaw University of Economics and Business, Komandorska Street 118/120, 53-345 Wroclaw, Poland
2
Institute of Low Temperature and Structure Research, Polish Academy of Science, Okolna Street 2, 50-422 Wroclaw, Poland
*
Authors to whom correspondence should be addressed.
Materials 2022, 15(5), 1850; https://doi.org/10.3390/ma15051850
Submission received: 28 January 2022 / Revised: 19 February 2022 / Accepted: 25 February 2022 / Published: 1 March 2022
(This article belongs to the Special Issue Structural and Optical Studies of Eu3+ Doped Materials)

Abstract

:
KMeY(PO4)2:5% Eu3+ phosphates have been synthesized by a novel hydrothermal method. Spectroscopic, structural, and morphological properties of the obtained samples were investigated by X-ray, TEM, Raman, infrared, absorption, and luminescence studies. The microscopic analysis of the obtained samples showed that the mean diameter of synthesized crystals was about 15 nm. The KCaY(PO4)2 and KSrY(PO4)2 compounds were isostructural and they crystallized in a rhabdophane-type hexagonal structure with the unit-cell parameters a = b ≈ 6.90 Å, c ≈ 6.34 Å, and a = b ≈ 7.00 Å, c ≈ 6.42 Å for the Ca and Sr compound, respectively. Spectroscopic investigations showed intense 5D07F4 transitions connected with D2 site symmetry of Eu3+ ions. Furthermore, for the sample annealed at 500 °C, europium ions were located in two optical sites, on the surface of grains and in the bulk. Thermal treatment of powders at high temperature provided better grain crystallinity and only one position of dopant in the crystalline structure. The most intense emission was possessed by the KSrY(PO4)2:5% Eu3+ sample calcinated at 500 °C.

1. Introduction

In recent times, inorganic phosphors doped with lanthanide ions have attracted much attention due to their potential applications as phosphors, laser materials, or solid-state lighting [1,2,3,4,5,6]. The current white-light-emitting diodes (W-LEDs) suffer from a lack of red light, therefore, red phosphors are sought to fill deficiency. Generally, W-LEDs are fabricated by combining the yellow emission of YAG: Ce3+ with the blue light of the diode [7]. The second method is to mix the blue, green, and red emissions generated from three or two blended powders. Rare-earth-doped (RE) phosphates are a good candidate for the formation of white LEDs due to their good physical and chemical stability, low cost of substrates, and reduced preparation temperatures compared to silicates, aluminosilicates, or nitrates [8,9,10,11,12,13].
One of the most promising phosphors are KMeRE(PO4)2 phosphates, where Me = Ca or Sr, and have a hexagonal structure with the unit cell parameters a = b ≈ 7.0 and c ≈ 6.4 Å [14,15,16,17,18]. The structure is closely related to rhabdophane (REPO4·nH2O), in which half of the cationic sites of RE3+ are filled by Me2+ (Figure 1). Simultaneously, the electrostatic charge is compensated by the placement of K+ in free spaces inside of channels running parallel to the c axis and formed by (RE, Ca)-PO4-(RE, Ca) chains [14]. According to the available literature, the simultaneous replacement of RE3+ with K+ and Ca2+ reduces the group symmetry of PO4 and RO8 (R = Ca or RE) from D2 to C2 [17].
The KMeRE(PO4)2 phosphates show good luminescence and hence can be applied as efficient luminophores [19,20]. Recently, a series of KMeRE(PO4)2 (Me = Ca, Sr; RE = Y, La, Lu, Gd) have been investigated carefully [4,21,22,23,24]. Wang et al. successfully synthesized KCaY(PO4)2:Dy3+, Eu3+ as a nanosized phosphor-generated warm-white light with a high color rendering index (CRI) [23]. Basic information about KCaY(PO4)2:Eu3+ has been reported in 2006 by Wang et al. [24]. Furthermore, the energy transfer from Eu2+ to Mn2+ in KCaY(PO4)2 was studied by Liu and co-workers [4]. Up until now, strontium ternary phosphates were activated by RE ions, such as Ce3+, Tb3+, Eu3+, and Mn2+ [21,22]. Samples doped with Ce3+, Tb3+, and Mn2+ exhibited high quantum efficiency (60%) and were obtained by a Pechini method [22]. Compounds are mostly obtained via a conventional ceramic method (sintering at high temperatures), however, results presented in [25,26,27] show that obtaining single-phase KMeRE(PO4)2 is difficult because of the limited thermal stability of such ternary phosphates at temperatures exceeding 1100–1200 °C. A relatively mild hydrothermal process (short-term heating carried out at 240 °C) has been applied for the synthesis of phase-pure KCaCe(PO4)2, which resulted in obtaining nanocrystalline powders [27].
The aim of the presented study was to describe the structural and luminescence properties of nanocrystalline KMeY(PO4)2 (Me = Ca, Sr) powders doped with Eu3+ and to discuss the obtained results from the point of view of the powders’ morphology.

2. Materials and Methods

The powders of KMeY(PO4)2:5% Eu3+ (Me = Ca or Sr) were obtained by a short-lasting hydrothermal technique. In the first step, Y2O3 (99.99% POCh, Gliwice, Poland) and Eu2O3 (99.9%, POCh, Gliwice, Poland) were digested in dilute nitric acid. The obtained clear solutions were dried for several days over solid NaOH until solid nitrates crystallized. The starting sols for hydrothermal processes were prepared as follows. Rare earth nitrates and Ca(NO3)2·4H2O (≥99.0%, POCh, Gliwice, Poland) or Sr(NO3)2 (≥99.0%, Sigma-Aldrich, Steinheim, Germany) were dissolved in 10 cm3 of distilled water, then K3PO4·H2O (≥94%, Fluka, Steinheim, Germany) was added to the solution, and the obtained mixture was diluted to 50 cm3 volume. The molar ratio of K:Me:Y:Eu metals in the obtained sols was 68:1:0.95:0.05. After one-day ageing, the sols were used in a hydrothermal process performed in a Magnum II autoclave (Ertec, Wrocław, Poland) with heating of the sols by microwaves of 600 W maximal power. The syntheses were controlled by temperature measurements performed at a bottom part of the reactor made of PTFE. The syntheses were carried out for 2 h at a maximal temperature of 250 °C and a pressure of 30 bar. As they were obtained, fine precipitates were centrifuged, washed several times with distilled water, and dried for 24 h at 120 °C. Further heating of the samples was carried out at 500 °C and 1000 °C for 10 h.
Phase analysis of obtained powders was performed using the XRD technique and a Siemens D5000 diffractometer (Munich, Germany) equipped with a copper radiation cathode. The measurements were performed at a 2θ angle range of 5–60° with a 0.02° step and at least 4 s per step. The indexing of powder patterns was made using the computer program DICVOL [28]. Unit cell lattice constants of KMeY(PO4)2:5%Eu were refined using the Checkcell software (LMGP, Grenoble, France) [29].
Simultaneous TGA/DSC measurements were carried out using a SETSYSTM (TG-DSC 1500; Setaram, Geneva, Switzerland) in the temperature range of 20–1200 °C (sample mass 40 mg, platinum crucibles, heating rate 10 °C min−1, argon atmosphere).
Excitation spectra were measured on a McPherson spectrometer (McPherson Inc. Chelmsford, MA, USA) equipped with a 150 W Xe lamp and 150 W deuterium lamp (for VUV part) as excitation sources, and a Hamamatsu R928 photomultiplier (Hamamatsu Photonics, Hamamatsu, Japan) as a detector. The normalization of the XRD and excitation spectra was performed at the highest point of the spectrum. The emission spectra were measured using a Hamamatsu PMA12 multichannel analyzer (Hamamatsu Photonics, Hamamatsu, Japan) as a detector, and 395 nm line from tunable pulsed Ti: Sapphire laser pumped by second harmonic (λ = 532 nm) of Nd: YAG laser as an excitation source (Lotis TII, Minsk, Belarus). Decay time measurements were performed using the same excitation as for emission spectra, while decay curves were collected on a Tektronix MSO-3052 digital oscilloscope (Tektronix, Beaverton, OR, USA). The low temperature measurement was carried out at 77 K using a quartz dewar.

3. Results and Discussion

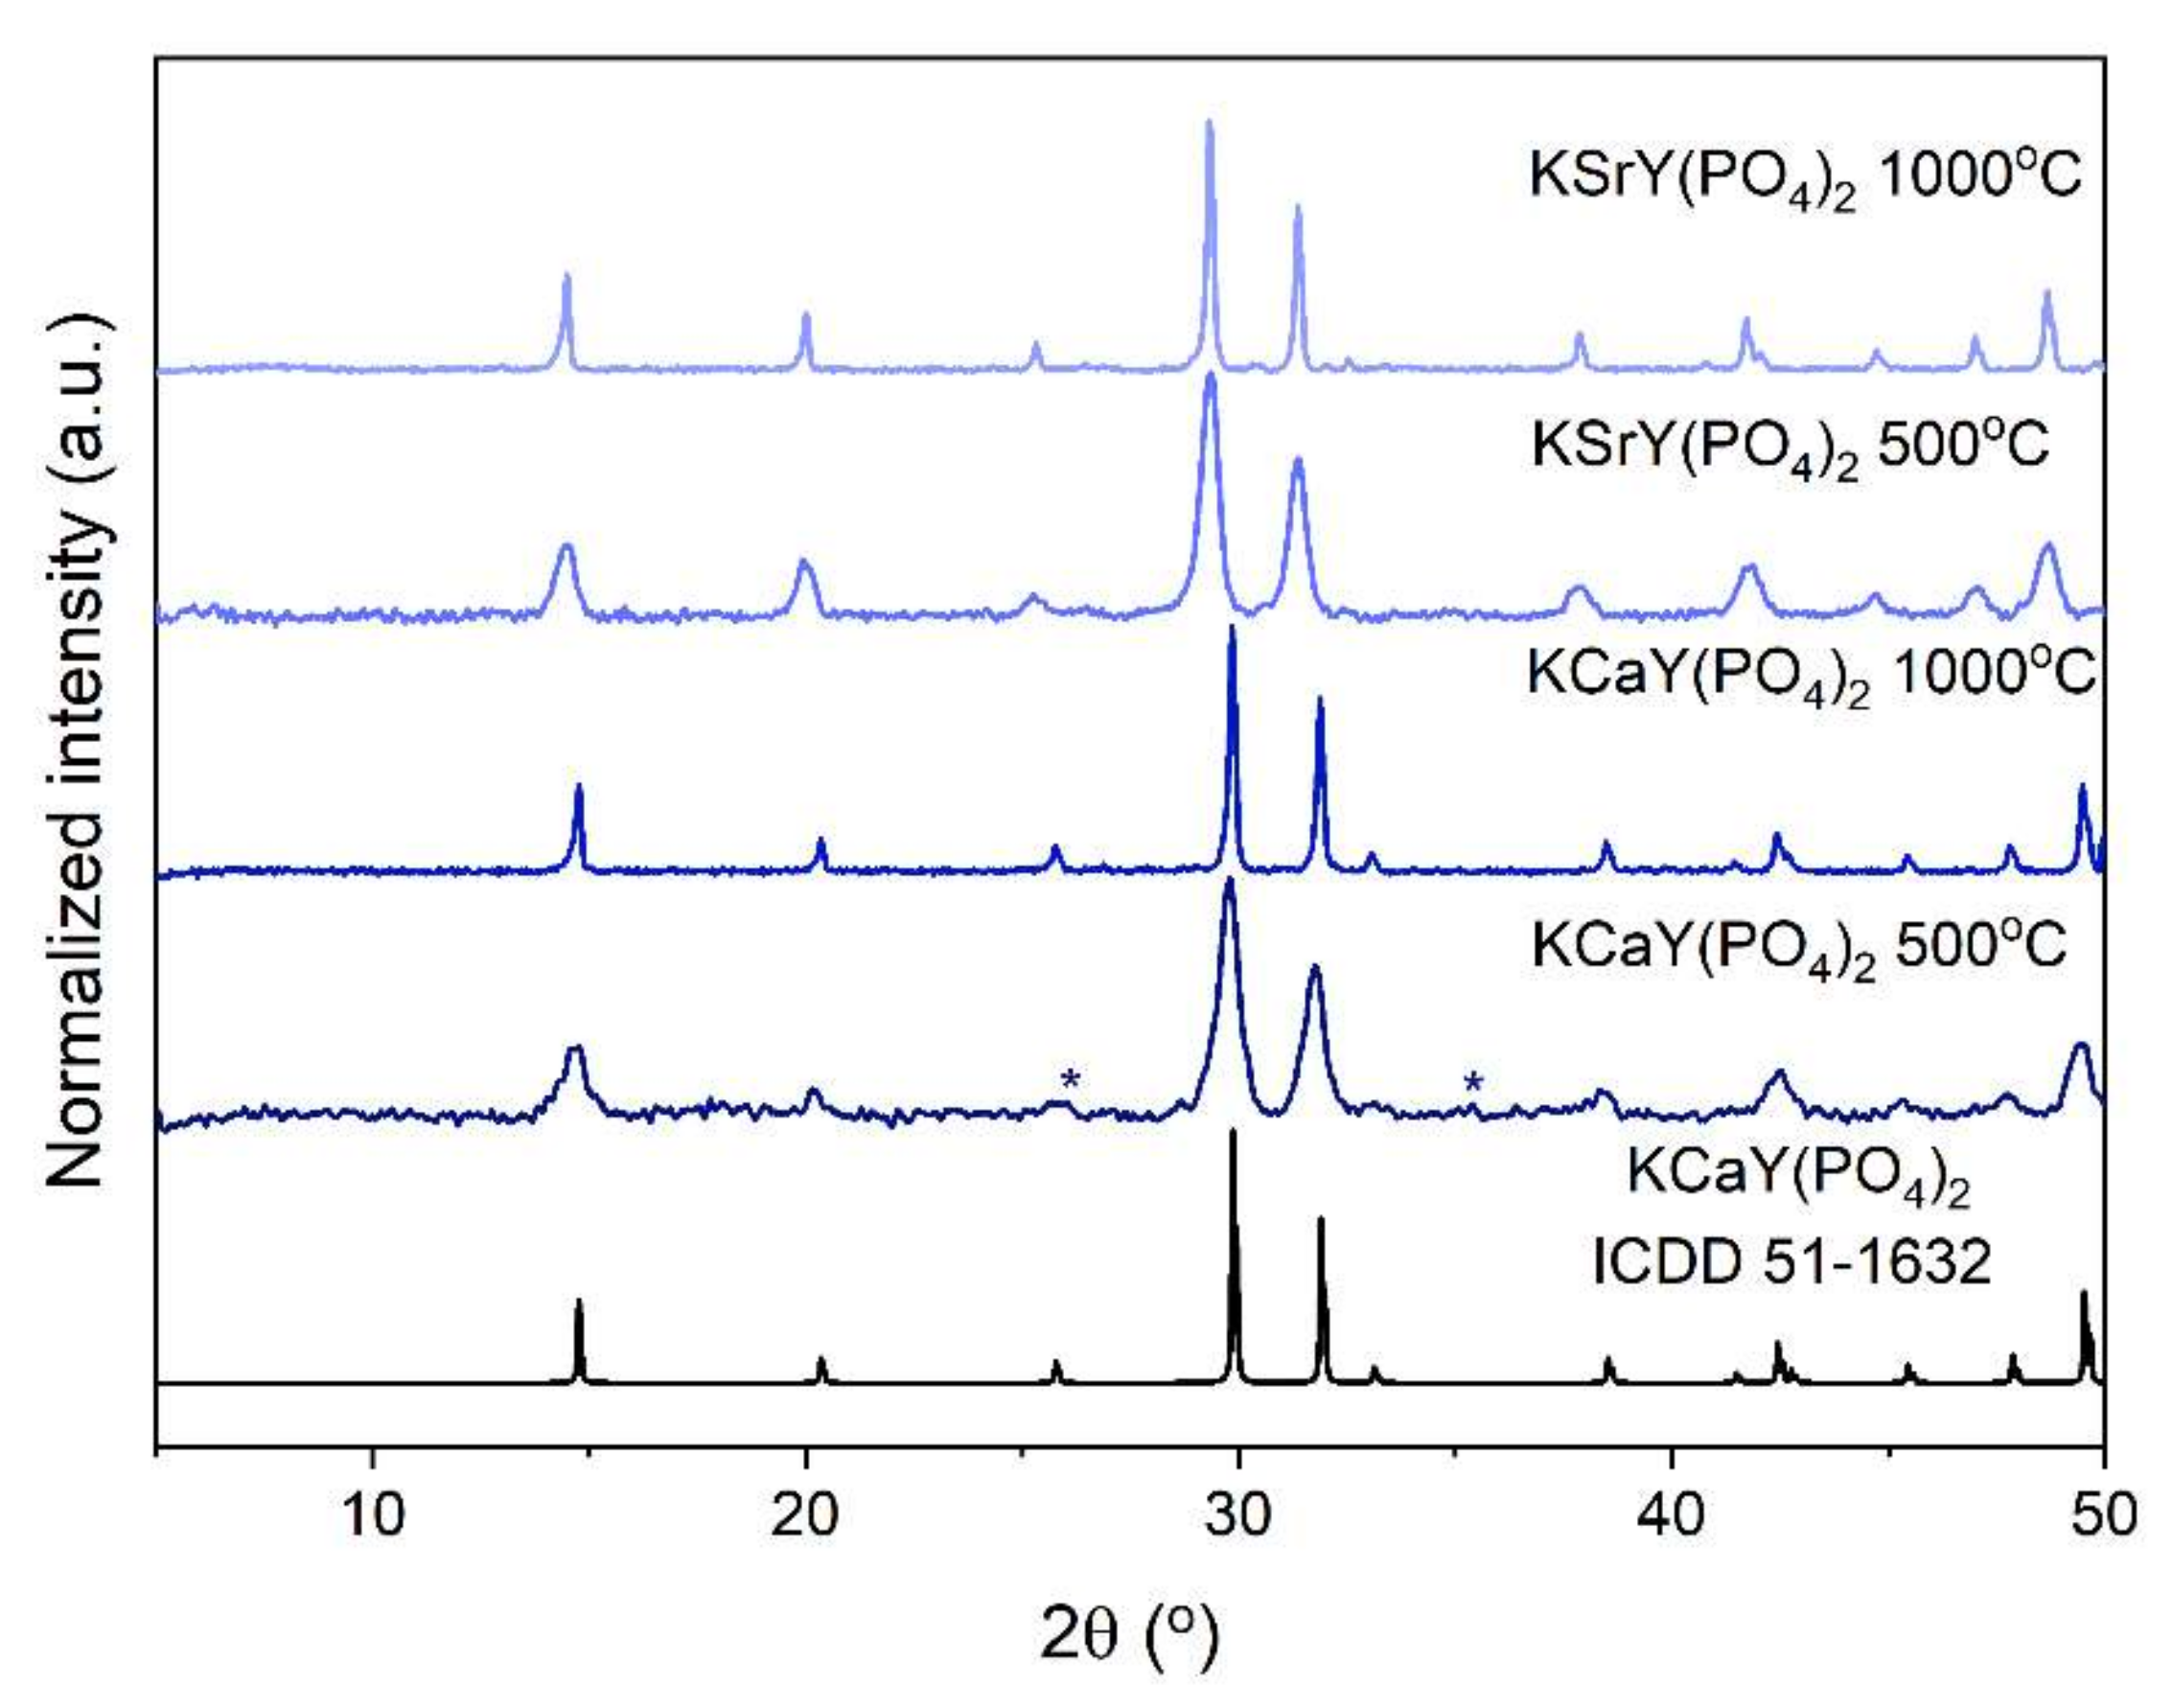
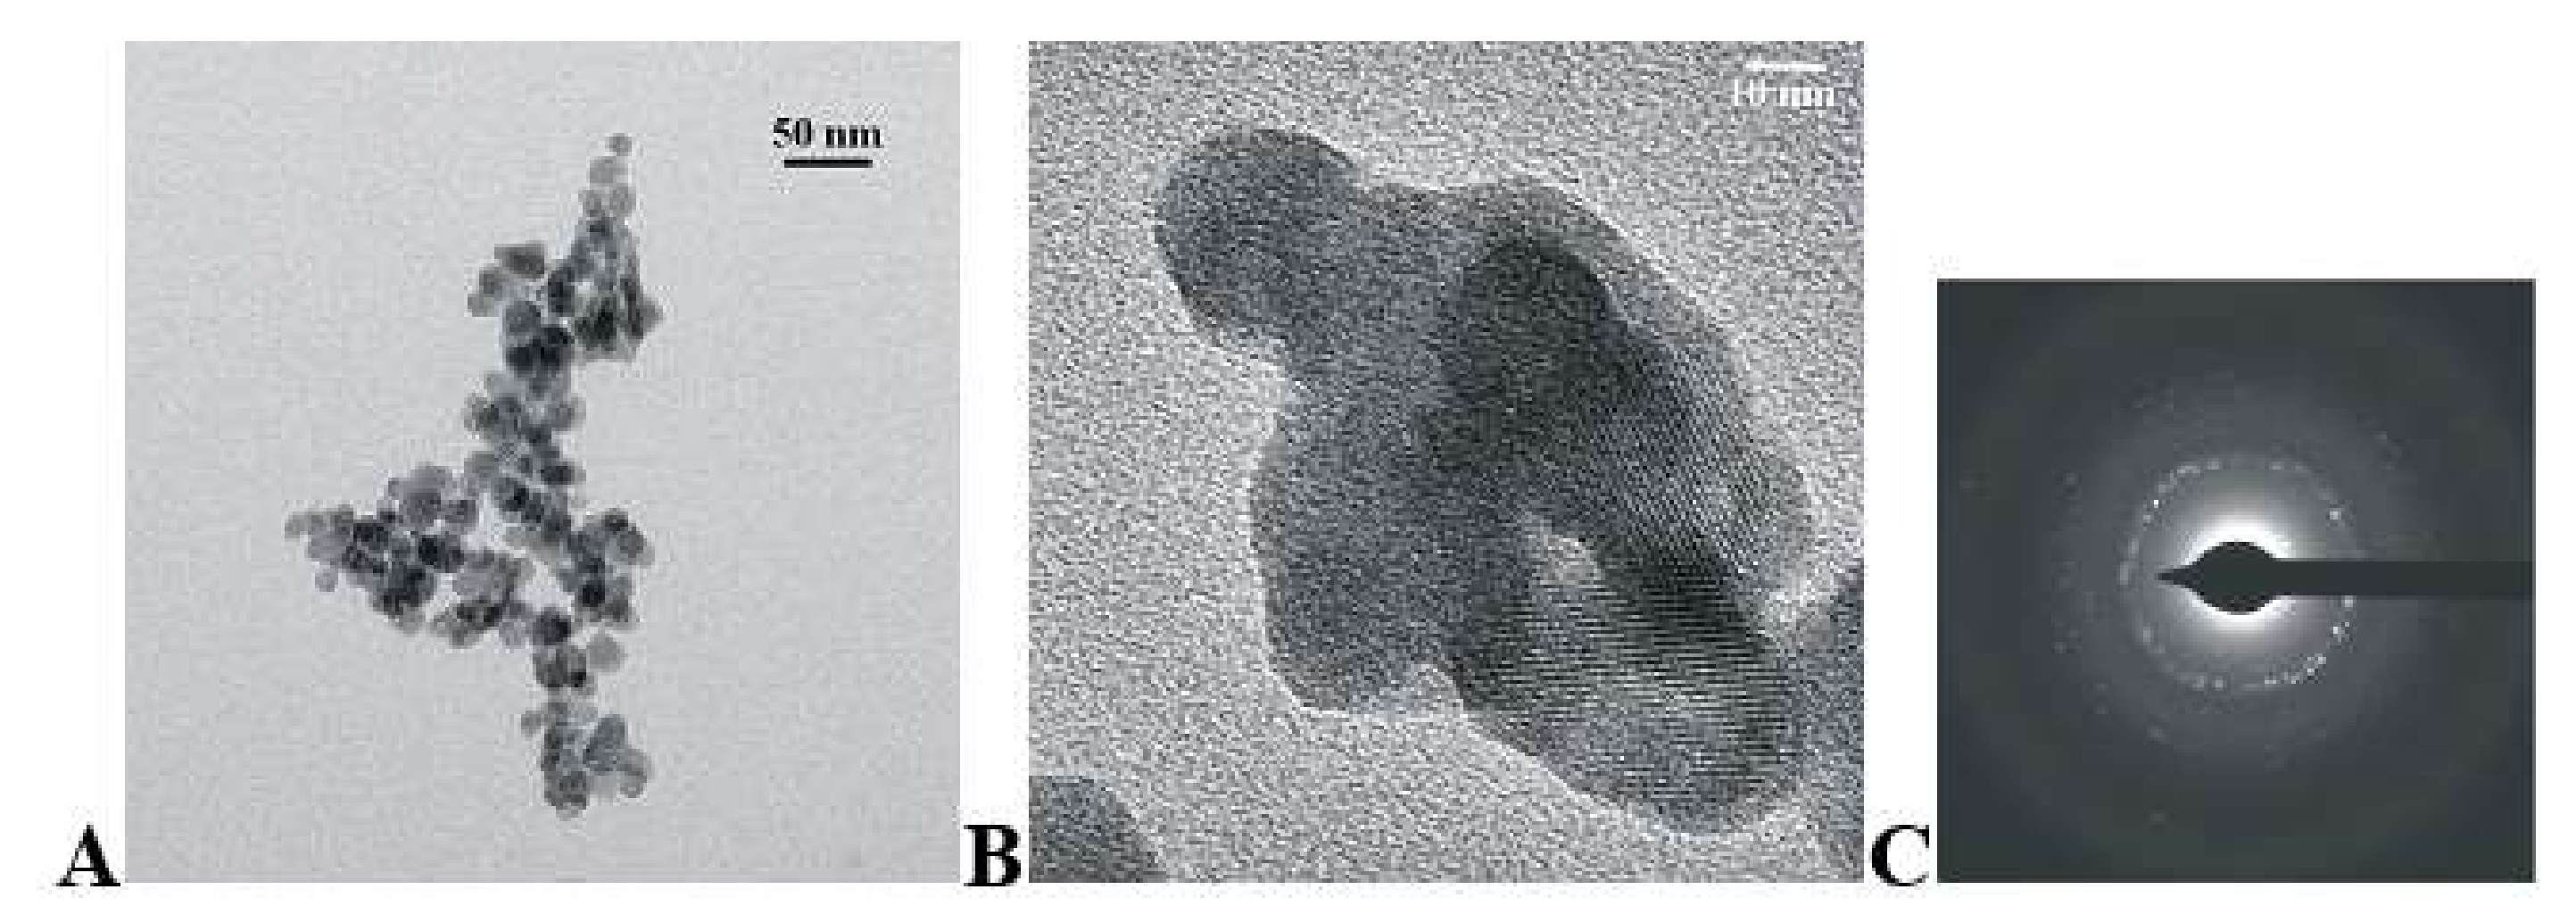
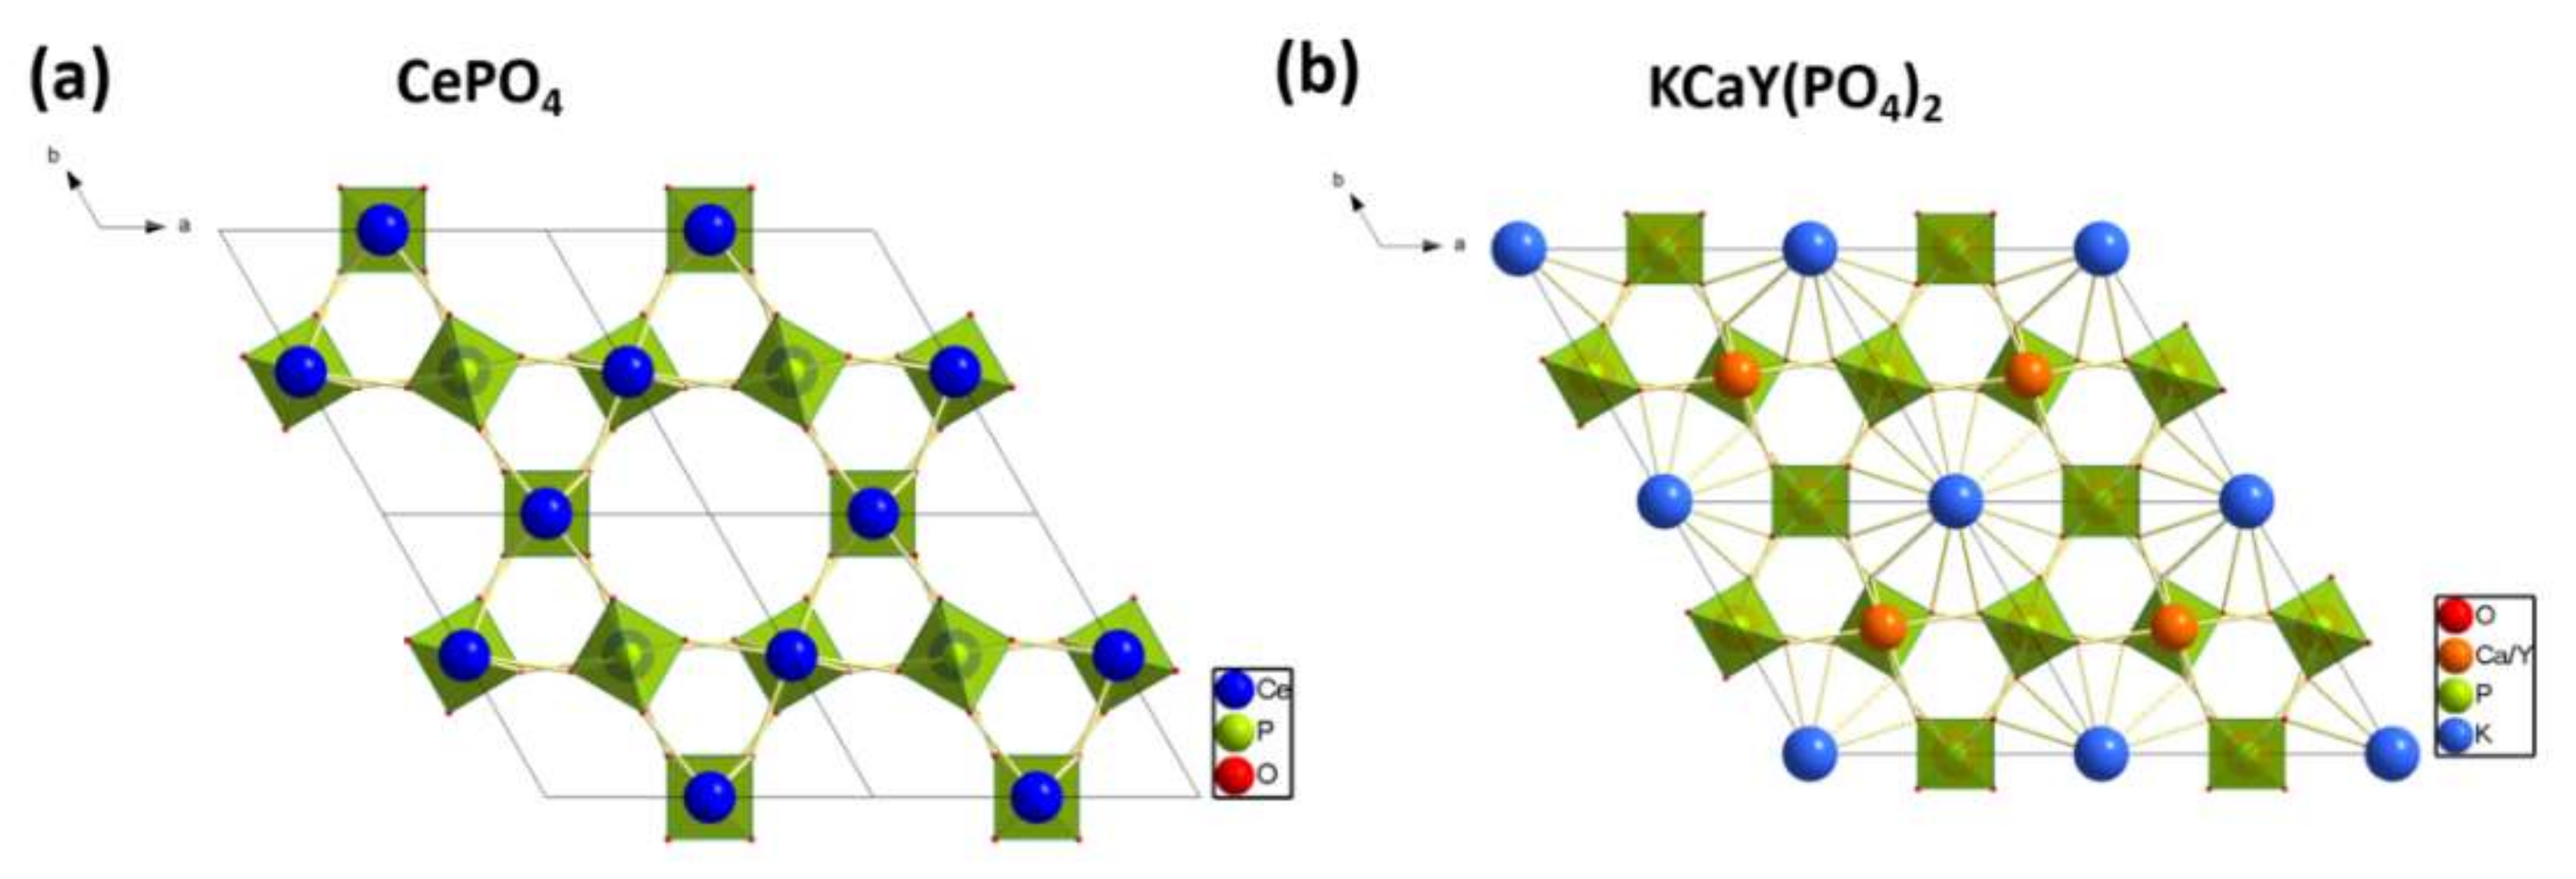
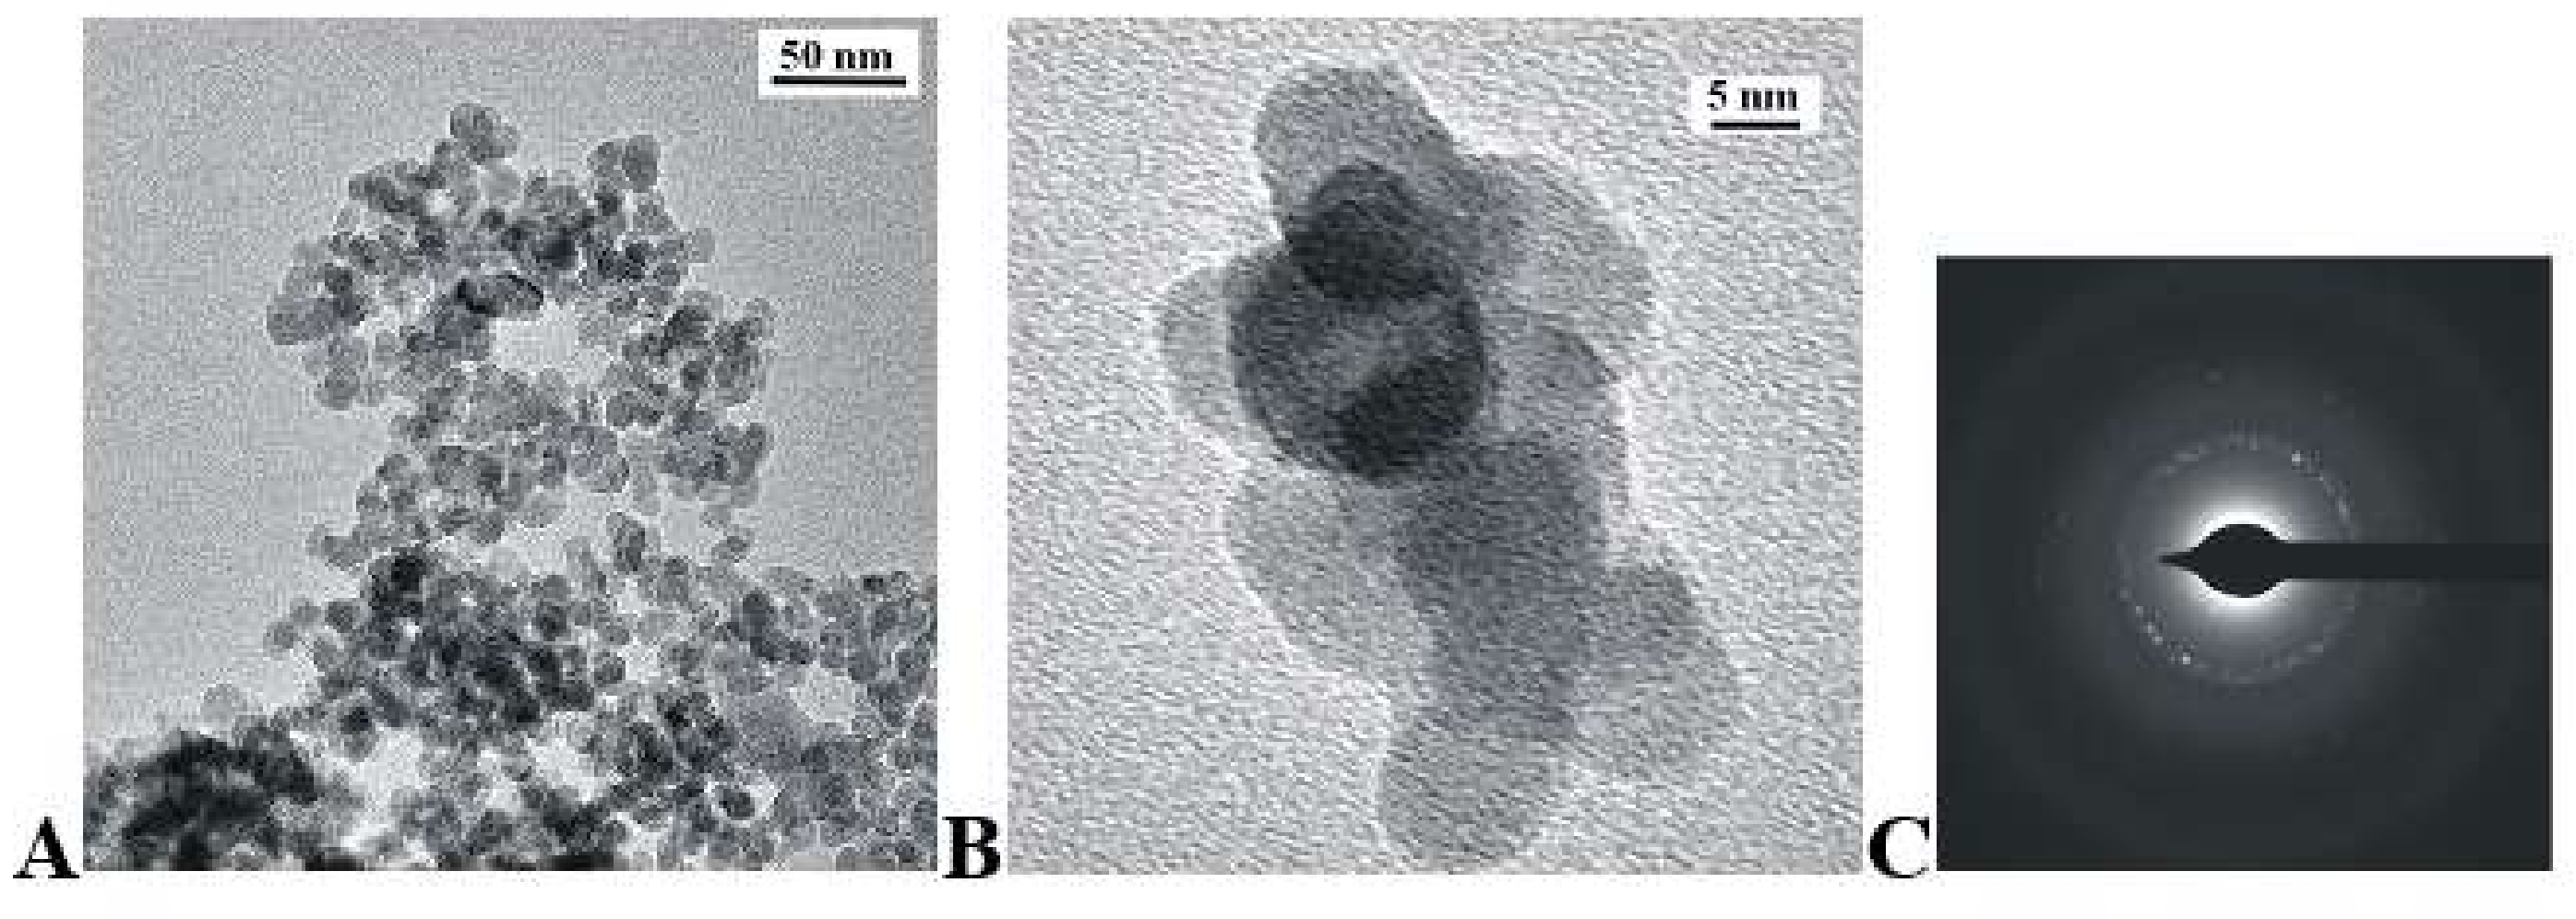
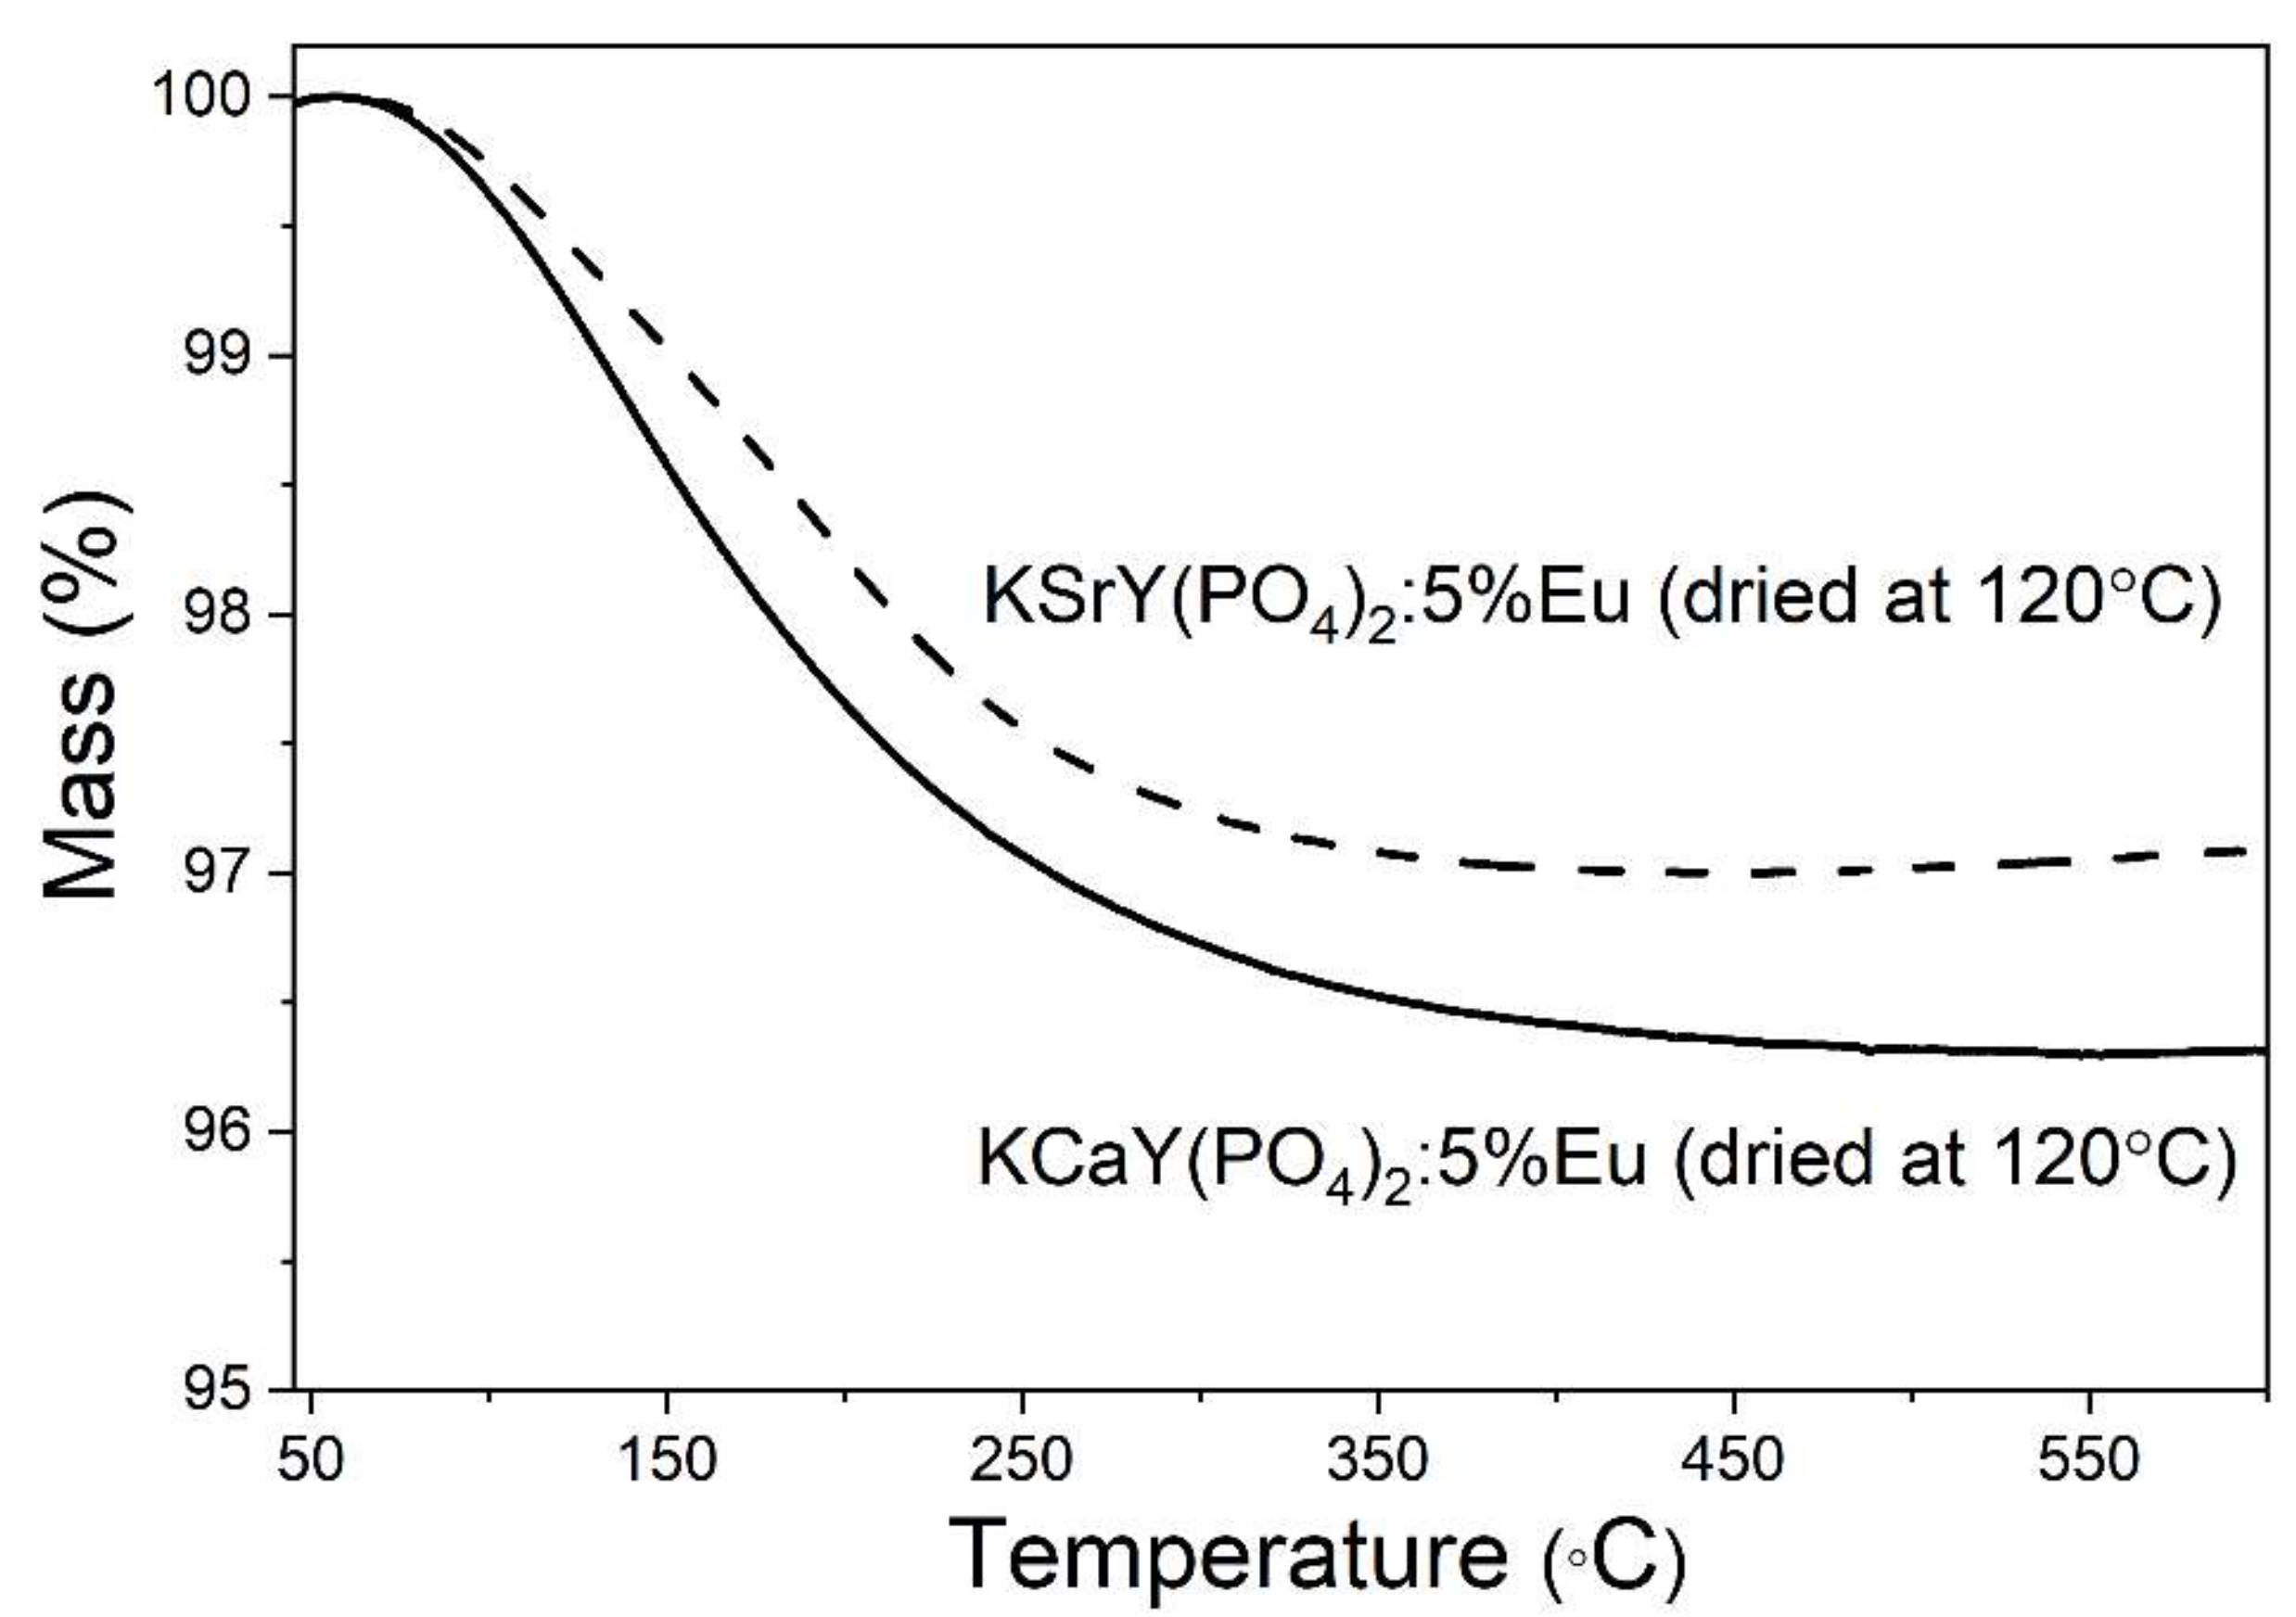
3.1. Structure and Morphology

The analysis of XRD patterns of obtained phosphates confirmed the crystalline characteristics of the powders. All of the samples were isostructural to the rhabdophane-type KCaY(PO4)2 phosphate (ICDD card No. 51-1632) (Figure 2). The XRD pattern of dried samples showed pure structures after the hydrothermal process (Figure S1). Due to the presence of hydroxyl groups originating from zeolitic water molecules, which can easily quench luminescence, samples were annealed at 500 °C and 1000 °C. The annealing process does not change the structure of prepared phosphates. Minor reflections of a secondary phase were registered in the XRD pattern of KCaY(PO4)2:5%Eu3+ sintered at 500 °C. They most likely derive from the YPO4 xenotime phase; however, due to the low intensity of reflections, the presence of the phase can be not confirmed with reliability. The refined hexagonal unit cell parameters of the phosphates sintered at 1000 °C are listed in Table 1.
Figure 3 and Figure 4 present the TEM and SEAD representative images of KCaY(PO4)2:5% Eu3+ and KSrY(PO4)2:5% Eu3+ samples, respectively. As can be seen, the obtained compounds possess rounded grains with an average particle length size (maximum particle dimension) D[1, 0] equal to 12 ± 2 nm and 18 ± 4 nm for Ca and Sr phosphates, respectively. The powders consist of single grains, as well as bigger objects created by the clumping of a few grains. Agglomerates have an irregular shape made from connected spherical single nanocrystals. The replacement of calcium ions by the strontium one does not change the shape of obtained nanopowders.
The analysis of TGA heating curves of samples obtained hydrothermally showed a 3–4% mass loss of powders in the temperature range of 100–350 °C (Figure 5). Mass loss is characteristic of hydrated samples. A relatively high temperature of the effect suggests the presence of zeolitic-bound water. No other thermal effects were observed on TGA/DSC heating curves.

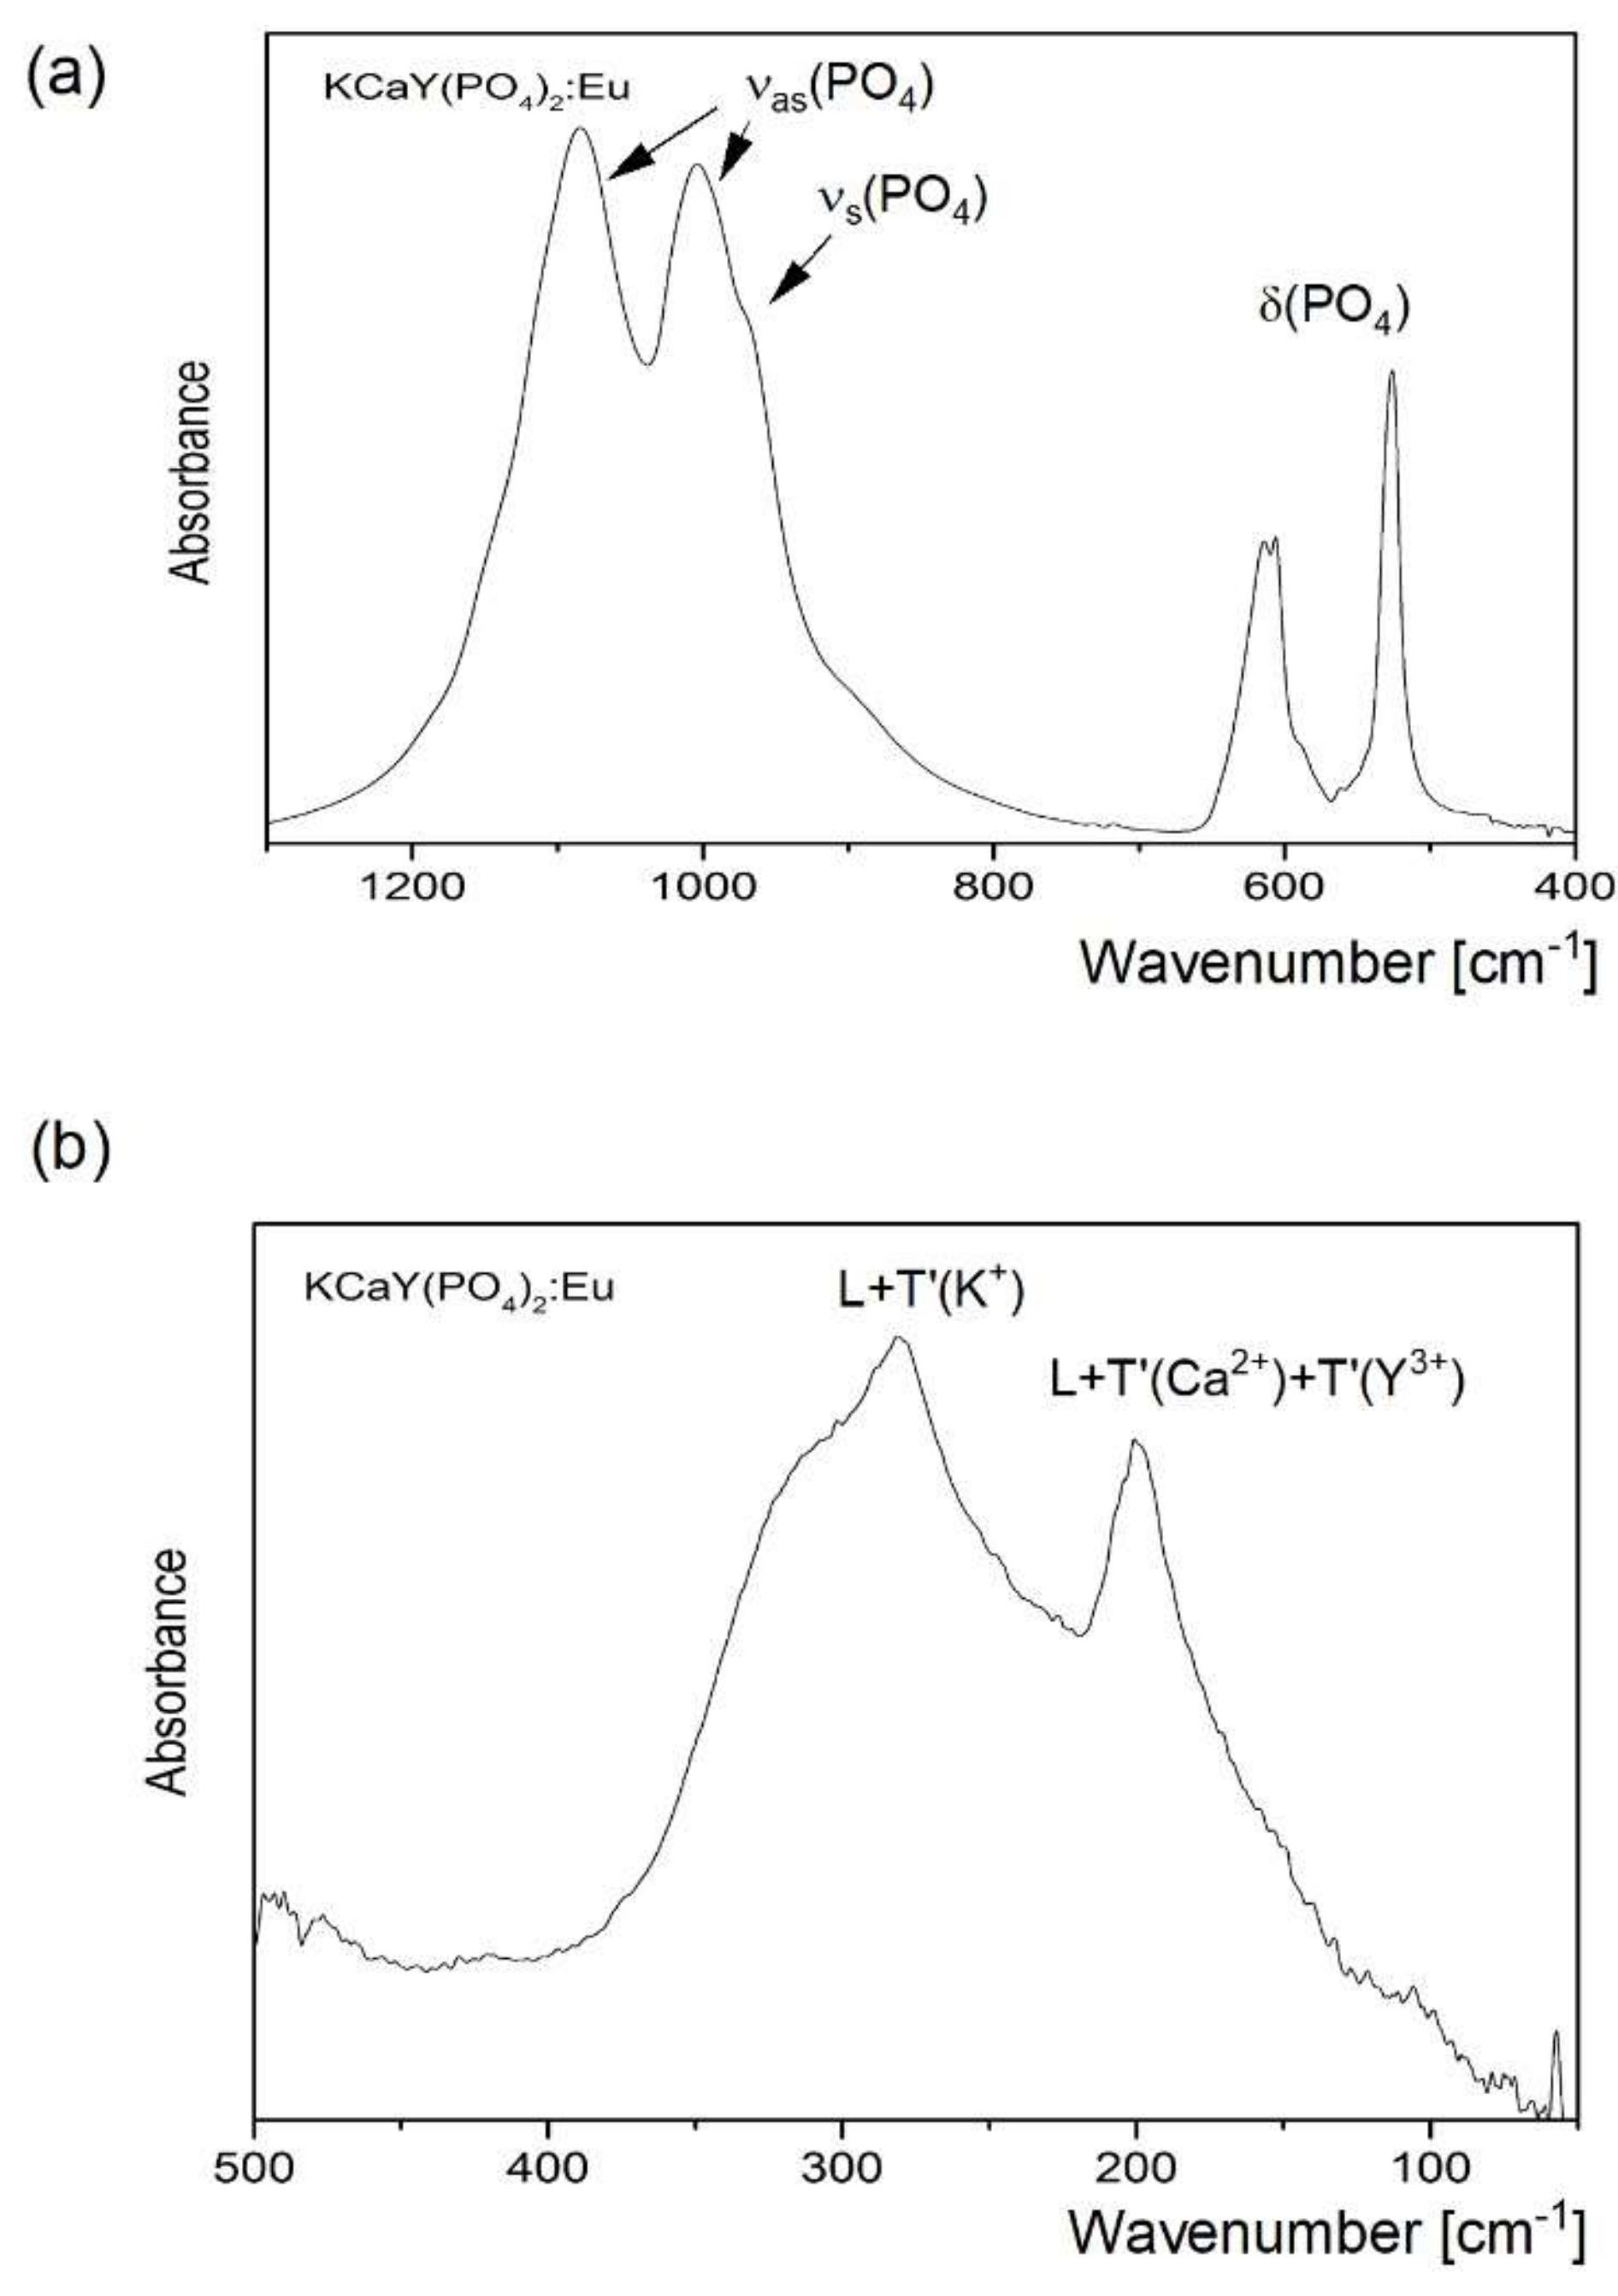
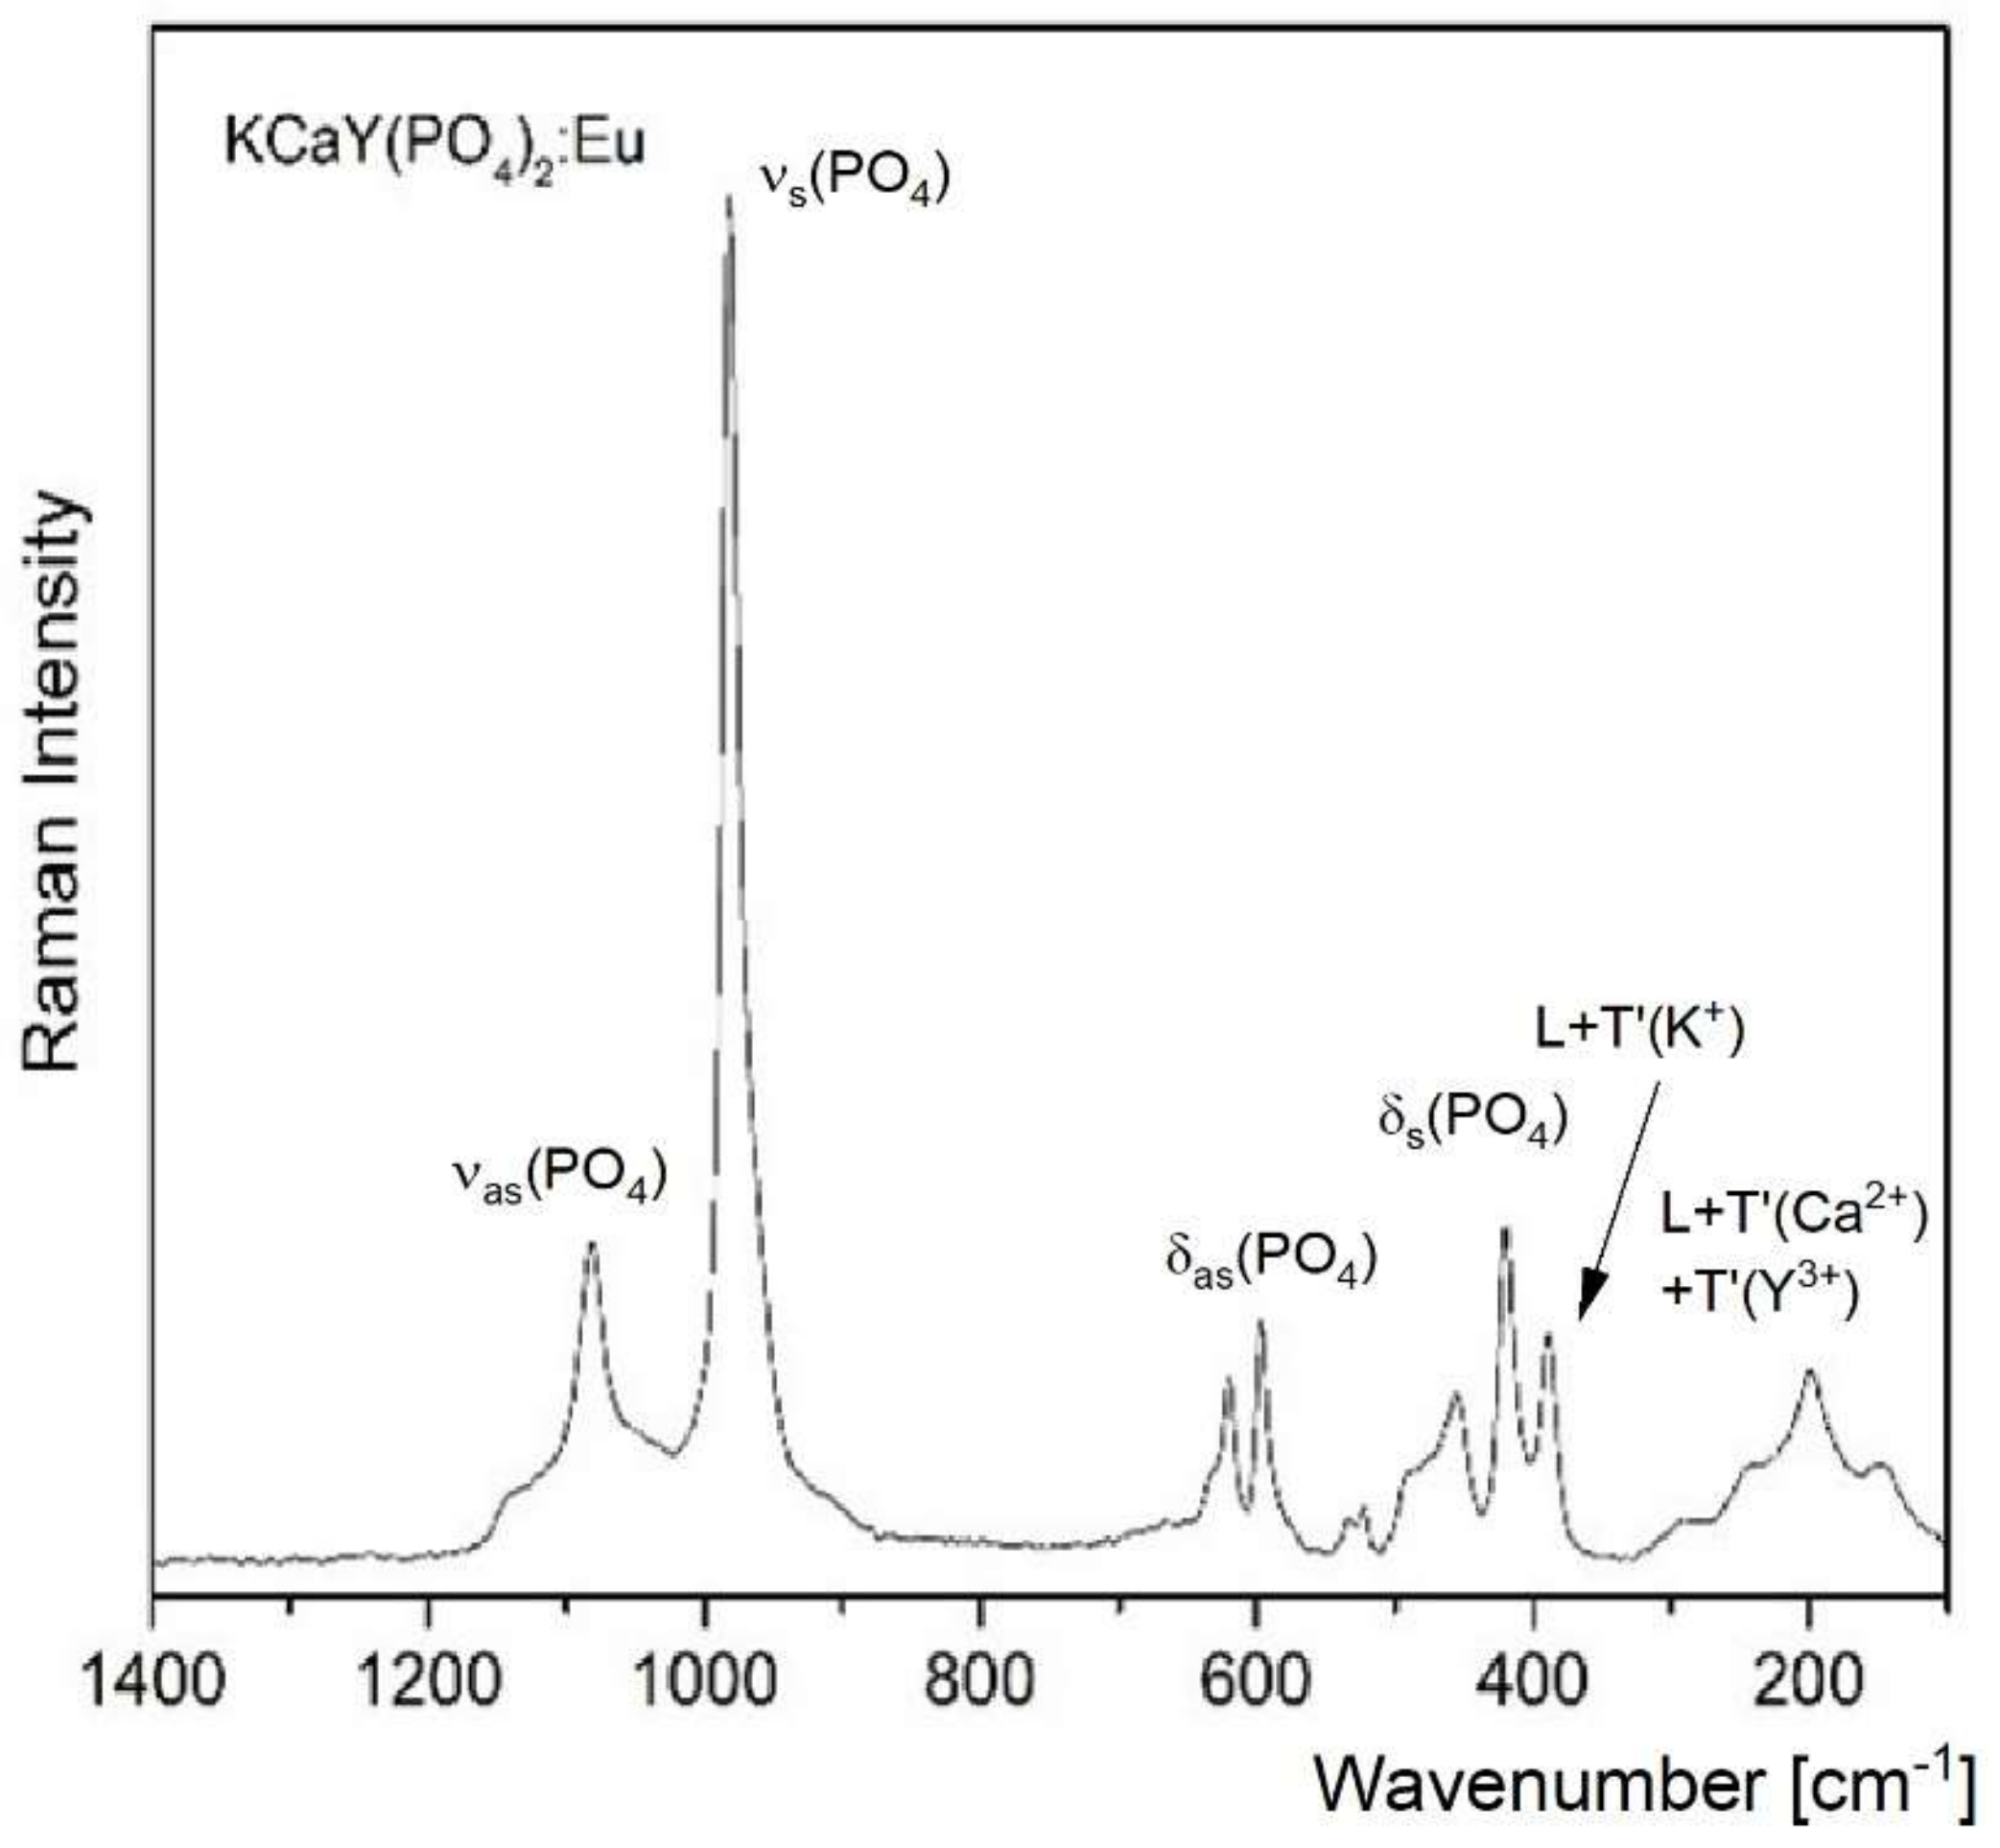
3.2. Raman and IR Studies

Figure 6a,b present infrared spectra in the middle (MIR) and far (FIR) infrared range, and Figure 7 shows the Raman spectra. The spectra measured for the strontium derivative are identical, so we decided to only show spectra for the calcium compound as the representative. They were also similar to those reported earlier by Tie et al. [17]. In general, the bands observed in these spectra agree with those reported earlier for other orthophosphates [30,31,32,33]. The particular types of vibrations appear in the typical range. The ν3(F2) = νas(PO4) vibrations were observed at 1130 and 1090 cm−1, where a strong multiplet consisting of 2–3 bands appeared. In the range characteristic for ν1(A1) = νs(PO4) vibrations, a strong single Raman band was observed. All bending δ(PO4) vibrations were observed in the range of 350–650 cm−1, in which nine Raman and five IR bands could be identified. The IR bands of average to strong intensities in the ranges of 250–350 cm−1 and 150–250 cm−1 correspond to the T’(K+) and T’(Ca2+) translations, respectively. The analysis of these vibrations was performed in Reference 4 on the basis of the D2 site symmetry of this unit, although factor group splitting was not taken into account.
According to the above-cited references [14,15,16,17,18], KMeY(PO4)2 phosphates (Me = Ca, Sr) crystallize in the hexagonal P6222 (D64) structure with Z = 3. Since the occupation of Ca2+, Nd3+, and K+ cations was equal to 0.5, a proper chemical formula can be written as (Ca1.5Y1.5)K1.5(PO4)3 with Z = 1 [14].
Its primitive unit cell contains three Ca2+/Y3+ ions equally sharing the 3c (D2 site) position, and three PO43− ions with P and O atoms in the 3d (D2) and 12k (C1) positions, respectively. The K+ ions could not be used for calculations because their occupancy in the primitive cell was partial. For this reason, only a partial factor group analysis can be presented.
The three PO43− ions and the Ca2+/Y3+ ions in the primitive cell give rise to 54 zone–center degrees of freedom described by the irreducible representation: Γv = 3A1 + 5A2 + 5B1 + 5B2 + 10E1 + 8E2 (54). Three of them, ΓT = A2 + E1 (3), describe the acoustic phonons, and the remainder, ΓO = 3A1 + 4A2 + 5B1 + 5B2 + 9E1 + 8E2 (51), correspond to the optical modes. The optical modes can be further subdivided by the vibrations of the respective components of the primitive cell, i.e., translations of Ca2+/Y3+ ions: ΓT(Ca2+/Y3+) = B1 + B2 + E1 + E2 (6), internal vibrations of PO43− ions: Γv(PO4) = 3A1 + 2A2 + 2B1 + 2B2 + 4E1 + 5E2 (27), as well as translations and librations of the PO43− ions, ΓT/L(PO4) = A2 + B1 + B2 + 2E1 + E2 (6).
In the discussion of the IR and Raman spectra, the correlation between the molecular Td, site D2, and factor D6 symmetry should be used. The following schemes related to the correlation Td → D2 → D6: for the ν1 mode A1 → A → A1 + E2; for the ν2 mode E → 2A → 2A1 + 2E2; and for the ν3 and ν4 modes F2 → B1 + B2 + B3 → A2 + B1 + B2 + 2E1 + E2. Since the A2 and E1 modes were IR-active, A1, E1, and E2 were Raman-active, and B1 and B2 were silent for P6222 symmetry, at least 13 (4A2 + 9E1) IR bands were expected in this spectrum, and similarly, 20 (3A1 + 9E1 + 8E2) bands should be observed in the Raman spectrum. These data fit well to the number of bands observed in the IR and Raman spectra, i.e., 14 and 20, respectively (Figure 6 and Figure 7).

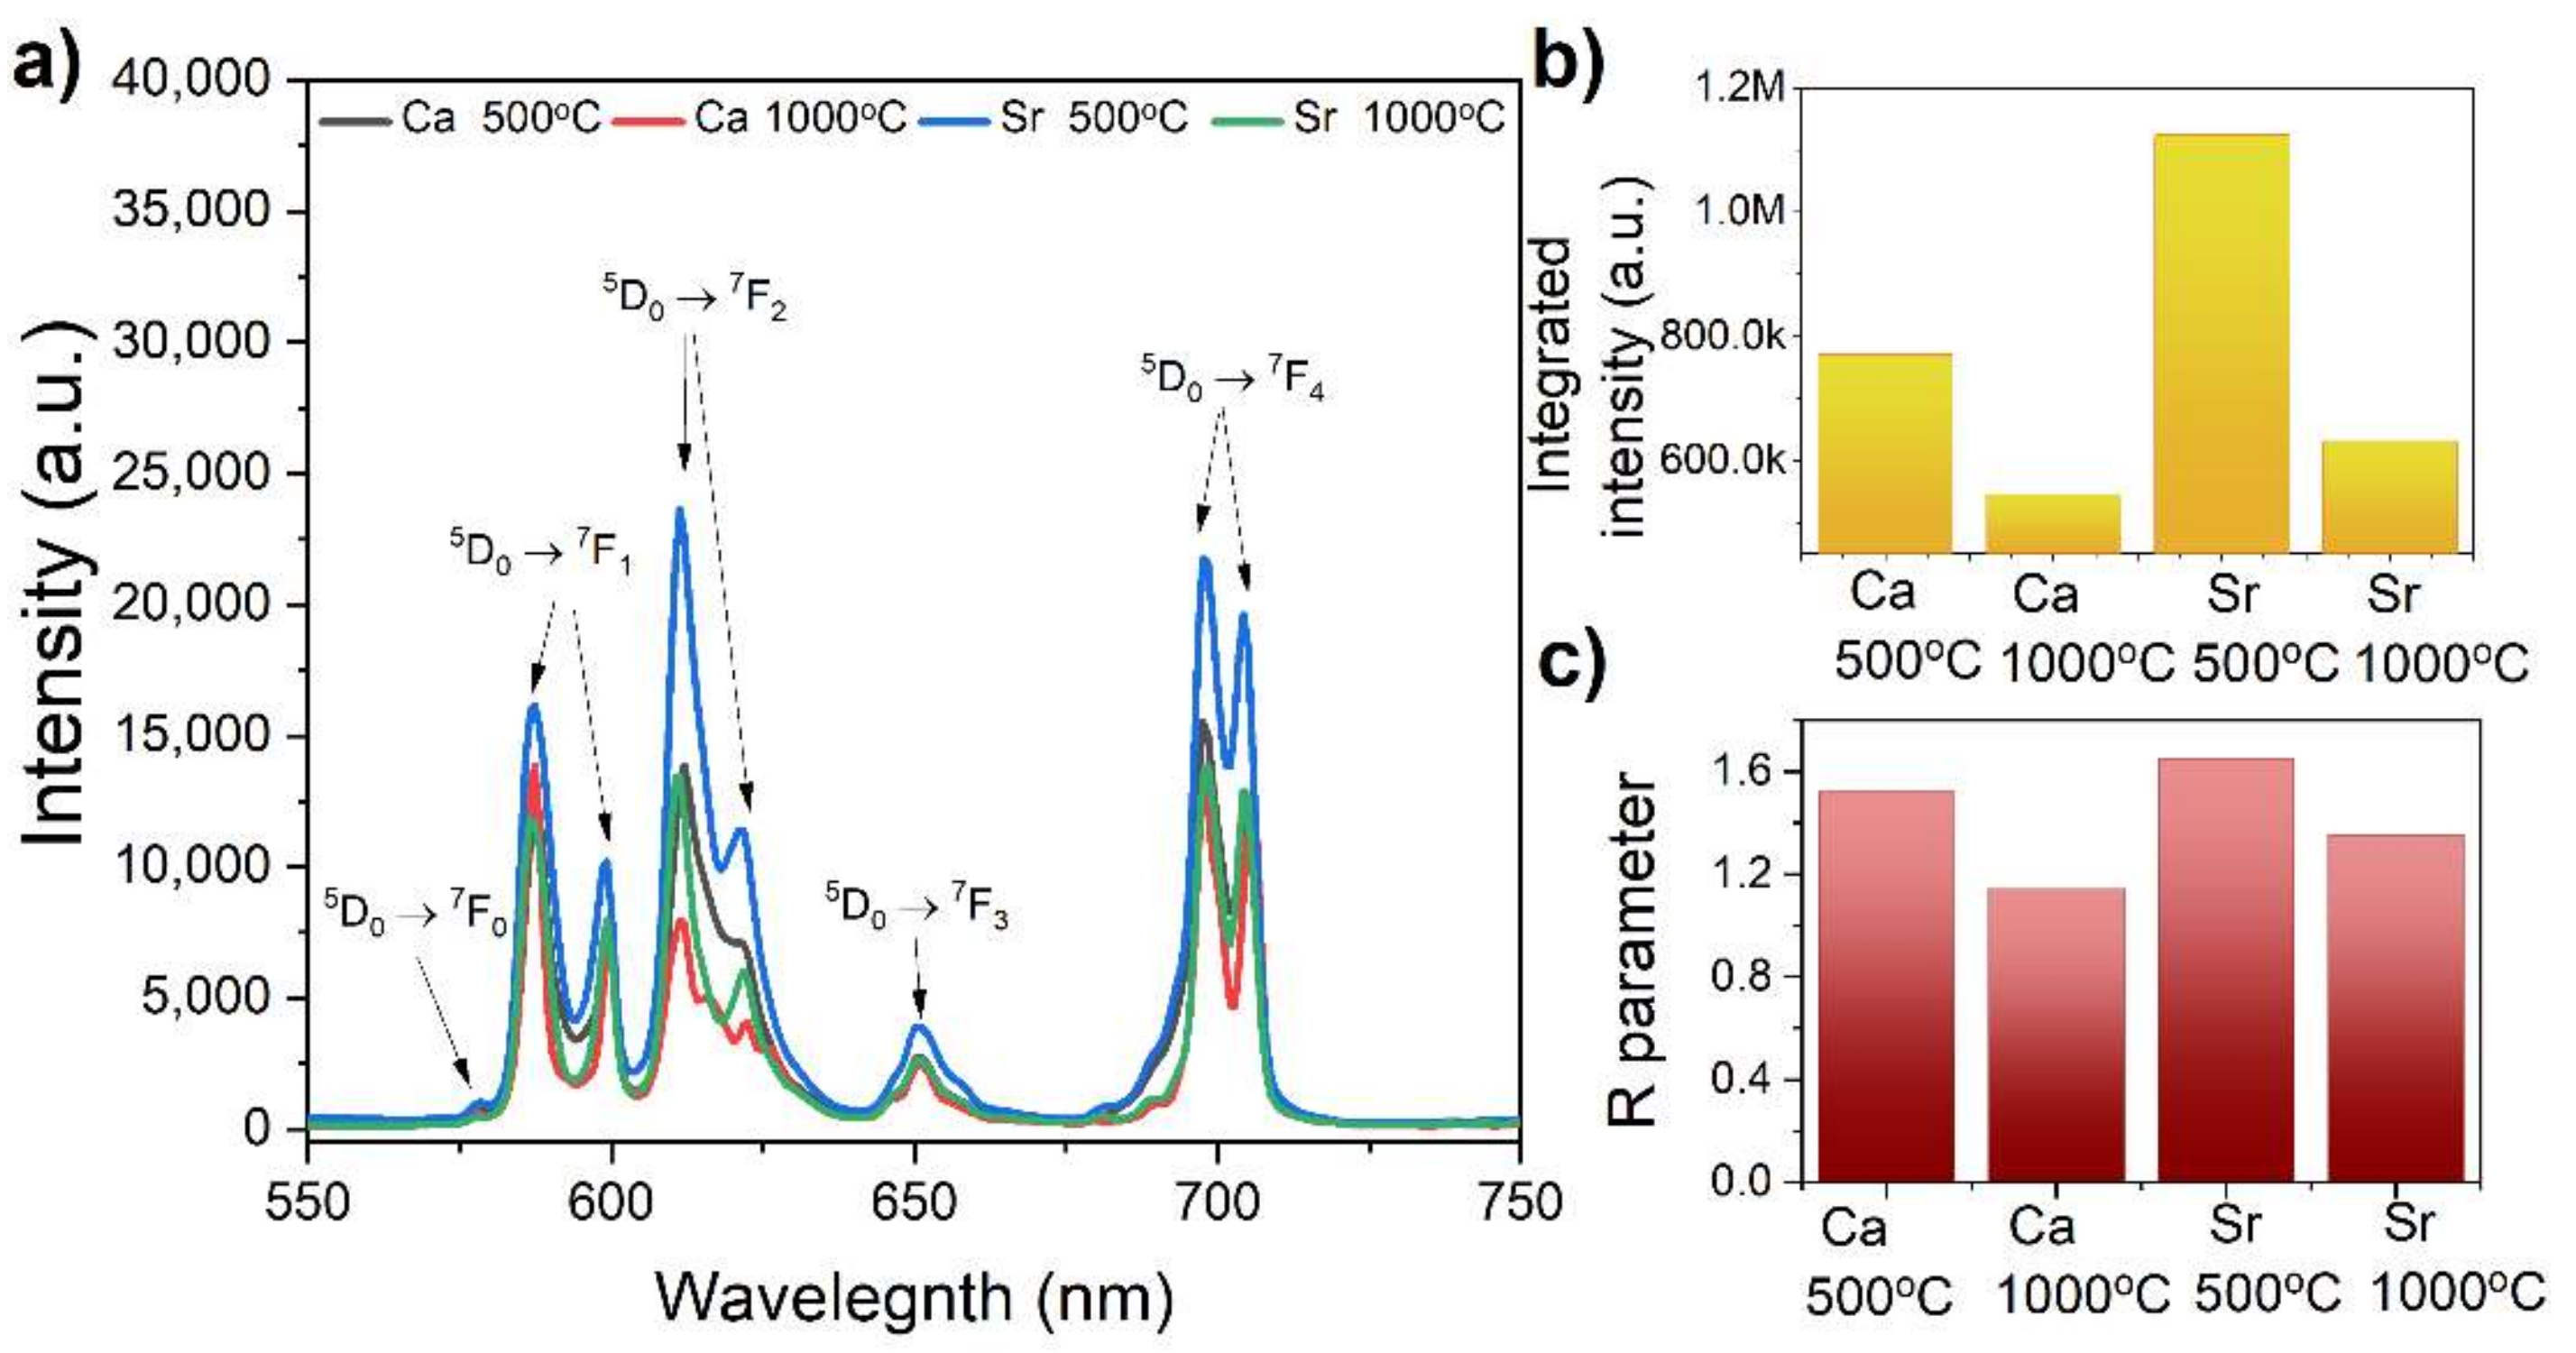
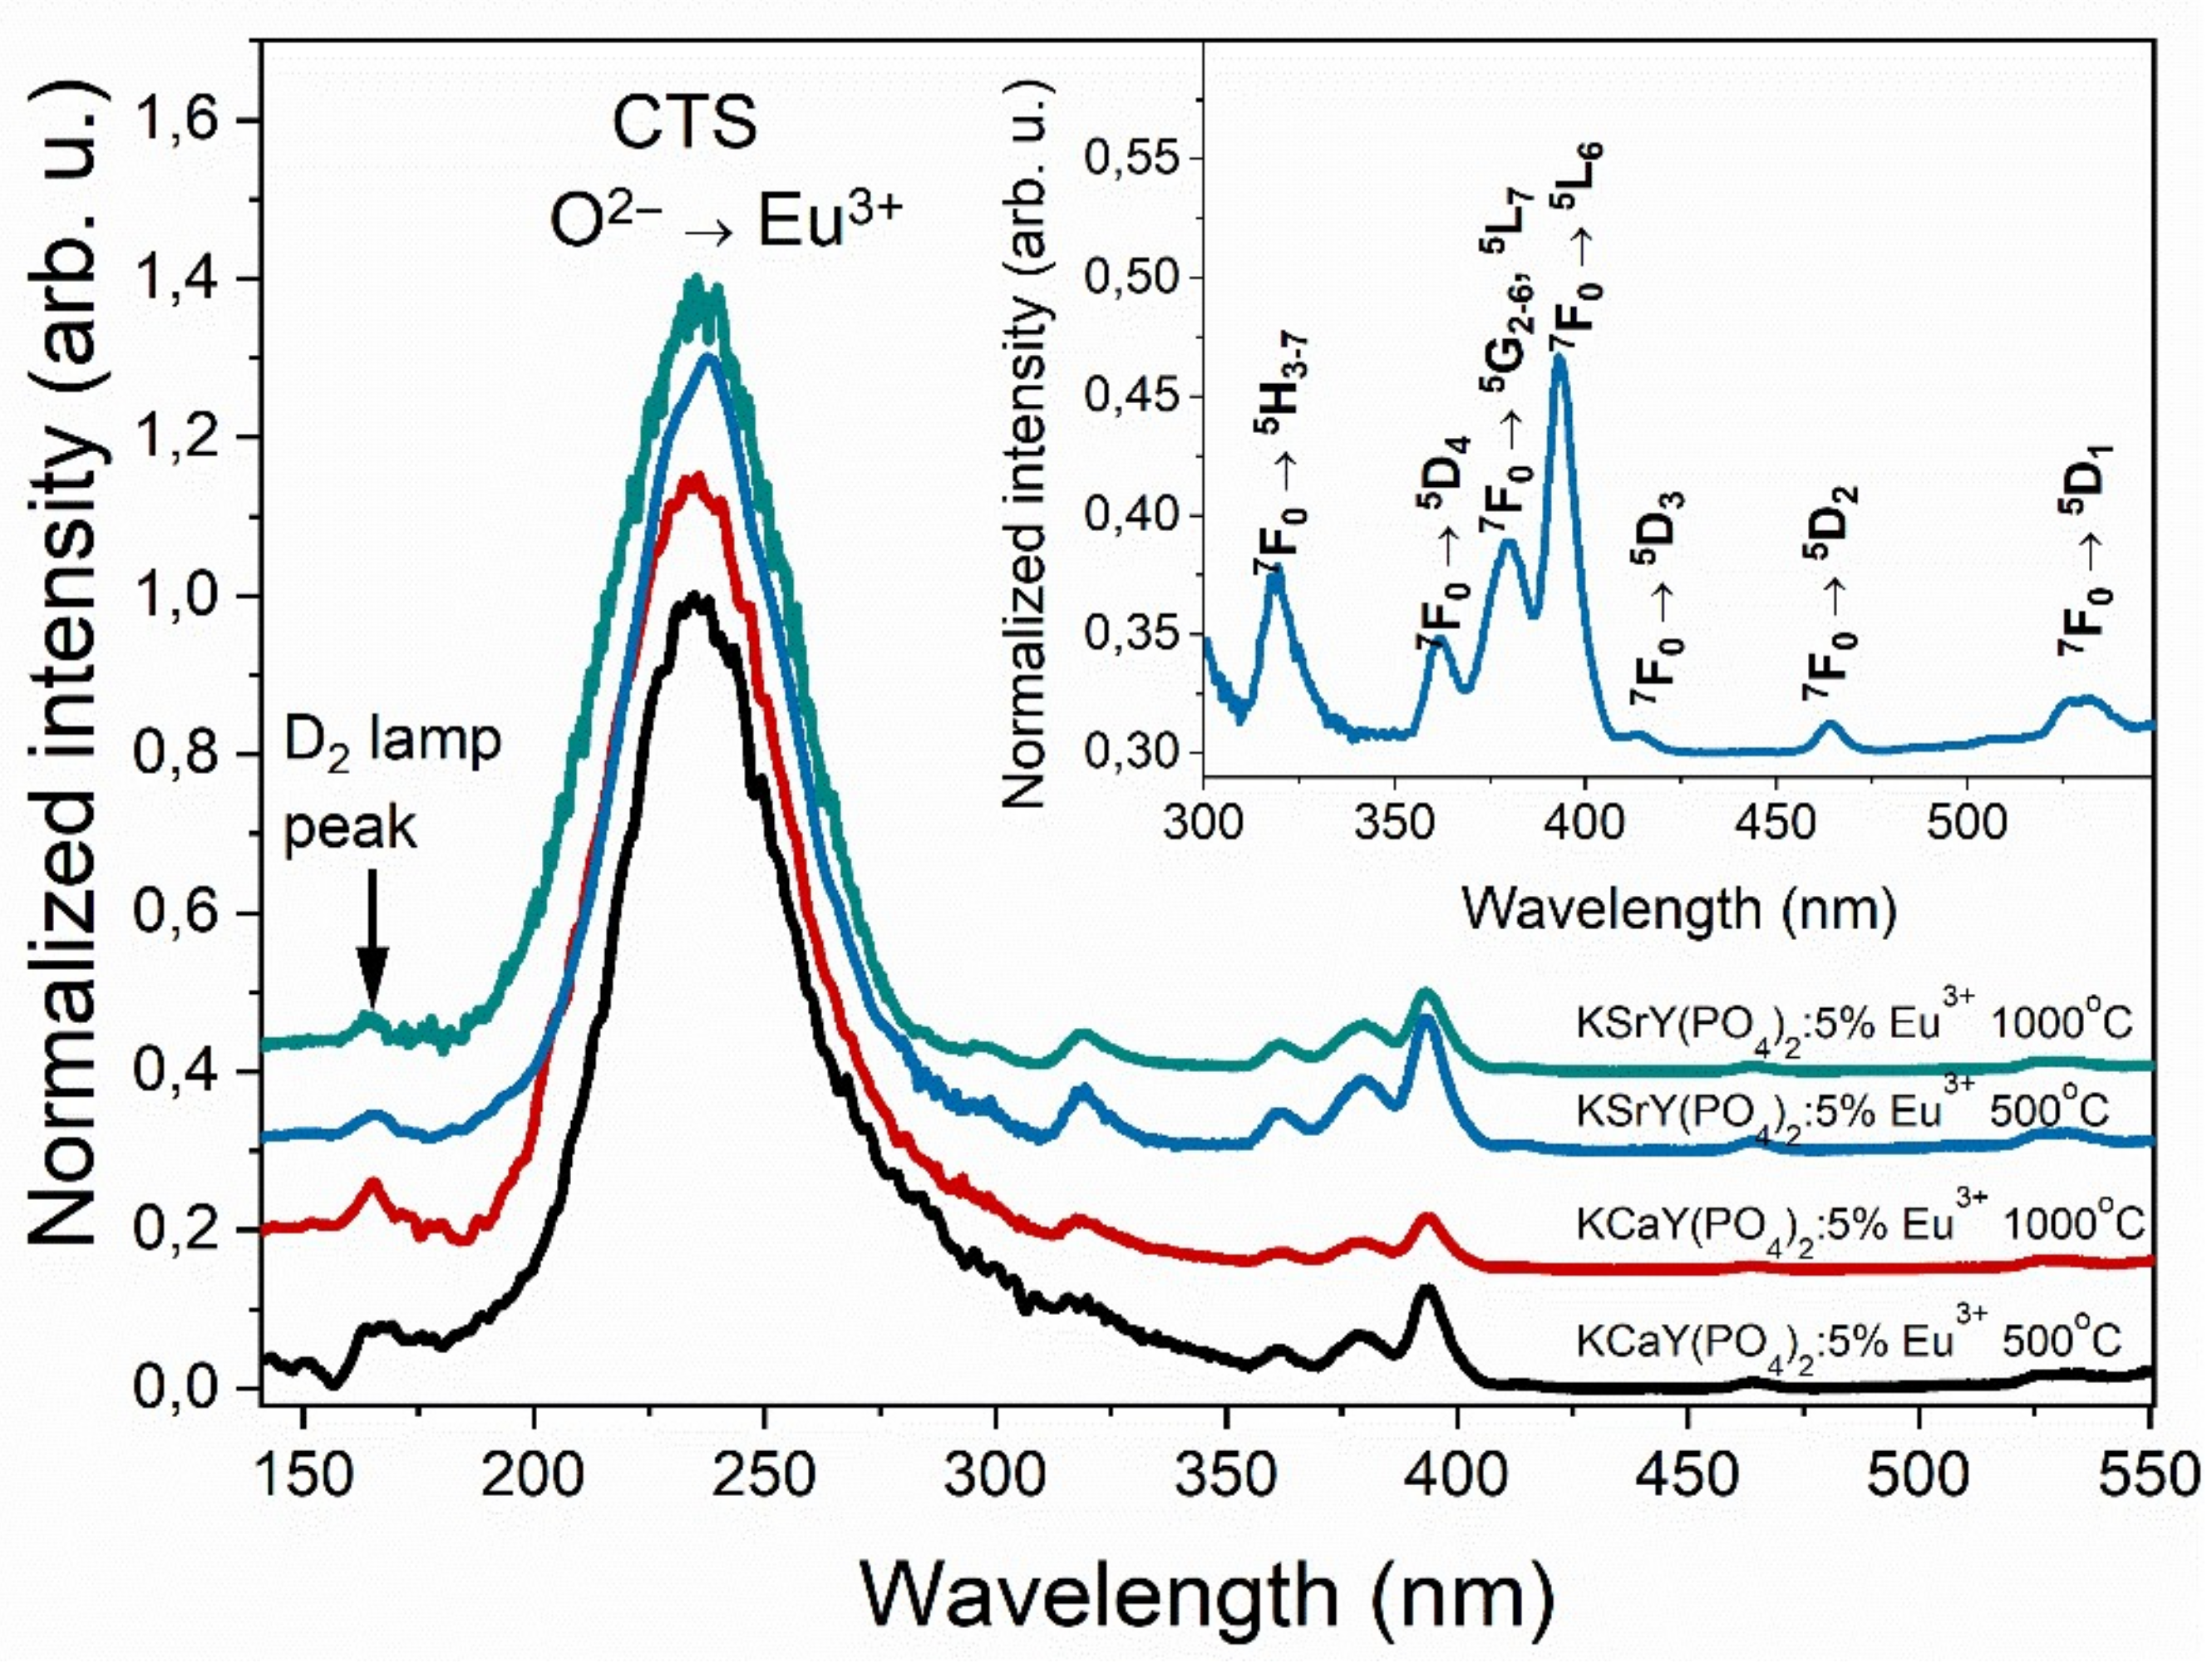
3.3. Optical Studies

The excitation spectra of KMeY(PO4)2:5% Eu3+ were measured by observing the transition at λem = 612 nm (Figure 8). The spectra consisted of a broad and intense band centered at 235 nm, which was assigned to the charge transfer transition from oxygen to europium ions (CTS—charge-transfer state) [34]. Besides the CTS, there were also sharp and narrow bands, which derived from the 4f–4f transition of Eu3+ [35]. The bands were assigned to the 7F05H3–7 at 319 nm, 7F05D4 at 361.5 nm, 7F05G2–6, 5L7 at 379 nm, 7F05L6 at 393 nm, 7F05D3 at 413.5 nm, 7F05D2 at 464 nm, and 7F05D1 at 532 nm. All spectra were normalized to the intensity of the charge transfer band. In the sample sintered at 1000 °C, the ratio between the CTS and 4f–4f bands increased.
The room temperature emission spectra measured with excitation at λ = 393 nm consist of bands characteristic for Eu3+ ions’ emission (Figure 9a) [36]. They can be assigned to the transition from the 5D0 excited level to 7FJ (J = 0, 1, 2, 3, 4) ground levels. The emission peak attributed to the 5D07F0 was located with the maximum at 578 nm, while the 7F1 was at 587 nm, 7F2 was at 612 nm, and 7F3 and 7F4 were at 653 nm and 704 nm, respectively. The highest emission intensity was exhibited by the KSrY(PO4)2:5% Eu3+ sample annealed at 500 °C (Figure 9b). The Ca2+ analogous phosphate possessed lower emission intensity. Furthermore, heat treatment of samples at 1000 °C decreased the overall emission intensity for both KCaY(PO4)2:5% Eu3+ and KSrY(PO4)2:5% Eu3+. This was probably connected with more efficient non-radiative processes. When the samples were annealed at a higher temperature, all Eu3+ ions only occupied one position in the crystal structure of the investigated phosphate. As a consequence, the distance between Eu3+–Eu3+ ions decreased causing concentration quenching. The enhancement of non-radiative processes with annealing temperatures confirmed registered decay curves (see Figures S4–S7). As shown in Figure 9a, the most intense was the electric dipole transition (ED) 5D07F2. However, it should the emphasized that the intensity of 7F4 bands was anomalously intense. Similar behavior was reported for the first time in 1988 by Blasse [37]. He linked this situation with the D4h site symmetry of Eu3+ ions. The same observation has been presented by Ferreira in Na9[EuW10O36]∙14H2O [38]. However, in the investigated phosphates, Eu3+ ions occupy Ca2+/Sr2+ sites with D2 symmetry. Bettinelli in 2011 explained that the distortion of EuO8 polyhedra to D2 symmetry was responsible for the enhancement of the 5D07F4 transition [39].
No significant changes were detected in the emission spectra recorded at 77 K (Figure S2). With the temperature decreasing, emission bands become narrower; however, even at low temperatures, the peaks overlapped and they were not well separated. The 5D07F0 transition of the sample annealed at 500 °C consisted of two peaks coming from two optical positions of dopant in the host of the compounds under study. On the other hand, for samples obtained at 1000 °C, only one 7F0 band was presented. The localization of Eu3+ ions on the surface of nanocrystals and inside the bulk can cause the occurrence of two dopant sites, and has been reported many times in the literature [40]. Presented emission and decay times also confirmed this hypothesis. The 5D07F0 transition of samples annealed at 500 °C consisted of two separate bands, while only one band was observed for samples prepared at 1000 °C. The magnification of the 5D07F0 transition of all samples is presented in Figure S3. These observations were in line with measured emission decay curves (see below).
For europium ions, the magnetic dipole transition (7F05D1) was almost independent of the local symmetry and type of matrix, while the electric dipole transition (7F05D2) was very sensitive to any change in the local environment. When europium ions occupied a site with a center of symmetry, the only allowed transition was the magnetic dipole, while for europium ions at non-centrosymmetric sites, the most intense transition was the electric dipole. Therefore, the ratio between these transitions is called the asymmetry parameter R and is defined as follows:
R = D 0 5 F 2 7 D 0 5 F 1 7
The higher the value of the R parameter, the more non-centrosymmetric the site of Eu3+ was. Calculated values of the R parameter are listed in Table 2 and Figure 9c. Increasing the annealing temperature of samples lowered the R parameter, which meant that distortion of the local surrounding of Eu3+ ions decreased, and for KCaY(PO4)2:5% Eu3+ annealed at 1000 °C, it was close to being ideally octahedral.
Room temperature decay curves measured for all samples are presented in Figures S4–S7, while the calculated decay times are listed in Table 2. The decay curves of samples annealed at 500 °C have biexponential characteristics, which confirmed the localization of europium ions on the nanograins surface and inside the bulk. The calculated values of decay time were typical for Eu3+ ions [35,41,42,43]; for example, the decay time of the Eu3+ ions in the Y2O3 compound equaled 2 ms, while for YAsO4:Eu3+ it was around 4 ms. Increasing the annealing temperature caused a decrease in decay time, which was in good agreement with the observed behavior of emission intensity. The enhancement of non-radiative processes with annealing temperatures confirmed registered decay curves. The lifetime of the KCaY(PO4)2:5% Eu3+ decreased from 5.4 ms to 4.7 ms with increasing annealing temperatures from 500 °C to 1000 °C, respectively.

4. Conclusions

Nanocrystalline powders of the KMeY(PO4)2:5% Eu3+ (Me = Ca, Sr) composition were obtained at relatively mild hydrothermal conditions. The XRD study confirmed the crystal structure of the investigated ternary phosphates, and TEM images showed that irregular agglomerates consisted of particles with an average size below 20 nm. Careful study of the IR and Raman spectra allowed all the vibrations, translations, and librations to be assigned. K(Ca, Sr)Y(PO4)2 activated with 5% of Eu3+ ions showed intense red emission, with a dominance of electric dipole transitions from the 5D0 to 7F2 level. The local symmetry of Eu3+ ions in the investigated phosphates KMeY(PO4)2:5% Eu3+ (Me = Ca, Sr) was D2, which caused the abnormally high intensity of the 5D07F4 transition. For samples annealed at the temperature of 500 °C, Eu3+ ions were on the surface of the nanocrystals and inside the bulk. Increasing the annealing temperature to 1000 °C resulted in better crystallinity of the sample and only one location of doping ions. Due to this, the distance between Eu3+–Eu3+ ions was reduced, which caused concentration quenching. For this reason, the most intense emission was observed for the samples heat-treated at 500 °C. These results were consistent with the recorded decay times.

Supplementary Materials

The following supporting information can be downloaded at https://www.mdpi.com/article/10.3390/ma15051850/s1: Figure S1: XRD patterns of obtained samples after hydrothermal process without annealing; Figure S2: Emission spectra of representative samples KMeY(PO4)2 (Me = Ca, Sr) recorded at 77 and 300 K; Figure S3: Magnification of the 5D07F0 transition of investigated compounds; Figures S4–S7: Emission decay curves of the KMeY(PO4)2:5% Eu3+ (Me = Ca, Sr) samples recorded at room temperature.

Author Contributions

Conceptualization, A.J.P., D.S., A.W., L.M., I.S. and J.H.; investigation, A.J.P., A.W. and L.M.; methodology, A.J.P., D.S., A.W., L.M. and J.H.; supervision, I.S. and J.H.; validation, A.J.P., D.S., A.W. and L.M.; visualization, A.J.P., D.S., A.W. and L.M.; writing—original draft, A.J.P., D.S., A.W., L.M., I.S. and J.H.; writing—review & editing, A.J.P., D.S., A.W., L.M., I.S. and J.H. All authors have read and agreed to the published version of the manuscript.

Funding

This research received no external funding.

Institutional Review Board Statement

Not applicable.

Informed Consent Statement

Not applicable.

Data Availability Statement

Data are contained within the article.

Conflicts of Interest

The authors declare no conflict of interest.

References

  1. Phogat, P.; Khatkar, S.P.; Taxak, V.B.; Malik, R.K. Eu3+ incorporated Bi4MgO4(PO4)2: Deviation of the novel nanophosphor by solution combustion and investigation in to crystallographic and photometric characteristic. Solid State Sci. 2022, 124, 106799. [Google Scholar] [CrossRef]
  2. Meena, M.L.; Lu, C.H.; Som, S.; Chaurasiya, R.; Lin, S.D. High efficient and thermally stable Eu3+ activated phosphate based phosphors for wLEDs: An experimental and DFT study. J. Alloys Comp. 2022, 895, 162670. [Google Scholar] [CrossRef]
  3. Zhao, J.; Dong, J.; Ye, X.; Wang, L. A promising novel red-emitting Eu3+-activated neodymium calcium phosphate phosphor with good thermal stability and excellent color purity for WLEDs. J. Mol. Struct. 2021, 1240, 130567. [Google Scholar] [CrossRef]
  4. Liu, W.R.; Huang, C.H.; Yeh, C.W.; Tsai, J.C.; Chiu, Y.C.; Yeh, Y.T.; Liu, R.S. A Study on the Luminescence and Energy Transfer of Single-Phase and Color-Tunable KCaY(PO4)2:Eu2+,Mn2+ Phosphor for Application in White-Light LEDs. Inorg. Chem. 2012, 51, 9636–9641. [Google Scholar] [CrossRef]
  5. Carrasco, I.; Bartosiewicz, K.; Piccinelli, F.; Nikl, M.; Bettinelli, M. Structural effects and 5d→4f emission transition shifts induced by Y co-doping in Pr-doped K3Lu1−xYx(PO4)2. J. Lumin. 2017, 189, 113–119. [Google Scholar] [CrossRef]
  6. Carrasco, I.; Piccinelli, F.; Bettinelli, M. Optical Spectroscopy of Ca9Tb1–xEux(PO4)7 (x=0, 0.1, 1): Weak Donor Energy Migration in the Whitlockite Structure. J. Phys. Chem. C 2017, 121, 16943–16950. [Google Scholar] [CrossRef]
  7. Yao, Q.; Hu, P.; Sun, P.; Liu, M.; Dong, R.; Chao, K.; Liu, Y.; Jiang, J.; Jiang, H. YAG:Ce3+ Transparent Ceramic Phosphors Brighten the Next-Generation Laser-Driven Lighting. Adv. Mater. 2020, 32, 1907888. [Google Scholar] [CrossRef] [PubMed]
  8. Ding, J.; Gao, Y.; Tang, X.; Zhou, J.; Ye, S.; Wu, D.; Wu, Q. Strong f-f excitation in titanium silicate: Near-UV LED pumped red phosphors with outstanding temperature sensitivity. Ceram. Int. 2021, 47, 27157–27164. [Google Scholar] [CrossRef]
  9. Rodríguez-García, M.M.; Ciric, A.; Ristic, Z.; Williams, J.A.G.; Dramićanin, M.D.; Evans, I.R. Narrow-band red phosphors of high colour purity based on Eu3+ activated apatite-type Gd9.33(SiO4)6O2. J. Matter. Chem. C 2021, 9, 7474–7484. [Google Scholar] [CrossRef]
  10. Dereń, P.J.; Stefańska, D.; Ptak, M.; Wiśniewski, P. Method to Measure the Degree of Reduction of Eu3+ to Eu2+: How Anion and Cation Vacancies Influence the Degree of Reduction. J. Phys. Chem. C 2021, 125, 24505–24514. [Google Scholar] [CrossRef]
  11. Li, X.; Yang, C.; Liu, Q.; Wang, X.; Mi, X. Enhancement of luminescence properties of SrAl2Si2O8:Eu3+ red phosphor. Ceram. Int. 2020, 46, 17376–17382. [Google Scholar] [CrossRef]
  12. Li, S.; Wang, L.; Tang, D.; Cho, Y.; Liu, X.; Zhou, X.; Lu, L.; Zhang, L.; Takeda, T.; Hirosaki, N.; et al. Achieving High Quantum Efficiency Narrow-Band β-Sialon:Eu2+ Phosphors for High-Brightness LCD Backlights by Reducing the Eu3+ Luminescence Killer. Chem. Mater. 2018, 30, 494–505. [Google Scholar] [CrossRef]
  13. Wang, Y.; Seto, T.; Ishigaki, K.; Uwatoko, Y.; Xiao, G.; Zou, B.; Li, G.; Tang, Z.; Li, Z.; Wang, Y. Pressure-Driven Eu2+-Doped BaLi2Al2Si2N6: A New Color Tunable Narrow-Band Emission Phosphor for Spectroscopy and Pressure Sensor Applications. Adv. Funct. Mater. 2020, 30, 2001384. [Google Scholar] [CrossRef]
  14. Vlasse, M.; Bochu, P.; Parent, C.; Cheminade, J.P.; Daoudi, A.; le Flem, G.; Hagenmuller, P. Structure determination of calcium neodymium potassium double phosphate CaKNd(PO4)2. Acta Cryst. B 1982, 38, 2328–2331. [Google Scholar] [CrossRef]
  15. Keller, L.P.; McCarthy, G.J.; Garvey, R. Crystal chemistry of ABC(PO4)2 phases (A=K, Rb, Cs; B=Ca, Sr; C=Ln or Bi) with hexagonal LaPO4 structure. Mater. Res. Bull. 1987, 20, 459–462. [Google Scholar] [CrossRef]
  16. Parent, C.; Bochu, P.; le Flem, G.; Hagenmuller, P.; Bourcet, J.C.; Gaume-Mahn, F. Energy transfer mechanisms in the KCaLa1−x−yCexTby(PO4)2 phases. J. Phys. Chem. Solids 1984, 45, 39–45. [Google Scholar] [CrossRef]
  17. Tie, S.; Su, Q.; Yu, Y. Structure and site-symmetry investigation on the hexagonal KCaY(PO4)2. J. Alloys Compd. 1995, 227, 1–4. [Google Scholar] [CrossRef]
  18. Tie, S.; Su, Q.; Yu, Y. Investigation on the Luminescence of Ln3+ (Ln=Eu, Gd, and Dy) in Hexagonal KCaR(PO4)2 Phosphates (R=Gd, Y). Phys. Stat. Sol. A 1995, 147, 267–276. [Google Scholar] [CrossRef]
  19. Zhang, Z.J.; Yuan, J.L.; Duan, C.J.; Xiong, D.B.; Chen, H.H.; Zhao, J.T.; Zhang, G.B.; Shi, C.S. Vacuum ultraviolet spectroscopic properties of rare earth (RE=Ce, Tb, Eu, Tm, Sm -doped hexagonal KCaGd(PO4)2 phosphate. J. Appl. Phys. 2007, 102, 093514. [Google Scholar] [CrossRef]
  20. Chen, Y.C.; Huang, W.Y.; Chen, T.M. Enhancing the performance of photovoltaic cells by using down-converting KCaGd(PO4)2:Eu3+ phosphors. J. Rare Earths 2011, 29, 907–910. [Google Scholar] [CrossRef]
  21. Zhang, M.; Liang, Y.; Huang, W.; Xia, Z.; Yu, D.; Lan, Y.; Li, G.; Zhou, W. A novel single-composition tunable color emission KSrY(PO4)2:Ce3+, Tb3+, Mn2+ phosphor based on energy transfer. Mater. Res. Bull 2014, 57, 231–237. [Google Scholar] [CrossRef]
  22. Zhang, M.; Liang, Y.; Tong, M.; Wang, Q.; Yu, D.; Zhao, J.; Wu, J. Photoluminescence properties and energy transfer of a novel bluish-green tunable KSrY(PO4)2:Ce3+, Tb3+ phosphor. Ceram. Int. 2014, 40, 10407–10413. [Google Scholar] [CrossRef]
  23. Wang, X.F.; Yang, Q.; Wang, G.G.; Wang, X.Z.; Han, J.C. A new single-component KCaY(PO4)2:Dy3+, Eu3+ nanosized phosphor with high color-rendering index and excellent thermal resistance for warm-white NUV-LED. RSC Adv. 2016, 6, 96263–96274. [Google Scholar] [CrossRef]
  24. Wang, D.; Wang, Y. Spectroscope properties of KCaY(PO4)2:Eu3+ in vacuum ultraviolet region. Mater. Sci. Eng. B 2006, 133, 218–221. [Google Scholar] [CrossRef]
  25. Campayo, L.; Audubert, F.; Lartigue, J.-E.; Botuha, S.; Bernache-Assolant, D. Study of a phosphate-based material with rhabdophane structure for caesium immobilization: Synthesis, sintering and leaching behaviour. J. Nuclear Mater. 2008, 374, 101–108. [Google Scholar] [CrossRef]
  26. Campayo, L.; Audubert, F.; Bernache-Assolant, D. Synthesis study of alkaline-bearing rare earth phosphates with rhabdophane structure. Solid State Ionics 2005, 176, 2663–2669. [Google Scholar] [CrossRef]
  27. Matraszek, A.; Szczygieł, I.; Znamierowska, T. The synthesis and thermal stability of CaKCe(PO4)2 phosphate. Phase equalibria in the CaKPO4-CePO4 system. J. Alloys Comp. 2013, 555, 138–144. [Google Scholar] [CrossRef]
  28. Boultif, A.; Louer, D. Powder pattern indexing with the dichotomy method. J. Appl. Cryst. 2004, 37, 724–731. [Google Scholar] [CrossRef]
  29. Laugier, J.; Bochu, B. Checkcell, LMGP-Suite of Programs for the Interpretation of X-Ray Experiments; Ensp/Laboratoire des Materiaux et du Genie, Physique: Saint Martin d’Heres, France, 2014; Available online: http://ccp14.cryst.bbk.ac.uk/tutorial/lmgp/index.html (accessed on 15 January 2022).
  30. Macalik, L.; Tomaszewski, P.E.; Matraszek, A.; Szczygieł, I.; Solarz, P.; Godlewska, P.; Sobczyk, M.; Hanuza, J. Optical and structural characterization of pure and Pr3+ doped LaPO4 and CePO4 nanocrystals. J. Alloys Comp. 2011, 509, 7458–7465. [Google Scholar] [CrossRef]
  31. Matraszek, A.; Godlewska, P.; Macalik, L.; Hermanowicz, K.; Hanuza, J.; Szczygieł, I. Optical and thermal characterization of microcrystalline Na3RE(PO4)2:Yb orthoposphates synthesized by Pechini method (RE=Y, La, Gd). J. Alloys Comp. 2015, 619, 275–283. [Google Scholar] [CrossRef]
  32. Godlewska, P.; Macalik, A.M.L.; Hermanowicz, K.; Ptak, M.; Hanuza, J.; Szczygieł, I. Spectroscopic and structural properties of Na3RE(PO4):Yb orthoposphates synthesised by hydrothermal method (RE=Y, Gd). J. Alloys Comp. 2015, 628, 199–207. [Google Scholar] [CrossRef]
  33. Pelczarska, A.; Watras, A.; Godlewska, P.; Radomińska, E.; Macalik, L.; Szczygieł, I.; Hanuza, J.; Dereń, P.J. Structural, Raman, FT-IR and optical properties of Rb3Y2(PO4)3 and Rb3La(PO4)2 doped with Eu3+ ions. New J. Chem. 2015, 39, 8474–8483. [Google Scholar] [CrossRef]
  34. Bondzior, B.; Stefańska, D.; Vu, T.H.Q.; Miniajluk-Gaweł, N.; Dereń, P.J. Red luminescence with controlled rise time in La2MgTiO6:Eu3+. J. Alloys Comp. 2021, 852, 157074. [Google Scholar] [CrossRef]
  35. Rudnicka, D.; Dereń, P.J. Preliminary spectroscopic properties of K4SrSi3O9 doped with Eu3+. Opt. Mater. 2013, 35, 2531–2534. [Google Scholar] [CrossRef]
  36. Chaudan, E.; Kim, J.; Tusseau-Nenez, S.; Goldner, P.; Malta, O.L.; Peretti, J.; Gacoin, T. Polarized Luminescence of Anisotropic LaPO4:Eu Nanocrystal Polymorphs. J. Am. Chem. Soc. 2018, 140, 30. [Google Scholar] [CrossRef] [PubMed]
  37. Blasse, G. Luminescence from the Eu3+ ion in D4d Symmetry. Inorg. Chim. Acta 1988, 142, 153–154. [Google Scholar] [CrossRef]
  38. Ferreira, R.A.S.; Nobre, S.S.; Granadeiro, C.M.; Nogueira, H.I.S.; Carlos, L.D.; Malta, O.L. A theoretical interpretation of the abnormal 5D07F4 intensity based on the Eu3+ local coordination in the Na9[EuW10O36]∙14H2O polyoxometalate. J. Lumin. 2006, 121, 561–567. [Google Scholar] [CrossRef]
  39. Bettinelli, M.; Speghini, A.; Piccinelli, F.; Neto, A.N.C.; Malta, O.L. Luminescence spectroscopy of Eu3+ in Ca3Sc2Si3O12. J. Lumin. 2011, 131, 1026–1028. [Google Scholar] [CrossRef]
  40. Wiglusz, R.J.; Grzyb, T.; Watras, A.; Dereń, P.J.; Lis, S.; Strek, W. An impact of sintering temperature and doping level on structural and spectra properties of Eu-doped strontium aluminium oxide. J. Rare Earths 2011, 29, 1105–1110. [Google Scholar] [CrossRef]
  41. Limbu, S.; Singh, L.R. A comparative study of a tunable body-centered cubic (I) red-emitting nanophosphor for warm WLED applications. J. Solid State Chem. 2022, 308, 122929. [Google Scholar] [CrossRef]
  42. Strzep, A.; Watras, A.; Zawisza, K.; Boutinaud, P.; Wiglusz, R.J. Forgotten and Resurrected Chernovite-(Y): YAsO4 Doped with Eu3+ Ions as a Potential Nanosized Luminophore. Inorg. Chem. 2017, 56, 10914–10925. [Google Scholar] [CrossRef] [PubMed]
  43. Pązik, R.; Watras, A.; Macalika, L.; Dereń, P.J. One step urea assisted synthesis of polycrystalline Eu3+ doped KYP2O7–luminescence and emission thermal quenching properties. New J. Chem. 2014, 38, 1129–1137. [Google Scholar] [CrossRef]
Figure 1. (a) A visualization of the rhabdophane type of structure of CePO4, and (b) of the KCaY(PO4)2 structure.
Materials 15 01850 g001
Figure 2. The XRD patterns of samples sintered at different temperatures. Asterisks denote unidentified reflections.
Materials 15 01850 g002
Figure 3. TEM (A,B) and SAED (C) images of KCaY(PO4)2:5% Eu3+ obtained by drying hydrothermally obtained powders.
Materials 15 01850 g003
Figure 4. TEM (A,B) and SAED (C) images of KSrY(PO4)2:5% Eu3+ obtained by drying of hydrothermally obtained powders.
Materials 15 01850 g004
Figure 5. The TGA heating curves of samples obtained hydrothermally and dried at 120 °C.
Materials 15 01850 g005
Figure 6. Infrared absorption spectra of KCaY(PO4)2:Eu3+ in the (a) FIR and (b) MIR range. Position of the stretching (ν) and bending (δ) modes as well as libration and translation are marked in the figures.
Materials 15 01850 g006
Figure 7. Raman spectra of KCaY(PO4)2:5% Eu3+.
Materials 15 01850 g007
Figure 8. Excitation spectra of KMeY(PO4)2:5% Eu3+ samples monitored at λem = 612 nm, and the assigned f–f absorption bands of representative KSrY(PO4)2:5% Eu3+ 500 °C sample (inset).
Materials 15 01850 g008
Figure 9. (a) The emission spectra of KMeY(PO4)2:5% Eu3+, λexc = 393 nm, (b) the integrated intensity of registered emissions, and (c) the R parameter of investigated samples.
Materials 15 01850 g009
Table 1. The unit cell parameters and the cell volume of the KMeY(PO4)2:5% Eu3+ powders sintered at 1000 °C.
SampleUnit Cell Parameters (Å)Cell Volume (Å3)
a = bc
KCaY(PO4)2:5% Eu3+6.8873 ± 0.00456.3380 ± 0.0004260.4
KSrY(PO4)2:5% Eu3+6.9911 ± 0.00156.4186 ± 0.0002271.7
Table 2. The decay time and the R parameter for the KMeY(PO4)2:5% Eu samples.
Sampleτ1 (ms)τ2 (ms)R
KCaY(PO4)2:5% Eu3+/500 °C1.45.41.52
KCaY(PO4)2:5% Eu3+/1000 °C4.7---1.14
KSrY(PO4)2:5% Eu3+/500 °C1.74.61.65
KSrY(PO4)2:5% Eu3+/1000 °C3.8---1.35
Publisher’s Note: MDPI stays neutral with regard to jurisdictional claims in published maps and institutional affiliations.

