
Synthesis and Characterization of Nanocrystalline Boron-Nitride Thin Films by Ion Milling and Thermal Treatment for Tribological Coatings: An Approach to Quantifying the Growth Dynamic Process

 , , ,
, , ,
Abstract
:1. Introduction
2. Materials and Methods
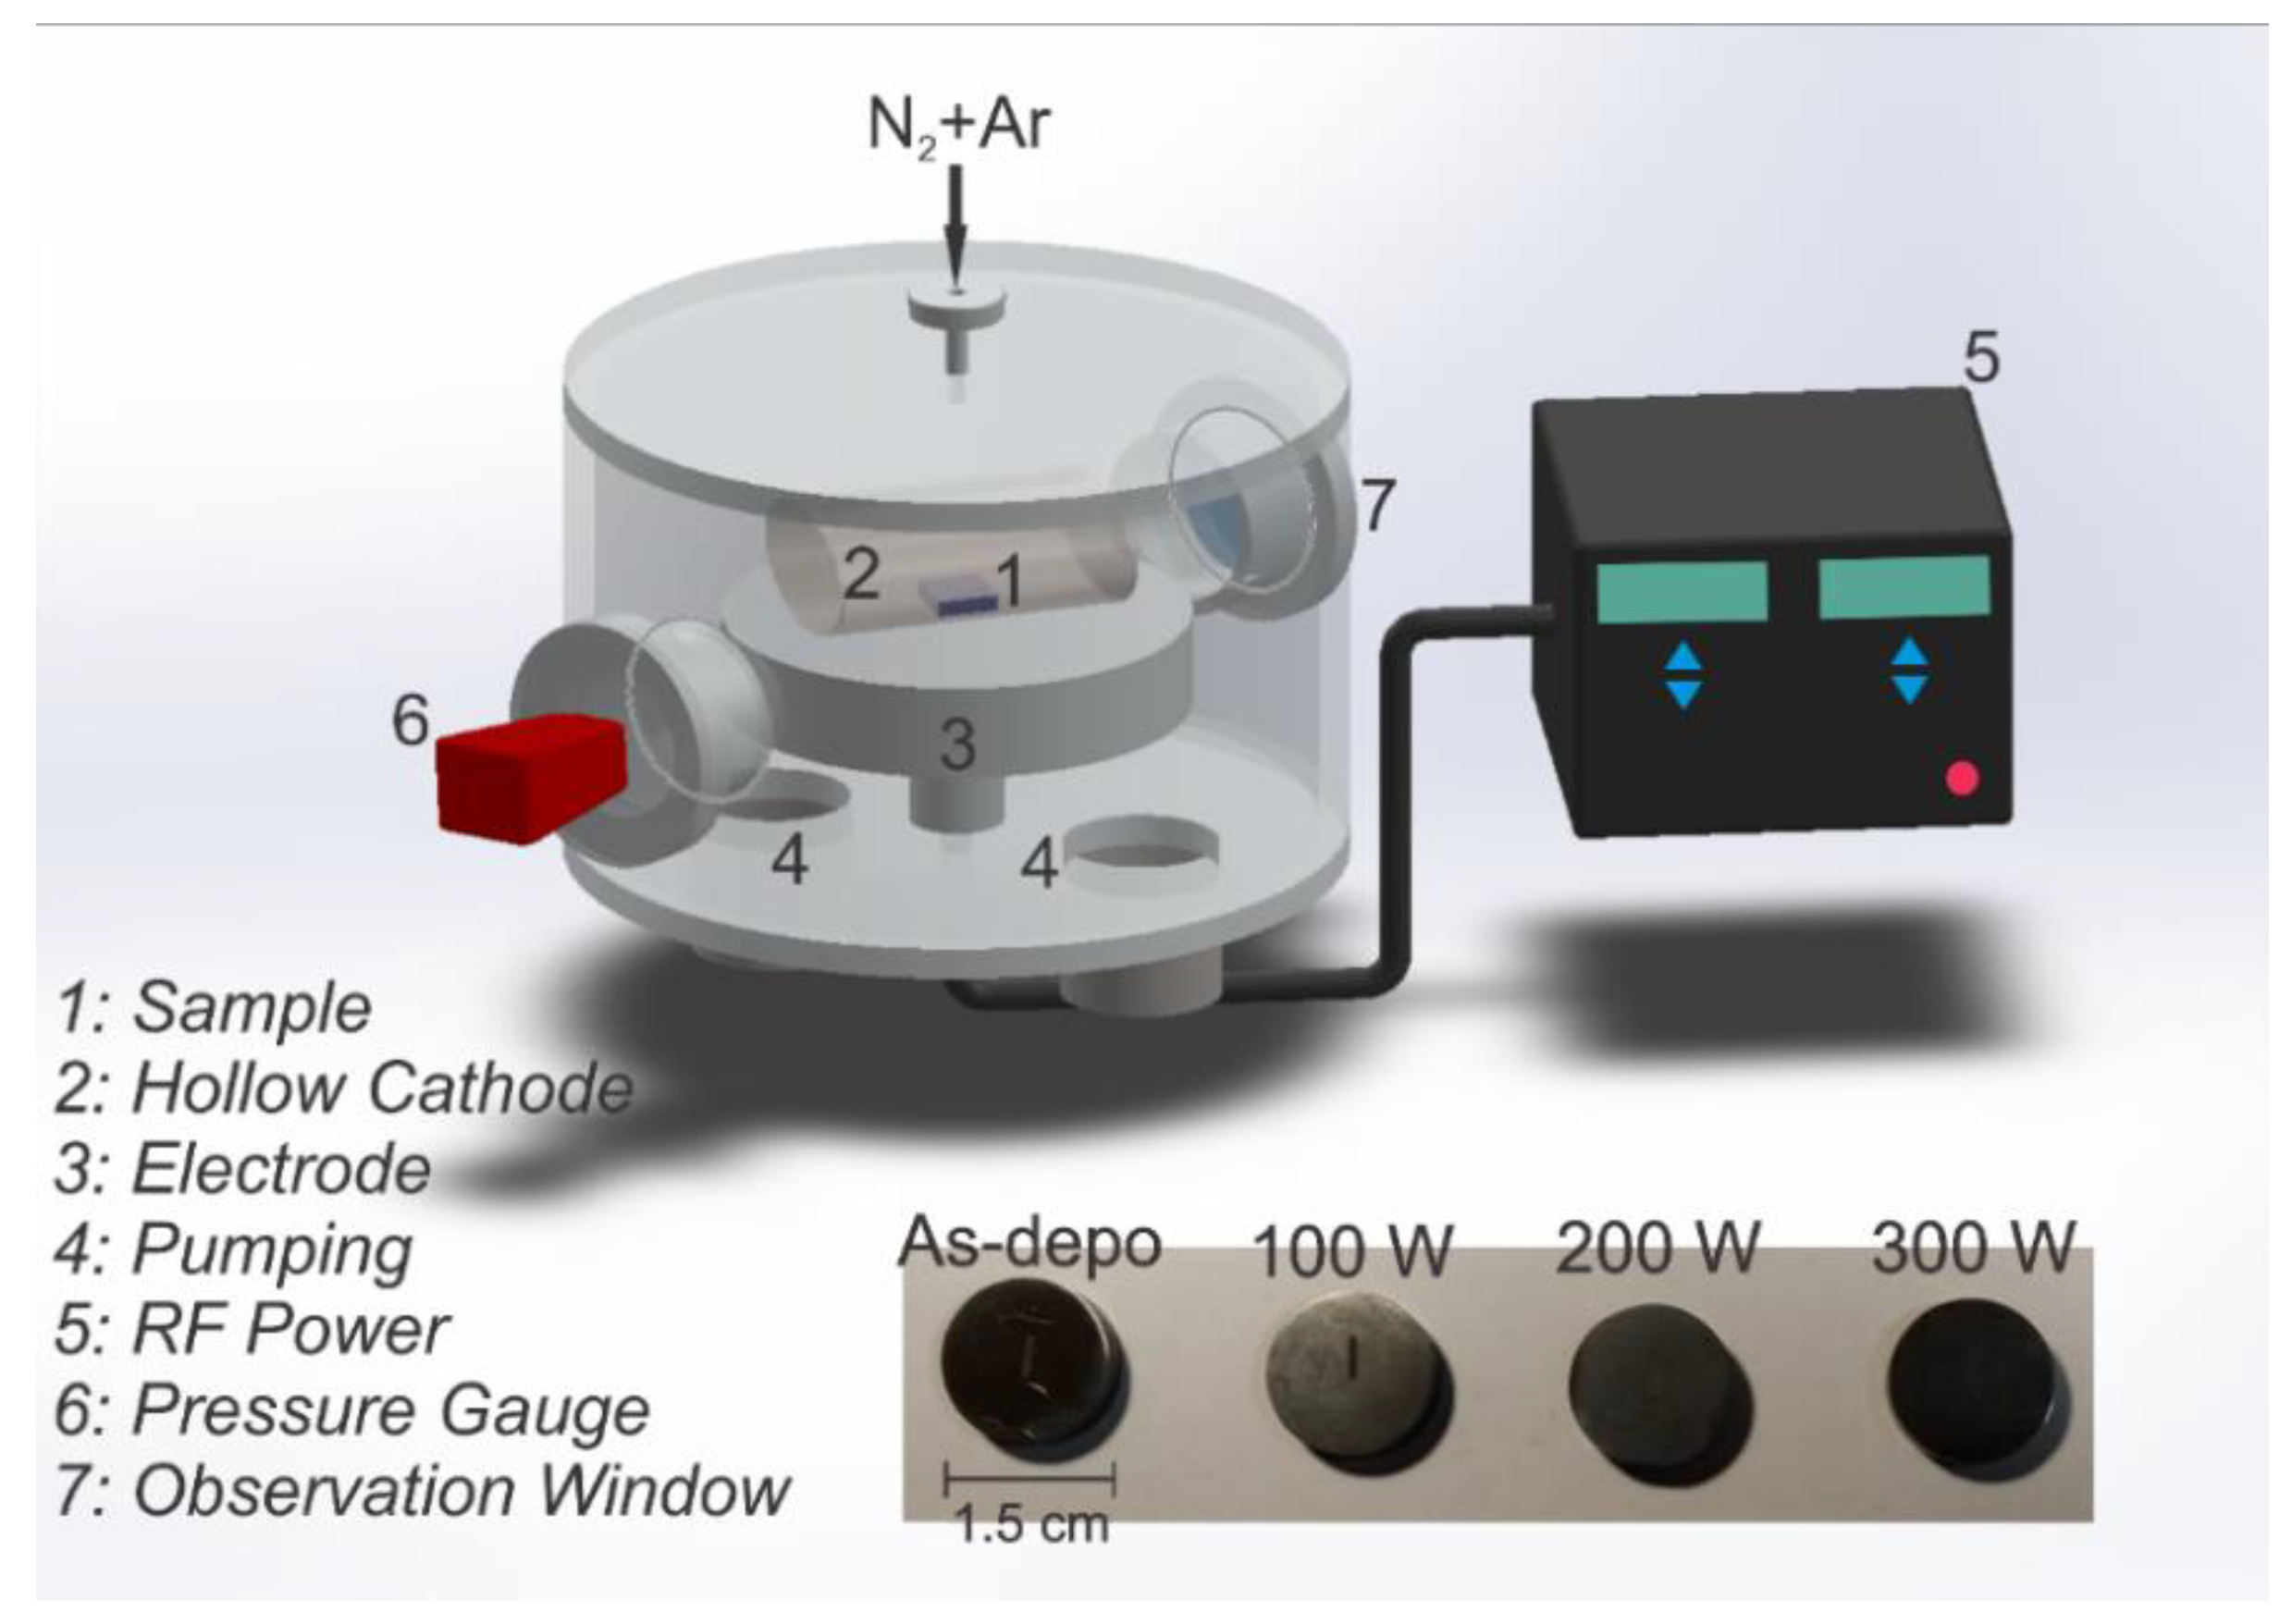
2.1. Sample Preparation and Deposition
2.2. Hardness Measurements
2.3. XRD Analysis
2.4. Coefficient of Friction (FC) Measurements
2.5. XPS Analysis
2.6. EDS/SEM Measurements
3. Results and Discussion
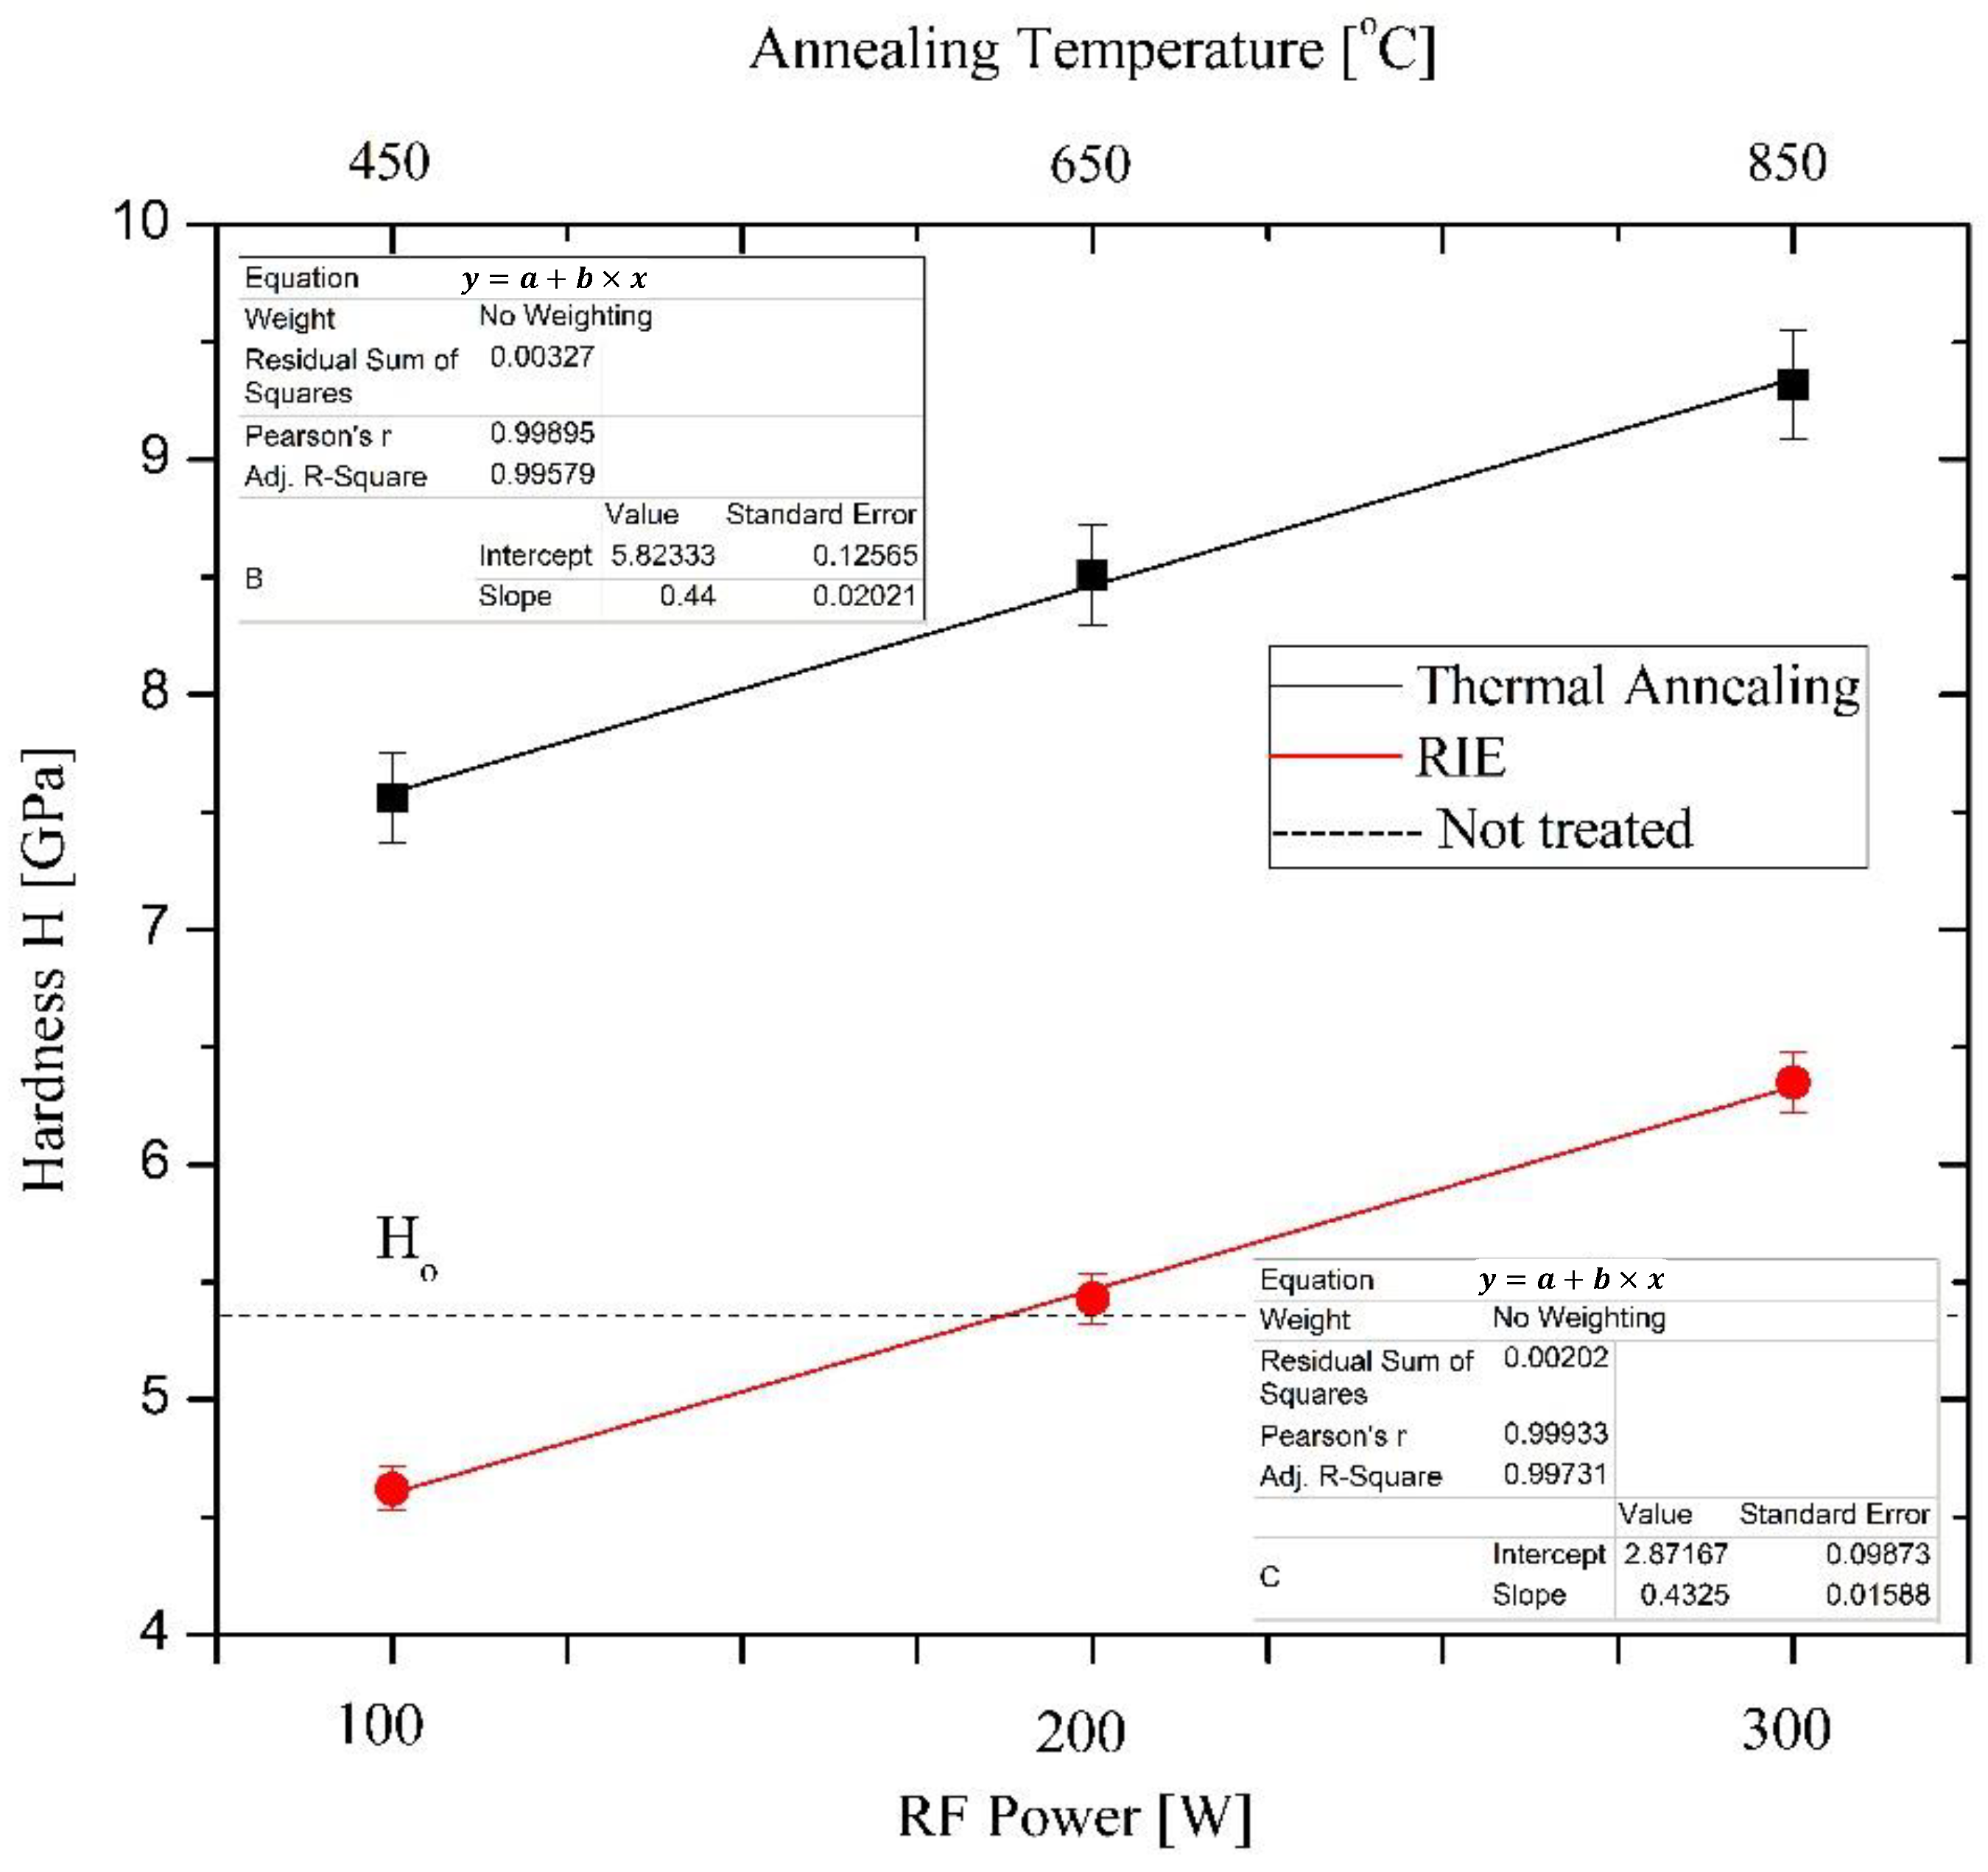
3.1. Hardness Measurements
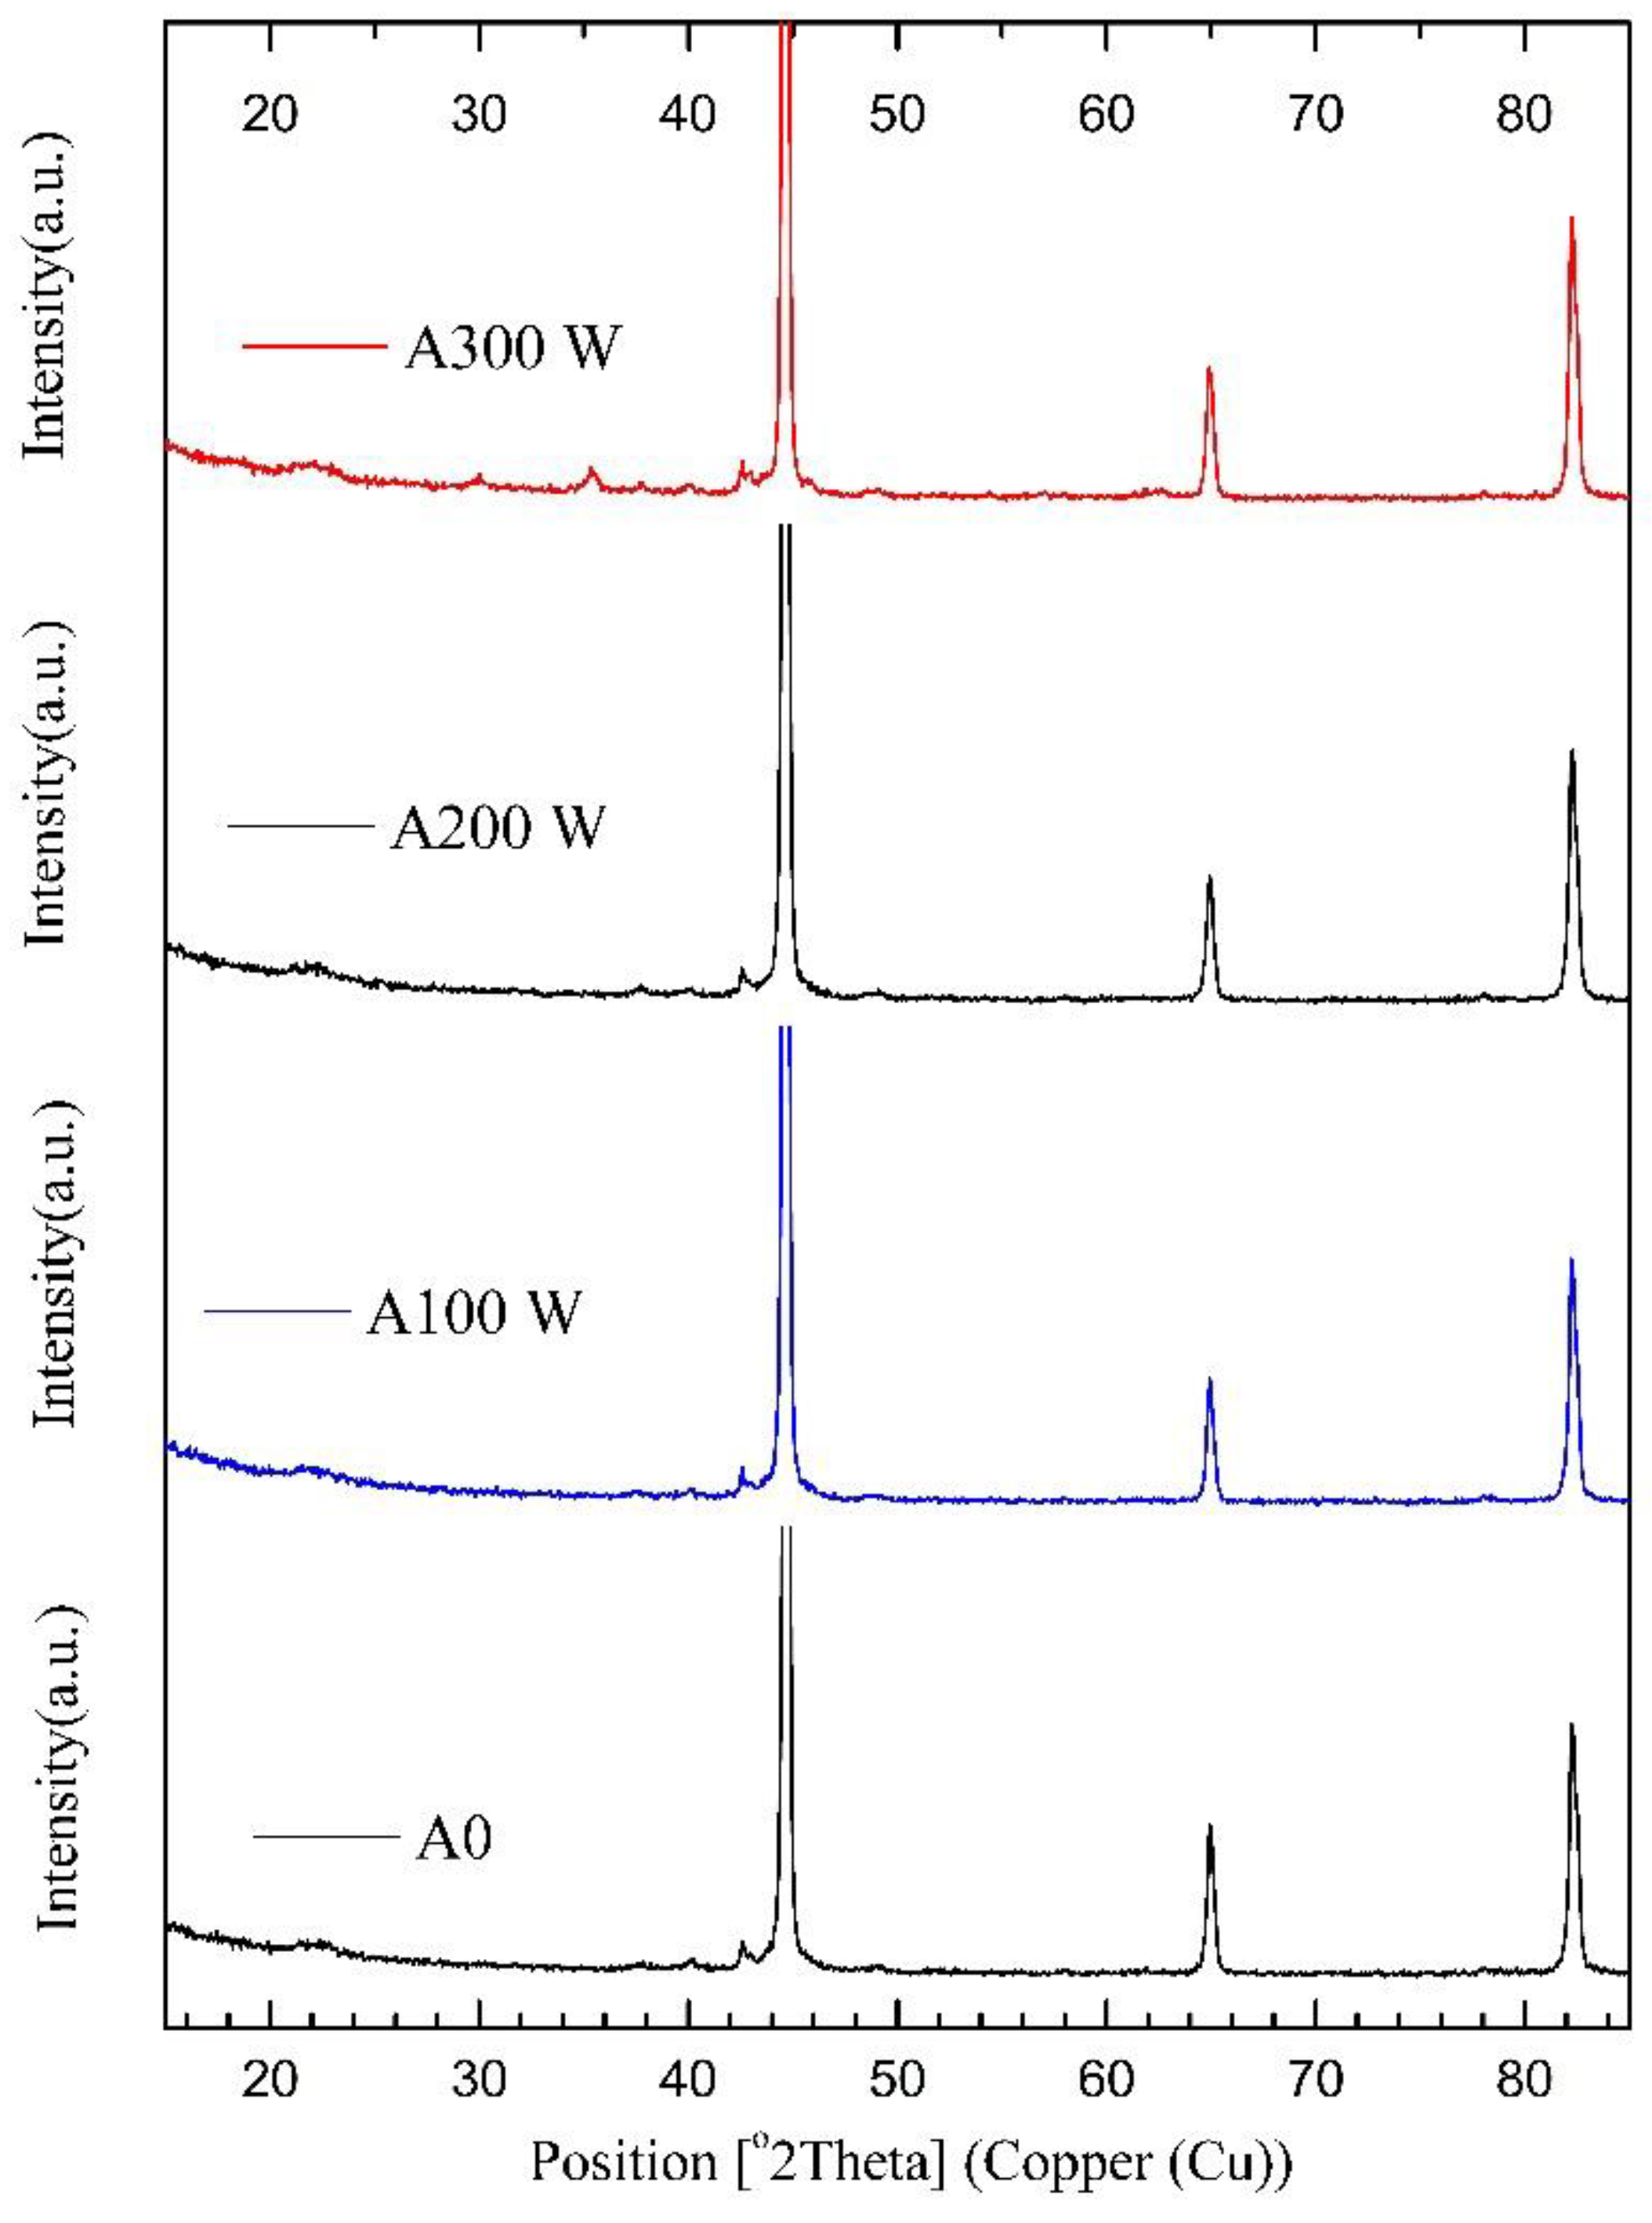
3.2. XRD Analysis
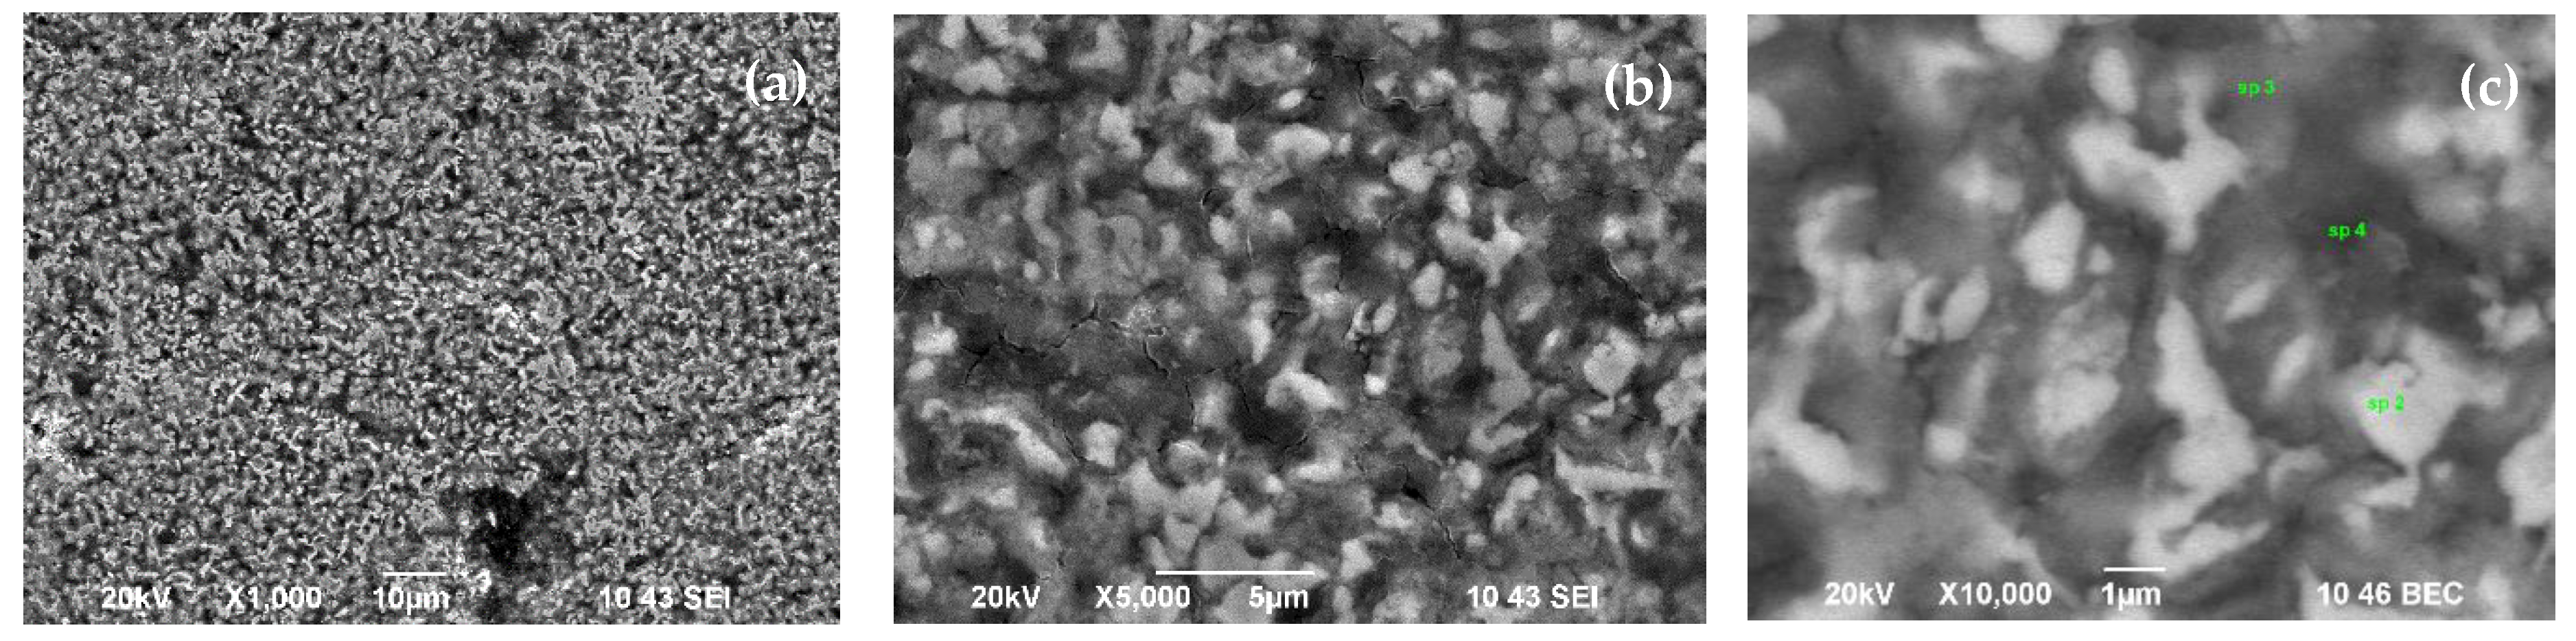
3.3. EDS/SEM Measurements
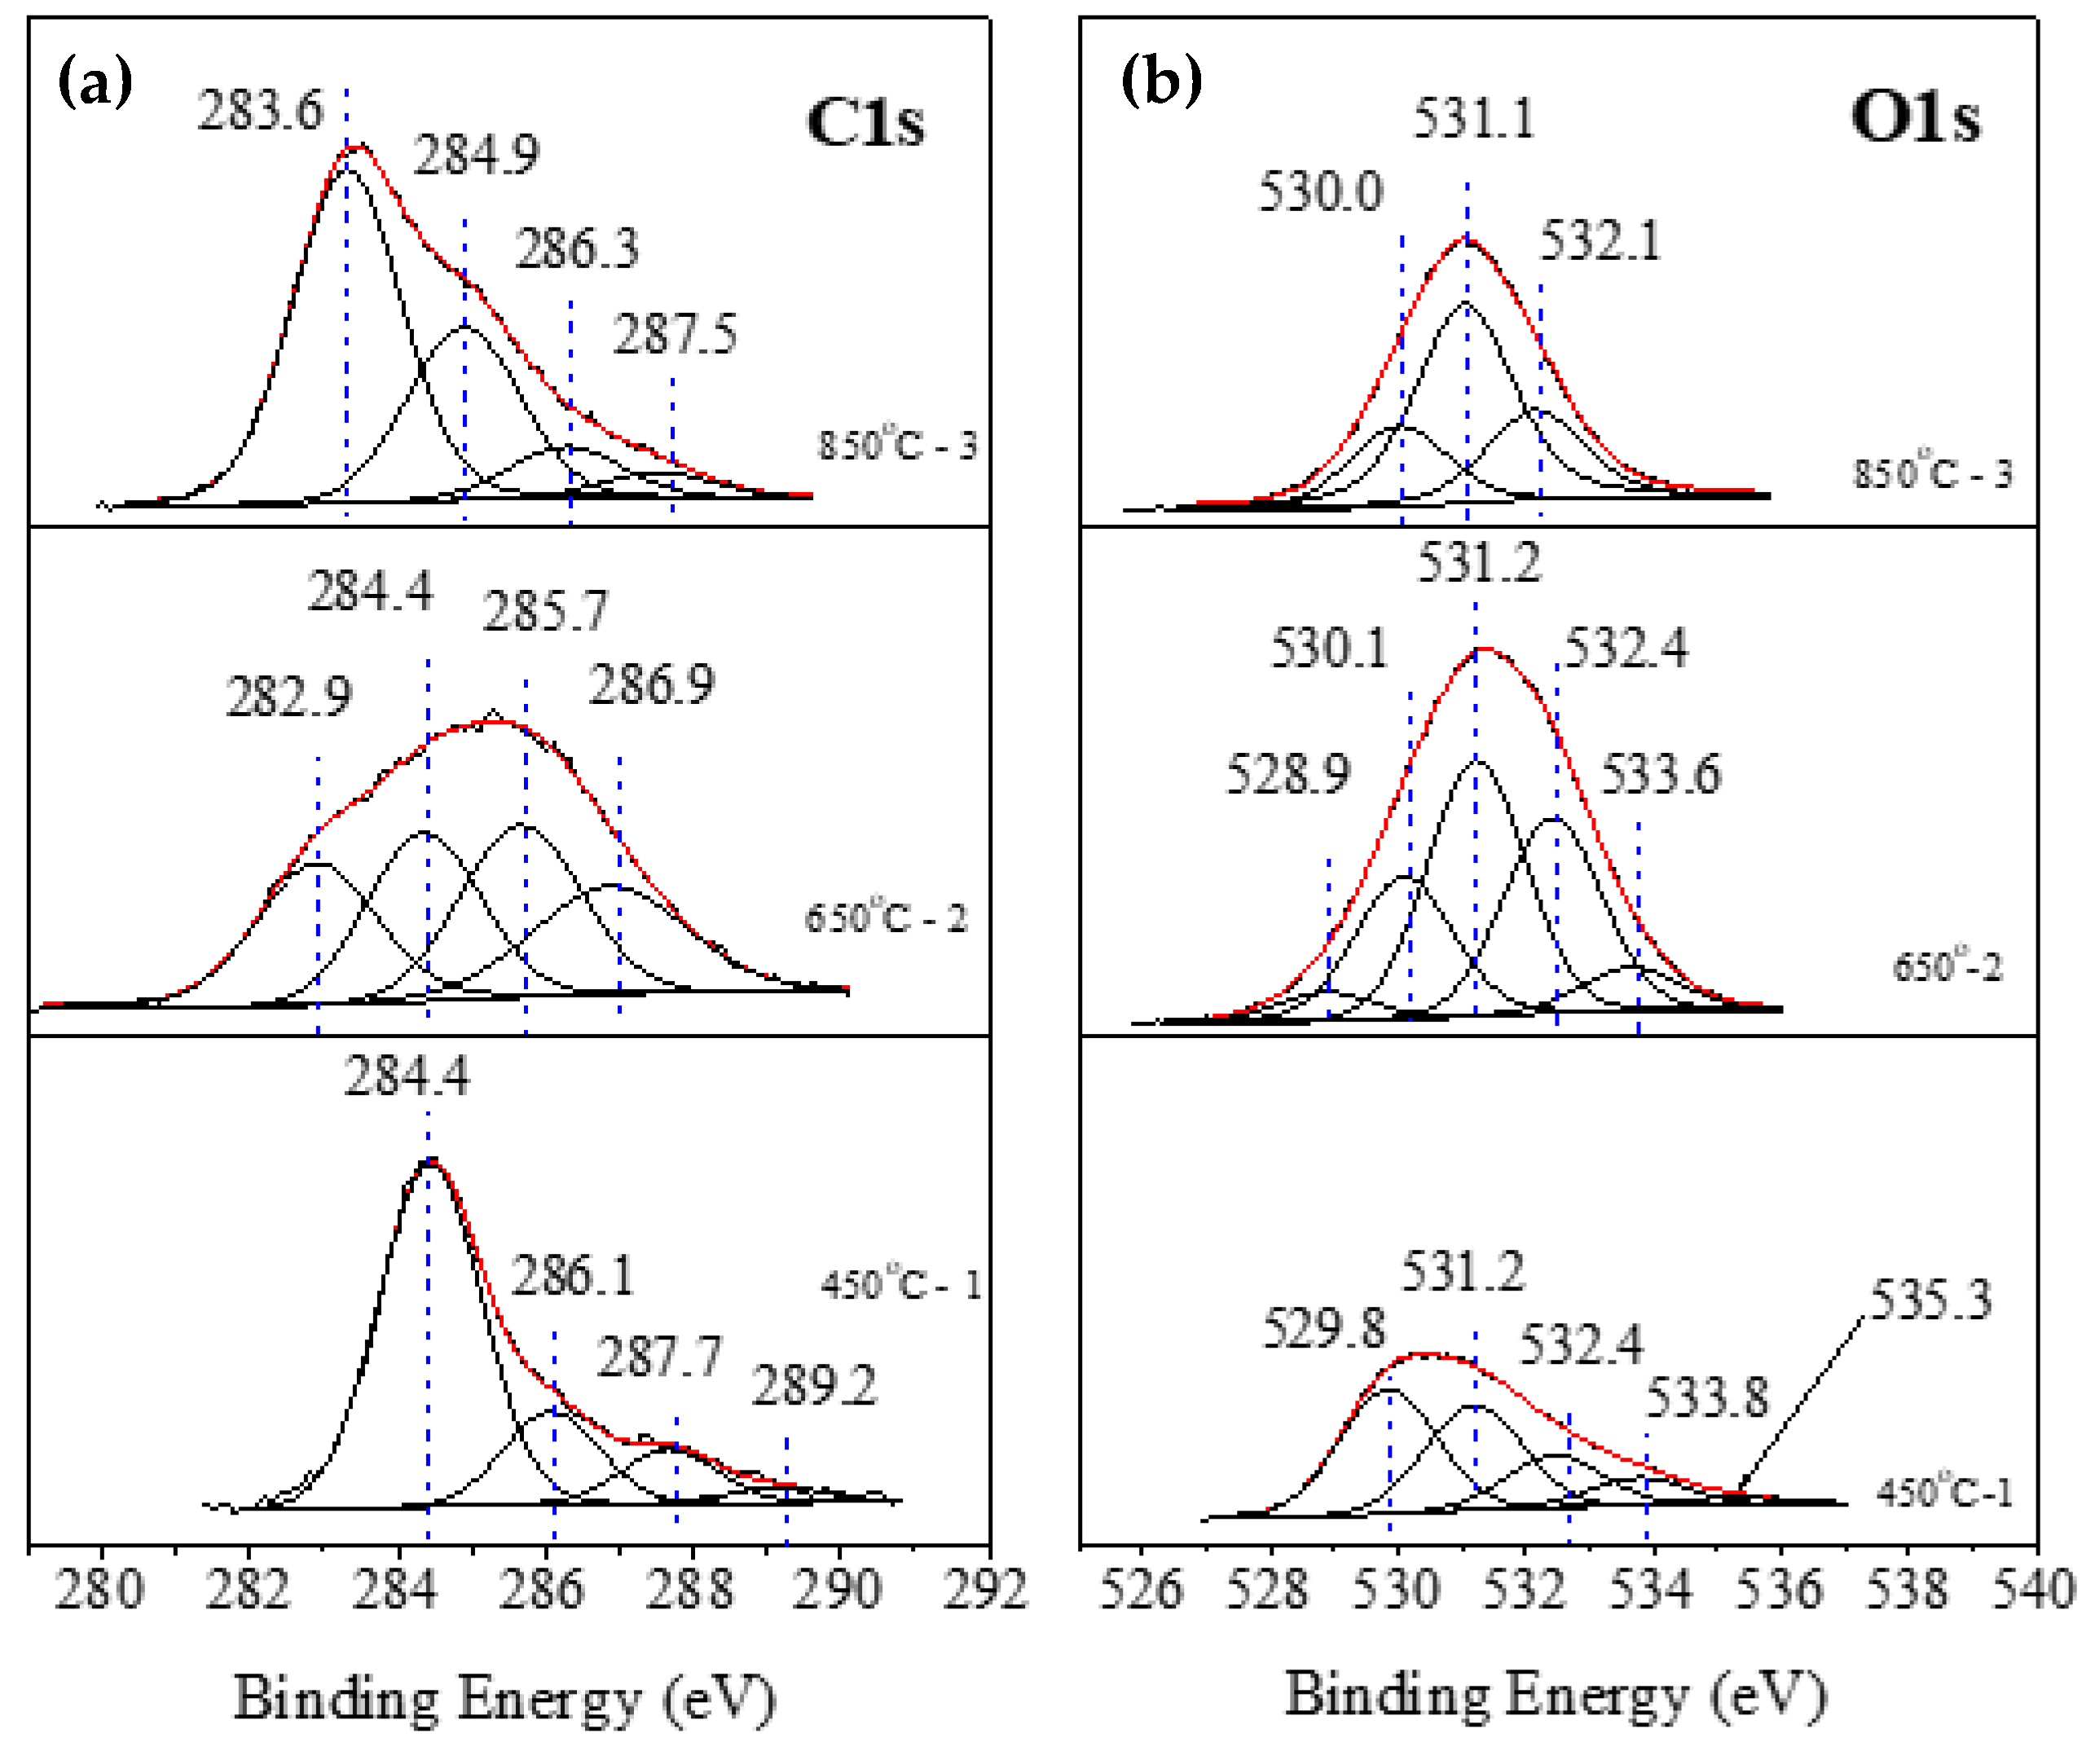
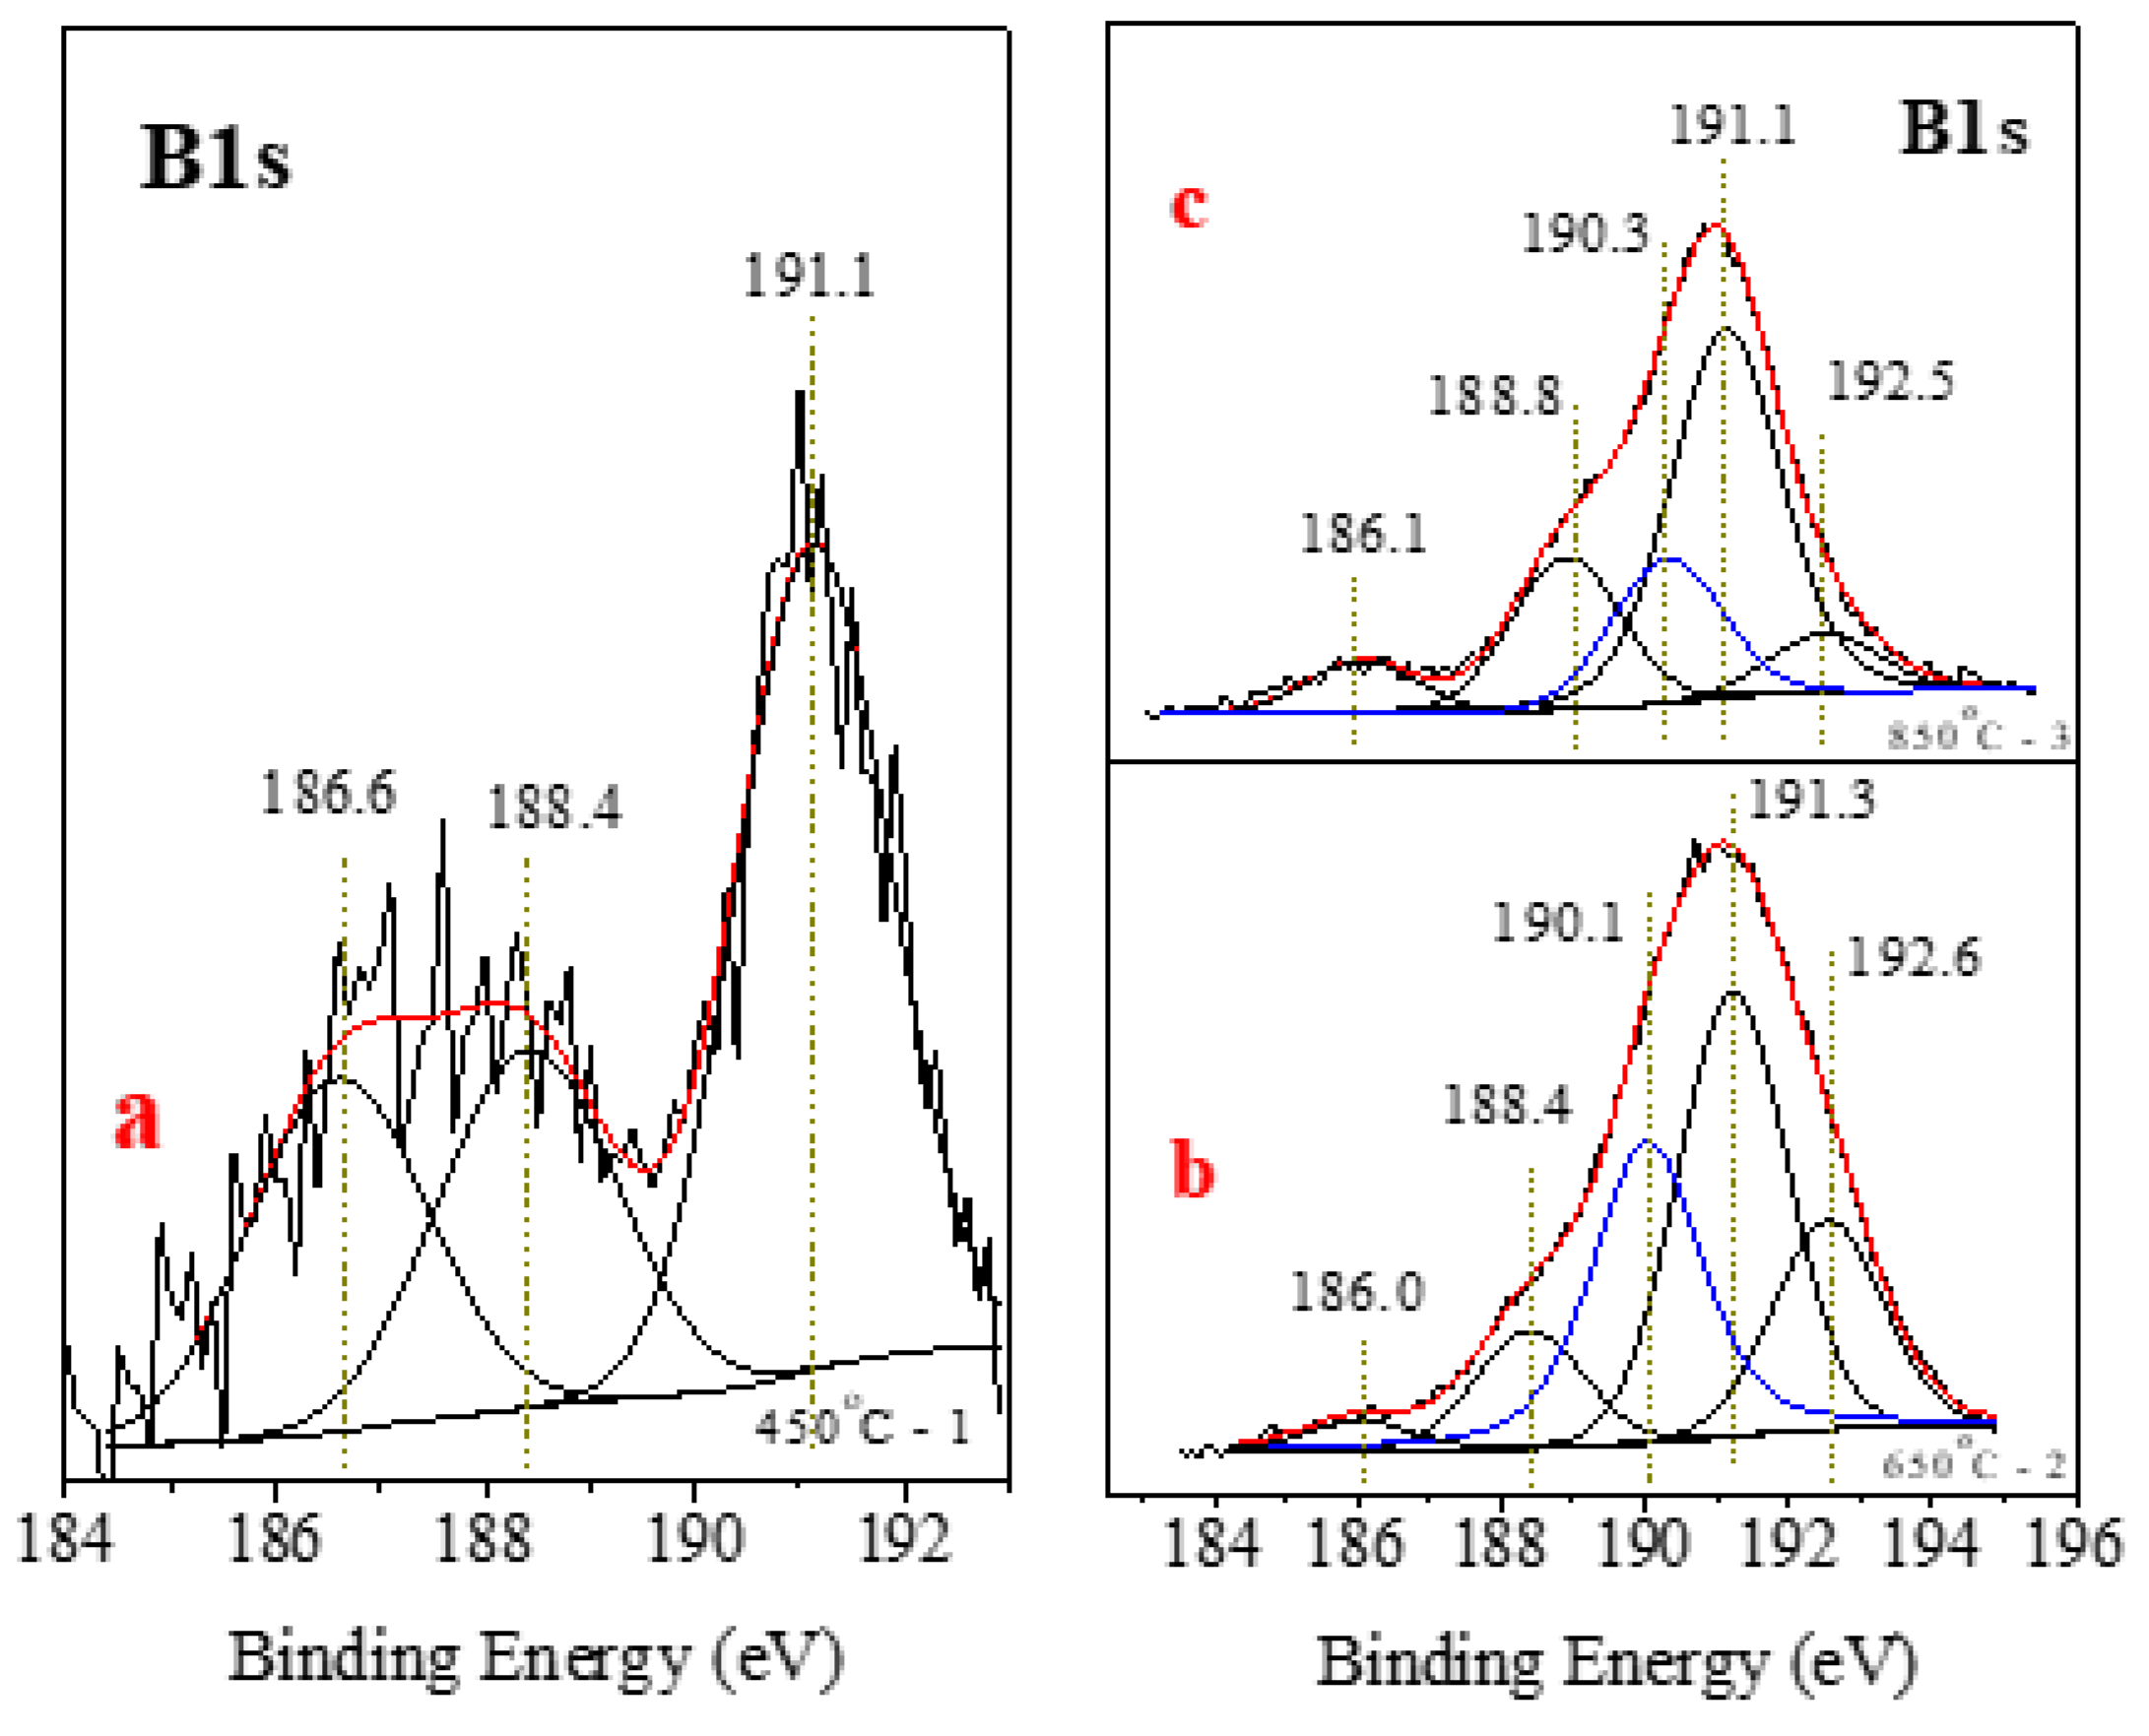
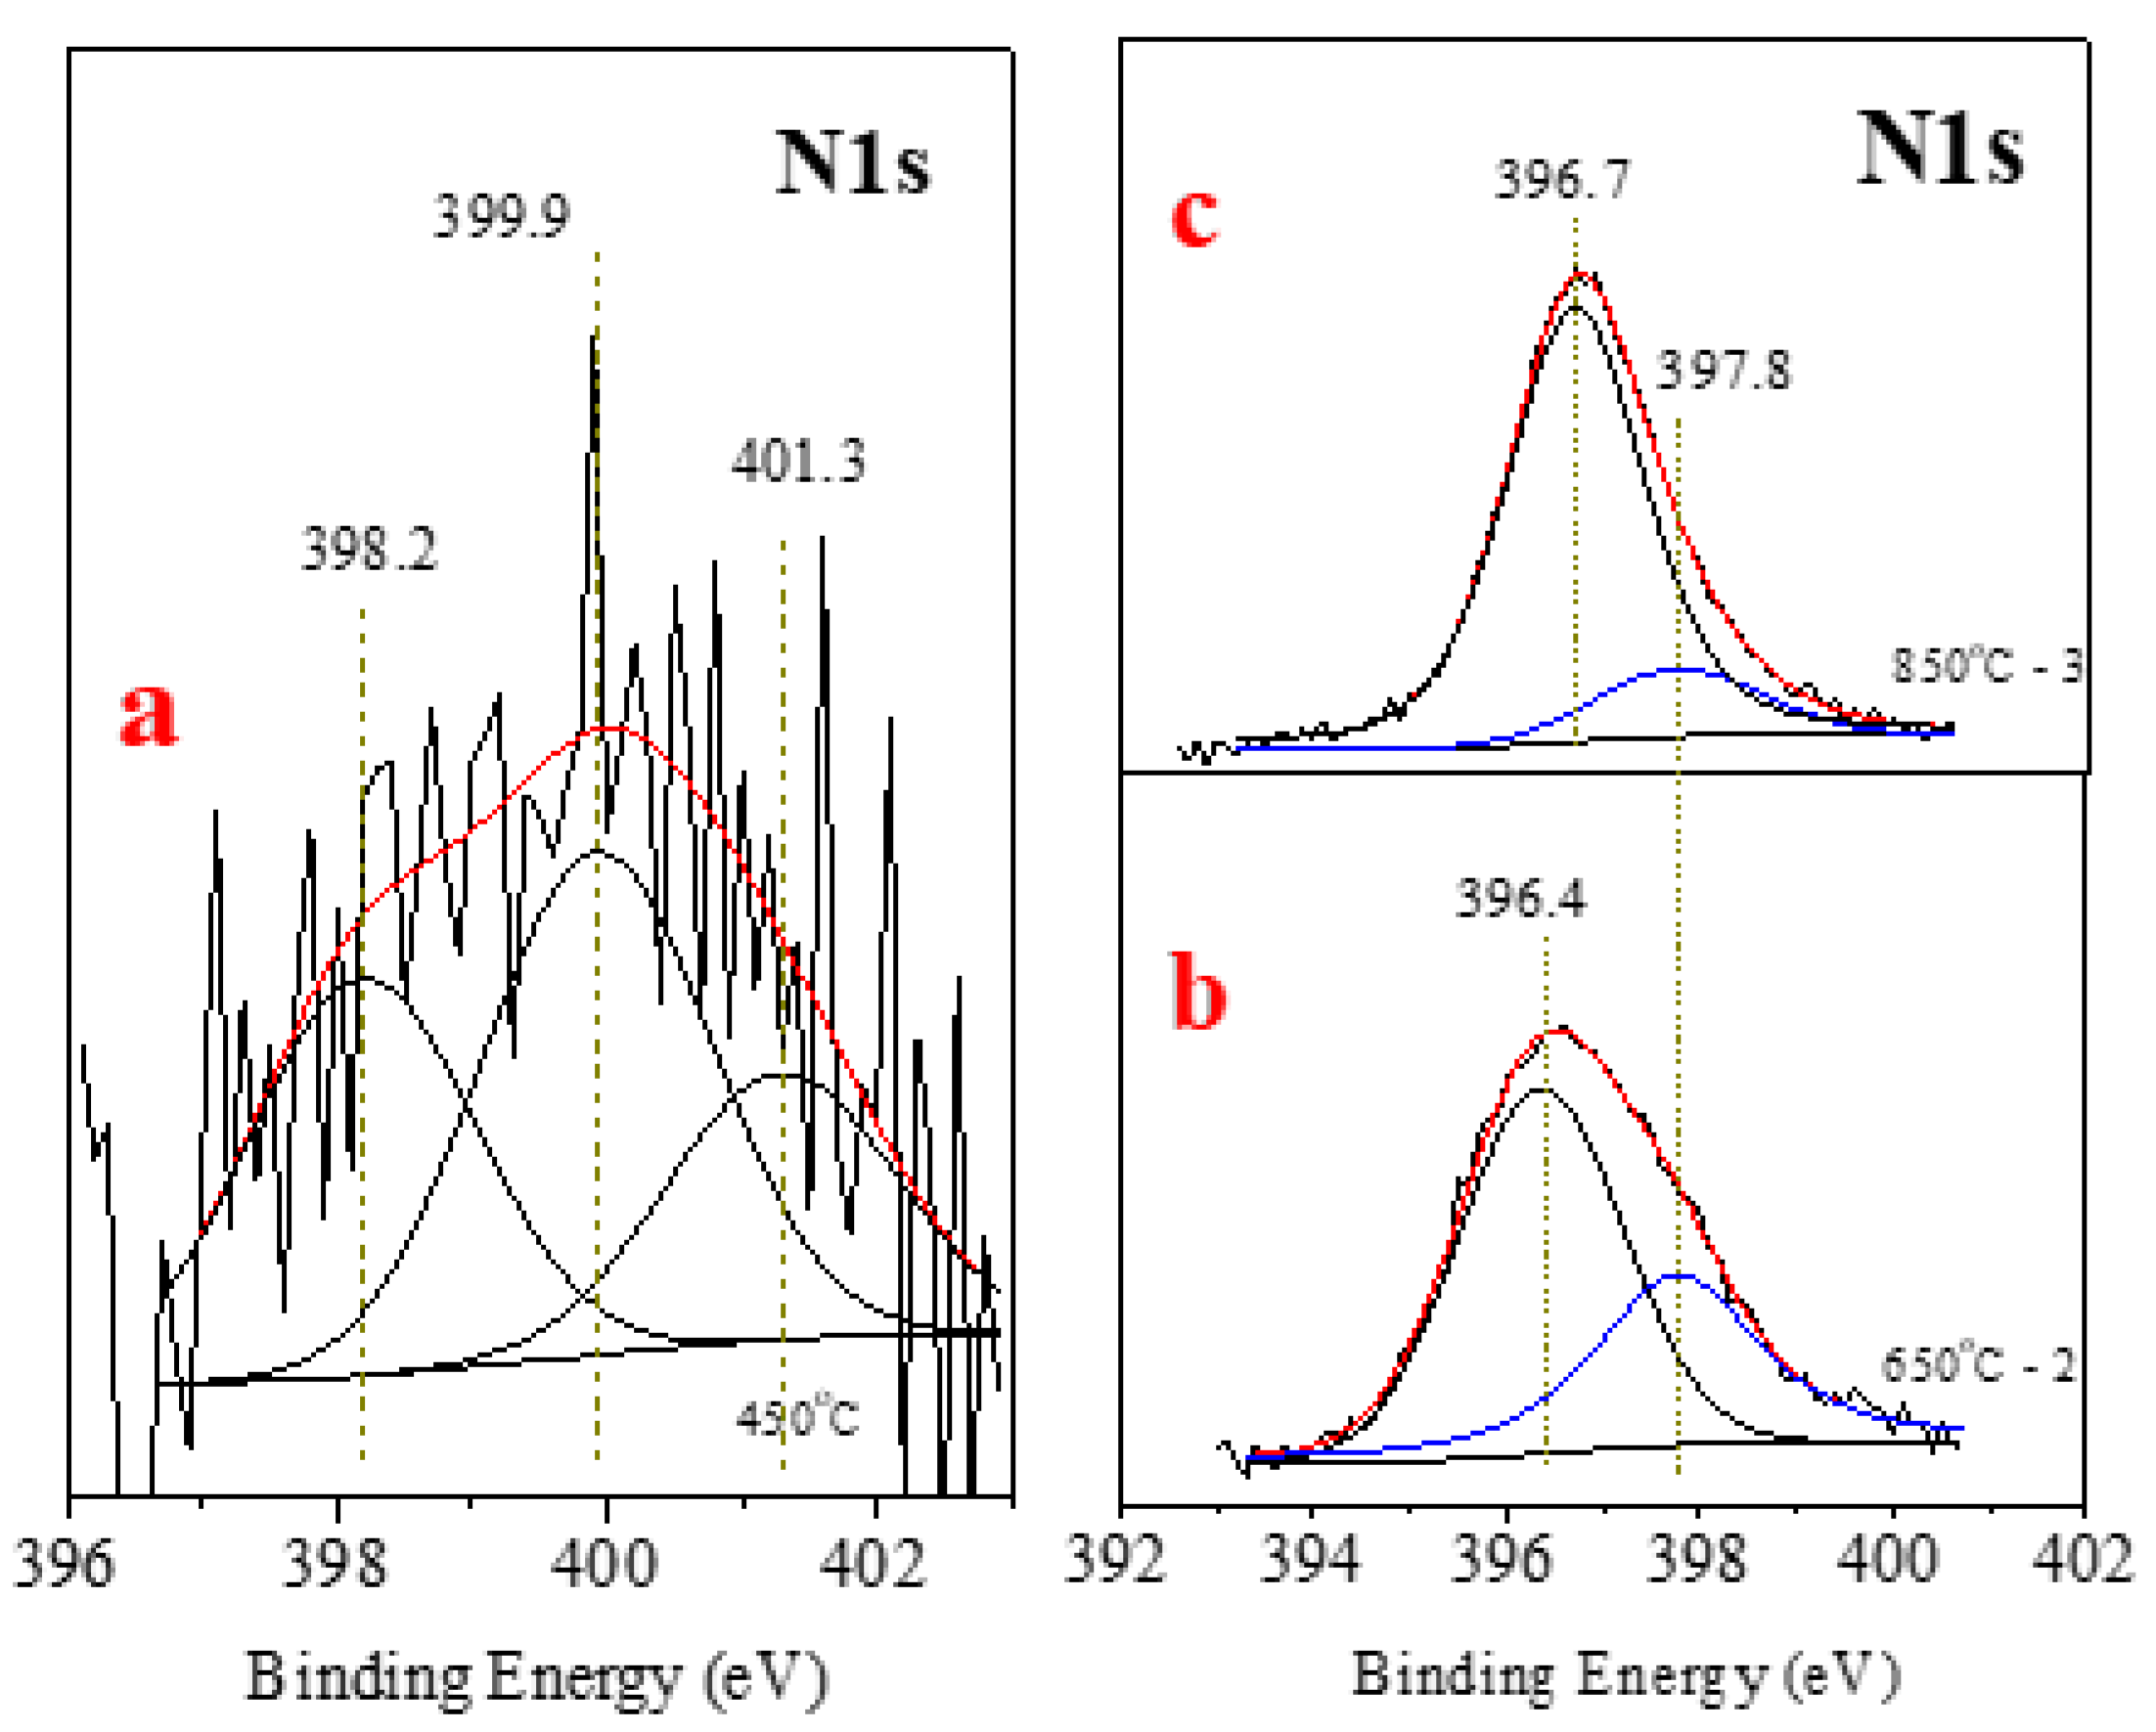
3.4. XPS Analysis
3.5. Friction Coefficient (FC) Measurements
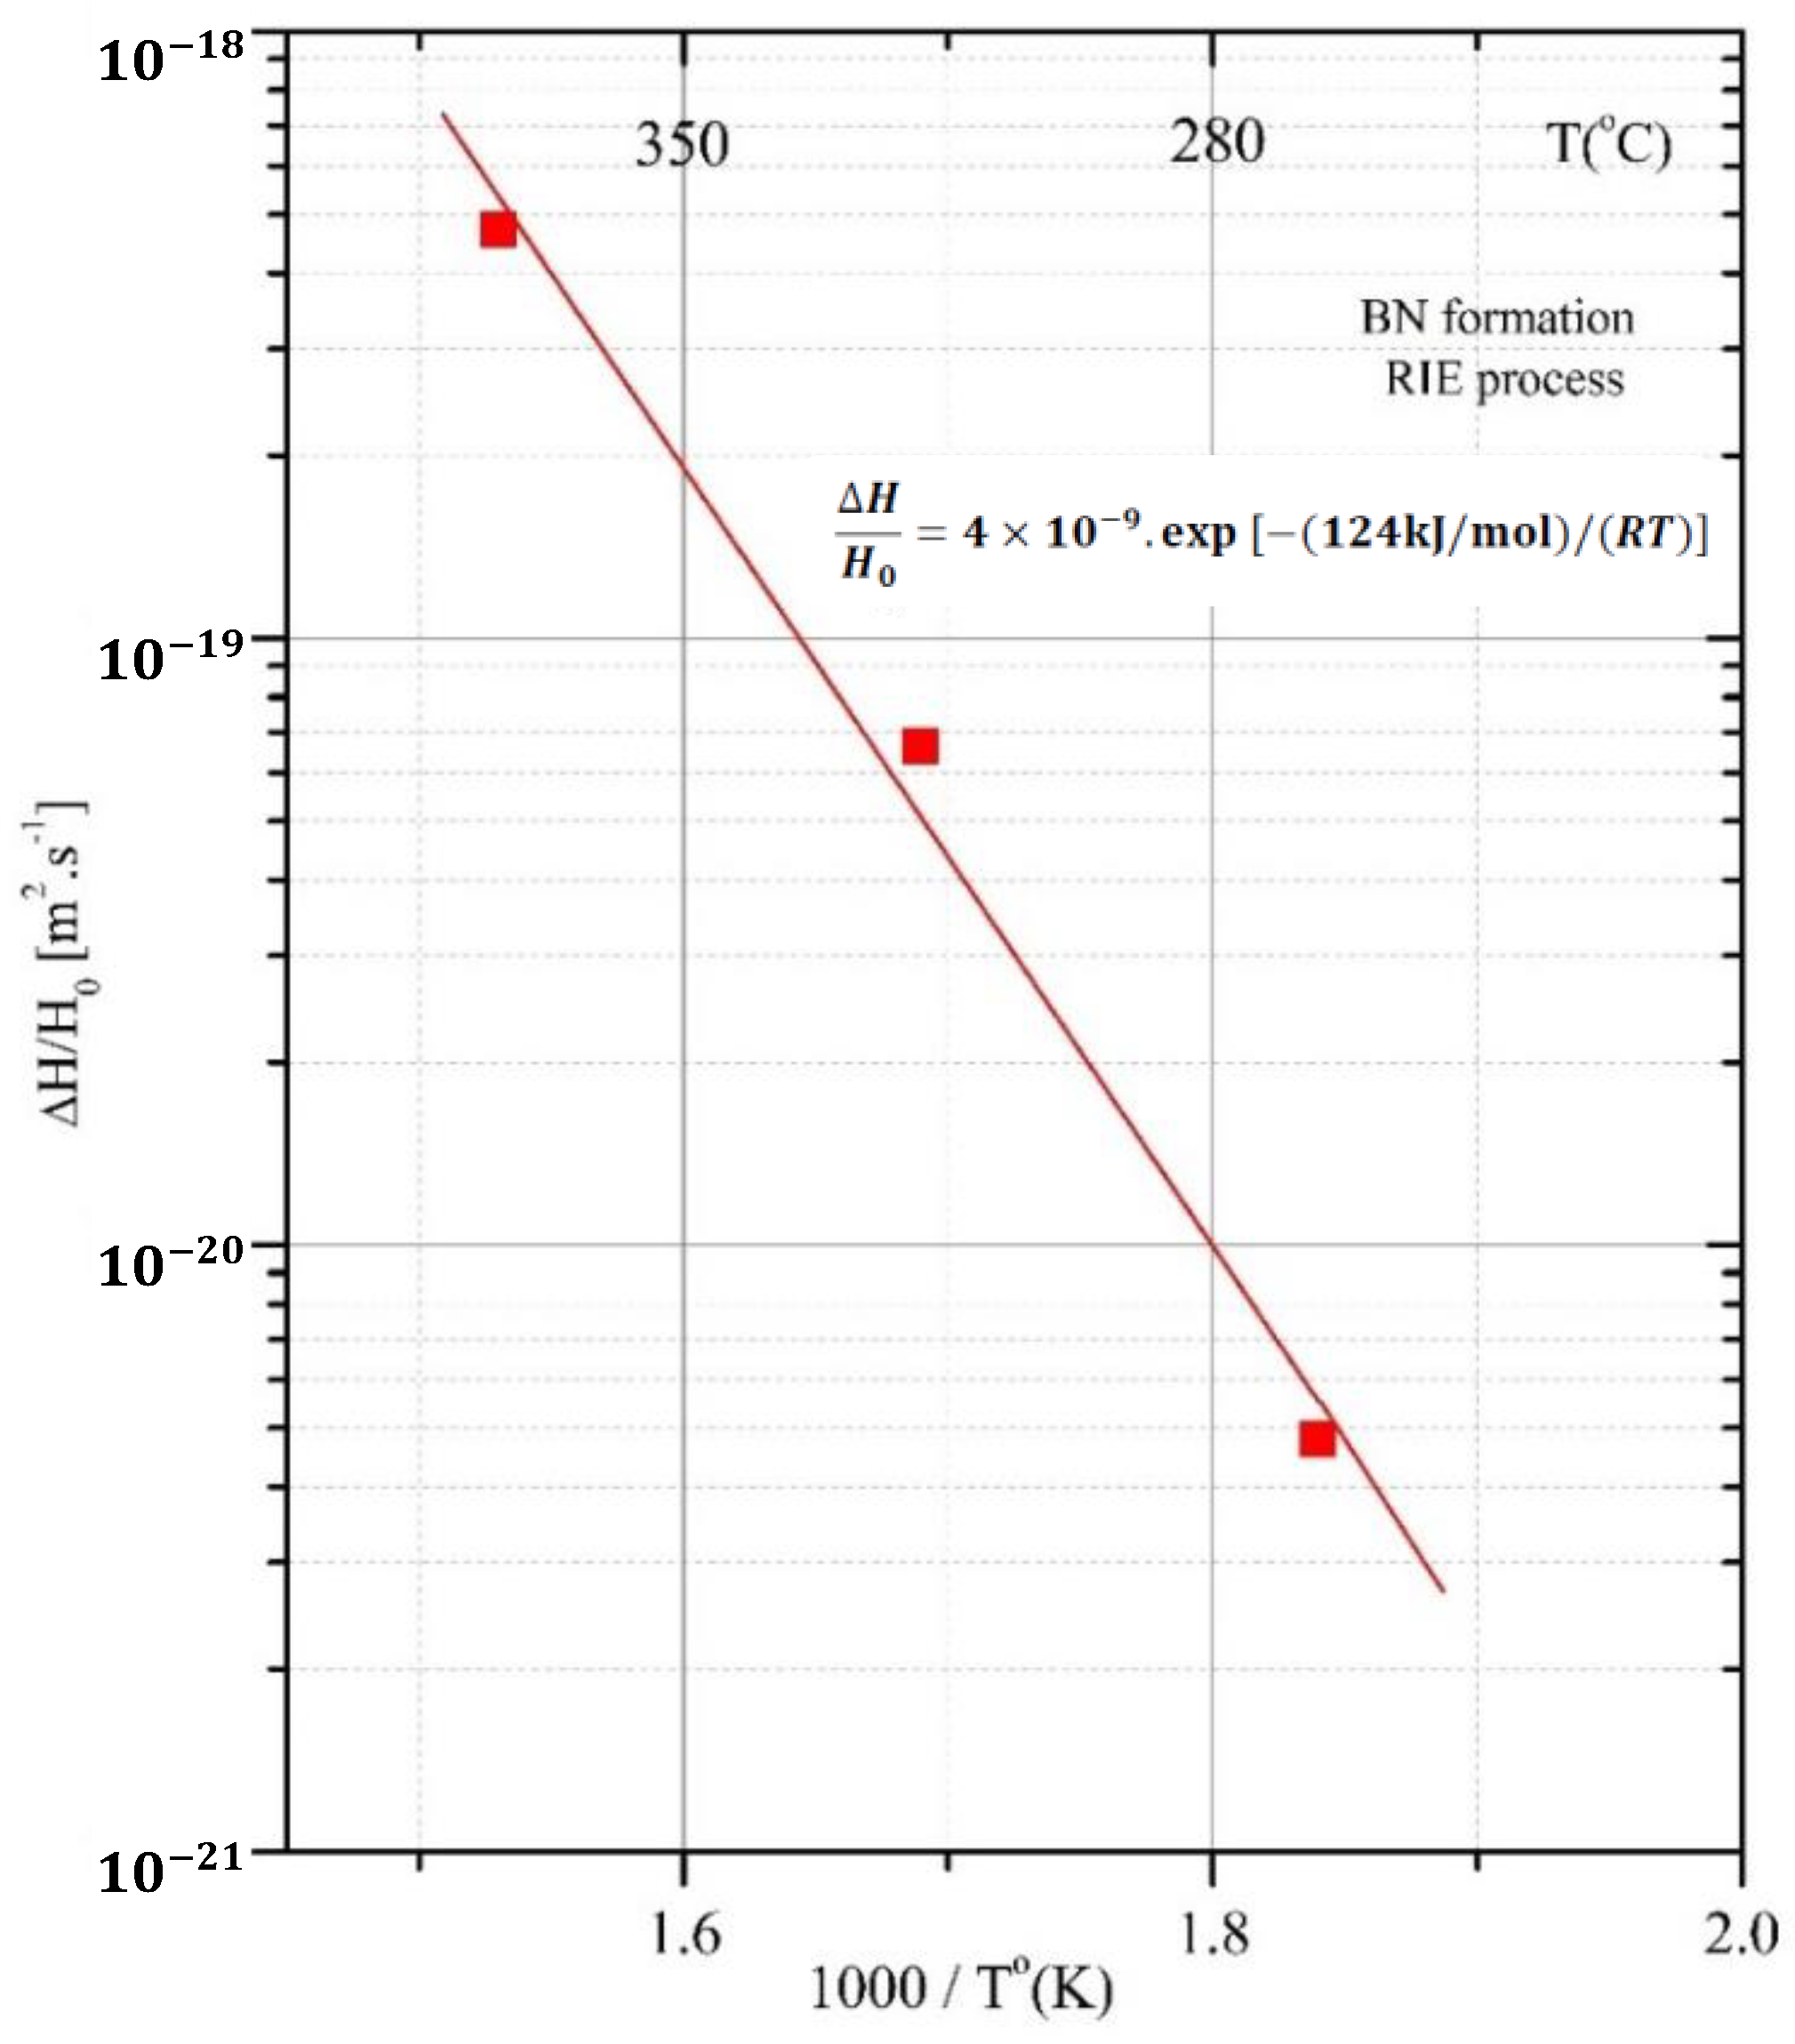
3.6. Growth Dynamics of the BN Phases
4. Conclusions
Author Contributions
Funding
Institutional Review Board Statement
Informed Consent Statement
Data Availability Statement
Conflicts of Interest
References
- De Barros’Bouchet, M.I.; Martin, J.M.; Le-Mogne, T.; Vacher, B. Boundary lubrication mechanisms of carbon coatings by MoDTC and ZDDP additives. Tribol. Int. 2005, 38, 257–264. [Google Scholar] [CrossRef]
- Guha, S.; Das, S.; Bandyopadhyay, A.; Das, S.; Swain, B.P. Investigation of structural network and mechanical properties of Titanium silicon nitride (TiSiN) thin films. J. Alloys Compd. 2018, 731, 347–353. [Google Scholar] [CrossRef]
- Zubar, T.; Fedosyuk, V.; Tishkevich, D.; Kanafyev, O.; Astapovich, K.; Kozlovskiy, A.; Trukhanov, A. The Effect of Heat Treatment on the Microstructure and Mechanical Properties of 2D Nanostructured Au/NiFe System. Nanomaterials 2020, 10, 1077. [Google Scholar] [CrossRef] [PubMed]
- Matović, J.; Luković, M.; Nikolić, B.; Babić, N.; Stanković, B.; Jokić, B.; Jelenković, B. Synthesis and characterization of nanocrystalline hexagonal boron nitride powders: XRD and luminescence properties. Ceram. Int. 2016, 42, 16655–16658. [Google Scholar] [CrossRef]
- Watanabe, K.; Taniguchi, T.; Niiyama, T.; Miya, K.; Taniguchi, M. Far-ultraviolet plane-emission handheld device based on hexagonal boron nitride. Nat. Photonics 2009, 3, 591–594. [Google Scholar] [CrossRef]
- Chkhartishvili, L. Correlation between surface specific area and particles average size: Hexagonal boron nitride nano-powders. Nano Stud. 2012, 6, 56–76. [Google Scholar]
- Chong, Y.M.; Ye, Q.; Yang, Y.; Zhang, W.J.; Bello, I.; Lee, S.T. Tribological study of boron nitride films. Diam. Relat. Mater. 2010, 19, 654–660. [Google Scholar] [CrossRef]
- Cassabois, G.; Valvin, P.; Gil, B. Hexagonal boron nitride is an indirect bandgap semiconductor. Nat. Photonics 2016, 10, 262–266. [Google Scholar] [CrossRef] [Green Version]
- Song, L.; Ci, L.; Lu, H.; Sorokin, P.B.; Jin, C.; Ni, J.; Kvashnin, A.G.; Kvashnin, D.G.; Lou, J.; Yakobson, B.I.; et al. Large Scale Growth and Characterization of Atomic Hexagonal Boron Nitride Layers. Nano Lett. 2010, 10, 3209–3215. [Google Scholar] [CrossRef]
- Liu, Z.; Gong, Y.; Zhou, W.; Ma, L.; Yu, J.; Idrobo, J.C.; Jung, J.; MacDonald, A.H.; Vajtai, R.; Lou, J.; et al. Ultrathin high-temperature oxidation-resistant coatings of hexagonal boron nitride. Nat. Commun. 2013, 4, 1–8. [Google Scholar] [CrossRef]
- Jo, I.; Pettes, M.T.; Kim, J.; Watanabe, K.; Taniguchi, T.; Yao, Z.; Shi, L. Thermal Conductivity and Phonon Transport in Suspended Few-Layer Hexagonal Boron Nitride. Nano Lett. 2013, 13, 550–554. [Google Scholar] [CrossRef] [Green Version]
- Zhu, S.; Cheng, J.; Qiao, Z.; Yang, J. High temperature solid-lubricating materials: A review. Tribol. Int. 2018, 133, 206–223. [Google Scholar] [CrossRef]
- Kimura, Y.; Wakabayashi, T.; Okada, K.; Wada, T.; Nishikawa, H. Boron nitride as a lubricant additive. Wear 1999, 232, 199–206. [Google Scholar] [CrossRef]
- Singh, M.; Vasudev, H.; Kumar, R. Microstructural characterization of BN thin films using RF magnetron sputtering method. Mater. Today Proc. 2020, 26, 2277–2282. [Google Scholar] [CrossRef]
- Zhao, J.; Shrotriya, P. Ultrahard Polycrystalline Cubic Boron Nitride Composite through Hybrid Laser/Waterjet Heat (LWH) Treatment. Procedia Manuf. 2016, 5, 747–760. [Google Scholar] [CrossRef] [Green Version]
- Jiménez, I.; Torres, R.; Caretti, I.; Gago, R.; Albella, J.M. A review of monolithic and multilayer coatings within the boron–carbon–nitrogen system by ion-beam-assisted deposition. J. Mater. Res. 2012, 27, 743–764. [Google Scholar] [CrossRef]
- Mirkarimi, P.B.; McCarty, K.F.; Medlin, D.L. Review of advances in cubic boron nitride film synthesis. Mater. Sci. Eng. R. Rep. 1997, 21, 47–100. [Google Scholar] [CrossRef] [Green Version]
- Ortner, H.M.; Ettmayer, P.; Kolaska, H.; Smid, I. The history of the technological progress of hardmetals. Int. J. Refract. Met. Hard Mater. 2015, 49, 3–8. [Google Scholar] [CrossRef]
- Zhang, W.J.; Chong, Y.M.; Bello, I.; Lee, S.T. Nucleation, growth and characterization of cubic boron nitride (c-BN) films. J. Phys. D Appl. Phys. 2007, 40, 6159–6174. [Google Scholar] [CrossRef]
- Audronis, M.; Valiulis, A.V.; Silickas, P. Recent developments in the deposition of c-BN coatings (ISSN 1392–1320). Mater. Sci. 2004, 10, 152–156. [Google Scholar]
- Cetin, B.; Kaplan, H.; Durkaya, G. A new generation, promising engineering material: Cubic boron nitride (c-BN), Hittite. J. Sci. Eng. 2015, 2, 85–90. [Google Scholar] [CrossRef]
- Efeoğlu, I.; Totik, Y.; Keleş, A.; Ersoy, K.; Durkaya, G. Synthesis and investigation of structural-mechanical-tribological properties of c-BN based BN thin films. Boron 2017, 2, 11–17. [Google Scholar]
- Soltani, A.; Talbi, A.; Mortet, V.; BenMoussa, A.; Zhang, W.J.; Gerbedoen, J.C.; de Jaeger, J.C.; Gokarna, A.; Haenen, K.; Wagner, P.; et al. Diamond and cubic boron nitride: Properties. Growth Appl. 2010, 1292, 191–196. [Google Scholar] [CrossRef] [Green Version]
- McKenzie, D.R. Generation and applications of compressive stress induced by low energy ion beam bombardment. J. Vac. Sci. Technol. B 1993, 11, 1928–1935. [Google Scholar] [CrossRef]
- Robertson, J. Deposition mechanism of cubic boron nitride. Diam. Relat. Mater. 1996, 5, 519–524. [Google Scholar] [CrossRef]
- Deyneka, N.; Zhang, X.W.; Boyen, H.-G.; Ziemann, P.; Banhart, F. Growth of cubic boron nitride films on Si by ion beam assisted deposition at the high temperatures. Diam. Relat. Mater. 2004, 13, 473–481. [Google Scholar] [CrossRef]
- Armstrong, G., Jr.; André, P.; Marcilene, G.; Mariana, F.; Rodrigo, P.; Douglas, L.; Gilberto, P.; Adailton, N.; Heberton, W.; Walter, M.; et al. Black TiO2 Thin Films Production Using Hollow Cathode Hydrogen Plasma Treatment: Synthesis, Material Characteristics and Photocatalytic Activity. Catalysts 2020, 10, 282. [Google Scholar] [CrossRef] [Green Version]
- Bárdoš, L. Radio frequency hollow cathodes for the plasma processing technology. Surf. Coat. Technol. 1996, 86, 648–656. [Google Scholar] [CrossRef]
- Little, P.F. The Hollow-Cathode Effect and the Theory of Glow Discharges. Proc. R. Soc. A Math. Phys. Eng. Sci. 1954, 224, 209–227. [Google Scholar] [CrossRef]
- Sivkov, D.; Petrova, O.; Mingaleva, A.; Ob’edkov, A.; Kaverin, B.; Gusev, S.; Vilkov, I.; Isaenko, S.; Bogachuk, D.; Skandakov, R.; et al. The Structure and Chemical Composition of the Cr and Fe Pyrolytic Coatings on the MWCNTs’ Surface According to NEXAFS and XPS Spectroscopy. Nanomaterials 2020, 10, 374. [Google Scholar] [CrossRef] [Green Version]
- Tian, Q.; Huang, N.; Yang, B.; Zhuang, H.; Wang, C.; Zhai, Z.; Li, J.; Jia, X.; Liu, L.; Jiang, X. Diamond/β-SiC film as adhesion-enhanced interlayer for top diamond coatings on cemented tungsten carbide substrate. J. Mater. Sci. Technol. 2017, 33, 1097–1106. [Google Scholar] [CrossRef]
- Stankovich, S.; Dikin, D.A.; Piner, R.D.; Kohlhaas, K.A.; Kleinhammes, A.; Jia, Y.; Wu, Y.; Nguyen, S.-B.T.; Ruoff, R.S. Synthesis of graphene-based nanosheets via chemical reduction of exfoliated graphite oxide. Carbon 2007, 45, 1558–1565. [Google Scholar] [CrossRef]
- Chen, X.; Wang, X.; Fang, D. A review on C1s XPS-spectra for some kinds of carbon materials. Fuller. Nanotub. Carbon Nanostructures 2020, 28, 1048–1058. [Google Scholar] [CrossRef]
- Das, S.K.; Dickinson, C.; Lafir, F.; Brougham, D.F.; Marsili, E. Synthesis, Characterization and Catalytic Activity of Gold Nanoparticles Biosynthesized with Rhizopus oryzae Protein Extract. Green Chem. 2012, 14, 1322–1334. [Google Scholar] [CrossRef]
- Yang, D.; Velamakanni, A.; Bozoklu, G.; Park, S.; Stoller, M.; Piner, R.D.; Stankovich, S.; Jung, I.; Field, D.A.; Ventrice, C.A., Jr.; et al. Chemical analysis of graphene oxide films after heat and chemical treatments by X-ray photoelectron and Micro-Raman spectroscopy. Carbon 2009, 47, 145–152. [Google Scholar] [CrossRef]
- Grosvenor, A.P.; Kobe, B.A.; McIntyre, N.S. Examination of the oxidation of iron by oxygen using X-ray photoelectron spectroscopy and QUASESTM. Surf. Sci. 2004, 565, 151–162. [Google Scholar] [CrossRef]
- Wu, Y.; Lin, Y.; Xu, J. Synthesis of Ag-Ho, Ag-Sm, Ag-Zn, Ag-Cu, Ag-Cs, Ag-Zr, Ag-Er, Ag-Y and Ag-Co metal organic nanoparticles for UV-Vis-NIR wide-range bio-tissue imaging. Photochem. Photobiol. Sci. 2019, 18, 1081–1091. [Google Scholar] [CrossRef]
- de Chathura Alwis, T.R.; Leftwich, P.; Mukherjee, A.; Denofre, K.A. Perrine, Spontaneous Selective Deposition of Iron Oxide Nanoparticles on Graphite. Nanoscale Adv. 2019, 1, 4729–4744. [Google Scholar] [CrossRef] [Green Version]
- Lee, J.; Kim, T.; Ryu, S.U.; Choi, K.; Ahn, G.; Paik, J.; Ryu, B.; Park, T.; Won, Y. Study on the Aging Mechanism of Boron Potassium Nitrate (BKNO3) for Sustainable Efficiency in Pyrotechnic Mechanical Devices. Sci. Rep. 2018, 8, 11745. [Google Scholar] [CrossRef] [Green Version]
- Wagner, C.D.; Moulder, J.F.; Davis, L.E.; Riggs, W.M. Handbook of X-ray Photoelectron Spectroscopy; Perking-Elmer Corporation: Eden Prairie, MN, USA, 1992. [Google Scholar]
- Tai, J.; Hu, J.; Chen, Z.; Lu, H. Two-step synthesis of boron and nitrogen co-doped graphene as synergistically enhanced catalyst for oxygen reduction reaction. RSC Adv. 2014, 4, 61437–61443. [Google Scholar] [CrossRef]
- Li, J.; Huang, Y.; Liua, Z.; Zhang, J.; Liua, X.; Luo, H.; Ma, Y.; Xu, X.; Lu, Y.; Lin, J.; et al. Chemical Activation of Boron Nitride Fibers for Improved Cationic Dye Removal Performance. J. Mater. Chem. A 2015, 3, 8185–8193. [Google Scholar] [CrossRef]
- Kavita; Kuntail, J.; Verma, D.K.; Kumar, B.; Singh, A.K.; Shukla, N.; Sinha, I.; Rastogi, R.B. Theoretical and experimental studies of pyranopyrazoles and their tribological compatibility with a borate ester. Colloids Surf. A 2020, 606, 125497. [Google Scholar] [CrossRef]
- Hellgren, N.; Haasch, R.T.; Schmidt, S.; Hultman, L.; Petrov, I. Interpretation of X-ray photoelectron spectra of carbon-nitride thin films: New insights from in situ XPS. Carbon 2016, 108, 242–252. [Google Scholar] [CrossRef]
- Kondo, T.; Casolo, S.; Suzuki, T.; Shikano, T.; Sakurai, M.; Harada, Y.; Saito, M.; Oshima, M.; Trioni, M.I.; Tantardini, G.-F.; et al. Atomic-scale characterization of nitrogen-doped graphite: Effects of dopant nitrogen on the local electronic structure of the surrounding carbon atoms. Phys. Rev. B 2012, 86, 035436. [Google Scholar] [CrossRef] [Green Version]
- Gammon, W.J.; Kraft, O.; Reilly, A.C.; Holloway, B.C. Experimental comparison of N(1s) X-ray photoelectron spectroscopy binding energies of hard and elastic amorphous carbon nitride films with reference organic compounds. Carbon 2003, 41, 1917–1923. [Google Scholar] [CrossRef]
- Torres, J.; Perry, C.C.; Bransfield, S.J.; Fairbrother, D.H. Low-Temperature Oxidation of Nitrided Iron Surfaces. J. Phys. Chem. B 2003, 107, 5558–5567. [Google Scholar] [CrossRef]
- Zubar, T.I.; Fedosyuk, V.M.; Tishkevich, D.I.; Panasyuk, M.I.; Kanafyev, O.D.; Kozlovskiy, A.; Zdorovets, M.; Michels, D.; Lyakhov, D.; Trukhanov, A.V. Mechanisms of elastoplastic deformation and their effect on hardness of nanogranular Ni-Fe coatings. Int. J. Mech. Sci. 2022, 215, 10695. [Google Scholar] [CrossRef]
- Kuznetsova, T.A.; Zubar, T.I.; Lapitskaya, V.A.; Sudzilovskaya, K.A.; Chizhik, S.A.; Uglov, V.V.; Kvasov, N.T. Mechanical Properties of Thin AlSiN Films, Studied by Nanoindentation, as a Thermal-Stability Criterion. J. Surf. Investig. X-ray Synchrotron Neutron. Tech. 2019, 13, 408–411. [Google Scholar] [CrossRef]
- Lian, J.; Garay, J.E.; Wang, J. Grain size and grain boundary effects on the mechanical behavior of fully stabilized zirconia investigated by nanoindentation. Scr. Mater. 2007, 56, 1095–1098. [Google Scholar] [CrossRef]
- Huang, P.-K.; Yeh, J.-W. Effects of substrate bias on structure and mechanical properties of (AlCrNbSiTiV)N coatings. J. Phys. D Appl. Phys. 2009, 42, 115401. [Google Scholar] [CrossRef]
- Kavanagh, K.L.; Magee, C.W.; Sheets, J.; Mayer, J.M. The interdiffusion of Si, P, and In at polysilicon/GaAs interfaces. Appl. Phys. B 1988, 64, 1845–1854. [Google Scholar] [CrossRef]
- Oliver, W.C.; Pharr, G.M. An improved technique for determining hardness and elastic modulus using load and displacement sensing indentation experiments. J. Mater. Res. 1992, 7, 1564–1583. [Google Scholar] [CrossRef]
- Ohring, M. Engineering Materials Science; Academic Press Inc.: San Diego, CA, USA, 1995. [Google Scholar]
- Grigorov, K.G.; Grigorov, G.I.; Stoyanova, M.; Vignes, J.L.; Langeron, J.P.; Denjean, P.; Perriere, J. Diffusion of silicon in titanium nitride films. Efficiency of TiN barrier layers. Appl. Phys. A 1992, 55, 502–504. [Google Scholar] [CrossRef]
- Khalil, S.; Swaminathan, N.; Shrader, D.; Heim, A.J.; Morgan, D.D.; Szlufarska, I. Diffusion of Ag along 3 grain boundaries in 3C-SiC. Phys. Rev. B 2011, 84, 214104. [Google Scholar] [CrossRef] [Green Version]
- Hackl, H.G.; Popovska, N.; Gerhard, H. Kinetics and film properties of Boron Nitride derived from Trimethoxyborane/Ammonia by CVD. Chem. Vap. Depos. 2004, 10, 325–330. [Google Scholar] [CrossRef]
 —iron carbide (C3Fe7); *—iron-boride phase, Fe2B.
—iron carbide (C3Fe7); *—iron-boride phase, Fe2B.
—iron carbide (C3Fe7); *—iron-boride phase, Fe2B.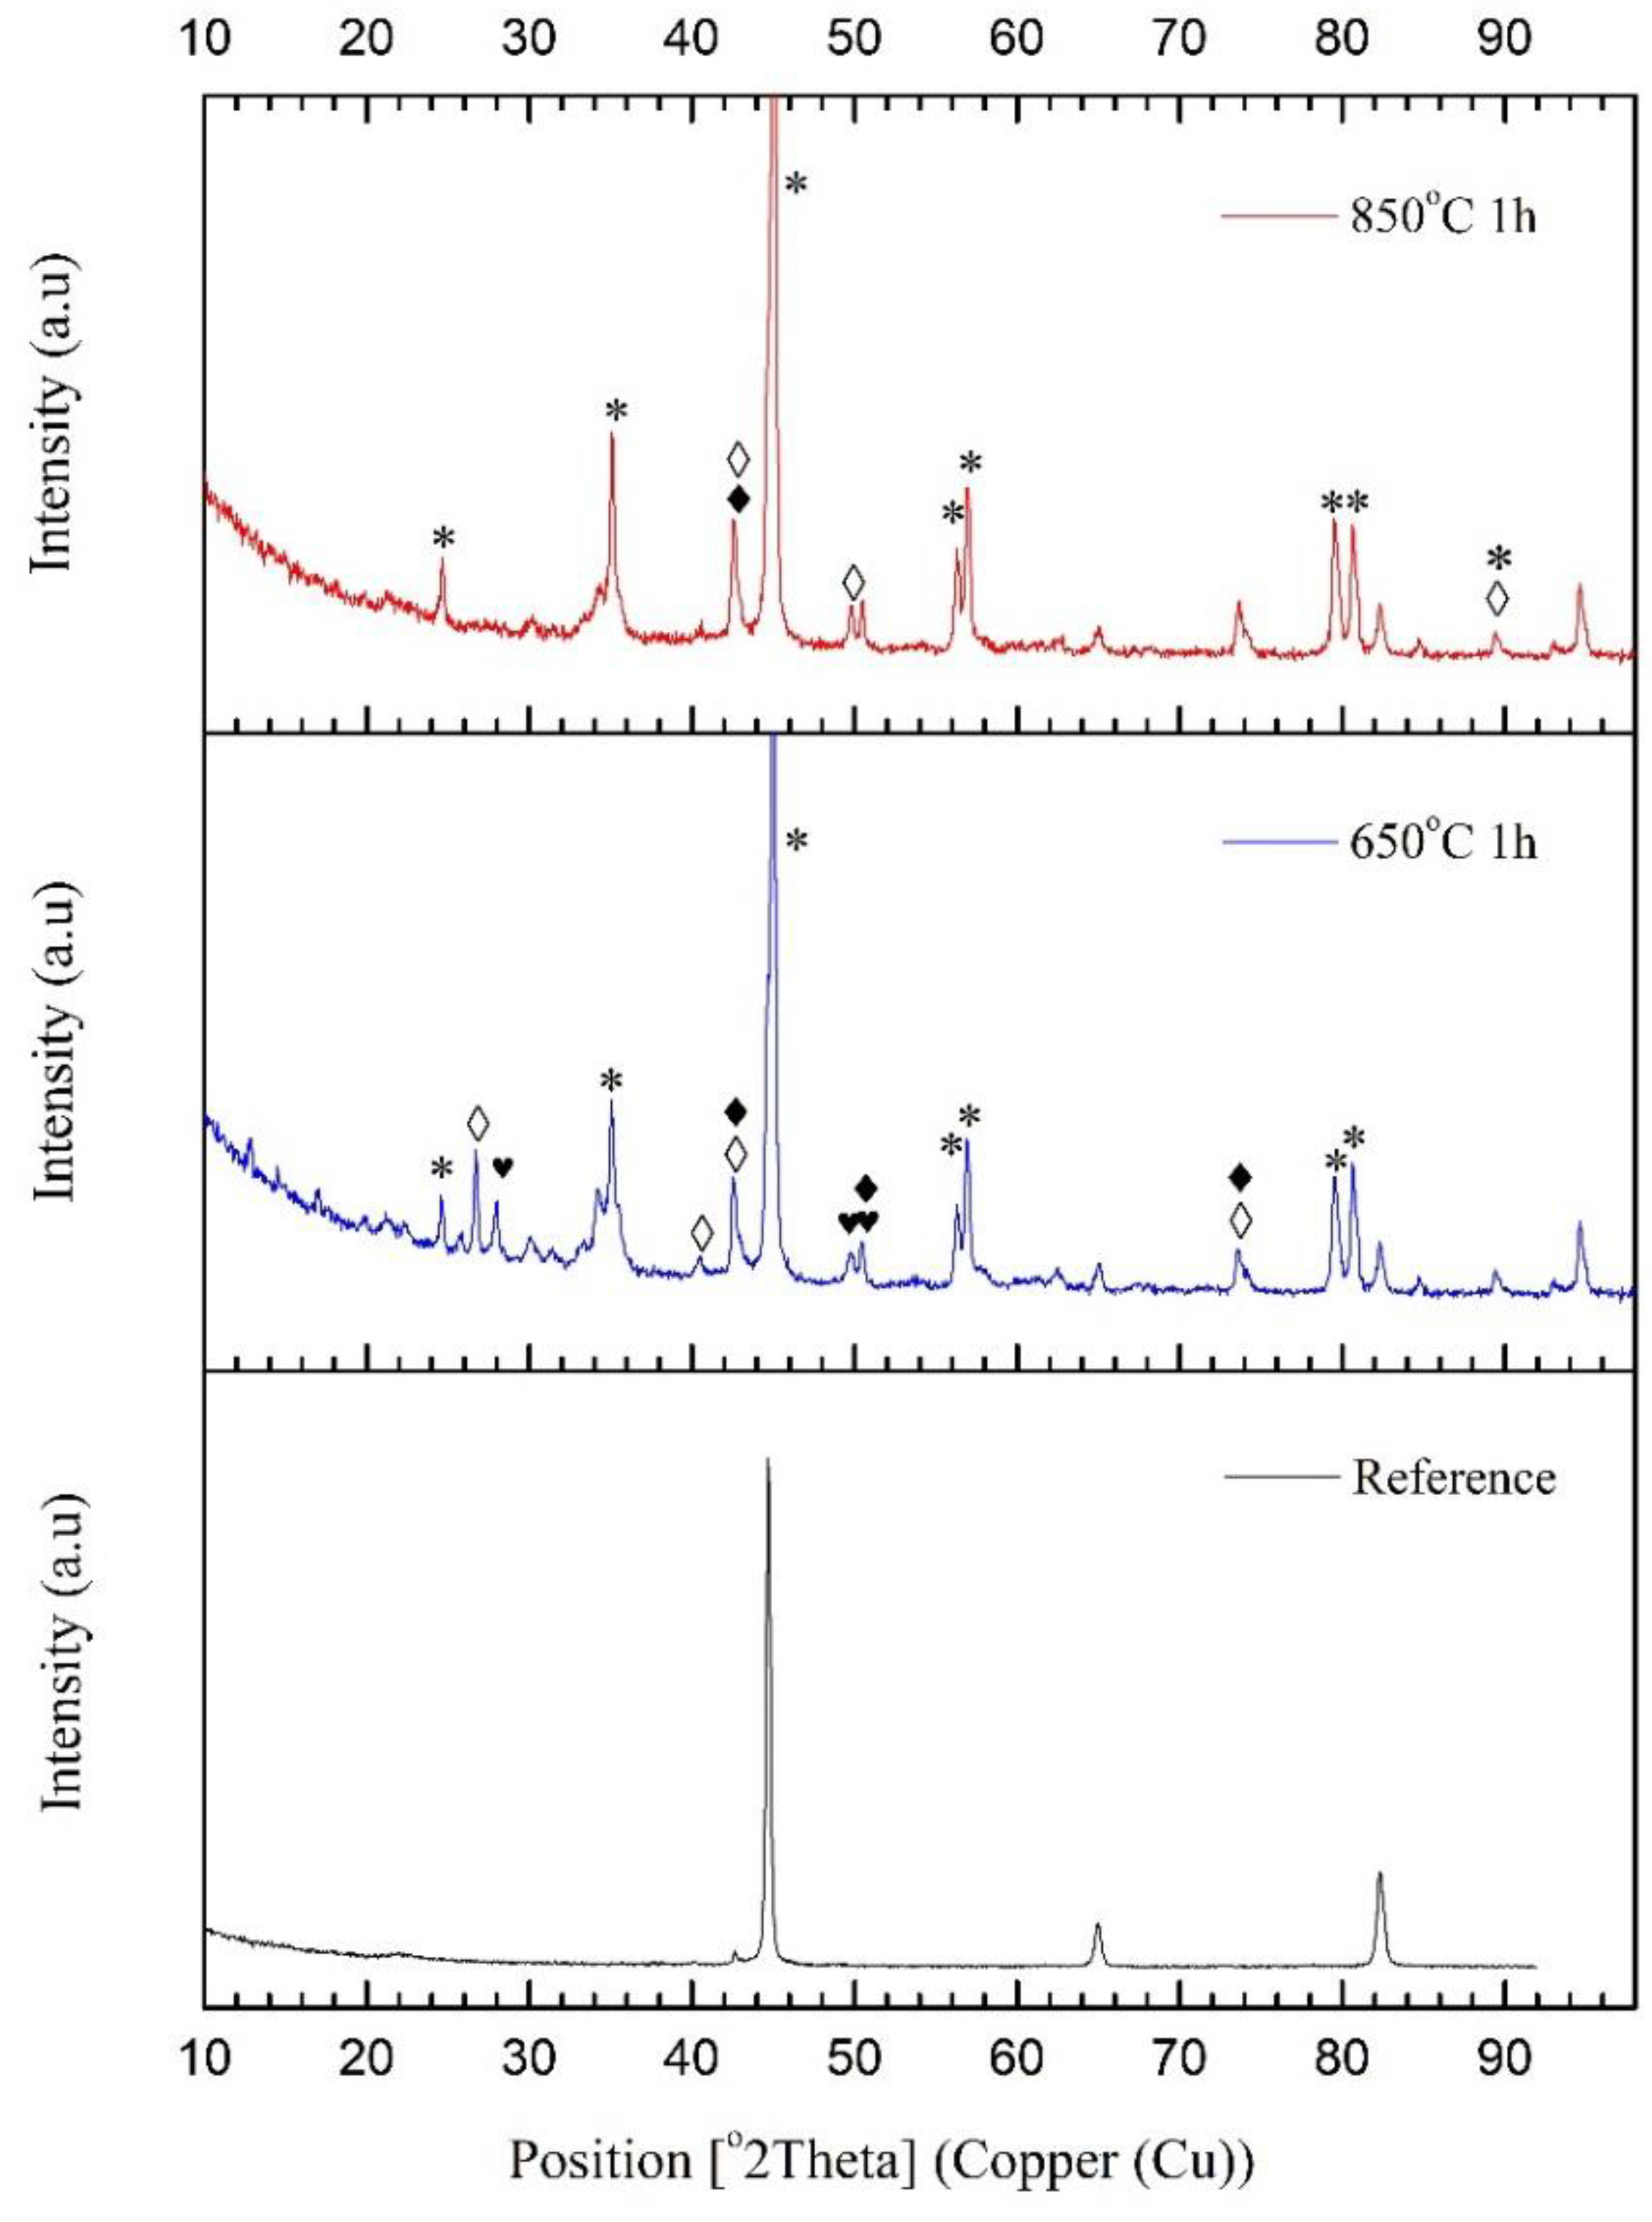


| Point/Sample | B | O | Na | Mg | Si | K | Fe |
|---|---|---|---|---|---|---|---|
| 2/2 | 0 | 33.17 | 0 | 1.9 | 0 | 0 | 64.93 |
| 3/2 | 38.67 | 37.39 | 1.02 | 1.87 | 0.41 | 0.2 | 20.43 |
| 4/2 | 46.92 | 33.1 | 0.77 | 1.57 | 0.38 | 0.16 | 17.12 |
| 7/3 | 33.67 | 45.78 | 0.55 | 1.18 | 0.54 | 0.11 | 18.18 |
| 8/3 | 0 | 48.82 | 0 | 1.61 | 0 | 0 | 49.56 |
| 9/3 | 36.27 | 42.7 | 0.93 | 1.41 | 1 | 0.06 | 17.62 |
| Sample | C (at. %) | O (at. %) | N (at. %) | B (at. %) | Fe (at. %) | Na (at. %) |
|---|---|---|---|---|---|---|
| 1/450 °C | 52.6 | 32.5 | 1.8 | 9.1 | 4.2 | 0.0 |
| 2/650 °C | 23.4 | 45.5 | 4.6 | 24.1 | 1.1 | 1.1 |
| 3/850 °C | 30.1 | 39.2 | 5.2 | 23.3 | 1.0 | 1.2 |
| Sample | Peak Position [BE] | Integrated Area [a.u] | Part of the Whole Spectrum in % | Type of Phase |
|---|---|---|---|---|
| 1–450 °C | 186.6 | 124.1 | 24.8 | BC |
| 188.4 | 125.5 | 25.1 | Fe2B, FeB | |
| 191.1 | 250.1 | 50.1 | Organic B | |
| 2–650 °C | 186.0 | 180.6 | 2.9 | B4C |
| 188.4 | 629.1 | 10.1 | Fe2B, FeB | |
| 190.0 | 1905.5 | 30.6 | BN | |
| 191.2 | 2376.8 | 38.2 | Organic B | |
| 192.6 | 1135.5 | 18.2 | Na2B4O7 · 10H2O | |
| 3–850 °C | 186.0 | 6.37 | 6.4 | B4C |
| 188.9 | 18.84 | 18.8 | Fe2B, FeB | |
| 190.3 | 17.95 | 18.0 | BN | |
| 191.1 | 49.63 | 49.6 | Organic B | |
| 192.5 | 7.20 | 7.2 | Na2B4O7 · 10H2O |
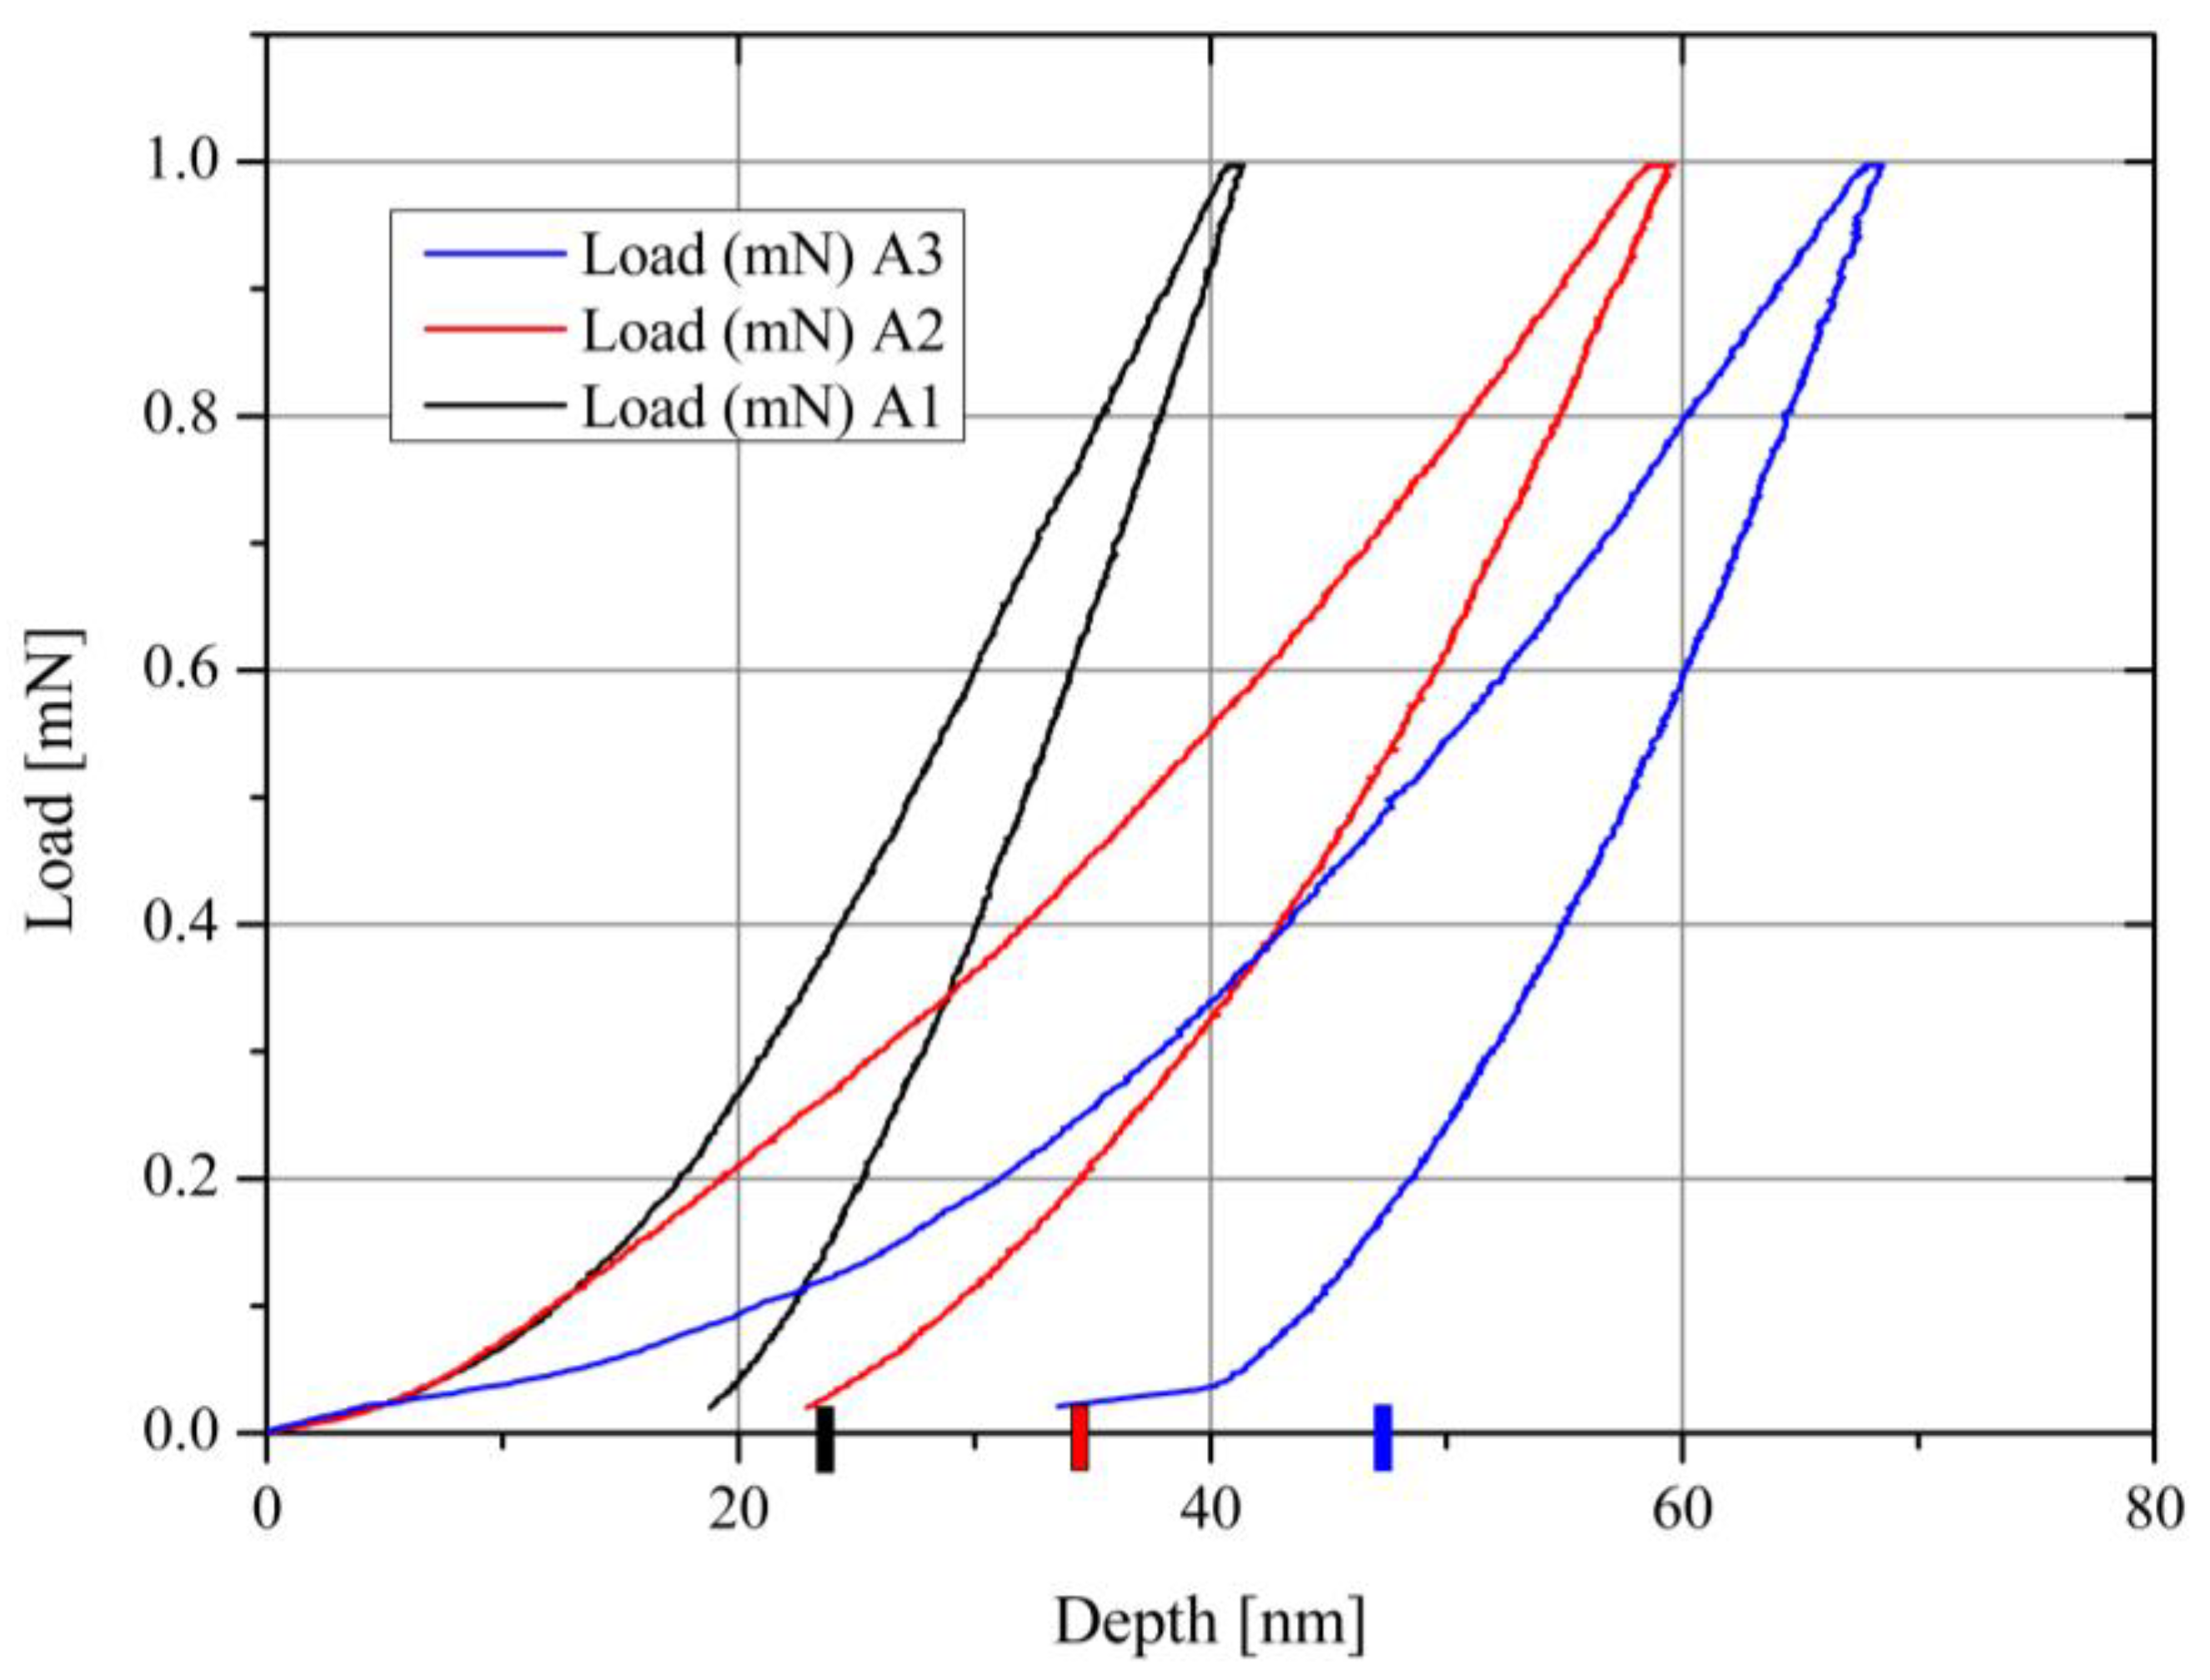
| Sample | Temp [°C] | Depth [nm] | ΔH/Ho | erfc−1 | D [m2s−1] |
|---|---|---|---|---|---|
| A1 | 450 | 22.8 | 0.437 | 0.509 | 3.6 × 10⁻²⁰ |
| A2 | 650 | 32.8 | 0.579 | 0.392 | 7.44 × 10⁻²⁰ |
| A3 | 850 | 46.8 | 0.729 | 0.243 | 1.52 × 10⁻¹⁹ |
| Sample | Power [W] | Ubias [V] | Temp [°C] | Depth [nm] | ΔH/Ho | erfc−1 | D [m2s−1] |
|---|---|---|---|---|---|---|---|
| A100 | 100 | 210 | 270 | 3.4 | −0.19 | 5.89 | 4.8 × 10⁻²¹ |
| A200 | 200 | 310 | 320 | 12.6 | −0.044 | 2.09 | 6.65 × 10⁻²⁰ |
| A300 | 300 | 380 | 380 | 33.6 | 0.11 | 1.13 | 4.7 × 10⁻¹⁹ |
| T °C/100 | x | 0 | 4.5 | 6.5 | 8.5 | 0 | 0 | 0 |
| Pol (eV)/100 | y | 0 | 0 | 0 | 0 | 2.1 | 3.1 | 4.5 |
| H(GPa) | z | 5.39 | 7.94 | 8.51 | 9.32 | 4.62 | 5.79 | 6.35 |
Publisher’s Note: MDPI stays neutral with regard to jurisdictional claims in published maps and institutional affiliations. |
© 2022 by the authors. Licensee MDPI, Basel, Switzerland. This article is an open access article distributed under the terms and conditions of the Creative Commons Attribution (CC BY) license (https://creativecommons.org/licenses/by/4.0/).
Share and Cite
Monezi, C.A.; Grigorov, K.G.; Tsanev, A.; Godoy, A., Jr.; Couto, A.A.; Lima, A.O.; Avdeev, G.; Iankov, R.; Massi, M. Synthesis and Characterization of Nanocrystalline Boron-Nitride Thin Films by Ion Milling and Thermal Treatment for Tribological Coatings: An Approach to Quantifying the Growth Dynamic Process. Materials 2022, 15, 1761. https://doi.org/10.3390/ma15051761
Monezi CA, Grigorov KG, Tsanev A, Godoy A Jr., Couto AA, Lima AO, Avdeev G, Iankov R, Massi M. Synthesis and Characterization of Nanocrystalline Boron-Nitride Thin Films by Ion Milling and Thermal Treatment for Tribological Coatings: An Approach to Quantifying the Growth Dynamic Process. Materials. 2022; 15(5):1761. https://doi.org/10.3390/ma15051761
Chicago/Turabian StyleMonezi, Carlos Alberto, Korneli Grigoriev Grigorov, Aleksandar Tsanev, Armstrong Godoy, Jr., Antonio Augusto Couto, Arnaldo Oliveira Lima, Georgi Avdeev, Roumen Iankov, and Marcos Massi. 2022. "Synthesis and Characterization of Nanocrystalline Boron-Nitride Thin Films by Ion Milling and Thermal Treatment for Tribological Coatings: An Approach to Quantifying the Growth Dynamic Process" Materials 15, no. 5: 1761. https://doi.org/10.3390/ma15051761
APA StyleMonezi, C. A., Grigorov, K. G., Tsanev, A., Godoy, A., Jr., Couto, A. A., Lima, A. O., Avdeev, G., Iankov, R., & Massi, M. (2022). Synthesis and Characterization of Nanocrystalline Boron-Nitride Thin Films by Ion Milling and Thermal Treatment for Tribological Coatings: An Approach to Quantifying the Growth Dynamic Process. Materials, 15(5), 1761. https://doi.org/10.3390/ma15051761