Abstract
The impermeable cover in urban area has been growing due to rapid urbanization, which prevents stormwater from being naturally infiltrated into the ground. There is a higher chance of flooding in urban area covered with conventional concretes and asphalts. The permeable pavement is one of Low-Impact Development (LID) technologies that can reduce surface runoff and water pollution by allowing stormwater into pavement systems. Unlike traditional pavements, permeable pavement bases employ open-graded aggregates (OGAs) with highly uniform particle sizes. There is very little information on the engineering properties of compacted OGAs. In this study, the moduli of open-graded aggregates under various compaction energies are investigated based on the Plate Load Test (PLT) and Light-Weight Deflectometer (LWD). Artificial Neural Network (ANN) and Linear Regression (LR) models are employed for estimation of the moduli of the aggregates based on the material type and level of compaction. Overall, the moduli from PLT and LWD steeply increase until the number of roller passes reaches 4, and they gradually increase until the number of roller passes becomes 8. A set of simple linear equations are proposed to evaluate the moduli of open-graded aggregates from PLT and LWD based on the material type and the number of roller passes.
1. Introduction
The rainfall pattern changes globally due to climate change, and therefore the rainfall can be much more intense than in the past. In addition, the impermeable cover in urban areas has been growing due to rapid urbanization [1,2]. Owing to climate change and urbanization, the cities suffer from heavier flood damages nowadays. Low-Impact Development (LID) is a design philosophy that can remedy these issues, often using surface-infiltrating stormwater facilities, and is being widely implemented worldwide [1,2,3,4,5]. The permeable pavements are one of the most popular LID technologies which can especially be well-applied in urban areas [6,7,8,9,10,11,12], which are implemented to not only low-traffic local roads but also high-traffic highways. Figure 1 shows typical sections of permeable pavements. Permeable pavements bring other benefits such as reducing the heat island phenomenon, leveling down traffic noise, and providing better skid resistance [9].
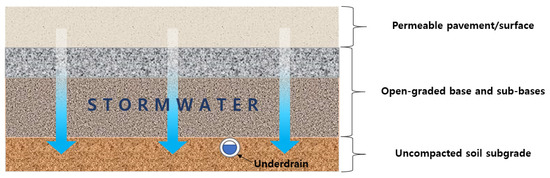
Figure 1.
Permeable pavements.
A permeable pavement has a surface layer that is in direct contact with the vehicle load. In addition, it has a base layer supporting the surface layer that disperses the vehicle load transmitted through the surface layer [6,8,10]. Compaction of this base layer during road construction plays a significant role in the stability and longevity of the pavement [13,14]. Therefore, proper compaction quality control of the base is essential for the construction of roads to ensure that they meet the required engineering specifications. However, a standard for the compaction quality control of open-graded aggregates (OGAs), which are used to construct base or sub-base layers of permeable pavements, has not been established, despite the increase in the applicability of permeable pavements [6,8,9,10,11,12]. In addition, the experimental study conducted in the lab environment does not necessarily reflect what would happen in the field. The magnitude of compaction energy and the way that the energy is delivered cannot be the same in the field and lab. In this study, the moduli of OGAs of various sizes under various compaction energies are investigated based on PLT (Plate Load Test) and LWD (Light-Weight Deflectometer). There have been very few experimental studies on the stiffness of open-grade aggregates in field conditions. Artificial Neural Network (ANN) and Linear Regression (LR) models are employed for estimation of the moduli of the aggregates based on the material type and level of compaction.
2. Field Modulus Evaluating Devices
In recent years, due to the implementation of mechanistic-empirical pavement design procedures (MEPDG) [15], modulus-based compaction specifications have been established [16], and many kinds of field modulus evaluating devices have been developed and used to evaluate the field compaction quality of pavement base layers [17]. These include test methods and devices such as PLT [18], LWD [19], soil stiffness gauge (SSG) [20], and dynamic cone penetrometer (DCP) [21].
Various studies regarding these devices or test methods have been conducted focusing on conventional road embankment construction materials. These studies have explored the feasibility of LWD, SSG, and DCP in compaction quality control during the construction based on laboratory or field experiments [13,14,17,22,23,24,25,26,27,28], investigated the variation of modulus in response to density or moisture content changes [24,26,27,28,29], compared modulus measurements from each device and suggested relationships between them [14,23,26], and investigated statistical limits of the measurements in construction quality assurance [30]. In this study, we coped with the modulus measurement data obtained from PLT and LWD tests.
The PLT is a test that evaluates the mechanical properties of the ground based on the relationship between the load and the settlement after applying a load through the rigid loading plate to the ground where the structure is installed. It is used to evaluate the stiffness of roads and the ground [31]. The test is divided into the non-repetitive loading method and the repetitive loading method depending on the loading. In Korea, the Korean Standards Association’s KS F 2310 [32] applies to the non-repetitive loading method. The German Standardization Association’s DIN 18134 [18] standard applies to the repetitive method, which is used in this study. There are loading and unloading stages in the test. From each stage, a stress-settlement curve is obtained by the second-order polynomial regression, and modulus is determined from the curve, which is represented as Ev1 (primary strain modulus) and Ev2 (secondary strain modulus), respectively. The configuration of the test equipment is shown in Figure 2.
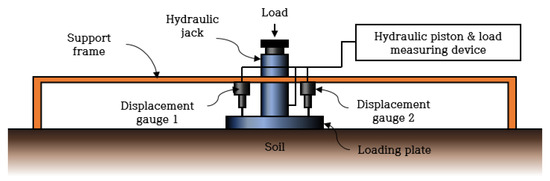
Figure 2.
Plate Loading Test (PLT) equipment composition [33].
The LWD measures modulus by dropping a falling weight at a certain height to its loading plate and measuring the maximum settlement of it. ELWD is the elastic modulus evaluated using the LWD. The elastic modulus is one of the indicators of the stiffness of the ground. It is a method to evaluate the compaction of the ground. Compared to the PLT, this test method has the advantage of being a simple test method with a short test time and portability [17]. The configuration of the test equipment is shown in Figure 3. A total of six drops should be performed to complete one test. The first three drops are steps to properly set the loading plate on the ground, and the latter three are steps to measure the settlement amount of the loading plate. The settlement of the loading plate is measured for each drop over time through an accelerometer mounted on the loading plate. The average value of the last three settlement measurements is used to calculate ELWD.
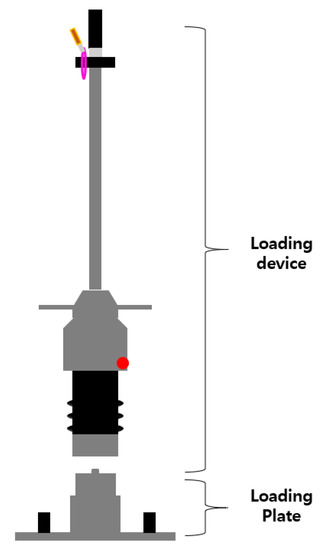
Figure 3.
Light-Weight Deflectometer (LWD) equipment composition [34].
Several studies have been conducted using the PLT and LWD test to evaluate the modulus or compaction of conventional road base construction materials, which are dense-graded aggregates. Kim and Park [23] and Kim et al. [35] conducted PLTs on pavement base layers based on both German standard, DIN 18134 [18], and KS F 2310 [32], and the results from both standards were compared. Wiman [36] evaluated the permanent deformation and modulus of base materials through the LWD and PLT based on DIN 18134 [18]. Berney, Mejais-Santiago, and Kyzar [29] constructed testbeds composed of various dense-graded base materials to evaluate the modulus of them using the LWD with other devices such as SSG and DCP and accumulated statistical data of the measurements.
The modulus-based compaction quality control technique can be an effective means for evaluating the compaction quality of OGAs because it is difficult to measure the maximum dry density and on-site dry density of them. However, most research about modulus-based compaction quality control has been focused on the materials used in conventional road base materials, except for a few studies conducted by Choi [37] and Choi et al. [38].
3. Field Experiment
3.1. Test Materials
The base layer in a road pavement is installed directly below the surface layer, and it distributes the traffic load received from the surface layer [39]. Since it is located under a thin surface layer, the load pressure distribution transmitted to the base layer is high; therefore, the selected base layer material needs to support the load and have sufficient resistance to deformation. In addition to these properties, the base in the permeable pavement should have a hydrological function to allow water to penetrate and retain rainwater in the ground. To this end, the base of the permeable pavement is composed of OGAs having an even particle size and almost no particulates, unlike the base layer of a road pavement composed of dense-graded aggregates.
In the field test, three different kinds of OGAs were used: D40 (maximum particle size 40 mm), D25 (maximum particle size 25 mm), and D13 (maximum particle size 13 mm). These particle sizes approximately lie in a commonly used particle size range of the base materials of permeable pavements. The aggregates were prepared in an air-dried state with about 0.5% of water contents. D40 and D25 were mixed 1:1 to make D40 + D25, and D25 and D13 were mixed 1:1 to make D25 + D13. A backhoe was used for the mixing of the aggregate, and a backhoe bucket was used to measure the volume of those aggregates to be mixed. In the field test, a total of five types of aggregates were prepared as test materials and were used in the construction of the test site. The aggregate volume composition, basic properties, and particle size distribution of each material are shown in Table 1 and Figure 4. In addition, the particle size distributions of OGAs used in typical permeable pavement base layers suggested by Smith [6] and Eisenberg, Lindow, and Smith [8], which is ASTM No. 57 aggregates, and Seoul Metropolitan City [10] are plotted together for comparison. Most of the materials coped within this study showed similar particle size distributions with the suggested range, with some exceptions in D13.

Table 1.
Basic information of the test materials [38].
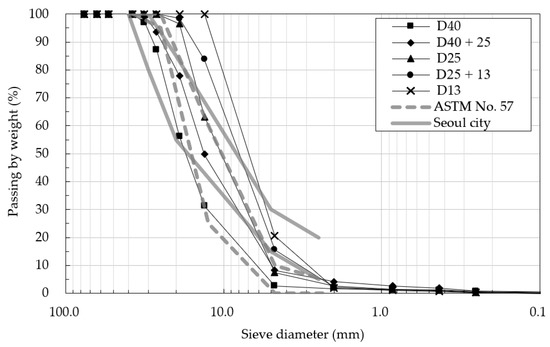
Figure 4.
Particle size distribution of test materials and specifications [38].
3.2. Test Program
The test was planned as follows using the five aggregates described above. In order to investigate the change in the stiffness of the compacted aggregate layer depending on the number of roller passes performed using a compaction roller, a field testbed was constructed following the dimensions illustrated in Figure 5. Each aggregate was placed to a height of 30 cm on the road (first lift), and then compacted 2, 4, 8, and 12 times with a 10 ton vibration compaction roller. Two PLTs and four LWD tests were then conducted at each number of compaction (roller passes) for all materials. A 30 cm diameter plate was used for the test. After all these tests were completed, an additional layer of each aggregate was laid to a depth of 30 cm on top of the previously laid aggregate layer (second lift), and the same measurement process was repeated. As a result, a total of 80 PLT and 160 LWD measurements were carried out throughout the whole test. Table 2 summarizes the whole test program.
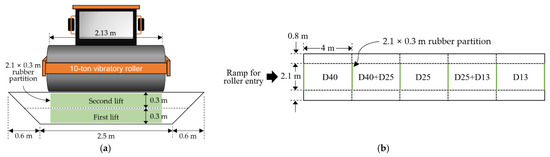
Figure 5.
Testbed layout [38]. (a) Cross-sectional view; (b) plan view.
Table 2.
Test program.
Figure 6 shows the locations corresponding to the test measurements. In the figure, the gray circles indicate the PLT measurements which have been conducted twice for each batch. LWD tests were conducted twice for each PLT test, a total of four times each batch. The numbers 2, 4, 8, and 12 indicate the number of roller passes, and A and B indicate the first and second PLT test positions. This layout of test location was applied to the tests for all materials.
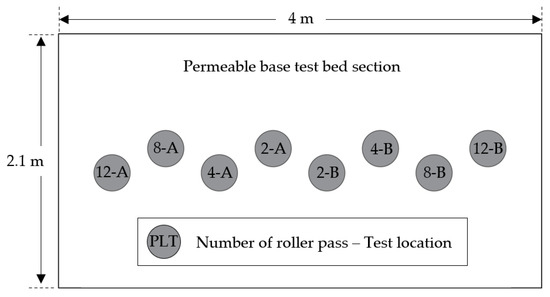
Figure 6.
Layout of test locations for PLT [38].
4. Modulus of Open-Graded Aggregate
4.1. Field Test Results
Table 3 presents 80 cases of datasets including types of materials, the number of roller passes, and the moduli evaluated using PLT and LWD. ELWD is the elastic modulus measured with the LWD test and Ev1 and Ev2 are the primary and secondary strain moduli, measured with the PLT test respectively. For each PLT, LWD tests were conducted twice, and therefore ELWD in the table is the average of two test results. There are five types of materials: D40, D40 + D25, D25, D25 + D13, and D13. Each of the materials is replaced with a numerical value of 1, 2, 3, 4, and 5, subsequently, to use as an input to the model. Areas A and B in Table 3 represent the test locations for PLT shown in Figure 5. In order to capture trends of the data in Table 3, it is also plotted in Figure 7, Figure 8 and Figure 9.
Table 3.
Dataset.
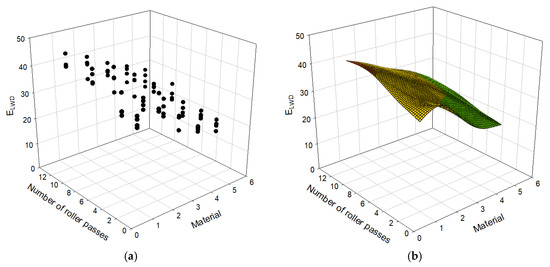
Figure 7.
Relationship between number of roller passes and ELWD: (a) scatter plot, (b) surface plot.
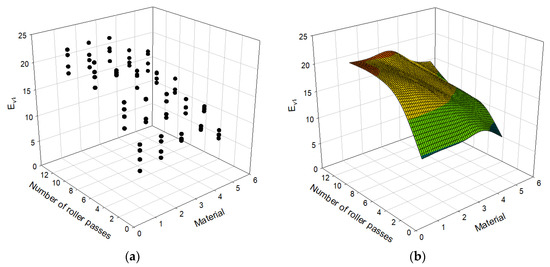
Figure 8.
Relationship between number of roller passes and Ev1: (a) scatter plot; (b) surface plot.
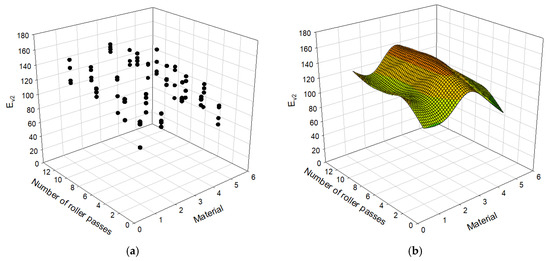
Figure 9.
Relationship between the number of roller passes and Ev2: (a) scatter plot, (b) surface plot.
The zone of influence of PLT is known as 1.5 to 2 times the diameter of the plate in the literatures based on experimental and numerical studies [41,42]. The zone of influence of LWD, on the other hand, may be identical to or a bit shallower than that of PLT. The zone of influence of LWD is reported to be 1.5 to 2 times [28] or 1 to 2 times the diameter [43,44]. Field tests have been conducted on the well-compacted and stiffer ground. Following the zone of influence, the test results for the first lift could possibly be influenced by the stiff bottom layer. However, when the moduli for the first and second lifts are compared, the results of the first lifts are not consistently higher than those of the second lifts. The open-graded aggregates tested in this study have much higher porosity and set-up with fewer particle-to-particle contacts than dense materials. The aggregates went through highly plastic behavior. Authors suspect the zone of influence was contained within a shallow depth with high plastic deformations. As there was no consistent difference found in the results of the first and second lifts, the number of the lift was not used as a variable in the regression and neural network analyses.
4.2. Modulus Results Depending on the Number of Roller Passes
The moduli Ev1, Ev2, and ELWD are plotted with respect to the number of roller passes and material type in Figure 7, Figure 8 and Figure 9 with the data presented in Table 3. Both the scatter plot and surface plot, which consists of the average values of the data points of the scatter plot, are shown in those figures to better visualize data. The Ev1 and Ev2 values steeply increase until the number of roller passes reaches 4. After 4 passes, Ev1 continues to increase with increasing number of roller passes with less steep rate, which was not the case for Ev2 and ELWD. During the first loading, the specimens are compressed and densified (or compacted), and therefore the second compression curve (or Ev2) is less sensitive to the number of roller passes. The first loading of the Plate Load Test also involves significant shear displacement, which does not happen during the second static loading or dynamic loading: Ev1 is more sensitive to the number of roller passes than Ev2 and ELWD overall. All three moduli, Ev1, Ev2, and ELWD, values nearly settle after the number of roller passes becomes 8. The number of roller passes 4, which is typically used in practice, may be an efficient number, but one may consider applying the number of roller passes 8 to achieve better stiffness for open-graded aggregates. The difference in measurements with LWD and PLT are due to different principles assumed for evaluation of the moduli. Therefore, the differences in measurement are owing to influence depth, loading rate, and the number of loading postulated for each evaluation method.
5. Artificial Neural Network and Linear Regression
It was attempted to evaluate the moduli of open-graded aggregates based on either ANN or Linear Regression [45,46,47,48], in order to see whether the moduli can be predicted well from aggregate and compaction information. MATLAB [49] and MS Excel [50] were used to implement ANN and LR, respectively.
5.1. Artificial Neural Network Model
The human brain solves many problems that are difficult to solve using current information processing technologies. Studies have been performed to analyze and model the functional factors of the human brain that entail excellent thinking ability, memory, problem analysis, and solving ability [46,51]. Machine learning is a technology through which a computer learns from accumulated data, and it is one of the artificial intelligence technologies developed in the 1980s. The algorithms used for machine learning include decision trees, clustering algorithms, and ANNs. Of these, an ANN operates in a manner similar to a neural network structure in which multiple neural cells connected to each other share signals and there is no direct connection between the input layer and the output layer. An ANN is divided into an input layer, which receives data as inputs, hidden layers that represent a complex relationship between the input and output, and the output layer, which produces the final result (Figure 10) [47,48,51].
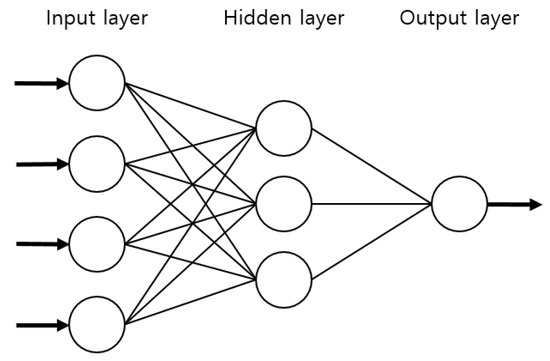
Figure 10.
Artificial Neural Network (ANN) structure.
The data used to train the ANN were the material type, the number of roller passes, and the moduli measured via PLT and LWD. Two different ANN models, ANN1 and ANN2, were set and applied. The “ANN1” model entailed the material type and the number of roller passes as features (inputs), and the moduli evaluated via PLT and LWD as labels (outputs), as presented in Figure 11. Therefore, in ANN1, it is attempted to predict the moduli based only on the material size and compaction level. The “ANN2” model, on the other hand, incorporates the modulus from LWD as a feature, not a label—the labels are the moduli from PLT (Figure 12). PLT generally costs much more time and effort to conduct than LWD. If one can successfully evaluate the results of PLT based on those of LWD, it would simplify the process of quality assessment while still keeping the benefits of PLT. An ANN structure with one hidden layer is selected, and 20 nodes were used. To determine the number of nodes, several different values of nodes were tried, and the use of 20 nodes resulted in efficient performance.
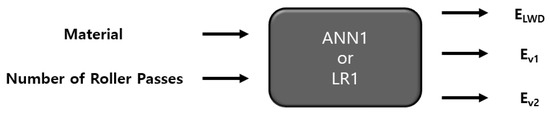
Figure 11.
Features and labels for ANN1 and LR1 models.
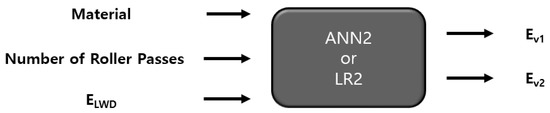
Figure 12.
Features and labels for ANN2 and Linear Regression 2 (LR2) models.
5.2. Linear Regression Model
Simple LR models were implemented to account for the relationships between the features and labels which have been postulated in ANN1 and ANN2 models (Figure 11 and Figure 12). ANN is the black box model, but with LR, explicit equations can be developed for inputs and outputs enabling an easier application to practice. Two LR models were postulated, LR1 and LR2, which employ the same features and labels for ANN1 and ANN2, respectively. LR1 entails the material type (1, 2, 3, 4, 5) and the number of roller passes (2, 4, 8, 12) as inputs, and the moduli from PLT and LWD as outputs (see Figure 13), while LR2 takes the modulus from LWD as an input, not an output (see Figure 14). As such, the completed LR1 model equates as follows:
where ELWD is the modulus from LWD, Ev1 and Ev2 are the moduli from PLT for loading and reloading, Nmat is the material type, and Nrp is the number of roller passes. On the other hand, the LR2 model formulates as follows:
ELWD = −3.55 Nmat + 0.7 Nrp + 37.01
Ev1 = −0.9 Nmat + 0.93 Nrp + 11.53
Ev2 = −2.64 Nmat + 1.7 Nrp + 115.52
Ev1 = −0.33 Nmat + 0.75 Nrp − 0.18ELWD + 5.46
Ev2 = −3.5 Nmat + 1.77 Nrp − 0.29ELWD + 127.29
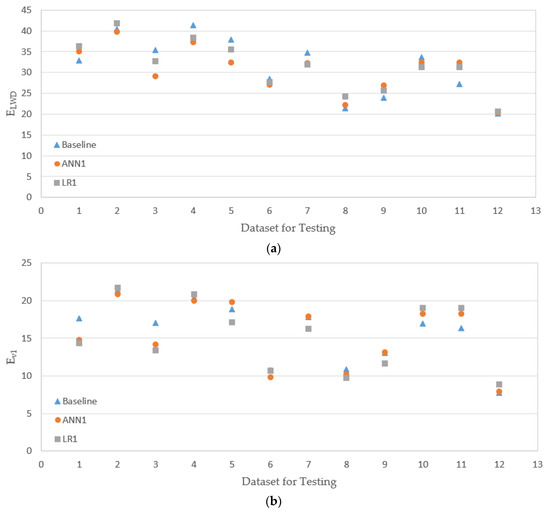
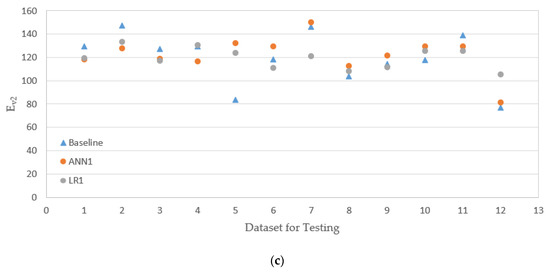
Figure 13.
Testing results 1 (results of ANN are based on the model ANN1, and results of LN are based on the model LN1). (a) Testing results from ELWD; (b) testing results from Ev1; (c) testing results from Ev2.
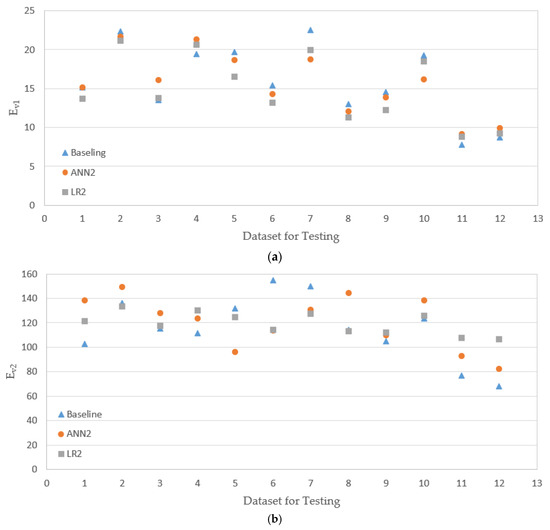
Figure 14.
Testing results 2 (results of ANN are based on the model ANN2, and results of LN are based on the model LN2). (a) Testing results from Ev1; (b) testing results from Ev2.
Root mean square error (RMSE) values of the equations presented above are presented in Table 4 and Table 5.
Table 4.
Root mean square error (RMSE) results for ANN1 and LR1.
Table 5.
RMSE results for ANN2 and LR2.
5.3. Evaluation Results and Comparison
The experimental data had a total of 80 sets, as presented in Table 3, and 70%, 15%, and 15% of data were randomly selected and used for training, validation, and testing (prediction) respectively, with an option implemented in MATLAB. The results of the evaluation of the models ANN1 and LR1 are presented in Figure 13 together with the baseline values (experimental results). The horizontal axis in the figure represents the dataset not used for training of the ANN model or fitting of the LR model (saved for evaluation of model performance). It is noted that the prediction based on the ANN model does not necessarily provide a better match with the baseline. For some datasets, LR prediction is better; for some others, ANN gives better prediction. In Figure 14, the results of ANN2 and LR2 models are shown. For amodels, ANN2 and LR2, for some datasets, the ANN2 model predictions are closer to the baselines, but for others, LR2 predicts closer values to the baselines.
RMSE (root mean square error) of the ANN and LR models were estimated to investigate overall performance of prediction of proposed models. RMSE is a statistical measure of the difference between the predicted and baseline, and can be equated as follows:
where Mi is the predicted, and Pi is the baseline.
Table 4 presents the RMSE values for training and testing of ANN1 and LR1 (see Figure 13). In the case of the model LR1, for all three moduli, ELWD, Ev1, and E, the RMSE values for training (fitting) and testing (prediction) are quite close; during fitting and evaluation, the LR1 model produces similar level of errors. In the model ANN1, on the other hand, for ELWD and Ev2, the RMSE for testing is larger than that for training. When the testing RMSEs of two different models, ANN1 and LR1, are compared, RMSE of ANN1 is higher for ELWD, but RMSE of LR1 is higher for Ev1. One model is not necessarily superior to the other for prediction. The results of the model evaluations of ANN2 and LR2 (see Figure 14) are presented in Table 5. The ANN2 model works better for training (or fitting), but the LR2 model is slightly better at testing (prediction).
PLT costs more much more time and efforts to conduct than LWD and replacing PLT by LWD would make the quality assessment procedure simpler. The intention of models ANN2 and LR2 is to predict the results of PLT based on those of LWD. While the models ANN1 and LR1 employ only the material type and the number of roller passes as inputs, the models ANN2 and LR2 additionally have ELWD as an input. However, by comparing Table 4 and Table 5, it can be seen that the models ANN1 and LR1, which have fewer inputs, therefore, are simpler, and have better perdition overall, especially for Ev2. It appears that there is no significant correlation between the moduli from PLT and LWD, as these two methods evaluate the moduli on entirely different bases.
Continuous Compaction Control (CCC) or Intelligent Compaction (IC) refers to an innovative compaction technique which can perform field compaction simultaneously evaluating the stiffness of soil, and therefore compaction quality [52]. There was no vibration sensor implemented to the compaction roller in this study, thus CCC measurements are not available for comparison with LWD and PLT measurements. However, when CCC or IC is applied to the open-graded aggregates, the stiffness results of LWD and PLT and regression equations presented in this study may be taken as references, making CCC operations more reliable.
6. Summary and Conclusions
In this study, the moduli of open-graded aggregates under various compaction energies were investigated based on PLT (Plate Load Test) and LWD (Light-Weight Deflectometer). Artificial Neural Network (ANN) and Linear Regression (LR) models were employed for estimation of the moduli of the aggregates based on the material type and level of compaction. The conclusions obtained are as follows:
- The modulus from the first loading curve of PLT was more sensitive to the number of roller passes than the moduli from the reloading curve of PLT and from LWD. It is due to the significant compressional and shear deformation that happens during the first loading of PLT, which does not appear during the reloading of PLT and dynamic loading of LWD.
- Overall, the moduli from PLT and LWD steeply increase until the number of roller passes reaches 4, and they gradually increase until the number of roller passes becomes 8. The number of roller passes 4, which is typically used in practice, may be an efficient number, but one may consider applying the number of roller passes 8 to achieve better stiffness for open-graded aggregates.
- The models that do have one less input (the modulus from LWD) actually performed a little better than the models with more inputs. When there is no good correlation between input and output (e.g., the moduli from PLT and LWD), adding more input variables does not necessarily help the prediction of the model.
- A set of simple linear equations were proposed to evaluate the moduli of open-graded aggregates from PLT and LWD based on the material type and the number of roller passes. The predictions based on ANN models did not necessarily provide a better match with the baseline compared to LR models.
- The stiffness results of LWD and PLT and regression equations presented in this study may be taken as references when CCC operations are made in open-graded aggregates. The characteristics of open-graded aggregates of different sizes, shapes, and minerals should be further studied for reliable application of open-graded aggregates to the base of permeable pavements.
Author Contributions
Conceptualization and methodology, Y.L., Y.C., D.A., and J.A.; Validation, Y.L., Y.C. and J.A.; Formal Analysis, Y.L. and Y.C.; Investigation, Y.L., Y.C., D.A. and J.A.; Resources, J.A.; Data Curation, Y.L. and Y.C.; Writing—Original Draft, Y.L.; Writing—Review and Editing, Y.L. and J.A.; Visualization, Y.L.; Supervision, J.A.; Project Administration, J.A.; Funding Acquisition, J.A. All authors have read and agreed to the published version of the manuscript.
Funding
This work was supported by the National Research Foundation of Korea (NRF) grant funded by the Korea government (MSIT) (No. NRF-2020R1A2C1012072).
Institutional Review Board Statement
Not applicable.
Informed Consent Statement
Not applicable.
Data Availability Statement
Data sharing is not applicable to this article.
Conflicts of Interest
The authors declare no conflict of interest.
References
- Baek, S.-S.; Ligaray, M.; Pyo, J.; Park, J.-P.; Kang, J.-H.; Pachepsky, Y.; Chun, J.A.; Cho, K.H. A novel water quality module of the SWMM model for assessing low impact development (LID) in urban watersheds. J. Hydrol. 2020, 586, 124886. [Google Scholar] [CrossRef]
- Zahmatkesh, Z.; Burian, S.J.; Karamouz, M.; Tavakol-Davani, H.; Goharian, E. Low-Impact Development Practices to Mitigate Climate Change Effects on Urban Stormwater Runoff: Case Study of New York City. J. Irrig. Drain. Eng. 2015, 141, 04014043. [Google Scholar] [CrossRef]
- Ahiablame, L.M.; Engel, B.A.; Chaubey, I. Effectiveness of Low Impact Development Practices: Literature Review and Suggestions for Future Research. Water Air Soil Pollut. 2012, 223, 4253–4273. [Google Scholar] [CrossRef]
- Dietz, M.E. Low Impact Development Practices: A Review of Current Research and Recommendations for Future Directions. Water Air Soil Pollut. 2007, 186, 351–363. [Google Scholar] [CrossRef]
- Eckart, K.; McPhee, Z.; Bolisetti, T. Performance and implementation of low impact development—A review. Sci. Total Environ. 2017, 607–608, 413–432. [Google Scholar] [CrossRef]
- Smith, D.R. Permeable Interlocking Concrete Pavements, 4th ed.; Interlocking Concrete Pavement Istitute: Herndon, VA, USA, 2011. [Google Scholar]
- Kumar, K.; Kozak, J.; Hundal, L.; Cox, A.; Zhang, H.; Granato, T. In-situ infiltration performance of different permeable pavements in a employee used parking lot—A four-year study. J. Environ. Manag. 2016, 167, 8–14. [Google Scholar] [CrossRef] [PubMed]
- Eisenberg, B.E.; Lindow, K.C.; Smith, D.R. Permeable Pavements, 1st ed.; American Society of Civil Engineers: Reston, VA, USA, 2015. [Google Scholar]
- Brattebo, B.O.; Booth, D.B. Long-term stormwater quantity and quality performance of permeable pavement systems. Water Res. 2003, 37, 4369–4376. [Google Scholar] [CrossRef]
- Seoul Metropolitan City. Design, Construction and Maintenance Standards of Permeable Block Pavement; Seoul Metropolitan City: Seoul, Korea, 2013. [Google Scholar]
- Interpave. Understanding Permeable Paving and Suds, 6th ed.; Interpave: Leicester, UK, 2020. [Google Scholar]
- CMAA. Permeable Interlocking Concrete Pavements—Design and Construction Guide, PE01 November 2010 ed.; Concrete Masonry Association of Australia (CMAA): Artarmon, Australia, 2010. [Google Scholar]
- Abu-Farsakh, M.; Alshibli, K.A.; Nazzal, M.; Seyman, E. Assessment of In-Situ Test Technology for Construction Control of Base Courses and Embankments; FHWA/LA.041389; Louisiana Transportation Research Center: Boton Rouge, LA, USA, 2004. [Google Scholar]
- Alshibli, K.A.; Abu-Farsakh, M.; Seyman, E. Laboratory Evaluation of the Geogauge and Light Falling Weight Deflectometer as Construction Control Tools. J. Mater. Civ. Eng. 2005, 17, 560–569. [Google Scholar] [CrossRef]
- Li, Q.; Xiao, D.X.; Wang, K.C.P.; Hall, K.D.; Qiu, Y. Mechanistic-empirical pavement design guide (MEPDG): A bird’s-eye view. J. Mod. Transp. 2011, 19, 114–133. [Google Scholar] [CrossRef]
- Board, T.R. Modulus-Based Construction Specification for Compaction of Earthwork and Unbound Aggregate; The National Academies Press: Washington, DC, USA, 2015. [Google Scholar] [CrossRef]
- Nazzal, M. Non-Nuclear Methods for Compaction Control of Unbound Materials; National Cooperative Highway Research Program Synthesis 456; Transportation Research Board: Washington, DC, USA, 2014. [Google Scholar]
- DIN. Earthworks and Foundations—Soil Classification for Civil Engineering Purposes; DIN 18196; DIN Deutsches Institut für Normung e. V.: Berlin, Germany, 2011. [Google Scholar]
- ASTM International. Standard Test Method for Measuring Deflections Using a Portable Impulse Plate Load Test Device; ASTM E2835; ASTM International: West Conshohocken, PA, USA, 2011. [Google Scholar]
- ASTM International. Standard Test Method for Measuring Stiffness and Apparent Modulus of Soil and Soil-Aggregate in-Place by Electro-Mechanical Method; ASTM D6758; ASTM International: West Conshohocken, PA, USA, 2018. [Google Scholar]
- ASTM International. Standard Test Method for Use of the Dynamic Cone Penetrometer in Shallow Pavement Applications; ASTM D6951; ASTM International: West Conshohocken, PA, USA, 2018. [Google Scholar]
- Fleming, P.; Frost, M.; Lambert, J. Review of Lightweight Deflectometer for Routine In Situ Assessment of Pavement Material Stiffness. Transp. Res. Rec. J. Transp. Res. Board 2007, 2004, 80–87. [Google Scholar] [CrossRef]
- Kim, D.; Park, S. Relationshop between the subgrade reaction modulus and the strain modulus obtained using a plate loading test. In Proceedings of the 9th World Congress on Railway Research, Lille, France, 22–26 May 2011. [Google Scholar]
- Lenke, L.R.; McKeen, G.R.; Grush, M.P. Laboratory Evaluation of GeoGauge for Compaction Control. Transp. Res. Rec. J. Transp. Res. Board 2003, 1849, 20–30. [Google Scholar] [CrossRef]
- Lin, D.F.; Liau, C.C.; Lin, J.D. Factors Affecting Portable Falling Weight Deflectometer Measurements. J. Geotech. Geoenviron. Eng. 2006, 132, 804–808. [Google Scholar] [CrossRef]
- Meehan, C.L.; Tehrani, F.S.; Vahedifard, F. A comparison of density-based and modulus-based in situ test measurements for compaction control. Geotech. Test. J. 2012, 35, 387–399. [Google Scholar] [CrossRef]
- Sulewska, M.J. The Control of Soil Compaction Degree by Means of LFWD. Balt J. Road Bridge E 2012, 7, 36–41. [Google Scholar] [CrossRef]
- Elhakim, A.F.; Elbaz, K.; Amer, M.I. The use of light weight deflectometer for in situ evaluation of sand degree of compaction. HBRC J. 2014, 10, 298–307. [Google Scholar] [CrossRef]
- Berney, E.S.; Mejais-Santiago, M.; Kyzar, J.D. Non-Nuclear Alternatives to Monitoring Moisture-Density Response in Soils; ERDC/GSL TR-13-6; U.S. Army Engineer Research and Development Center Geotechnical and Structures Laboratory: Vicksburg, MS, USA, 2013. [Google Scholar]
- Volovski, M.; Arman, M.; Labi, S. Developing Statistical Limits for Using the Light Weight Defl ectometer (LWD) in Construction Quality Assurance; FHWA/IN/JTRP-2014/10; Purdue University: West Lafayette, IN, USA, 2014. [Google Scholar]
- Research Society of Road and Traffic. Additional Technical Contractual Conditions and Guidelines for Earthwork in Road Construction and Technical Testing Instructions for Soil and Rock in Road Construction; Research Society of Road and Traffic: Koln, Germnay, 1994. [Google Scholar]
- Korean Agency for Technology and Standards. Standard Test Method for Plate Load Test on Soils for Road; KS F 2310; Korean Agency for Technology and Standards: Seoul, Korea, 2015.
- Choi, C. Stiffness Evaluation of Open-Graded Aggregate Base Corresponding to Compaction Level Based on Plate Load Tests; Pusan Natioanl University: Busan, Korea, 2019. [Google Scholar]
- Zorn, I. User Manual for the Light Weight Deflectometer (LWD) ZFG 3.0; Zorn: Stendal, Germany, 2011. [Google Scholar]
- Kim, D.-S.; Park, S.-Y.; Kim, S.-I. Evaluation of Correlation between Subgrade Reaction Modulus and Strain Modulus Using Plate Loading Test. J. Korean Geotech. Soc. 2008, 24, 57–67. [Google Scholar]
- Wiman, L.G. Accelerated Load Testing of Pavements: HVS-NORDIC Tests at VTI Sweden 2003–2004; VTI Rapport 544A; Swedish National Road and Transport Research Institute: Linköping, Sweden, 2006.
- Choi, Y.; Ahn, D.; Lee, Y.; Ahn, J. Compaction Quality Monitoring of Open-Graded Aggregates by Light Weight Deflectometer and Soil Stiffness Gauge. Sustainability 2020, 12, 2521. [Google Scholar] [CrossRef]
- Choi, Y.; Ahn, D.; Nguyen, T.H.; Ahn, J. Assessment of Field Compaction of Aggregate Base Materials for Permeable Pavements Based on Plate Load Tests. Sustainability 2018, 10, 3817. [Google Scholar] [CrossRef]
- AASHTO. AASHTO Guide for Design of Pavement Structures, 1993; AASHTO: Washington, DC, USA, 1993; Volume 1. [Google Scholar]
- ASTM International. Standard Test Method for Resistance to Degradation of Small-Size Coarse Aggregate by Abrasion and Impact in the Los Angeles Machine; ASTM C131/C131M-14; ASTM International: West Conshohocken, PA, USA, 2006. [Google Scholar]
- Agarwal, K.; Rana, M. Effect of ground water on settlement of footing in sand. Eur. Conf. Soil Mech. Found. Eng. 1987, 9, 751–754. [Google Scholar]
- Oh, W.; Vanapalli, S. Modelling the applied vertical stress and settlement relationship of shallow foundation in saturated and unsaturated sands. Can. Geotech. J. 2011, 48, 425–438. [Google Scholar] [CrossRef]
- Tompai, Z. Laboratory Evaluation of New B&C Light Falling Weight Deflectometer; IOS Press: Amsterdam, The Netherlands, 2008. [Google Scholar]
- Nazzal, D. Field Evaluation of In-Situ Test Technology for QC/QA during Construction of Pavement Layers and Embankments; Louisiana State University: Baton Rouge, LA, USA, 2003. [Google Scholar]
- Draper, N.R.; Smith, H. Applied Regression Analysis; John Wiley & Sons: Hoboken, NJ, USA, 1998; Volume 326. [Google Scholar]
- Hassoun, M.H. Fundamentals of Artificial Neural Networks; MIT Press: Cambridge, MA, USA, 1995. [Google Scholar]
- Kim, B.-J.; Ho, J.-K.; Hwang, Y.-C. Prediction of Shear Wave Velocity on Sand Using Standard Penetration Test Results: Application of Artificial Neural Network Model. J. Korean Geotech. Soc. 2014, 30. [Google Scholar] [CrossRef]
- Moon, I.-J.; Kim, Y.-U. Correlation Analysis between Soil Shear Strength Parameters and Cone Index Using Artificial Neural Networks-1. J. Korea Acad.-Ind. Coop. Soc. 2015, 16. [Google Scholar] [CrossRef]
- MathWorks. What Is a Neural Network? Available online: https://kr.mathworks.com/discovery/neural-network.html (accessed on 14 October 2020).
- Microsoft. Perform a Regression Analysis. Available online: https://support.microsoft.com/en-us/office/perform-a-regression-analysis-54f5c00e-0f51-4274-a4a7-ae46b418a23e (accessed on 14 October 2020).
- Shahin, M.A. A review of artificial intelligence applications in shallow foundations. Int. J. Geotech. Eng. 2015, 9, 49–60. [Google Scholar] [CrossRef]
- Anderegg, R.; Kaufmann, K. Intelligent Compaction with Vibratory Rollers: Feedback Control Systems in Automatic Compaction and Compaction Control. Transp. Res. Rec. 2004, 1868, 124–134. [Google Scholar] [CrossRef]
Publisher’s Note: MDPI stays neutral with regard to jurisdictional claims in published maps and institutional affiliations. |
© 2021 by the authors. Licensee MDPI, Basel, Switzerland. This article is an open access article distributed under the terms and conditions of the Creative Commons Attribution (CC BY) license (http://creativecommons.org/licenses/by/4.0/).