
Characterizing Mat Formation of Bamboo Fiber Composites: Horizontal Density Distribution


 ,
,
Abstract
1. Introduction
2. Materials and Methods
2.1. Materials
2.2. Panel Fabrication and Testing
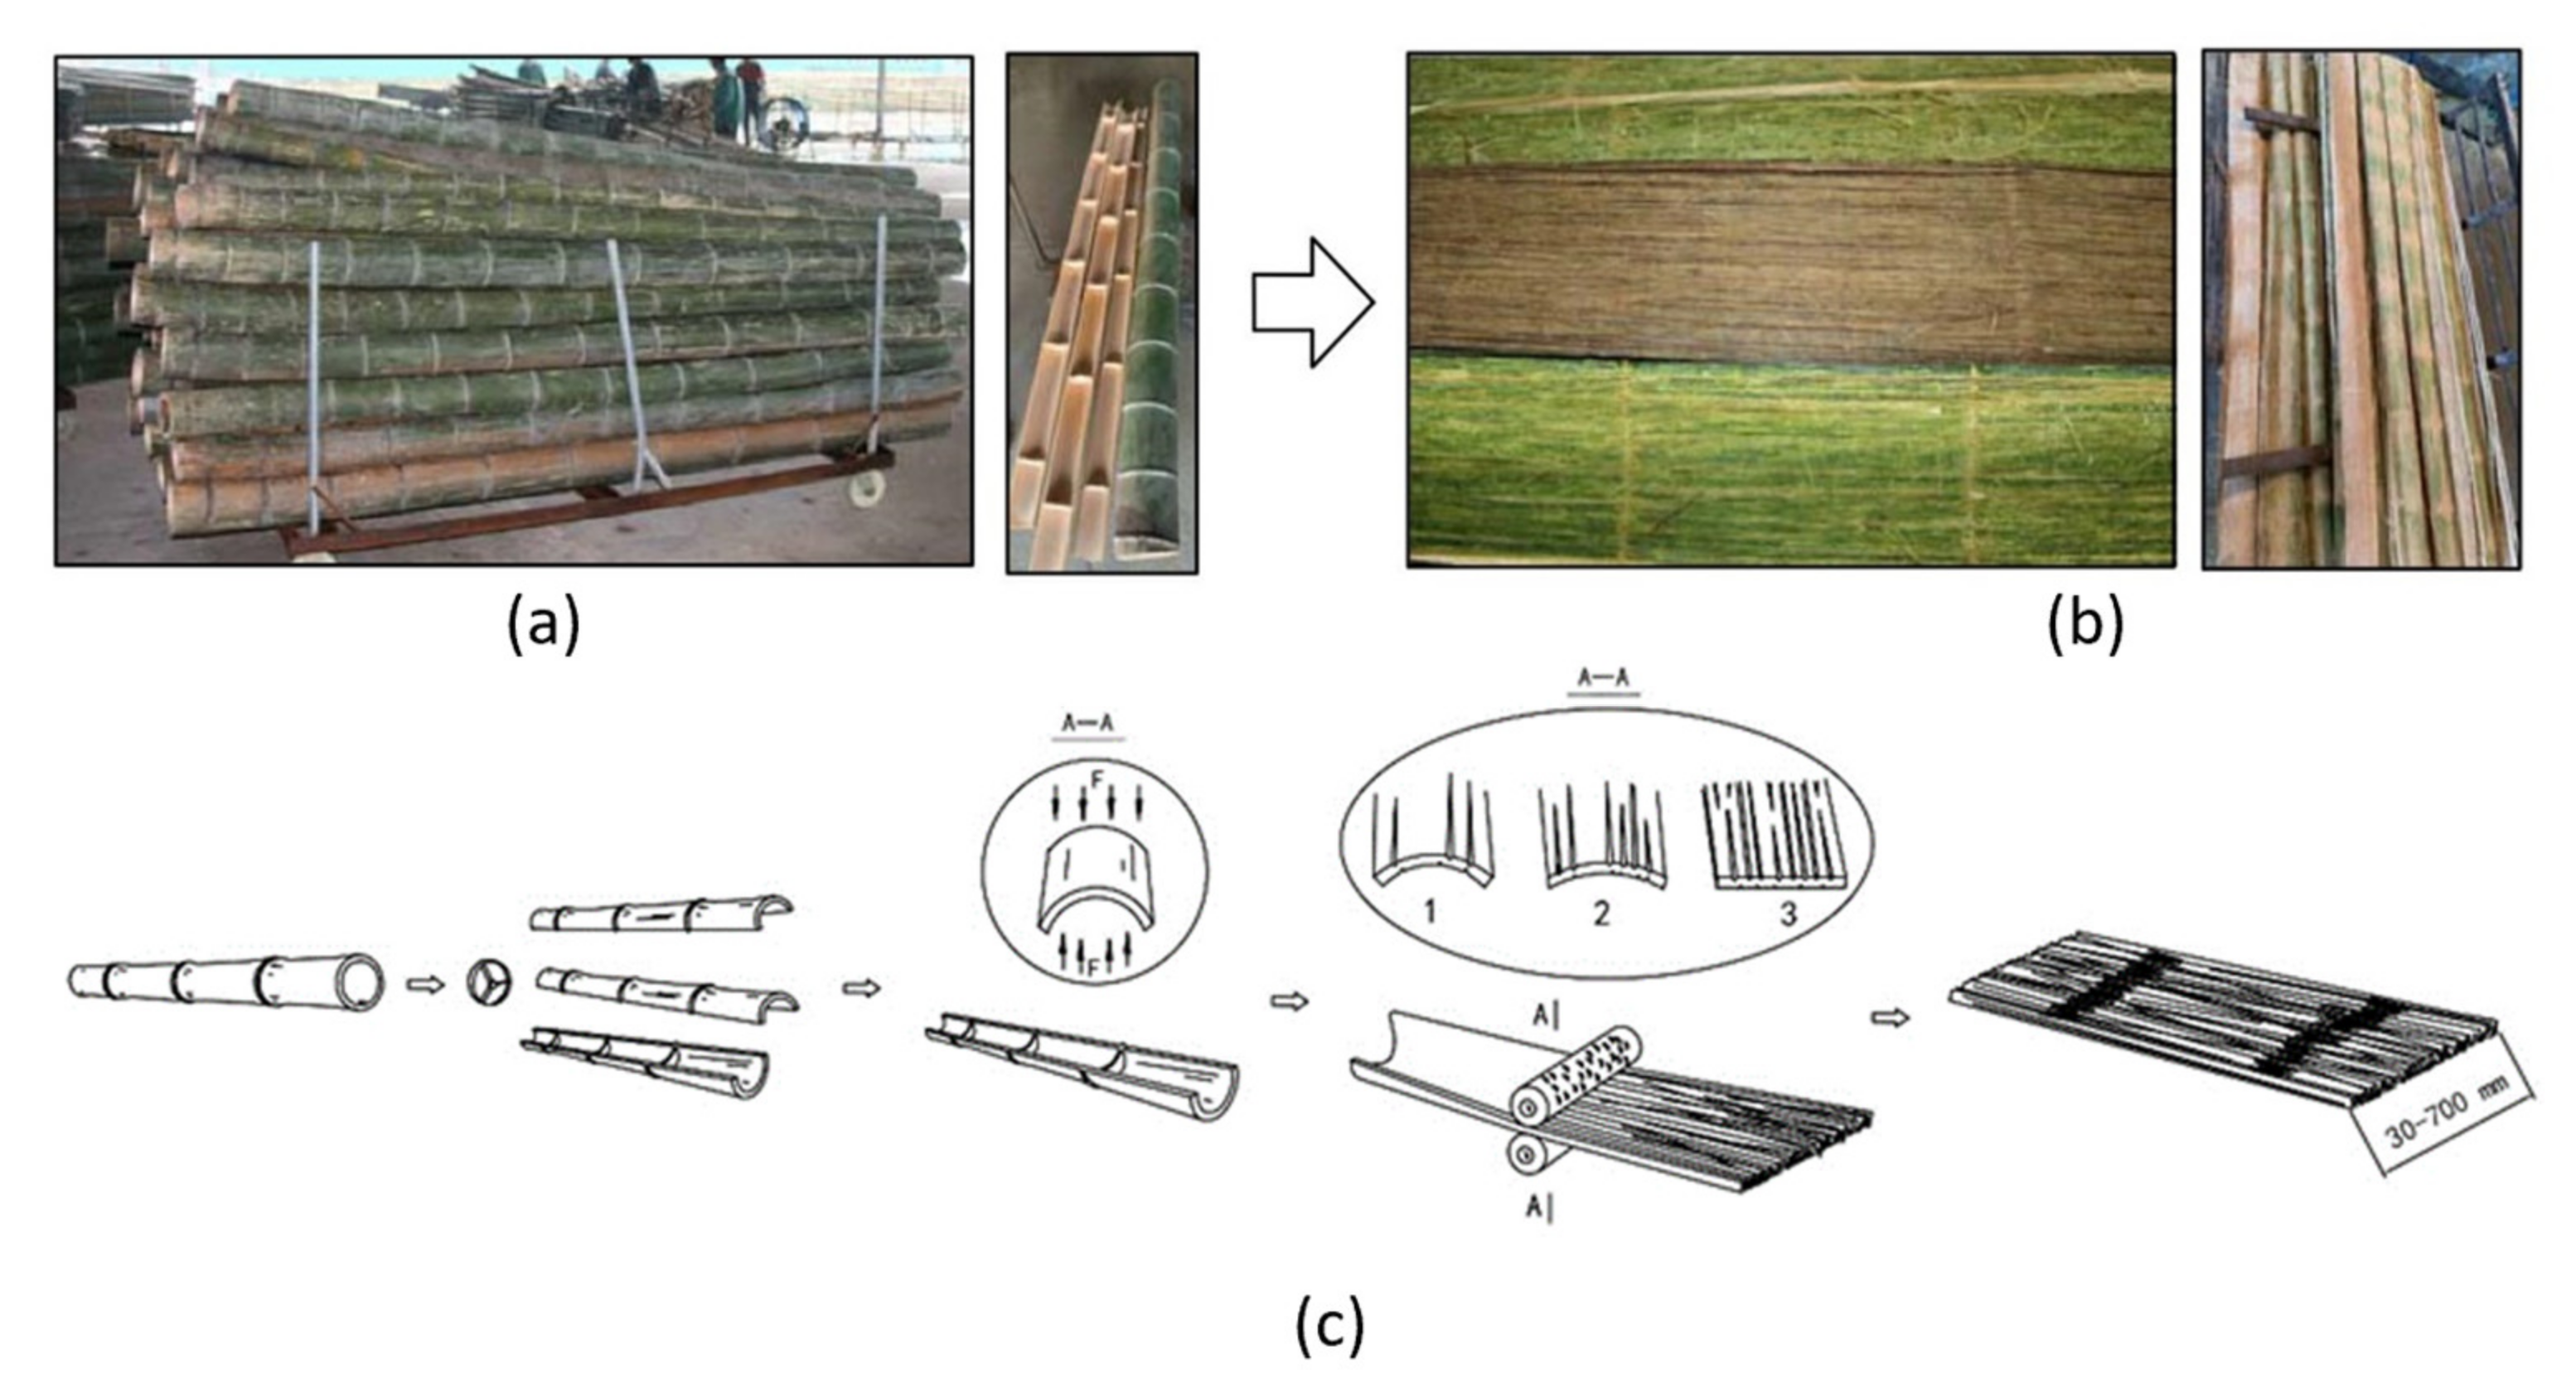
- (a)
- Resin application and drying
- (b)
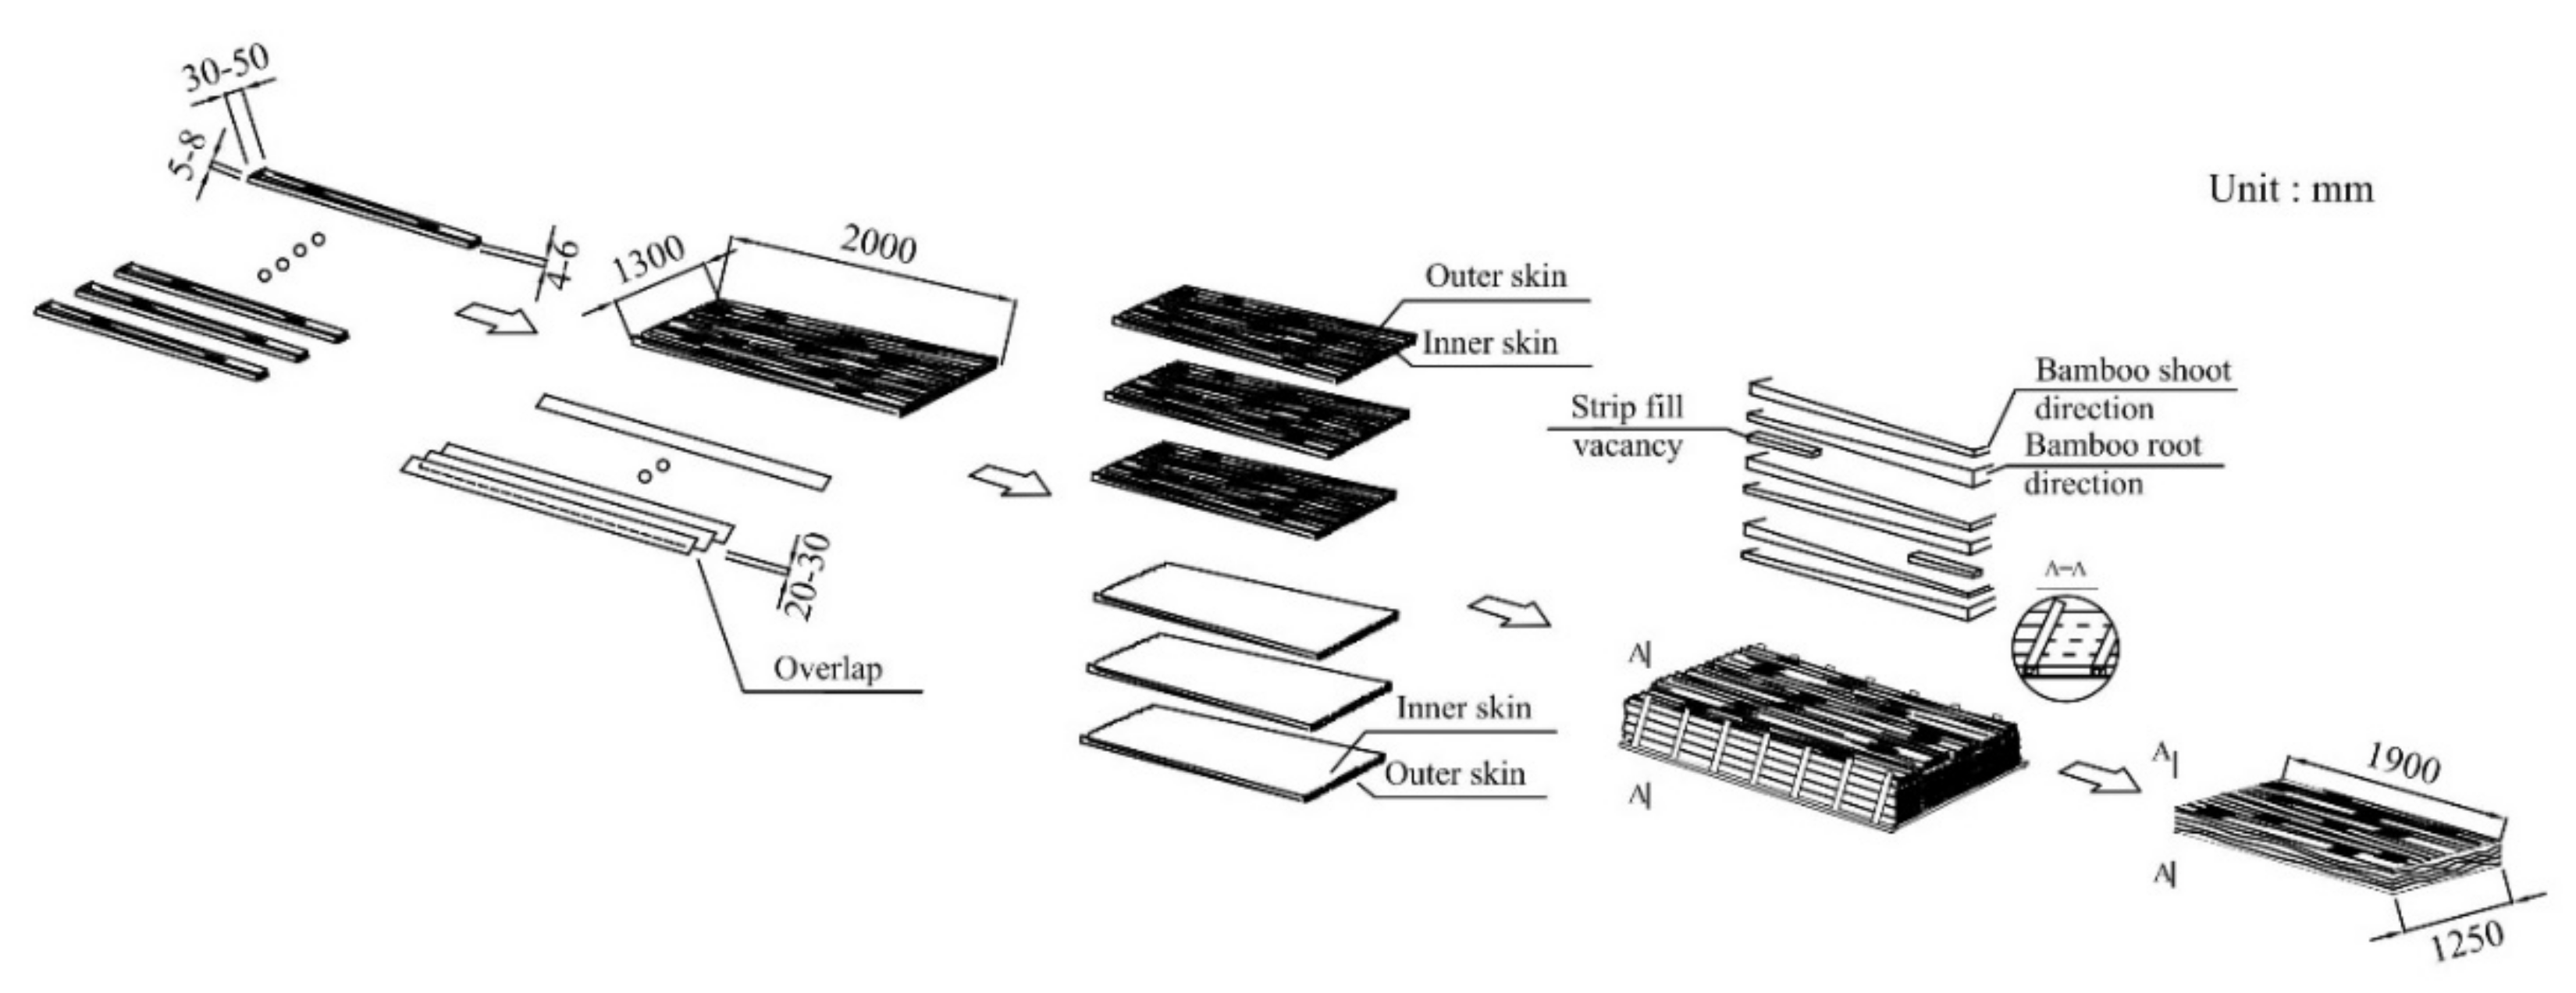
- Mat lay-up
- i.
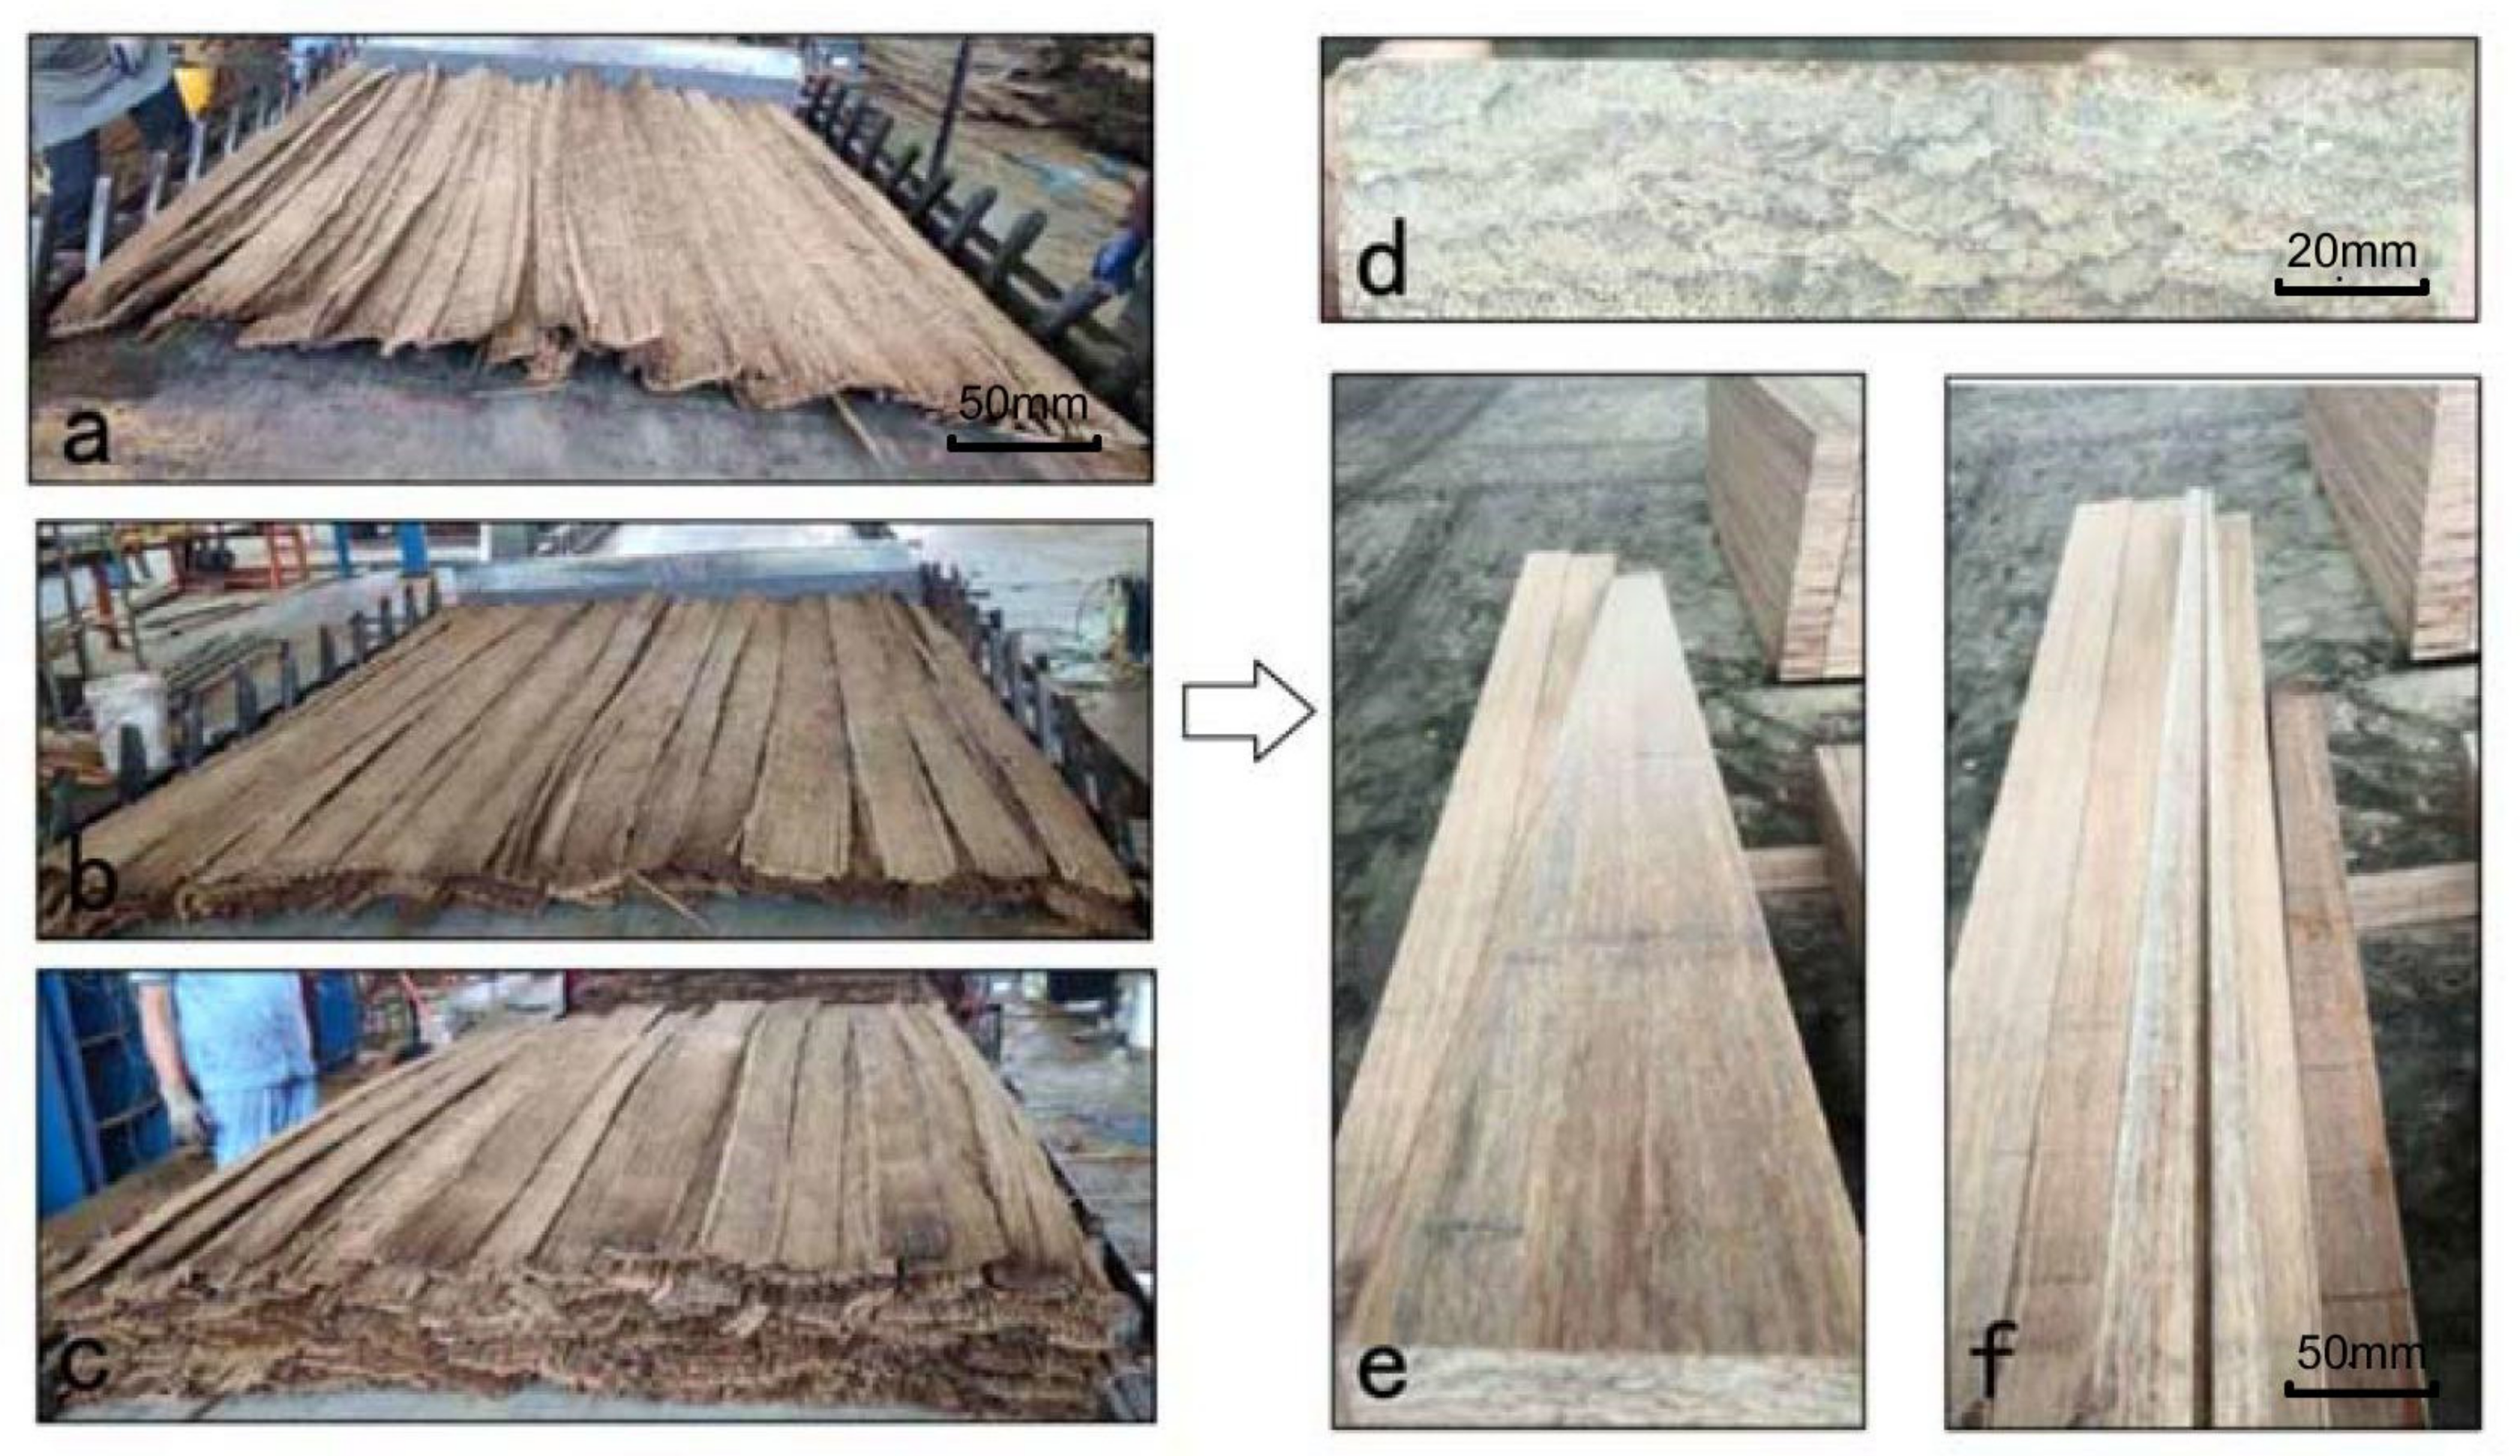
- The width of the scrimmed strips was carefully controlled by the culm splitting and roller flattening processes to be as uniform as possible. Two strip widths were generally maintained: 30–50 and 60–80 mm. Here, two mat formation mechanisms may co-exist: narrow strips are good for randomization and, hence, uniformity, whereas wide strips are useful for manual placement, which can be beneficial for more uniform control of density distribution.
- ii.
- The strips were unidirectionally oriented with no or very low angle relative to the length axis of the panel. There was partial overlap which helped to consolidate flexural strength across the panel and reduced the random arrangement of void space throughout the panel, helping to reduce horizontal density variation.
- iii.
- The top and bottom of the panels were isometric, i.e., the bottom half of the scrimmed strips was oriented so that the outer wall of the culm faces down, and in the top half of the layers, the outer wall faces up. This is because the bamboo tissue is densest and strongest in the zone at the outer wall, which is richest in fiber bundles. The strips were also placed to overlap more in the outer, or “shell”, layers to increase flexural properties across the width of the panel.
- iv.
- Each mat layer was counter-oriented in terms of culm length direction, i.e., the bottom (root) end of the culm was located at the opposite end of the panel in each layer. This is because the width and the culm wall thickness are greater and the average density of the culm wall is lower at the bottom end of the culm. In order to control the effect of large variation in fiber bundle thickness along the entire bamboo culm, culms were cross-cut into three 2-m-long sections (bottom, middle and top). During mat forming, only the strips from the same section were used in any one layer.
- v.
- The mat was inspected both visually and by compression to check for gaps which are filled with shorter strips. This was to even up any low-density zones found in the ends of the mat. The loose arrangement of the strips allows for some lateral expansion of the mat during pressing, helping fill edge voids and reducing horizontal density variation.
- (c)
- Hot pressing
- (d)
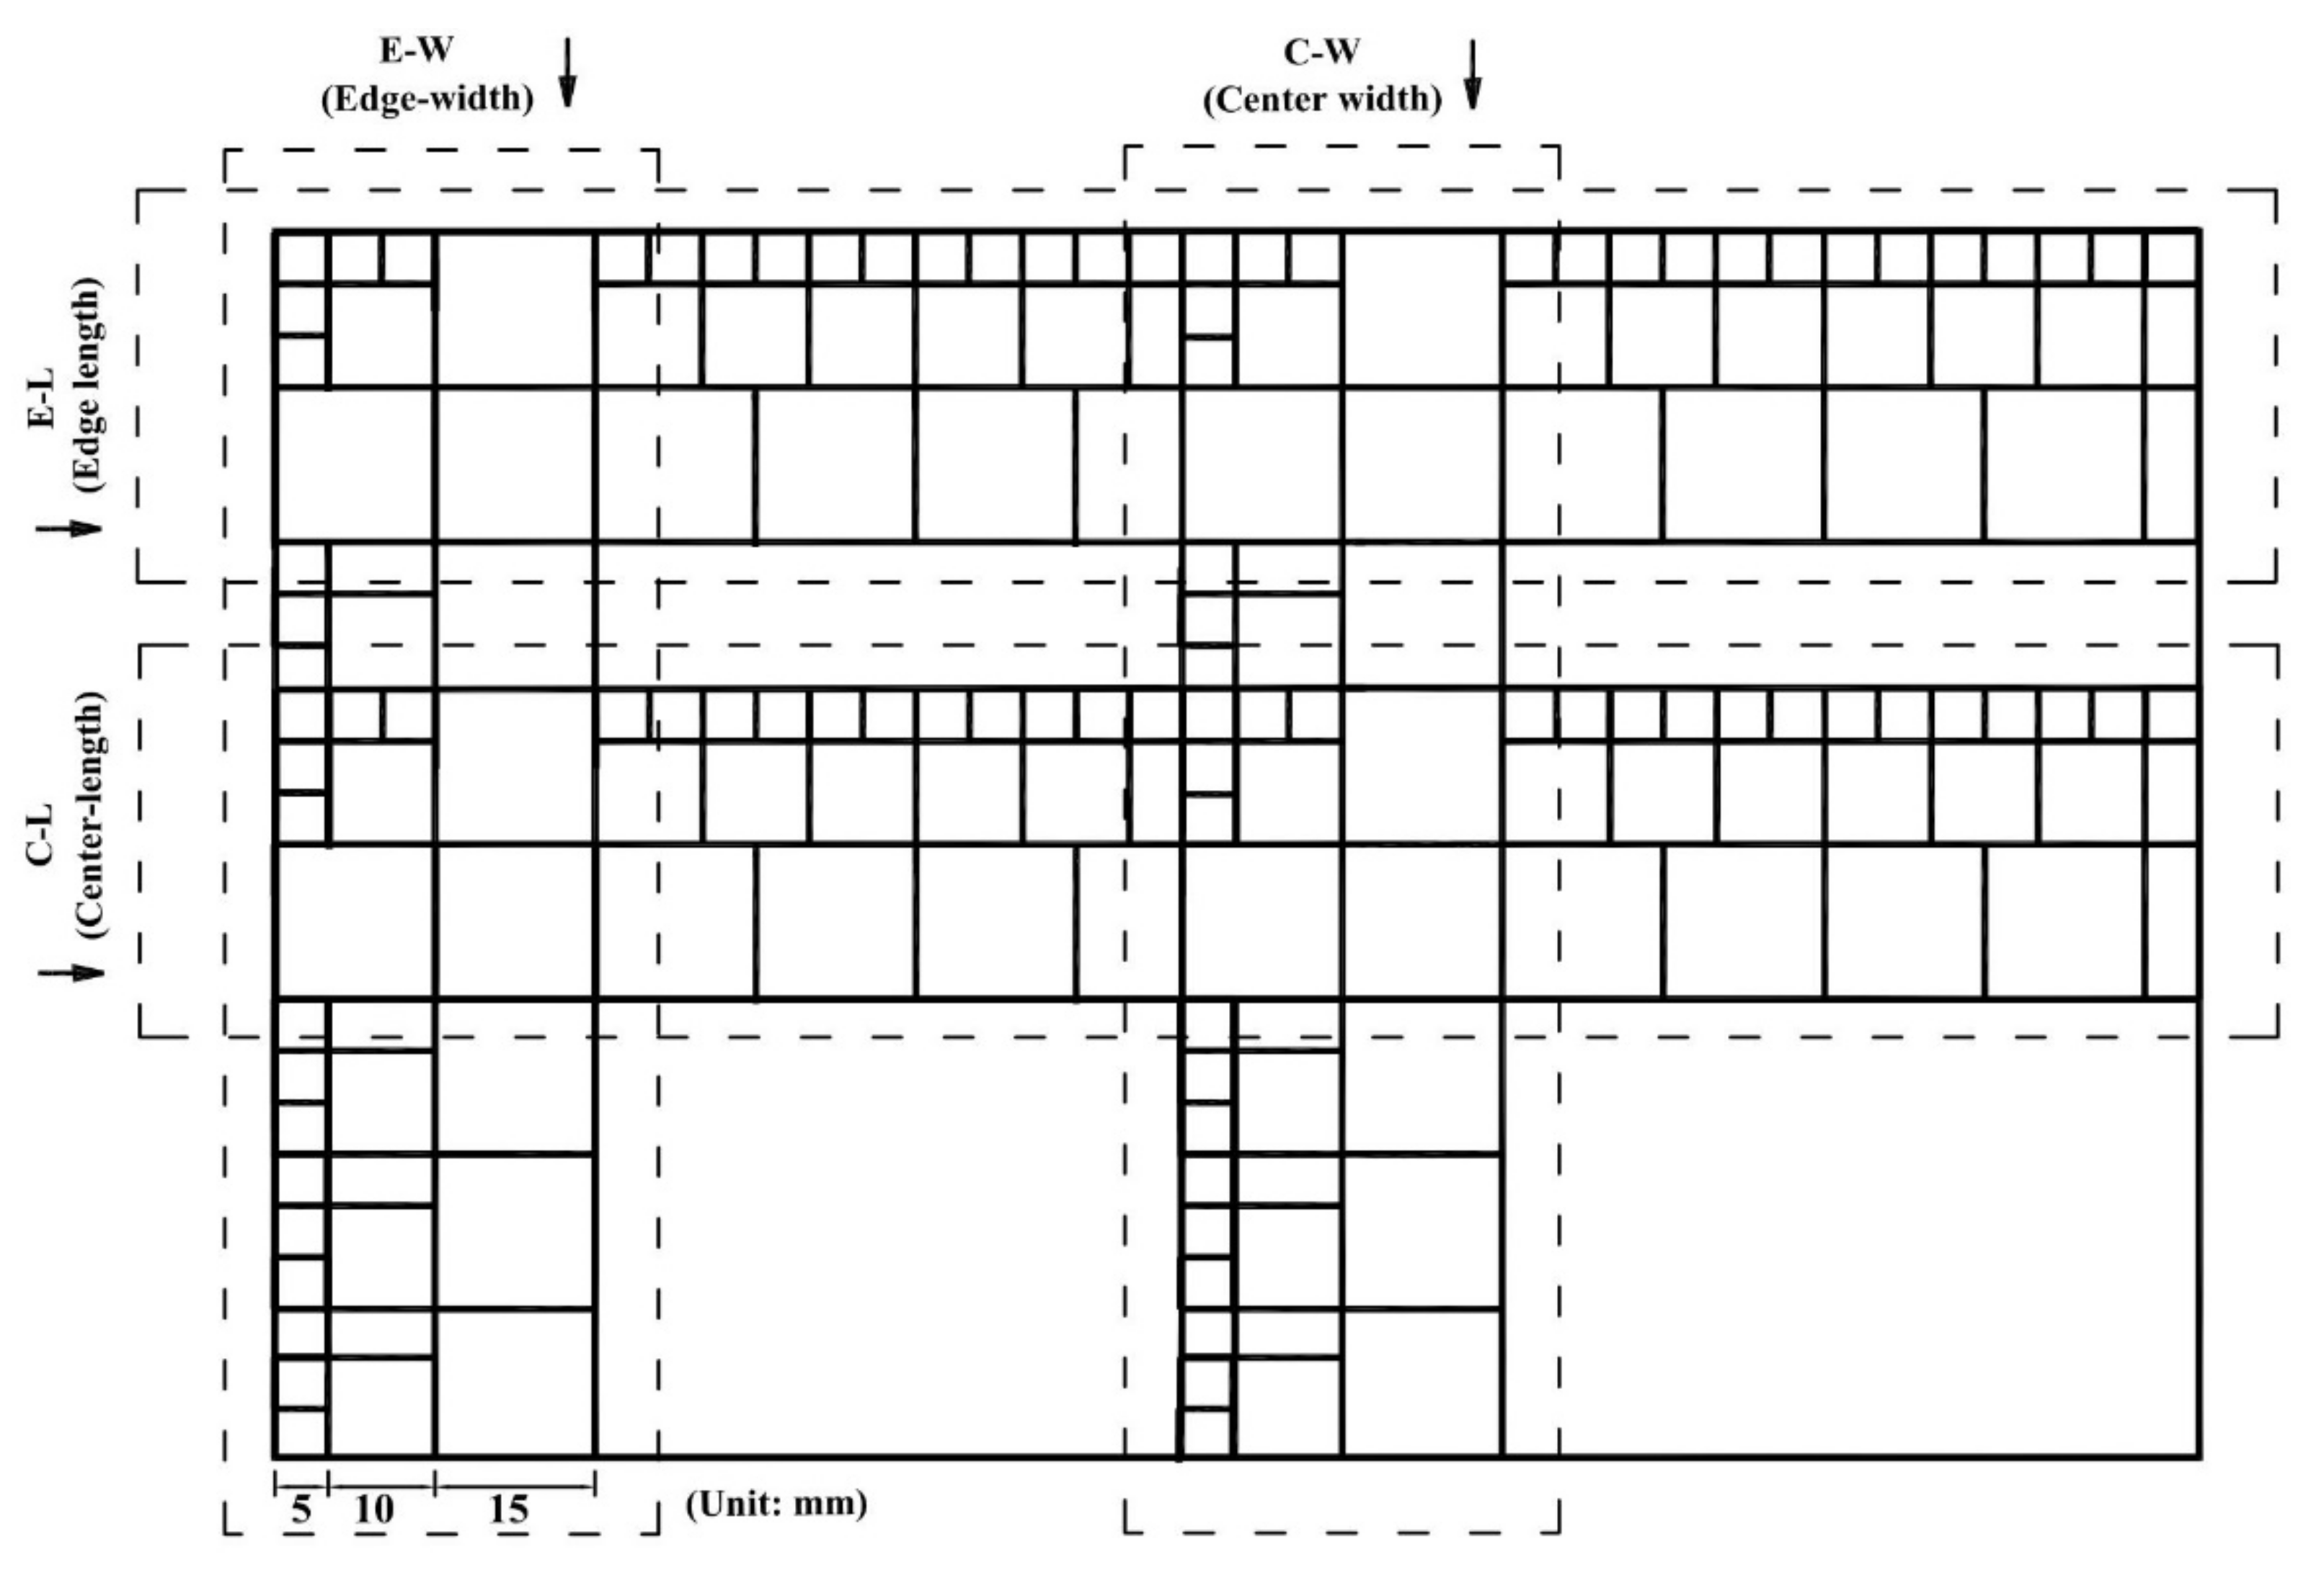
- Panel density sampling
3. Results
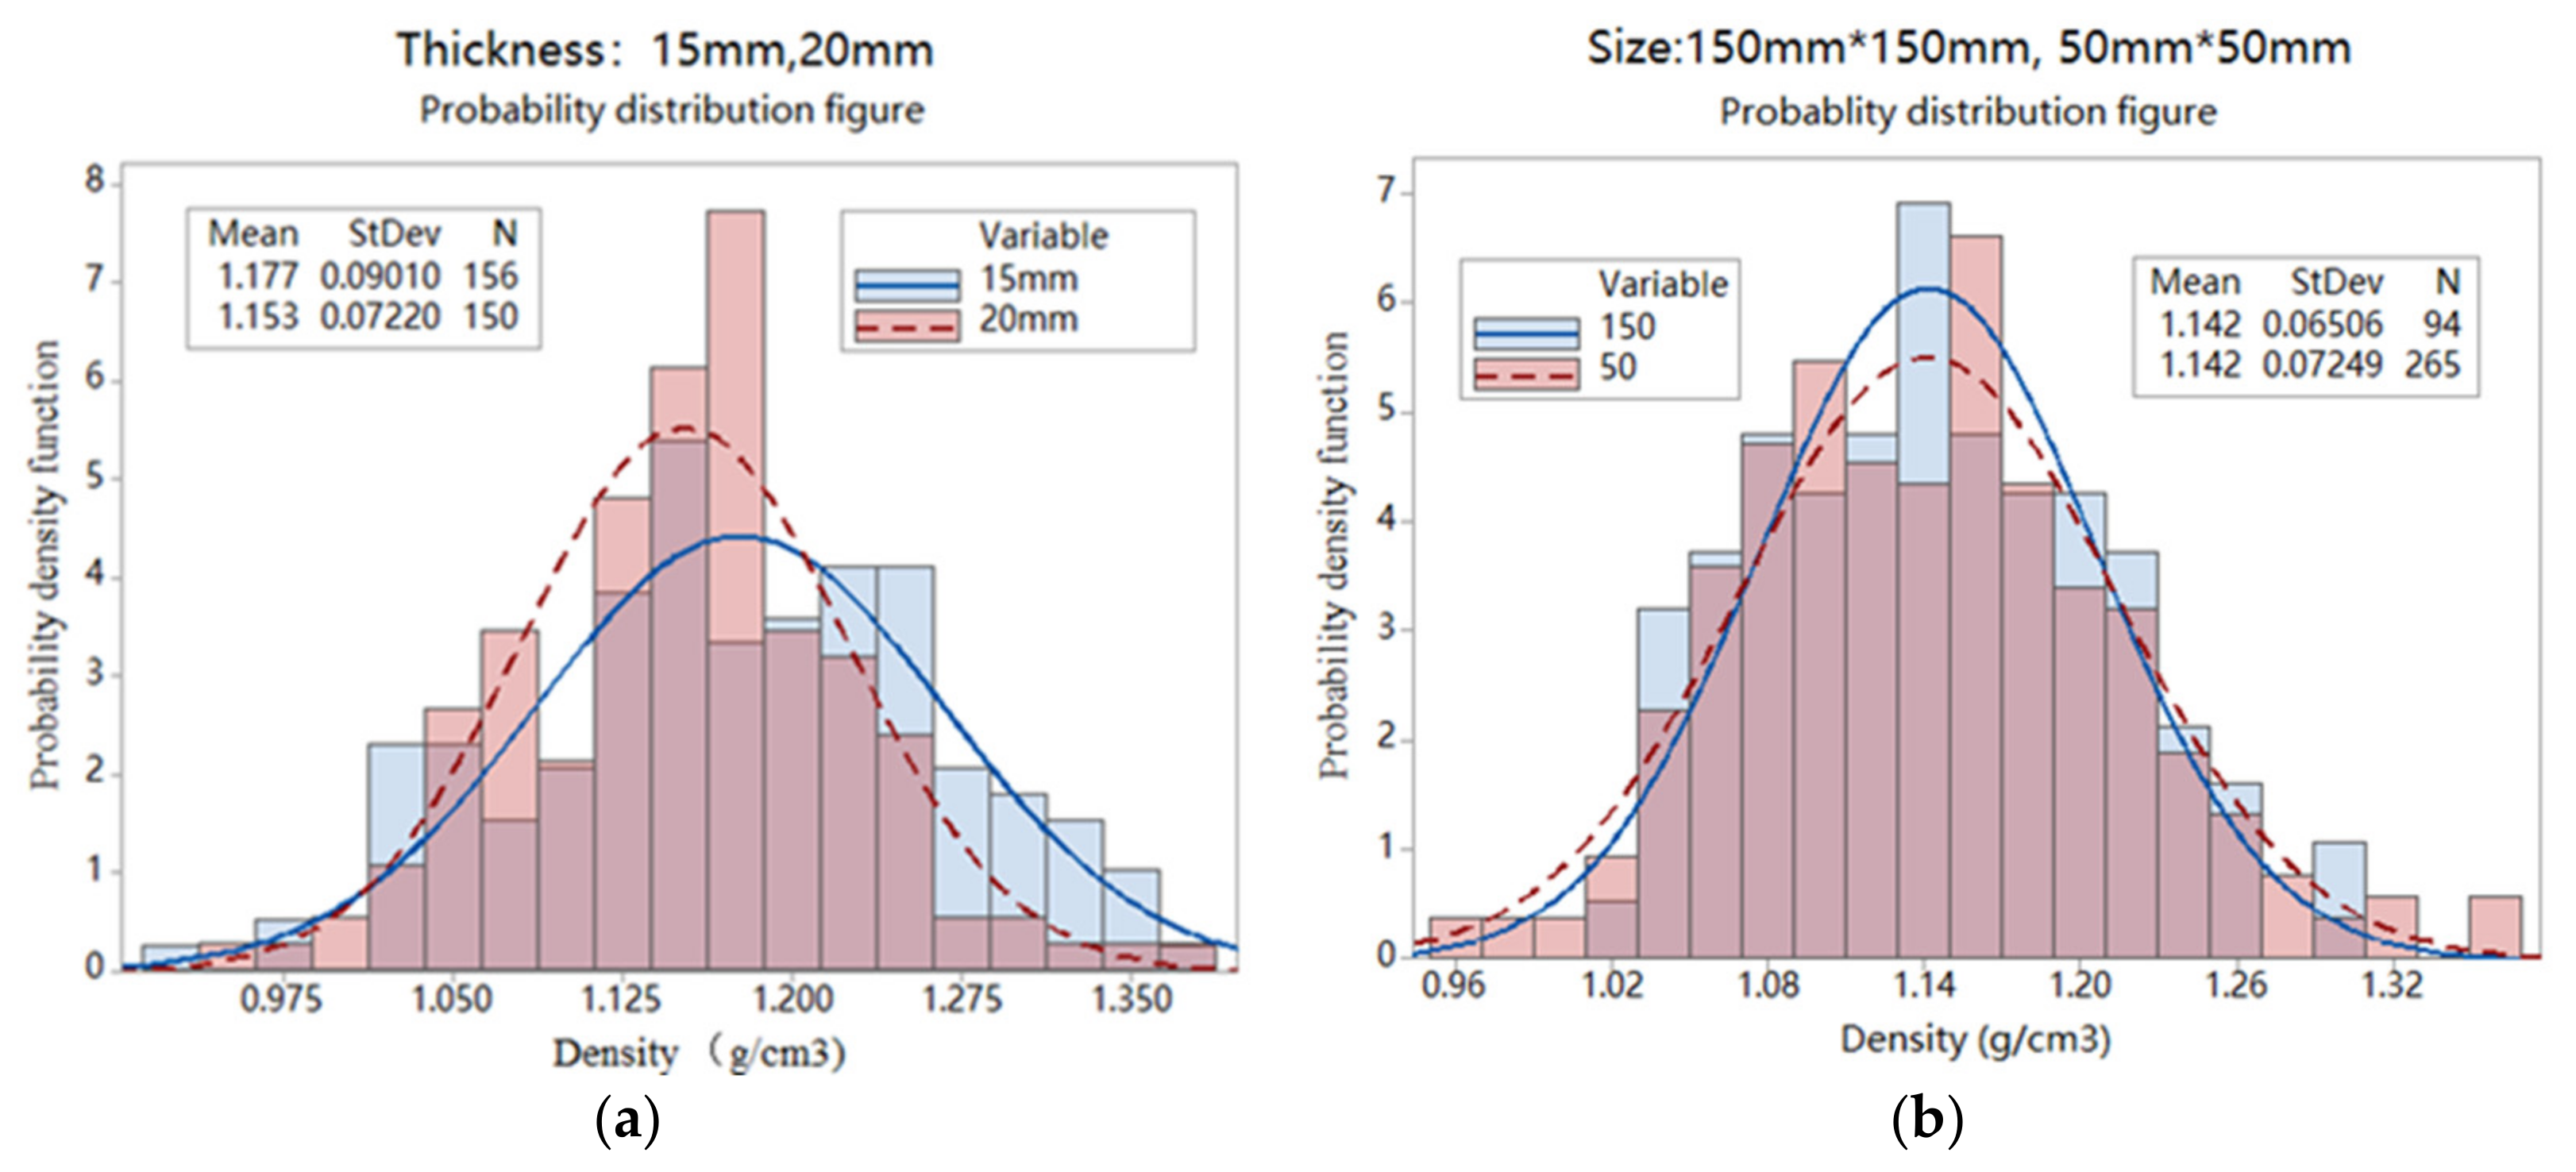
3.1. Normal Density Distribution
3.2. Comparing BFC with Wood Composites
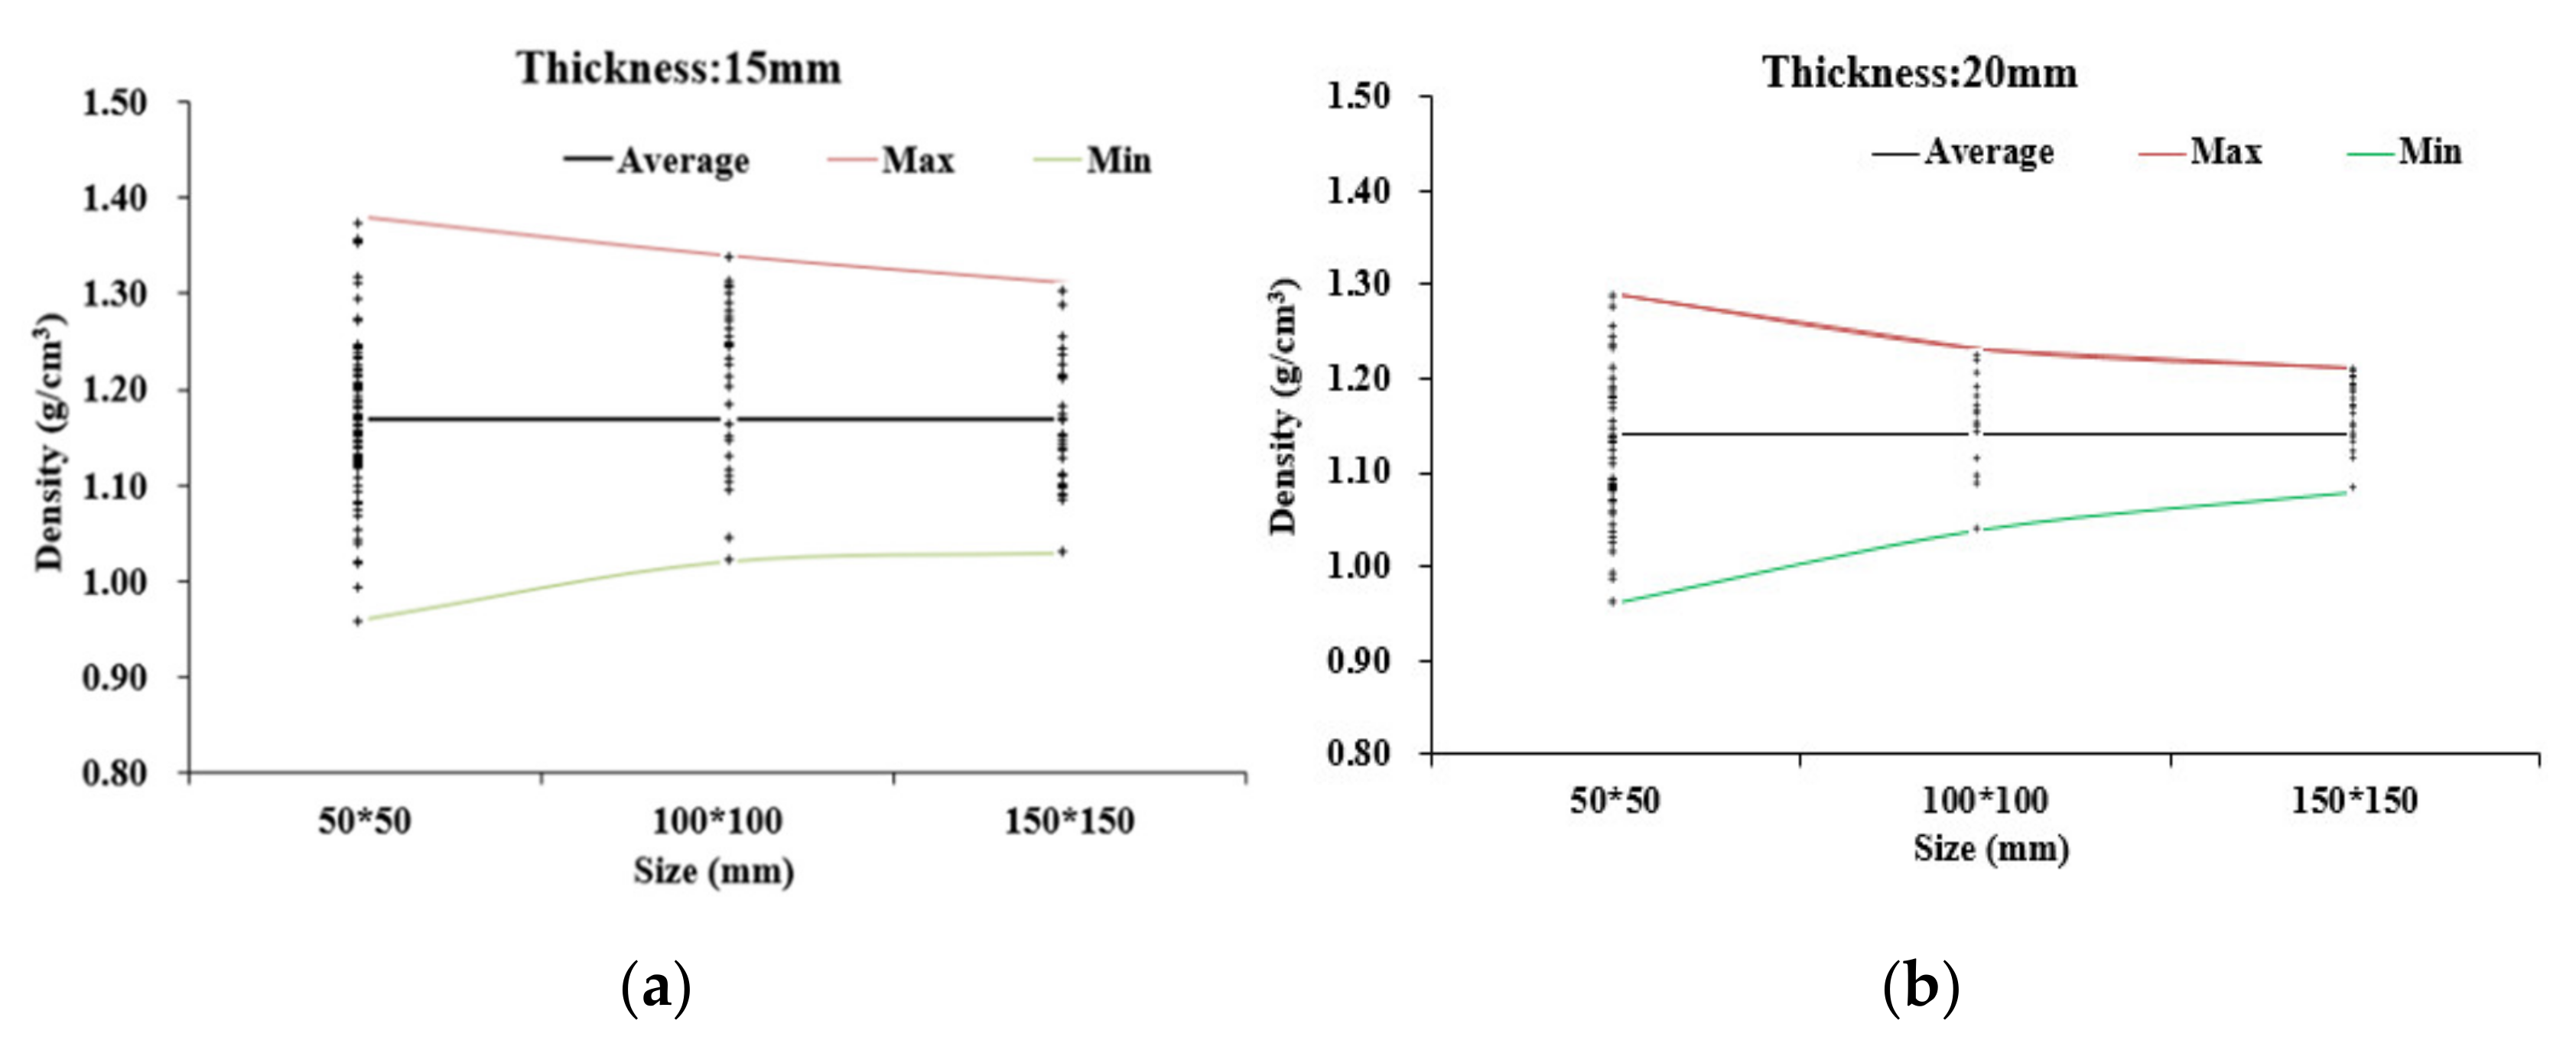
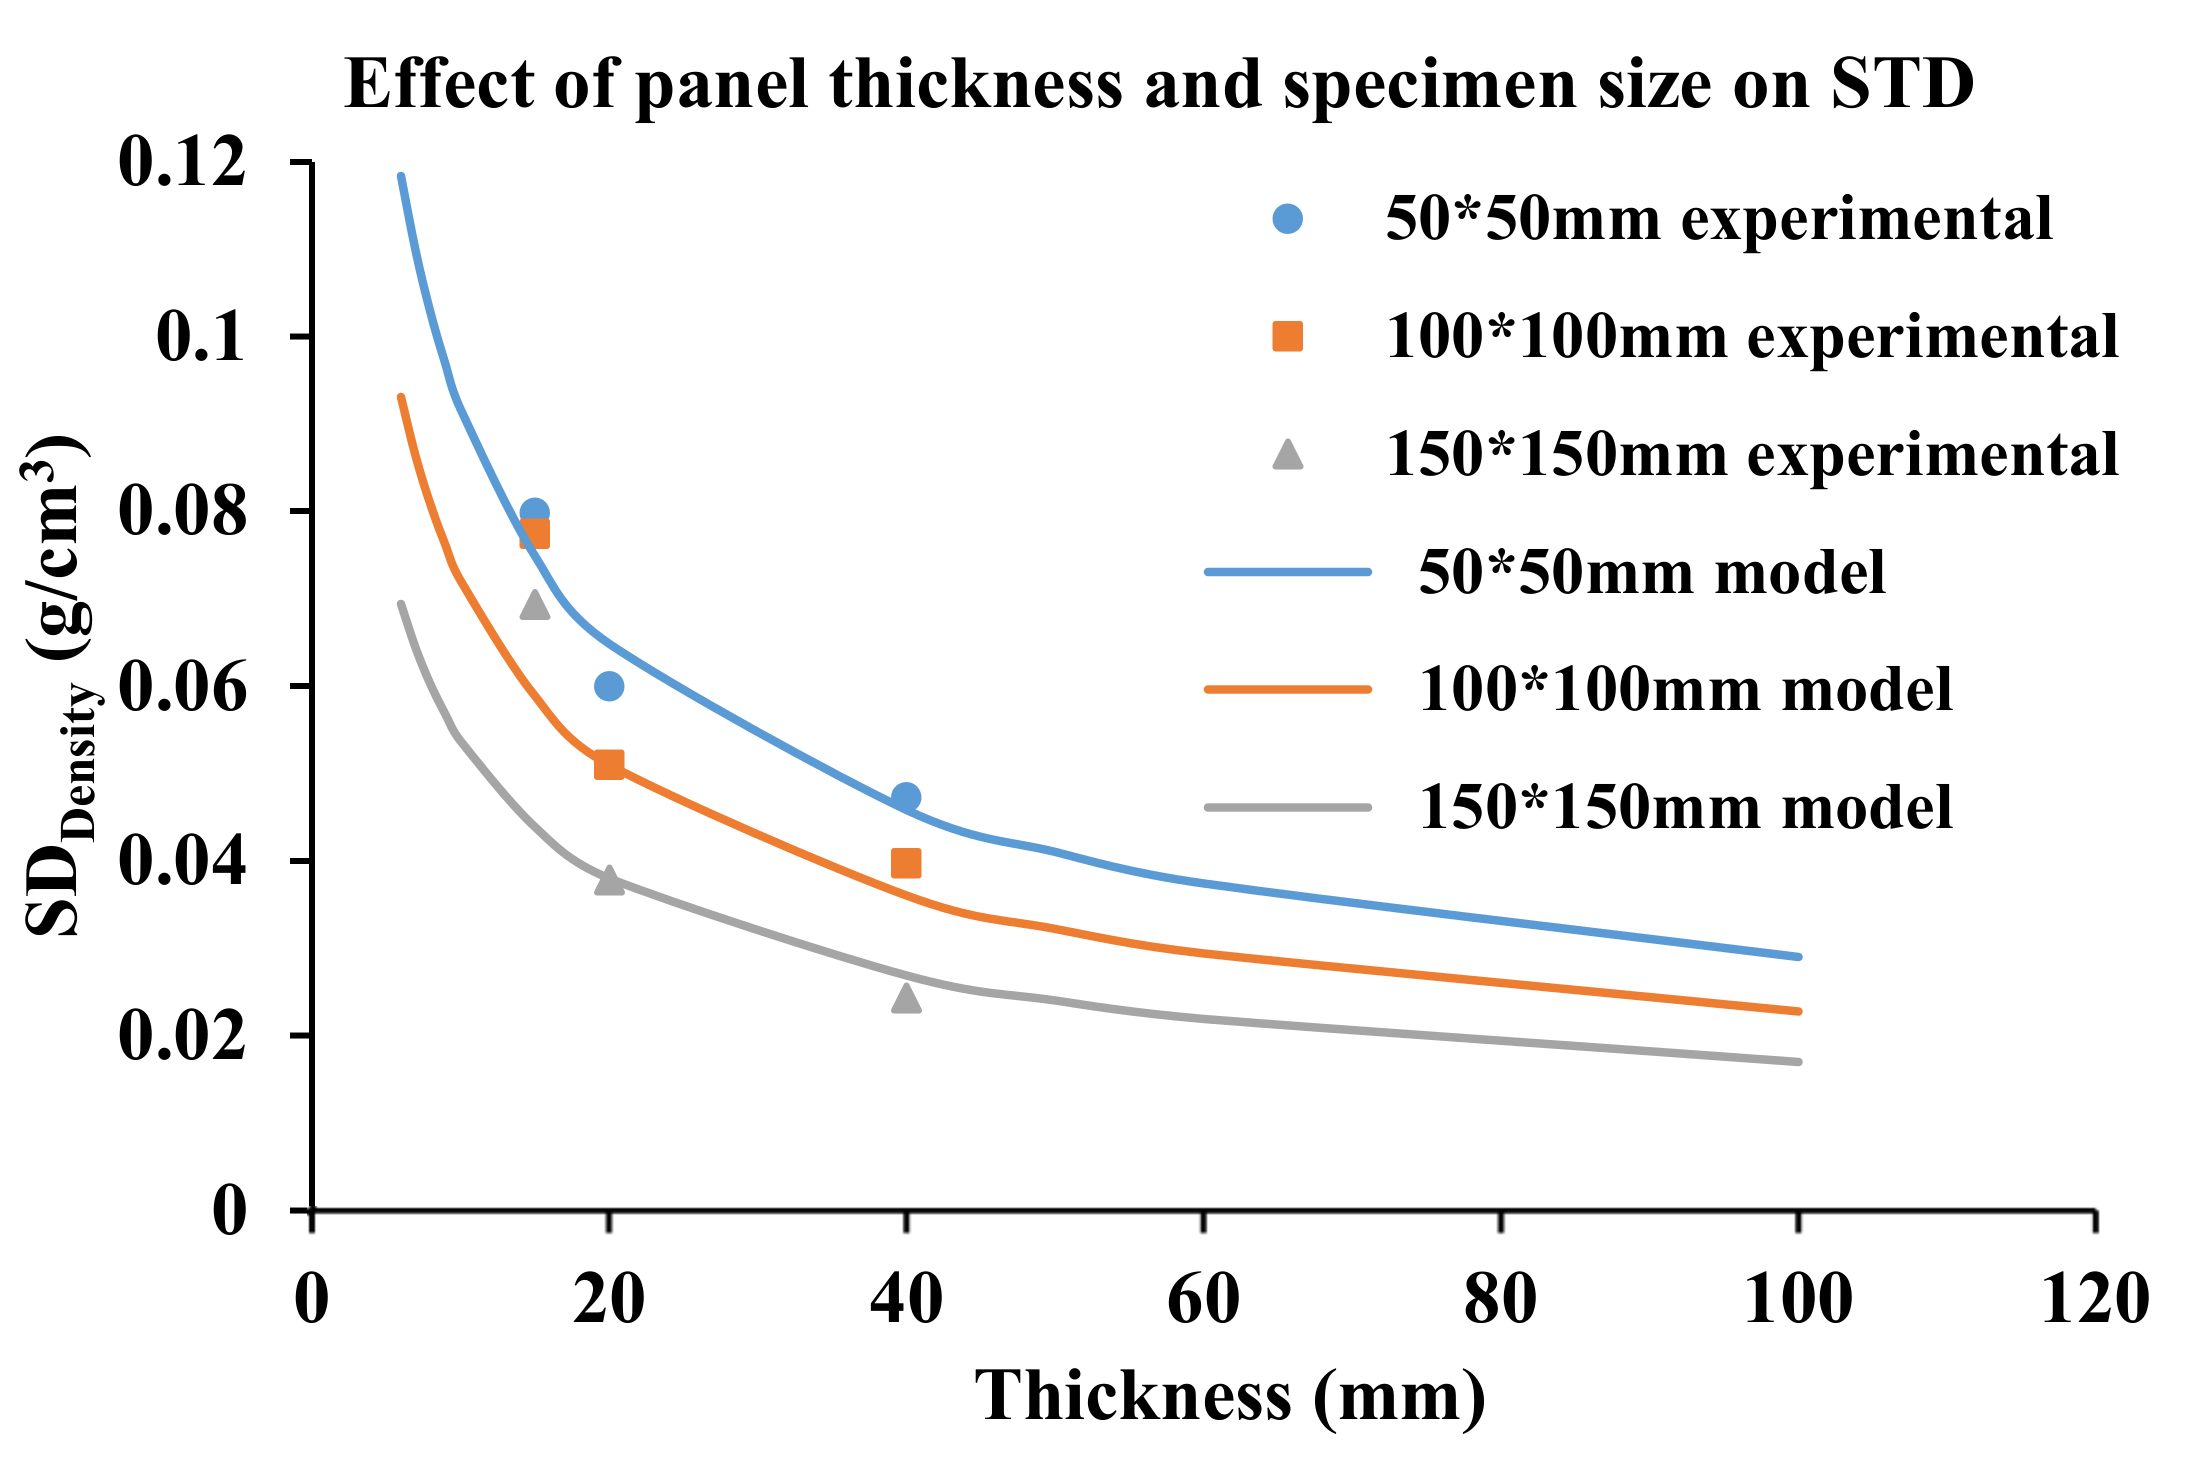
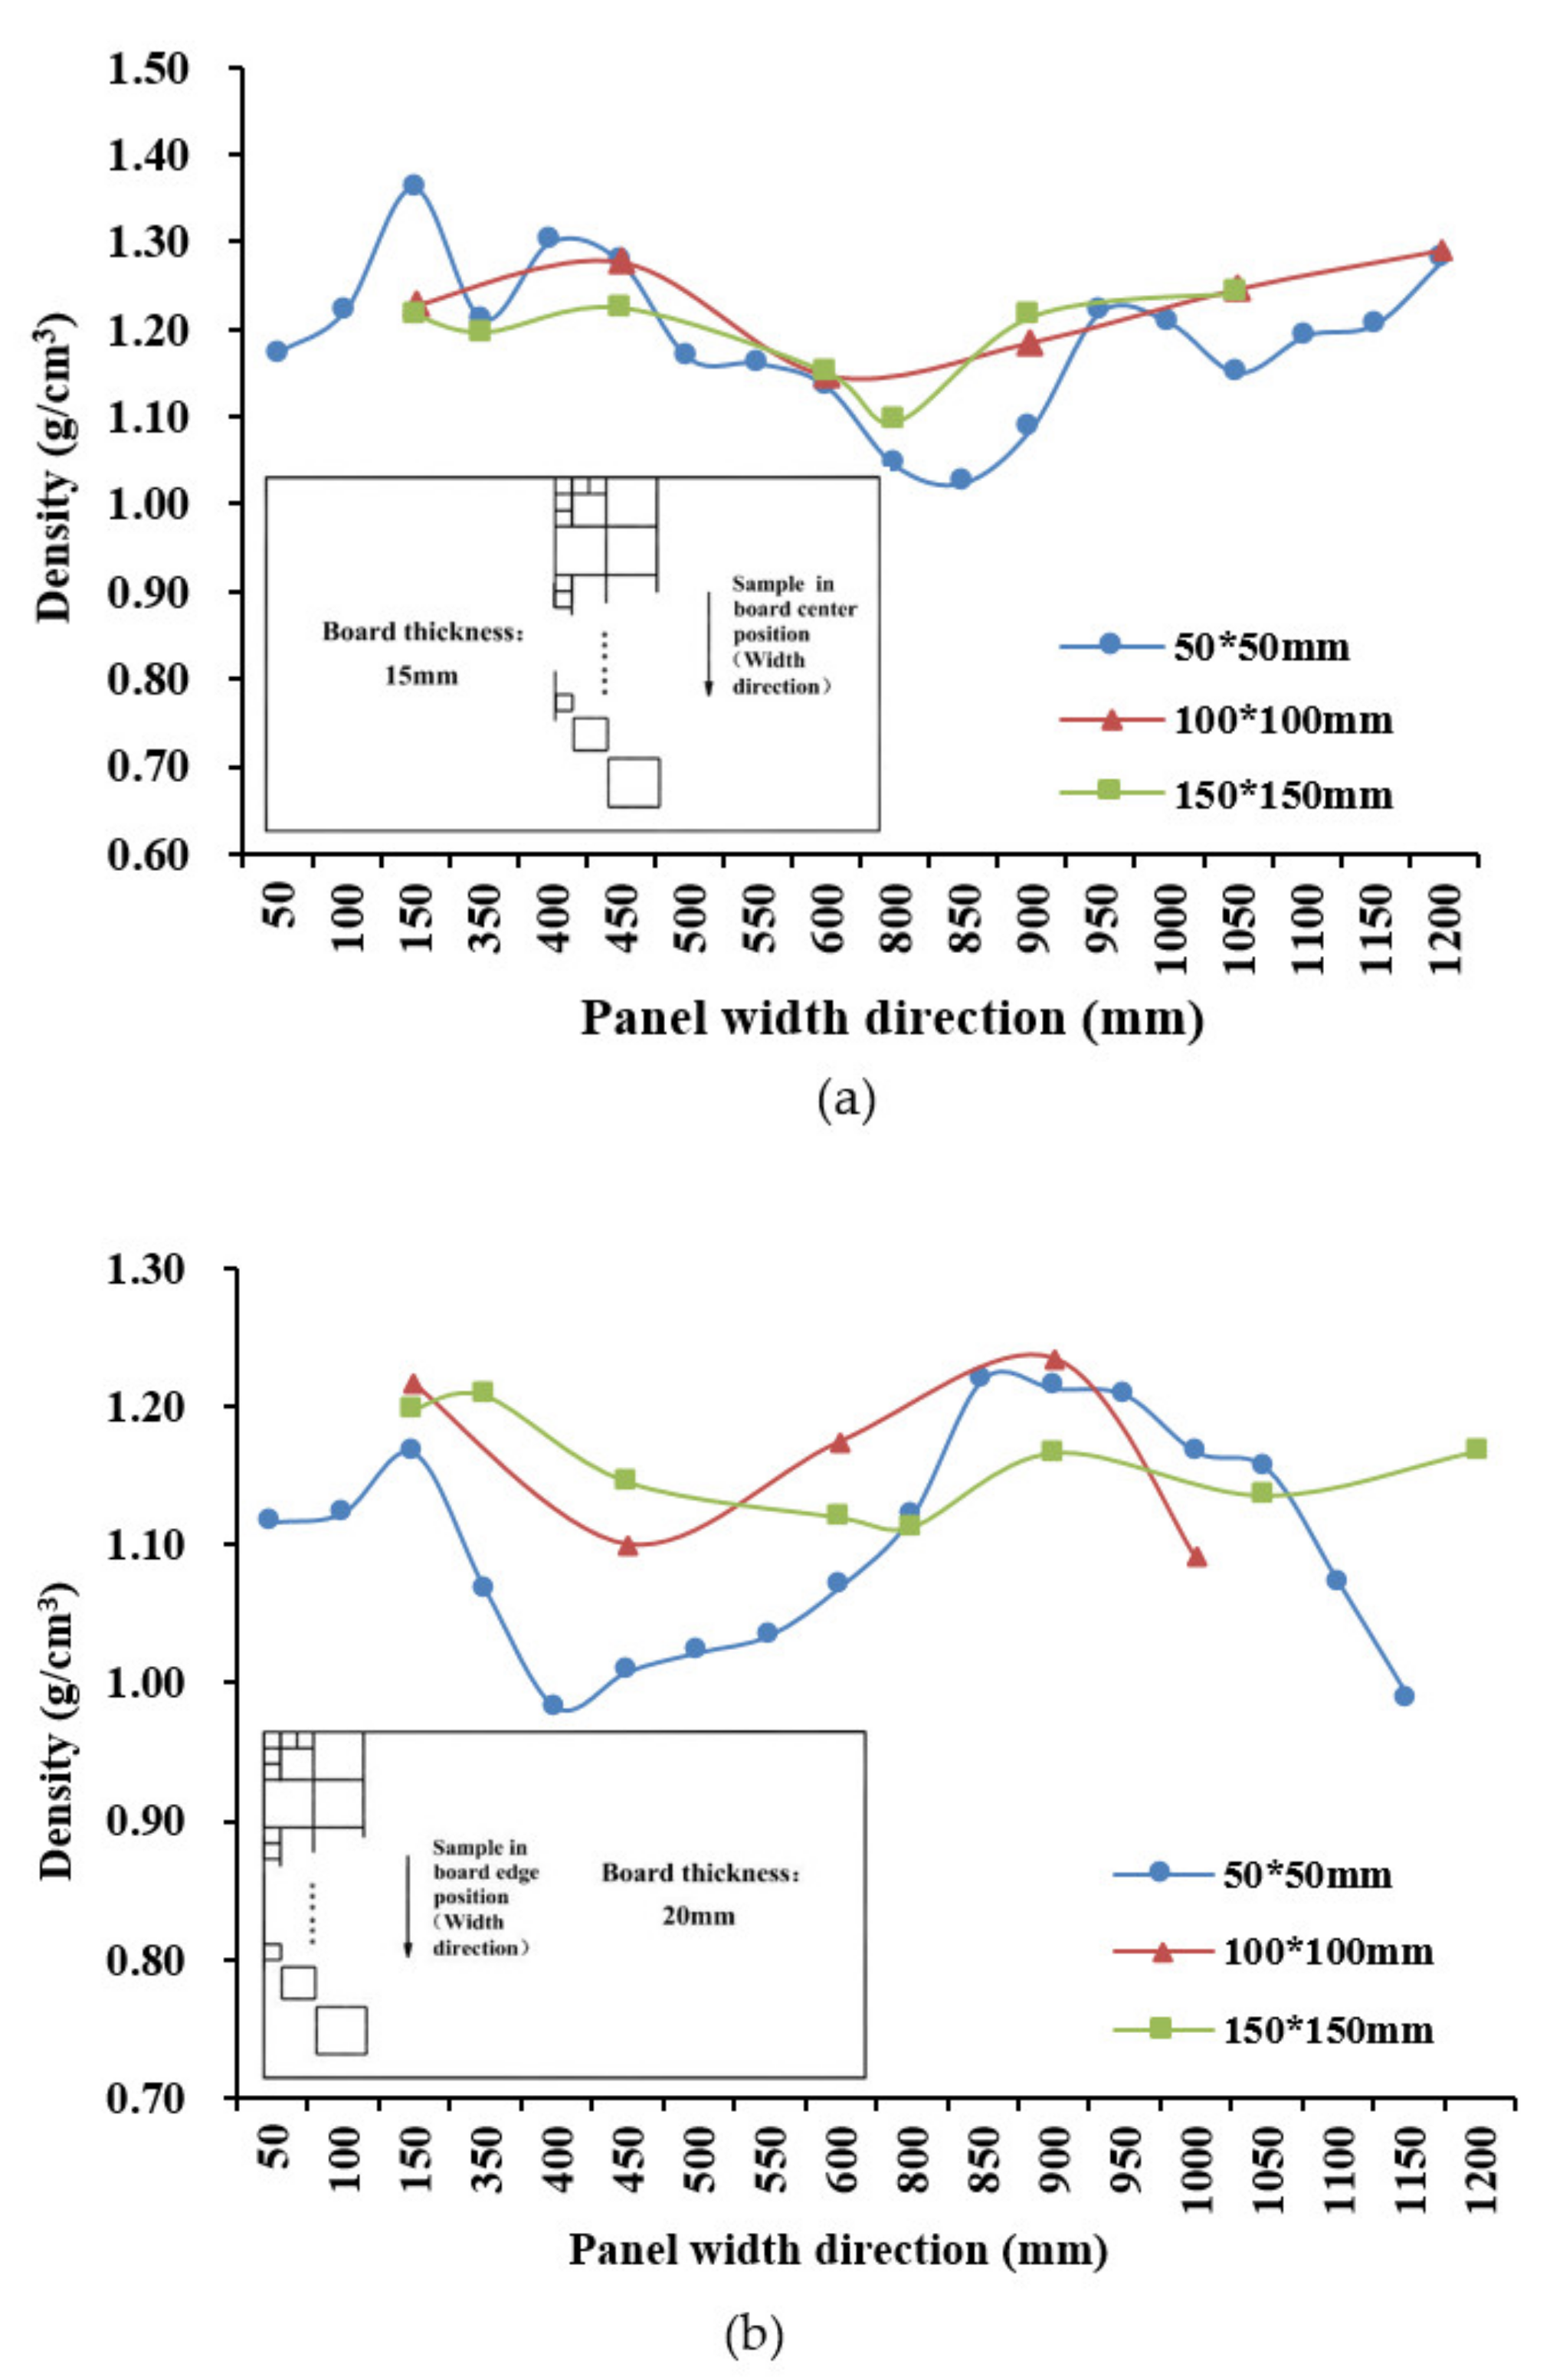
3.3. Effects of Panel Thickness and Specimen Size
3.4. Spatial Variation
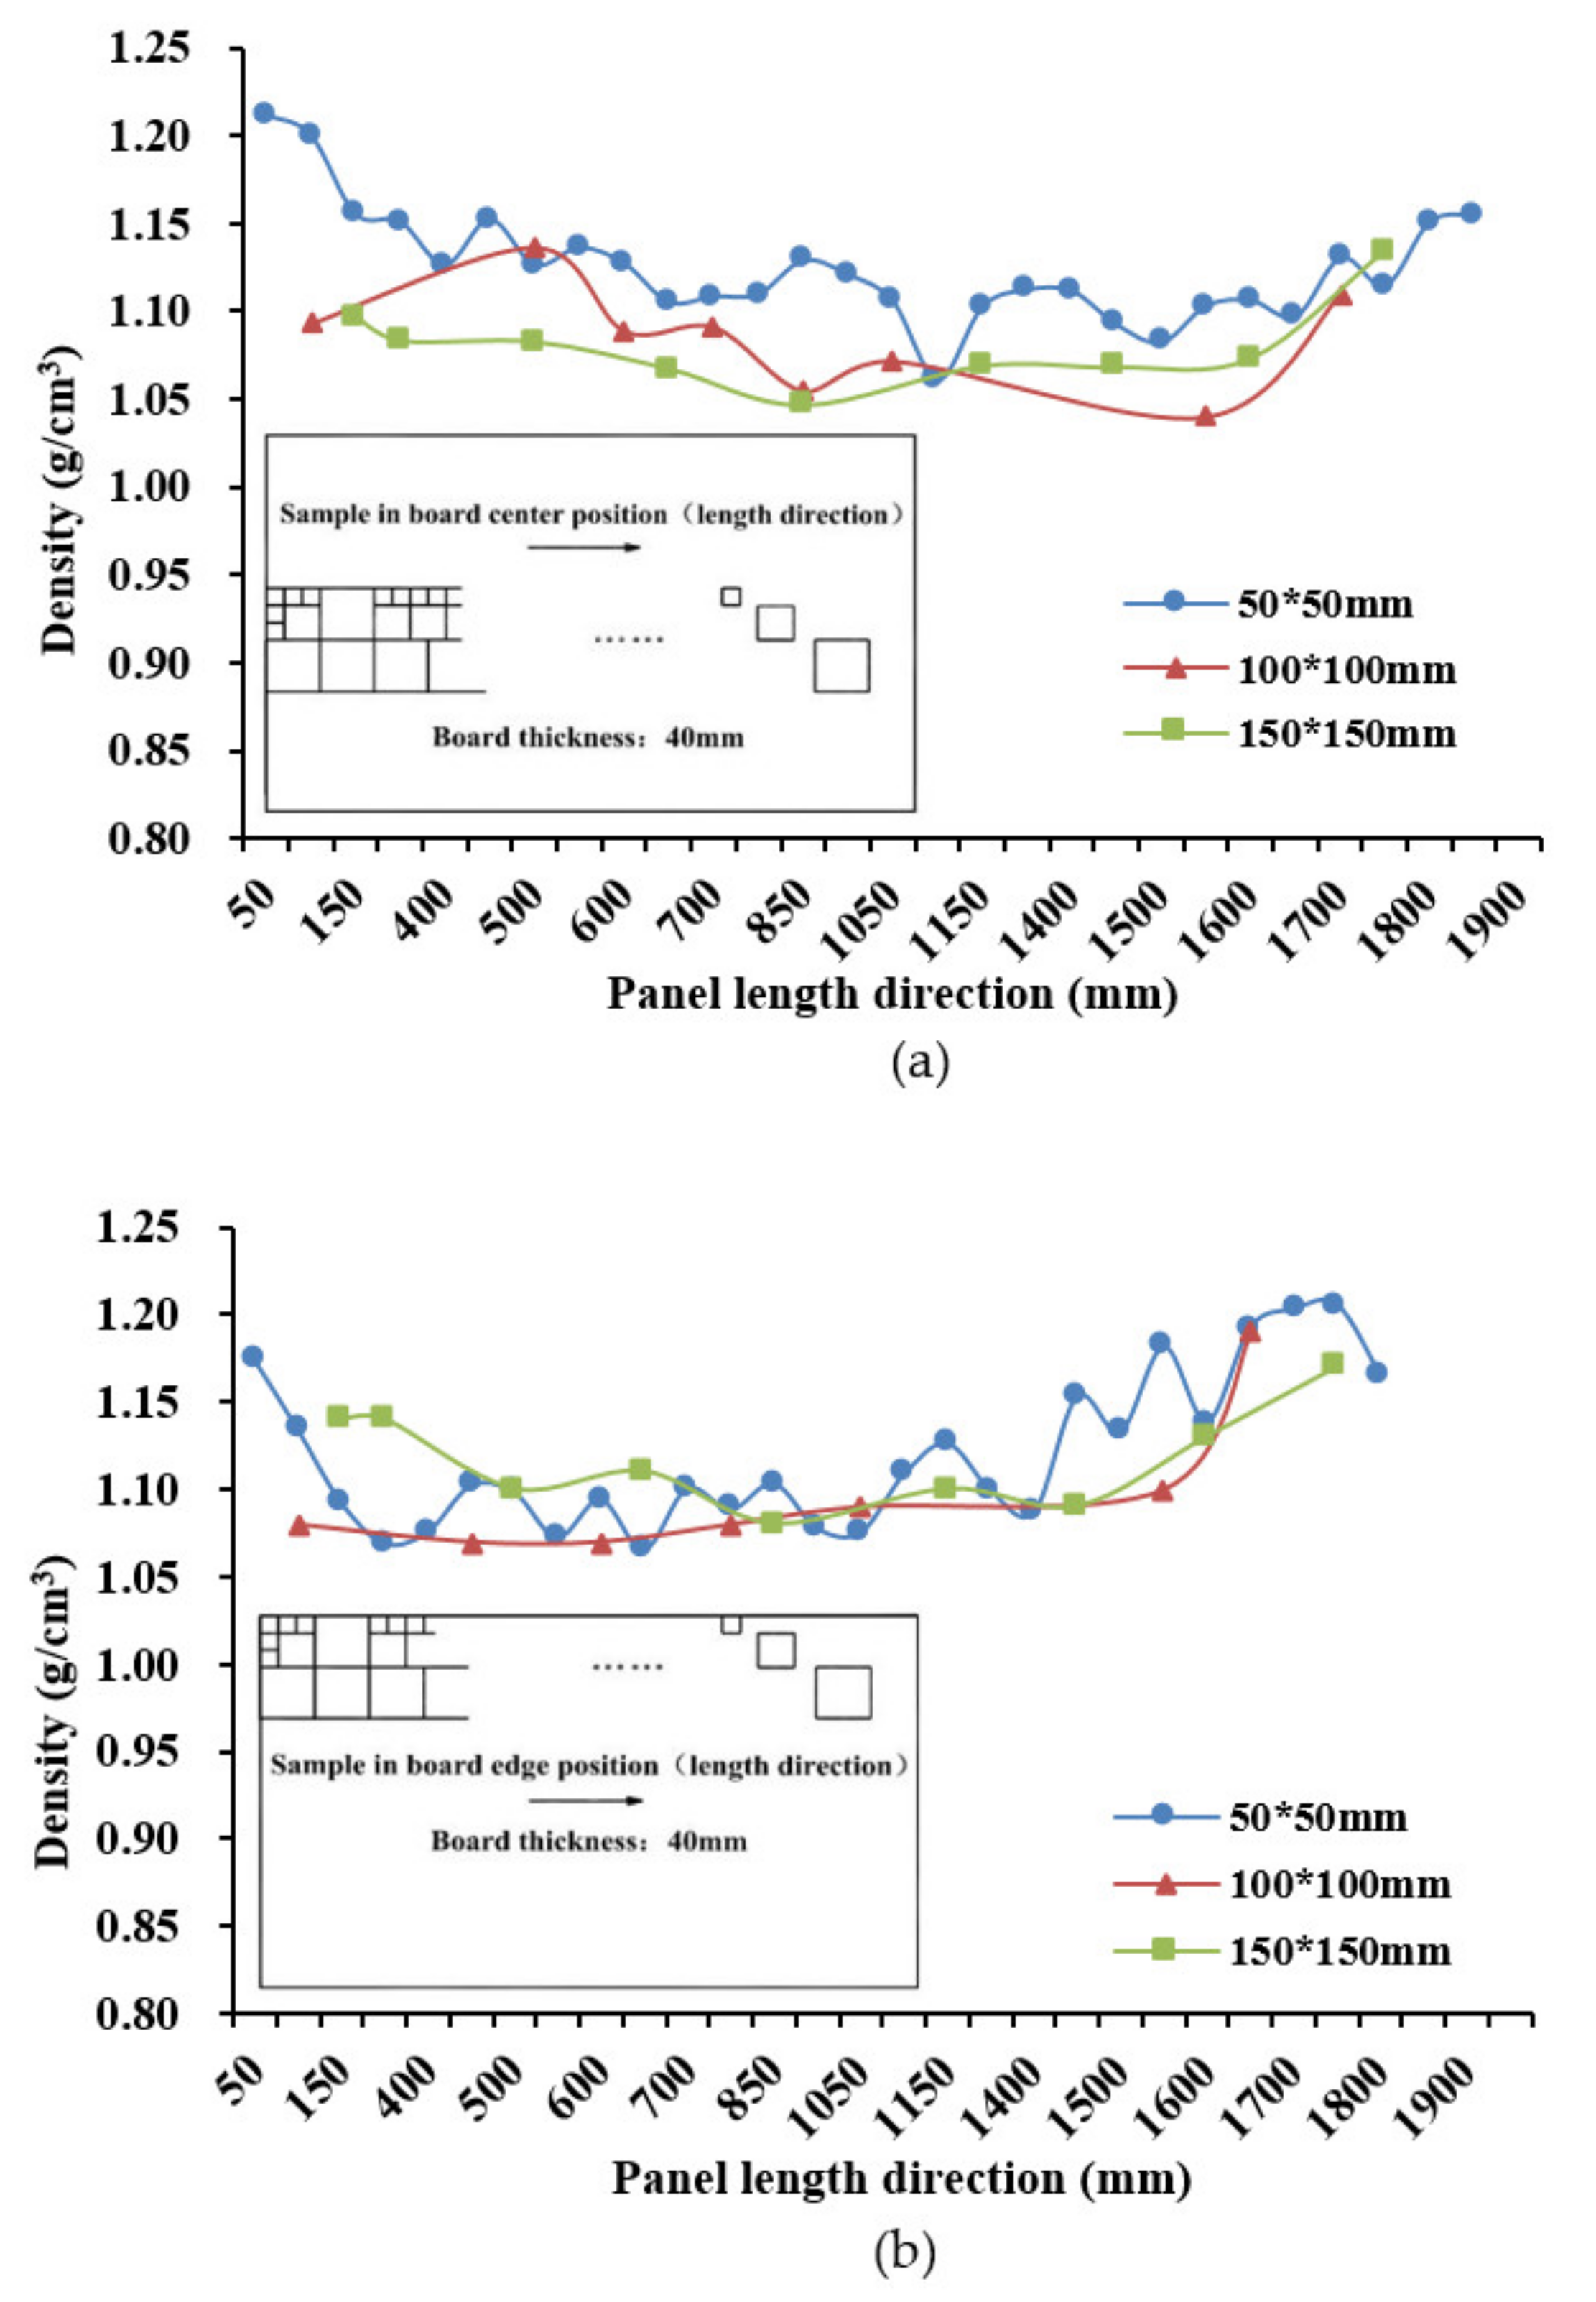
3.4.1. Density Distribution along the Length of the Panel
3.4.2. Density Distribution across the Width of the Panel
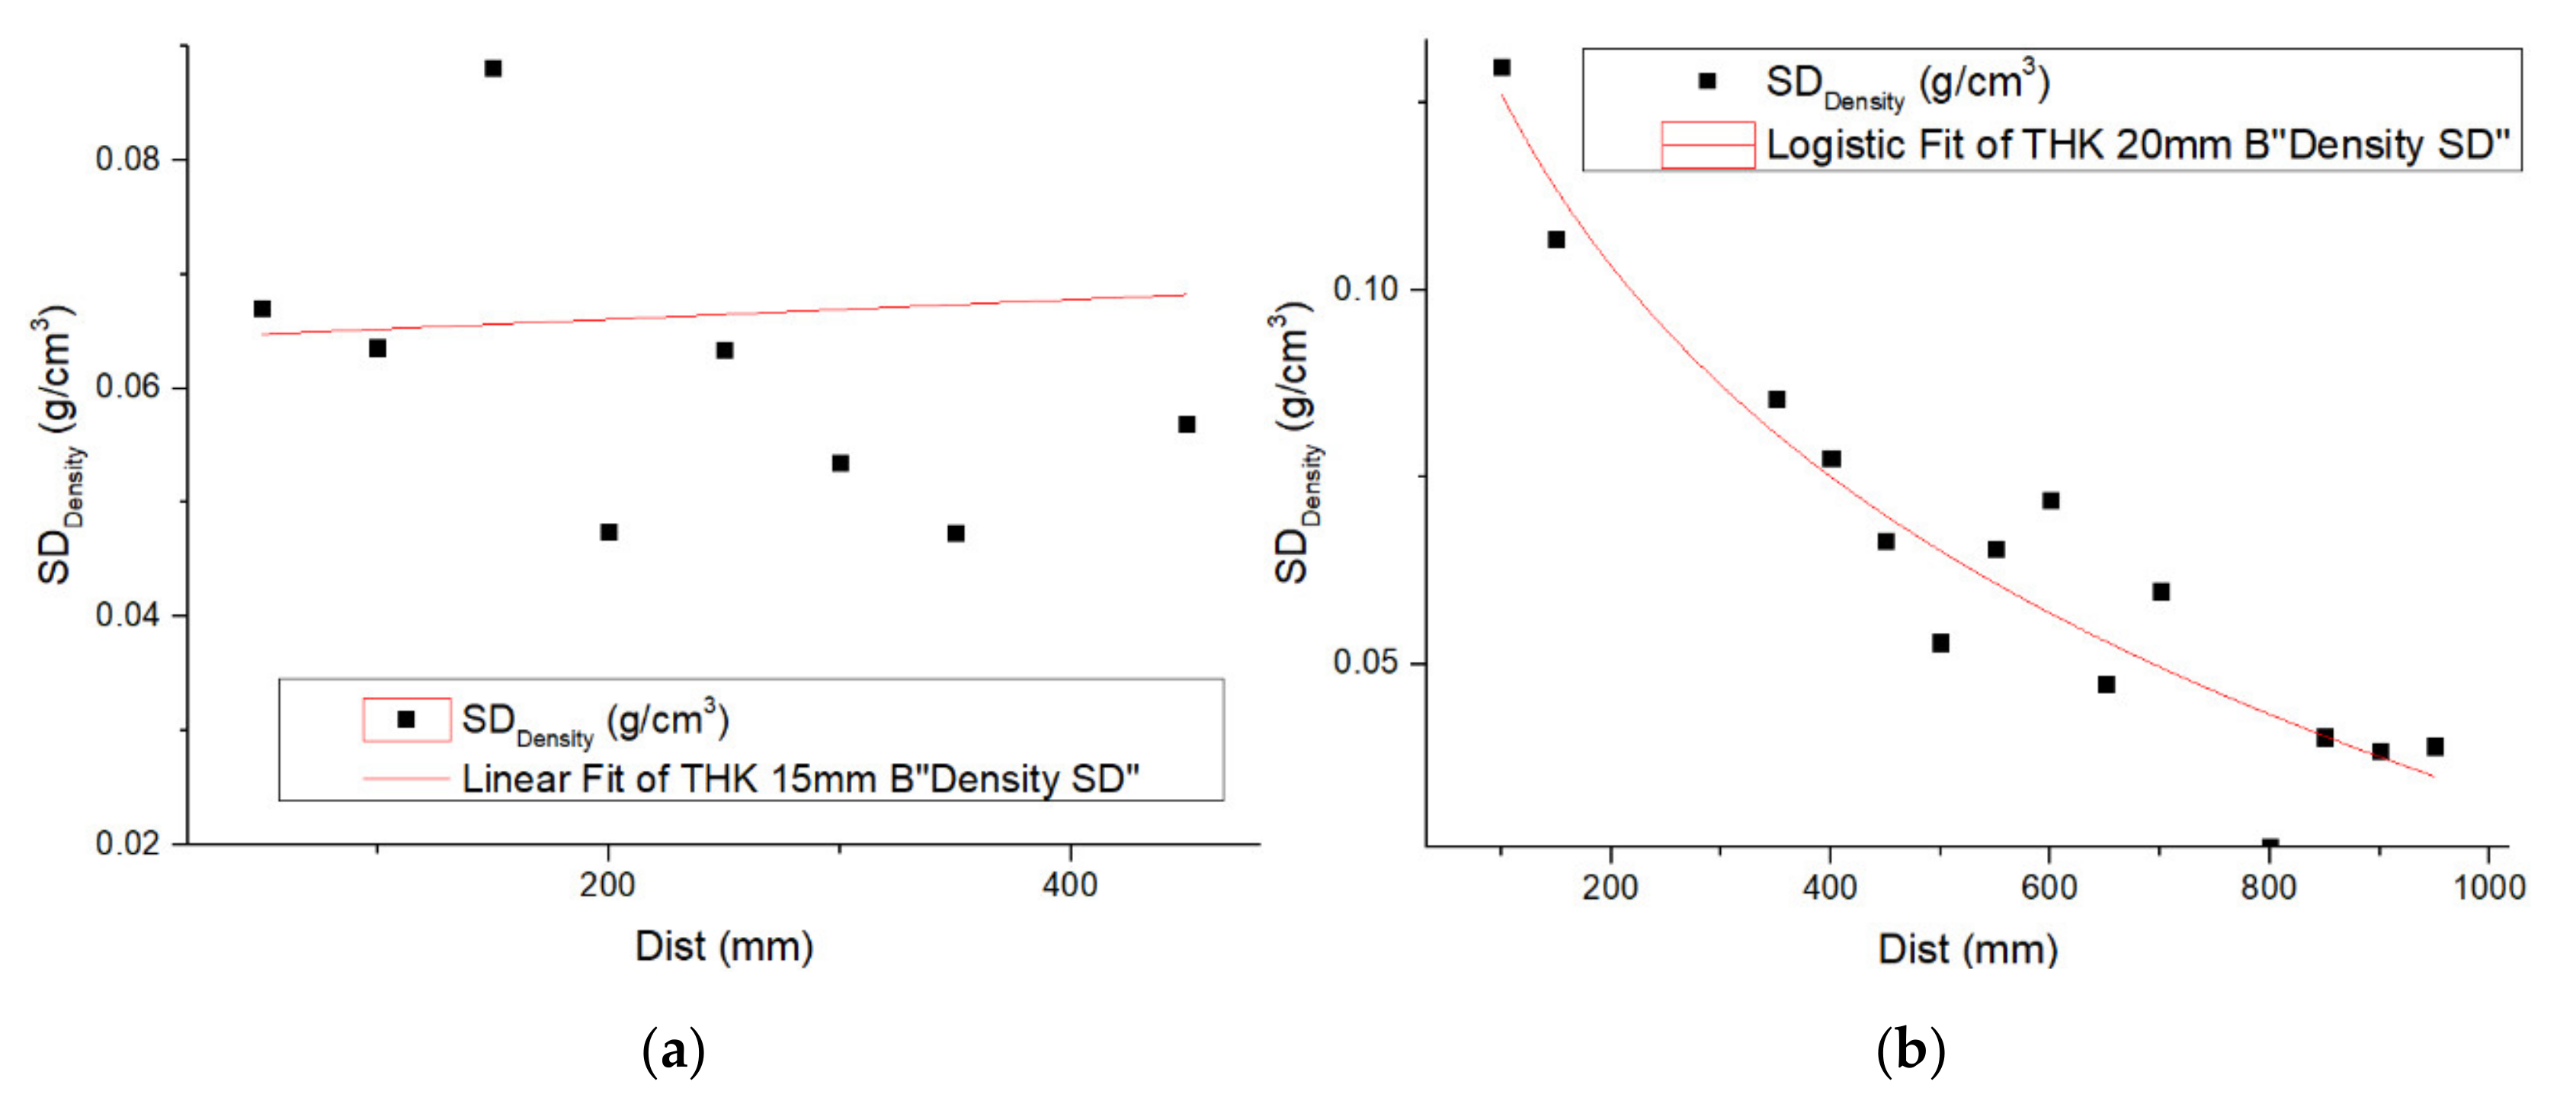
3.4.3. Density Standard Deviation along and Cross the Panel
4. Conclusions
Author Contributions
Funding
Institutional Review Board Statement
Informed Consent Statement
Data Availability Statement
Conflicts of Interest
References
- Fu, J. Chinese moso bamboo: Its importance. Bamboo 2001, 22, 5–7. [Google Scholar]
- Chen, M.; Ye, L.; Li, H.; Wang, G.; Chen, Q.; Fang, C.; Dai, C.; Fei, B. Flexural strength and ductility of moso bamboo. Constr. Build. Mater. 2020, 246, 118418. [Google Scholar] [CrossRef]
- Huang, Y.; Ji, Y.; Yu, W. Development of bamboo scrimber: A literature review. J. Wood Sci. 2019, 65, 25. [Google Scholar] [CrossRef]
- Yu, Y.-L.; Huang, X.-A.; Yu, W.-J. High performance of bamboo-based fiber composites from long bamboo fiber bundles and phenolic resins. J. Appl. Polym. Sci. 2014, 131, 131. [Google Scholar] [CrossRef]
- Kumar, A.; Vlach, T.; Laiblova, L.; Hrouda, M.; Kasal, B.; Tywoniak, J.; Hajek, P. Engineered bamboo scrimber: Influence of density on the mechanical and water absorption properties. Constr. Build. Mater. 2016, 127, 815–827. [Google Scholar] [CrossRef]
- Sharma, B.; Gatóo, A.; Bock, M.; Ramage, M. Engineered bamboo for structural applications. Constr. Build. Mater. 2015, 81, 66–73. [Google Scholar] [CrossRef]
- Yu, Y.; Zhu, R.; Wu, B.; Hu, Y.; Yu, W. Fabrication, material properties, and application of bamboo scrimber. Wood Sci. Technol. 2014, 49, 83–98. [Google Scholar] [CrossRef]
- Yu, Y.; Huang, Y.; Zhang, Y.; Liu, R.; Meng, F.; Yu, W. The reinforcing mechanism of mechanical properties of bamboo fiber bundle-reinforced composites. Polym. Compos. 2018, 40, 1463–1472. [Google Scholar] [CrossRef]
- He, S.; Xu, J.; Wu, Z.-X.; Yu, H.; Chen, Y.-H.; Song, J.-G. Effect of bamboo bundle knitting on enhancing properties of bamboo scrimber. Holzals Roh-und Werkst. 2017, 76, 1071–1078. [Google Scholar] [CrossRef]
- Li, H.; Chen, F.; Xian, Y.; Deng, J.; Wang, G.; Cheng, H. An empirical model for predicting the mechanical properties degradation of bamboo bundle laminated veneer lumber (BLVL) by hygrothermal aging treatment. Holzals Roh-und Werkst. 2017, 75, 553–560. [Google Scholar] [CrossRef]
- Chen, F.; Jiang, Z.; Wang, G.; Li, H.; Simth, L.M.; Shi, S.Q. The bending properties of bamboo bundle laminated veneer lumber (BLVL) double beams. Constr. Build. Mater. 2016, 119, 145–151. [Google Scholar] [CrossRef]
- Wang, G.; Chen, F. Development of bamboo fiber-based composites. In Advanced High Strength Natural Fibre Composites in Construction; Elsevier BV: Amsterdam, The Netherlands, 2017; pp. 235–255. [Google Scholar]
- Zhou, H.; Wei, X.; Smith, L.M.; Wang, G.; Chen, F. Evaluation of Uniformity of Bamboo Bundle Veneer and Bamboo Bundle Laminated Veneer Lumber (BLVL). Forests 2019, 10, 921. [Google Scholar] [CrossRef]
- Yu, Y.; Huang, X.; Yu, W. A novel process to improve yield and mechanical performance of bamboo fiber reinforced composite via mechanical treatments. Compos. Part B Eng. 2014, 56, 48–53. [Google Scholar] [CrossRef]
- Wang, B.; Ellis, S.; Dai, C. Veneer surface roughness and compressibility pertaining to plywood/LVL manufacturing. part II. Optimum panel densification. Wood Fiber Sci. 2006, 38, 727–735. [Google Scholar]
- Gereke, T.; Malekmohammadi, S.; Nadot-Martin, C.; Dai, C.; Ellyin, F.; Vaziri, R. Multiscale Stochastic Modeling of the Elastic Properties of Strand-Based Wood Composites. J. Eng. Mech. 2012, 138, 791–799. [Google Scholar] [CrossRef]
- Zhou, C.; Dai, C.; Smith, G.D. Modeling vertical density profile formation for strand-based wood composites during hot pressing: Part 1. Model development. Compos. Part B Eng. 2011, 42, 1350–1356. [Google Scholar] [CrossRef]
- Dai, C.; Yu, C.; Hubert, P. Modeling vertical density profile in wood composite boards. In Proceedings of the 5th Pacific Rim Bio-based Composites symposium, Canberra, Australia, 10–14 December 2000; pp. 220–226. [Google Scholar]
- Dai, C.; Yu, C.; Zhou, X. Heat and mass transfer in wood composite panels during hot pressing. Part II. Modeling void formation and mat permeability. Wood Fiber Sci. 2007, 37, 242–257. [Google Scholar]
- Dai, C.; Yu, C.; Zhou, C. Theoretical modeling of bonding characteristics and performance of wood composites. Part I. Inter-element contact. Wood Fiber Sci. 2007, 39, 48–55. [Google Scholar]
- Suchsland, O. An Analysis of the Particle Board Process. Michigan Quarterly Bulletin 1959, 42, 350–372. [Google Scholar]
- Suchsland, O.; Xu, H. A simulation of the horizontal density distribution in a flakeboard. For. Prod. J. 1989, 39, 29–33. [Google Scholar]
- Dai, C.; Steiner, P. Spatial structure of wood composites in relation to processing and performance characteristics. Part III. Modelling and simulation of a random multi-layered flake mat. Wood Sci. Technol. 1994, 28, 229–239. [Google Scholar] [CrossRef]
- Dai, C.; Steiner, P.R. On horizontal density variation in randomly-formed short-fibre wood composite boards. Compos. Part A Appl. Sci. Manuf. 1997, 28, 57–64. [Google Scholar] [CrossRef]
- Steiner, P.; Dai, C. Spatial structure of wood composites in relation to processing and performance characteristics. Part I. Rationale for model development. Wood Sci. Technol. 1993, 28, 45–51. [Google Scholar] [CrossRef]
- He, G.; Feng, M.; Dai, C. Development of soy-based adhesives for the manufacture of wood composite products. Holzforschung 2012, 66, 857–862. [Google Scholar] [CrossRef]
- Oudjehane, A.; Lam, F. On the density profile within random and oriented wood-based composite panels: Horizontal distribution. Compos. Part B Eng. 1998, 29, 687–694. [Google Scholar] [CrossRef]
- Painter, G.; Budman, H.; Pritzker, M. Prediction of oriented strand board properties from mat formation and compression operating conditions. Part 1. Horizontal density distribution and vertical density profile. Wood Sci. Technol. 2005, 40, 139–158. [Google Scholar] [CrossRef]
- Grandmont, J.-F.; Cloutier, A.; Gendron, G.; Desjardins, R. Effect of Density on the Properties of Oriented Strandboard Web Stock Used in Wood I-Joists. For. Prod. J. 2010, 60, 592–598. [Google Scholar] [CrossRef]
- Dai, C.; Yu, C.; Xu, C.; He, G. Heat and mass transfer in wood composite panels during hot pressing: Part 4. Experimental investigation and model validation. Holzforschung 2007, 61, 83–88. [Google Scholar] [CrossRef]
- Yu, C.; Dai, C.; Wang, B.J. Heat and mass transfer in wood composite panels during hot pressing: Part 3. Predicted variations and interactions of the pressing variables. Holzforschung 2007, 61, 74–82. [Google Scholar] [CrossRef]
- Kruse, K.; Dai, C.; Pielasch, A. An analysis of strand and horizontal density distributions in oriented strand board (OSB). Holzals Roh-und Werkst. 2000, 58, 270–277. [Google Scholar] [CrossRef]
- Yang, X.; Chai, Y.; Liu, H.; Sun, Z.; Jiang, Z. Study on size classification of bamboo stem and round bamboo. J. For. Eng. 2019, 4, 53–58. [Google Scholar] [CrossRef]


| Factor | Levels | N/Panel | Total |
|---|---|---|---|
| Specimen size | 50 × 50-mm2 | 96 | 288 |
| 100 × 100-mm2 | 38 | 114 | |
| 150 × 150-mm2 | 36 | 108 |
| Composite Type | MDF 1 | PB Structural 1 | PB Furniture 1 | Wafer Board 1 | OSB 1 | BFC 2 |
|---|---|---|---|---|---|---|
| Element | Fibers | Particles | Particles | Wafers | Strands | Strips |
| Thickness (mm) | 16.3 | 12 | 16 | 11.1 | 9.5 | 15 |
| Avg. density (g/cm3) | 0.81 | 0.76 | 0.65 | 0.67 | 0.67 | 1.15 |
| COV (%) | 1.0 | 3.1 | 2.4 | 4.7 | 6.6 | 6.7 |
| Panel Thickness (mm) | 15 | 20 | 40 |
|---|---|---|---|
| Avg. Density (g/cm3) | 1.15 | 1.13 | 1.10 |
| Max | 1.36 | 1.29 | 1.21 |
| Min | 0.96 | 0.98 | 1.04 |
| SD | 0.078 | 0.060 | 0.044 |
| COV (%) | 6.8 | 5.3 | 4.0 |
| 15 mm Panel | Sampling Position | |||
|---|---|---|---|---|
| Sampling Direction | E-L | C-L | E-W | C-W |
| Ave. density (g/cm3) | 1.18 | 1.14 | 1.2 | 1.2 |
| Max | 1.33 | 1.27 | 1.36 | 1.36 |
| Min | 1.05 | 1.02 | 0.96 | 1.02 |
| SD | 0.054 | 0.062 | 0.114 | 0.084 |
| COV (%) | 0.045 | 0.055 | 0.094 | 0.069 |
Publisher’s Note: MDPI stays neutral with regard to jurisdictional claims in published maps and institutional affiliations. |
© 2021 by the authors. Licensee MDPI, Basel, Switzerland. This article is an open access article distributed under the terms and conditions of the Creative Commons Attribution (CC BY) license (http://creativecommons.org/licenses/by/4.0/).
Share and Cite
Hu, Y.; He, M.; Semple, K.; Chen, M.; Pineda, H.; Zhou, C.; Dai, C. Characterizing Mat Formation of Bamboo Fiber Composites: Horizontal Density Distribution. Materials 2021, 14, 1198. https://doi.org/10.3390/ma14051198
Hu Y, He M, Semple K, Chen M, Pineda H, Zhou C, Dai C. Characterizing Mat Formation of Bamboo Fiber Composites: Horizontal Density Distribution. Materials. 2021; 14(5):1198. https://doi.org/10.3390/ma14051198
Chicago/Turabian StyleHu, Yu’an, Mei He, Kate Semple, Meiling Chen, Hugo Pineda, Chenli Zhou, and Chunping Dai. 2021. "Characterizing Mat Formation of Bamboo Fiber Composites: Horizontal Density Distribution" Materials 14, no. 5: 1198. https://doi.org/10.3390/ma14051198
APA StyleHu, Y., He, M., Semple, K., Chen, M., Pineda, H., Zhou, C., & Dai, C. (2021). Characterizing Mat Formation of Bamboo Fiber Composites: Horizontal Density Distribution. Materials, 14(5), 1198. https://doi.org/10.3390/ma14051198