
Influence of Selective Laser Melting Technology Process Parameters on Porosity and Hardness of AISI H13 Tool Steel: Statistical Approach


Abstract
:
1. Introduction
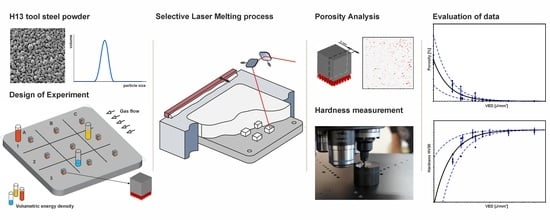
2. Materials and Methods
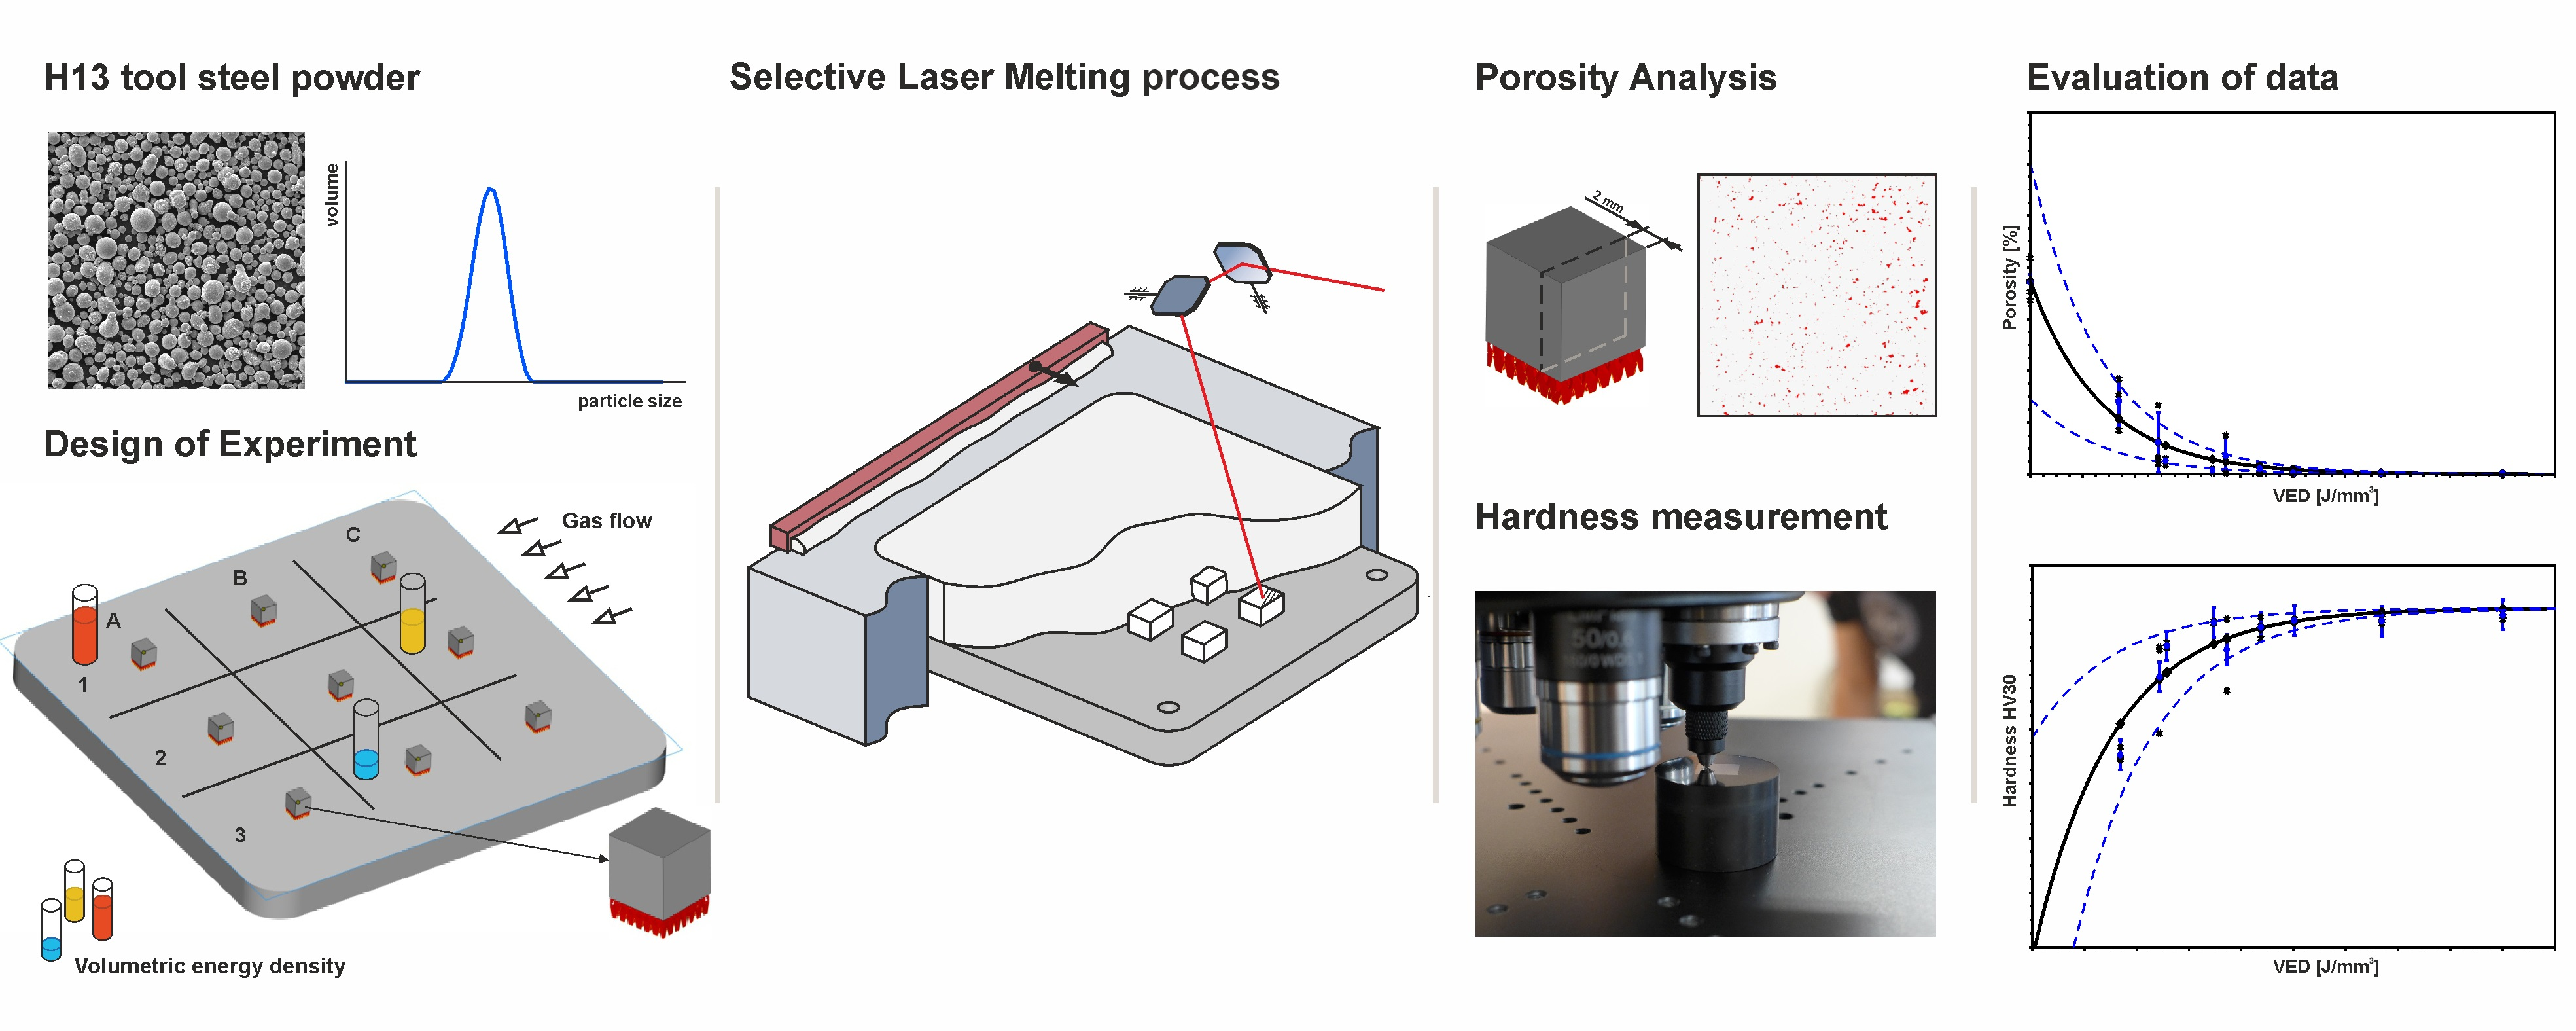
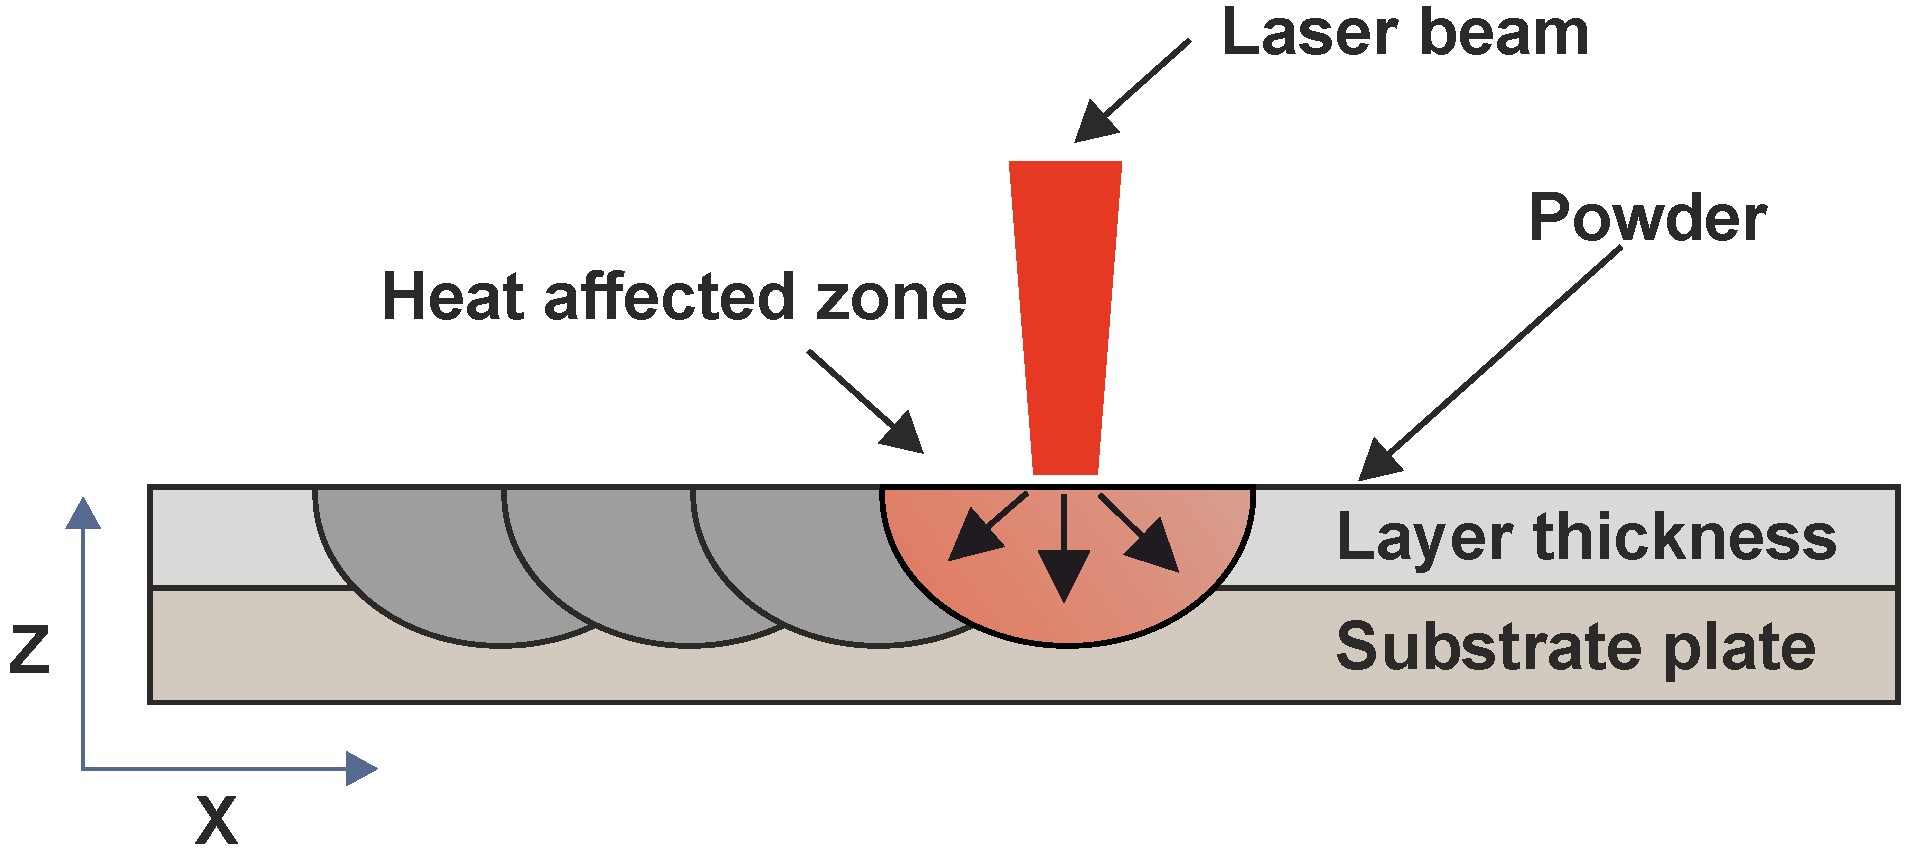
2.1. Selective Laser Melting
2.2. Process Parameters
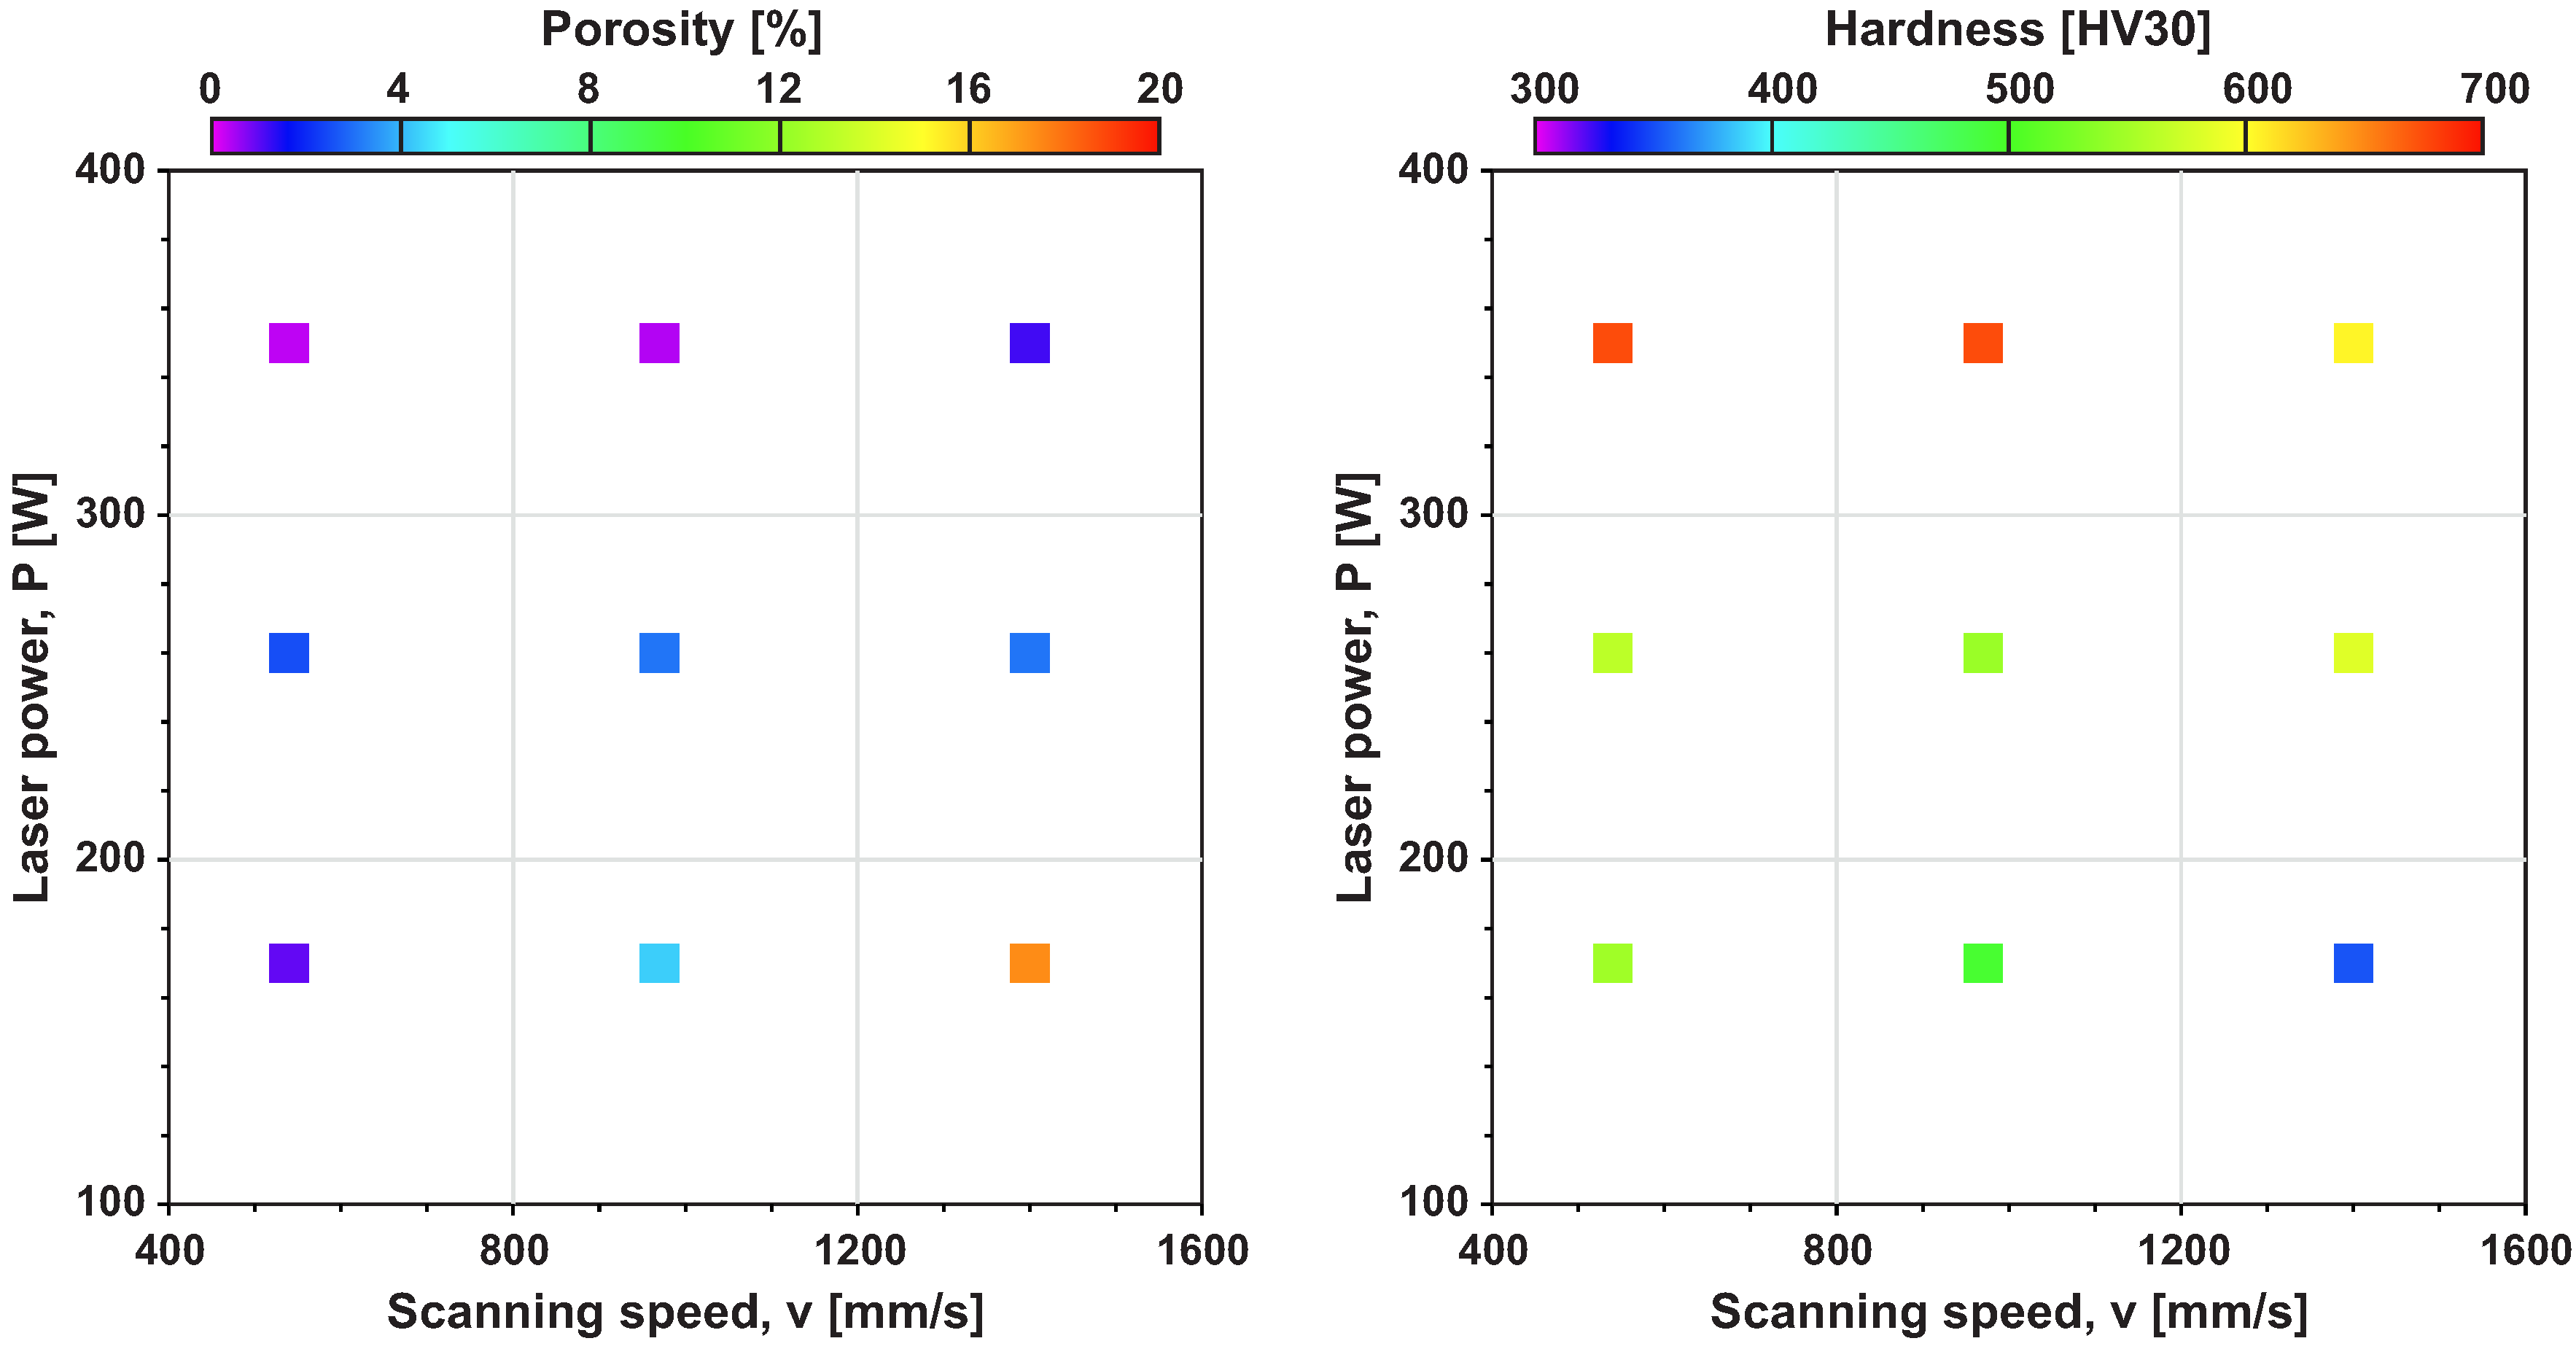
- Laser power P [W]
- Hatch distance h [mm]
- Scanning speed v [mm/s]
- Layer thickness t [mm]
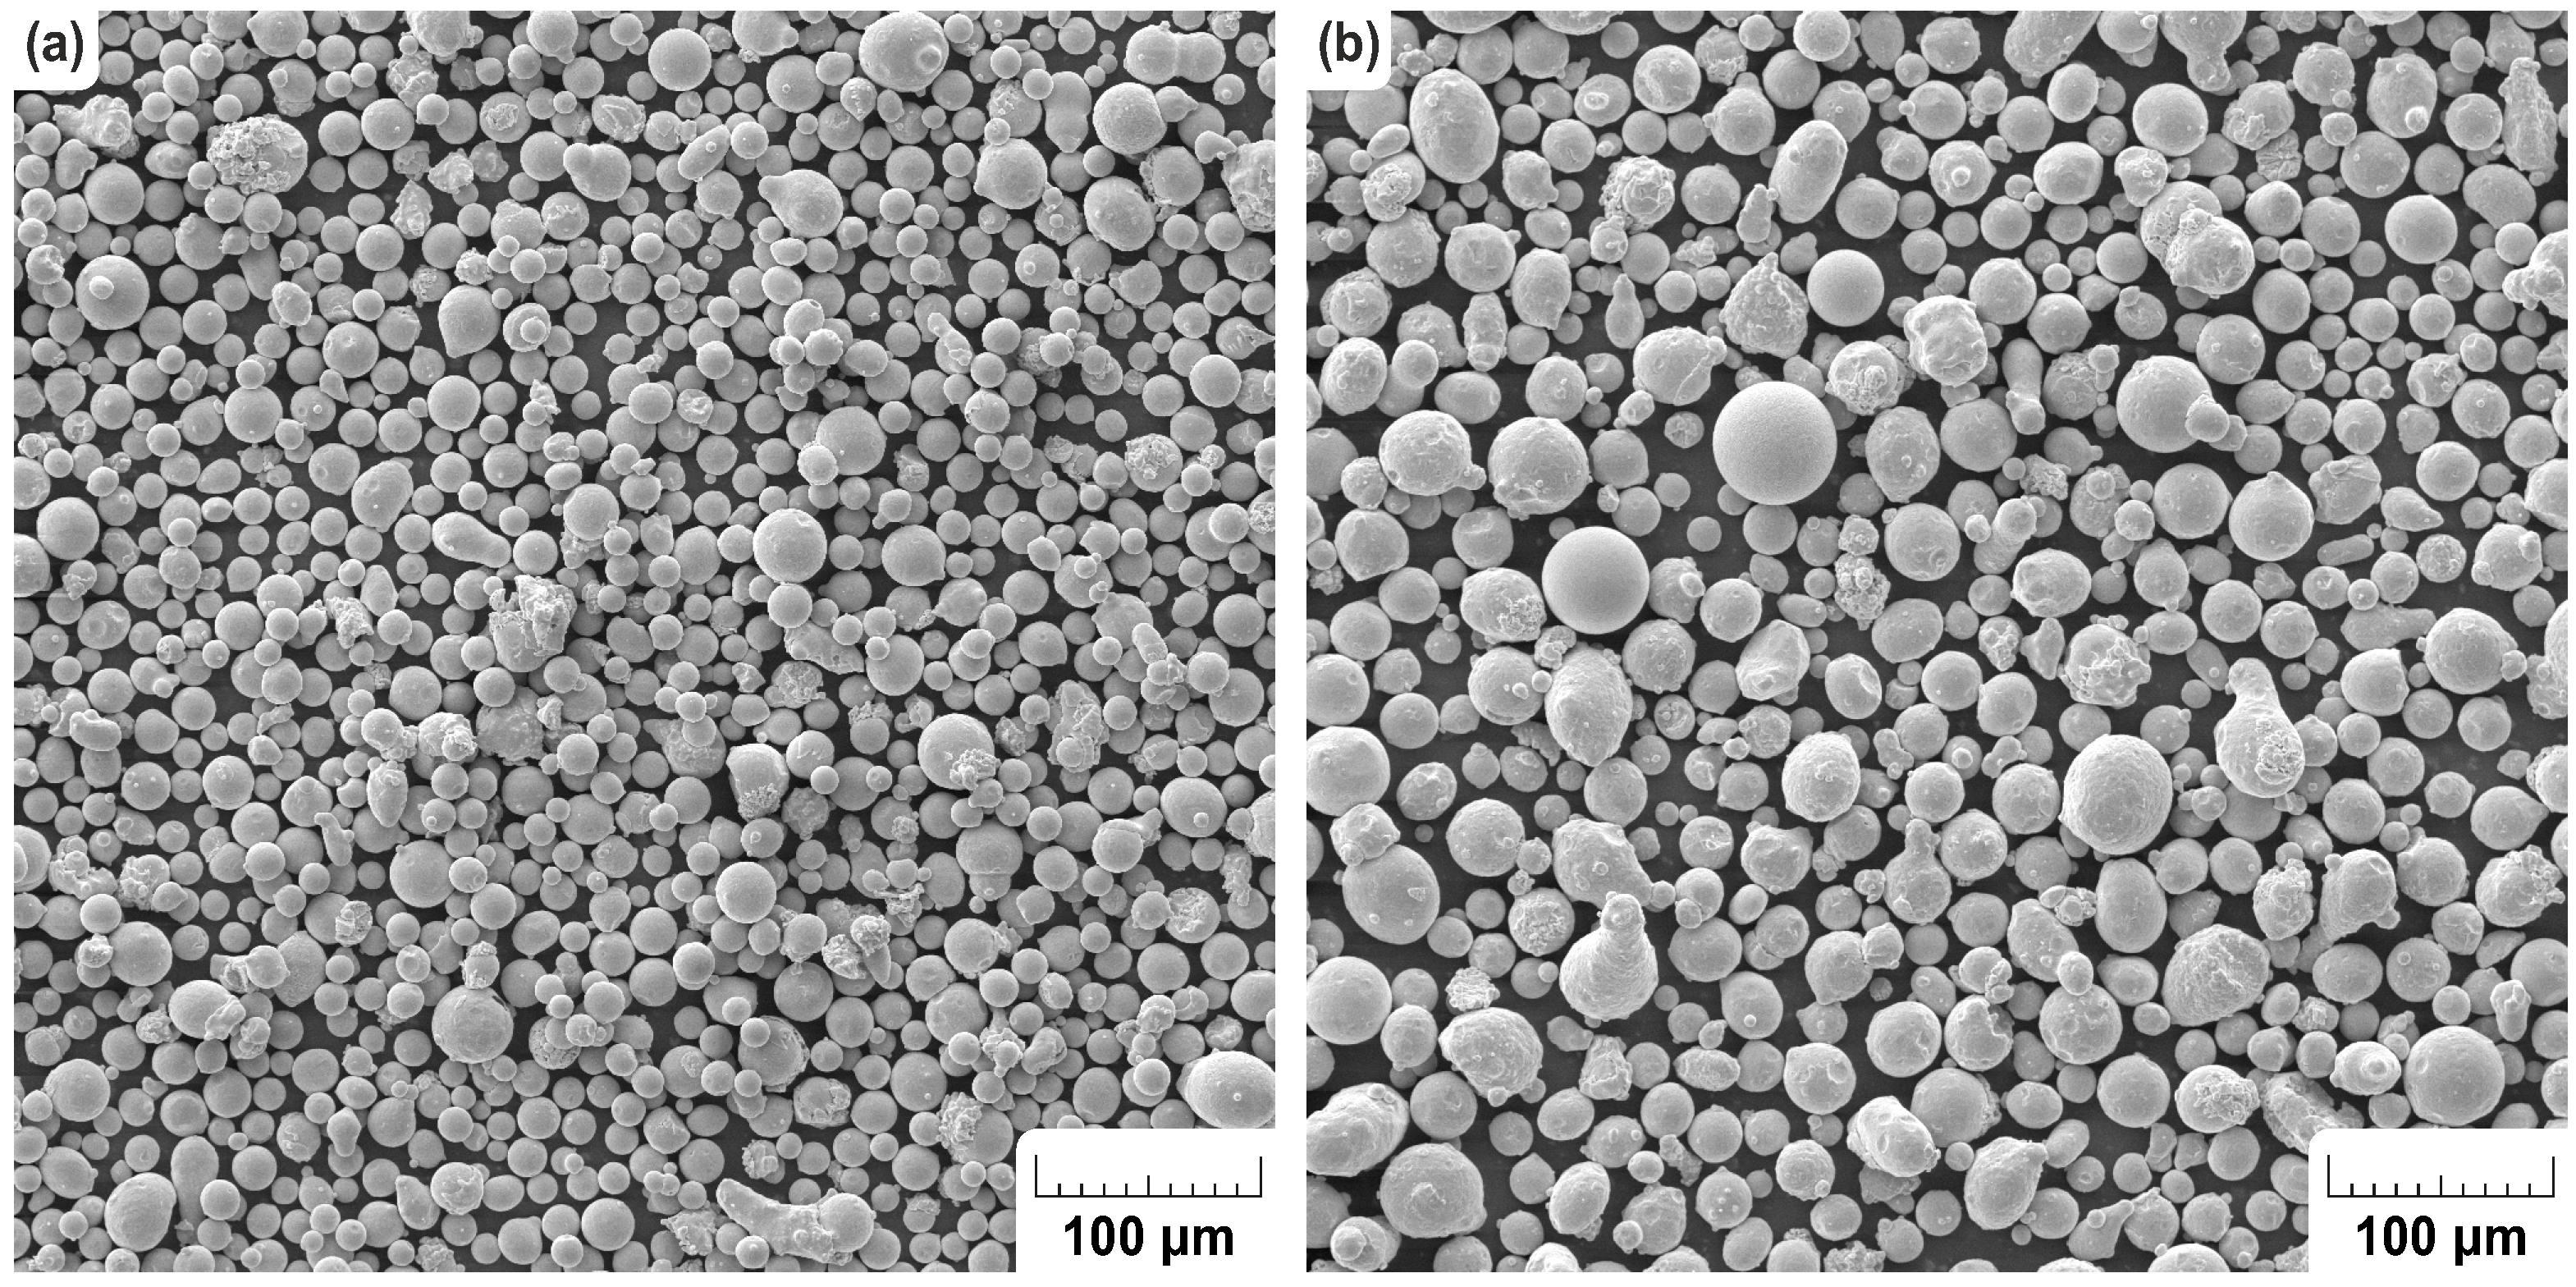
2.3. H13 Powder Tool Steel
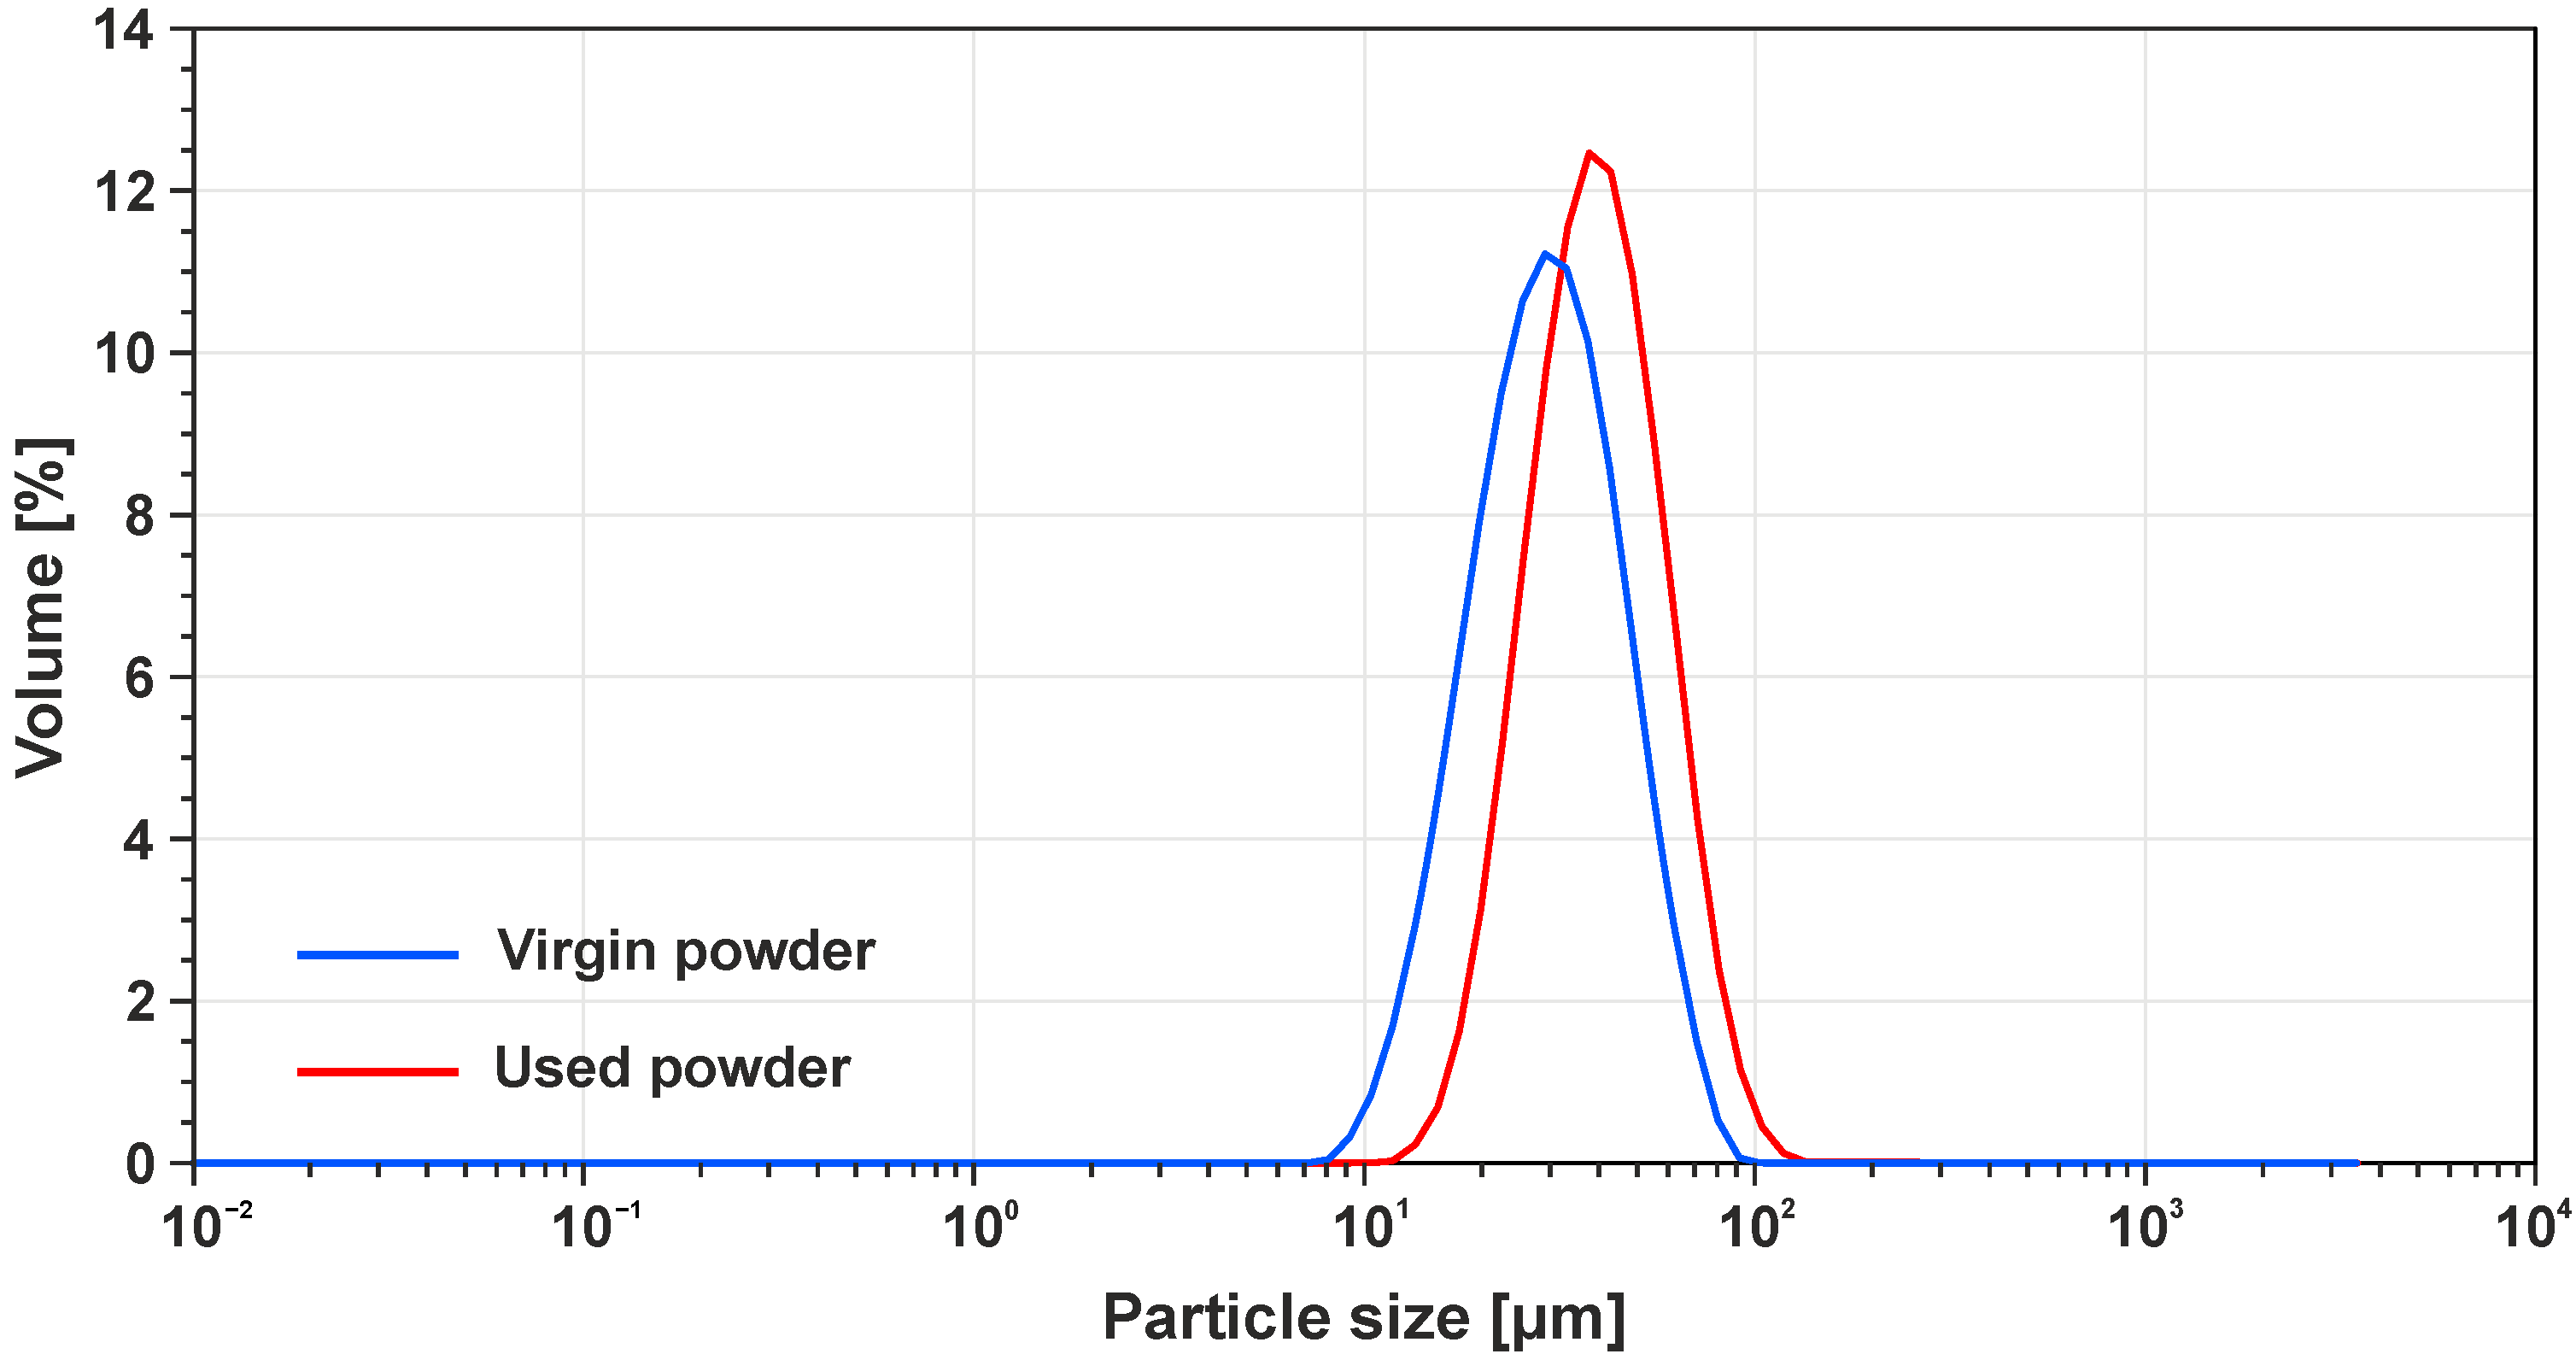
2.4. Analysis of H13 Powder
2.5. Design of Experiment
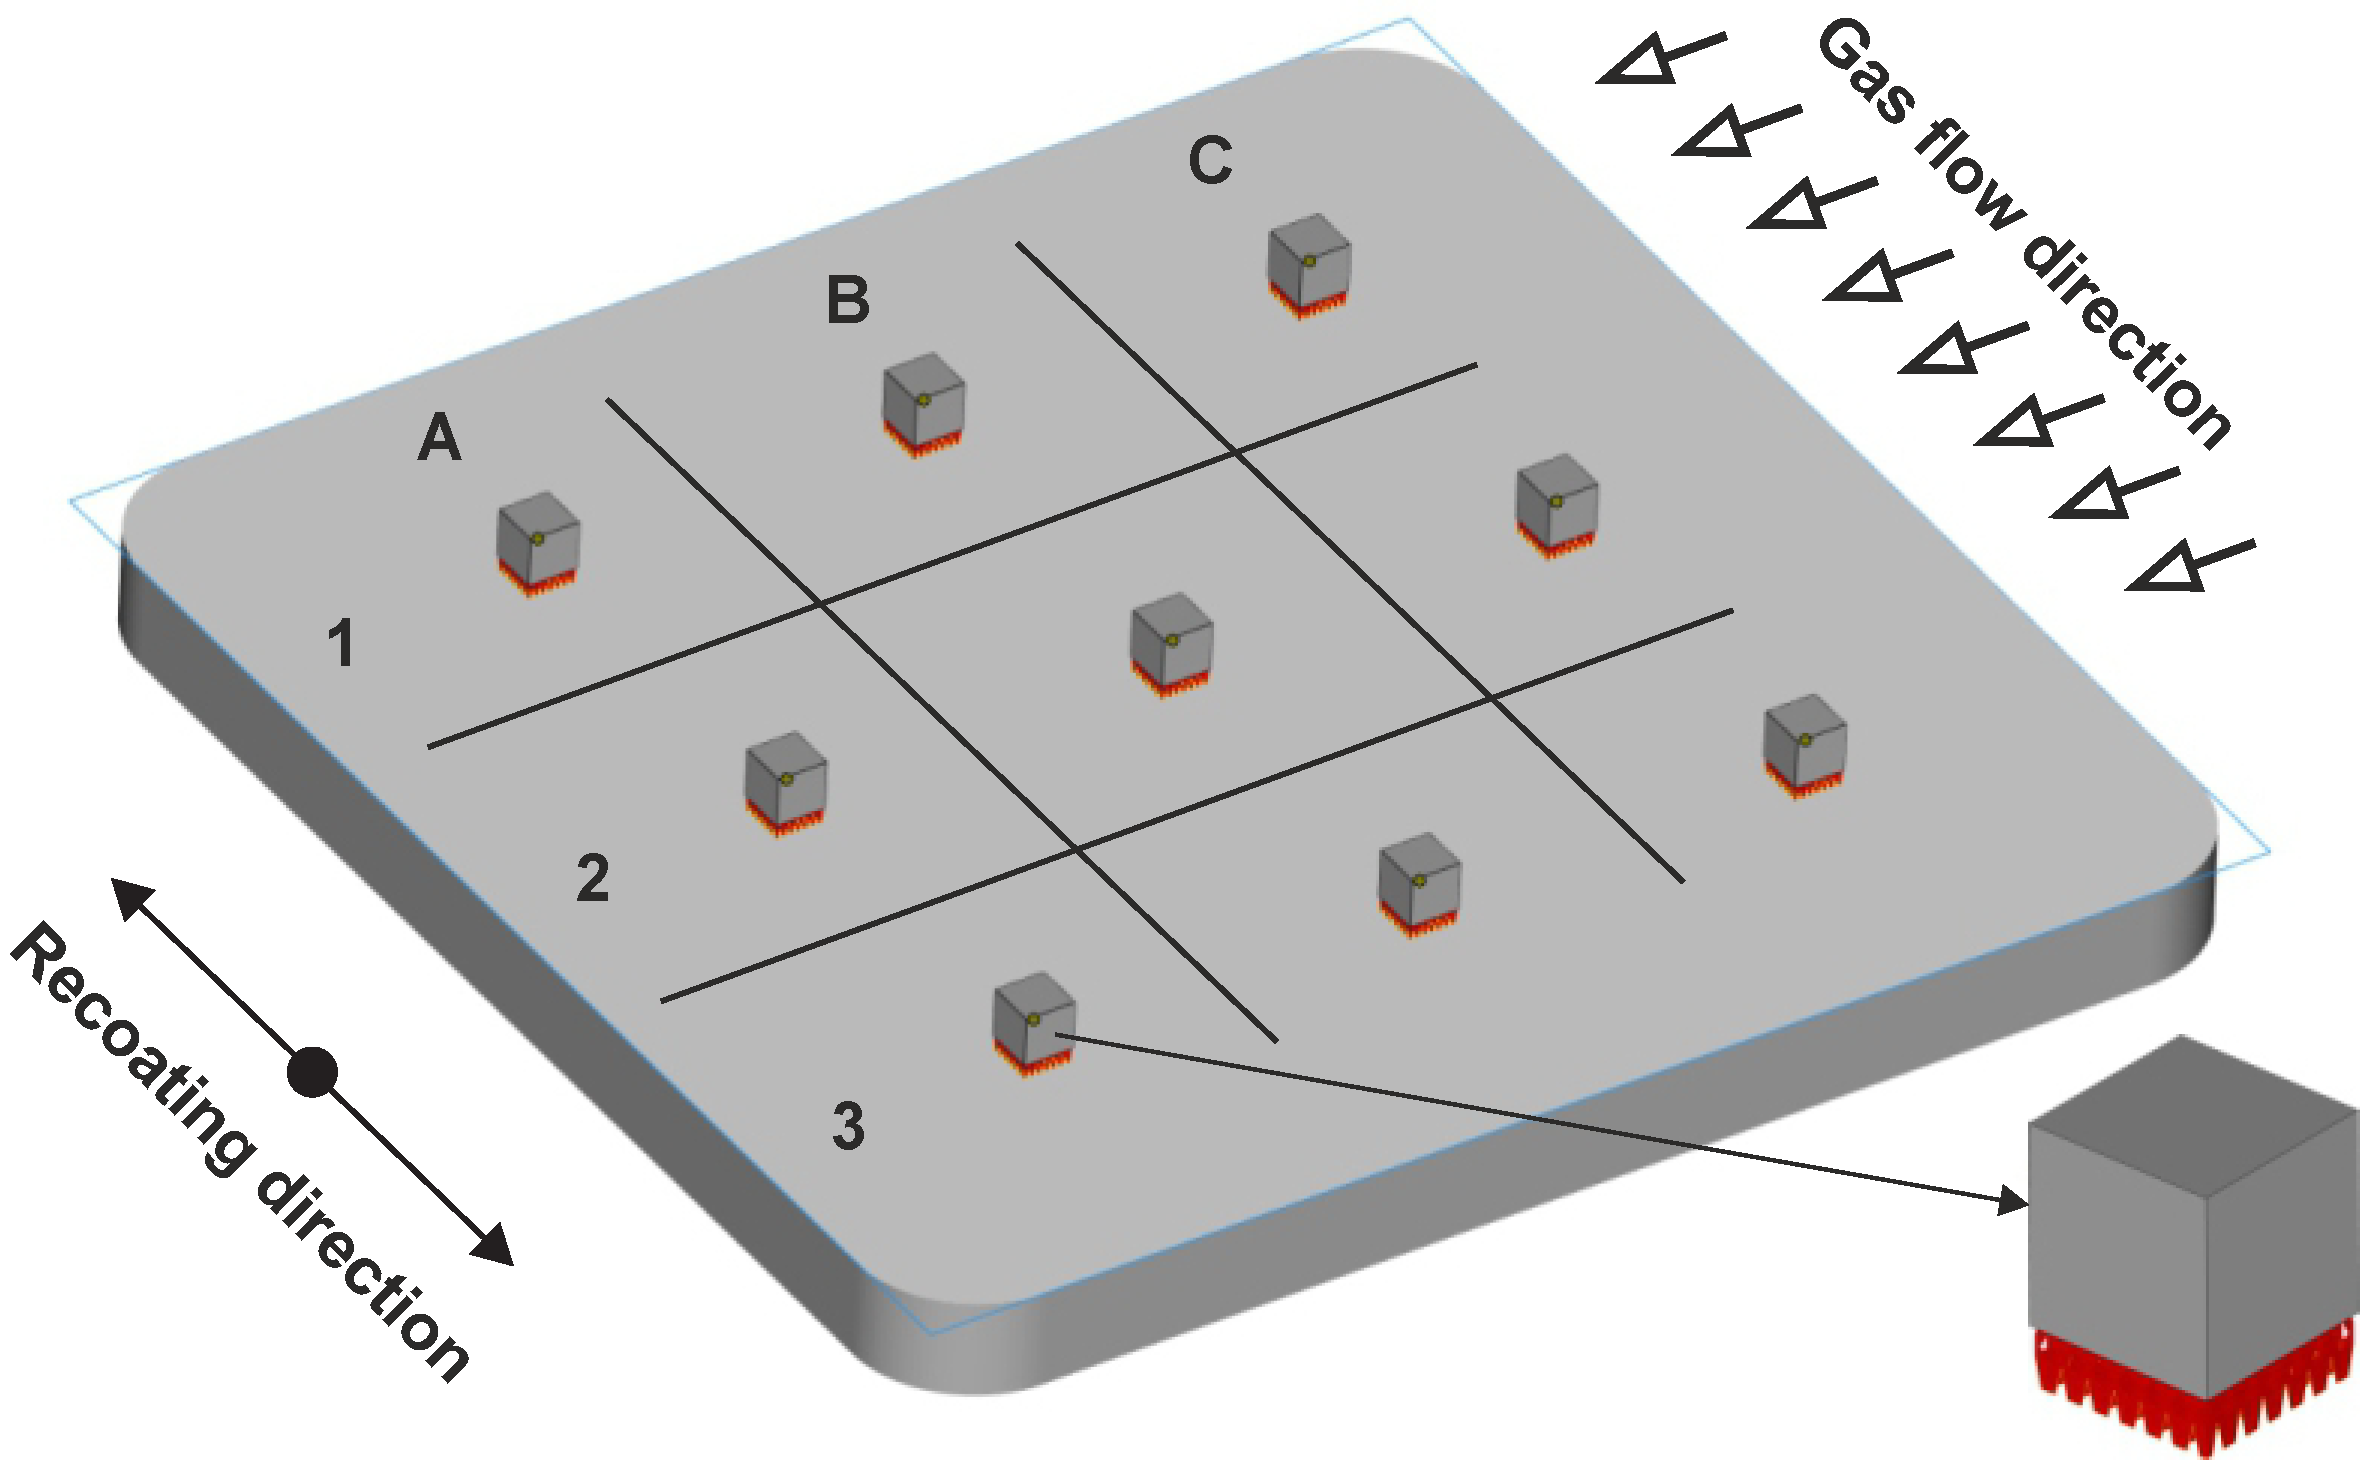
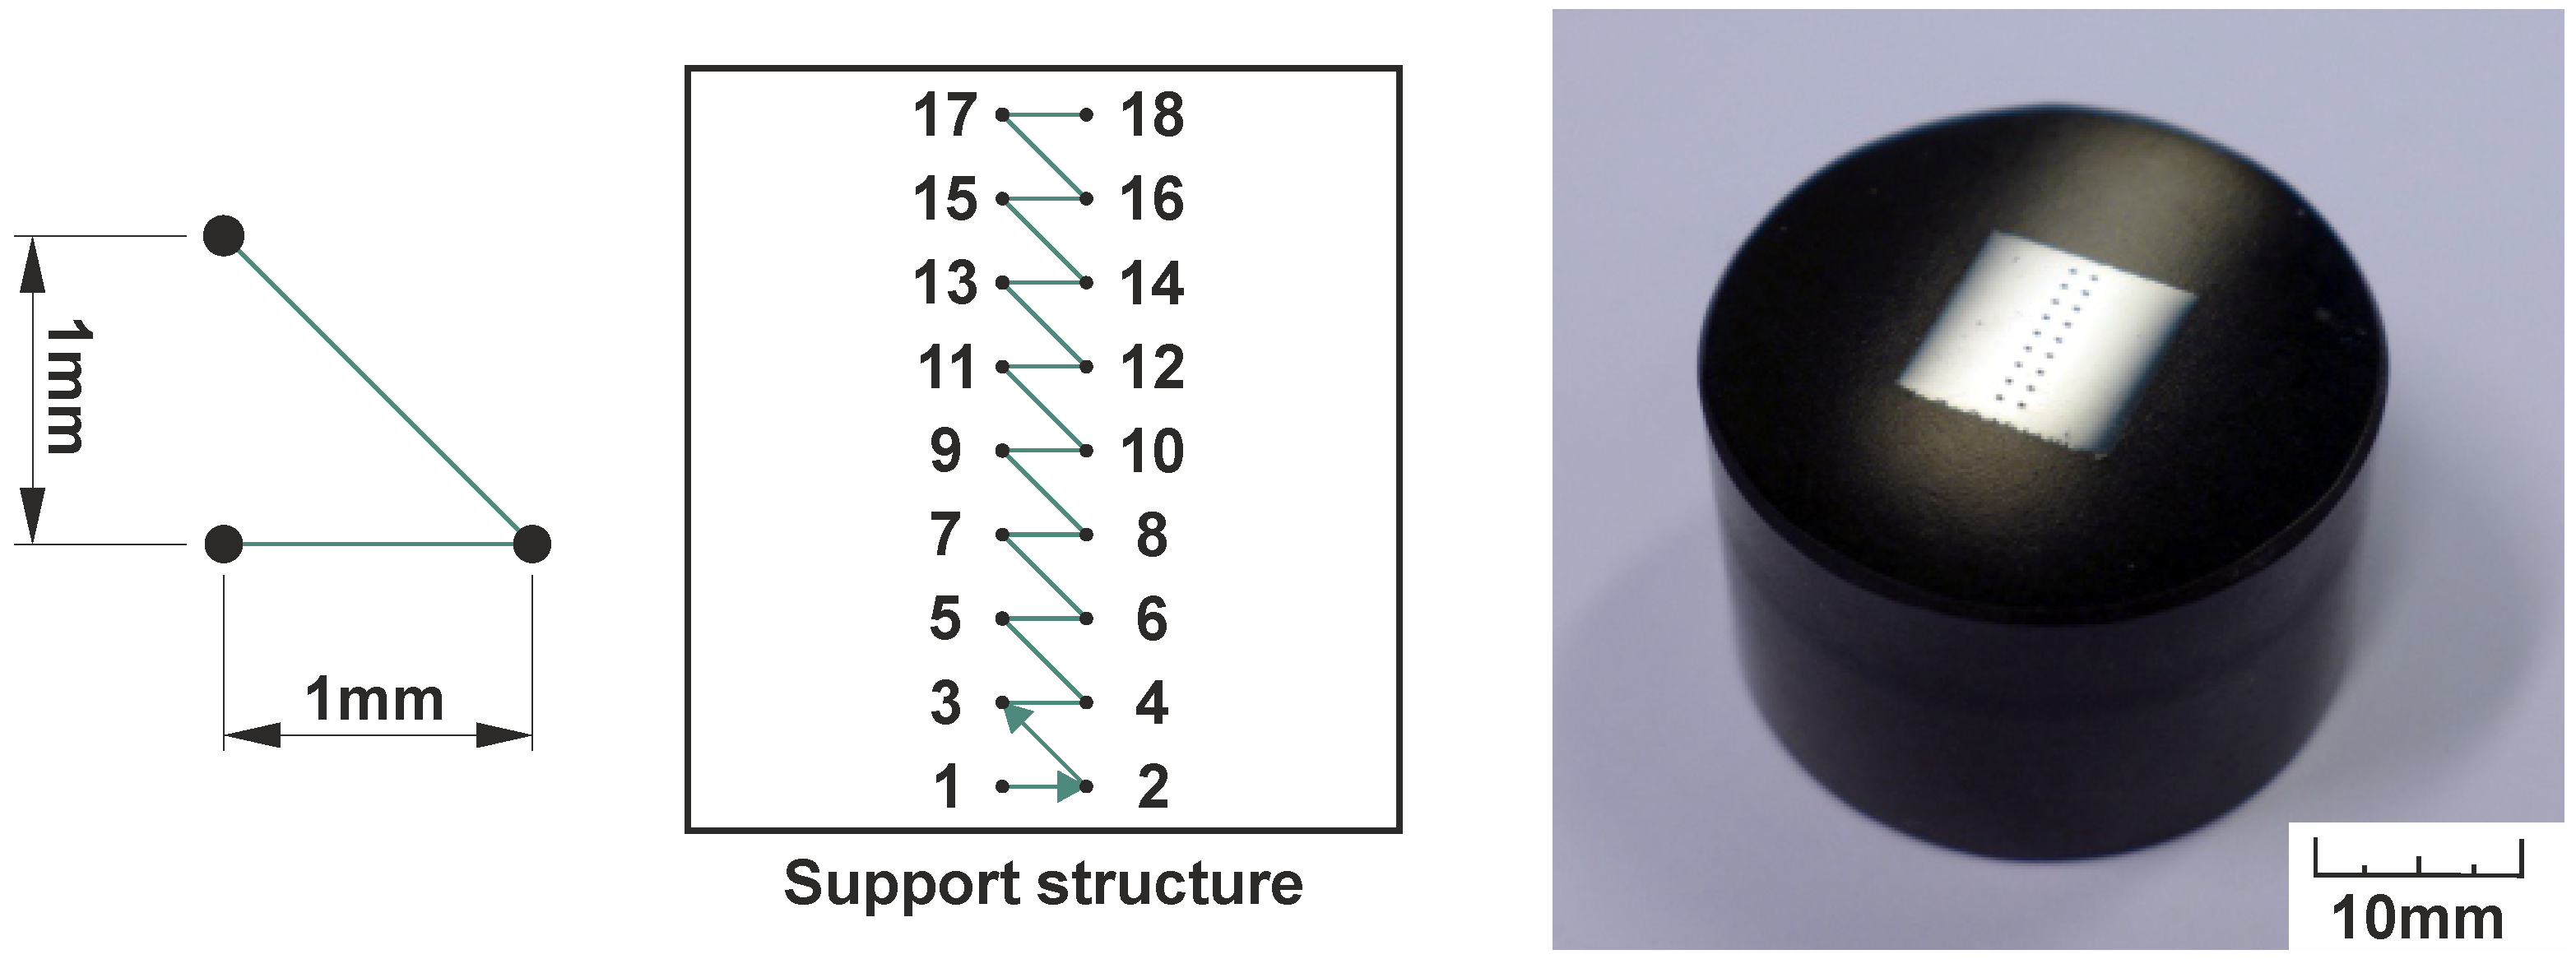
2.6. Production of the Specimens
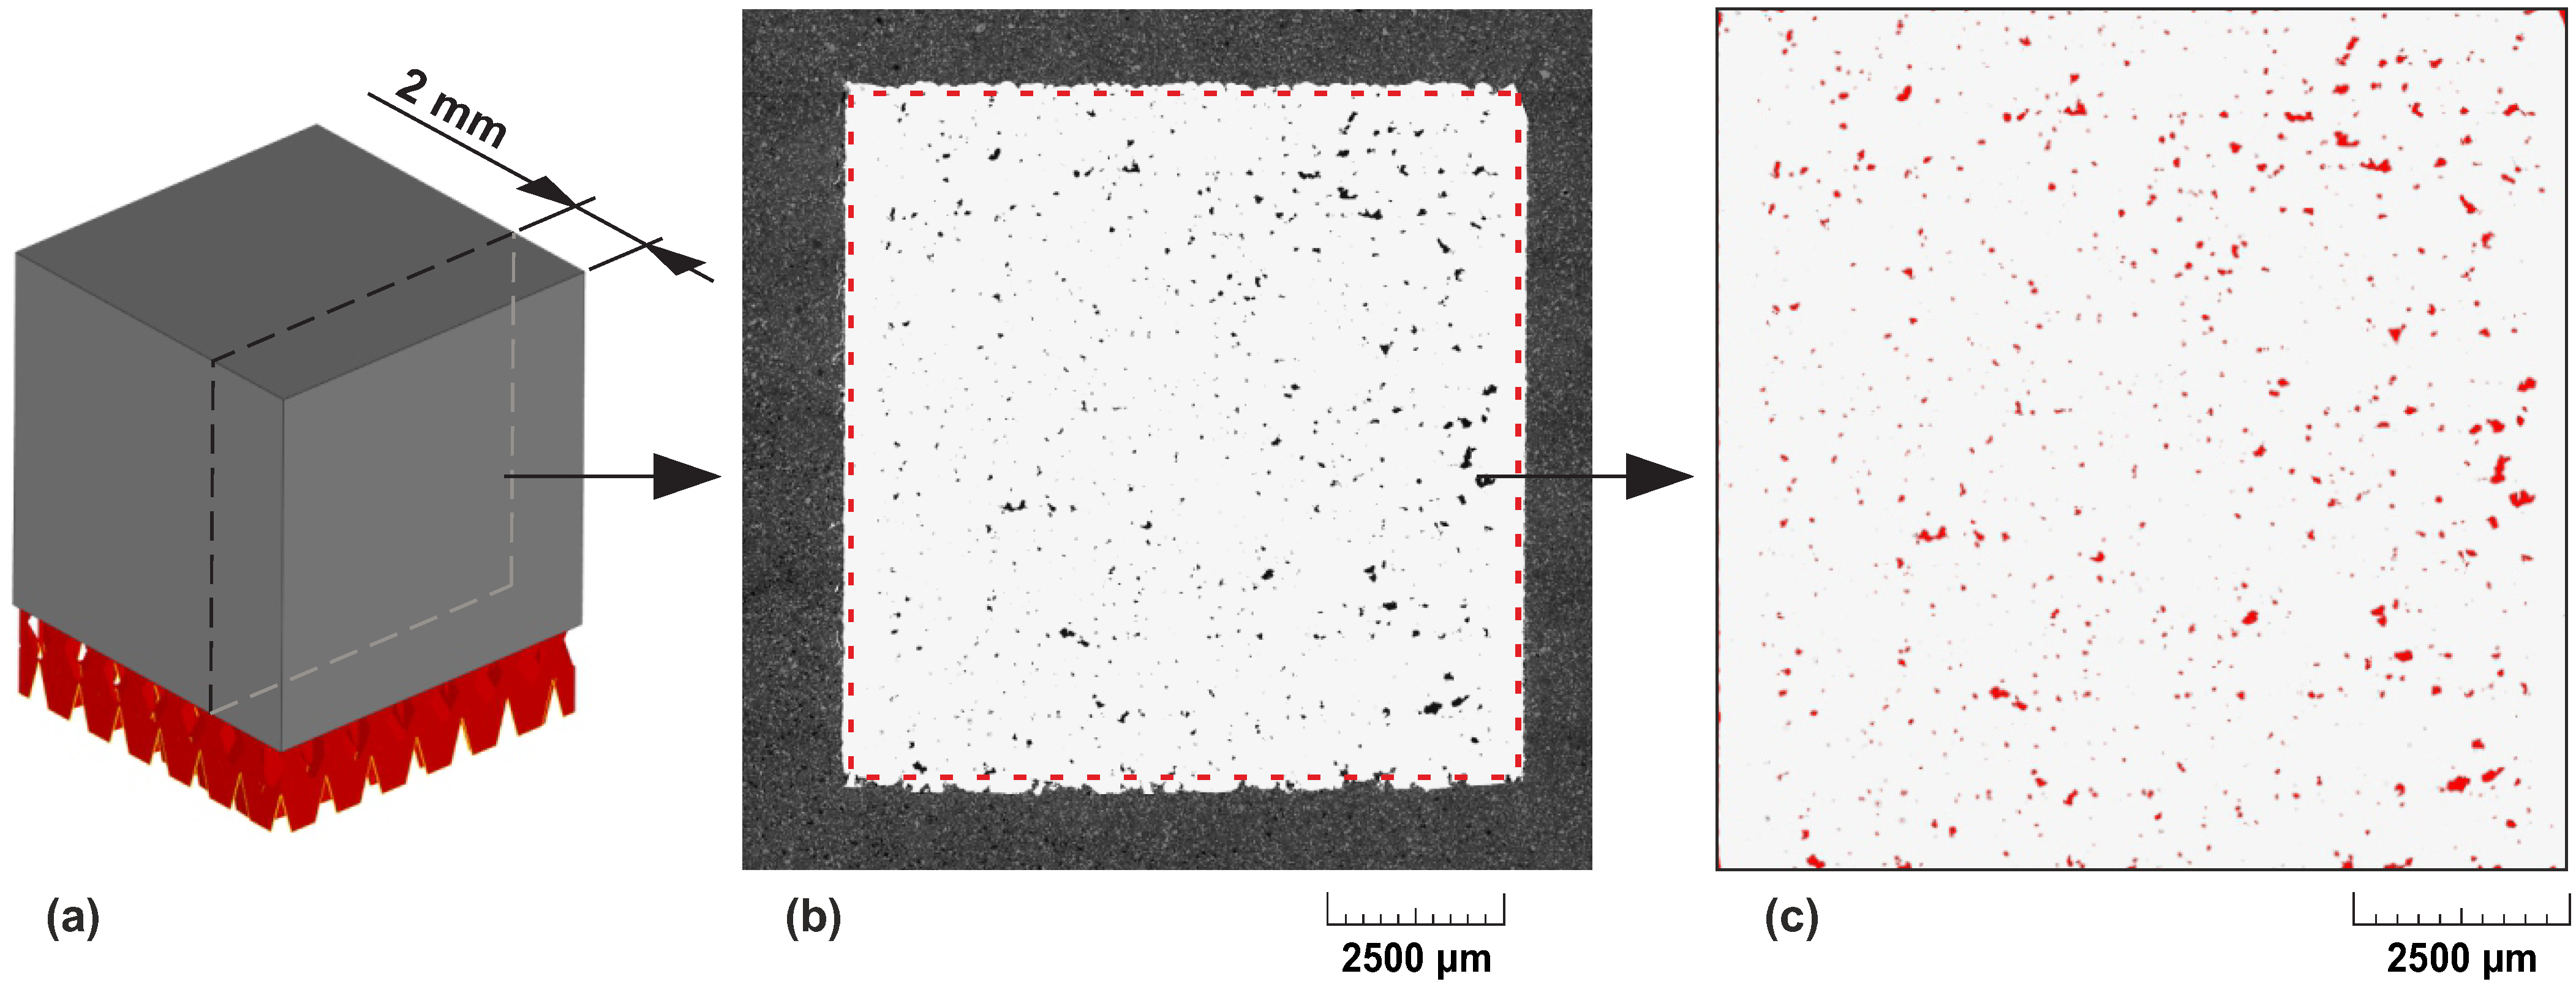
2.7. Analysis of Porosity
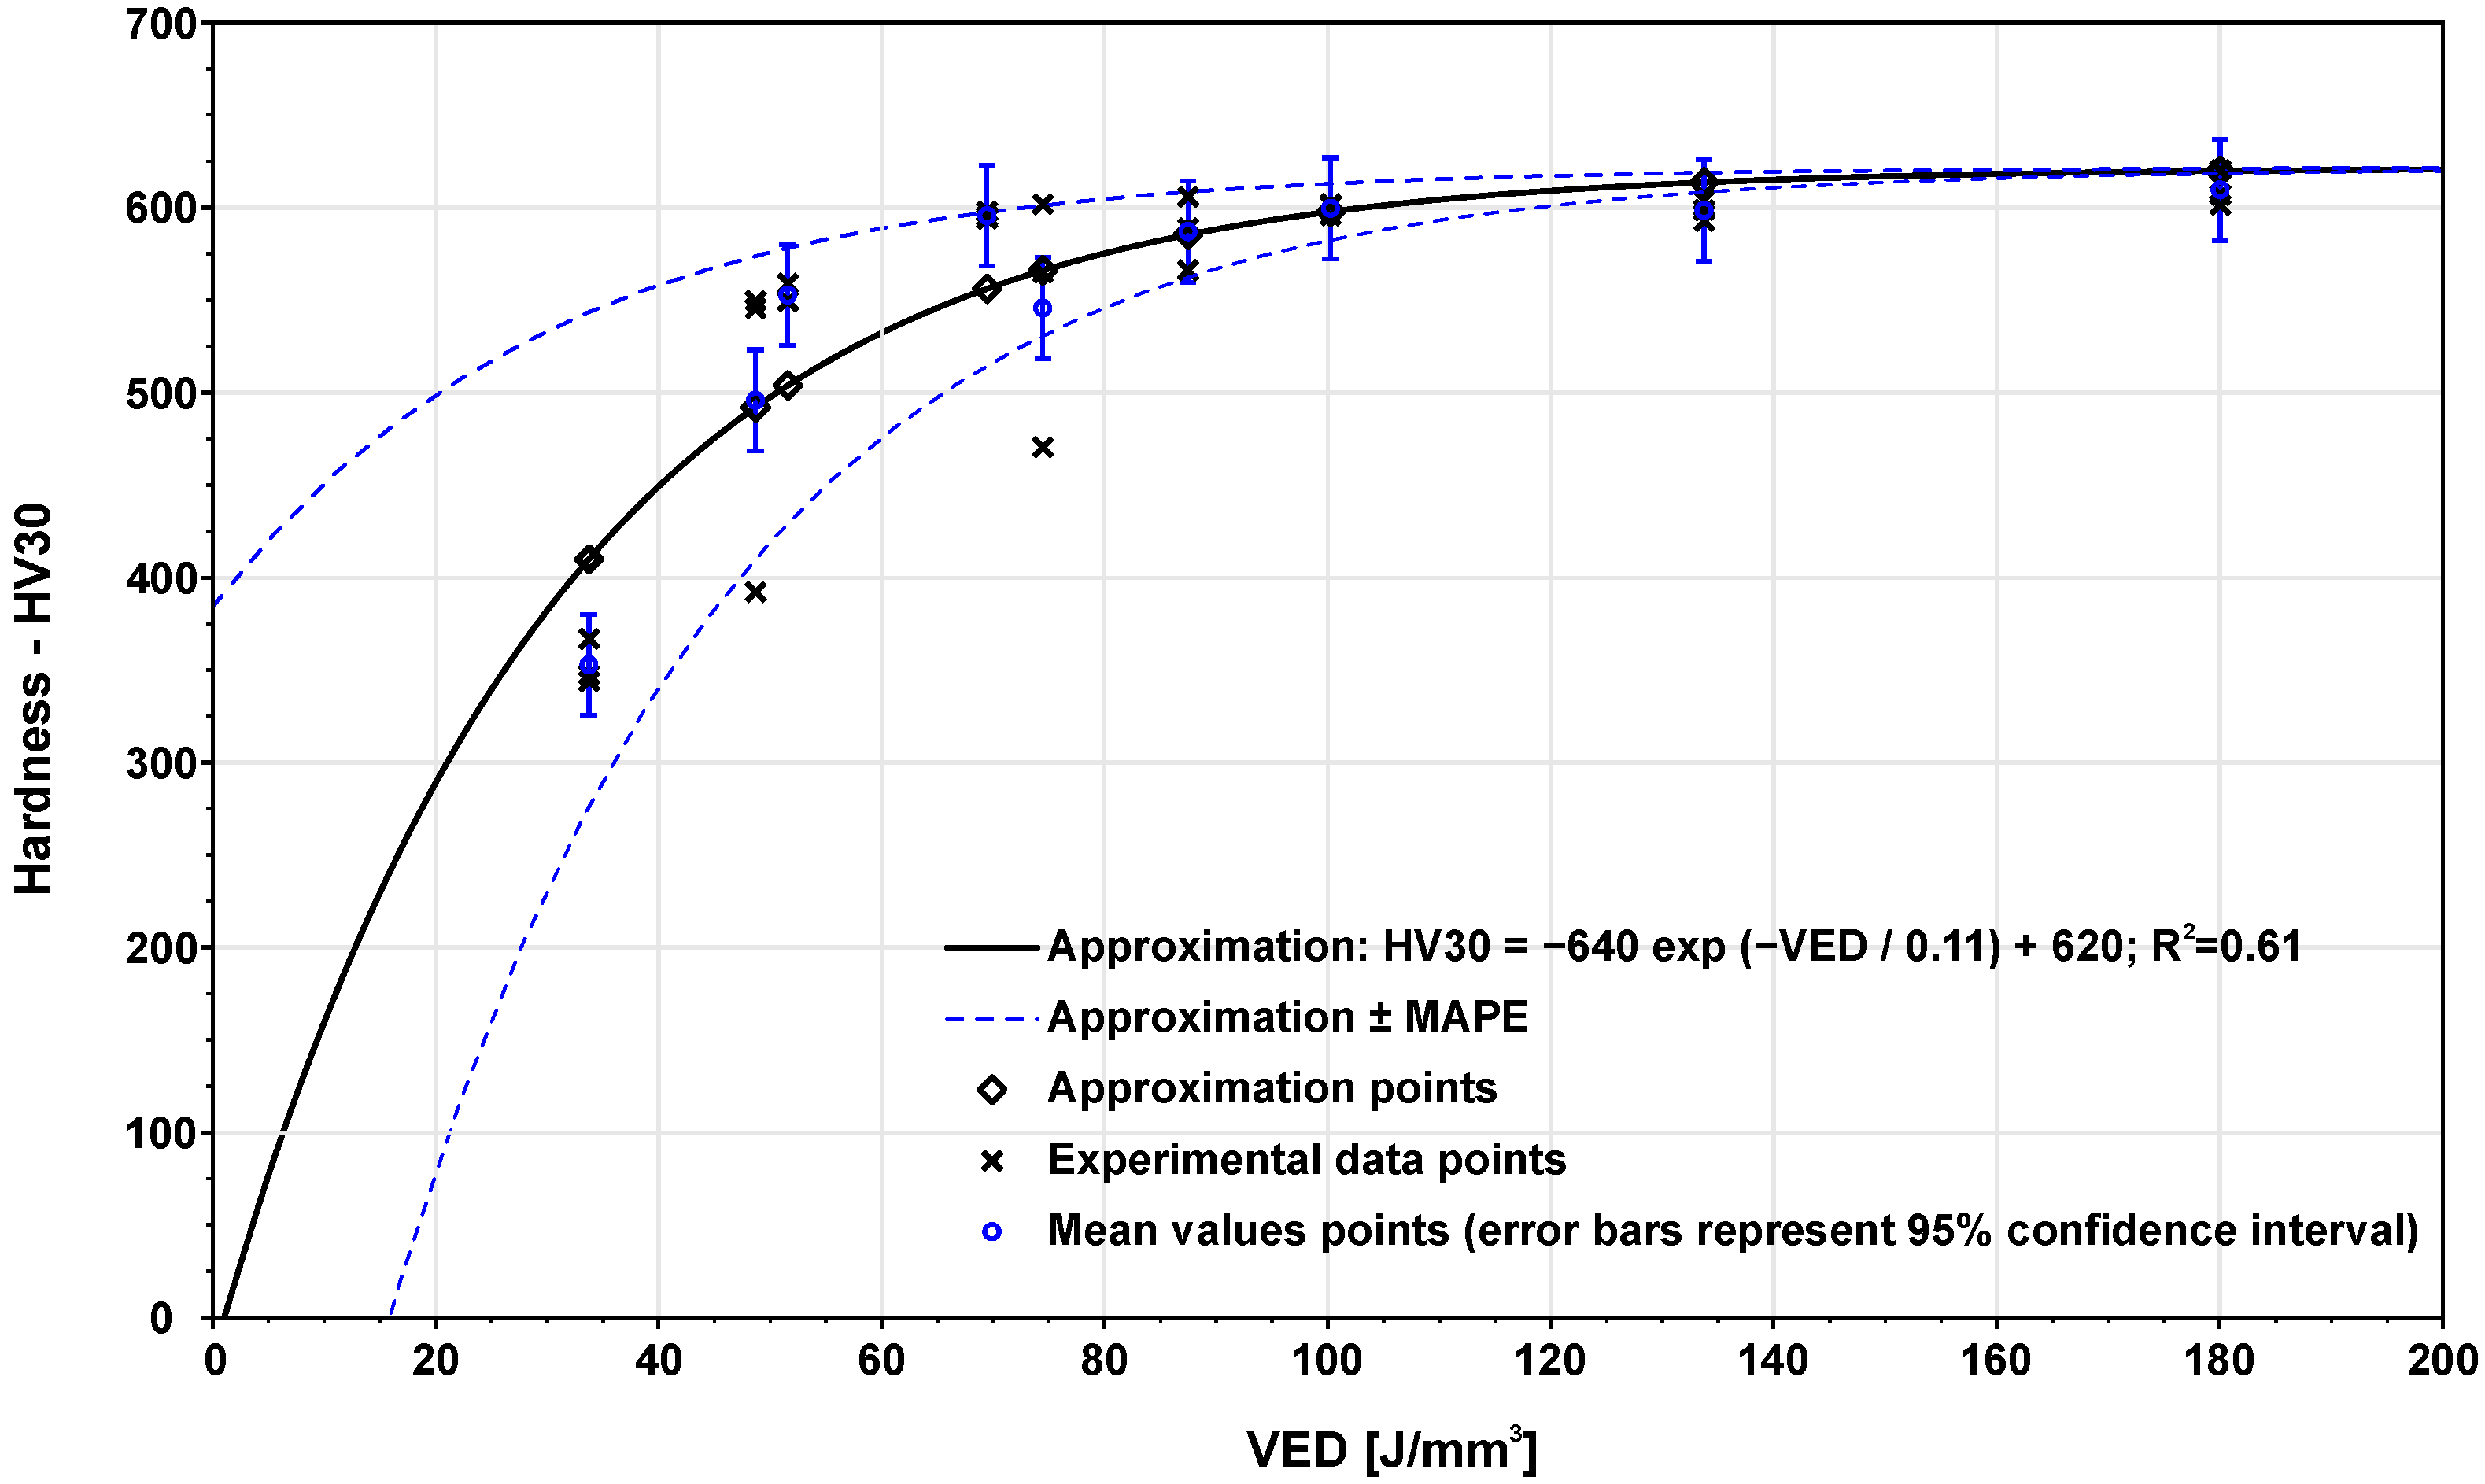
2.8. Analysis of Hardness
2.9. Theoretical Aspect of the Issue
3. Results
4. Discussion
5. Conclusions
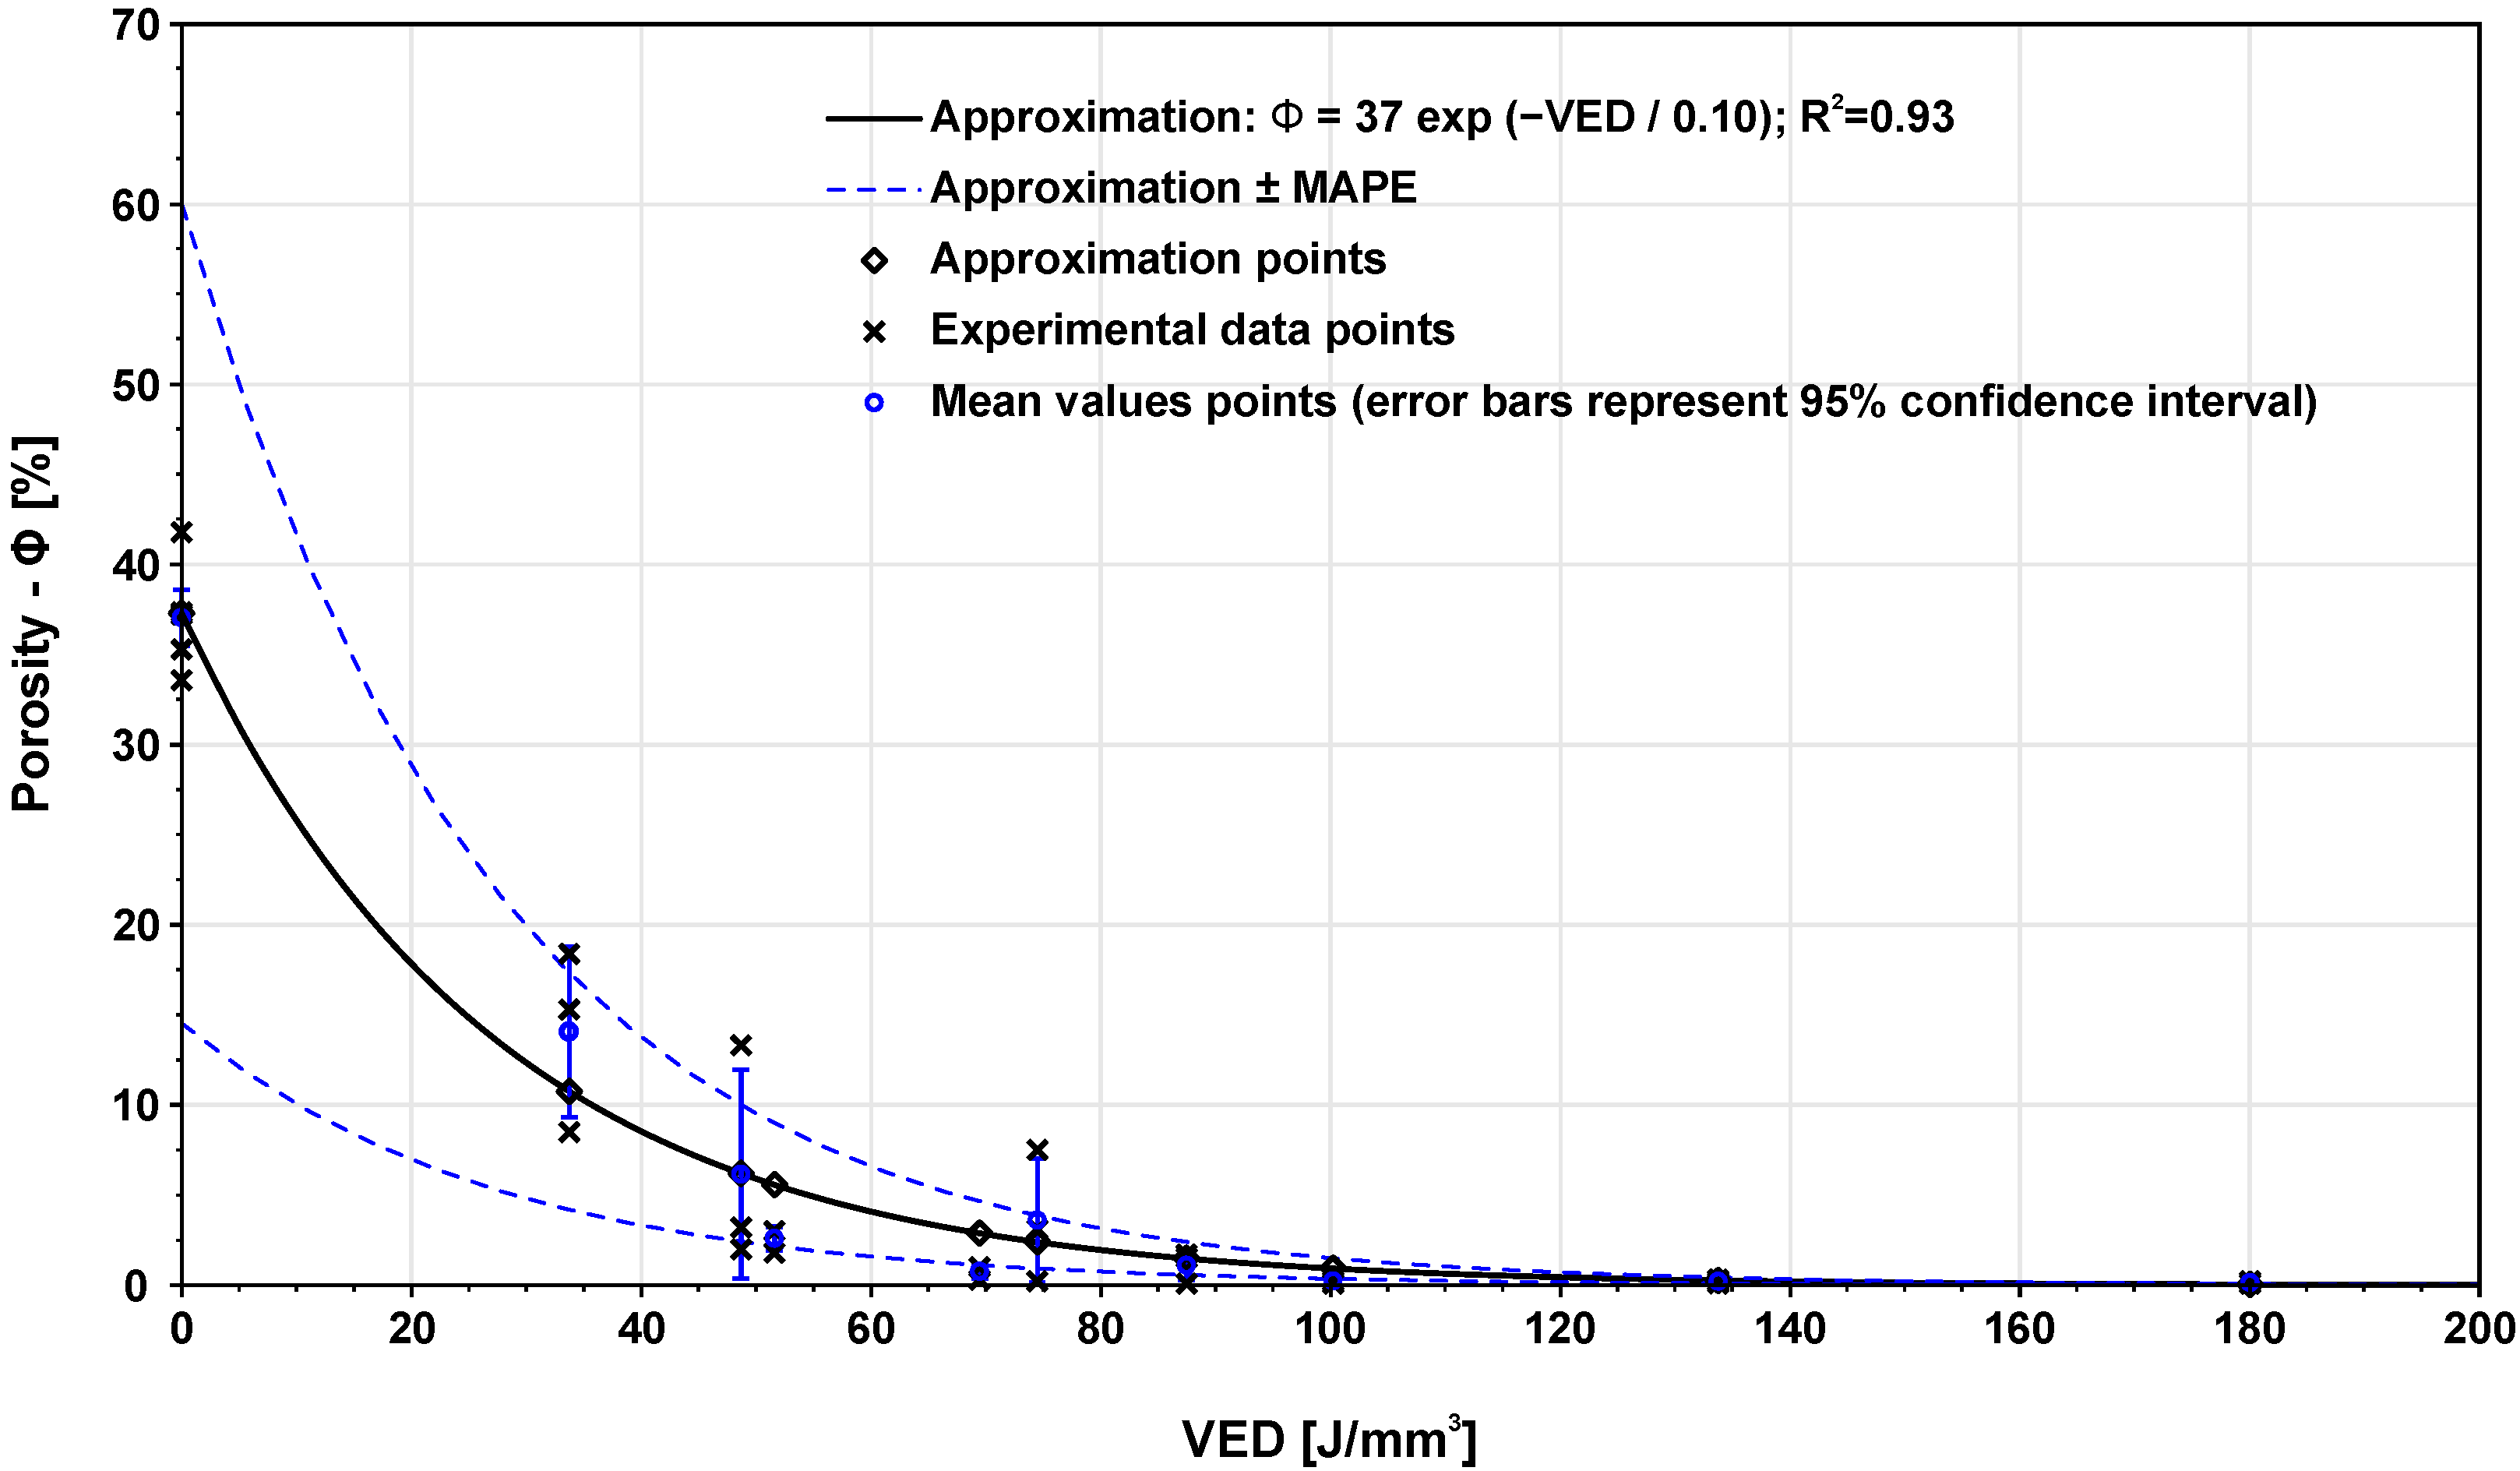
- It was confirmed that to obtain material with a minimal possible porosity for H13 tool steel, VED of at least 100.3 J/mm must be applied. This setup resulted in a porosity of 0.2%. Higher VED does not lead to any further minimisation of porosity.
- With respect to our results, both the relations of porosity–VED and hardness–VED may be approximated with anexponential function. For VED lower than 87.5 J/mm, a high scatter in values of porosity occurs.
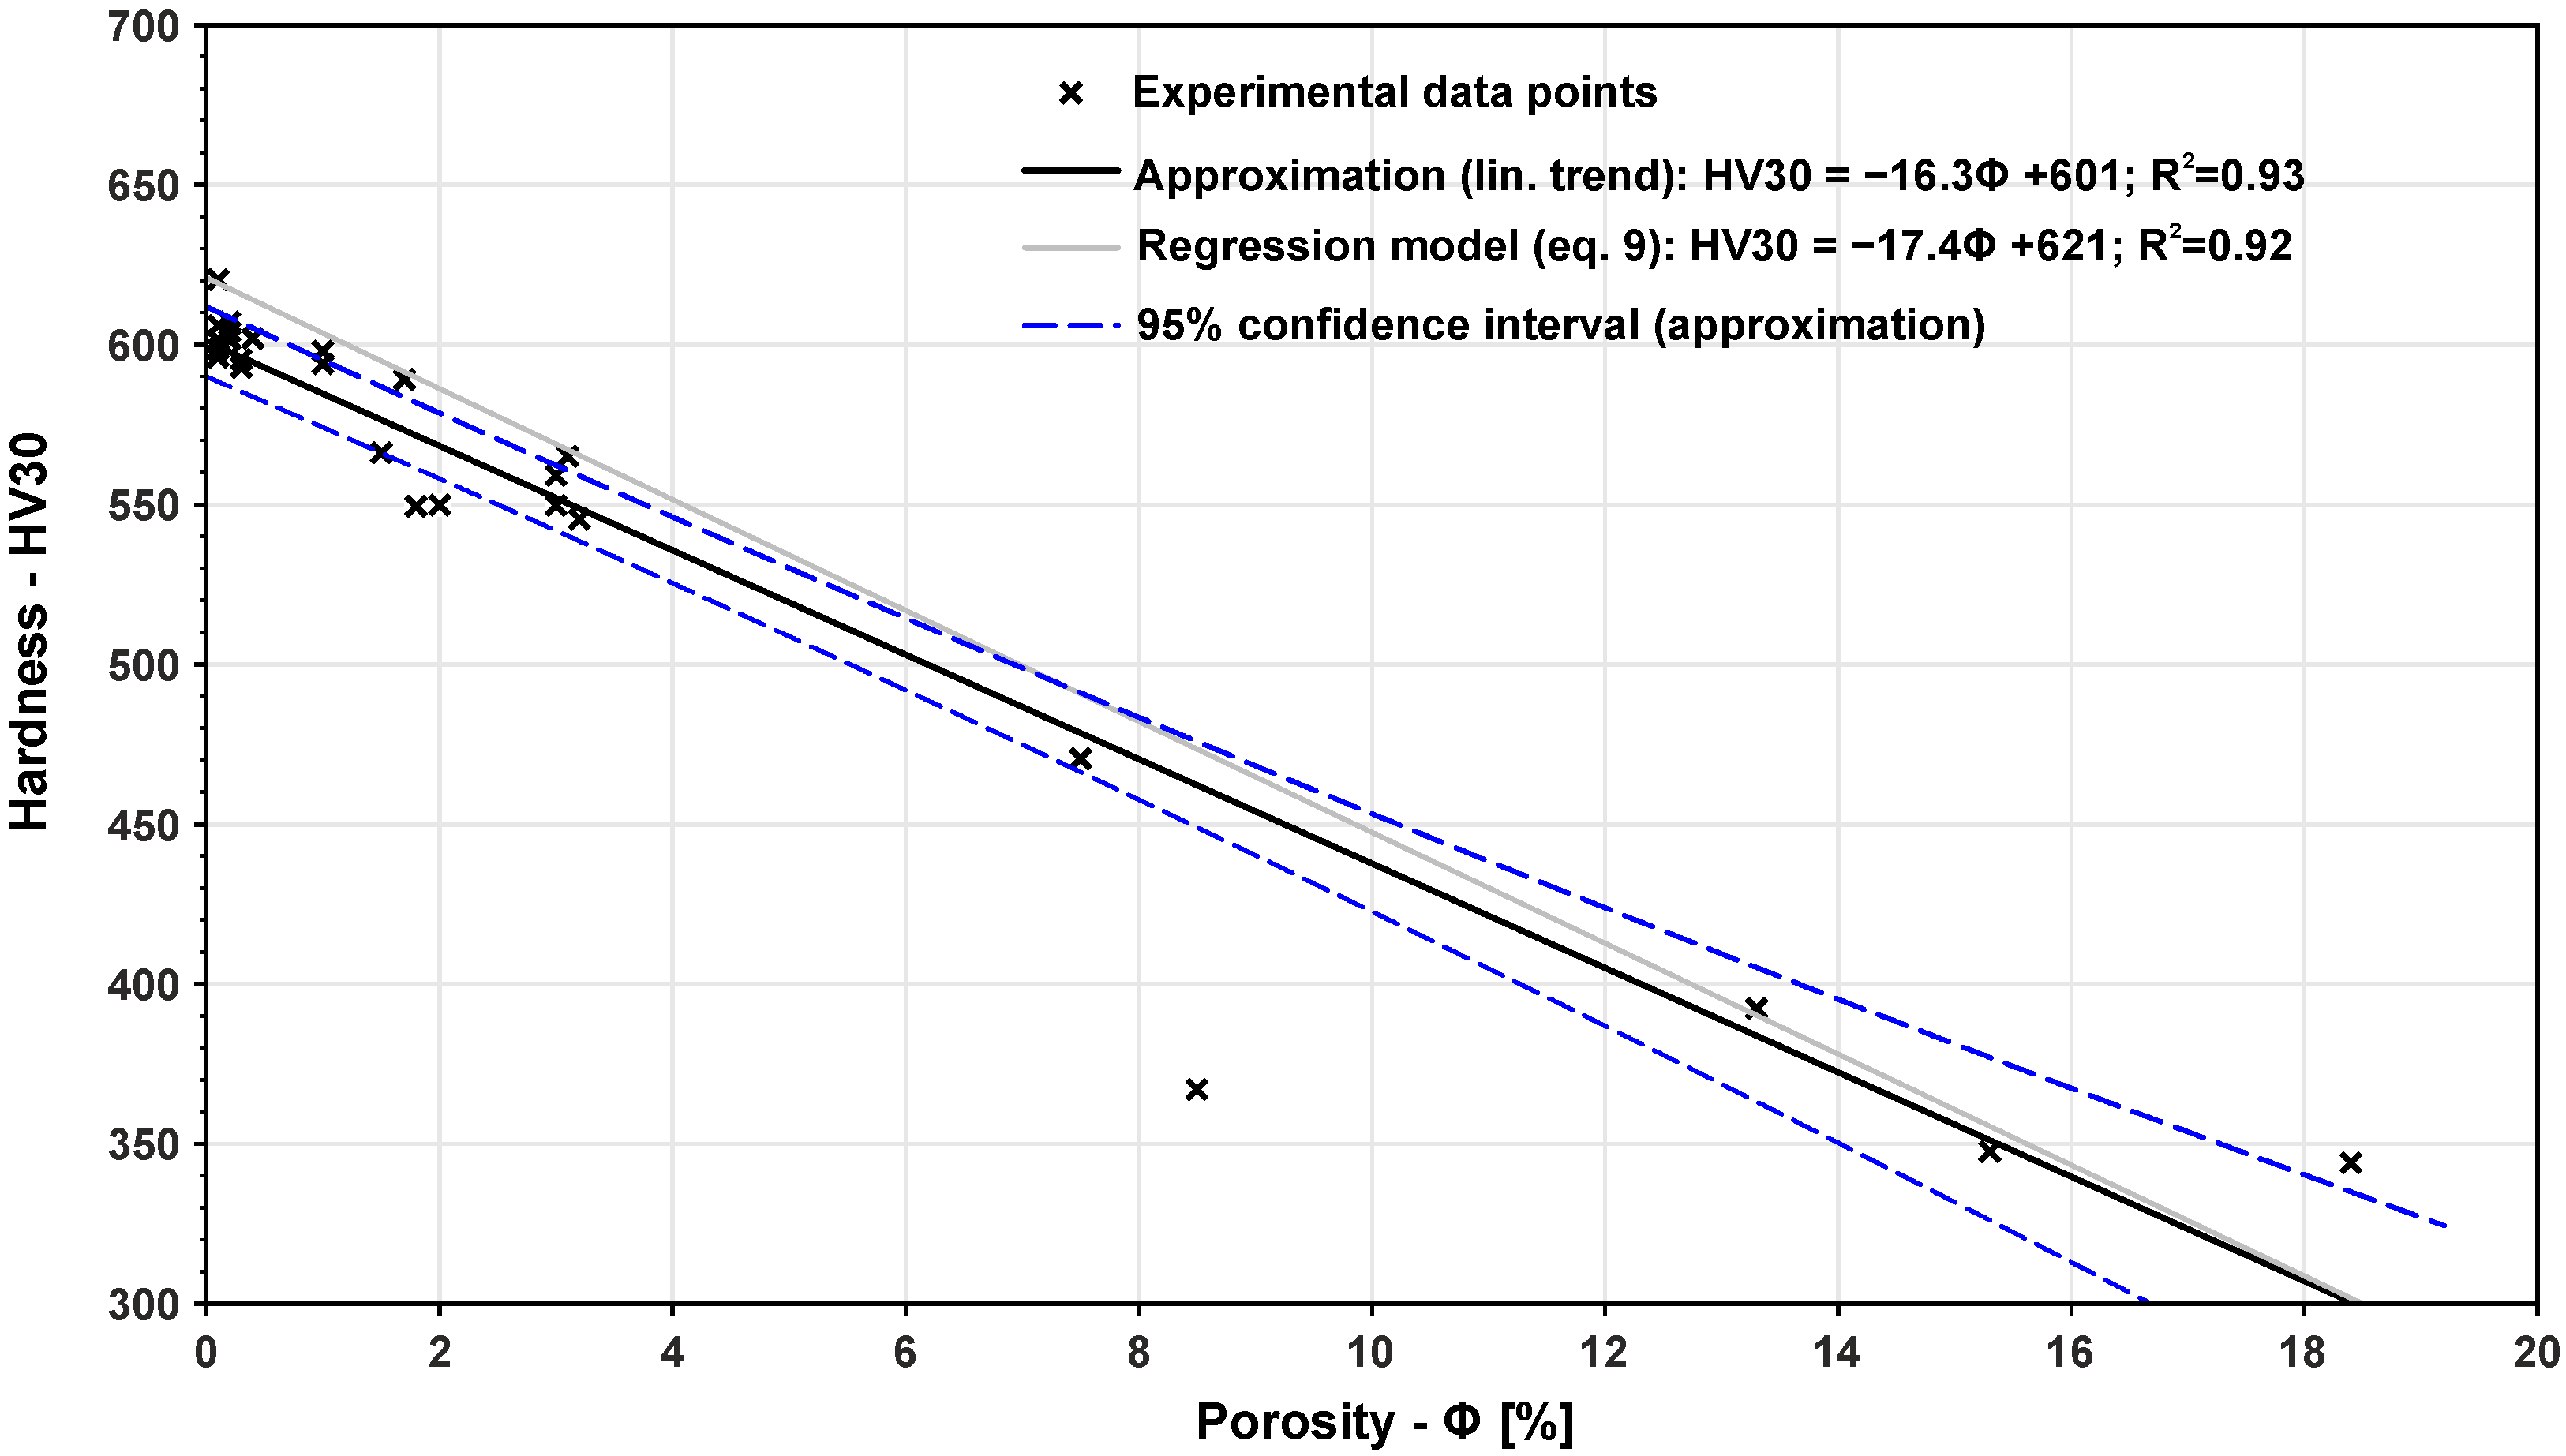
- The relation between hardness and porosity was confirmed to be linear. This assumption was proved by fitting experimental data with a linear regression model with R. Such a result may be used for predicting the porosity or hardness by VED.
Author Contributions
Funding
Institutional Review Board Statement
Informed Consent Statement
Data Availability Statement
Acknowledgments
Conflicts of Interest
Abbreviations
| SLM | Selective Laser Melting |
| L-PBF | Laser Powder Bed Fusion |
| DOE | Design of Experiment |
| AM | Additive Manufacturing |
| CT | Computed tomography |
| ANOVA | Analysis of variance |
| VED | Volumetric Energy Density |
| YS | Yield strength |
| UTS | Ultimate Tensile Strength |
| OM | Optical Metalography |
| RPM | Revolutions per minute |
Appendix A. Supplementary Data for Porosity Evaluation

| Specimen Label | Combination Number (see Table 5) | Laser Power P [W] | Scanning Speed v [mm/s] | VED [J/mm] | Porosity [%] |
|---|---|---|---|---|---|
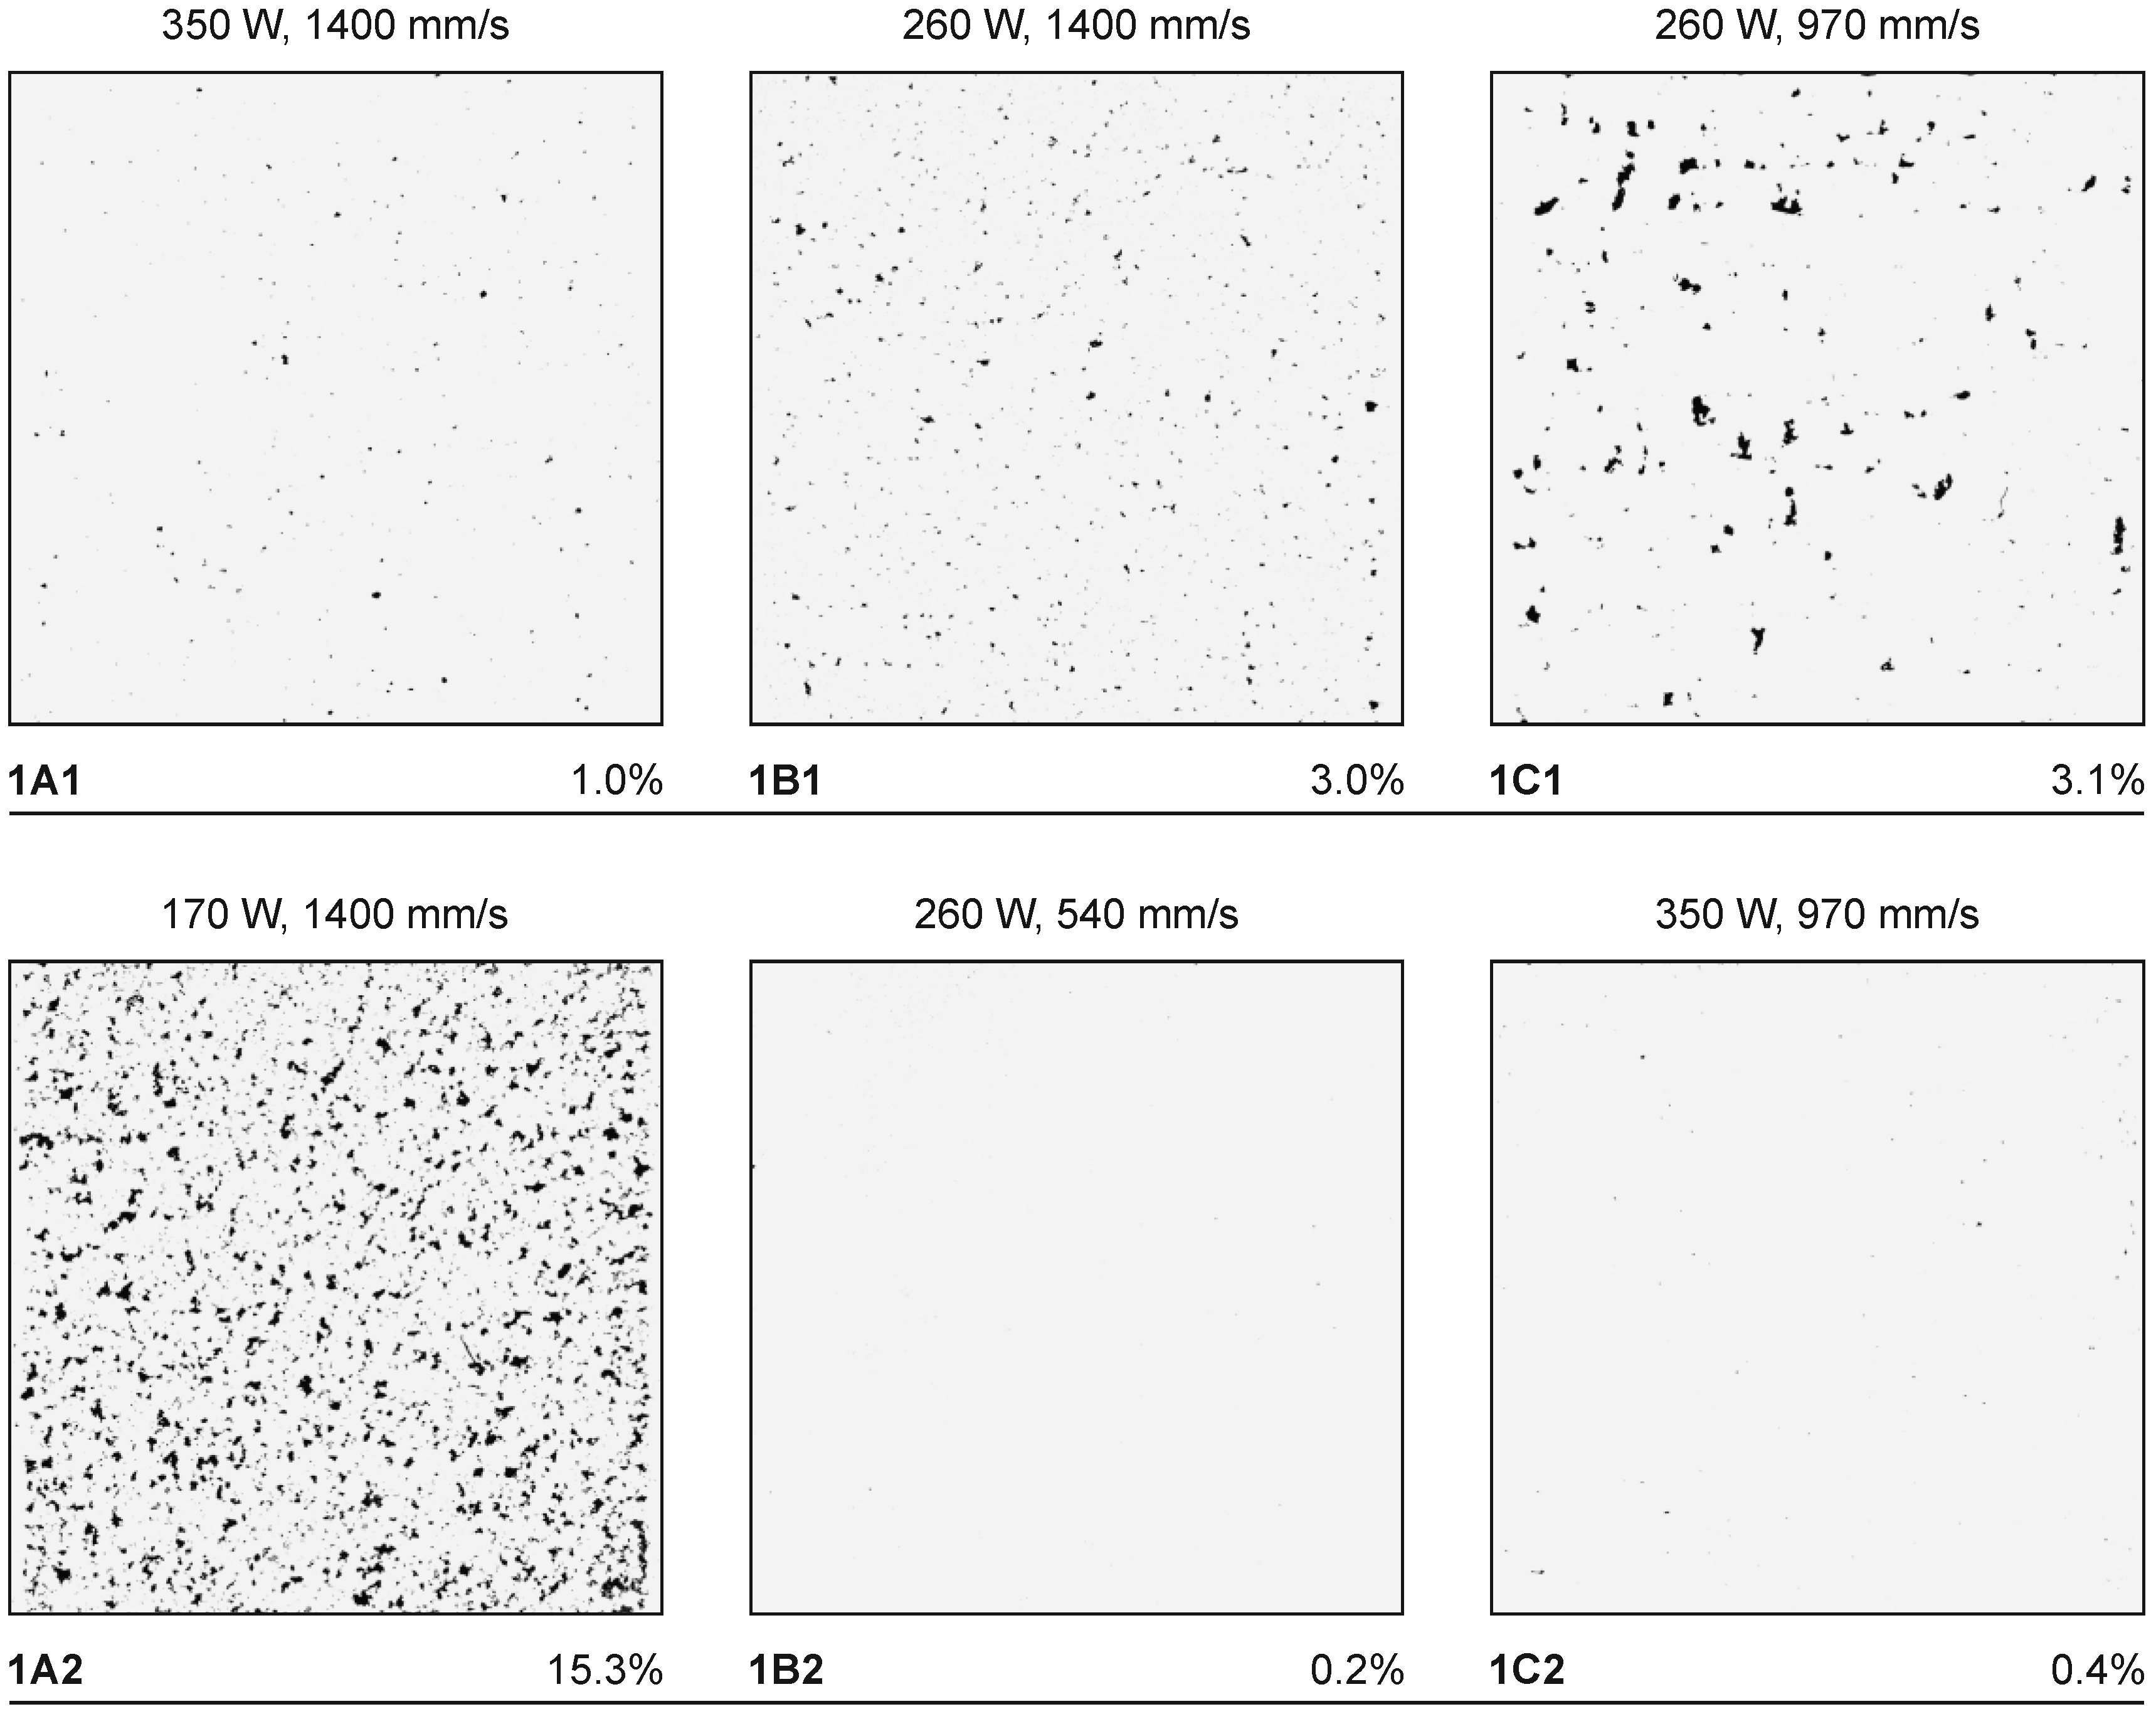
| 1A1 | 7 | 350 | 1400 | 69.4 | 1.0 |
| 1A2 | 1 | 170 | 1400 | 33.7 | 15.3 |
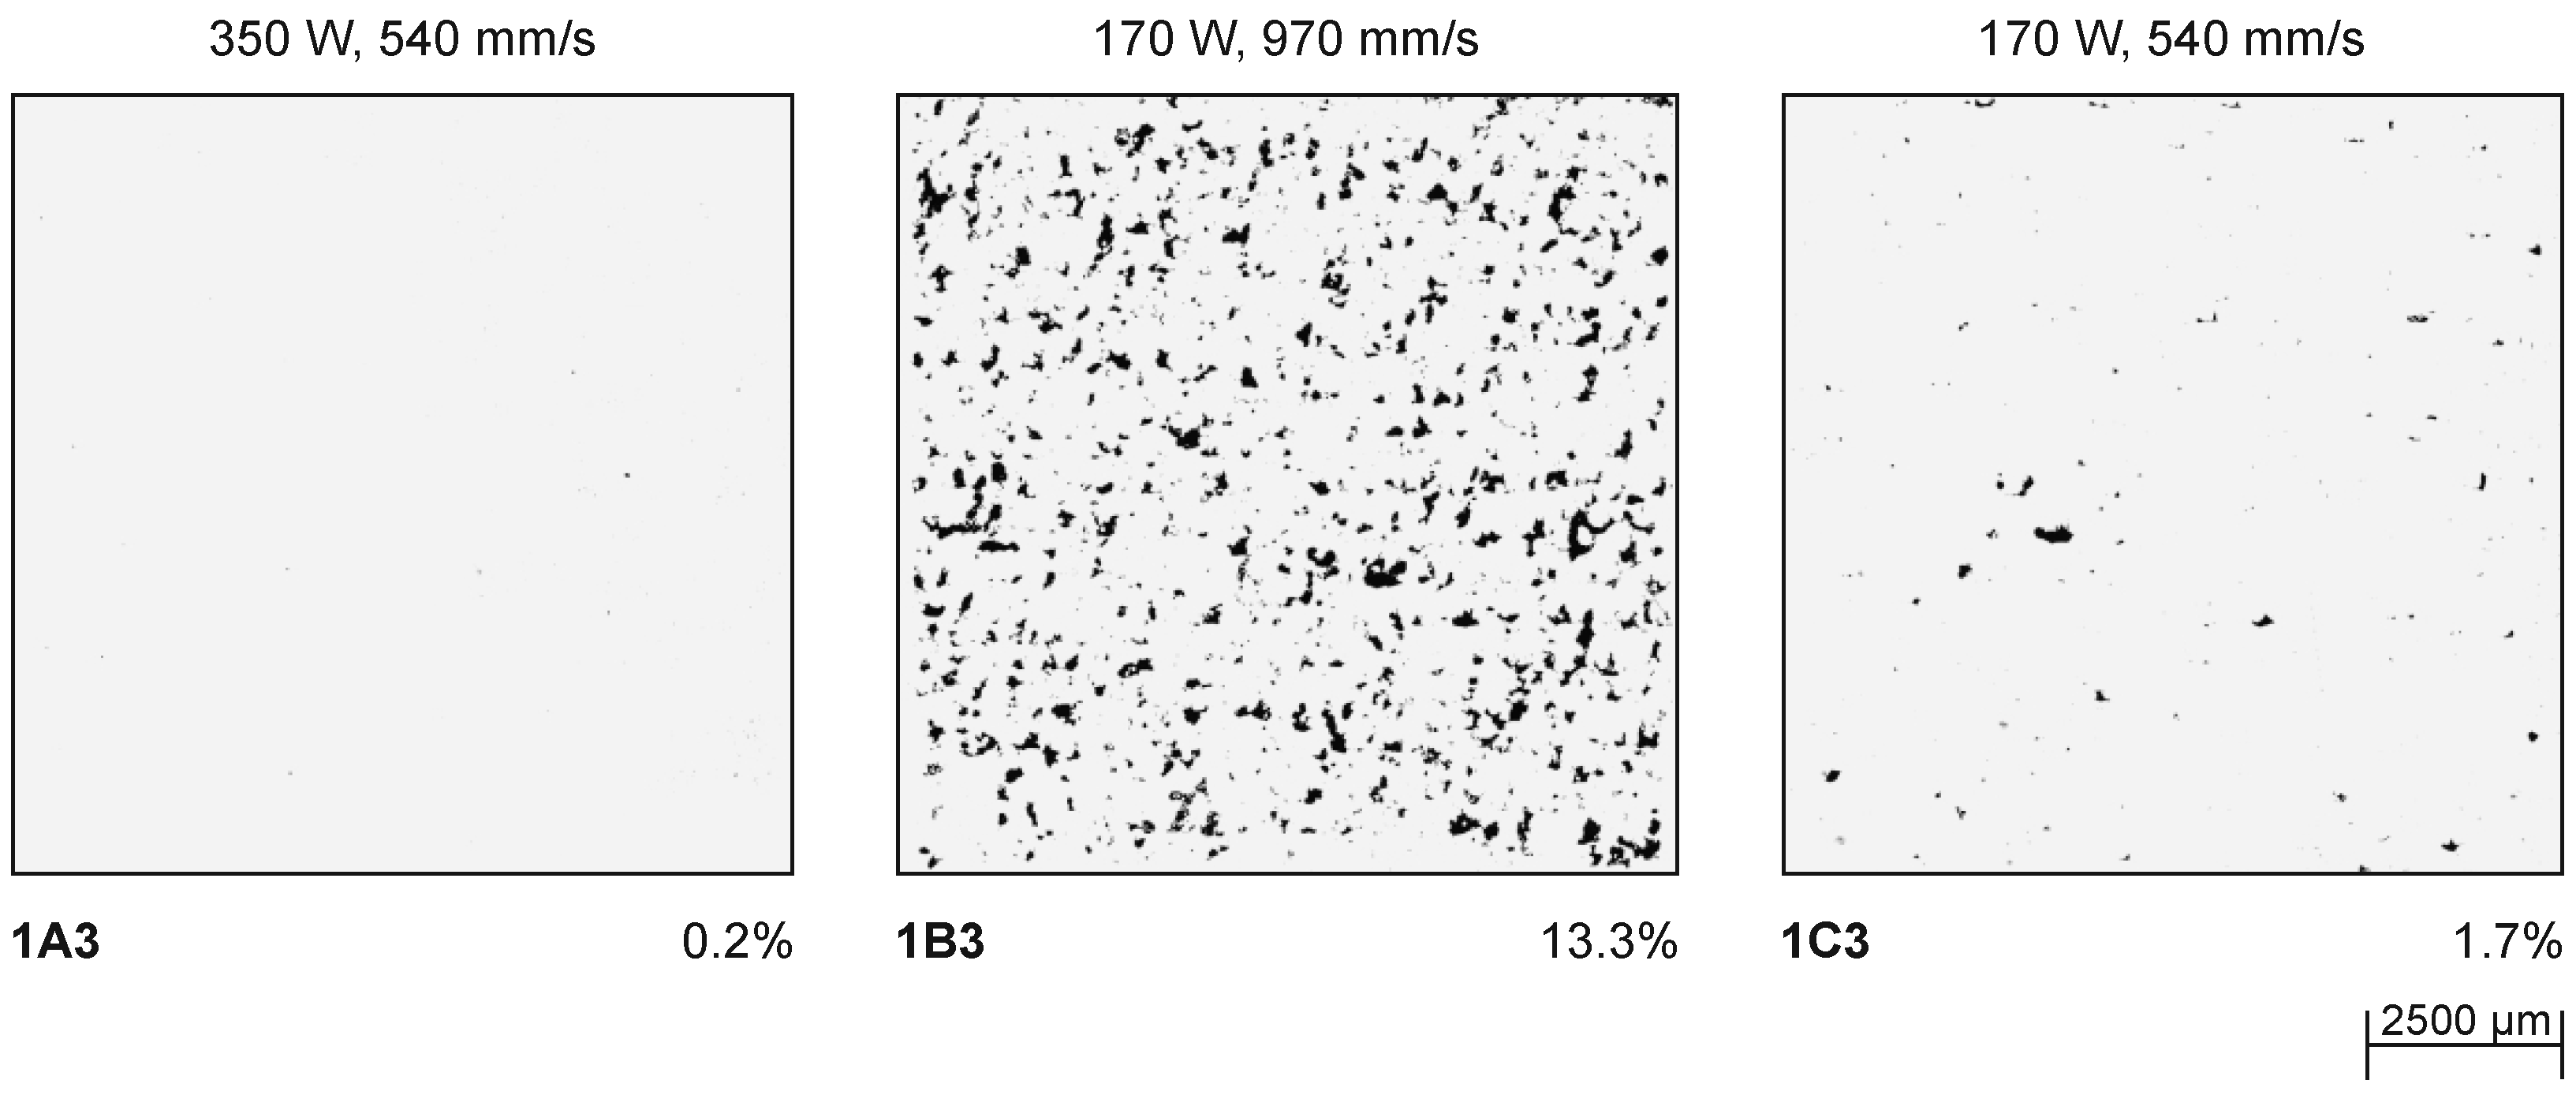
| 1A3 | 8 | 350 | 540 | 180 | 0.2 |
| 1B1 | 4 | 260 | 1400 | 51.6 | 3.0 |
| 1B2 | 5 | 260 | 540 | 133.7 | 0.2 |
| 1B3 | 3 | 170 | 970 | 48.7 | 13.3 |
| 1C1 | 6 | 260 | 970 | 74.5 | 3.1 |
| 1C2 | 9 | 350 | 970 | 100.2 | 0.4 |
| 1C3 | 2 | 170 | 540 | 87.5 | 1.7 |
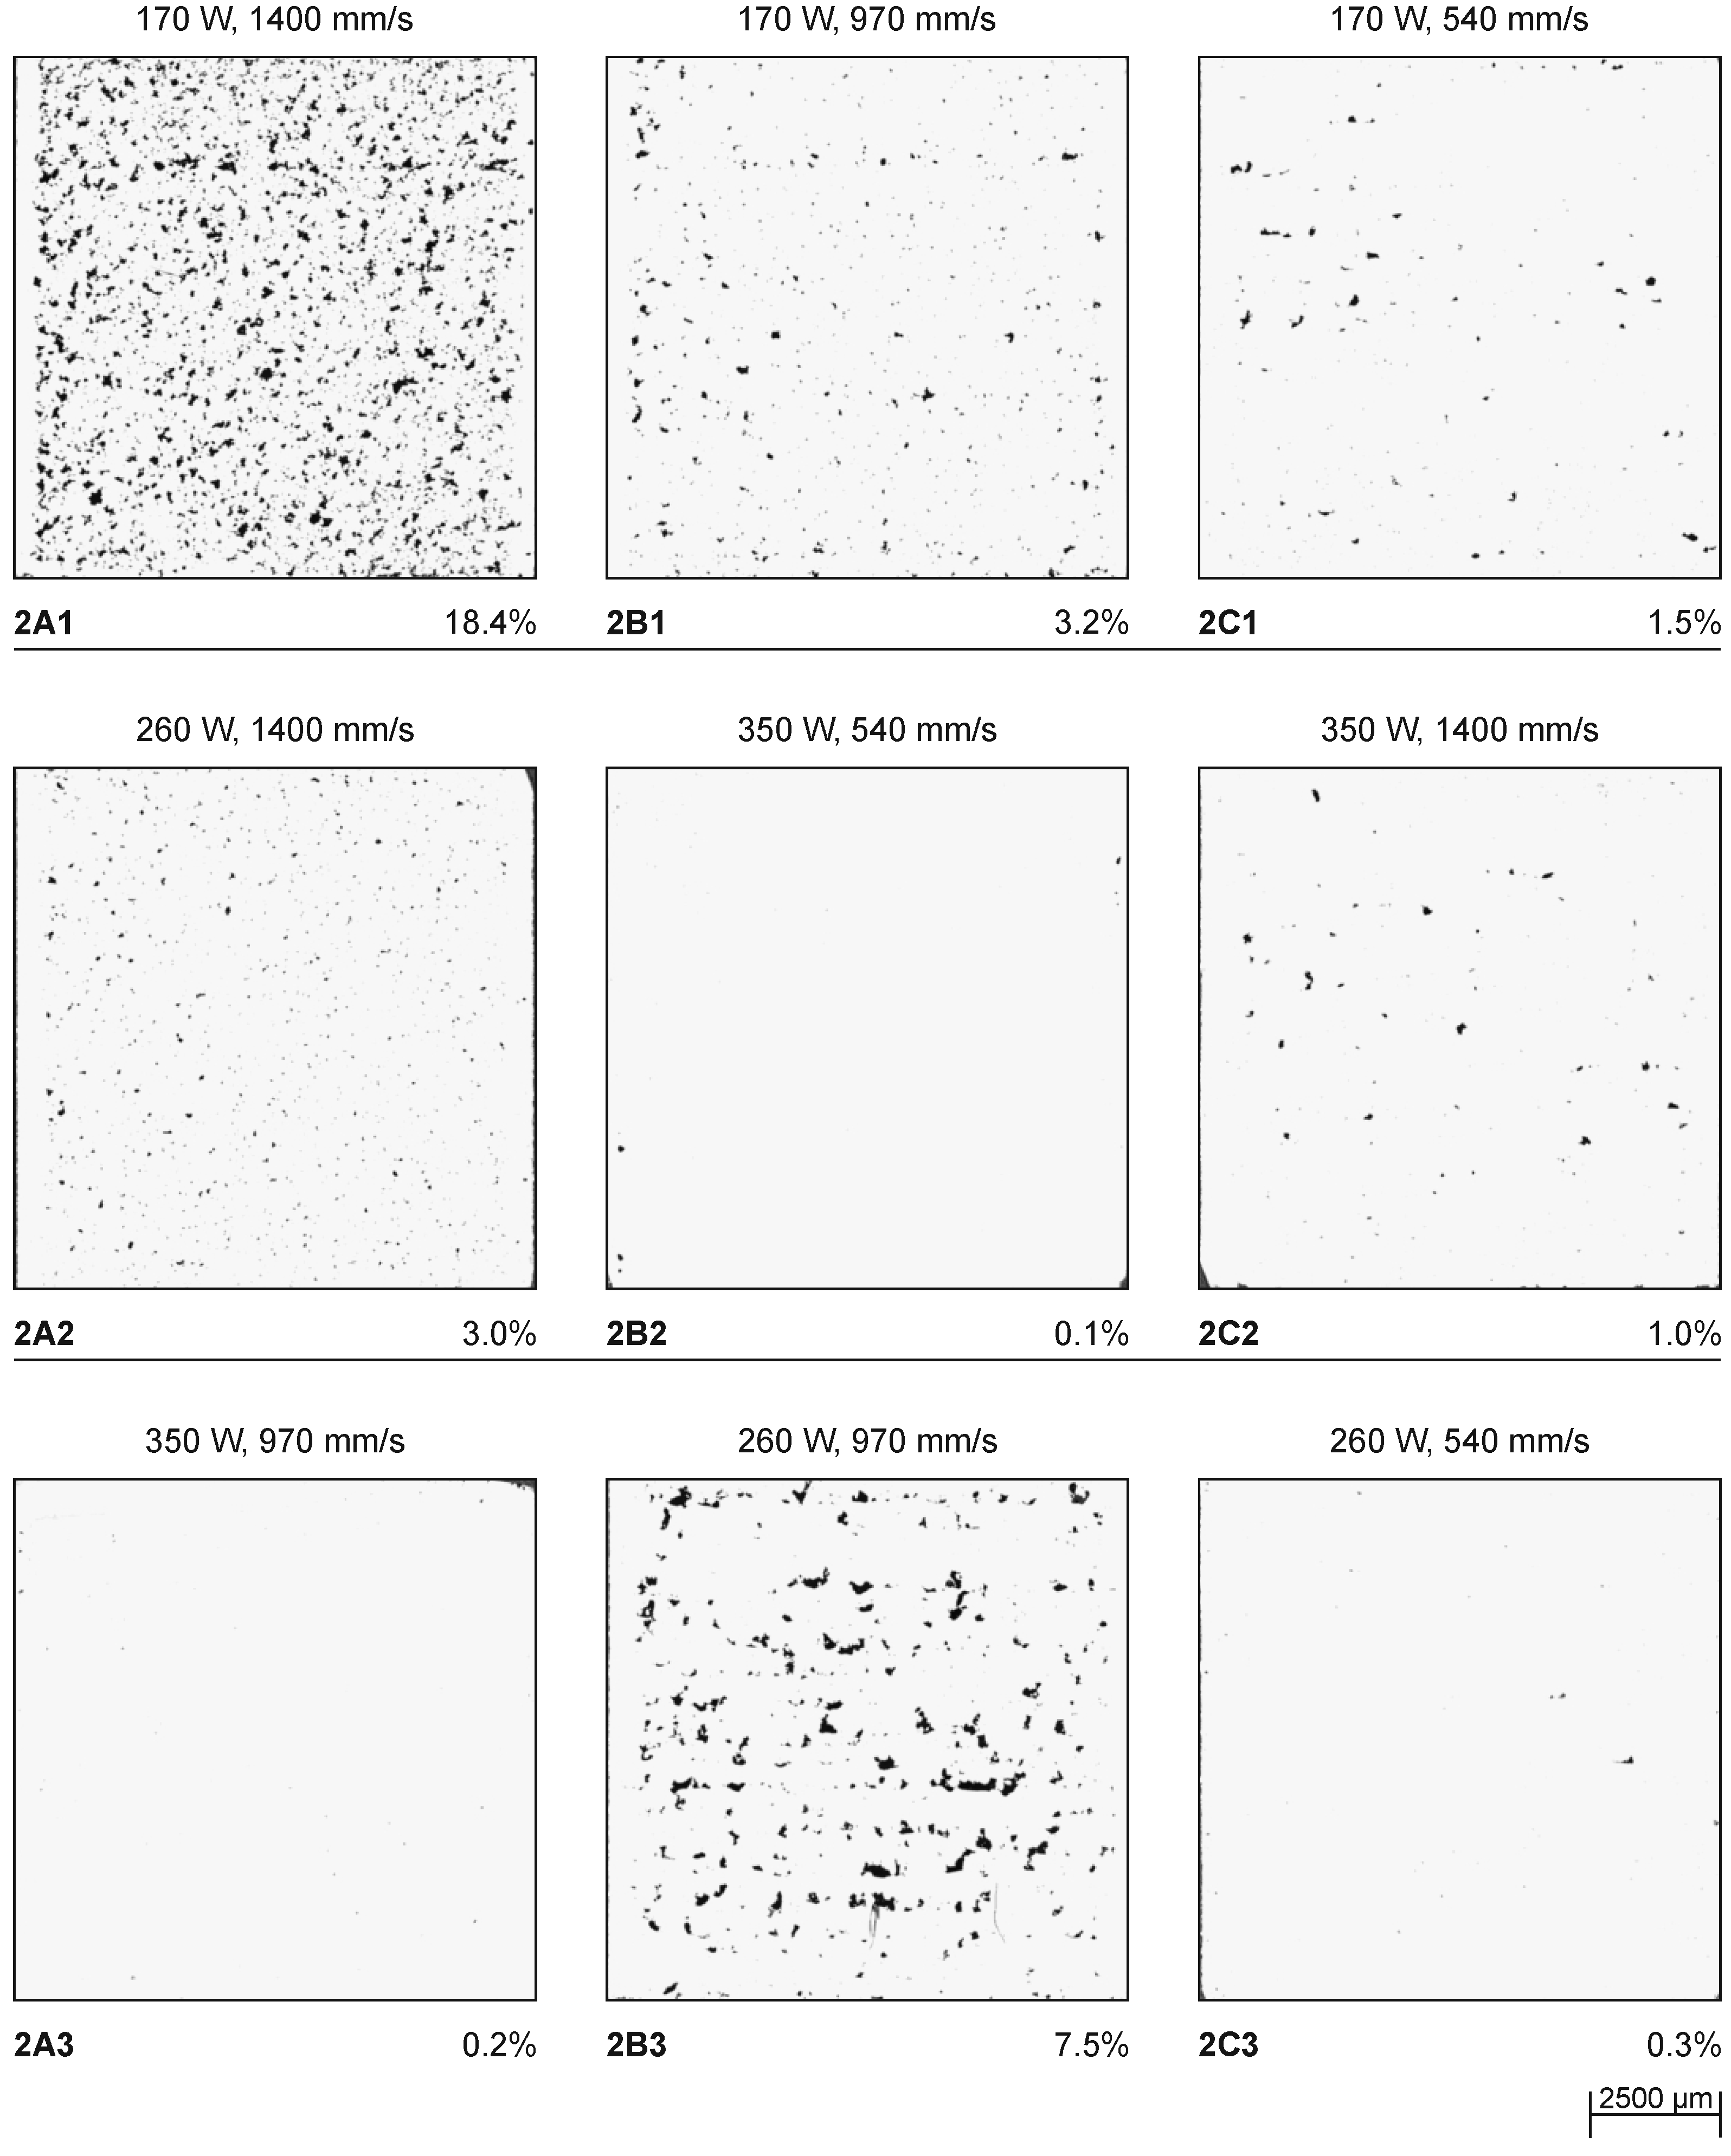
| 2A1 | 1 | 170 | 1400 | 33.7 | 18.4 |
| 2A2 | 4 | 260 | 1400 | 51.6 | 3.0 |
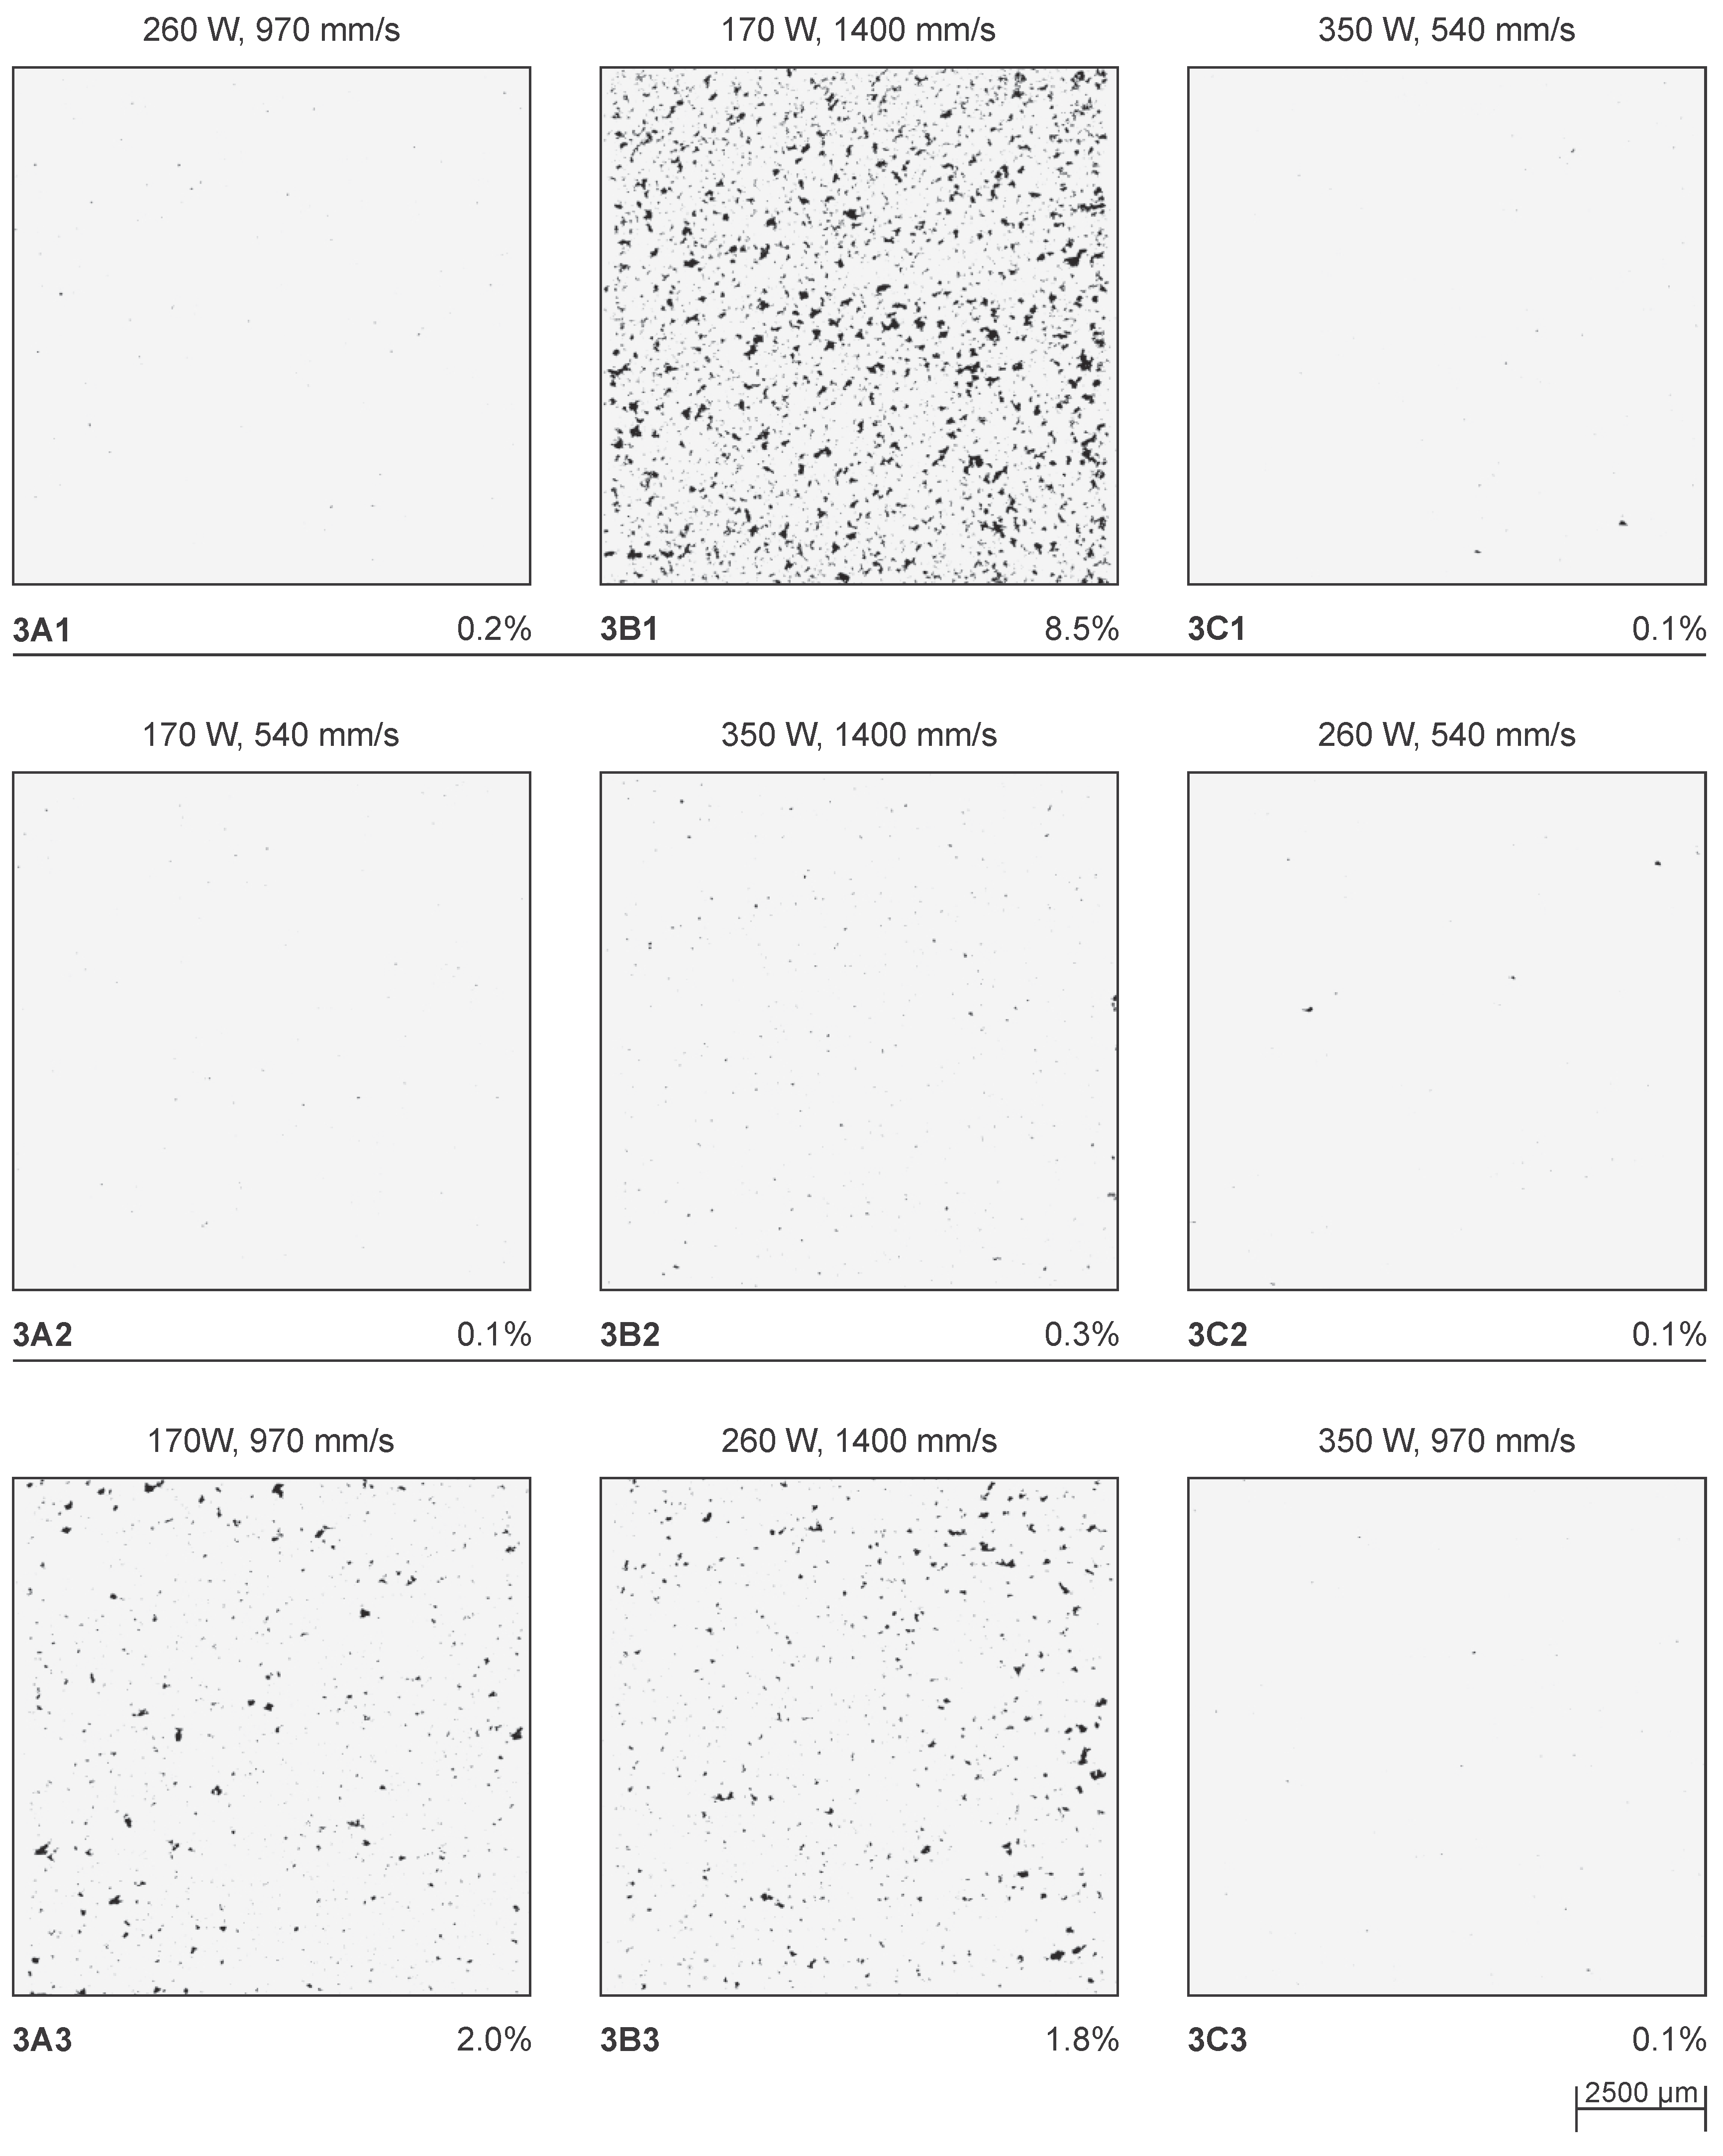
| 2A3 | 9 | 350 | 970 | 100.2 | 0.2 |
| 2B1 | 3 | 170 | 970 | 48.7 | 3.2 |
| 2B2 | 8 | 350 | 540 | 180 | 0.1 |
| 2B3 | 6 | 260 | 970 | 74.5 | 7.5 |
| 2C1 | 2 | 170 | 540 | 87.5 | 1.5 |
| 2C2 | 7 | 350 | 1400 | 69.4 | 1.0 |
| 2C3 | 5 | 260 | 540 | 133.7 | 0.3 |
| 3A1 | 6 | 260 | 970 | 74.5 | 0.2 |
| 3A2 | 2 | 170 | 540 | 87.5 | 0.1 |
| 3A3 | 3 | 170 | 970 | 48.7 | 2.0 |
| 3B1 | 1 | 170 | 1400 | 33.7 | 8.5 |
| 3B2 | 7 | 350 | 1400 | 69.4 | 0.3 |
| 3B3 | 4 | 260 | 1400 | 51.6 | 1.8 |
| 3C1 | 8 | 350 | 540 | 180 | 0.1 |
| 3C2 | 5 | 260 | 540 | 133.7 | 0.1 |
| 3C3 | 9 | 350 | 970 | 100.2 | 0.1 |


References
- Yap, C.; Chua, C.; Dong, Z.; Liu, Z.; Zhang, D.; Loh, L.; Sing, S. Review of selective laser melting: Materials and applications. Appl. Phys. Rev. 2015, 2, 041101. [Google Scholar] [CrossRef]
- Maconachie, T.; Leary, M.; Lozanovski, B.; Zhang, X.; Qian, M.; Faruque, O.; Brandt, M. SLM lattice structures: Properties, performance, applications and challenges. Mater. Des. 2019, 183, 108137. [Google Scholar] [CrossRef]
- Hao, L.; Raymont, D.; Yan, C.; Hussein, A.; Young, P. Design and additive manufacturing of cellular lattice structures. In The International Conference on Advanced Research in Virtual and Rapid Prototyping (VRAP); Taylor & Francis Group: Leiria, Portugal, 2011; pp. 249–254. [Google Scholar] [CrossRef]
- Durakovic, B. Design for additive manufacturing: Benefits, trends and challenges. Period. Eng. Nat. Sci. 2018, 6, 179–191. [Google Scholar] [CrossRef] [Green Version]
- Kempen, K.; Thijs, L.; Yasa, E.; Badrossamay, M.; Verheecke, W.; Kruth, J. Process optimization and microstructural analysis for selective laser melting of AlSi10Mg. In Proceedings of the 22nd Annual International Solid Freeform Fabrication Symposium-An Additive Manufacturing Conference, SFF 2011, Austin, TX, USA, 8–10 August 2011; pp. 484–495. [Google Scholar]
- Fousová, M.; Vojtěch, D.; Kubásek, J.; Jablonská, E.; Fojt, J. Promising characteristics of gradient porosity Ti-6Al-4V alloy prepared by SLM process. J. Mech. Behav. Biomed. Mater. 2017, 69, 368–376. [Google Scholar] [CrossRef]
- Gong, H.; Rafi, K.; Gu, H.; Ram, G.J.; Starr, T.; Stucker, B. Influence of defects on mechanical properties of Ti–6Al–4 V components produced by selective laser melting and electron beam melting. Mater. Des. 2015, 86, 545–554. [Google Scholar] [CrossRef]
- Ninpetch, P.; Kowitwarangkul, P.; Mahathanabodee, S.; Chalermkarnnon, P.; Ratanadecho, P. A review of computer simulations of metal 3D printing. In AIP Conference Proceedings; AIP Publishing LLC: New York, NY, USA, 2020; Volume 2279, p. 050002. [Google Scholar] [CrossRef]
- Zvoníček, J.; Koutnỳ, D.; Pantělejev, L.; Paloušek, D. Development of process parameters for SLM processing of AlSi7Mg aluminum alloy. In Current Methods of Construction Design; Springer: Berlin, Germany, 2020; pp. 515–524. [Google Scholar] [CrossRef]
- Spears, T.G.; Gold, S.A. In-process sensing in selective laser melting (SLM) additive manufacturing. Integr. Mater. Manuf. Innov. 2016, 5, 16–40. [Google Scholar] [CrossRef] [Green Version]
- Laakso, P.; Riipinen, T.; Laukkanen, A.; Andersson, T.; Jokinen, A.; Revuelta, A.; Ruusuvuori, K. Optimization and simulation of SLM process for high density H13 tool steel parts. Phys. Procedia 2016, 83, 26–35. [Google Scholar] [CrossRef] [Green Version]
- Liao, H.T.; Shie, J.R. Optimization on selective laser sintering of metallic powder via design of experiments method. Rapid Prototyp. J. 2007, 13, 156–162. [Google Scholar] [CrossRef]
- Vrancken, B. Study of Residual Stresses in Selective Laser Melting. Ph.D. Thesis, KU Leuven, Leuven, Belgium, 2016. [Google Scholar]
- Mertens, R.; Vrancken, B.; Holmstock, N.; Kinds, Y.; Kruth, J.P.; Van Humbeeck, J. Influence of powder bed preheating on microstructure and mechanical properties of H13 tool steel SLM parts. Phys. Procedia 2016, 83, 882–890. [Google Scholar] [CrossRef] [Green Version]
- Krell, J.; Röttger, A.; Geenen, K.; Theisen, W. General investigations on processing tool steel X40CrMoV5-1 with selective laser melting. J. Mater. Process. Technol. 2018, 255, 679–688. [Google Scholar] [CrossRef]
- Yan, J.; Zheng, D.; Li, H.; Jia, X.; Sun, J.; Li, Y.; Qian, M.; Yan, M. Selective laser melting of H13: Microstructure and residual stress. J. Mater. Sci. 2017, 52, 12476–12485. [Google Scholar] [CrossRef]
- Gu, D.; Shen, Y. Balling phenomena in direct laser sintering of stainless steel powder: Metallurgical mechanisms and control methods. Mater. Des. 2009, 30, 2903–2910. [Google Scholar] [CrossRef]
- Thanki, A.; Goossens, L.; Mertens, R.; Probst, G.; Dewulf, W.; Witvrouw, A.; Yang, S. Study of keyhole-porosities in selective laser melting using X-ray computed tomography. In Proceedings of the 9th Conference on Industrial Computed Tomography, iCT 2019, Padova, Italy, 13–15 February 2019; pp. 1–7. [Google Scholar]
- Liu, Q.C.; Elambasseril, J.; Sun, S.J.; Leary, M.; Brandt, M.; Sharp, P.K. The effect of manufacturing defects on the fatigue behaviour of Ti-6Al-4V specimens fabricated using selective laser melting. In Advanced Materials Research; Trans Tech Publications Ltd.: Freynbach, Switzerland, 2014; Volume 891, pp. 1519–1524. [Google Scholar]
- Mugwagwaa, L.; Dimitrova, D.; Matopea, S.; Yadroitsevb, I. Influence of process parameters on residual stress related distortions in selective laser melting. Procedia Manuf. 2018, 21, 92–99. [Google Scholar] [CrossRef]
- Algara Muñoz, V. Analysis of the Optimal Parameters for 3D Printing Aluminum Parts with a SLM 280 Machine. Master’s Thesis, Universitat Politècnica de Catalunya, Barcelona, Spain, 2017. [Google Scholar]
- Simchi, A. Direct laser sintering of metal powders: Mechanism, kinetics and microstructural features. Mater. Sci. Eng. A 2006, 428, 148–158. [Google Scholar] [CrossRef]
- Hanzl, P.; Zetek, M.; Bakša, T.; Kroupa, T. The influence of processing parameters on the mechanical properties of SLM parts. Procedia Eng. 2015, 100, 1405–1413. [Google Scholar] [CrossRef] [Green Version]
- Ansari, M.J.; Nguyen, D.S.; Park, H.S. Investigation of SLM Process in Terms of Temperature Distribution and Melting Pool Size: Modeling and Experimental Approaches. Materials 2019, 12, 1272. [Google Scholar] [CrossRef] [PubMed] [Green Version]
- Di, W.; Yongqiang, Y.; Xubin, S.; Yonghua, C. Study on energy input and its influences on single-track, multi-track, and multi-layer in SLM. Int. J. Adv. Manuf. Technol. 2012, 58, 1189–1199. [Google Scholar] [CrossRef]
- Peng, T.; Chen, C. Influence of energy density on energy demand and porosity of 316L stainless steel fabricated by selective laser melting. Int. J. Precis. Eng. Manuf.-Green Technol. 2018, 5, 55–62. [Google Scholar] [CrossRef]
- Dai, D.; Gu, D. Effect of metal vaporization behavior on keyhole-mode surface morphology of selective laser melted composites using different protective atmospheres. Appl. Surf. Sci. 2015, 355, 310–319. [Google Scholar] [CrossRef]
- Nguyen, Q.; Luu, D.; Nai, S.; Zhu, Z.; Chen, Z.; Wei, J. The role of powder layer thickness on the quality of SLM printed parts. Arch. Civ. Mech. Eng. 2018, 18, 948–955. [Google Scholar] [CrossRef]
- Gebhardt, A.; Hötter, J.S.; Ziebura, D. Impact of SLM Build Parameters on the Surface Quality; RTejournal-Forum für Rapid Technologie: Aachen, Germany, 2014. [Google Scholar]
- Kniepkamp, M.; Harbig, J.; Seyfert, C.; Abele, E. Towards high build rates: Combining different layer thicknesses within one part in selective laser melting. In Proceedings of the SFF Symposium Proceedings, Austin, TX, USA, 13–15 August 2018; pp. 2286–2296. [Google Scholar]
- Ali, H.; Ghadbeigi, H.; Mumtaz, K. Effect of scanning strategies on residual stress and mechanical properties of Selective Laser Melted Ti6Al4V. Mater. Sci. Eng. A 2018, 712, 175–187. [Google Scholar] [CrossRef]
- Cheng, B.; Shrestha, S.; Chou, K. Stress and deformation evaluations of scanning strategy effect in selective laser melting. Addit. Manuf. 2016, 12, 240–251. [Google Scholar]
- Kurzynowski, T.; Stopyra, W.; Gruber, K.; Ziółkowski, G.; Kuźnicka, B.; Chlebus, E. Effect of scanning and support strategies on relative density of SLM-ed H13 steel in relation to specimen size. Materials 2019, 12, 239. [Google Scholar] [CrossRef] [Green Version]
- Benedyk, J. Aerospace and High Performance Alloys Database (AHAD); Version 2.0; CINDAS LLC: West Lafayette, IN, USA, 2008; Available online: https://cindasdata.com/products/docs/ahad/ahad-example-h13.pdf (accessed on 9 October 2021).
- Li, G.; Li, X.; Wu, J. Study of the thermal fatigue crack initial life of H13 and H21 steels. J. Mater. Process. Technol. 1998, 74, 23–26. [Google Scholar] [CrossRef]
- Wanga, M.; Zhoua, Y.; Weia, Q.; Fanb, Z. The mechanical behavior of AISI H13 hot-work tool steel processed by selective laser melting under tensile stress. In Proceedings of the 29th Annual International Solid Freeform Fabrication Symposium—An Additive Manufacturing Conference, Austin, TX, USA, 13–15 August 2018. [Google Scholar]
- Safka, J.; Ackermann, M.; Volesky, L. Structural properties of H13 tool steel parts produced with use of selective laser melting technology. In Journal of Physics: Conference Series; IOP Publishing: Bristol, UK, 2016; Volume 709, pp. 1–7. [Google Scholar] [CrossRef] [Green Version]
- Mazur, M.; Leary, M.; McMillan, M.; Elambasseril, J.; Brandt, M. SLM additive manufacture of H13 tool steel with conformal cooling and structural lattices. Rapid Prototyp. J. 2016, 22, 504–518. [Google Scholar] [CrossRef]
- Yonehara, M.; Ikeshoji, T.T.; Nagahama, T.; Mizoguchi, T.; Tano, M.; Yoshimi, T.; Kyogoku, H. Parameter optimization of the high-power laser powder bed fusion process for H13 tool steel. Int. J. Adv. Manuf. Technol. 2020, 110, 427–437. [Google Scholar] [CrossRef]
- Wang, M.; Li, W.; Wu, Y.; Li, S.; Cai, C.; Wen, S.; Wei, Q.; Shi, Y.; Ye, F.; Chen, Z. High-temperature properties and microstructural stability of the AISI H13 hot-work tool steel processed by selective laser melting. Metall. Mater. Trans. B 2018, 50, 531–542. [Google Scholar] [CrossRef]
- Cohen, J. Statistical Power Analysis for the Behavioral Sciences; Academic Press: Cambridge, MA, USA, 2013. [Google Scholar] [CrossRef]
- Wang, P.; Tan, X.; He, C.; Nai, M.L.S.; Huang, R.; Tor, S.B.; Wei, J. Scanning optical microscopy for porosity quantification of additively manufactured components. Addit. Manuf. 2018, 21, 350–358. [Google Scholar] [CrossRef]
- Ren, B.; Zhou, R.; Li, Z.; Guan, J. Preparation and mechanical properties of selective laser melted H13 steel. J. Mater. Res. 2019, 34, 1415–1425. [Google Scholar] [CrossRef]
- Tucho, W.M.; Lysne, V.H.; Austbø, H.; Sjolyst-Kverneland, A.; Hansen, V. Investigation of effects of process parameters on microstructure and hardness of SLM manufactured SS316L. J. Alloys Compd. 2018, 740, 910–925. [Google Scholar] [CrossRef]
- Cherry, J.; Davies, H.; Mehmood, S.; Lavery, N.; Brown, S.; Sienz, J. Investigation into the effect of process parameters on microstructural and physical properties of 316L stainless steel parts by selective laser melting. Int. J. Adv. Manuf. Technol. 2014, 76, 869–879. [Google Scholar] [CrossRef] [Green Version]
- Tonelli, L.; Fortunato, A.; Ceschini, L. CoCr alloy processed by selective laser melting (SLM): Effect of laser energy density on microstructure, surface morphology, and hardness. J. Manuf. Process. 2020, 52, 106–119. [Google Scholar] [CrossRef]


| Reference | SLM | [11] | [15] | [38] | [39] | [40] |
|---|---|---|---|---|---|---|
| Laser power [W] | 350 | 250 | 100 | 175 | 375 | 280 |
| Scanning speed [mm/s] | 1400 | 994 | 300 | 607 | 790 | 980 |
| Layer thickness [mm] | 0.03 | 0.03 | 0.03 | 0.03 | 0.05 | 0.04 |
| Hatch distance [mm] | 0.10 | 0.10 | 0.10 | 0.12 | 0.12 | 0.12 |
| VED [J/mm] | 84.03 | 84.03 | 111 | 80 | 79.1 | 59.51 |
| Porosity [%] | - | 0.09 | 0.50 | 0.12 | 0.10 | 1.40 |
| Element | New Powder | Used Powder | ASTM A681 |
|---|---|---|---|
| Fe | 90.80 | 90.90 | Balance |
| C | Balance | Balance | 0.32–0.45 |
| Cr | 5.60 | 5.50 | 4.75–5.50 |
| Mn | 0.60 | 0.60 | 0.20–0.60 |
| Mo | 1.00 | 1.00 | 1.10–1.75 |
| Si | 0.60 | 0.80 | 0.80–1.25 |
| V | 1.10 | 0.90 | 0.80–1.20 |
| D10 [m] | D50 [m] | D90 [m] | |
|---|---|---|---|
| H13 Virgin | 16.49 | 29.42 | 51.13 |
| H13 Used | 23.66 | 39.07 | 64.48 |
| Parameter | Value | Parameter Details |
|---|---|---|
| Number of factors | Factor 1: laser power P [W] | |
| Factor 2: scanning speed v [mm/s] | ||
| Number of levels | Factor 1: 170 W; 260 W; 350 W | |
| Factor 2: 540 mm/s; 970 mm/s; 1400 mm/s | ||
| Number of specimens for one batch | ||
| Number of replications | 3 | |
| Total specimens | 27 |
| Combination | 1 | 2 | 3 | 4 | 5 | 6 | 7 | 8 | 9 |
|---|---|---|---|---|---|---|---|---|---|
| P [W] | 170 | 170 | 170 | 260 | 260 | 260 | 350 | 350 | 350 |
| v [mm/s] | 1400 | 540 | 970 | 1400 | 540 | 970 | 1400 | 540 | 970 |
| VED [J/mm] | 33.7 | 87.5 | 48.7 | 51.6 | 133.7 | 74.5 | 69.4 | 180 | 100.2 |
| Replication 1 | Replication 2 | Replication 3 | |||||||
|---|---|---|---|---|---|---|---|---|---|
| A | B | C | A | B | C | A | B | C | |
| 1 | 7 | 4 | 6 | 1 | 3 | 2 | 6 | 1 | 8 |
| 2 | 1 | 5 | 9 | 4 | 8 | 7 | 2 | 7 | 5 |
| 3 | 8 | 3 | 2 | 9 | 6 | 5 | 3 | 4 | 9 |
| Step | Grinding Paper (Grit Size) | Force [N] | Time [min] | RPM [min] | Grinding Medium |
|---|---|---|---|---|---|
| 1 | SiC 500 | 30 | 6 | 300 | Water |
| 2 | SiC 1200 | 25 | 5 | 300 | Water |
| 3 | SiC 2000 | 20 | 5 | 300 | Water |
| 4 | SiC 4000 | 15 | 3 | 300 | Water |
| 5 | MD-Nap | 15 | 4.5 | 150 | Dia Duo 1 |
Publisher’s Note: MDPI stays neutral with regard to jurisdictional claims in published maps and institutional affiliations. |
© 2021 by the authors. Licensee MDPI, Basel, Switzerland. This article is an open access article distributed under the terms and conditions of the Creative Commons Attribution (CC BY) license (https://creativecommons.org/licenses/by/4.0/).
Share and Cite
Véle, F.; Ackermann, M.; Bittner, V.; Šafka, J. Influence of Selective Laser Melting Technology Process Parameters on Porosity and Hardness of AISI H13 Tool Steel: Statistical Approach. Materials 2021, 14, 6052. https://doi.org/10.3390/ma14206052
Véle F, Ackermann M, Bittner V, Šafka J. Influence of Selective Laser Melting Technology Process Parameters on Porosity and Hardness of AISI H13 Tool Steel: Statistical Approach. Materials. 2021; 14(20):6052. https://doi.org/10.3390/ma14206052
Chicago/Turabian StyleVéle, Filip, Michal Ackermann, Václav Bittner, and Jiří Šafka. 2021. "Influence of Selective Laser Melting Technology Process Parameters on Porosity and Hardness of AISI H13 Tool Steel: Statistical Approach" Materials 14, no. 20: 6052. https://doi.org/10.3390/ma14206052
APA StyleVéle, F., Ackermann, M., Bittner, V., & Šafka, J. (2021). Influence of Selective Laser Melting Technology Process Parameters on Porosity and Hardness of AISI H13 Tool Steel: Statistical Approach. Materials, 14(20), 6052. https://doi.org/10.3390/ma14206052