
Structural, Thermal and Magnetic Analysis of Fe75Co10Nb6B9 and Fe65Co20Nb6B9 Nanostructured Alloys


Abstract
:1. Introduction
2. Experimental Details
3. Results and Discussion
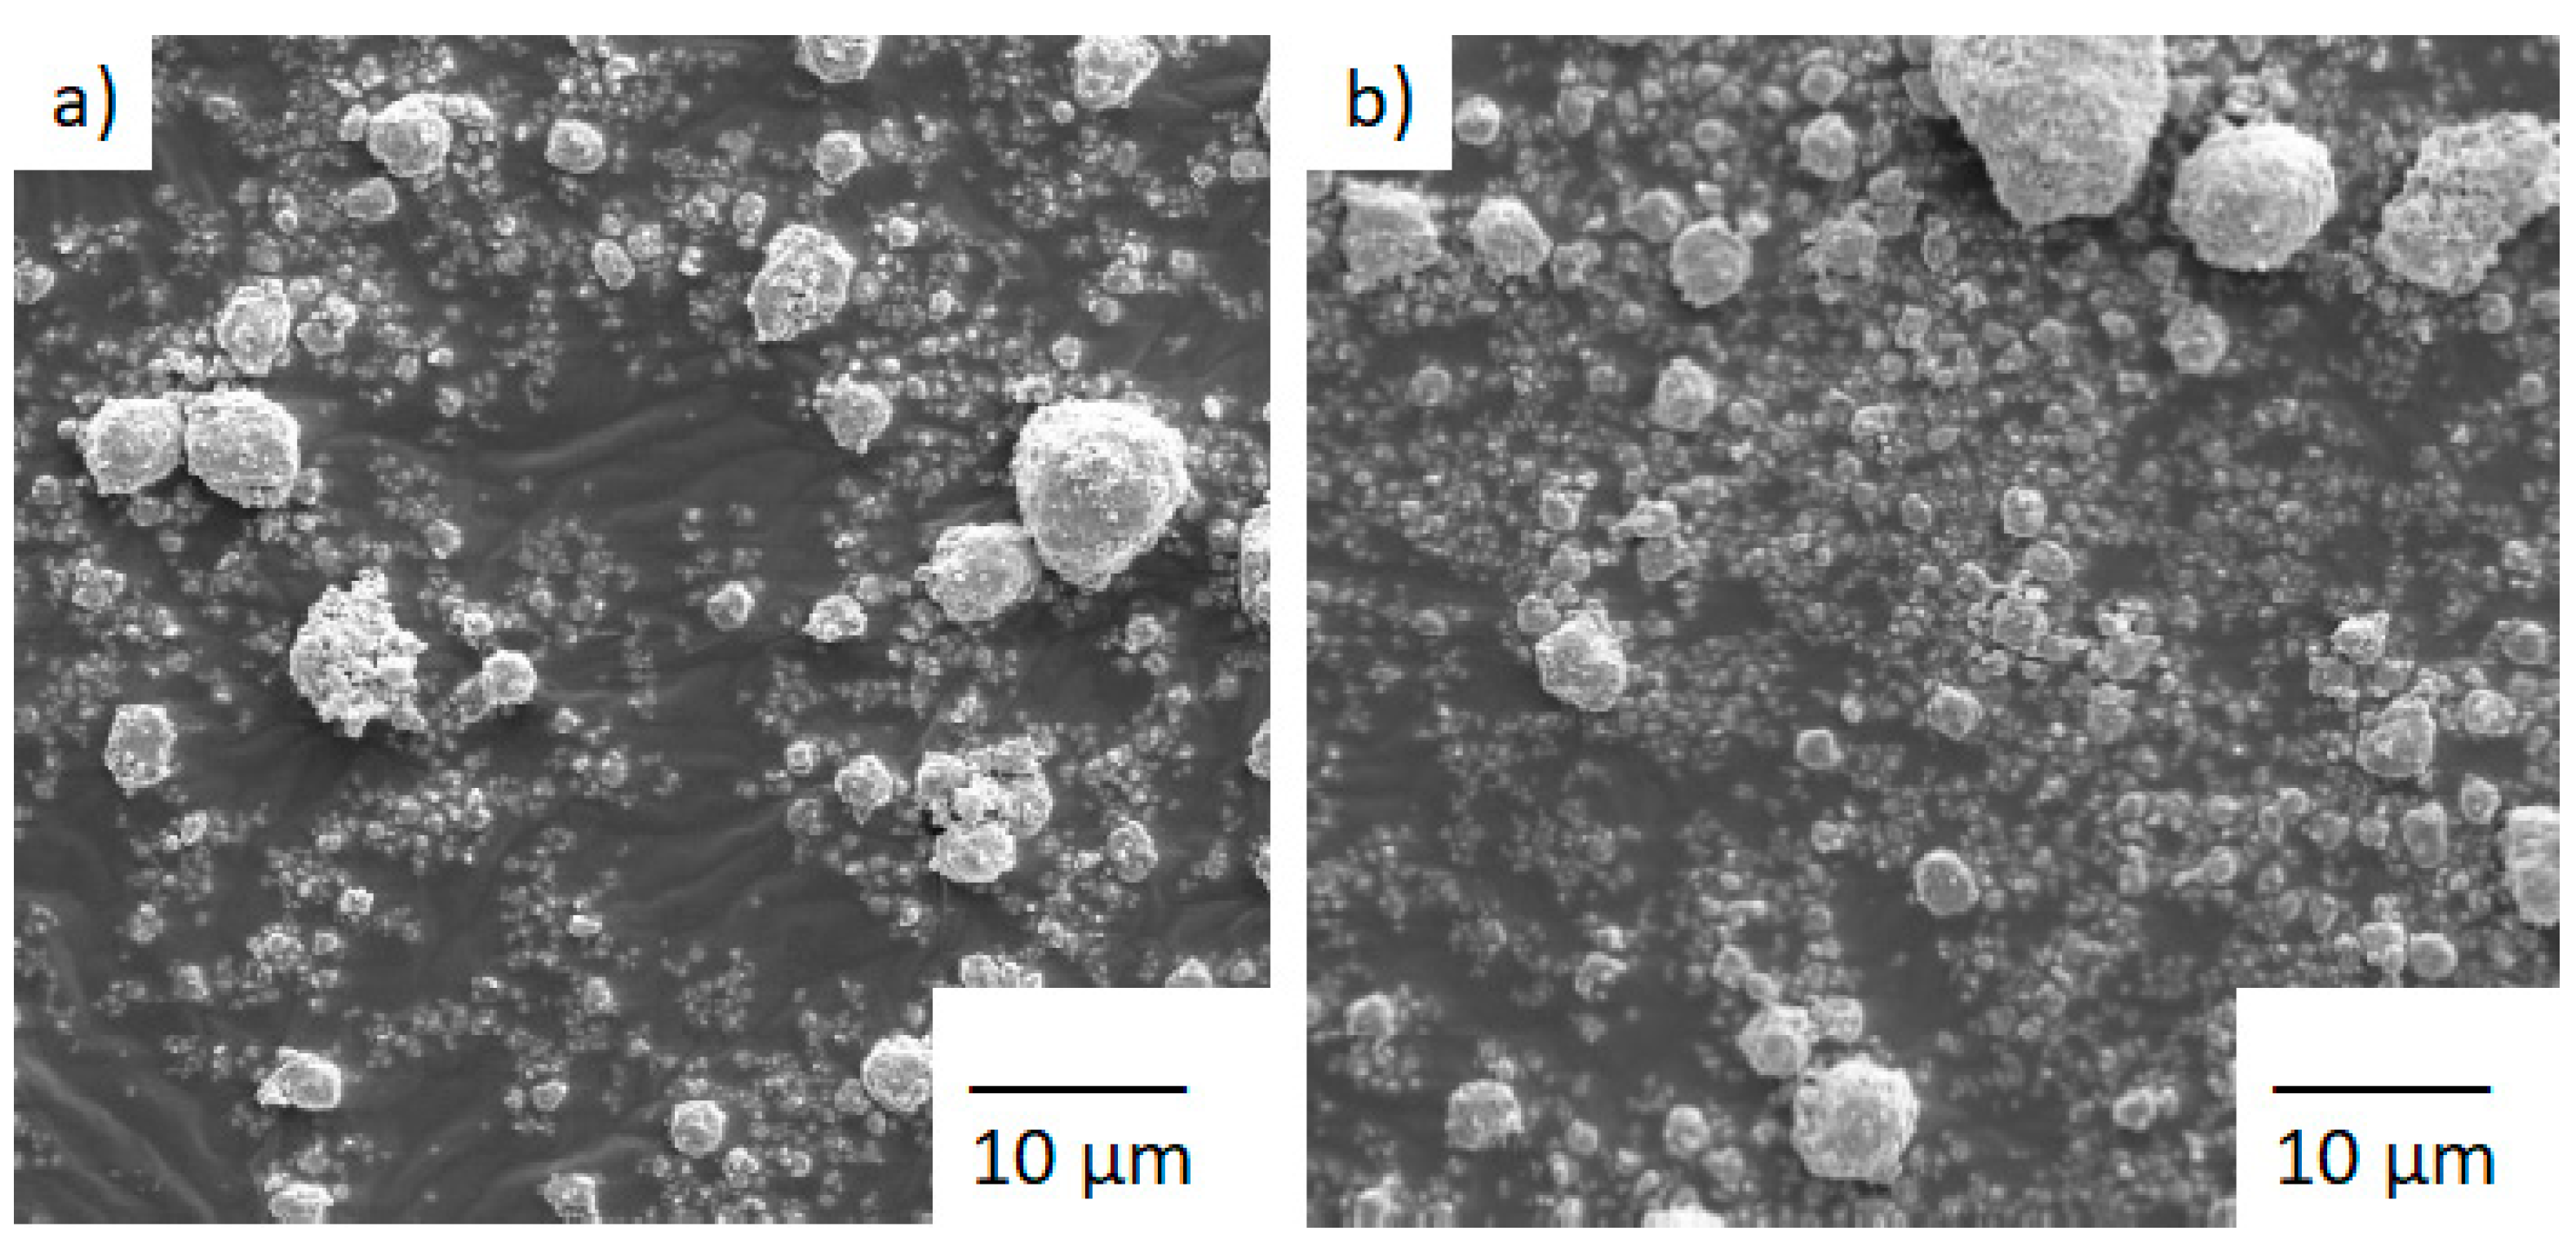
- (a)
- (b)
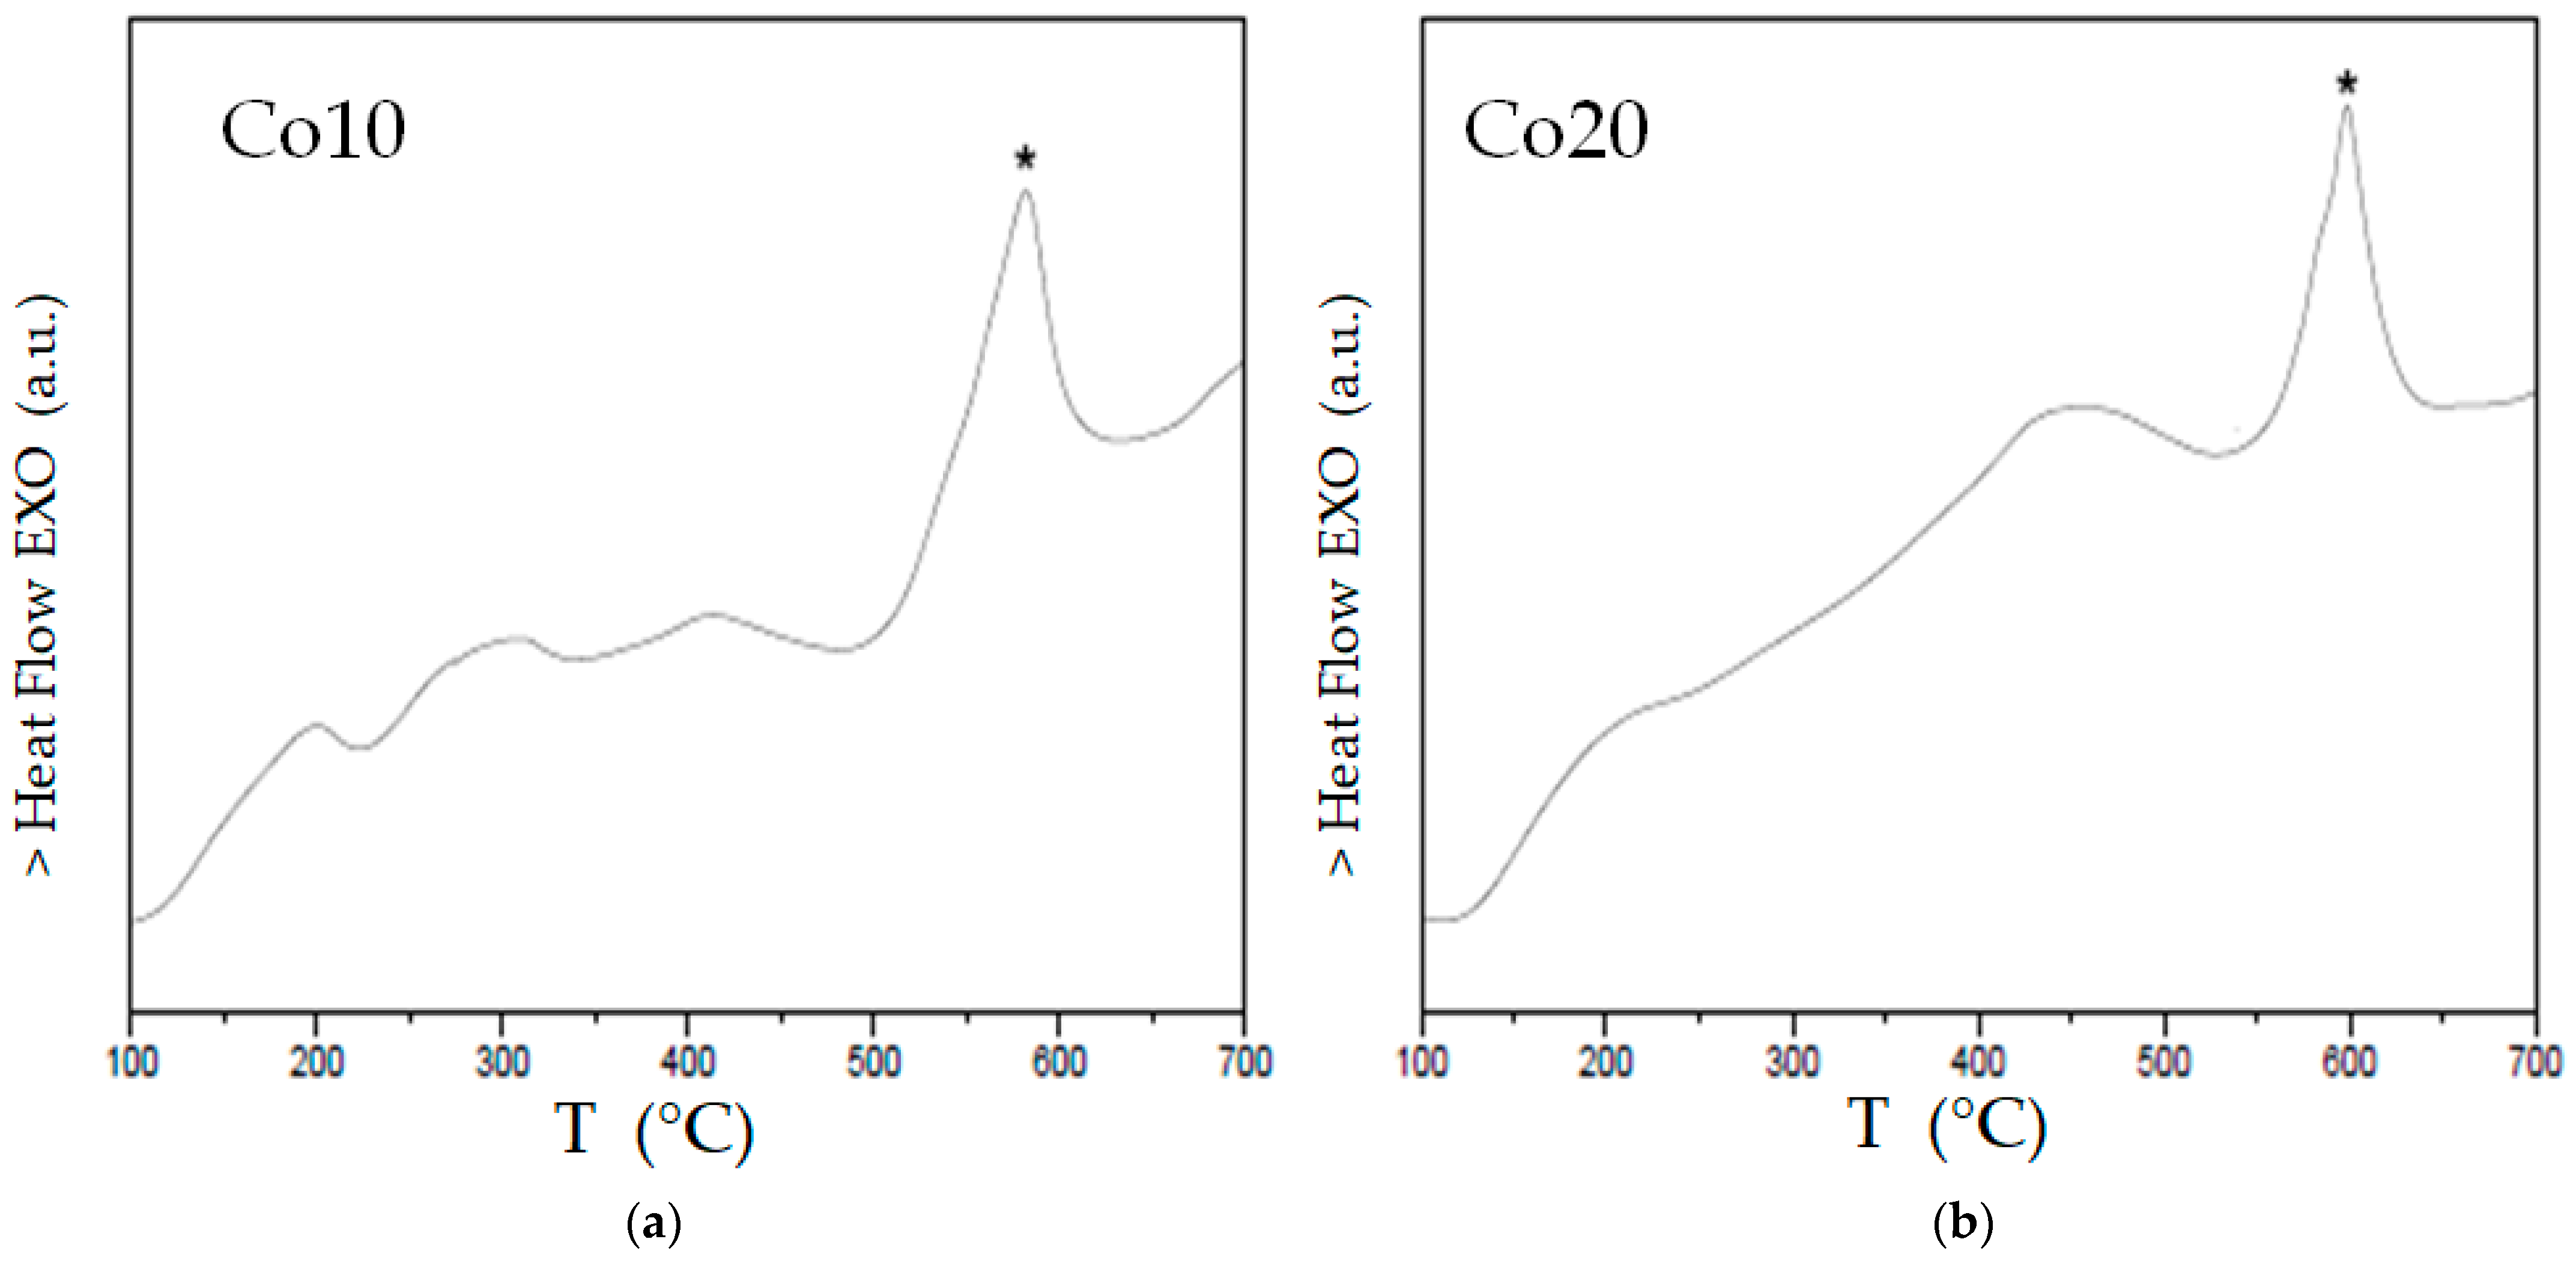
- The main exothermic process occurs at temperatures above 500 °C and at a similar temperature interval (a slightly higher peak temperature of ~8 °C in the Co20 sample);
- (c)
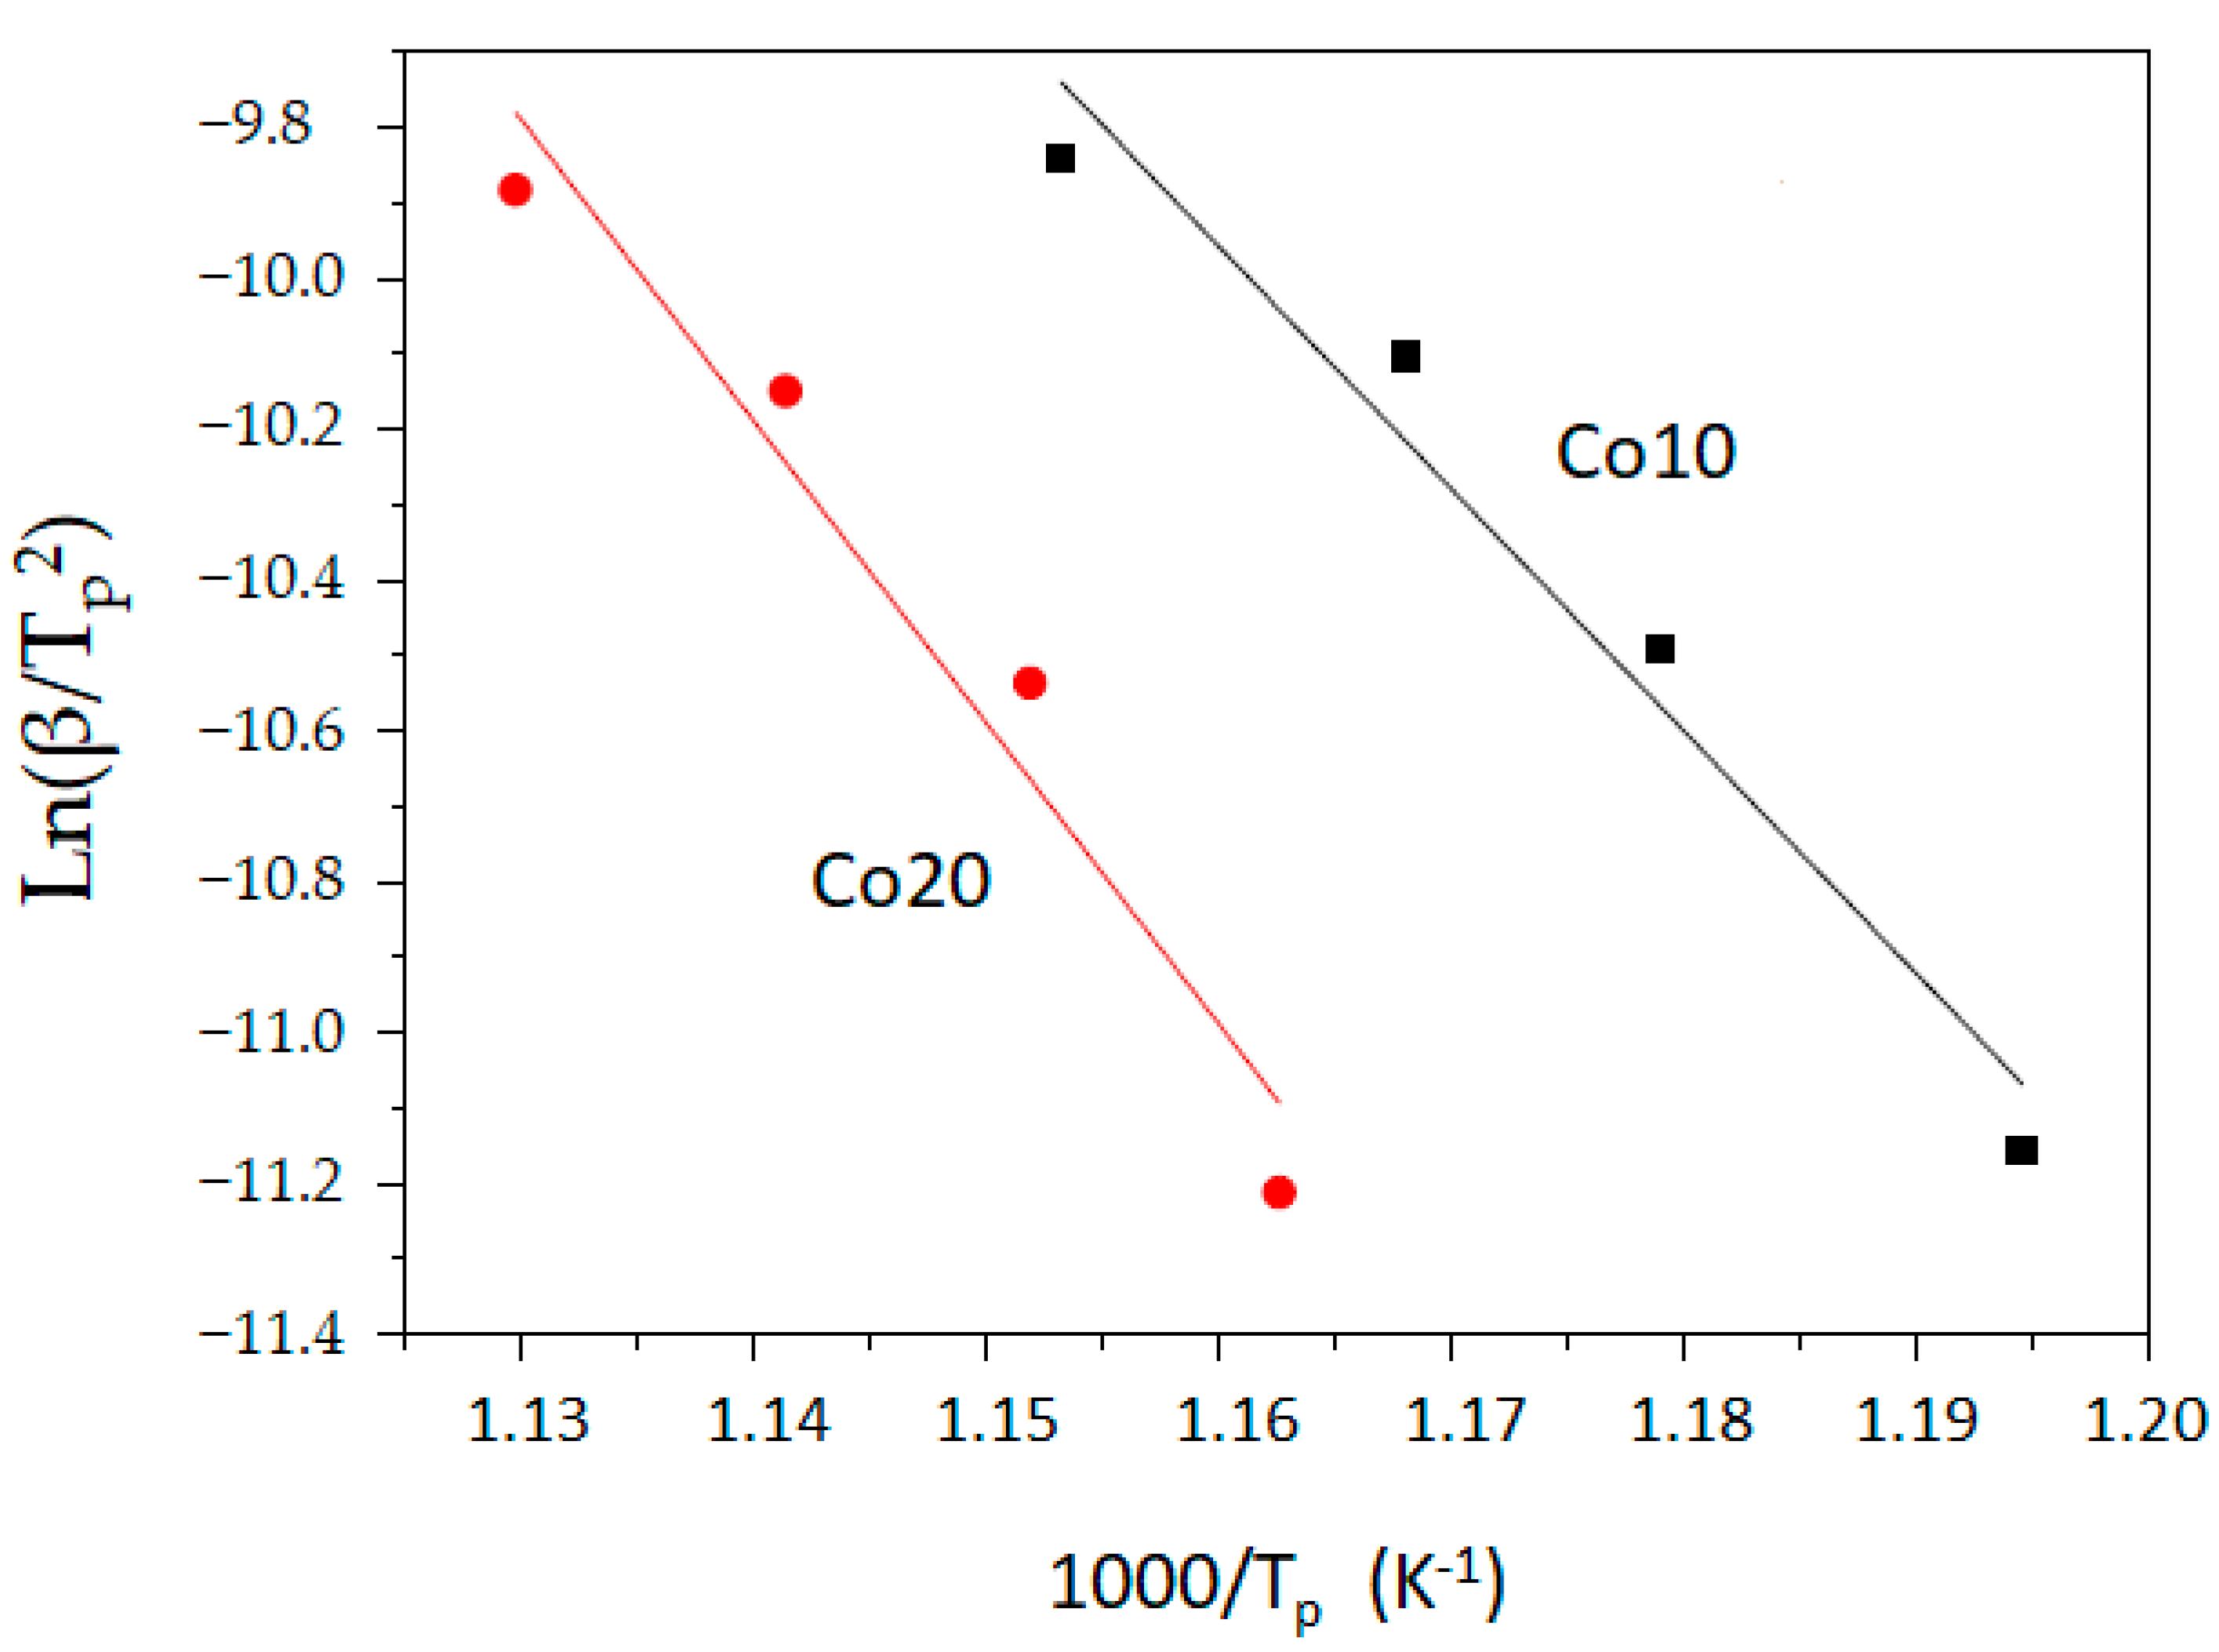
- With regard to the activation energy (of the main process) calculated in the two samples with cobalt, the energy of the alloy with 10% atomic cobalt is 267 kJ/mol, whereas that of the alloy with 20% cobalt is 332 kJ/mol.
4. Conclusions
Author Contributions
Funding
Institutional Review Board Statement
Informed Consent Statement
Data Availability Statement
Conflicts of Interest
References
- McHenry, M.E.; Willard, M.A.; Laughlin, D.E. Recent advances in the development of (Fe, Co)88M7B4Cu1 magnets. J. Appl. Phys. 2000, 87, 7091–7096. [Google Scholar]
- Bai, F.S.; Dong, Y.Q.; Xie, L.; Li, Q.; He, A.N.; Jia, X.J.; Li, J.W.; Wang, X.M. Effect of the pre-existing nuclei on microstructure and magnetic properties of high B-s Finemet-like nanocrystalline alloys. J. Mater. Sci. 2021, 56, 9254–9262. [Google Scholar] [CrossRef]
- Hasiak, M.; Laszcz, A.; Zak, A.; Kaleta, J. Mirostructure and magnetic properties of Nanoperm type soft magnetic materials. Acta Phys. Pol. A. 2019, 135, 284–287. [Google Scholar] [CrossRef]
- Wang, G.; Liu, M.; Wang, L.; Liu, H. Preparation and study of Fe-Co-Zr-B nano-soft magnetic alloy. Mater. Express 2019, 9, 686–689. [Google Scholar] [CrossRef]
- Ali, M.; Ahmad, F. A review of processing techniques for Fe-Ni soft magnetic materials. Mater. Manufact. Process. 2019, 34, 1580–1604. [Google Scholar] [CrossRef]
- Novak, P. Advanced Powder Metallurgy technologies. Materials 2020, 13, 1742. [Google Scholar]
- Martin, P.; Salvo, C.; Pio, E.; Neves, G.; Colorado, H.A.; Henríquez, R.; Mangalaraja, R.V.; Aguilar, C. A study of the phase formation and magnetic properties of FeNiCoCuM (M=Mo, Nb) high-entropy alloys processed through powder metallurgy. Metall. Mater. Trans. A Phys. Metal. Mater. Sci. 2021, 52, 1044–1058. [Google Scholar] [CrossRef]
- Suzuki, K.; Parsons, R.; Zang, B.; Onodera, K.; Shoji, T.; Kato, A. nanocrystalline soft magnetic materials from binary alloy precursors with high saturation magnetization. AIP Adv. 2019, 9, 035311. [Google Scholar] [CrossRef]
- Škorvánek, I.; Svec, P.; Marcin, J.; Kováč, J.; Kremcky, T.; Deanko, M. Nanocrystalline Cu-free Hitperm alloys with improved soft magnetic properties. J. Phys. Stat. Sol. 2003, 196, 217. [Google Scholar] [CrossRef]
- Sheng, W.W.; Qiu, Z.G.; Zheng, Z.G.; Zeng, D.C. Thermal behavior, microstructure and magnetic properties of (FexNiyCoz)80B10Si2Cu1Zr7alloys. J. Alloy. Comp. 2021, 855, 157436. [Google Scholar] [CrossRef]
- Yu, W.; Lu, L.; Hua, Z. Effects of Co content on microstructure and magnetic property of Fe81-xCoxZr7B9M1(M= Ge/Cu) alloys. Phys. Lett. A 2020, 384, 126116. [Google Scholar] [CrossRef]
- Blázquez, J.S.; Franco, V.; Conde, C.F.; Conde, A. Microstructure and magnetic properties of Fe72-xCoxNb6B15Cu1 (x = 18, 39, 60) alloys. J. Magn. Magn. Mater. 2002, 254-255, 460–462. [Google Scholar] [CrossRef]
- Franco, V. Soft magnetic nanocrystalline alloys: Materials and models. Mater. Matters 2015, 11, 104–110. [Google Scholar]
- Gupta, P.; Ganguli, T.; Gupta, A.; Sinha, A.K.; Deb, S.K.; Svec, P.; Franco, V. Influence of isochronal annealing on the microstructure and magnetic properties of Cu free Hitperm Fe40.5Co40.5Nb7B12. J. Appl. Phys. 2012, 111, 113518. [Google Scholar] [CrossRef]
- Gu, Y.; Zhang, Y.H.; Li, X.; Wang, J.; Wang, B.; Wang, K.M. Effect of Co content on structural stability and soft magnetic properties for (Fe1-xCox)86Hf7B6Cu1. Phys. Met. Metall. 2020, 121, 123–127. [Google Scholar] [CrossRef]
- Xue, L.; Yang, W.M.; Liu, H.S.; Men, H.; Wag, A.D.; Chang, C.T.; Shen, B.L. Effect of Co addition on the magnetic properties and microstructure of FeNbBCu nanocrystalline alloys. J. Magn. Magn. Mater. 2016, 419, 198–201. [Google Scholar] [CrossRef]
- Yang, Y.; Wang, Y.; Li, Y.; Bi, X. Microstructure and magnetic anisotropy of FeCoNbB films. Chin. J. Aeronaut. 2011, 2424, 823–828. [Google Scholar] [CrossRef] [Green Version]
- Souilah, S.; Alleg, S.; Bensalem, R.; Suñol, J.J. Magnetic and microstructural properties of the mechanically alloyed Fe57Co21Nb7B15 powder mixture. Mater. Chem. Phys. 2012, 132, 766–772. [Google Scholar] [CrossRef]
- Iijima, Y.; Lee, C.G. Self-diffusion in bcc and ordered phases of equiatomic iron.cobalt alloy. Acta. Metall. Mater. 1995, 43, 1183–1188. [Google Scholar] [CrossRef]
- Ibn Gharsallah, H.; Azabou, M.; Escoda, L.; Suñol, J.J.; López, I.; Llorca-Isern, N. The magnetic and structural properties of (Fe75Al25)100-xBxalloys prepared by mechanical alloying. J. Alloy. Comp. 2017, 729, 776–786. [Google Scholar] [CrossRef] [Green Version]
- Minor, A.M.; Dehm, G. Advances in in situ nanomechanical testing. MRS Bull. 2019, 44, 438–442. [Google Scholar] [CrossRef] [Green Version]
- Alleg, S.; Ibrir, M.; Fenineche, M.E.; Azzaza, S.; Bensalem, R.; Suñol, J.J. Magnetic and structural characterization of the mechanically alloyed Fe75Si15B10. J. Alloy. Comp. 2010, 494, 109–115. [Google Scholar] [CrossRef]
- Zhang, Y.; Yan, B.; Yang, Y.; Wang, Y. Non-isothermal nanocrystallization kinetics study on (Fe 0.8 Ni 0.15 M 0.05) 78 Si 8 B 14 (M= Nb, Ta, W) amorphous alloys. J. Alloy. Comp. 2013, 54, 556–559. [Google Scholar] [CrossRef]
- Bonastre, J. Production and Characterization of Soft Magnetic Nanocrystalline and Amorphous Alloys. Ph.D. Thesis, University of Girona, Girona, Spain, 2019. [Google Scholar]
- Wang, R.W.; Liu, J.; Xu, Y.P.; Gan, Z.H.; Xiang, Z.D.; Lu, Z.H.; Chen, J.S.; Li, Y.B.; Wang, D.J.; Yuan, J.; et al. Nanocrystallization kinetics of amorphous Fe73.5Cu1Nb3-xMoxSi13.5B9 (x= 1, 2, 3) alloys. Phys. B 2010, 405, 3555–3559. [Google Scholar] [CrossRef]
- Johnson, F.; Hughes, P.; Gallaguer, R.; Laughlin, D.E.; McHenry, M.E.; Willard, M.A.; Harris, V.G. Structure and thermomagnetic properties of new Fe-Co based nanocrystalline ferromagnets. IEEE Trans. Magn. 2002, 37, 2261–2263. [Google Scholar] [CrossRef]
- Hasiak, M.; Sobczyk, K.; Zbroszczyk, J.; Ciurzynska, W.; Olszewski, J.; Nabialek, M.; Kaleta, J.; Swierczek, J.; Lukicwska, A. Some magnetic properties of bulk amorphous Fe-Co-Zr-Hf-Ti-W-B-(Y) alloys. IEEE Trans. Magn. 2008, 44, 3879–3882. [Google Scholar] [CrossRef]
- Shyni, P.C.; Perumal, A. Structural and magnetic properties of nanocrystalline Fe-Co-Si alloy powders produced by mechanical alloying. J. Alloy. Comp. 2010, 648, 658–666. [Google Scholar] [CrossRef]
- Mishra, D.; Perumal, A.; Saravanan, P.; Arvindha Babu, D.; Srinivasan, A. Effect of Co or Mn addition on the soft magnetic properties of amorphous Fe89-xZr11Bx (x= 5, 10) alloy ribbons. J. Magn. Magn. Mater. 2009, 321, 4097–4102. [Google Scholar] [CrossRef]
- Mizoguchi, T. Magnetism in amorphous alloys. AIP Conf. Proc. 1976, 34, 286. [Google Scholar]
- Avar, B.; Ozcan, S. Characterization and amorphous phase formation of mechanically alloyed Co66Fe5Ni5Ti25B5 powders. J. Alloy. Comp. 2015, 650, 53–58. [Google Scholar] [CrossRef]
- Zhou, G.F.; Bakker, H. Influence of mechanical milling on magnetic properties of intermetallic compounds (overview). Mater. Trans. JIM 1995, 36, 329–340. [Google Scholar] [CrossRef] [Green Version]
- Martínez-Blanco, D.; Gorria, P.; Fernández-Martínez, M.; Pérez, M.J.; Cuello, G.J.; Blanco, J.A. Spin-glass behavior in ball milled Fe70Cr30 alloy studied by AC magnetic susceptibility. J. Alloy. Comp. 2011, 509S, 397–399. [Google Scholar] [CrossRef]
- Suñol, J.J.; González, A.; Saurina, J.; Escoda, L.; Fernández-Barquín. Thermal and magnetic behavior of a nanocrystalline Fe(Ni;Co) based alloy. J. Non-Cryst. Solids 2007, 353, 865–868. [Google Scholar] [CrossRef]
- Chen, Y.T.; Hsich, W.H. Thgermal, magnetic electric and adhesive properties of amorphous Co60Fe20B20 thin films. J. Alloy. Comp. 2007, 552, 283–288. [Google Scholar] [CrossRef]
- Zaara, K.; Chemingui, M.; Le Gallet, S.; Gaillard, Y.; Escoda, L.; Saurina, J.; Suñol, J.J.; Bernard, F.; Khitouni, M.; Optasanu, V. High-Entropy FeCoNiB0.5Si0.5 alloy synthesized by mechanical alloying and spark plasma sintering. Crystals 2020, 10, 929. [Google Scholar] [CrossRef]
- Duhaj, P.; Matko, I.; Svec, P.; Sitek, J.; Janickov, D. Structural investigation of Fe(Cu)ZrB amorphous alloy. Mater. Sci. Eng. B 1996, 39, 208–215. [Google Scholar] [CrossRef]
- Pilar, M.; Escoda, L.; Suñol, J.J.; Greneche, J.M. Magnetic study and thermal analysis of a metastable Fe-Zr based alloy: Influence of process control agents. J. Magn. Magn. Mater. 2008, 320, 823–827. [Google Scholar] [CrossRef]
- Alleg, S.; Souilah, S.; Younes, A.; Bensalem, R.; Suñol, J.J.; Greneche, J.M. Effect of the Nb content on the amorphization process of the mechanically alloyed Fe-Co-Nb-B powders. J. Alloy. Comp. 2012, 5365, 394–397. [Google Scholar] [CrossRef]


| Alloy | 0 h | 10 h | 20 h | 40 h | 80 h |
|---|---|---|---|---|---|
| Co10 | 2.8666 ± 0.0004 | 2.8736 ± 0.0003 | 2.8797 ± 0.0004 | 2.8825 ± 0.0003 | 2.8836 ± 0.0003 |
| Co20 | 2.8665 ± 0.0005 | 2.8717 ± 0.0003 | 2.8758 ± 0.0004 | 2.8794 ± 0.0004 | 2.8791 ± 0.0003 |
| Alloy | 0 h | 10 h | 20 h | 40h | 80 h |
|---|---|---|---|---|---|
| Co10 | 212 ± 6 | 12.9 ± 0.2 | 11.9 ± 0.3 | 9.8 ± 0.2 | 9.5 ± 0.3 |
| Co20 | 206 ± 6 | 11.3 ± 0.2 | 9.5 ± 0.2 | 8.0 ± 0.3 | 9.8 ± 0.4 |
| Alloy | 0 h | 10 h | 20 h | 40 h | 80 h |
|---|---|---|---|---|---|
| Co10 | 0.013 ± 0.003 | 0.35 ± 0.02 | 0.58 ± 0.08 | 0.62 ± 0.08 | 0.70 ± 0.05 |
| Co20 | 0.010 ± 0.003 | 0.11 ± 0.02 | 0.32 ± 0.06 | 0.43 ± 0.05 | 0.59 ± 0.03 |
| Alloy | 0 h | 10 h | 20 h | 40 h | 80 h |
|---|---|---|---|---|---|
| Co10 | 0.016 ± 0.005 | 4.32 ± 0.05 | 7.8 ± 0.5 | 10.0 ± 0.6 | 12 ± 2 |
| Co20 | 0.008 ± 0.009 | 1.0 ± 0.1 | 5.8 ± 0.6 | 8.7 ± 0.5 | 10 ± 2 |
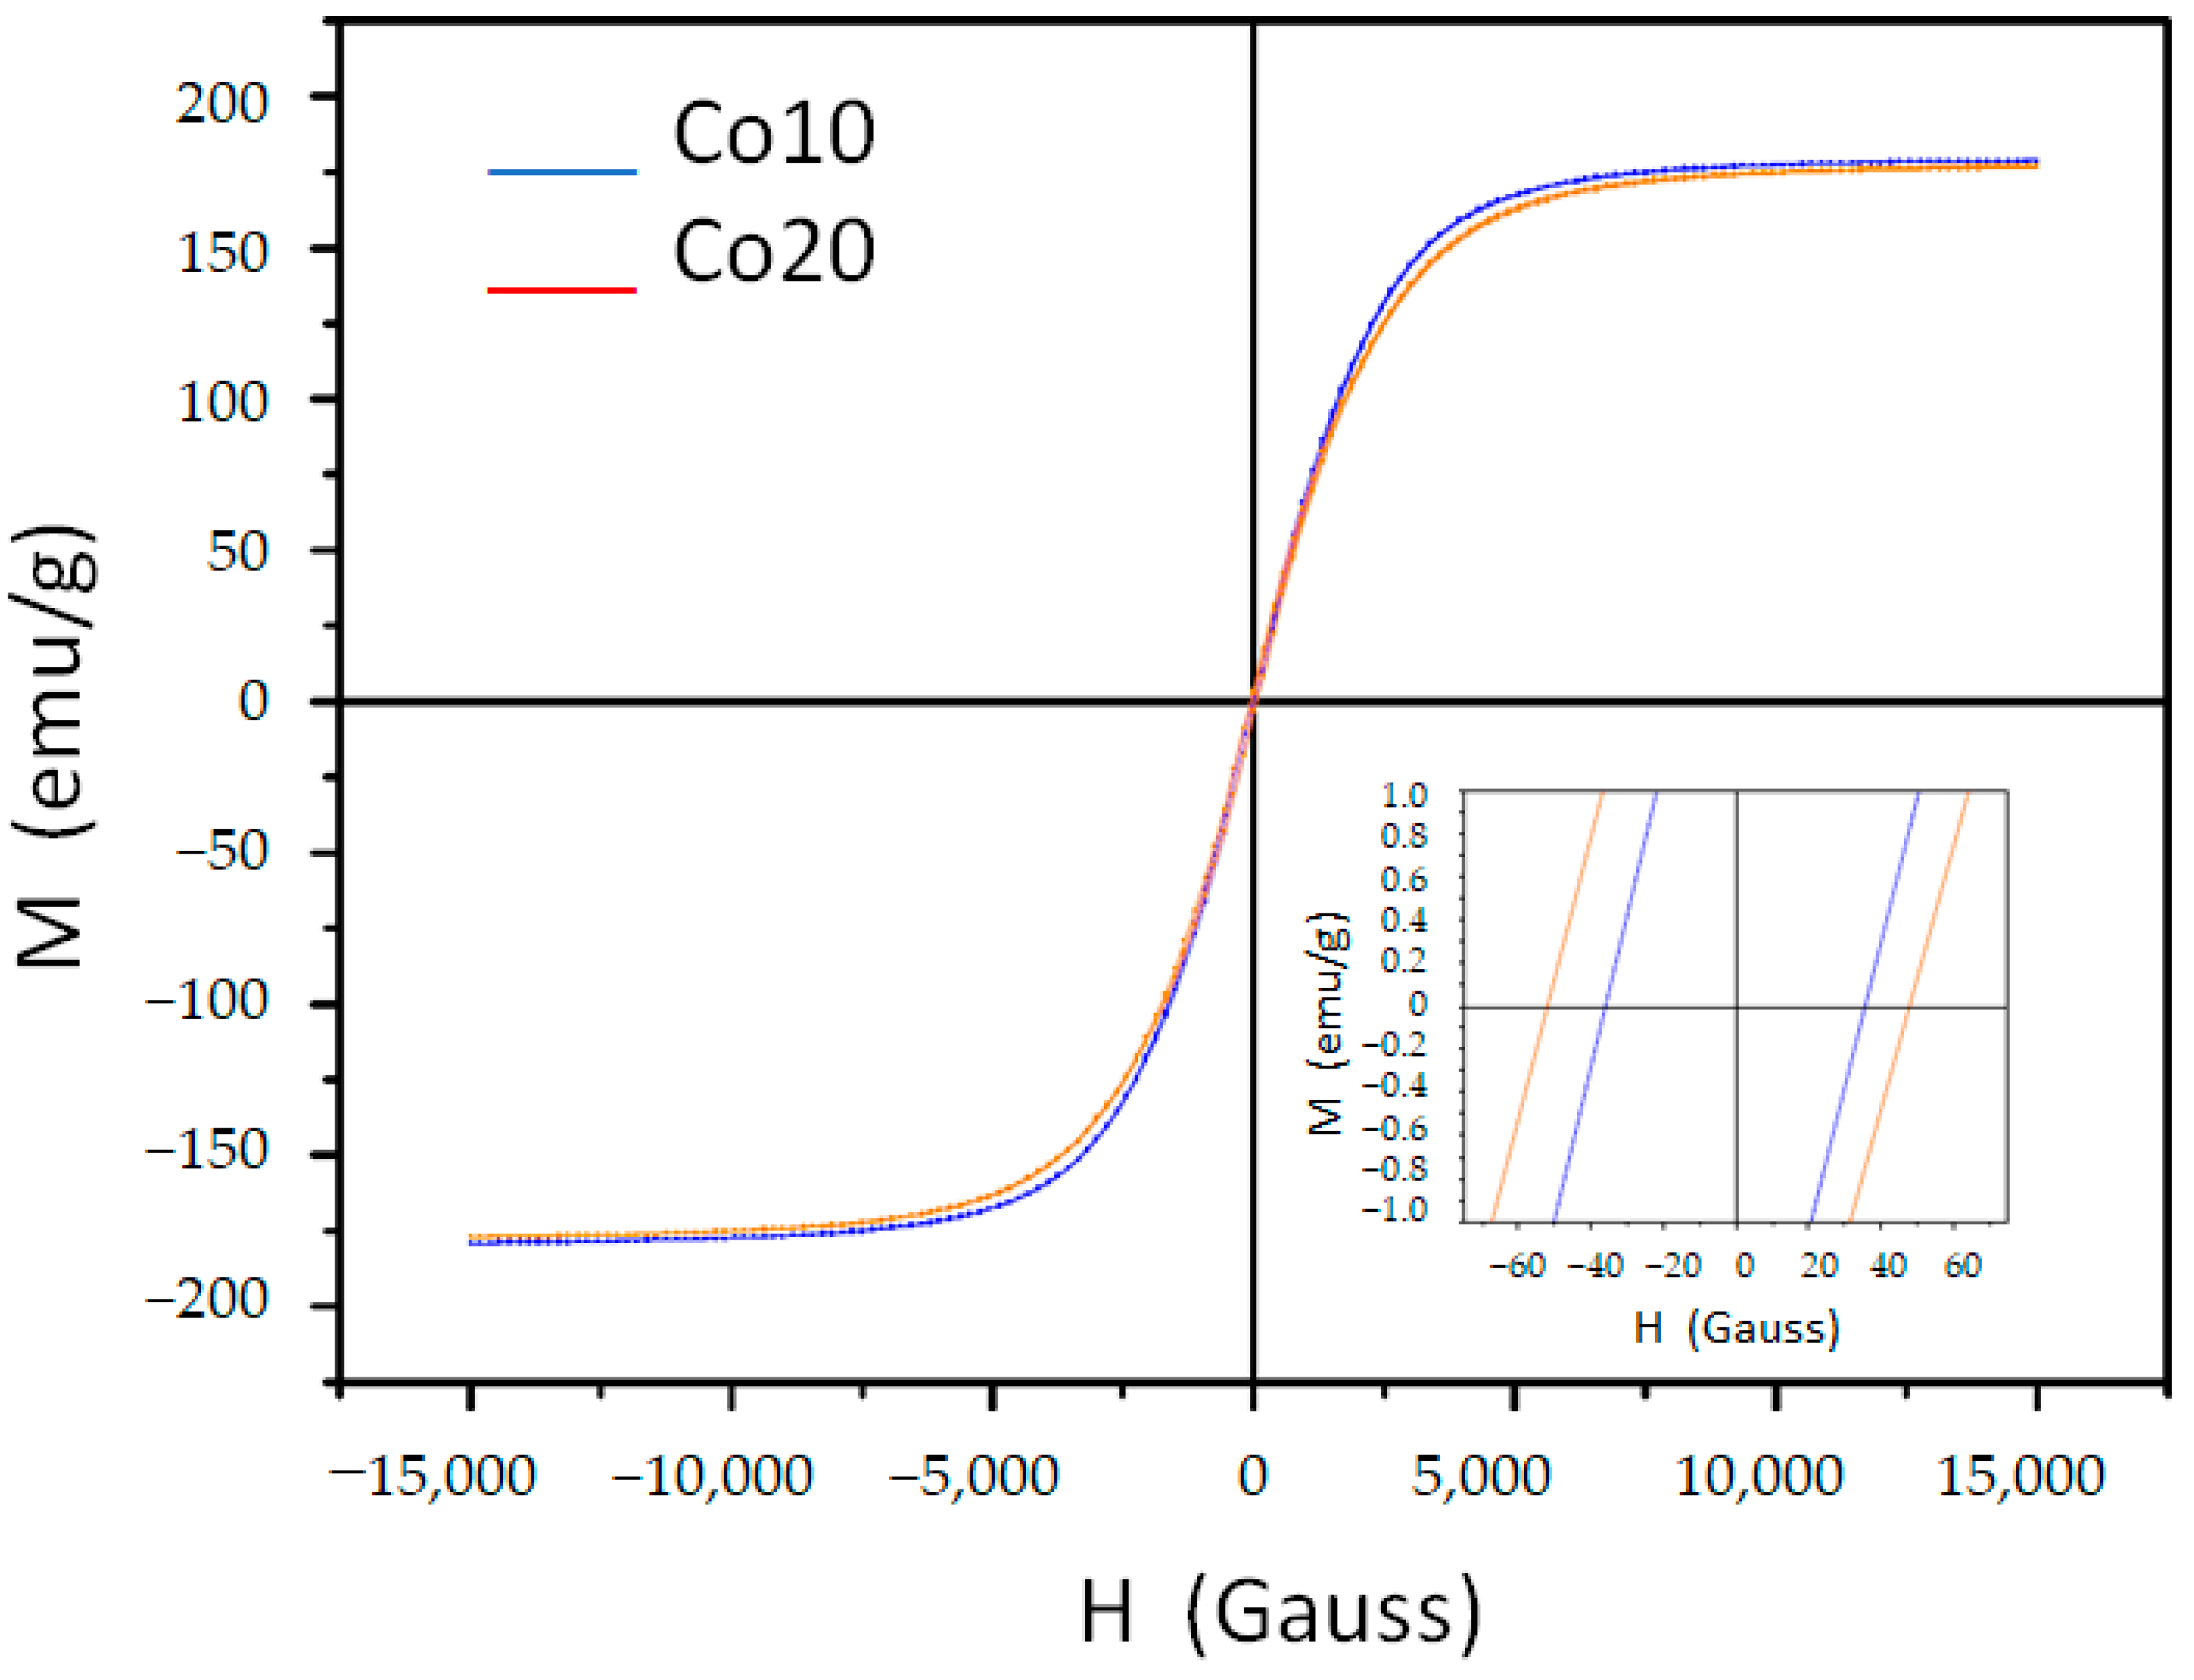
| Sample | Ms/emu g−1 | Hc/Oe | Mr/emu g−1 | Mr/Ms/Adim. |
|---|---|---|---|---|
| Co10 | 178.9 | 36 | 2.52 | 0.014 |
| Co20 | 177.0 | 50 | 3.38 | 0.019 |
| Sample | Hc (RT)/A m−1 | Hc (350 °C)/A m−1 | Hc (600 °C)/A m−1 |
|---|---|---|---|
| Fe85Nb6B9 | 2747 ± 29 | 1868 ± 41 | 6145 ± 15 |
| Co10(Fe75Co10Nb6B9) | 2054 ± 85 | 1786 ± 45 | 5695 ± 15 |
| Co20(Fe65Co20Nb6B9) | 3211 ± 37 | 2326 ± 44 | 4734 ± 72 |
| Fe75Ni10Nb6B9 | 2015 ± 28 | 1883 ± 15 | 3826 ± 35 |
| Fe65Ni120Nb6B9 | 1859 ± 27 | 1559 ± 31 | 2582 ± 66 |
Publisher’s Note: MDPI stays neutral with regard to jurisdictional claims in published maps and institutional affiliations. |
© 2021 by the authors. Licensee MDPI, Basel, Switzerland. This article is an open access article distributed under the terms and conditions of the Creative Commons Attribution (CC BY) license (https://creativecommons.org/licenses/by/4.0/).
Share and Cite
Carrillo, A.; Daza, J.; Saurina, J.; Escoda, L.; Suñol, J.-J. Structural, Thermal and Magnetic Analysis of Fe75Co10Nb6B9 and Fe65Co20Nb6B9 Nanostructured Alloys. Materials 2021, 14, 4542. https://doi.org/10.3390/ma14164542
Carrillo A, Daza J, Saurina J, Escoda L, Suñol J-J. Structural, Thermal and Magnetic Analysis of Fe75Co10Nb6B9 and Fe65Co20Nb6B9 Nanostructured Alloys. Materials. 2021; 14(16):4542. https://doi.org/10.3390/ma14164542
Chicago/Turabian StyleCarrillo, Albert, Jason Daza, Joan Saurina, Lluisa Escoda, and Joan-Josep Suñol. 2021. "Structural, Thermal and Magnetic Analysis of Fe75Co10Nb6B9 and Fe65Co20Nb6B9 Nanostructured Alloys" Materials 14, no. 16: 4542. https://doi.org/10.3390/ma14164542
APA StyleCarrillo, A., Daza, J., Saurina, J., Escoda, L., & Suñol, J.-J. (2021). Structural, Thermal and Magnetic Analysis of Fe75Co10Nb6B9 and Fe65Co20Nb6B9 Nanostructured Alloys. Materials, 14(16), 4542. https://doi.org/10.3390/ma14164542