1. Introduction
With the increasing demands on material recycling, especially in the field of lightweight materials, such as aluminum alloys, a profound knowledge of the effects of increased impurity levels (e.g., Fe) on the property profile of the manufactured products is of essential importance. The properties of the various aluminum alloys should be maintained even with increased content of impurity elements and meet the application requirements [
1,
2] In the category of AlMg(Mn) (5xxx) alloys, which unify medium strength and good formability, as well as good corrosion resistance, the final properties are largely determined by the solute content of Mg, the cold rolling degree (CRD) and the microstructure [
3,
4] Additionally, with superior deep-drawing properties, the AlMg(Mn) alloys are widely used in the automotive industry [
5,
6].
With regard to the influence of secondary alloying elements Fe, Mn and Si, the aluminum alloys show distinct formation of various intermetallic phases [
7,
8,
9] which affect the processing and microstructure of the material [
10,
11]. For increased iron contents, typical formation of the needle-like Al
3Fe (or Al
13Fe
4) phase is observed [
12]. Various studies already accentuated the adverse effects of Fe on the materials properties, which can be partially counteracted by spheroidizing the phases by adding ‘Fe-corrector’ elements, such as Mn [
12]. Furthermore, the main secondary alloying element Mn tends to coarsen and spheroidize the constituent Al-Fe(-Si) phases and initiates the formation of secondary phases (dispersoids) of type Al
6Mn during homogenization [
12,
13]. These dispersoids play a crucial role in grain size control during subsequent rolling and recrystallization processes [
14]. The Si content in the AlMg(Mn) alloys influences both the primary and secondary phase precipitation. During casting, Si can form stable Mg
2Si precipitates, as well as different types of Al(Fe,Mn)Si phases. Phase transformations and the precipitation of secondary α-Al
15(Fe,Mn)
3Si
2 dispersoids are likely to occur in the following homogenization treatment. Finally, the precipitation kinetics, grain size and, thus, the properties of Mn, Fe and Si containing 5xxx aluminum alloys are also strongly affected by the cooling rate in the casting process. In general, higher cooling rates during casting significantly refine the grain size, as well as constituent phases, and can further change the levels of solute Fe, Mn and Si [
15,
16,
17,
18,
19]. A comprehensive overview on the details of primary and secondary phases formed in AlMg(Mn) alloys with varying Fe and Mn additions under different processing parameters, such as solidification conditions, homogenization temperature and degree of cold rolling, is given in Part I of this work [
15].
With regard to the effects of primary and secondary phases on the recrystallization processes and, thus, on the evolution of microstructure, texture and the final properties, two fundamentally different mechanisms must be taken into account: particle stimulated nucleation (PSN) and grain boundary pinning [
14,
20,
21]. In general, the PSN mechanism occurs in the vicinity of rather large (primary) particles (>1 µm), where the accumulation of dislocations and the formation of recrystallization nuclei are favored. The resulting grain size is then related to the interparticle distances. Moreover, the PSN effect is commonly associated with changes in the typical recrystallization textures of Aluminum alloys [
14,
20,
22,
23,
24,
25].
Meanwhile, the influence of small, nanometer sized (secondary phase) particles is described by the Smith–Zener pinning effect [
26]. In the case of normal grain growth after primary recrystallization, the grain boundary movement is impeded by pinning forces of small dispersoid particles (“Zener drag”), which depend on the particle sizes, morphologies and volume fractions. Over several decades, numerous research groups improved the original Smith–Zener approach by taking various parameters, such as shape, orientation, or the constitution of the particle-matrix interface, into account [
27,
28,
29,
30,
31,
32,
33]. Concerning the impact of dispersoid shape on the pinning efficiency, the authors of [
27] derived formulas for the extreme cases of differently oriented spheroidal dispersoids and their restrictive forces on the moving grain boundary. However, the applicability of the formulas to experimentally derived data is still of high complexity.
With the progress in computational modelling in the last forty years, various simulations were performed on the interaction of particles and grain boundaries [
34,
35,
36,
37,
38,
39,
40,
41,
42,
43,
44,
45,
46]. The simulation algorithms resulted in a broad spectrum of possible parameters for the formulation of the Smith–Zener pinning. A comparison of experimental data to the various theoretical formulations for the Zener pinning pressure can be performed by the equation for the Zener limiting grain size R
lim (1) [
28],
which represents the resulting grain size after recrystallization and grain growth till reaching equilibrium conditions (r, particle size; f, particle volume fraction). Over the years, not only the dimensionless constant K (considering geometric relations of boundary curvature and grain size) was altered in the various approaches, but also the exponent m, accounting for the pinning efficiency of the dispersoids. In general, it was found that for higher volume fractions the exponent m will be <1. However, the exact definition of “higher” volume fractions differs in the various studies and ranges from 1 vol.% up to 3 vol.% of the secondary phase particles [
28,
47].
In addition to the effects of primary and secondary phases on the grain size, the properties of the final Aluminum sheets are also significantly influenced by the texture of the material [
14,
48,
49,
50,
51,
52]. In typical aluminum rolling processes, the fcc crystal structure and the high stacking fault energy favor the formation of characteristic rolling textures in the deformed state. The orientations Brass {011}<211>, Copper {112}<111> and S {123}<634>, typically referred to as β-fiber [
6,
53,
54,
55,
56,
57], arise from the preferred dislocation slip systems in the material and represent rotations of the crystallites during cold deformation ending in this stable alignment [
14].
During subsequent heat treatments, recrystallization, in terms of classical nucleation and growth mechanisms, rearranges the microstructure and the texture of the material. Whereas in earlier years the discussions focused on the differences between two common mechanisms of recrystallization texture formation—oriented nucleation and oriented growth—an implication of both effects is now the preferred approach [
52,
58]. The main recrystallization texture component in the majority of Aluminum alloys is the Cube orientation {001}<100>, which evolves from remaining Cube nuclei in the deformed state and was the subject of decades of research [
49,
59,
60,
61,
62,
63,
64]. Furthermore, frequently found accompanying recrystallization orientations, such as Goss {011}<100> or Q {013}<231>, preferentially nucleate at shear bands, which were also found to occur particularly in AlMg(Mn) alloys [
65].
The typical Aluminum recrystallization texture can be altered by the presence of primary and secondary phases, due to the effects of PSN and Zener pinning. In the case of particle stimulated nucleation, the two specific texture components P {011}<122> and Cube
ND {001}<310> are generally stated to preferentially evolve, together with a rather weak classical recrystallization texture [
24,
66,
67]. Moreover, the Zener drag exerted by small dispersoid particles impedes the grain boundary movement and therefore changes the recrystallization texture by modifications of the oriented growth mechanisms. The resulting texture is in many cases still dominated by the Cube component, which is least affected by the drag forces due to low energy boundaries and the size advantages of emerging Cube nuclei [
25,
68]. In case of concurrent appearance of both effects, the Zener pinning dominates the recrystallization texture and effectively suppresses the growth of PSN nuclei [
23,
66,
69].
In terms of the mechanical properties and forming behavior, the texture modifications due to particle related (recrystallization) effects can yield considerable improvements in the final sheet quality. For the AlMg(Mn) alloys, the combination of PSN and Cube texture components can optimize the resulting earing behavior and thus enhance the formability of the 5xxx Al sheets [
52]. The number density and distribution of primary and secondary phases can further weaken the Portevin–Le Chatelier (PLC) effect in those alloys [
70,
71]. Moreover, the PSN components can effectively suppress Cube banding in 6xxx alloys, therefore reducing the probability of the undesired roping phenomenon [
6,
66,
72].
The present study focuses on the microstructure and texture evolution in 5xxx Al alloys with different Fe and Mn levels. A detailed description and discussion of the primary and secondary phase formation in alloys based on Al4.5Mg0.1Si with varying Fe (0.1 and 0.4 wt.%) and Mn (0.2 and 1.0 wt.%) contents is given in Part I of the study [
15]. In this Part II, the effects of the mechanisms PSN and Zener pinning are discussed and the experimental data compared to established theories.
2. Materials and Methods
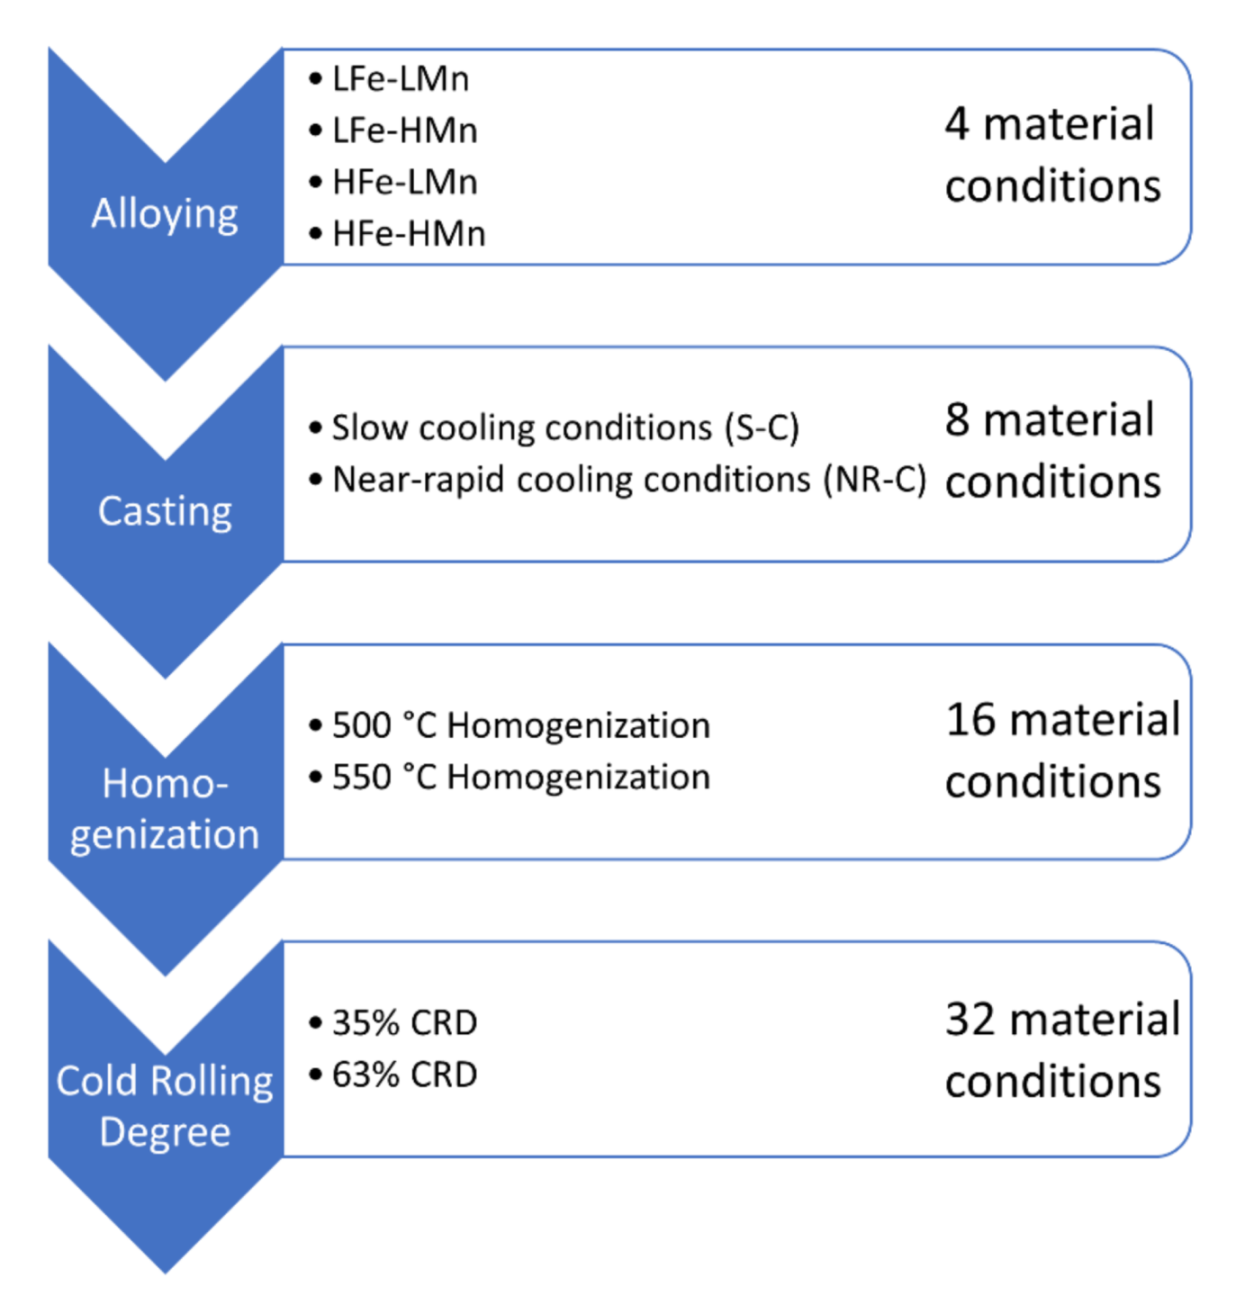
The studied alloys were based on Al4.5Mg0.1Si with varying Fe (0.1 or 0.4 wt.%) and Mn (0.2 or 1.0 wt.%) contents. Starting from four different alloys (low Fe, low Mn; low Fe, high Mn; high Fe, low Mn; high Fe, high Mn), the variations in casting cooling rate (NR-C: near-rapid cooling, ~50 K/s; S-C: slow-cooling, ~1–2 K/s), homogenization treatment (500 °C and 550 °C) and cold rolling degree (35% and 63%), before final soft annealing (salt bath at 500 °C for 5 min and water quenching), resulted in 32 different sample states (
Figure 1). Basically, while the high Fe contents resulted in higher volume fractions of primary phase particles, the high Mn favored the formation of dispersoids and resulted in high volume fractions, especially in the HFe-HMn alloy. Details of the casting and further processing steps of the alloys. as well as the analyses of the primary and secondary phases in terms of their composition, volume fraction and morphology, are presented in Part I of the study [
15].
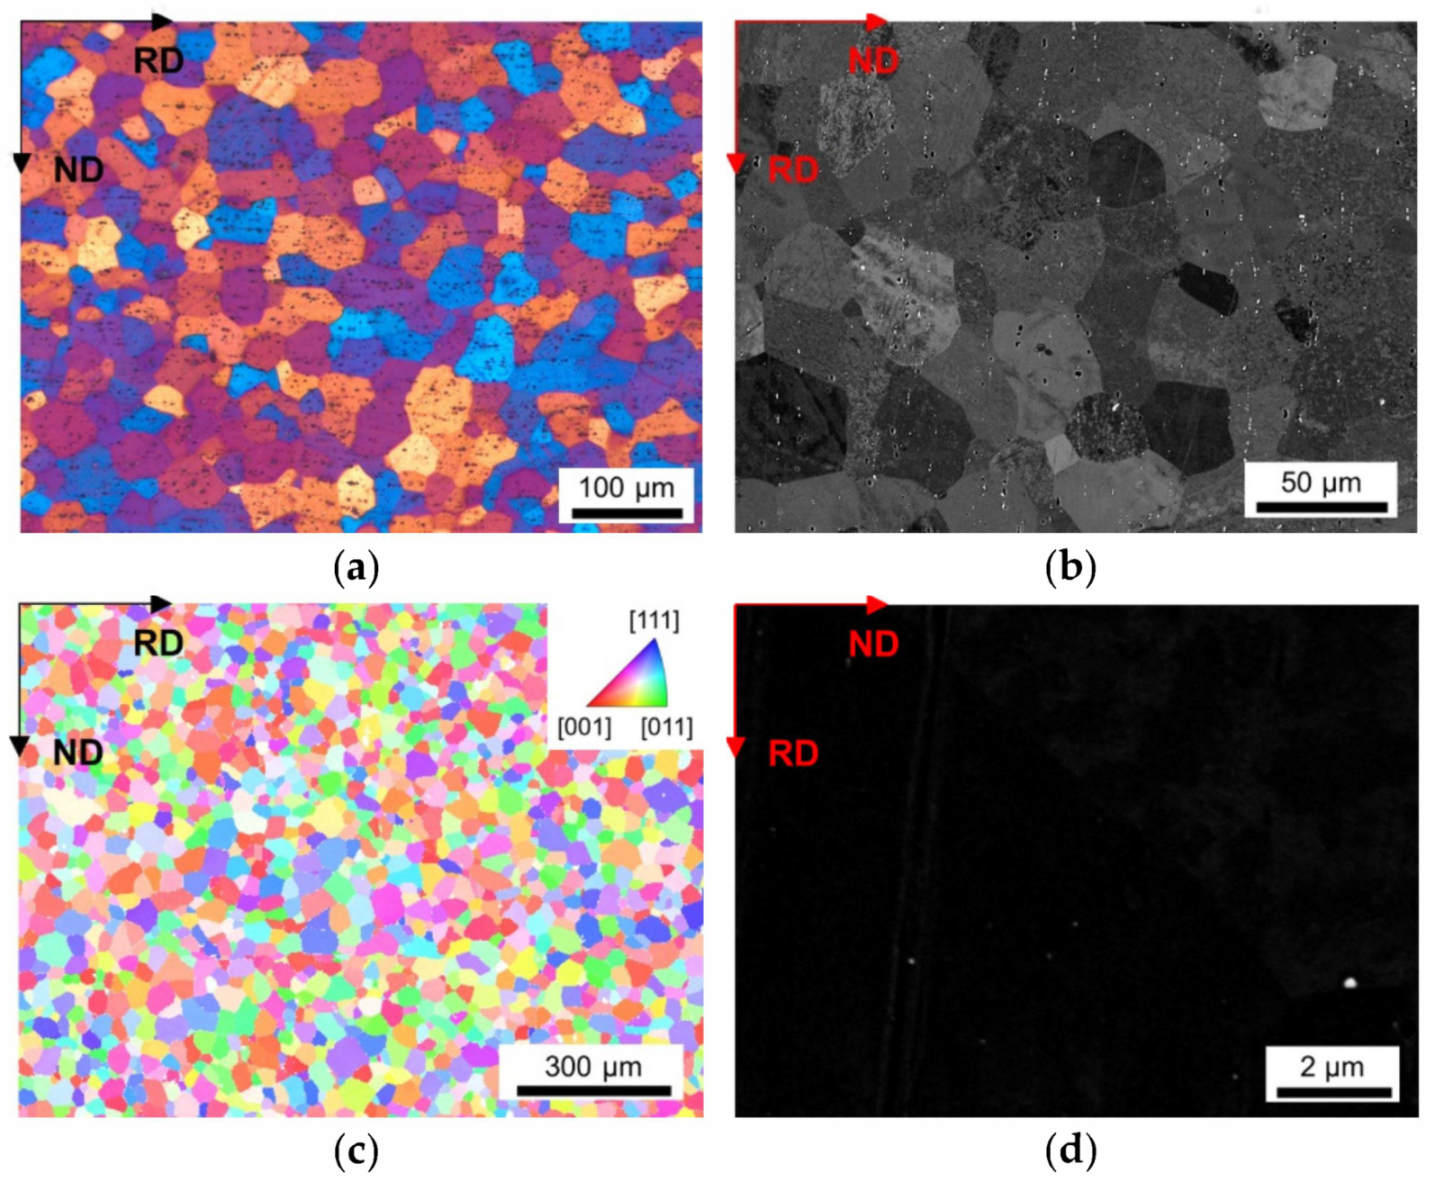
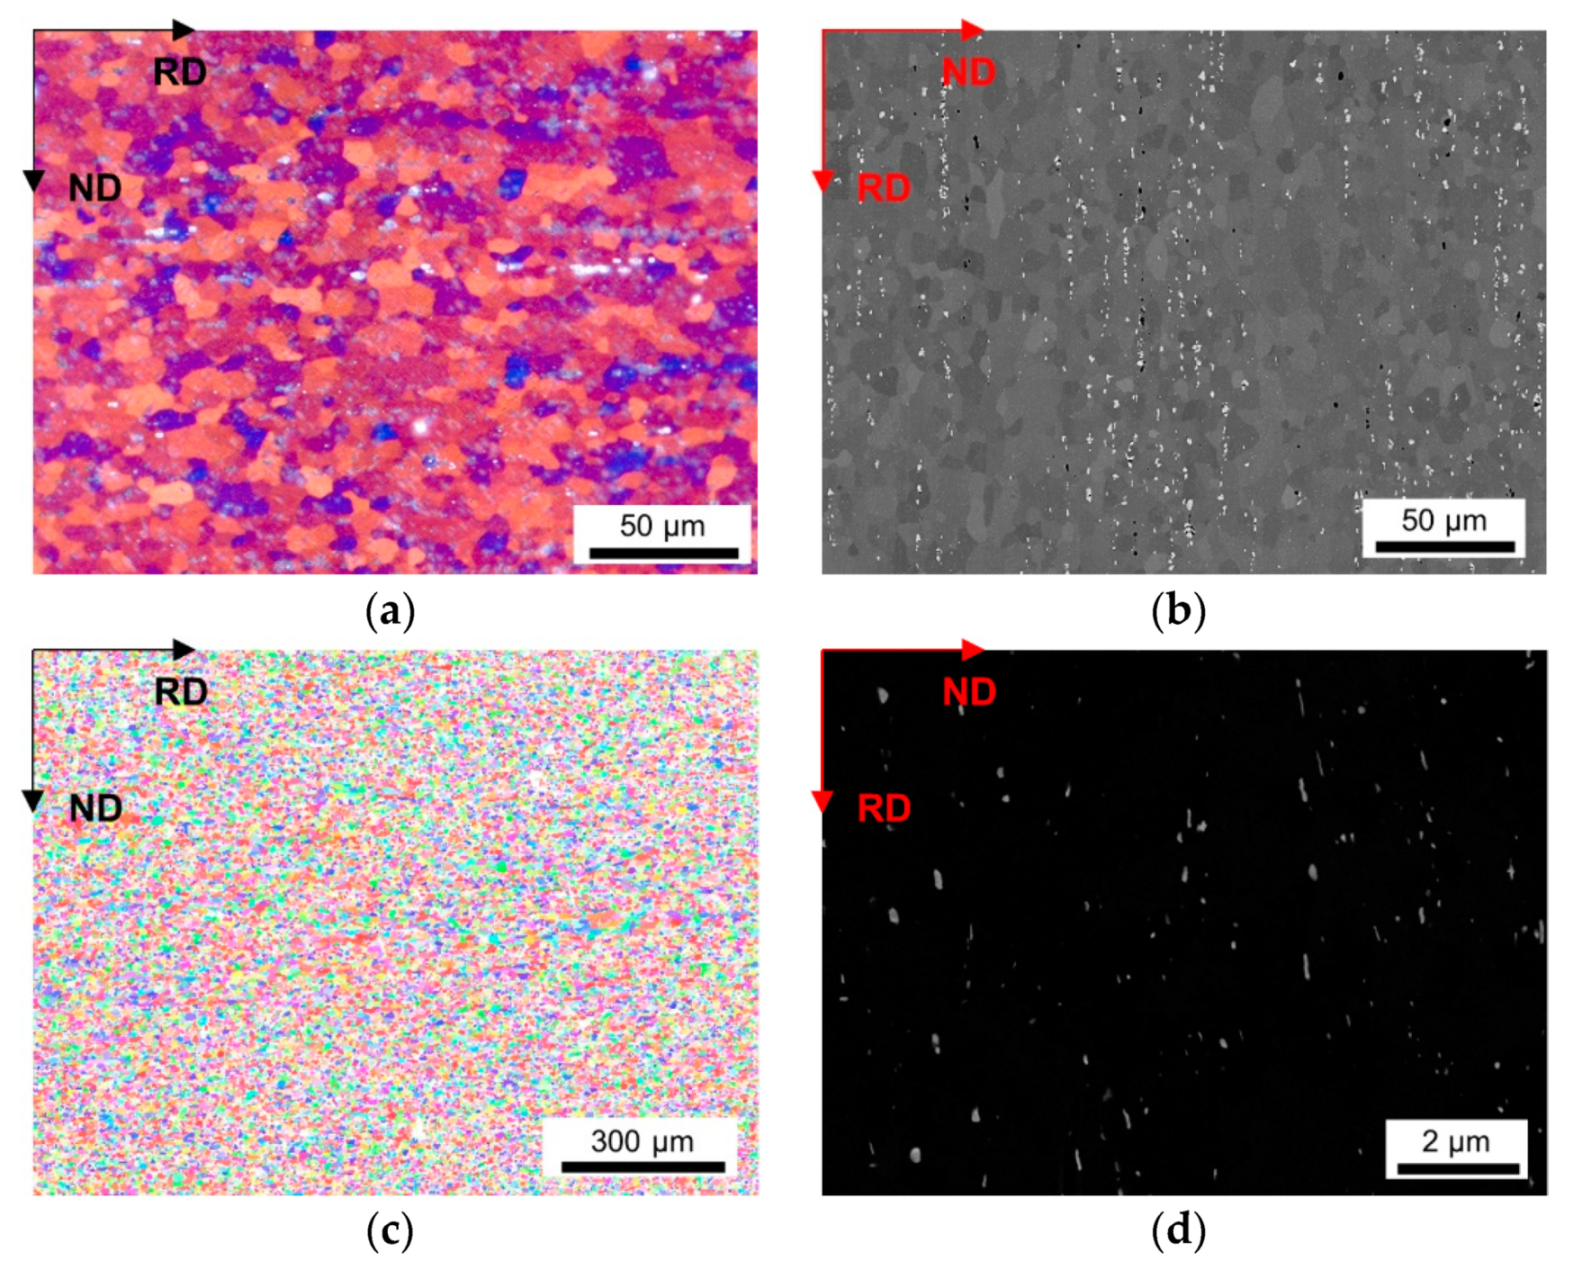
Investigations regarding the microstructure formation, such as grain size and Zener pinning, as well as texture analysis of the final soft annealed state, were performed on cross-sectional samples (looking in the transverse direction (TD) of the cold rolled sheet). Three different experimental methods were used for grain size analysis:
High contrast backscattered electron (BSE) images from scanning electron microscopy;
Light optical microscopy (LOM);
Electron backscattered diffraction (EBSD).
The sample preparation for all characterization methods started with standard metallographic sample preparation, including cutting, embedding, grinding and polishing, plus oxide suspension (OPS, Struers) polishing on a Struers Tegramin 30 grinding and polishing machine. The BSE micrographs were recorded from these samples using a scanning electron microscope (SEM) (JEOL 7200F FEG-SEM, Tokyo, Japan) at an accelerating voltage of 10 kV or 5 kV at higher magnifications for dispersoid analysis. The EBSD measurements were performed on the SEM equipped with the EBSD-measurement system (Nordlys Nano detector, Oxford Instruments, Abingdon, UK) using 20 kV accelerating voltage and a 70° pre-tilt sample holder. Parameters and details on the necessary electropolishing surface treatment for the EBSD analysis can be found in [
73]. For light optical microscopy, additional Barker etching of the OPS-polished samples with Barker etchant according to [
74] using the Struers Lectro-Pol 5 unit at a temperature of 10 °C and a voltage of 25 V for 50 s accomplished the surface preparation. The LOM micrographs were recorded by utilizing polarized light in a reflected-light microscope Axio Imager M1m (Zeiss, Oberkochen, Germany).
The grain size analysis of the micrographs was carried out performing the line intercept method on LOM and BSE images of various sizes using the free software tool ImageJ. Each measurement contained a minimum of twelve lines (three in rolling direction (RD), three in normal direction (ND); two images per sample), with each line including at least 12 intercept points. Grain size analysis of the EBSD data of was performed by means of the Matlab based toolbox MTEX 5.2.beta3, which is described in detail in [
73] and also used the line intercept method on two cross-sectional scans of size 1600 × 1200 µm
2 per sample (EBSD). The EBSD micrographs are presented in the form of inverse pole figure mappings (IPF) in the RD–ND plane.
The mean grain radius R was calculated from the mean intercept length, taking into account the proportionality constant of 0.75, as described in [
75,
76]. Grain-defining parameters, such as a minimum grain misorientation angle of 15° and a minimum grain size of 5 µm
2, as well as grains situated on the sheet or scan edge and coarse primary particles, were considered as exclusion factors.
The calculation of the Zener limiting grain size follows Equation (1), with the parameters K and m relating to the different models. The Manohar model used the parameters K = 0.17 and m = 1 [
33], whereas the Smith–Zener model used K = 4/3 and m = 1 [
26]. The implementation of the ellipsoidal particle morphology followed the derivations of Ryum [
32] and yields the Equations (2) and (3) to calculate the limiting grain radii in RD and ND:
with AR being the aspect ratio of the dispersoids. The calculation again used the exponent m = 1. More information on the mathematical considerations is given in [
14,
27].
The quantification of texture (using MTEX) focused on the relative intensity of ideal orientations (within 10° maximum deviation) extracted from the EBSD area fractions and normalized by the area fraction of a random orientation distribution, multiplied by the number of the respective symmetric equivalents. The quantification was based on the same cross-sectional scans as the grain size analysis including at least 4000 grains. The ideal orientations of the analyzed components are listed in
Table 1.
4. Discussion
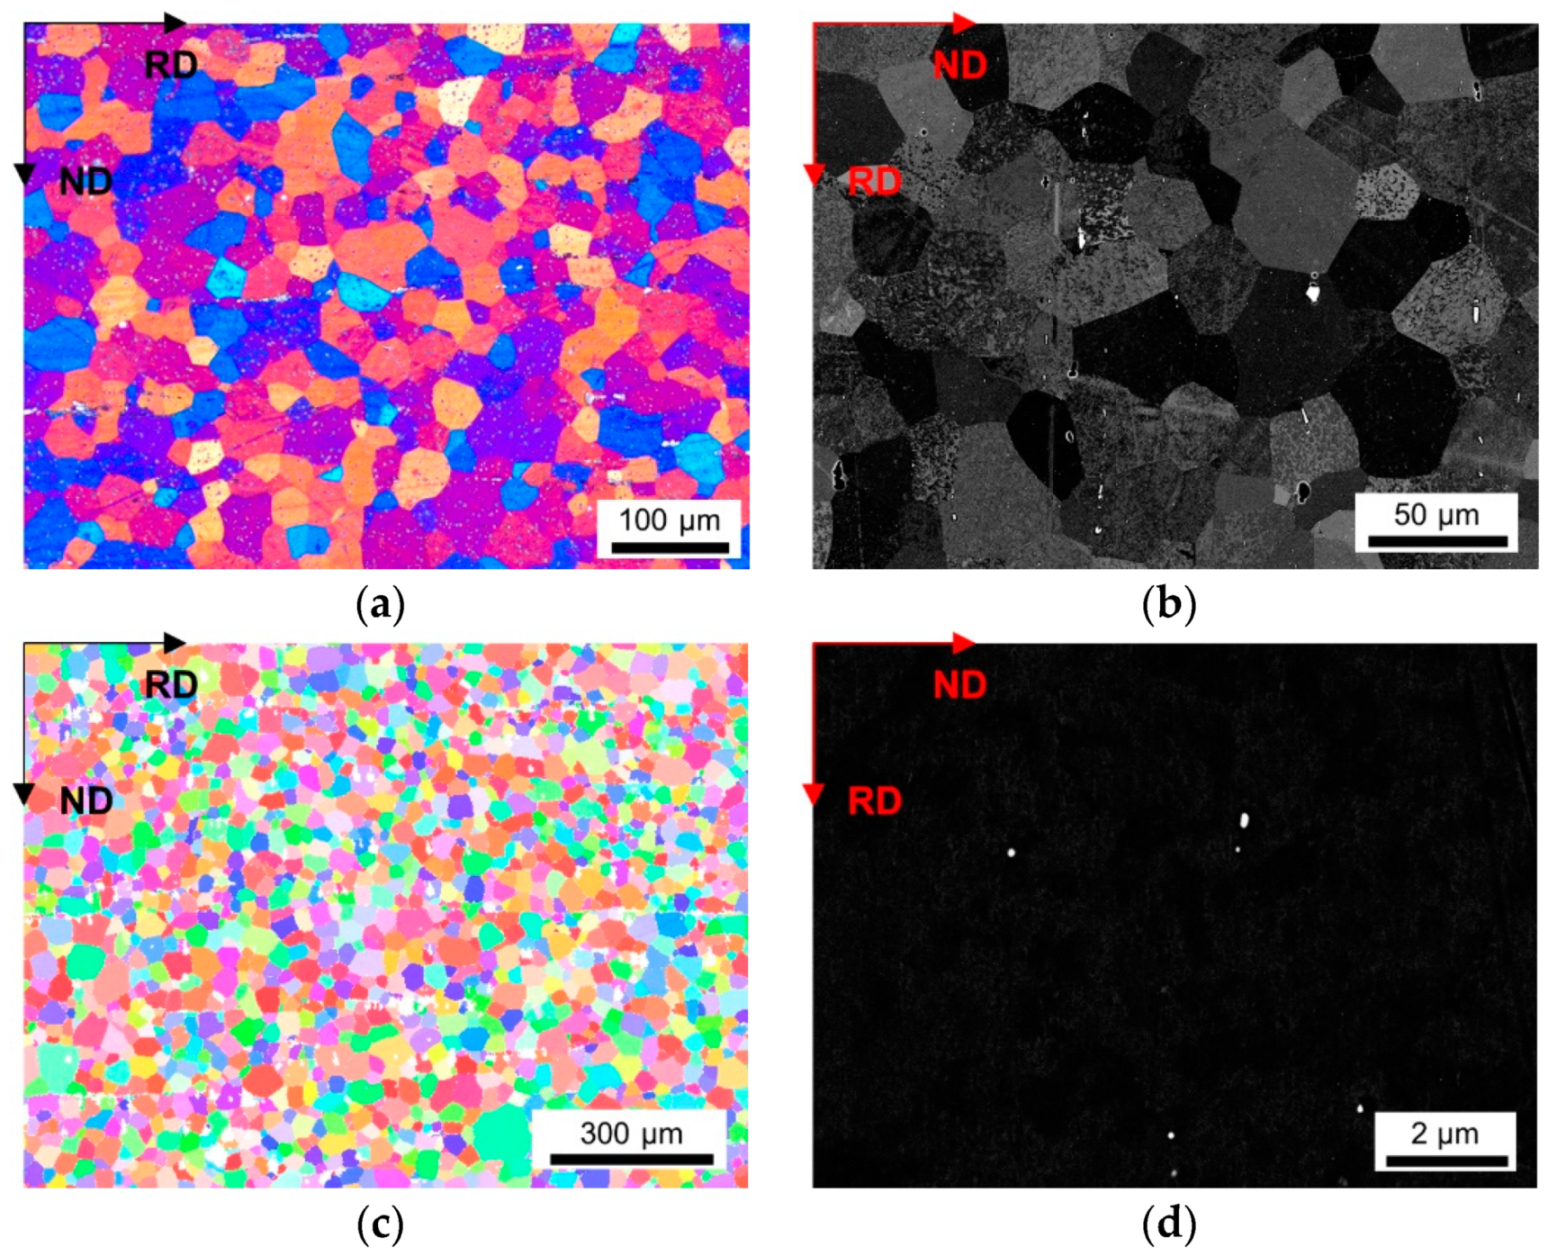
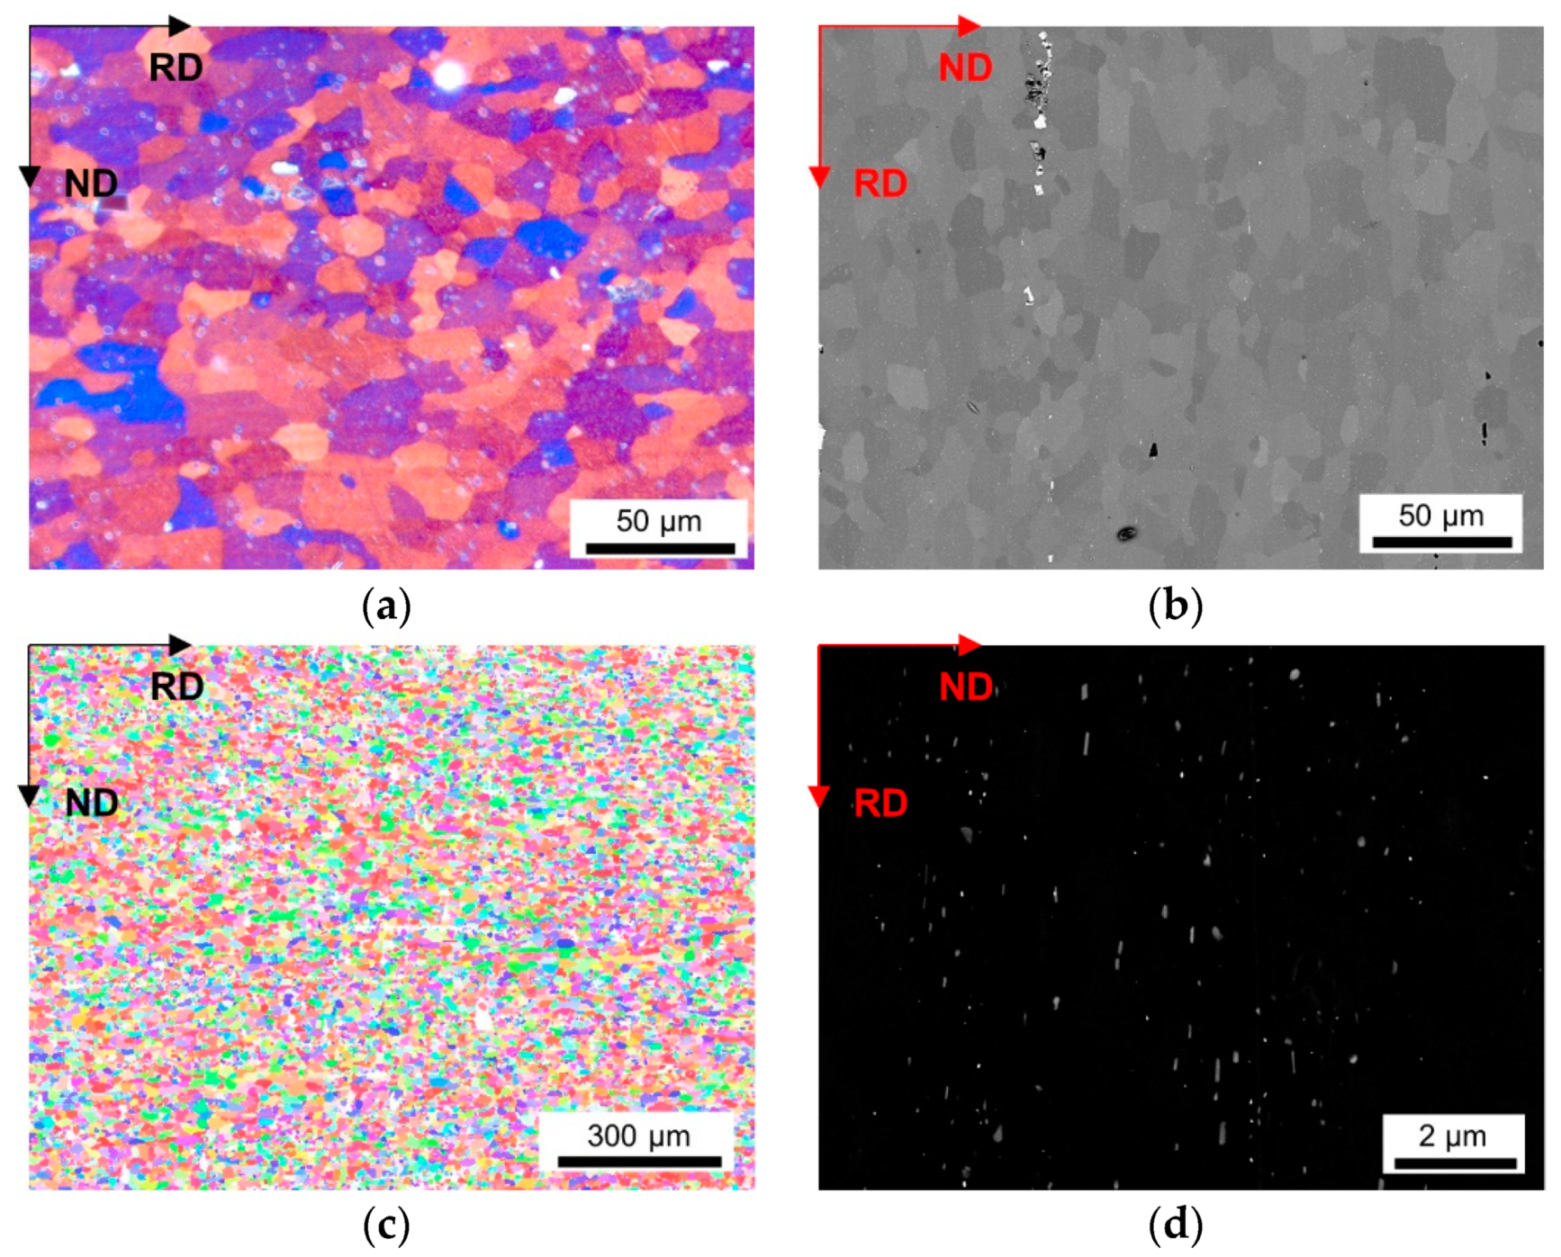
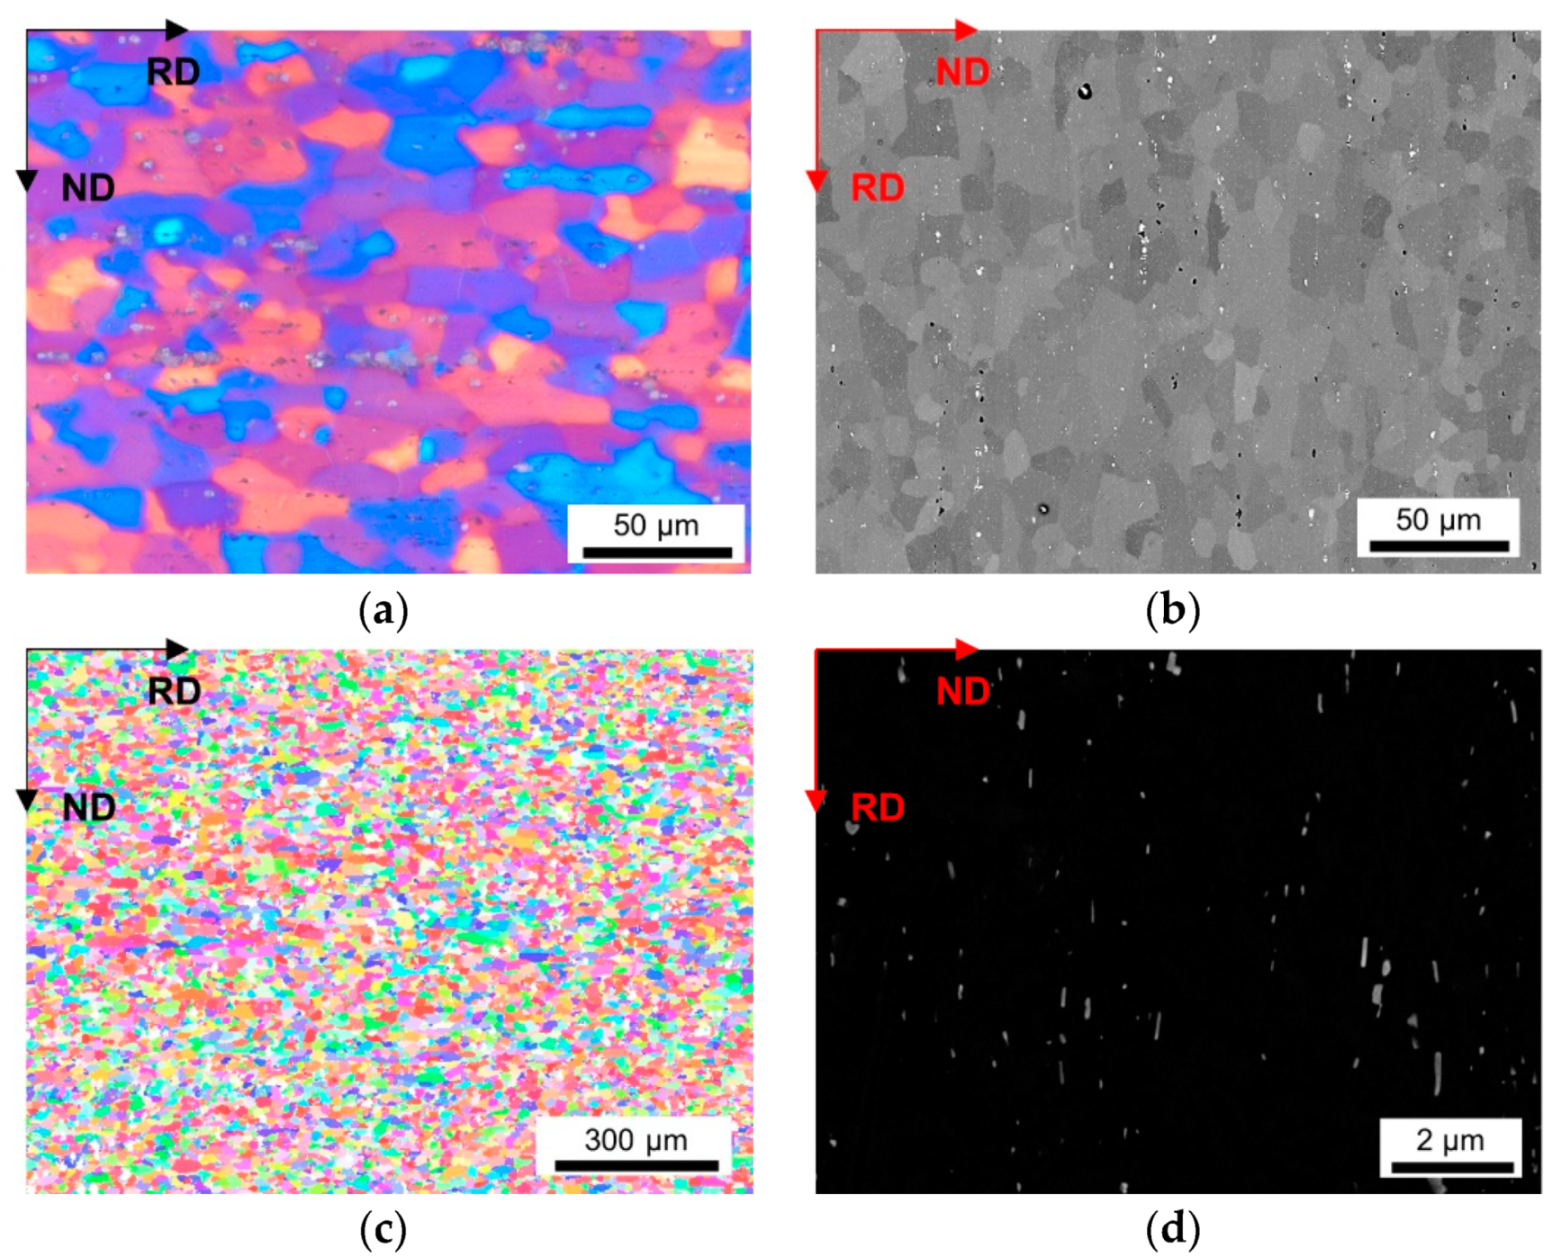
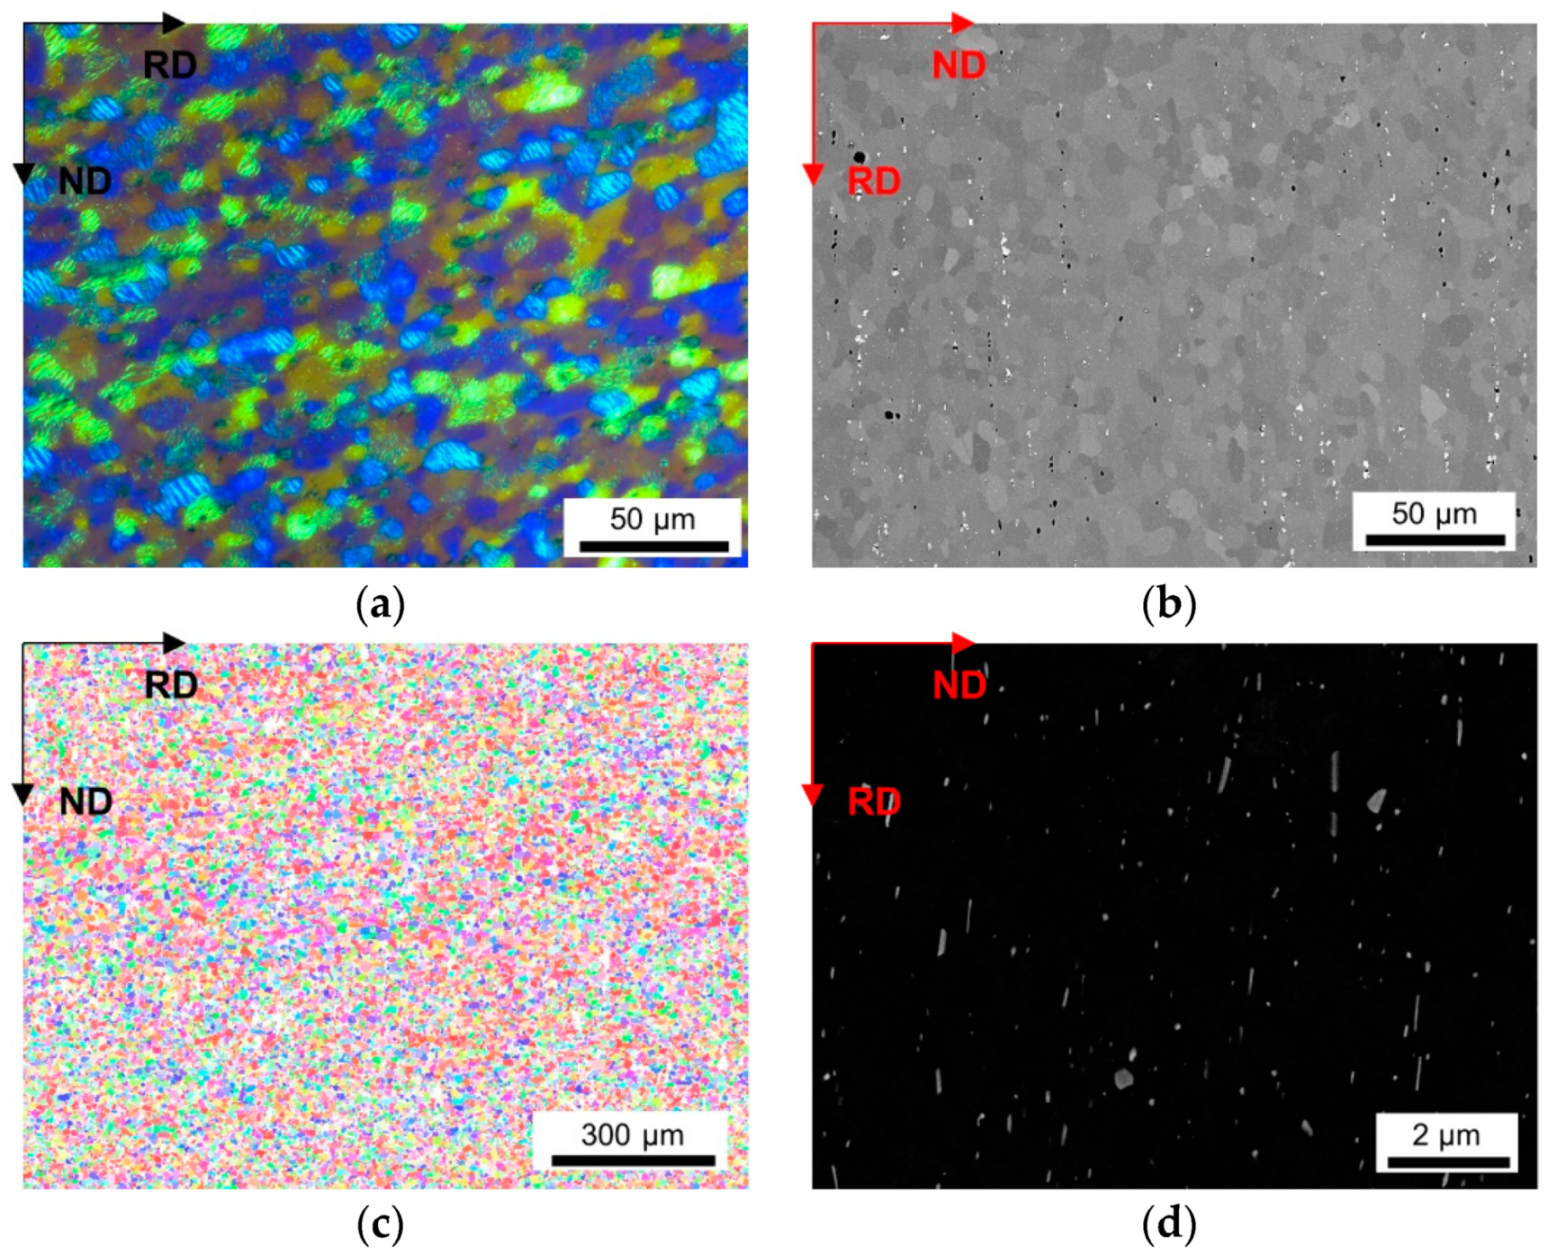
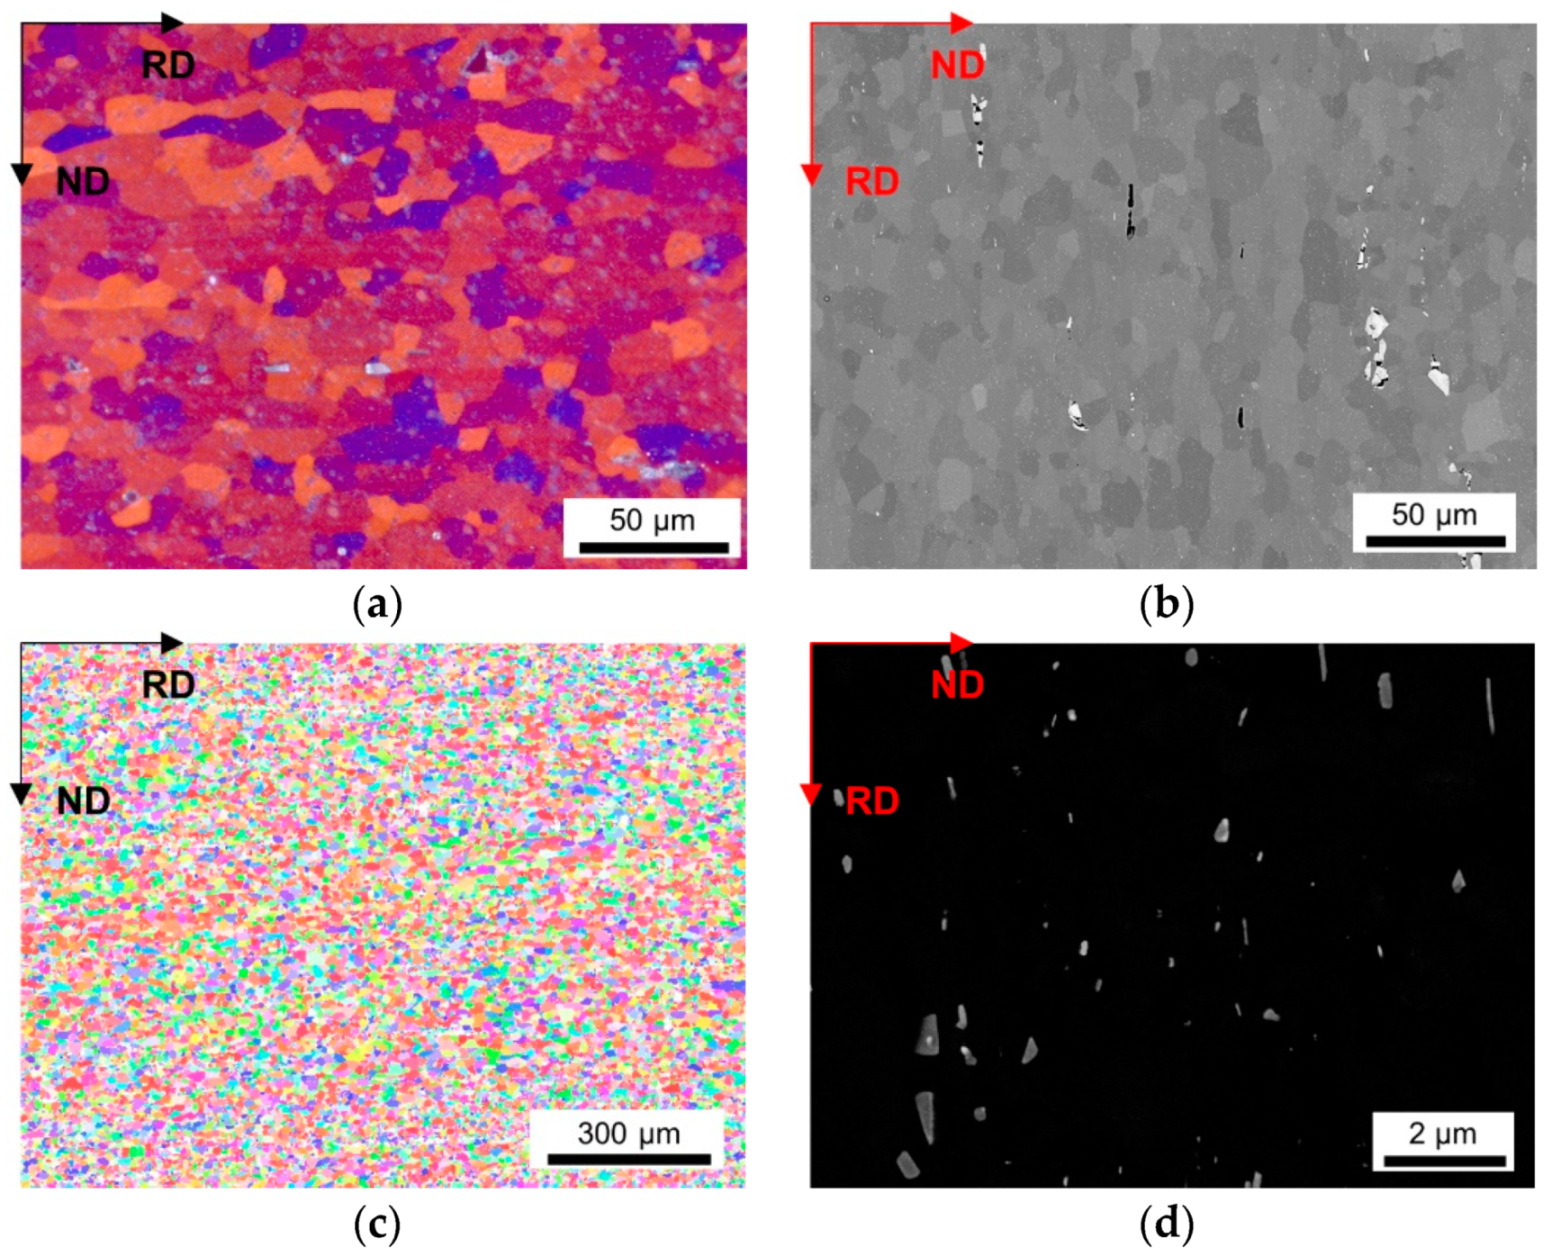
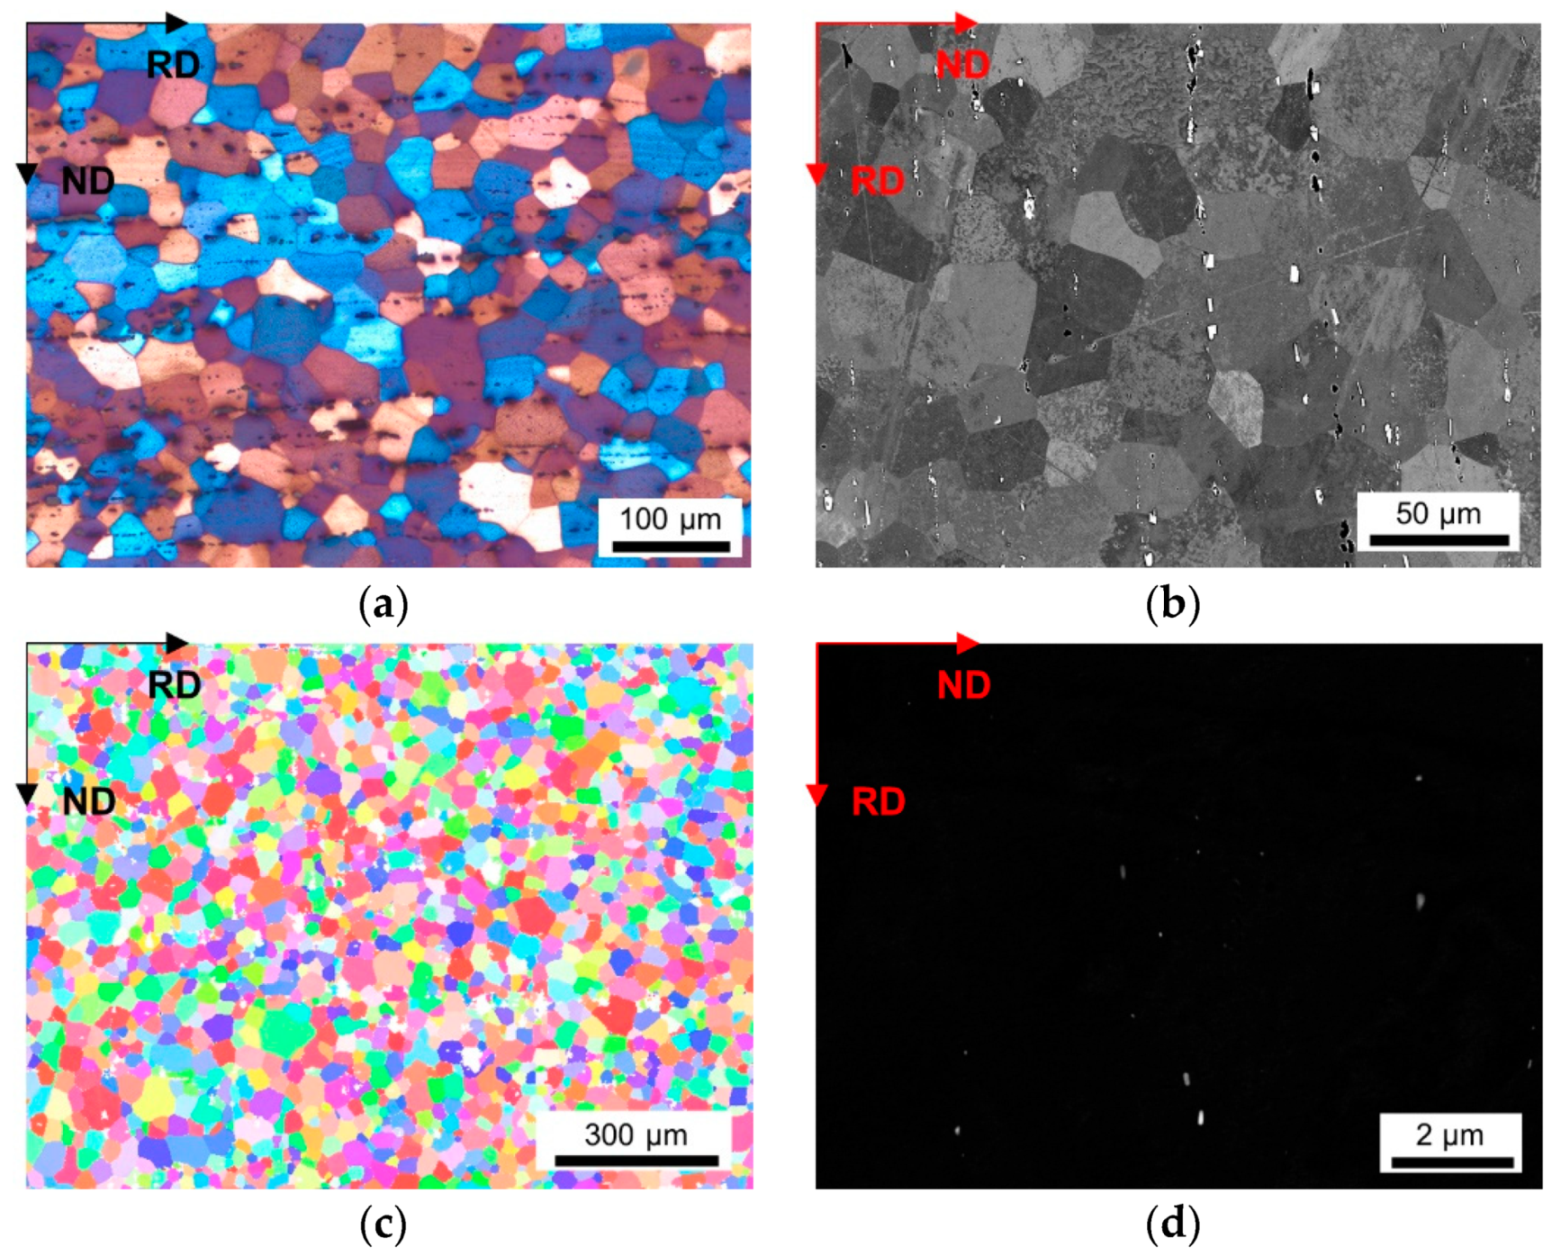
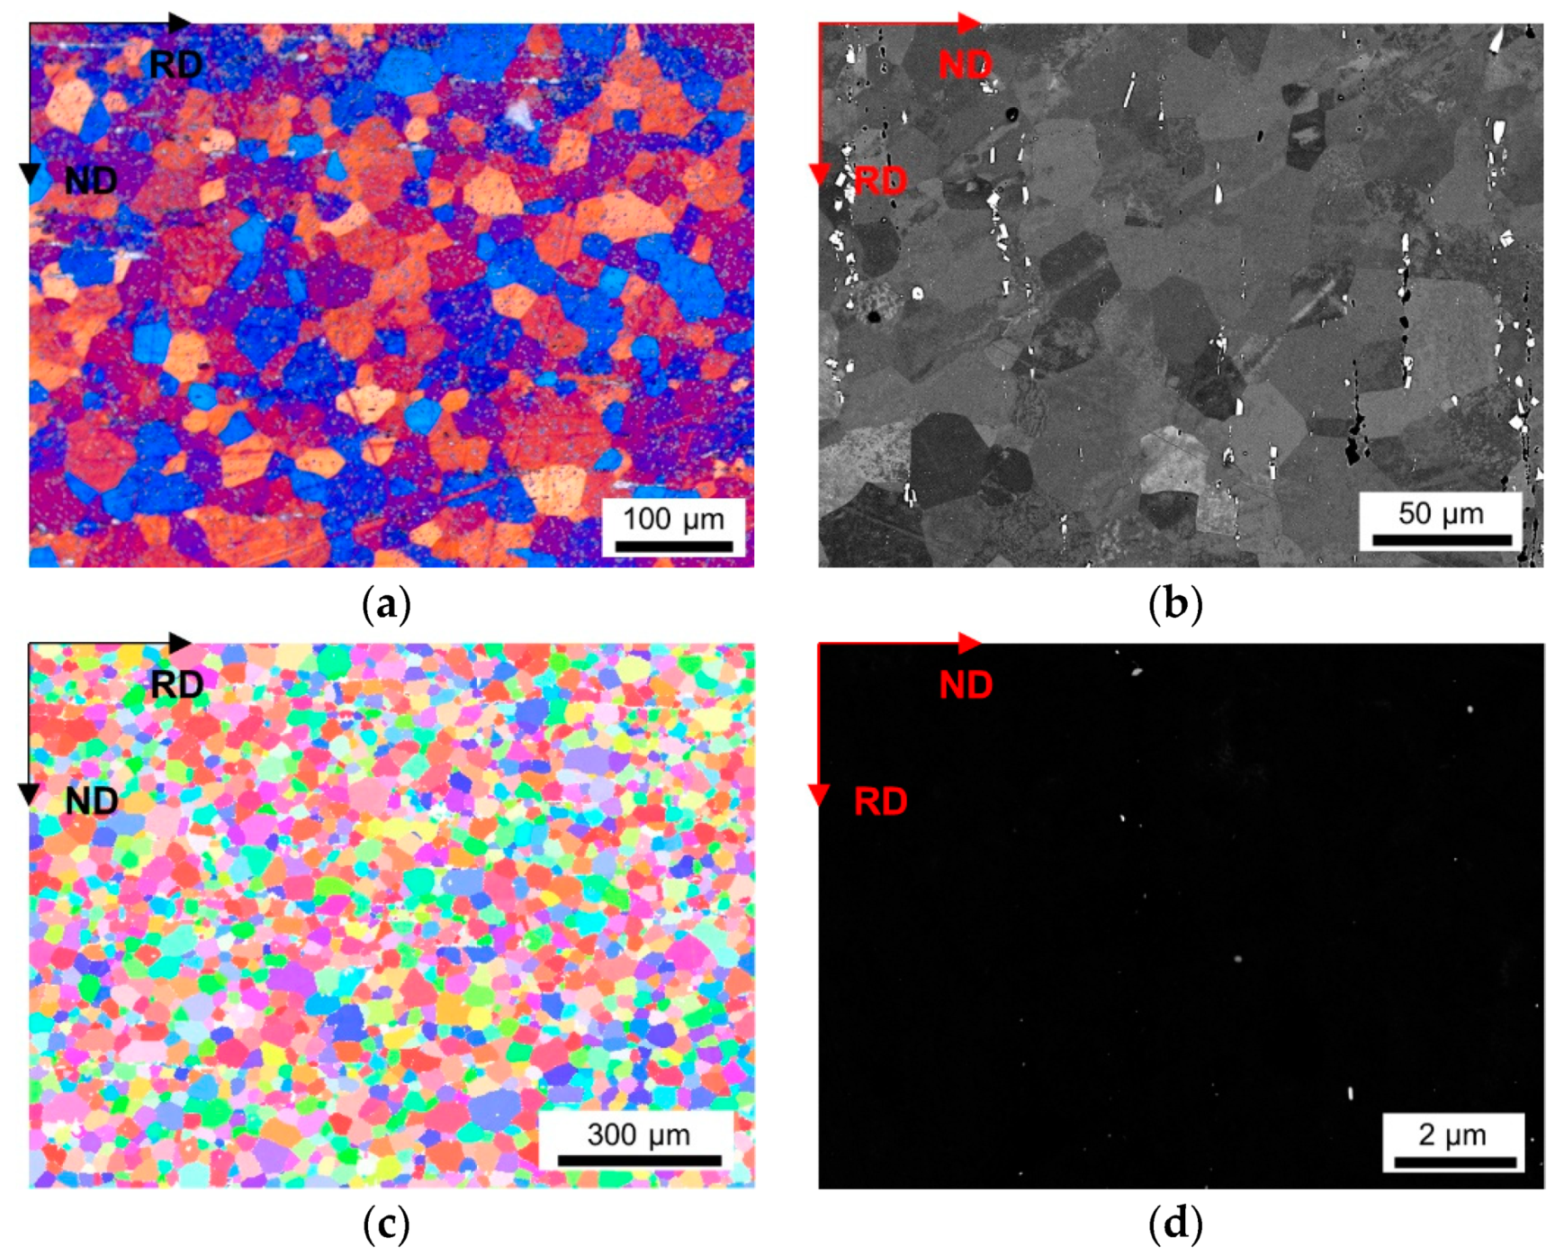
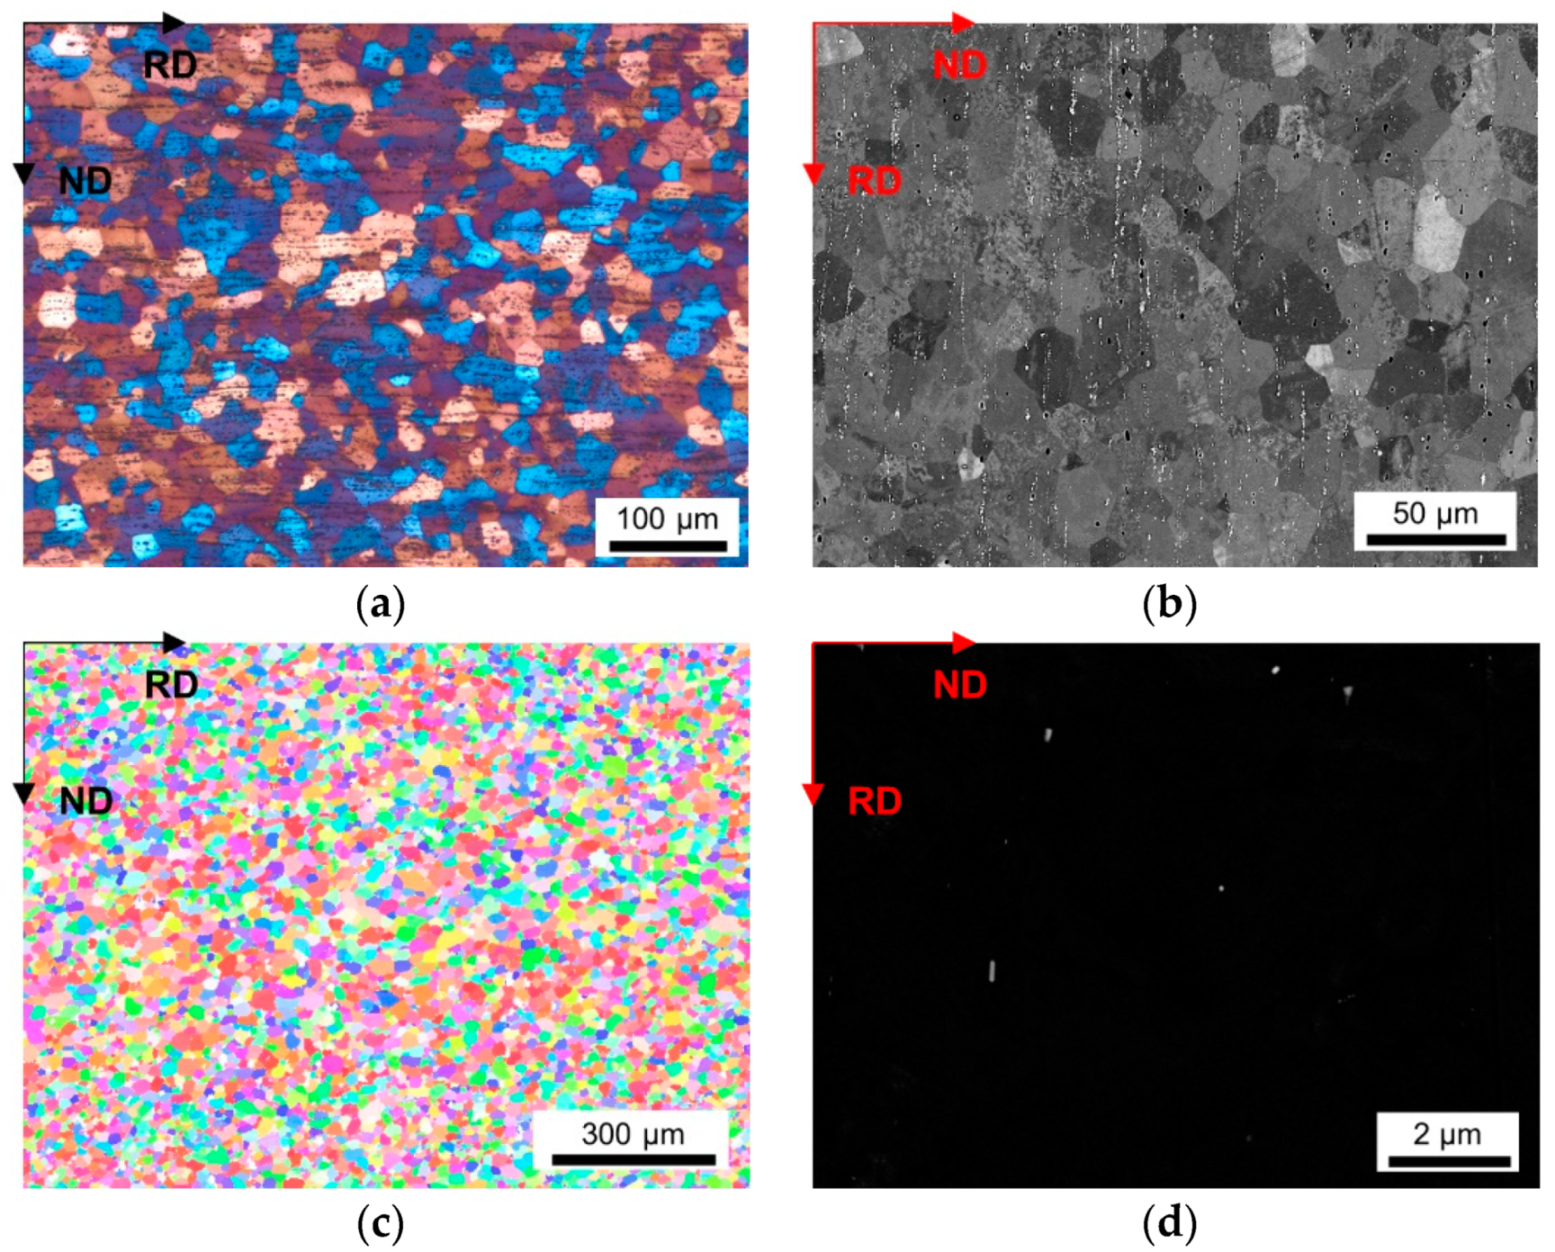
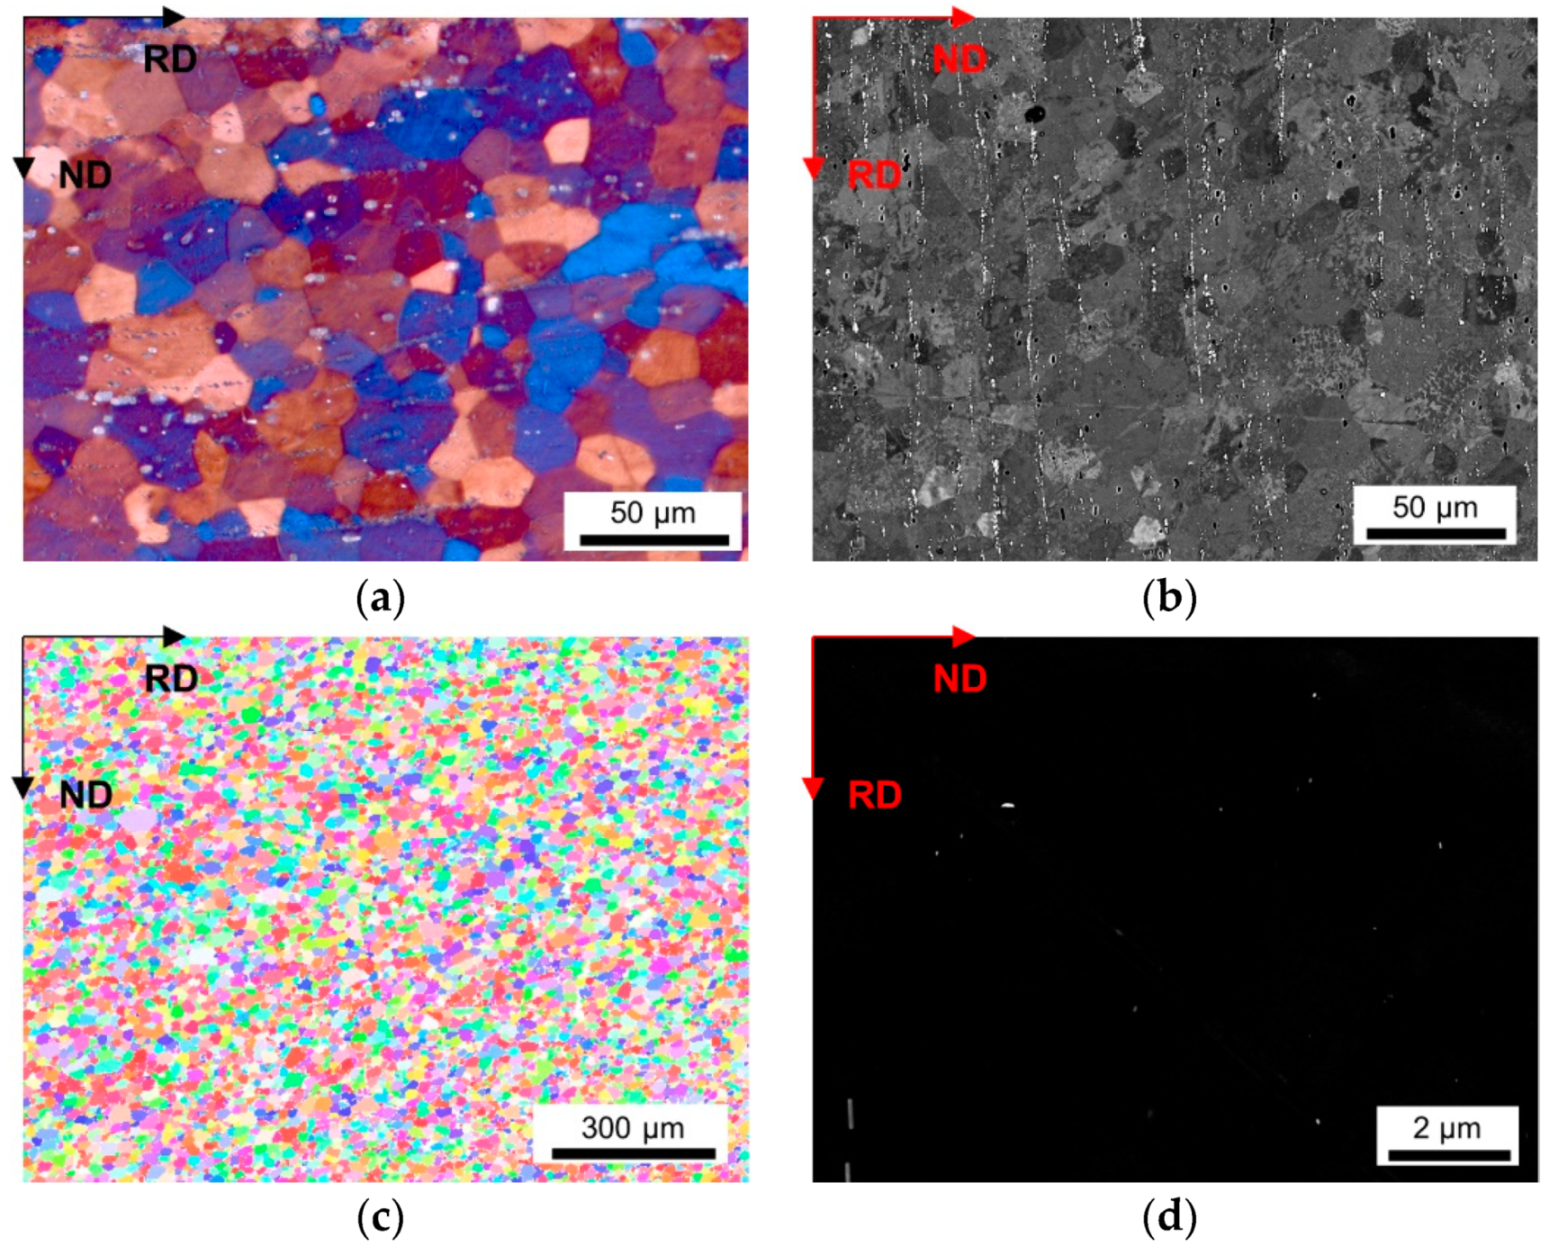
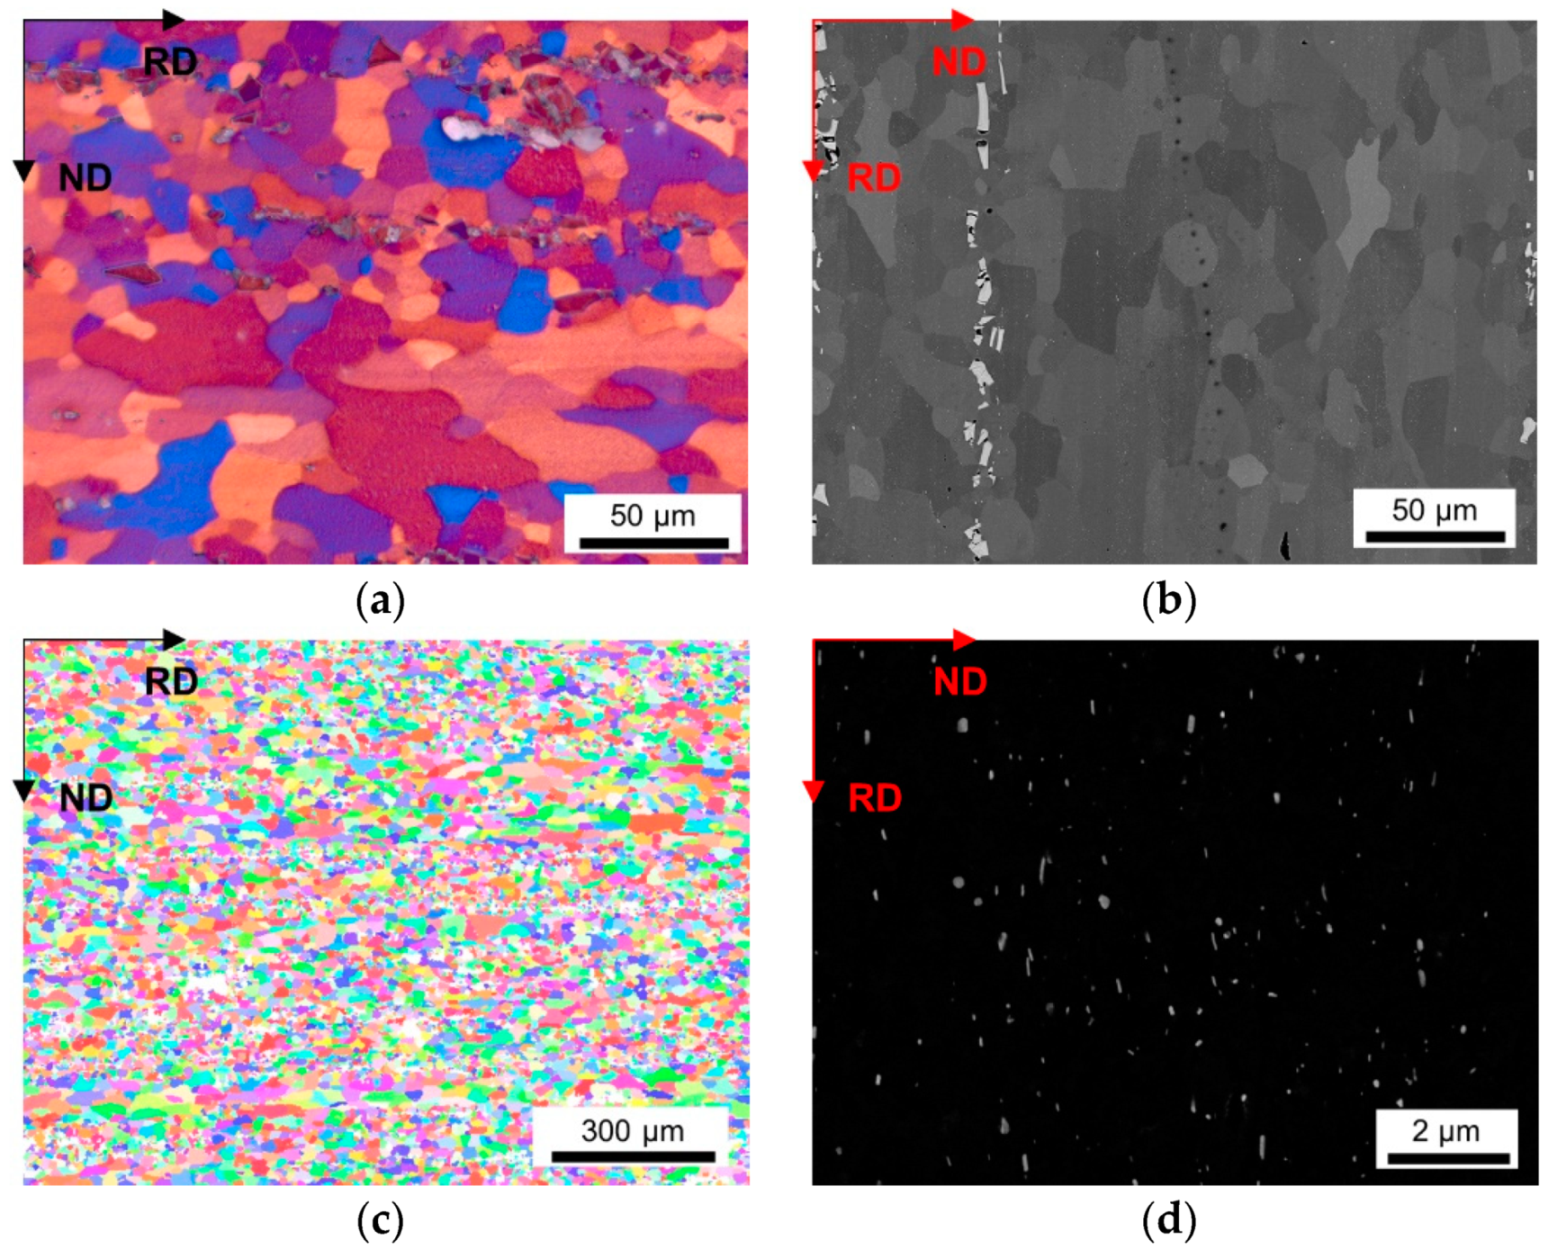
We first focus the discussion on the resulting mean grain size in the different sample states, which is depicted in
Figure 2,
Figure 3,
Figure 4,
Figure 5 and
Figure 6 and stated in
Table 2, for 63% cold rolled samples, or
Table 3, for 35% cold rolled samples, respectively.
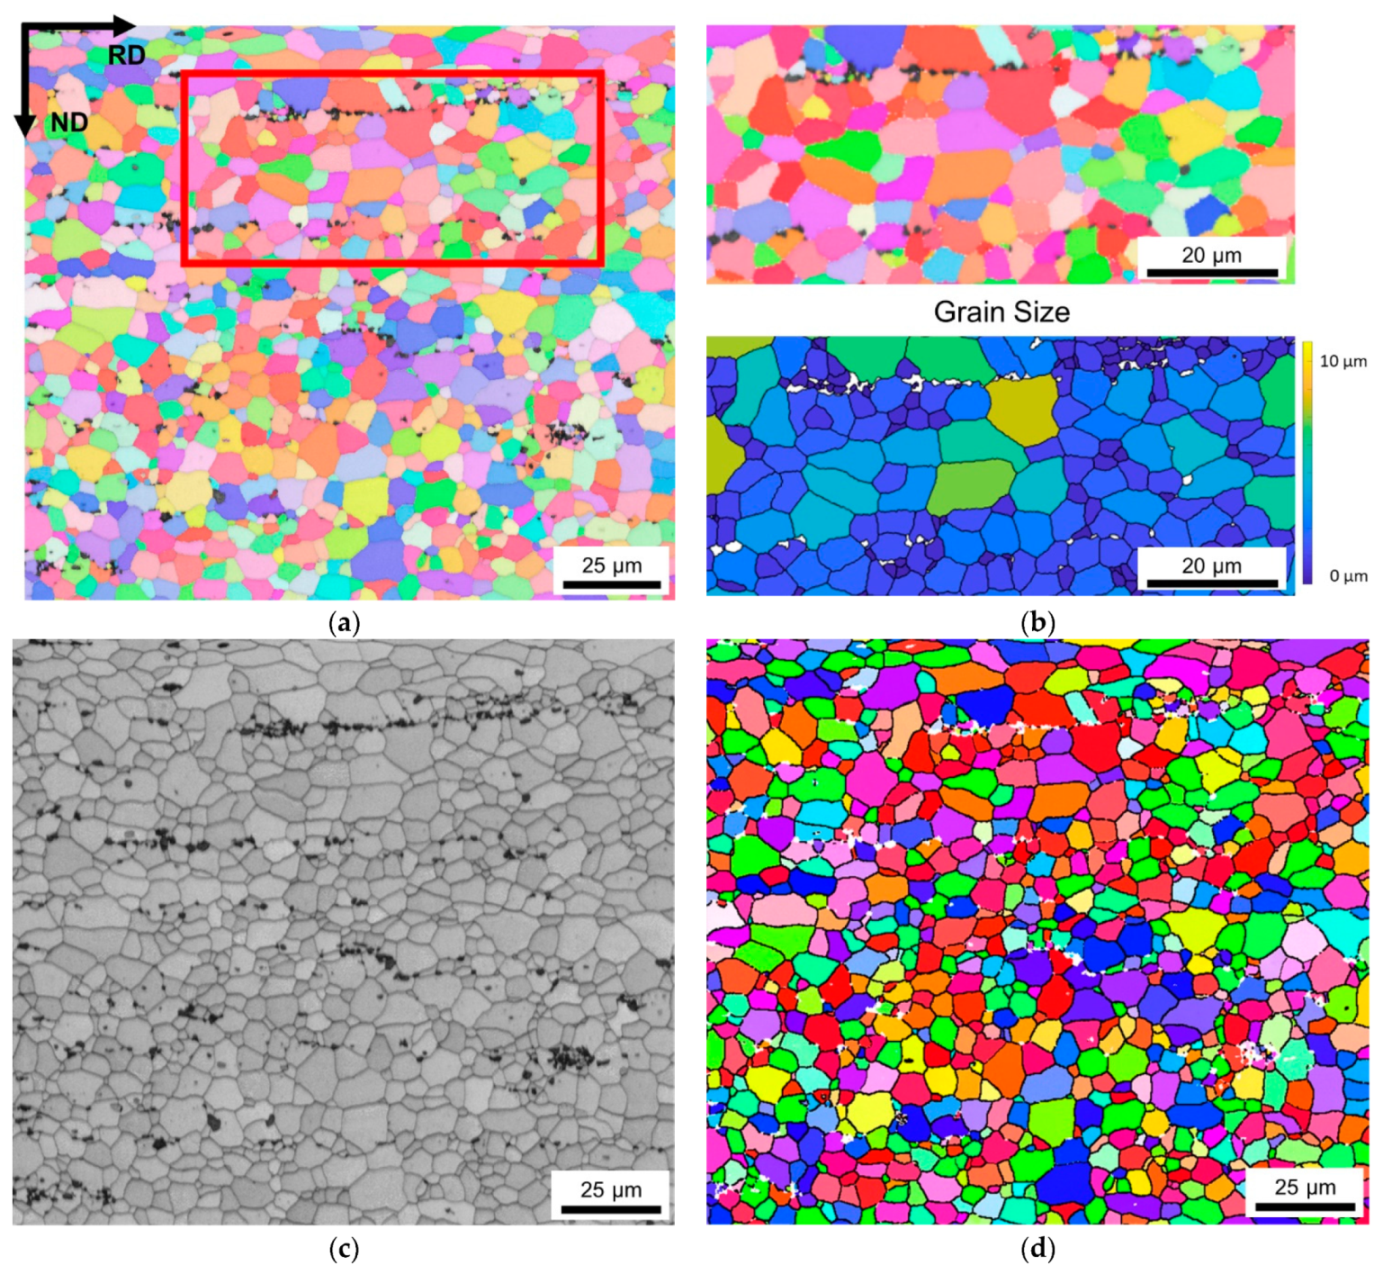
Comparing the different results for the line intercept method from LOM, BSE and EBSD micrographs in
Figure 2a,c, the importance of well-designed grain size analysis becomes clear. Although LOM and BSE imaging and evaluation are more easily executed, the EBSD technique is less user-biased and was reported in [
78] to have advantages especially in the detection of smaller sized grains. This is verified by the results in
Table 2, where the average grain size is significantly smaller for experimentally observed data by the EBSD technique. Therefore, especially for further calculations, the usage of EBSD is beneficial to avoid error propagations [
78]. However, the standard deviation is higher for EBSD results.
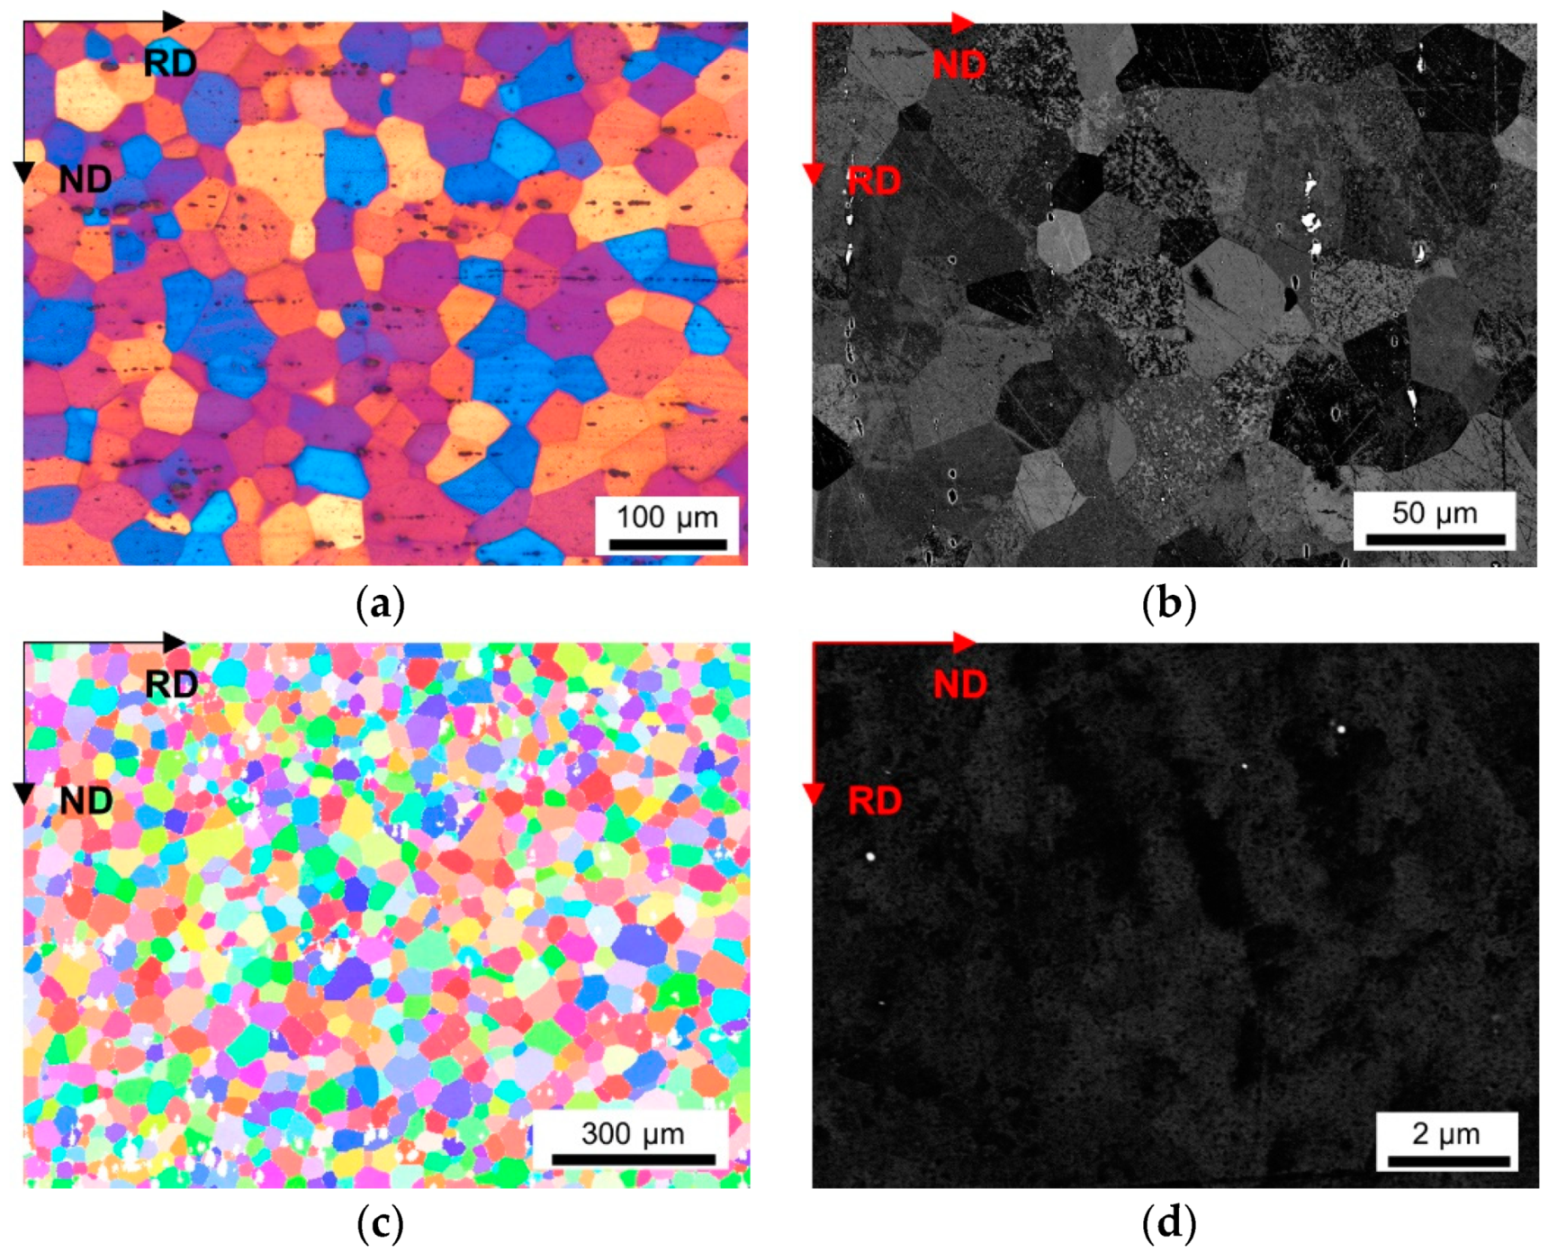
The influence of the processing parameters on the final grain size is denotable from
Table 2 and the respective figures. The refinement of the grains and the microstructural features obtained for the NR-C (near-rapid cooling) casting conditions [
17] (comparing
Figure 4 and
Figure 5) will improve the mechanical properties of the Al sheets, since the smaller average grain size is still preserved in the final sheet, to some extent [
14]. Furthermore, the combination of the solidification rate and Fe, Mn and Si alloying contents determine the size, shape and composition of the primary phase particles [
7,
8,
9,
12] With the high number density of rather small and blocky Al-Fe-Mn(-Si) precipitates, as in, for example, the HFe-HMn alloys (
Figure 3 and
Figure 4b), the NR-C conditions can reduce the adverse effects caused by stress concentrations of needle-shaped Fe bearing phases and thus increase the mechanical properties, such as r value, yield strength or ultimate tensile strength [
11,
67].
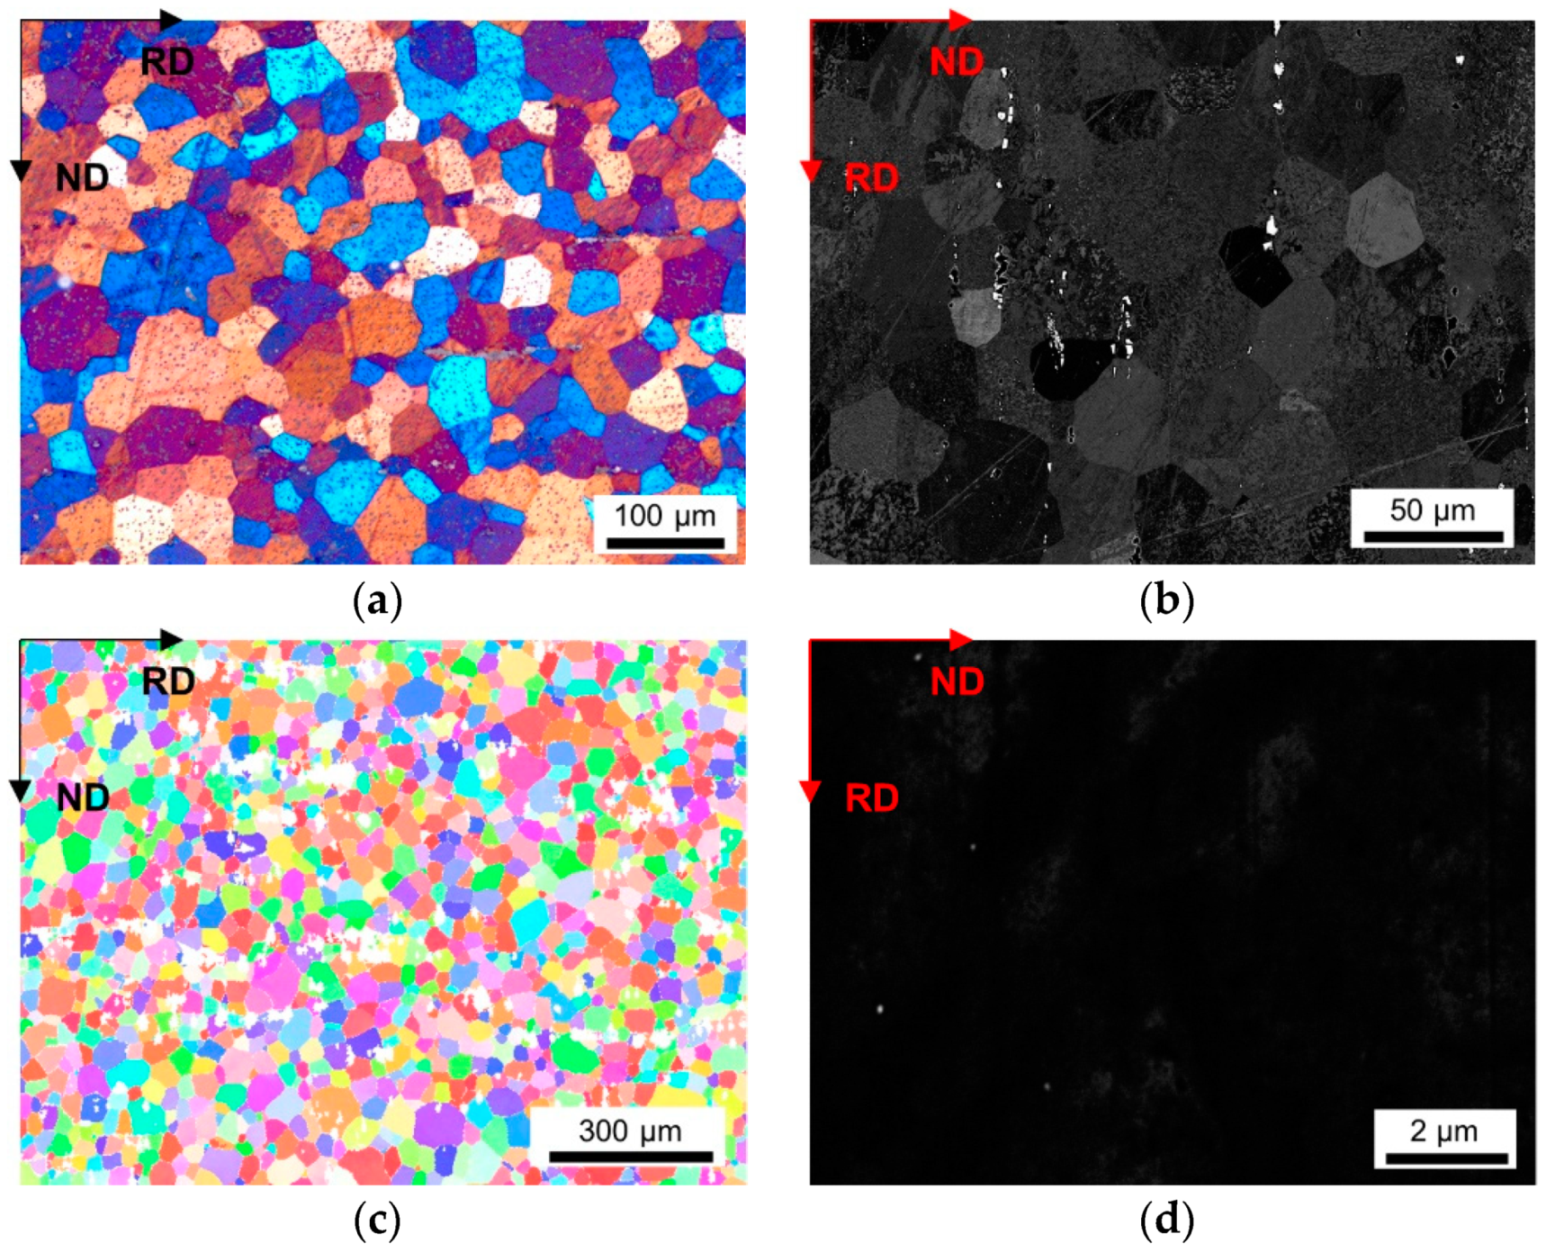
The comparison of
Table 2 to
Table 3 clarifies the impacts of the cold rolling degree on the resulting grain size. According to the classical recrystallization theory, the higher pressure for recrystallization in the 63% cold rolled alloys leads to distinct refinement of the microstructure in the soft annealed state (
Figure 3 and
Figure 4) and might therefore improve the mechanical properties [
14].
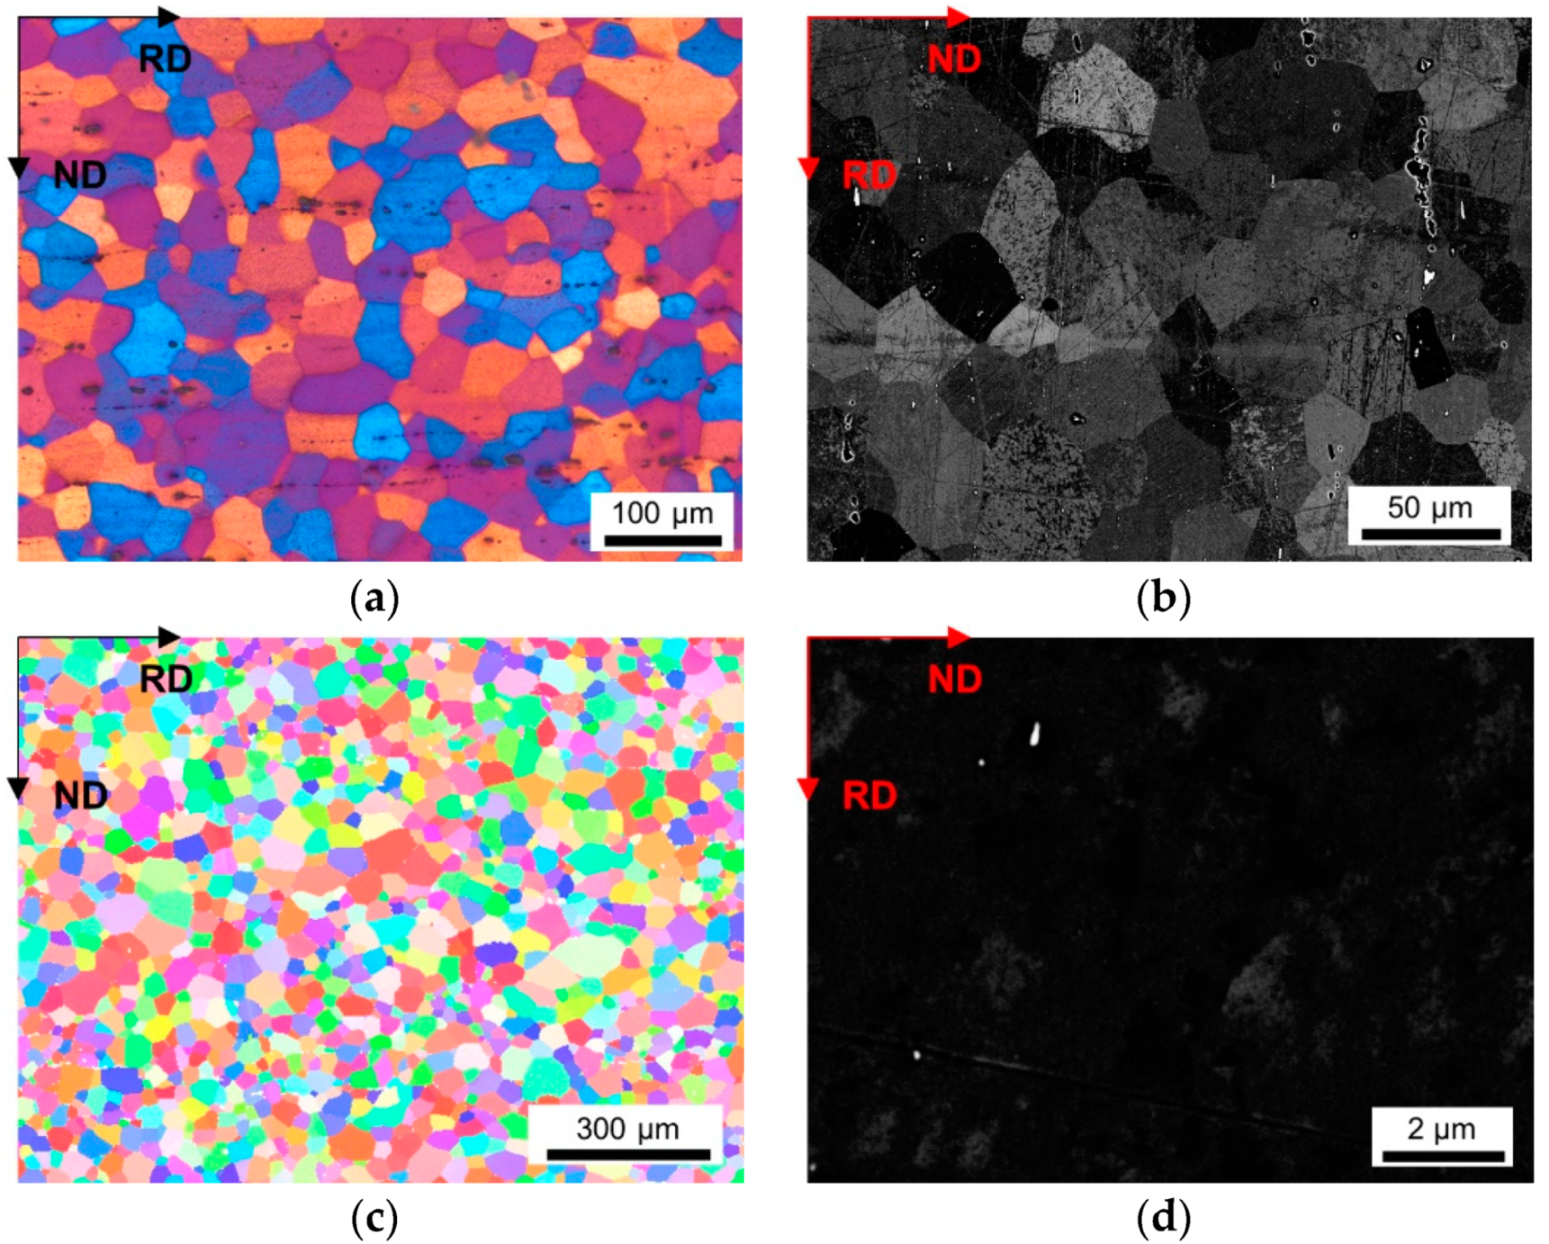
The effect of the homogenization temperature on the final sheets microstructure is discussed in light of
Table 2, as well as
Table 4 and
Table 5. As reported in Part I of the present study, the shape and constitution of the primary Al-Fe-Mn(-Si) and Mg
2Si particles alter with the high temperature heat treatment [
15,
79,
80]. Furthermore, secondary phase particles undergo distinct coarsening at the higher homogenization temperature for LFe-HMn and HFe-HMn alloys (see
Figure 2 and
Figure A6d, as well as
Figure 5 and
Figure 6d; compare
Table 4 and
Table 5) [
13,
79]. Although the results in the average grain size for 500 °C and 550 °C homogenization in
Table 2 are ambiguous concerning the exerted pinning forces by the dispersoids, the homogenization treatment plays a fundamental role in the microstructure evolution in multiphase materials, as it predominantly initiates the dispersoid formation [
16,
79,
80].
Alongside the processing parameters, the Fe and Mn alloying levels are crucial for the microstructure evolution in deformation and recrystallization processes [
14,
67]. Concerning the results in
Table 2 or the micrographs given in
Figure 2 and
Figure 3, either high Fe and/or Mn contents yield significant grain refinement for the HFe-HMn in comparison to the LFe-LMn alloy. However, in reference to the primary and secondary phase volume fractions obtained for the different alloys [
15], the effect of Zener pinning requires consideration and sophisticated discussion in this context [
10,
14,
66].
With the formation of Al
6(Fe,Mn) dispersoids during homogenization found mainly in the high Mn containing alloys, the effective Zener pinning is clearly denoted by the obvious reduction in the average grain size. Besides the verification of the general Zener pinning effect [
26], the results for the limiting grain size given in
Table 4 and
Table 5 vary significantly with the different model parameters for Equation (1) [
26,
32,
33]. The large discrepancies between the approaches of Smith–Zener or Ryum and Manohar occur from the differently chosen pinning and driving pressures for grain growth [
28]. However, while [
28] stated the good applicability of the Manohar model parameters [
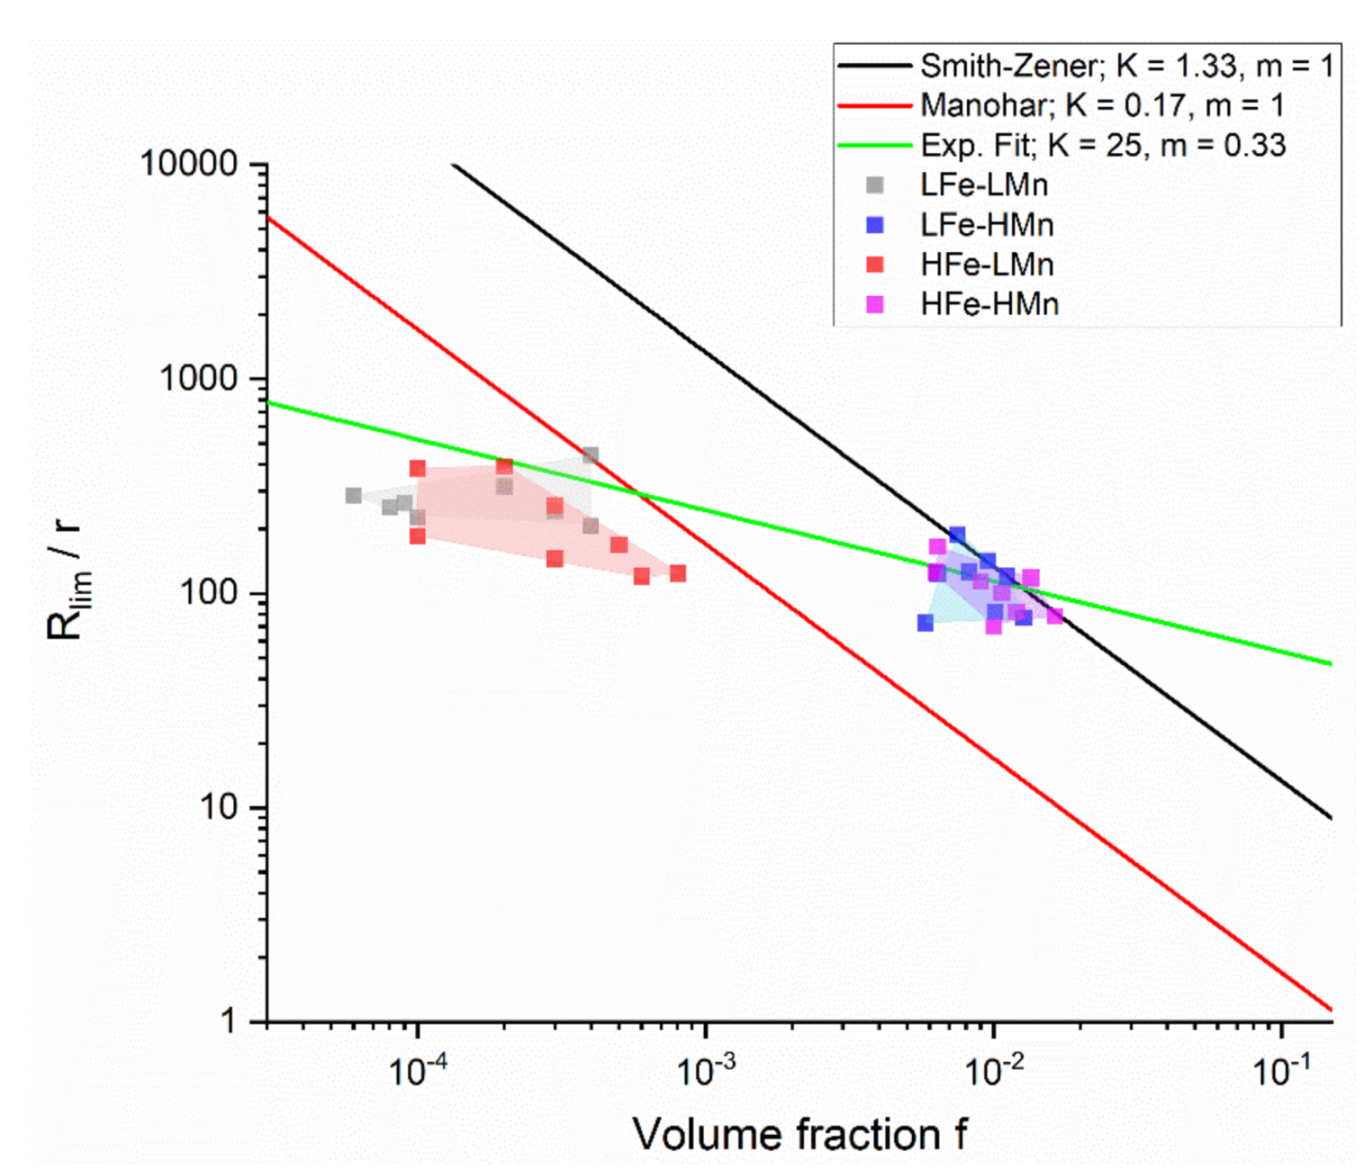
33] to predict the resulting grain size in materials with dispersoid volume fractions below f
V = 0.05, the data for LFe-HMn and HFe-HMn in
Table 4 and
Table 5, as well as
Figure 7, show best conformity with the original Smith–Zener approach [
26].
Although the grain size predictions by the Ryum model [
32] do not match the experimentally observed data as well as the Smith–Zener approach, the implementation of the dispersoids ellipsoidal shape in Equation (1) seems a necessary improvement for the present study. With the often obtained rod- or plate-like shape of the dispersoids in Mn and Fe containing 5xxx alloys [
13,
19,
79].and their (banded) alignment with RD in subsequent processing (
Figure 2 and
Figure 3d), the resulting Zener drag will be different for the individual sample directions [
27,
35,
41,
45] The aspect ratios of the dispersoids in the high Mn containing alloys given in
Table 4 and
Table 5 affect the pinning efficiency in RD and ND and further cause the discrepancies in the grain size in those directions [
14].
Concerning the resulting grain size in the LFe-LMn and HFe-LMn alloys,
Figure 7 clearly depicts that large discrepancies occur between the predictions of the Smith–Zener or Manohar model and the experimental data. On the other hand, the tentatively applied optimized fit, which follows model parameters obtained for computational studies using the exponent m = 0.33, shows high accordance to the experimental data. Nevertheless, the close match with LFe-LMn and HFe-LMn is unexpected, as the computational model is stated to be valid only for high volume fractions of dispersoids f
V > 0.01 [
34,
35,
36]. Moreover, the reliability of the fit is questionable with the high value of K = 25, since most studies proposed this parameter to be around 4/3, as in the original Smith–Zener approach, or even lower [
28]. Possible explanations for the deviations in the grain size prediction for the low Mn containing alloys might be that the final soft annealed samples (even though fully recrystallized) either (i) did not reach the static limiting grain size by grain growth in the short-term soft annealing, or (ii) additional (primary phase) particle-related effects reduced the resulting grain size [
14].
As shown in
Figure 8b for the HFe-HMn alloy, the final microstructure and grain size shows distinct influence of micron-sized fragmented primary phases. With the effect of particle stimulated nucleation, preferential nucleation around these fragmented phases may be partly responsible for grain refinement [
14,
20,
22,
25]. However, since the coarse primary particles are favorably situated on grain boundaries and junctions of the final recrystallized grains, they should also be considered for pinning effects during recrystallization and grain growth. Because the particle pinning efficiency decreases with increasing particle dimensions, additional pinning effects are only obtained for high primary phase volume fraction containing alloys HFe-LMn and HFe-HMn [
26,
27,
28]. Therefore, the refined grains for HFe-LMn in comparison to LFe-LMn in
Table 2 may be the result of combined effects of PSN and primary phase pinning. The similar trends of grain size reduction for S-C cast HFe-HMn in comparison to LFe-HMn suggest equivalent mechanisms; however, with the high fraction of pinning dispersoids weakening the effect of the primary phases, the difference in the resulting grain size is significantly smaller [
69].
In general, the present study verifies the theories of Zener pinning by second phase dispersoid particles. Despite numerous sophisticated corrections and improvements that have included various parameters into the model for the resulting limiting grain size, the applicability for predicting the resulting grain size in experimental or industrial processes is still limited. Even though the present results confirm the conclusions of the original Smith–Zener relation, further investigations and combined implementation of various particle-grain boundary related effects in an all-encompassing model equation are still sought [
14,
26,
28,
32].
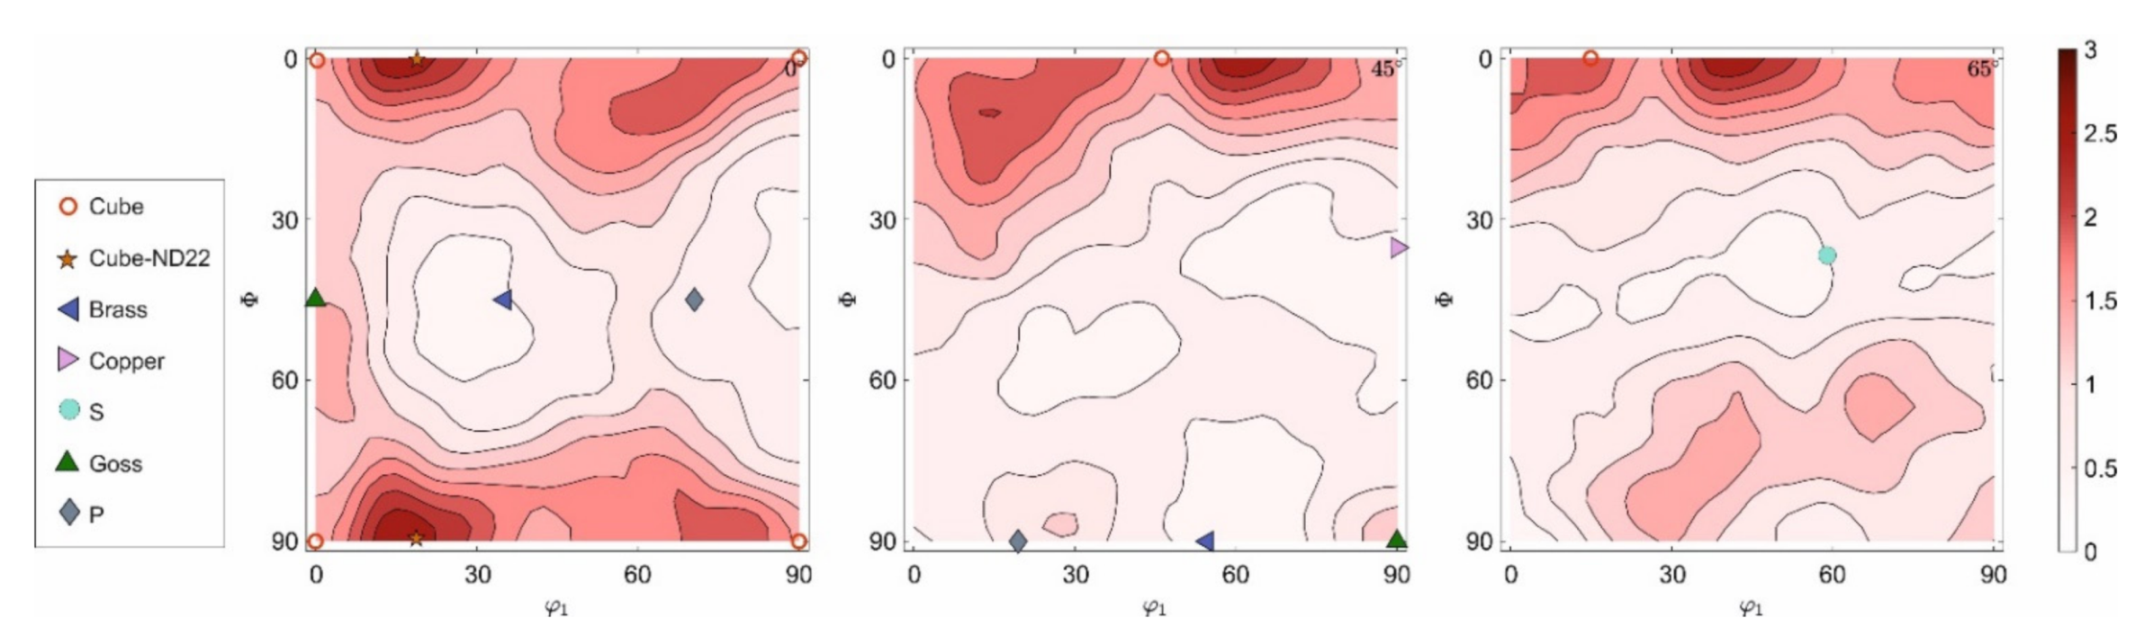
We now discuss the texture evolution of the investigated alloys shown in the IPF maps in
Figure 2,
Figure 3,
Figure 4,
Figure 5 and
Figure 6c, as well as
Figure 9 and
Figure A29. All samples exhibit remarkably low fractions of typical aluminum recrystallization textures in the annealed condition. These overall minor intensities were similarly found for laboratory and industrially processed EN AW-5182 alloys [
73]. The texture transformations to higher random fractions can be attributed to shear band formation, which is likely in high Mg containing Al alloys implicating Cube texture suppression and preferential nucleation of Goss, P and Q orientation, or to PSN effects [
14,
58].
Figure 9a,b highlight the small and ambiguous influence of the casting process on the final texture. The variation in the casting cooling conditions S-C and NR-C mainly influences the refinement of the primary phase and the casting grain and accompanying texture modifications will be observed in the comparison of the individual alloys. As both casting processes do not involve any special operations or directed solidification, the formation of pronounced texture components in the as-cast state is not promoted [
21] and, thus, the transfer of orientations, such as Cube, to the final soft annealed states is unlikely to occur [
54].
The influence of the maximum homogenization temperature on the resulting texture is hardly perceptible when comparing
Figure 9b,c. Although grain boundary pinning by dispersoid particles in general affects the texture evolution, the differences in average dispersoid size and amount at 500 °C and 550 °C homogenization do not produce significant texture transformations [
23,
25,
68,
69].
It is well established that cold rolling significantly influences the recrystallization behavior of materials by altering the driving pressure for primary recrystallization and normal grain growth [
14]. The results on the impact of the CRD on the recrystallization texture (comparing
Figure 9c,d) are in line with expectations, as the higher CRD of 63% promotes recrystallization during soft annealing and, hence, exhibit lower fractions of remaining β-fiber components but more pronounced recrystallization textures [
14].
With the generally weak texture found in the present study, the texture modifications due to primary particles and dispersoids can only be assessed by trends and not by significant differences in the intensities. The impacts of the Zener drag on the recrystallization texture can be deduced from the behavior of the different alloys in
Figure 9 and
Figure A29. The weaker transformation of the rolling components in the LFe-HMn and HFe-HMn alloys can be related to pinning effects by dispersoids, since the growth of emerging recrystallization nuclei with Goss, P and Cube
ND orientation is retarded [
25,
66,
68,
69]. In turn, the intensities of those components are rather low in comparison to the LFe-LMn and HFe-LMn alloys. Furthermore, as the growth of Cube oriented grains is assumed to be least affected by pinning effects, slightly higher Cube fractions are obtained for some of the LFe-HMn and HFe-HMn alloys in various sample states, in agreement with the mechanisms described in literature [
25,
68,
69].
For the formation of the recrystallization structures, the PSN mechanism also needs to be taken into account, as the occurring fragmentation of primary phase particles during rolling can significantly increase the number of potential PSN nuclei (
Figure 2,
Figure 3,
Figure 4,
Figure 5 and
Figure 6b), thus altering the resulting texture [
21]. The PSN related texture component P was slightly more favorably observed for the low Mn alloys; in the case of the high Mn alloys, however, the expansion of the P-oriented nuclei is likely to be retarded by dispersoid pinning effects [
23,
24,
25,
68,
69]. In general, it has to be emphasized that due to the overall weak textures the change of the annealing texture towards a higher random fraction of orientations through PSN effects is very weakly pronounced [
6,
58,
59].
With the large varieties in primary and secondary phase fractions in the four different alloys and the differences in the resulting grain size, the mechanical properties, as well as the forming behavior, will be affected. In addition to the commonly known increased strength with the reduction in the average grain size, recent studies also state that there can be beneficial effects of (coarse) Fe and Mn bearing primary phases on the mechanical properties, as well as the deep drawability, as the phases can beneficially refine the soft annealed grain structure and favor texture randomization [
3,
11,
67] Moreover, the detrimental effect of Lüdering in the AlMg(Mn) alloys can effectively be reduced by the control of the primary and secondary phase number density, size and total volume fraction [
70,
71].
Furthermore, whereas numerous publications mention the essential effects of PSN to reduce the mechanical anisotropy or surface effects, such as roping in other Al alloys series [
6,
23,
24,
66] the high fraction of random texture components obtained in the 5xxx series will minimize the plastic anisotropy in the material [
52,
73]. In light of these findings, in particular the Fe and Mn rich alloy HFe-HMn processed via NR-C is expected to exhibit interesting mechanical properties due to the particular particle distribution, small grain size and random annealing textures.


 ,
, 


