
Abrasive Waterjet (AWJ) Forces—Potential Indicators of Machining Quality

 , , ,
, , ,
Abstract
:1. Introduction
2. Theoretical Base
- the limit traverse speed;
- the coefficient modifying abrasive water jet performance according to the changing content of abrasive below “saturation level” (above this level, the jet performance increases no more and );
- ratio between the quantity of non-damaged grains (i.e., not containing defects) and the total quantity of grains in the supplied abrasive material;
- diameter of the water nozzle;
- density of abrasive jet (conversion to homogeneous liquid);
- pressure obtained from Bernoulli’s equation for liquid with density and velocity of abrasive jet;
- attenuation coefficient of abrasive jet in the environment between the focusing tube outlet and the material surface;
- stand-off distance (distance between exit of the focusing tube and material surface);
- coefficient of abrasive water jet velocity loss in the interaction with material (experimentally determined);
- material thickness;
- density of material being machined;
- strength of material being machined;
- minimum limit traverse speed of cutting—correction for the zero traverse speed (usually is used, where is the average abrasive particle size after the mixing process inside the mixing head and focusing tube);
- material hardness;
- interaction time;
- mean size of particles (elements) of material—grains or their chips.
3. Methods and Tools
3.1. Measuring Device
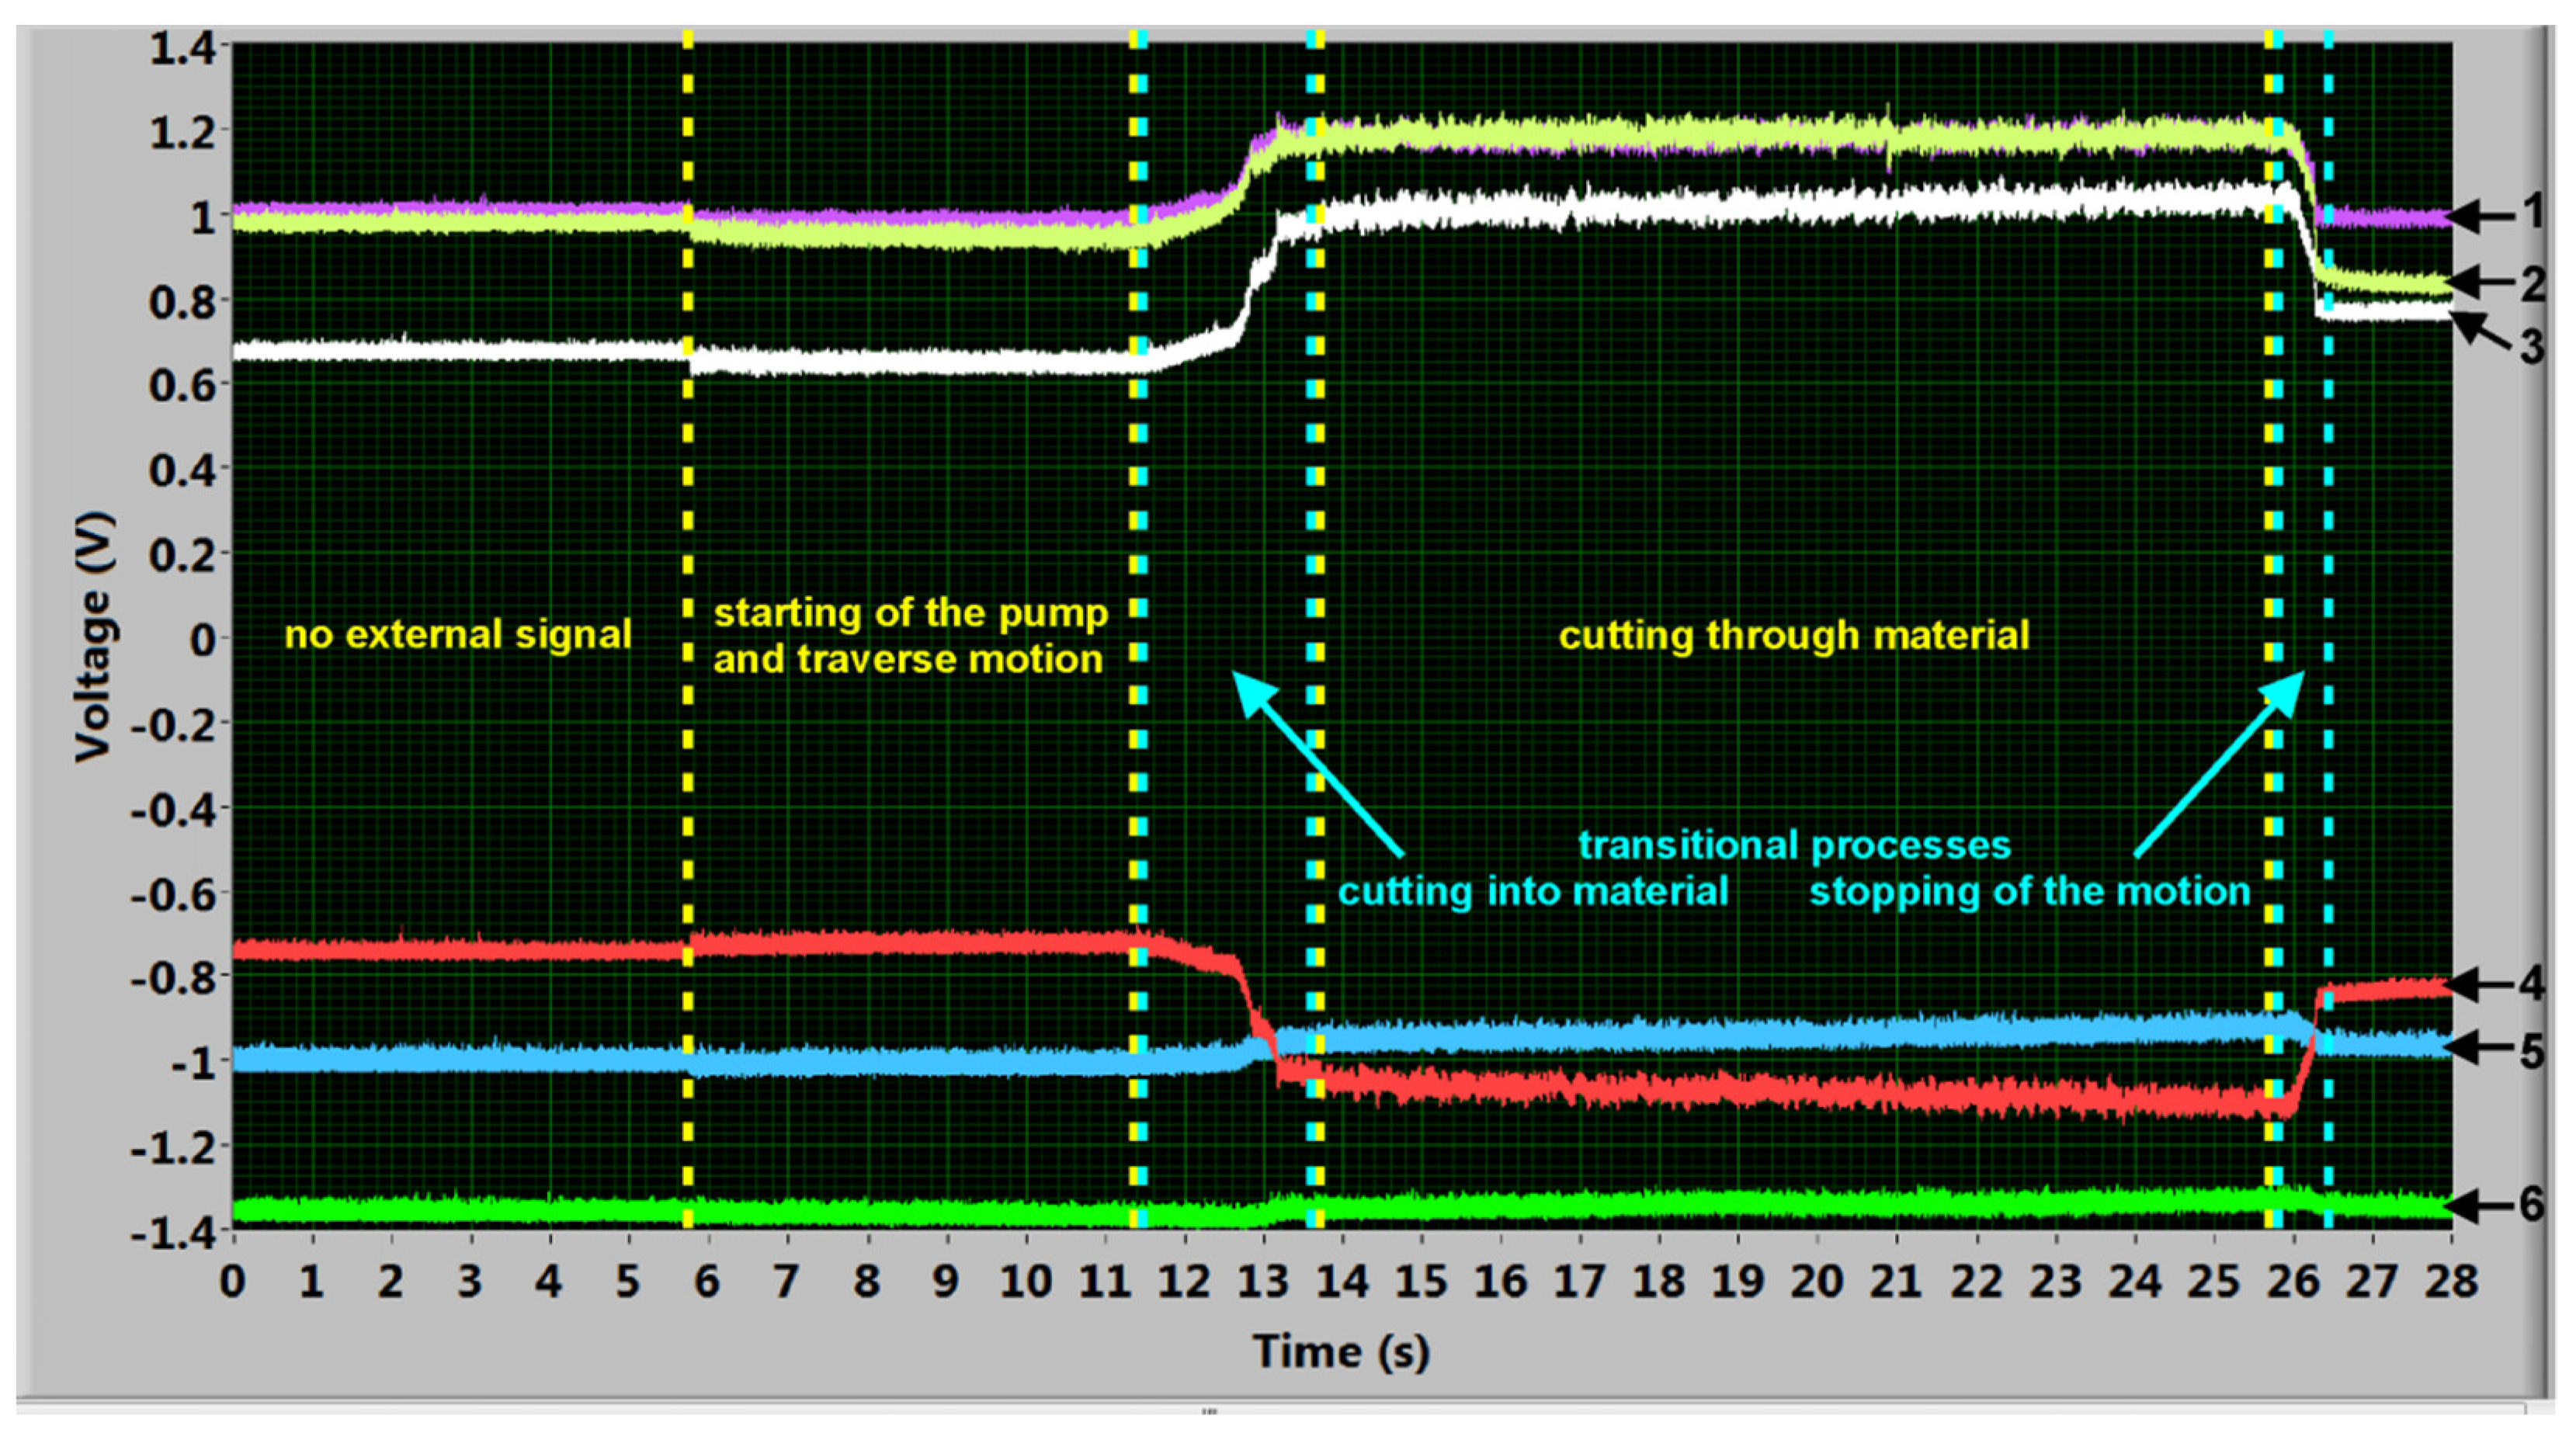
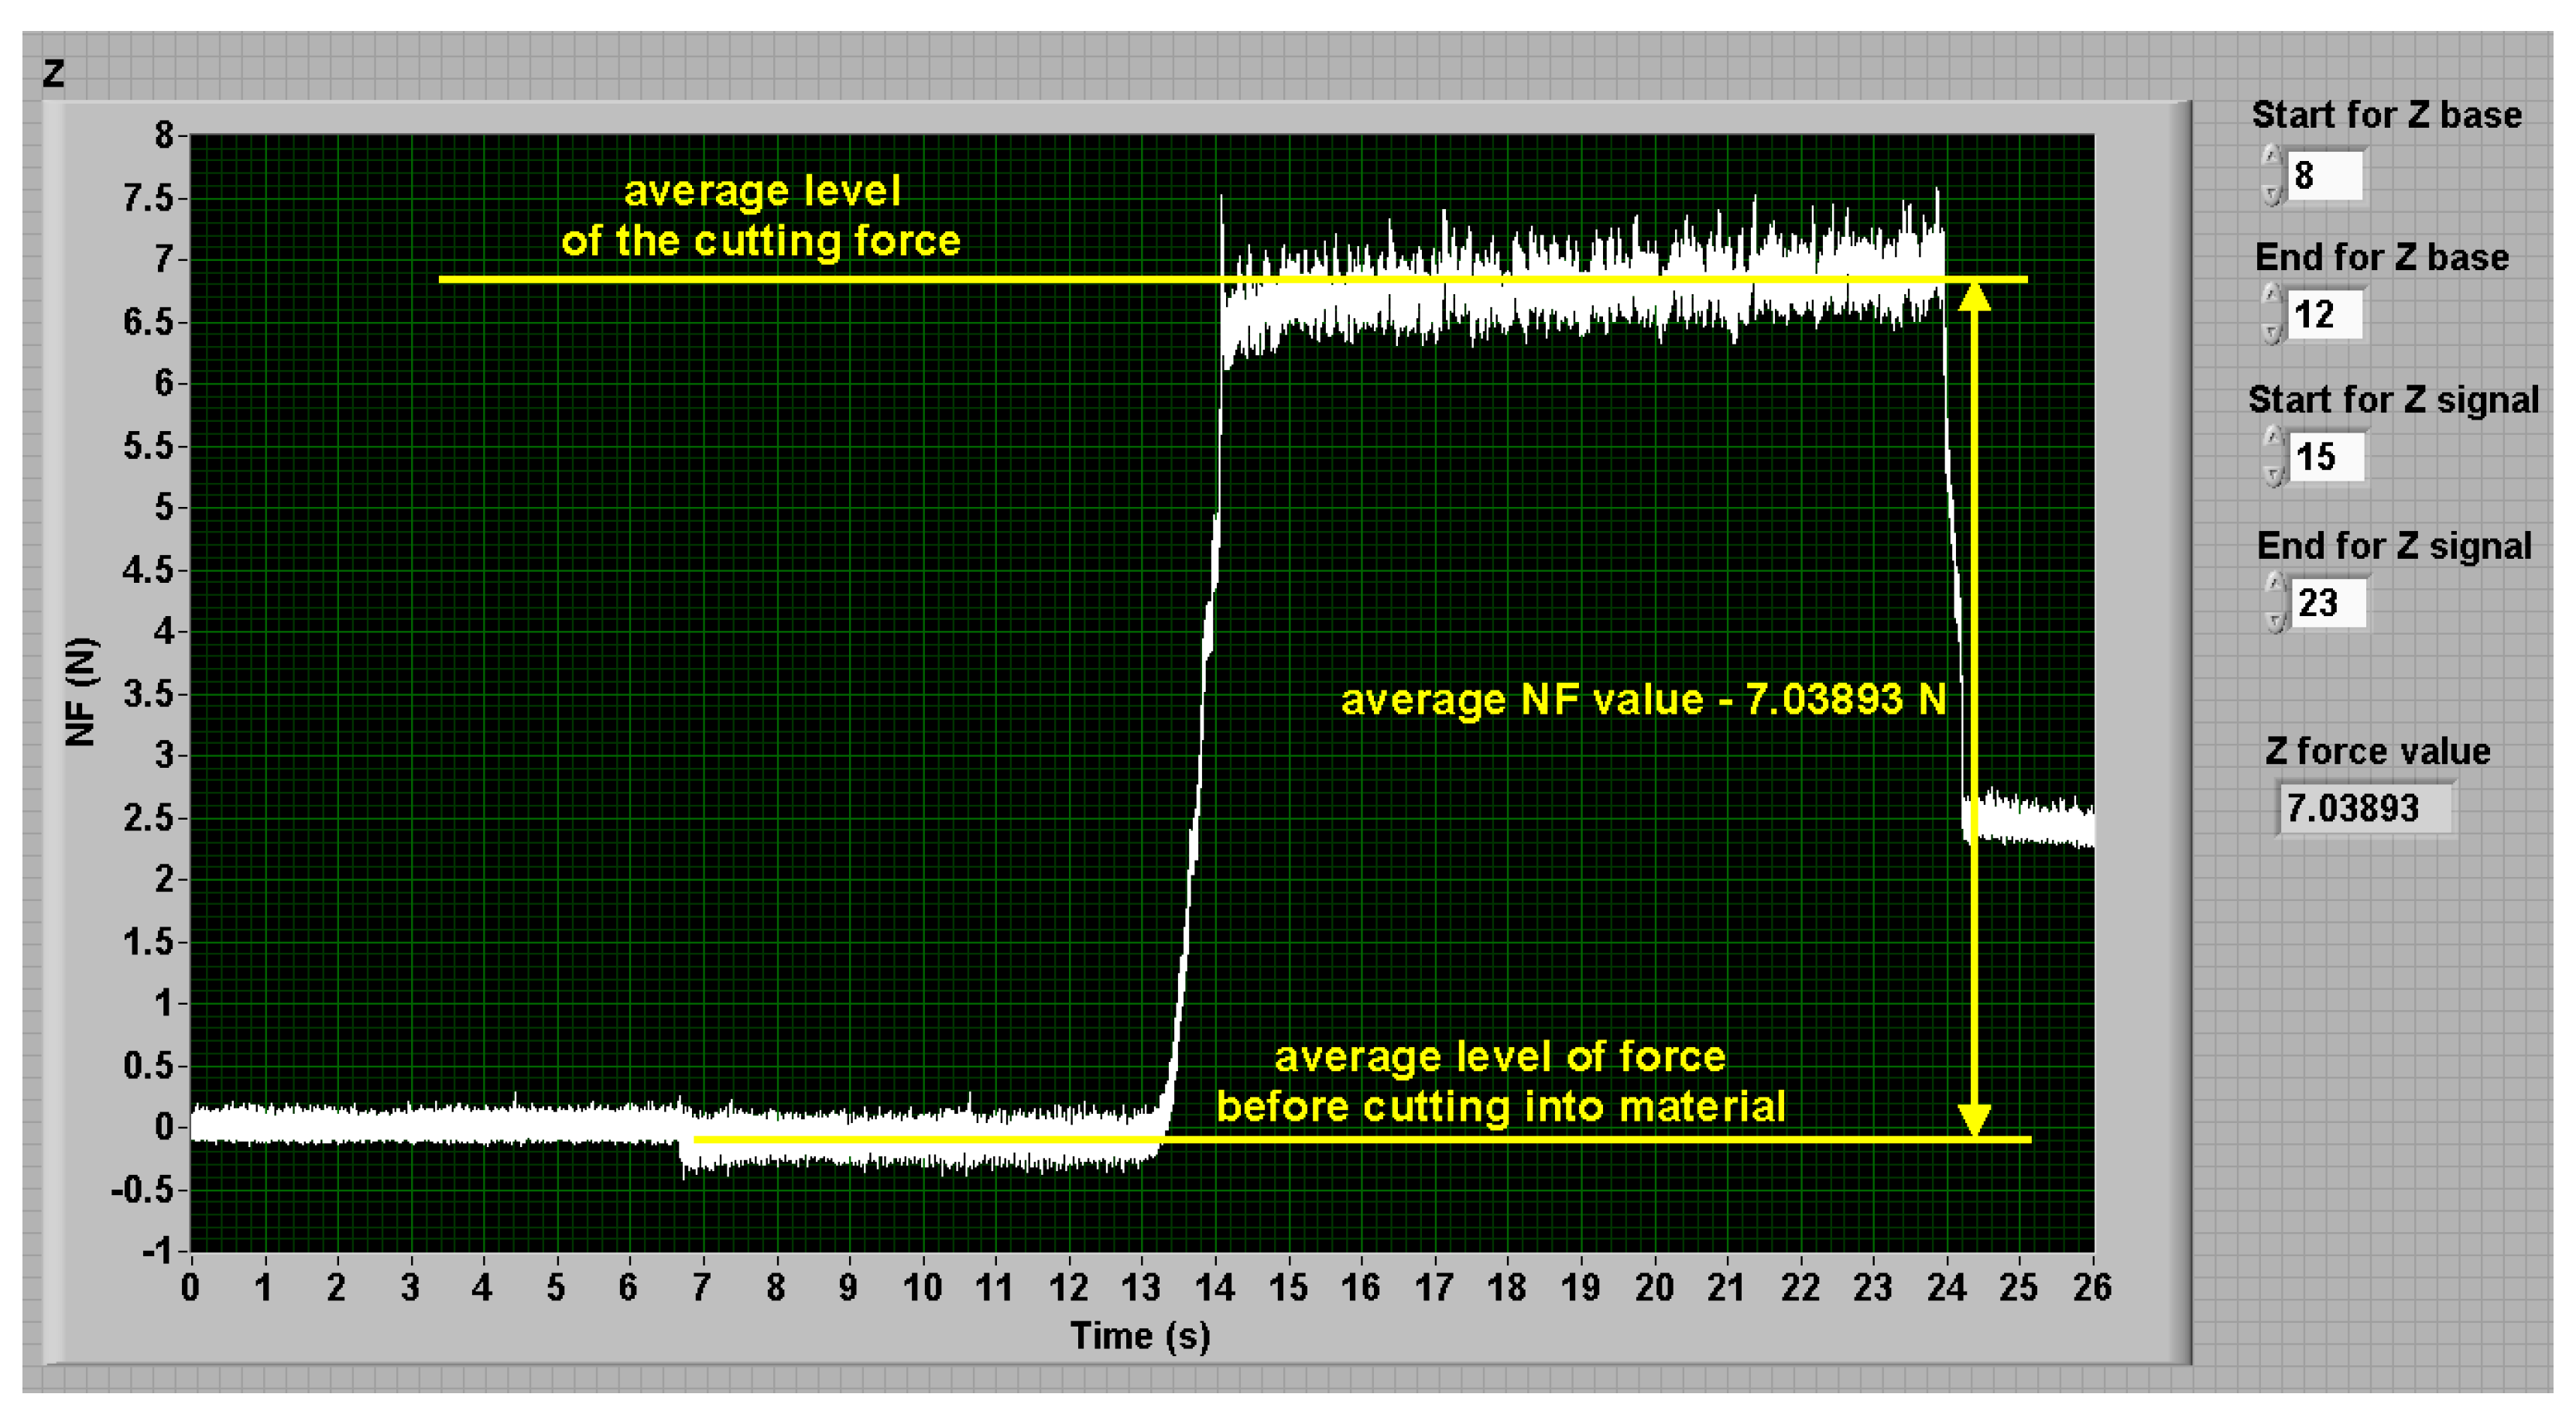
3.2. Force Signals Acquisition and Processing
3.3. The Cutting Machines Used for Research
4. Experimental Plan and Results
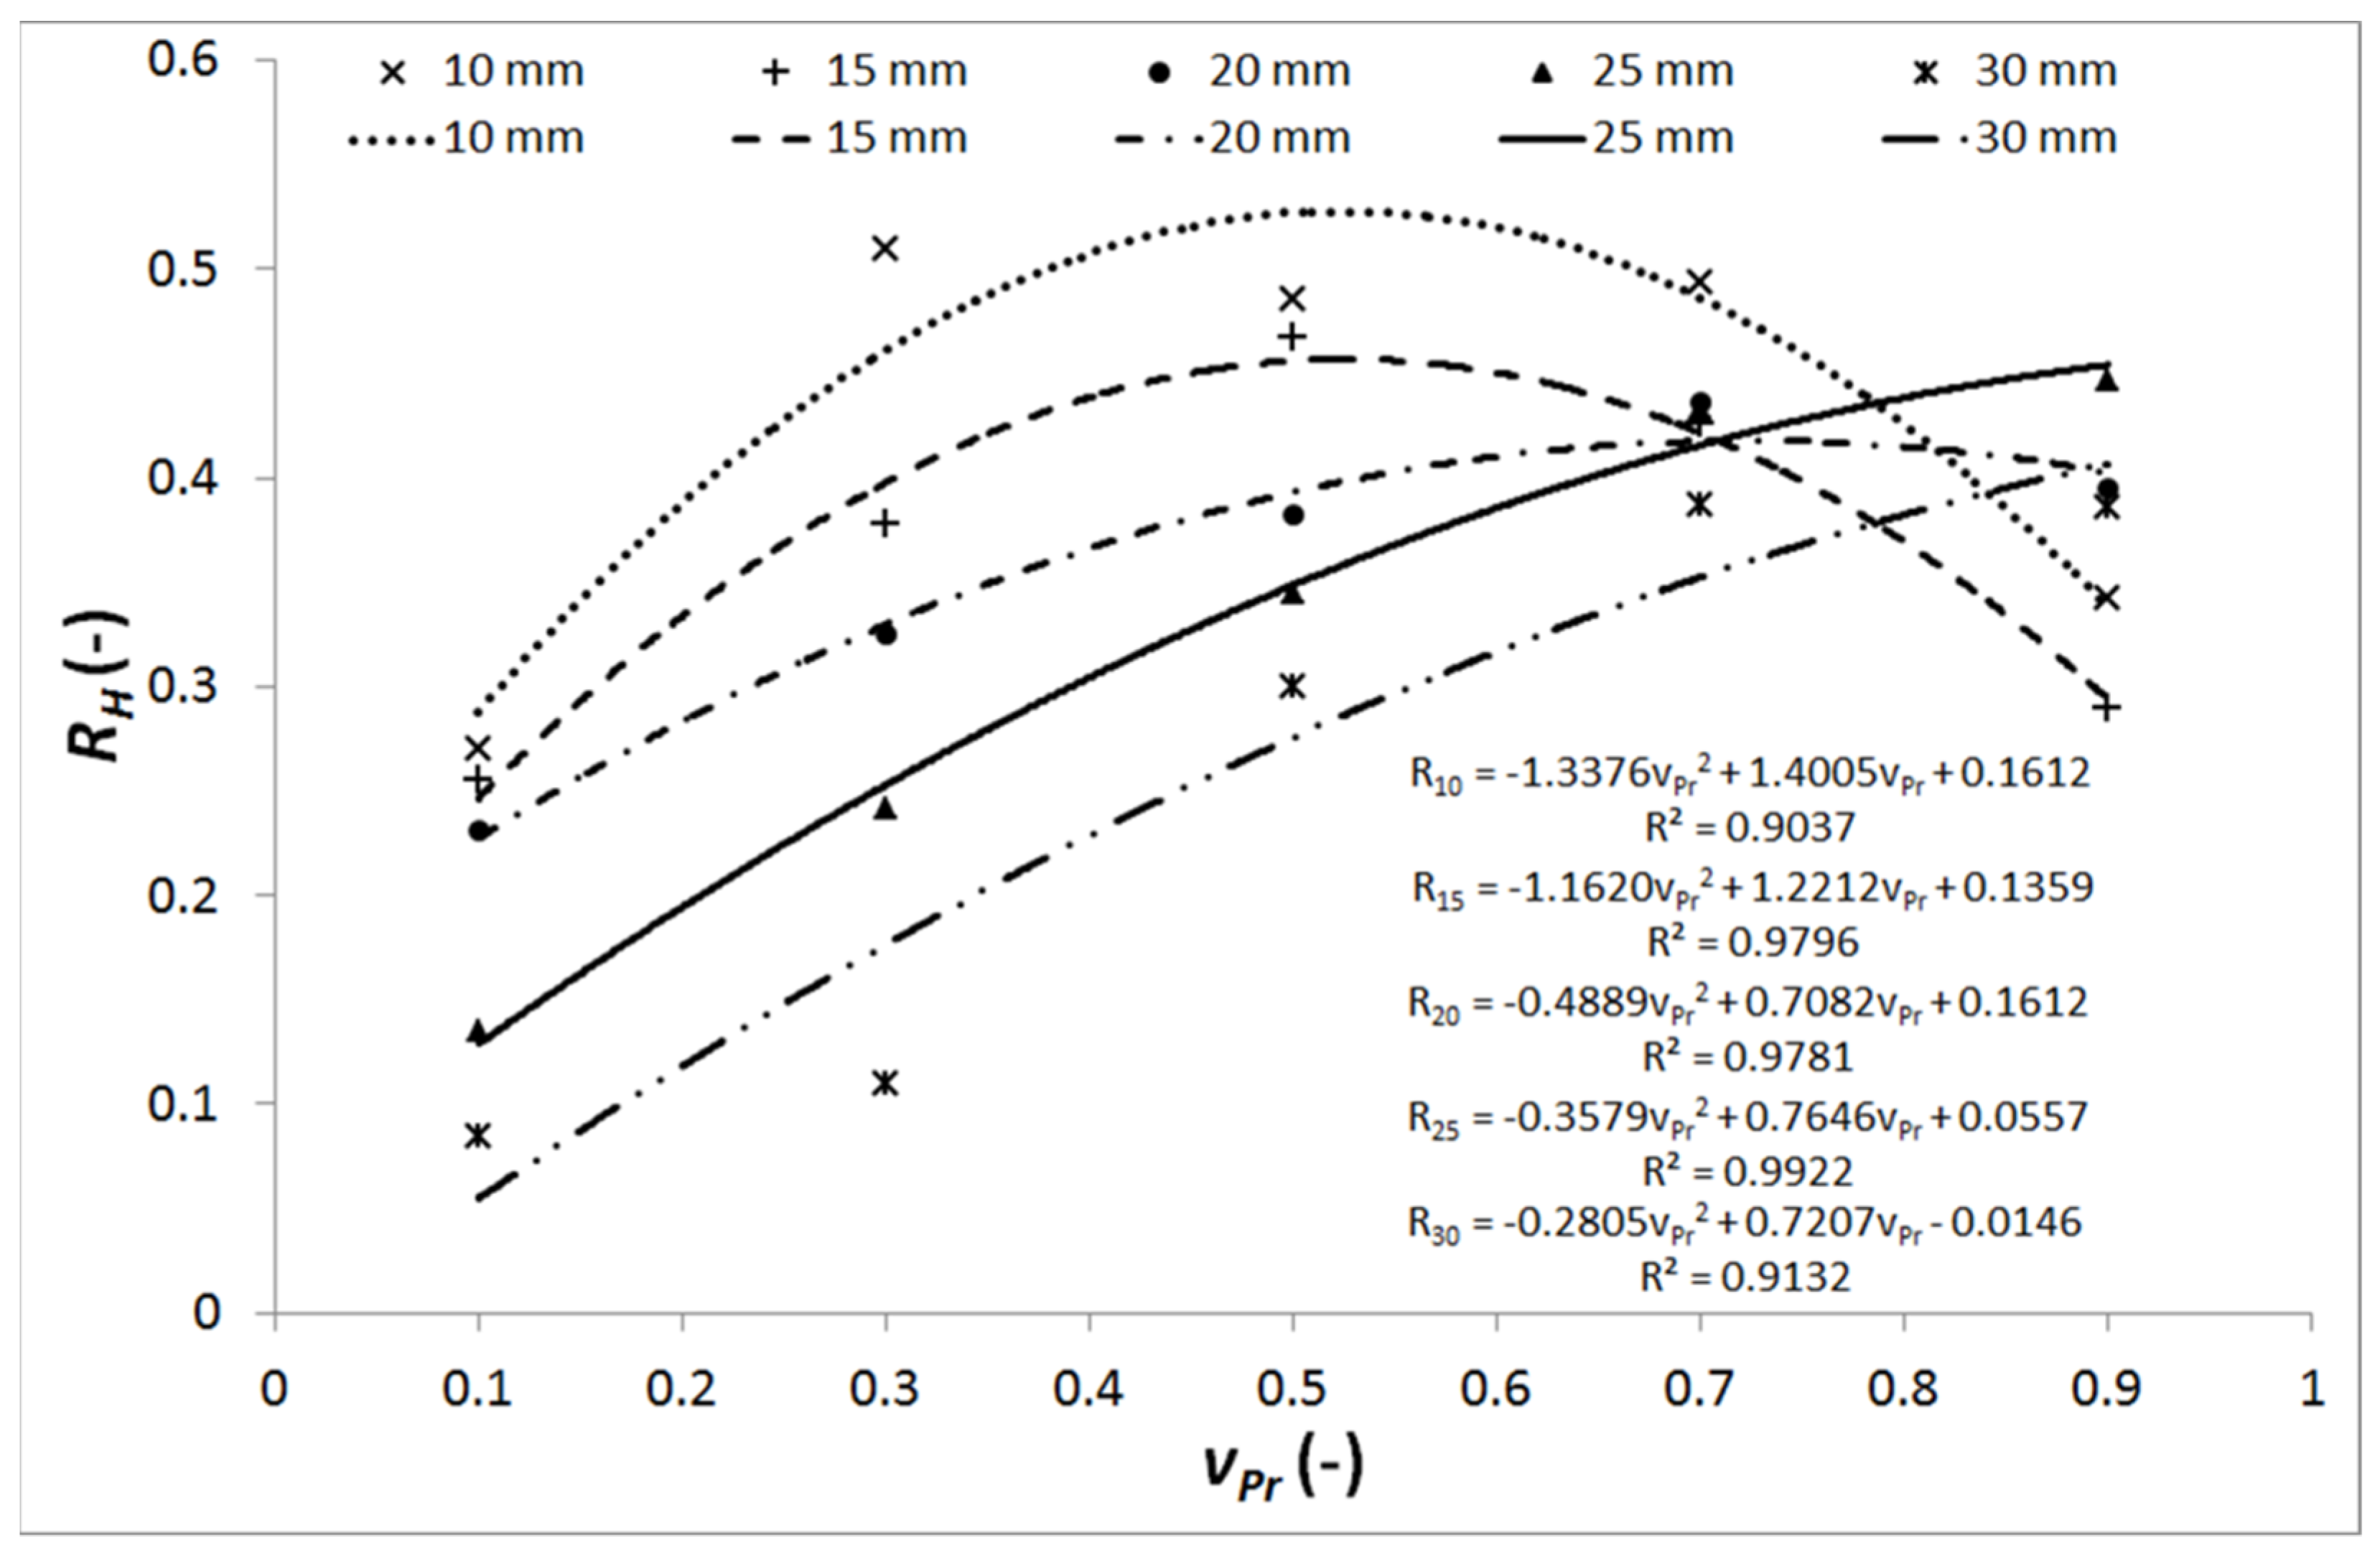
4.1. Link between the TNR and the Traverse Speed Ratio
4.2. Link between the TNR and the Type of Wear
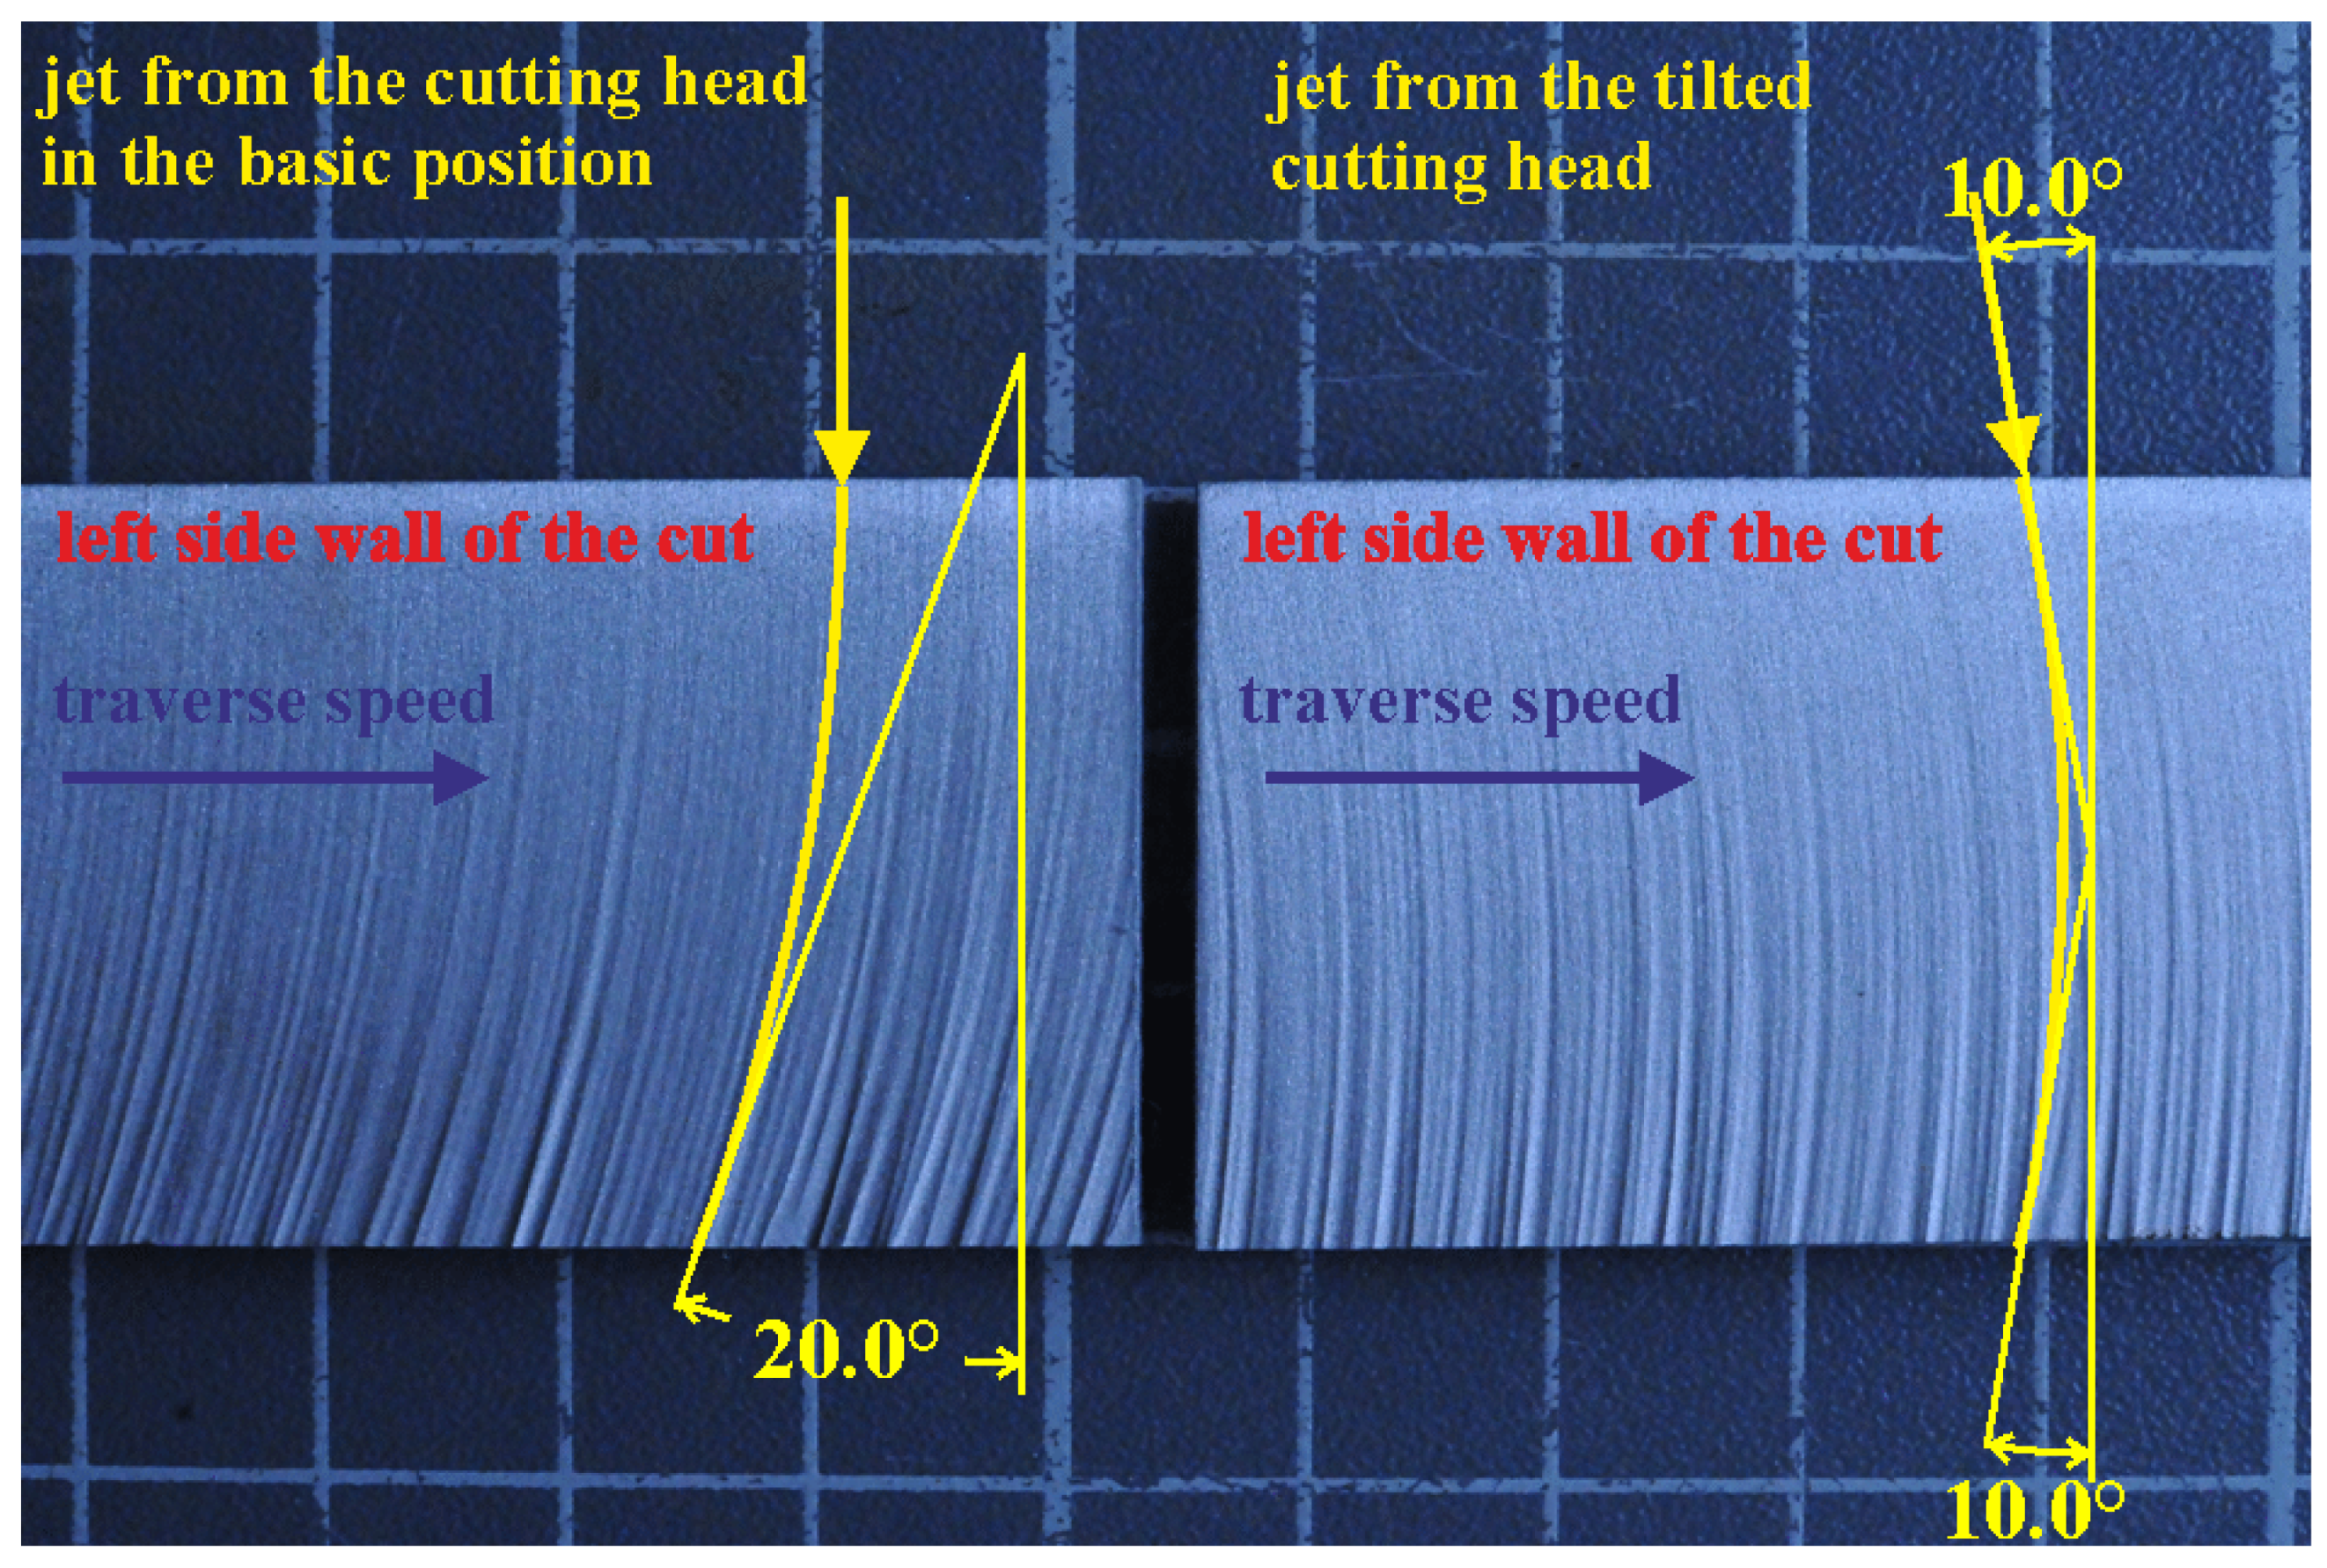
4.3. Link between the Cutting Head Tilting and the TNR/CDR
5. Discussion of Results
5.1. Discussion on the Link between the TNR and the Actual-to-Limit Traverse Speed Ratio
5.2. Discussion on the Link between the TNR and the CDR
5.3. Discussion on the Link between the TNR and the CDR for Tilted Cutting Head
6. Conclusions
- The CDR decreases by increasing the (which means increasing the declination angle at the kerf bottom);
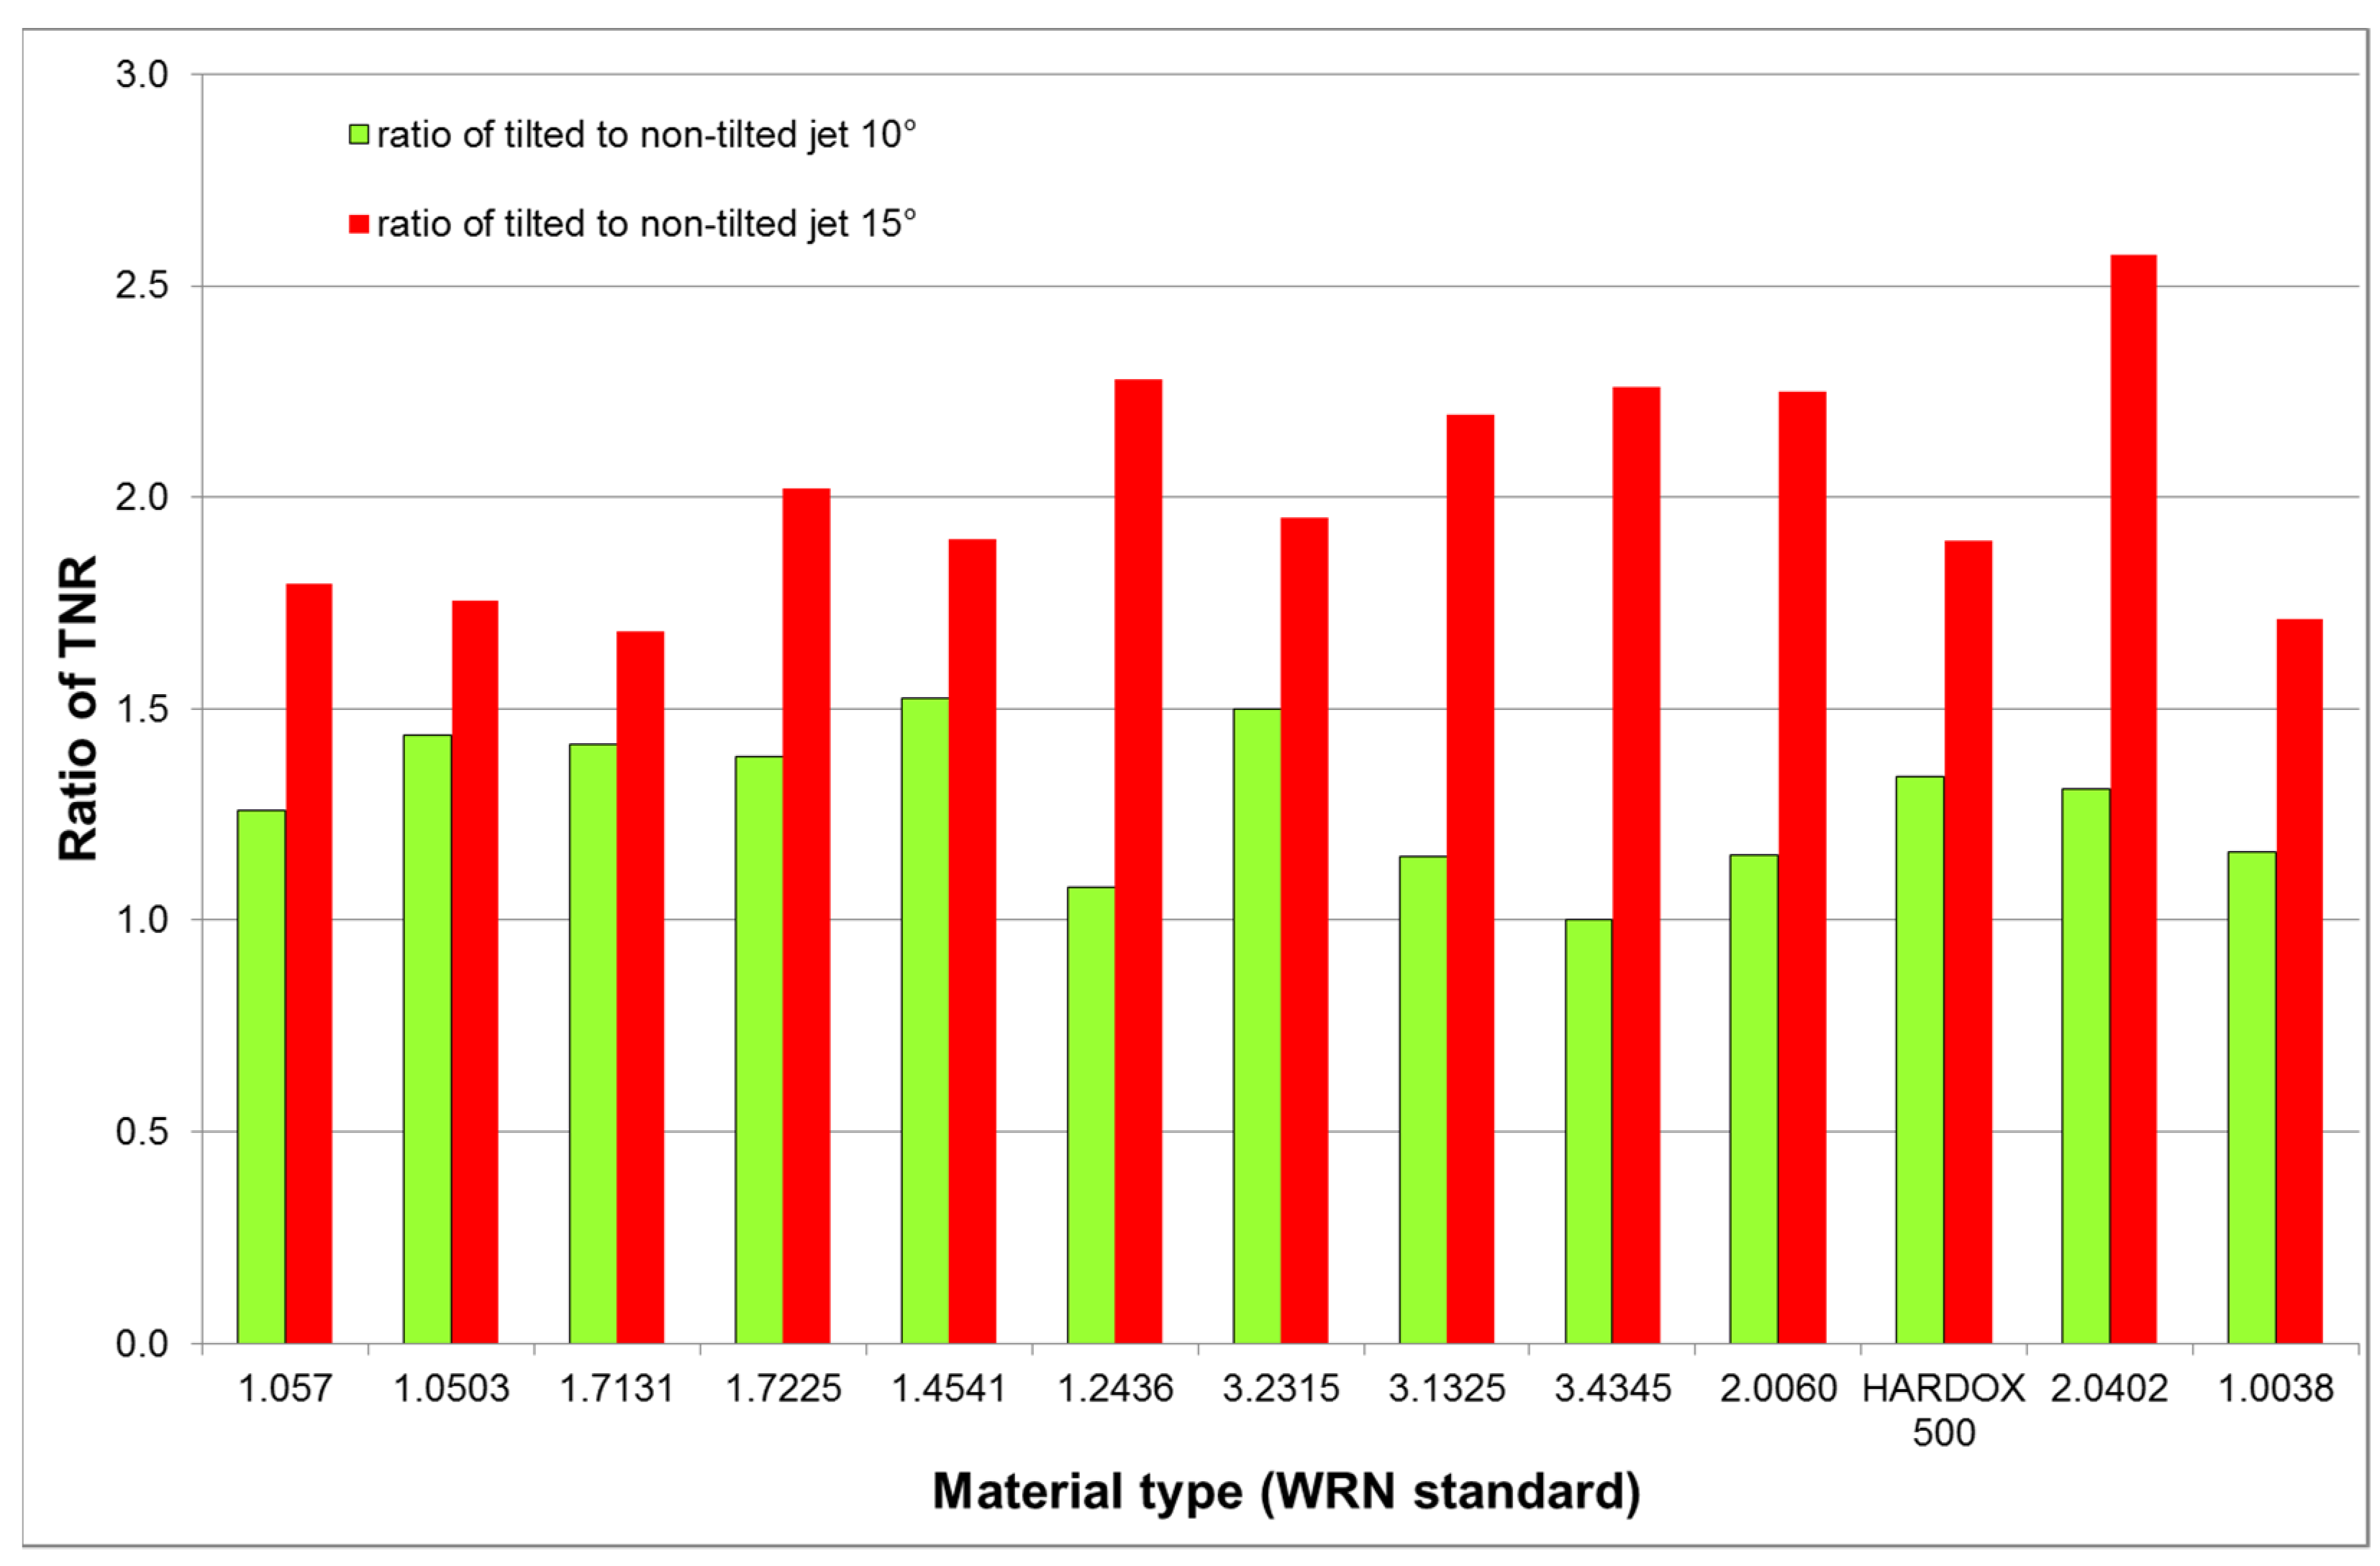
- The jet axis tilting towards the direction induces a TNR increase being more extent for less brittle metals like aluminum, copper and their alloys;
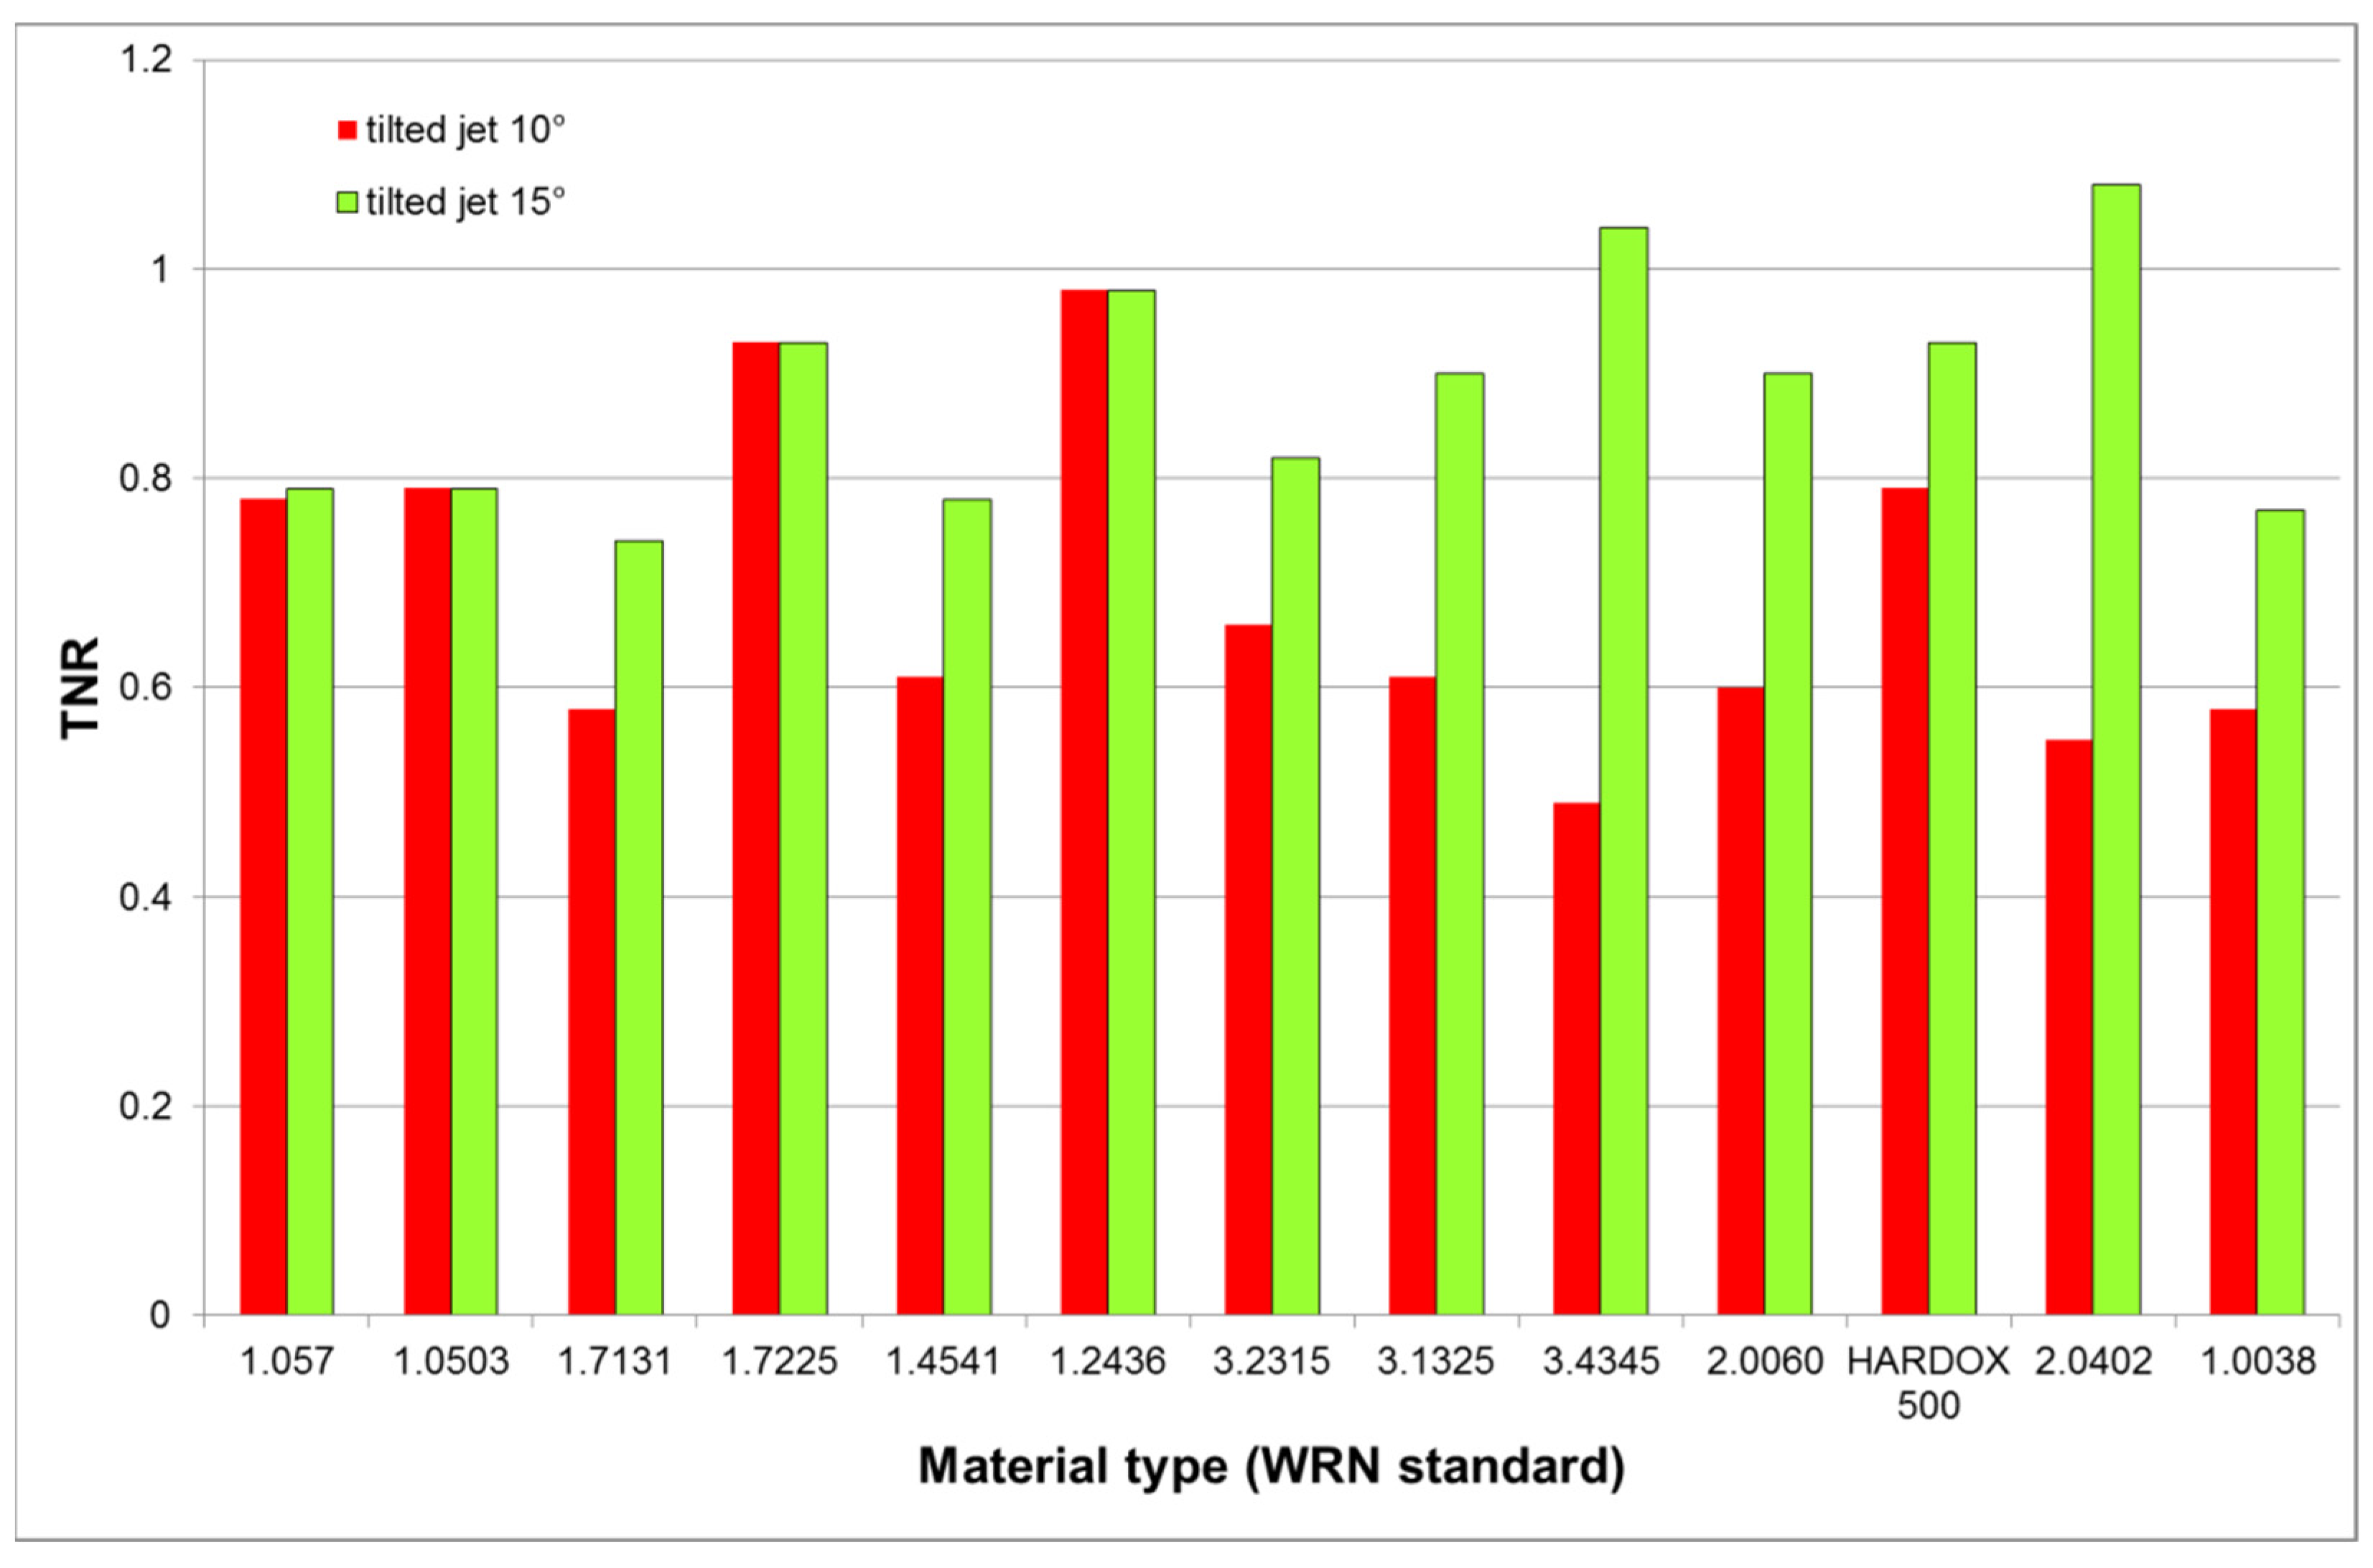
- The tilting angle increase from 10° to 15° changes the average TNR from 0.69 ± 0.14 to 0.88 ± 0.10, i.e., by 27.5%;
- As the increases from the value producing the bottom declination angle of 20° to the value producing the bottom declination angle of 30°, together with their respective cutting head tilting angles of 10° and 15°, the tilted-to-non-tilted force ratio increases from 1.28 ± 0.16 to 2.02 ± 0.25, i.e., by 57.8%.
Author Contributions
Funding
Institutional Review Board Statement
Informed Consent Statement
Data Availability Statement
Acknowledgments
Conflicts of Interest
References
- Natarajan, Y.; Murugesan, P.K.; Mohan, M.; Liyakath Ali Khan, S.A. Abrasive Water Jet Machining process: A state of art of review. J. Mater. Process. 2020, 49, 271–322. [Google Scholar] [CrossRef]
- Axinte, D.A.; Karpuschewski, B.; Kong, M.C.; Beaucamp, A.T.; Anwar, S.; Miller, D.; Petzel, M. High energy fluid jet machining (HEFJet-Mach): From scientific and technological advances to niche industrial applications. CIRP Ann. Manuf. Technol. 2014, 63, 751–771. [Google Scholar] [CrossRef]
- Hashish, M. A modeling study of metal-cutting with abrasive waterjets. J. Eng. Mater. Technol. ASME 1984, 106, 88–100. [Google Scholar] [CrossRef]
- Bitter, J.G.A. A study of erosion phenomena–Part I. Wear 1963, 6, 5–21. [Google Scholar] [CrossRef]
- Bitter, J.G.A. A study of erosion phenomena–Part II. Wear 1963, 6, 169–190. [Google Scholar] [CrossRef]
- Finnie, I.; Wolak, J.; Kabil, Y. Erosion of metals by solid particles. J. Mater. 1967, 2, 682–700. [Google Scholar]
- Paul, S.; Hoogstrate, A.M.; van Luttervelt, C.A.; Kals, H.J.J. Analytical and Experimental Modeling of Abrasive Water Jet Cutting of Ductile Materials. J. Mater. Process. Technol. 1998, 73, 189–199. [Google Scholar] [CrossRef]
- Srinivas, S.; Babu, N.R. An analytical model for predicting depth of cut in abrasive waterjet cutting of ductile materials considering the deflection of jet in lateral direction. Int. J. Abrasive Technol. 2009, 2, 259–278. [Google Scholar] [CrossRef]
- Zeng, J.; Kim, T.J. An erosion model of polycrystalline ceramics in abrasive waterjet cutting. Wear 1996, 193, 207–217. [Google Scholar] [CrossRef]
- Paul, S.; Hoogstrate, A.M.; van Luttervelt, C.A.; Kals, H.J.J. Analytical Modeling of the Total Depth of Cut in Abrasive Water Jet Machining of Polycrystalline Brittle Materials. J. Mater. Process. Technol. 1998, 73, 206–212. [Google Scholar] [CrossRef]
- Shanmugam, D.K.; Wang, J.; Liu, H. Minimisation of kerf tapers in abrasive waterjet machining of alumina ceramics using a compensation technique. Int. J. Mach. Tools Manu. 2008, 48, 1527–1534. [Google Scholar] [CrossRef]
- Srinivasu, D.S.; Axinte, D.A.; Shipway, P.H.; Folkes, J. Influence of kinematic operating parameters on kerf geometry in abrasive waterjet machining of silicon carbide ceramics. Int. J. Mach. Tools Manu. 2009, 49, 1077–1088. [Google Scholar] [CrossRef]
- Hlaváč, L.M. JETCUT-software for prediction of high-energy waterjet efficiency. In Proceedings of the 14th International Conference on Jetting Technology, Brugge, Belgium, 21–23 September 1998; Louis, H., Ed.; Professional Engineering Publishing Ltd.: London, UK, 1998; pp. 25–37. [Google Scholar]
- Hlaváč, L.M. Investigation of the abrasive water jet trajectory curvature inside the kerf. J. Mater. Process. Technol. 2009, 209, 4154–4161. [Google Scholar] [CrossRef]
- Hlaváč, L.M.; Strnadel, B.; Kaličinský, J.; Gembalová, L. The model of product distortion in AWJ cutting. Int. J. Adv. Manuf. Technol. 2012, 62, 157–166. [Google Scholar] [CrossRef]
- Chen, F.L.; Wang, J.; Lemma, E.; Siores, E. Striation formation mechanisms on the jet cutting surface. J. Mater. Process. Technol. 2003, 141, 213–218. [Google Scholar] [CrossRef]
- Deam, R.T.; Lemma, E.; Ahmed, D.H. Modelling of the abrasive water jet cutting process. Wear 2004, 257, 877–891. [Google Scholar] [CrossRef]
- Fowler, G.; Shipway, P.H.; Pashby, I.R. Abrasive water-jet controlled depth milling of Ti6Al4V alloy-an investigation of the role of jet-workpiece traverse speed and abrasive grit size on the characteristics of the milled material. J. Mater. Process. Technol. 2005, 161, 407–414. [Google Scholar] [CrossRef]
- Cénaç, F.; Zitoune, R.; Collombet, F.; Deleris, M. Abrasive water-jet milling of aeronautic aluminum 2024-T3. Proc. Inst. Mech. Eng. Pt. L J. Mater. Des. Appl. 2015, 229, 29–37. [Google Scholar]
- Rabani, A.; Madariaga, J.; Bouvier, C.; Axinte, D. An approach for using iterative learning for controlling the jet penetration depth in abrasive waterjet milling. J. Manuf. Process. 2016, 22, 99–107. [Google Scholar] [CrossRef]
- Yuan, Y.; Chen, J.; Gao, H.; Wang, X. An investigation into the abrasive waterjet milling circular pocket on titanium alloy. Int. J. Adv. Manuf. Technol. 2020, 107, 4503–4515. [Google Scholar] [CrossRef]
- Zohourkari, I.; Zohoor, M.; Annoni, M. Investigation of the effects of machining parameters on material removal rate in abrasive waterjet turning. Adv. Mech. Eng. 2014, 624203. [Google Scholar] [CrossRef]
- Schwartzentruber, J.; Papini, M. Abrasive waterjet micro-piercing of borosilicate glass. J. Mater. Process. Technol. 2015, 219, 143–154. [Google Scholar] [CrossRef]
- ShivajiRao, M.; Satyanarayana, S. Abrasive water jet drilling of float glass and characterization of hole profile. Glass Struct. Eng. 2020, 5, 155–169. [Google Scholar] [CrossRef]
- Liang, Z.W.; Xie, B.H.; Liao, S.P.; Zhou, J.H. Concentration degree prediction of AWJ grinding effectiveness based on turbulence characteristics and the improved ANFIS. Int. J. Adv. Manuf. Technol. 2015, 80, 887–905. [Google Scholar] [CrossRef]
- Loc, P.H.; Shiou, F.J. Abrasive water jet polishing on Zr-based bulk metallic glass. In Advanced Materials Research; Lin, Z.C., Huang, Y.M., Chen, C.C.A., Chen, L.K., Eds.; Trans Tech Publications Ltd.: Bäch, Switzerland, 2012; Volume 579, pp. 211–218. [Google Scholar]
- Che, C.L.; Huang, C.Z.; Wang, J.; Zhu, H.T.; Li, Q.L. Theoretical model of surface roughness for polishing super hard materials with Abrasive Waterjet. In Advances in Machining and Manufacturing Technology IX; Key Engineering Materials; Yao, Y., Xu, X., Zuo, D., Eds.; Trans Tech Publications Ltd.: Bäch, Switzerland, 2008; Volume 375–376, pp. 465–469. [Google Scholar]
- Martinec, P. Mineralogical properties of abrasive minerals and their role in water jet cutting process. In Proceedings of the International Conference Geomechanics’91, Hradec/Ostrava, Czechoslovakia, 24–26 September 1991; Rakowski, Z., Ed.; Balkema: Rotterdam, the Netherlands, 1992; pp. 353–362. [Google Scholar]
- Hlaváč, L.M.; Martinec, P. Almandine garnets as abrasive material in high-energy waterjet-physical modelling of interaction, experiment and prediction. In Proceedings of the 14th International Conference on Jetting Technology, Brugge, Belgium, 21–23 September 1998; Louis, H., Ed.; Professional Engineering Publishing Ltd.: London, UK, 1998; pp. 211–223. [Google Scholar]
- Fowler, G.; Pashby, I.R.; Shipway, P.H. The effect of particle hardness and shape when abrasive water jet milling of titanium alloy Ti6Al4V. Wear 2009, 266, 613–620. [Google Scholar] [CrossRef]
- Aydin, G. Recycling of abrasives in abrasive water jet cutting with different types of granite. Arab. J. Geosci. 2014, 7, 4425–4435. [Google Scholar] [CrossRef]
- Aydin, G. Performance of recycling abrasives in rock cutting by abrasive water jet. J. Cent. South. Univ. 2015, 22, 1055–1061. [Google Scholar] [CrossRef]
- Hlaváčová, I.M.; Geryk, V. Abrasives for water-jet cutting of high-strength and thick hard materials. Int. J. Adv. Manuf. Technol. 2017, 90, 1217–1224. [Google Scholar] [CrossRef]
- Karakurt, I.; Aydin, G.; Aydiner, K. An investigation on the kerf width in abrasive waterjet cutting of granitic rocks. Arab. J. Geosci. 2014, 7, 2923–2932. [Google Scholar] [CrossRef]
- Zhang, S.J.; Wu, Y.Q.; Wang, S. An exploration of an abrasive water jet cutting front profile. Int. J. Adv. Manuf. Technol. 2015, 80, 1685–1688. [Google Scholar] [CrossRef]
- Wu, Y.Q.; Zhang, S.J.; Wang, S.; Yang, F.L.; Tao, H. Method of obtaining accurate jet lag information in abrasive water-jet machining process. Int. J. Adv. Manuf. Technol. 2015, 76, 1827–1835. [Google Scholar] [CrossRef]
- Hlaváč, L.M.; Hlaváčová, I.M.; Gembalová, L.; Jonšta, P. Experimental investigation of depth dependent kerf width in abrasive water cutting. In Proceedings of the 20th International Conference on Water Jetting, Graz, Austria, 20–22 October 2010; Trieb, F.H., Ed.; BHR Group: Cranfield, UK, 2010; pp. 459–467. [Google Scholar]
- Hlaváč, L.M.; Hlaváčová, I.M.; Geryk, V.; Plančár, Š. Investigation of the taper of kerfs cut in steels by AWJ. Int. J. Adv. Manuf. Technol. 2015, 77, 1811–1818. [Google Scholar] [CrossRef]
- Hlaváč, L.M.; Hlaváčová, I.M.; Arleo, F.; Viganò, F.; Annoni, M.P.G.; Geryk, V. Shape distortion reduction method for abrasive water jet (AWJ) cutting. Precis. Eng. 2018, 53, 194–202. [Google Scholar] [CrossRef]
- Chen, M.; Zhang, S.; Zeng, J.; Chen, B.; Xue, J.; Ji, L. Correcting shape error on external corners caused by the jet cut-in/cut-out process in abrasive water jet cutting. Int. J. Adv. Manuf. Technol. 2019, 103, 849–859. [Google Scholar] [CrossRef]
- Schwartzentruber, J.; Spelt, J.K.; Papini, M. Prediction of surface roughness in abrasive waterjet trimming of fiber reinforced polymer composites. Int. J. Mach. Tools Manu. 2017, 122, 1–17. [Google Scholar] [CrossRef]
- Pahuja, R.; Ramulu, M.; Hashish, M. Surface quality and kerf width prediction in abrasive water jet machining of metal-composite stacks. Compos. Part B Eng. 2019, 175, 107134. [Google Scholar] [CrossRef]
- Singh, R.; Singh, V.; Gupta, T.V.K. An experimental study on surface roughness in slicing tungsten carbide with abrasive water jet machining. In Proceedings of the International Conference on Advances in Mechanical Engineering, ICAME 2020, Nagpur, India, 10–11 January 2020; Kalamkar, V.R., Monkova, K., Eds.; Springer: Singapore, 2021; pp. 353–359. [Google Scholar]
- Królczyk, G.M.; Królczyk, J.B.; Maruda, R.W.; Legutko, S.; Tomaszewski, M. Metrological changes in surface morphology of high-strength steels in manufacturing processes. Measurement 2016, 88, 176–185. [Google Scholar] [CrossRef]
- Rabani, A.; Marinescu, I.; Axinte, D. Acoustic emission energy transfer rate: A method for monitoring abrasive water jet milling. Int. J. Mach. Tools Manu. 2012, 61, 80–89. [Google Scholar] [CrossRef]
- Hloch, S.; Ruggiero, A. Online monitoring and analysis of hydroabrasive cutting by vibration. Adv. Mech. Eng. 2013, 894561. [Google Scholar] [CrossRef]
- Fabian, S.; Salokyová, Š. AWJ cutting: The technological head vibrations with different abrasive mass flow rates. Appl. Mech. Mater. 2013, 308, 1–6. [Google Scholar] [CrossRef]
- Salokyová, Š. Measurement and analysis of technological head vibrations in hydro-abrasive cutting technology. Acad. J. Manuf. Eng. 2014, 12, 90–95. [Google Scholar]
- Salokyová, Š. Measurement and analysis of mass flow and feed speed impact on technological head vibrations during cutting abrasion resistant steels with abrasive water jet technology. Key Eng. Mater. 2016, 669, 243–250. [Google Scholar] [CrossRef]
- Mikler, J. On use of acoustic emission in monitoring of under and over abrasion during a water jet milling process. J. Mach. Eng. 2014, 142, 104–115. [Google Scholar]
- Vala, M. The measurement of the non-setting parameters of the high pressure water jets. In Geomechanics 93; Rakowski, Z., Ed.; Balkema: Rotterdam, The Netherlands, 1994; pp. 333–336. [Google Scholar]
- Sitek, L.; Vala, M.; Vašek, J. Investigation of high pressure water jet behaviour using jet/target interaction. In Proceedings of the 12th International Conference on Jet Cutting Technology, Rouen, France, 25–27 October 1994; Allen, N.G., Ed.; Mechanical Engineering Publishing Ltd.: London, UK, 1994; pp. 59–66. [Google Scholar]
- Foldyna, J.; Sitek, L.; Švehla, B.; Švehla, T. Utilization of ultrasound to enhance high-speed water jet effects. Ultrason. Sonochem. 2004, 11, 131–137. [Google Scholar] [CrossRef] [PubMed]
- Fuchs, E.; Köhler, H.; Majschak, J.-P. Measurement of the impact force and pressure of water jets under the influence of jet break-up. Chemie-Ingenieur-Technik 2019, 91, 455–466. [Google Scholar] [CrossRef]
- Li, H.Y.; Geskin, E.S.; Chen, W.L. Investigation of forces exerted by an abrasive water jet on workpiece. In Proceedings of the 5th American Water Jet Conference, Toronto, ON, Canada, 29–31 August 1989; Vijay, M.M., Savanick, G.A., Eds.; National Research Council of Canada: Ottawa, ON, Canada; U.S. Water Jet Technology Association: St. Louis, MS, USA, 1989; pp. 69–77. [Google Scholar]
- Momber, A.W. Energy transfer during the mixing of air and solid particles into a high-speed waterjet: An impact-force study. Exp. Therm. Fluid Sci. 2001, 25, 31–41. [Google Scholar] [CrossRef]
- Orbanic, H.; Junkar, M.; Bajsic, I.; Lebar, A. An instrument for measuring abrasive water jet diameter. Int. J. Mach. Tools Manu. 2009, 49, 843–849. [Google Scholar] [CrossRef]
- Kliuev, M.; Pude, F.; Stirnimann, J.; Wegener, K. Measurement of the effective waterjet diameter by means of force signals. In Proceedings of the Advances in Water Jetting—Water Jet 2019, Čeladná, Czech Republic, 20–22 November 2019; Klichová, D., Sitek, L., Hloch, S., Valentinčič, J., Eds.; Lecture Notes in Mechanical Engineering; Springer: Cham, Switzerland, 2021; pp. 15–27. [Google Scholar]
- Hlaváčová, I.M.; Vondra, A. Future in marine fire-fighting: High pressure water mist extinguisher with abrasive water jet cutting. Nase More 2016, 63, 102–107. [Google Scholar] [CrossRef]
- Mádr, V.; Lupták, M.; Hlaváč, L. Force Sensor and Method of Force Sensing in the Process of Abrasive Water Jet. Cutting. Patent No. CZ 303189, 5 April 2012. [Google Scholar]
- Štefek, A.; Hlaváč, L.M.; Tyč, M.; Barták, P.; Kozelský, J. Remarks to abrasive waterjet (AWJ) forces measurements. In Proceedings of the Advances in Water Jetting-Water Jet 2019, Čeladná, Czech Republic, 20–22 November 2019; Klichová, D., Sitek, L., Hloch, S., Valentinčič, J., Eds.; Lecture Notes in Mechanical Engineering; Springer: Cham, Switzerland, 2021; pp. 208–218. [Google Scholar]
- Hlaváč, L.M.; Štefek, A.; Tyč, M.; Krajcarz, D. Influence of material structure on forces measured during abrasive waterjet (AWJ) machining. Materials 2020, 13, 3878. [Google Scholar] [CrossRef]
- Hlaváč, L.M.; Bańkowski, D.; Krajcarz, D.; Štefek, A.; Tyč, M.; Młynarczyk, P. Abrasive waterjet (AWJ) forces—Indicator of cutting system malfunction. Materials 2021, 14, 1683. [Google Scholar] [CrossRef]
- Strnadel, B.; Hlaváč, L.M.; Gembalová, L. Effect of steel structure on the declination angle in AWJ cutting. Int. J. Mach. Tools Manuf. 2013, 64, 12–19. [Google Scholar] [CrossRef]
- Sutowski, P.; Sutowska, M.; Kapłonek, W. The use of high-frequency acoustic emission analysis for in-process assessment of the surface quality of aluminium alloy 5251 in abrasive waterjet machining. Proc. Inst. Mech. Eng. Part B J. Eng. Manuf. 2018, 232, 2547–2565. [Google Scholar] [CrossRef]
- Sutowska, M.; Kapłonek, W.; Pimenov, D.Y.; Gupta, M.K.; Mozammel Mia, M.; Sharma, S. Influence of variable radius of cutting head trajectory on quality of cutting kerf in the abrasive water jet process for soda–lime glass. Materials 2020, 13, 4277. [Google Scholar] [CrossRef] [PubMed]


| Variable (Unit) | Ostrava (PTV WJ 1020-1Z-EKO) | Milano (Tecnocut IDRO 1740) (Intermac Primus 322) |
|---|---|---|
| Water pressure in pump (MPa) | 380 | 350 |
| Water nozzle (orifice) diameter (mm) | 0.254 | 0.330 |
| Focusing tube diameter (mm) | 1.02 | 1.02 |
| Focusing tube length (mm) | 76 | 76 |
| Abrasive mass flow (g/min) | 250 | 300 |
| Mean abrasive grain size (*) (mm) | 0.25 | 0.25 |
| Abrasive type (**) | AG | AG |
| Stand-off distance (mm) | 2 | 3 |
| Marking of Samples | ||
|---|---|---|
| WRN (DIN) Standard | mm/min | mm/min |
| 1.057 (St 52-3) steel | 250 | 325 |
| 1.0503 (C 45) steel | 200 | 260 |
| 1.7131 (16 MnCr 5) steel | 220 | 286 |
| 1.7225 (42 CrMo 4) steel | 180 | 234 |
| 1.4541 (X6 CrNiTi 18 10) steel | 200 | 260 |
| 1.2436 (X210 CrW 12) steel | 160 | 208 |
| 3.2315 (AlMgSi1Mn) duralumin | 750 | 975 |
| 3.1325 (AlCu4MgSi) duralumin | 760 | 988 |
| 3.4345 (AlZn5Mg3Cu) duralumin | 720 | 936 |
| 2.0060 (E-Cu57) copper | 380 | 494 |
| HARDOX 500 PLATE steel | 135 | 176 |
| 2.0402 (CuZn40Pb2) brass | 350 | 455 |
| 1.0038 (RSt 37-2) steel | 246 | 320 |
| Material Type | Thickness | (*) | Relative Traverse Speed | ||||
|---|---|---|---|---|---|---|---|
| WRN (DIN) Standard | mm | mm/min | 0.1 | 0.3 | 0.5 | 0.7 | 0.9 |
| 1.0038 (RSt 37) | 10 | 320 | 0.271 | 0.510 | 0.486 | 0.493 | 0.342 |
| 1.0038 (RSt 37) | 15 | 220 | 0.255 | 0.377 | 0.468 | 0.426 | 0.290 |
| 1.0038 (RSt 37) | 20 | 150 | 0.231 | 0.325 | 0.383 | 0.436 | 0.395 |
| 1.0038 (RSt 37) | 25 | 102 | 0.135 | 0.242 | 0.344 | 0.433 | 0.446 |
| 1.0038 (RSt 37) | 30 | 72 | 0.084 | 0.110 | 0.300 | 0.387 | 0.386 |
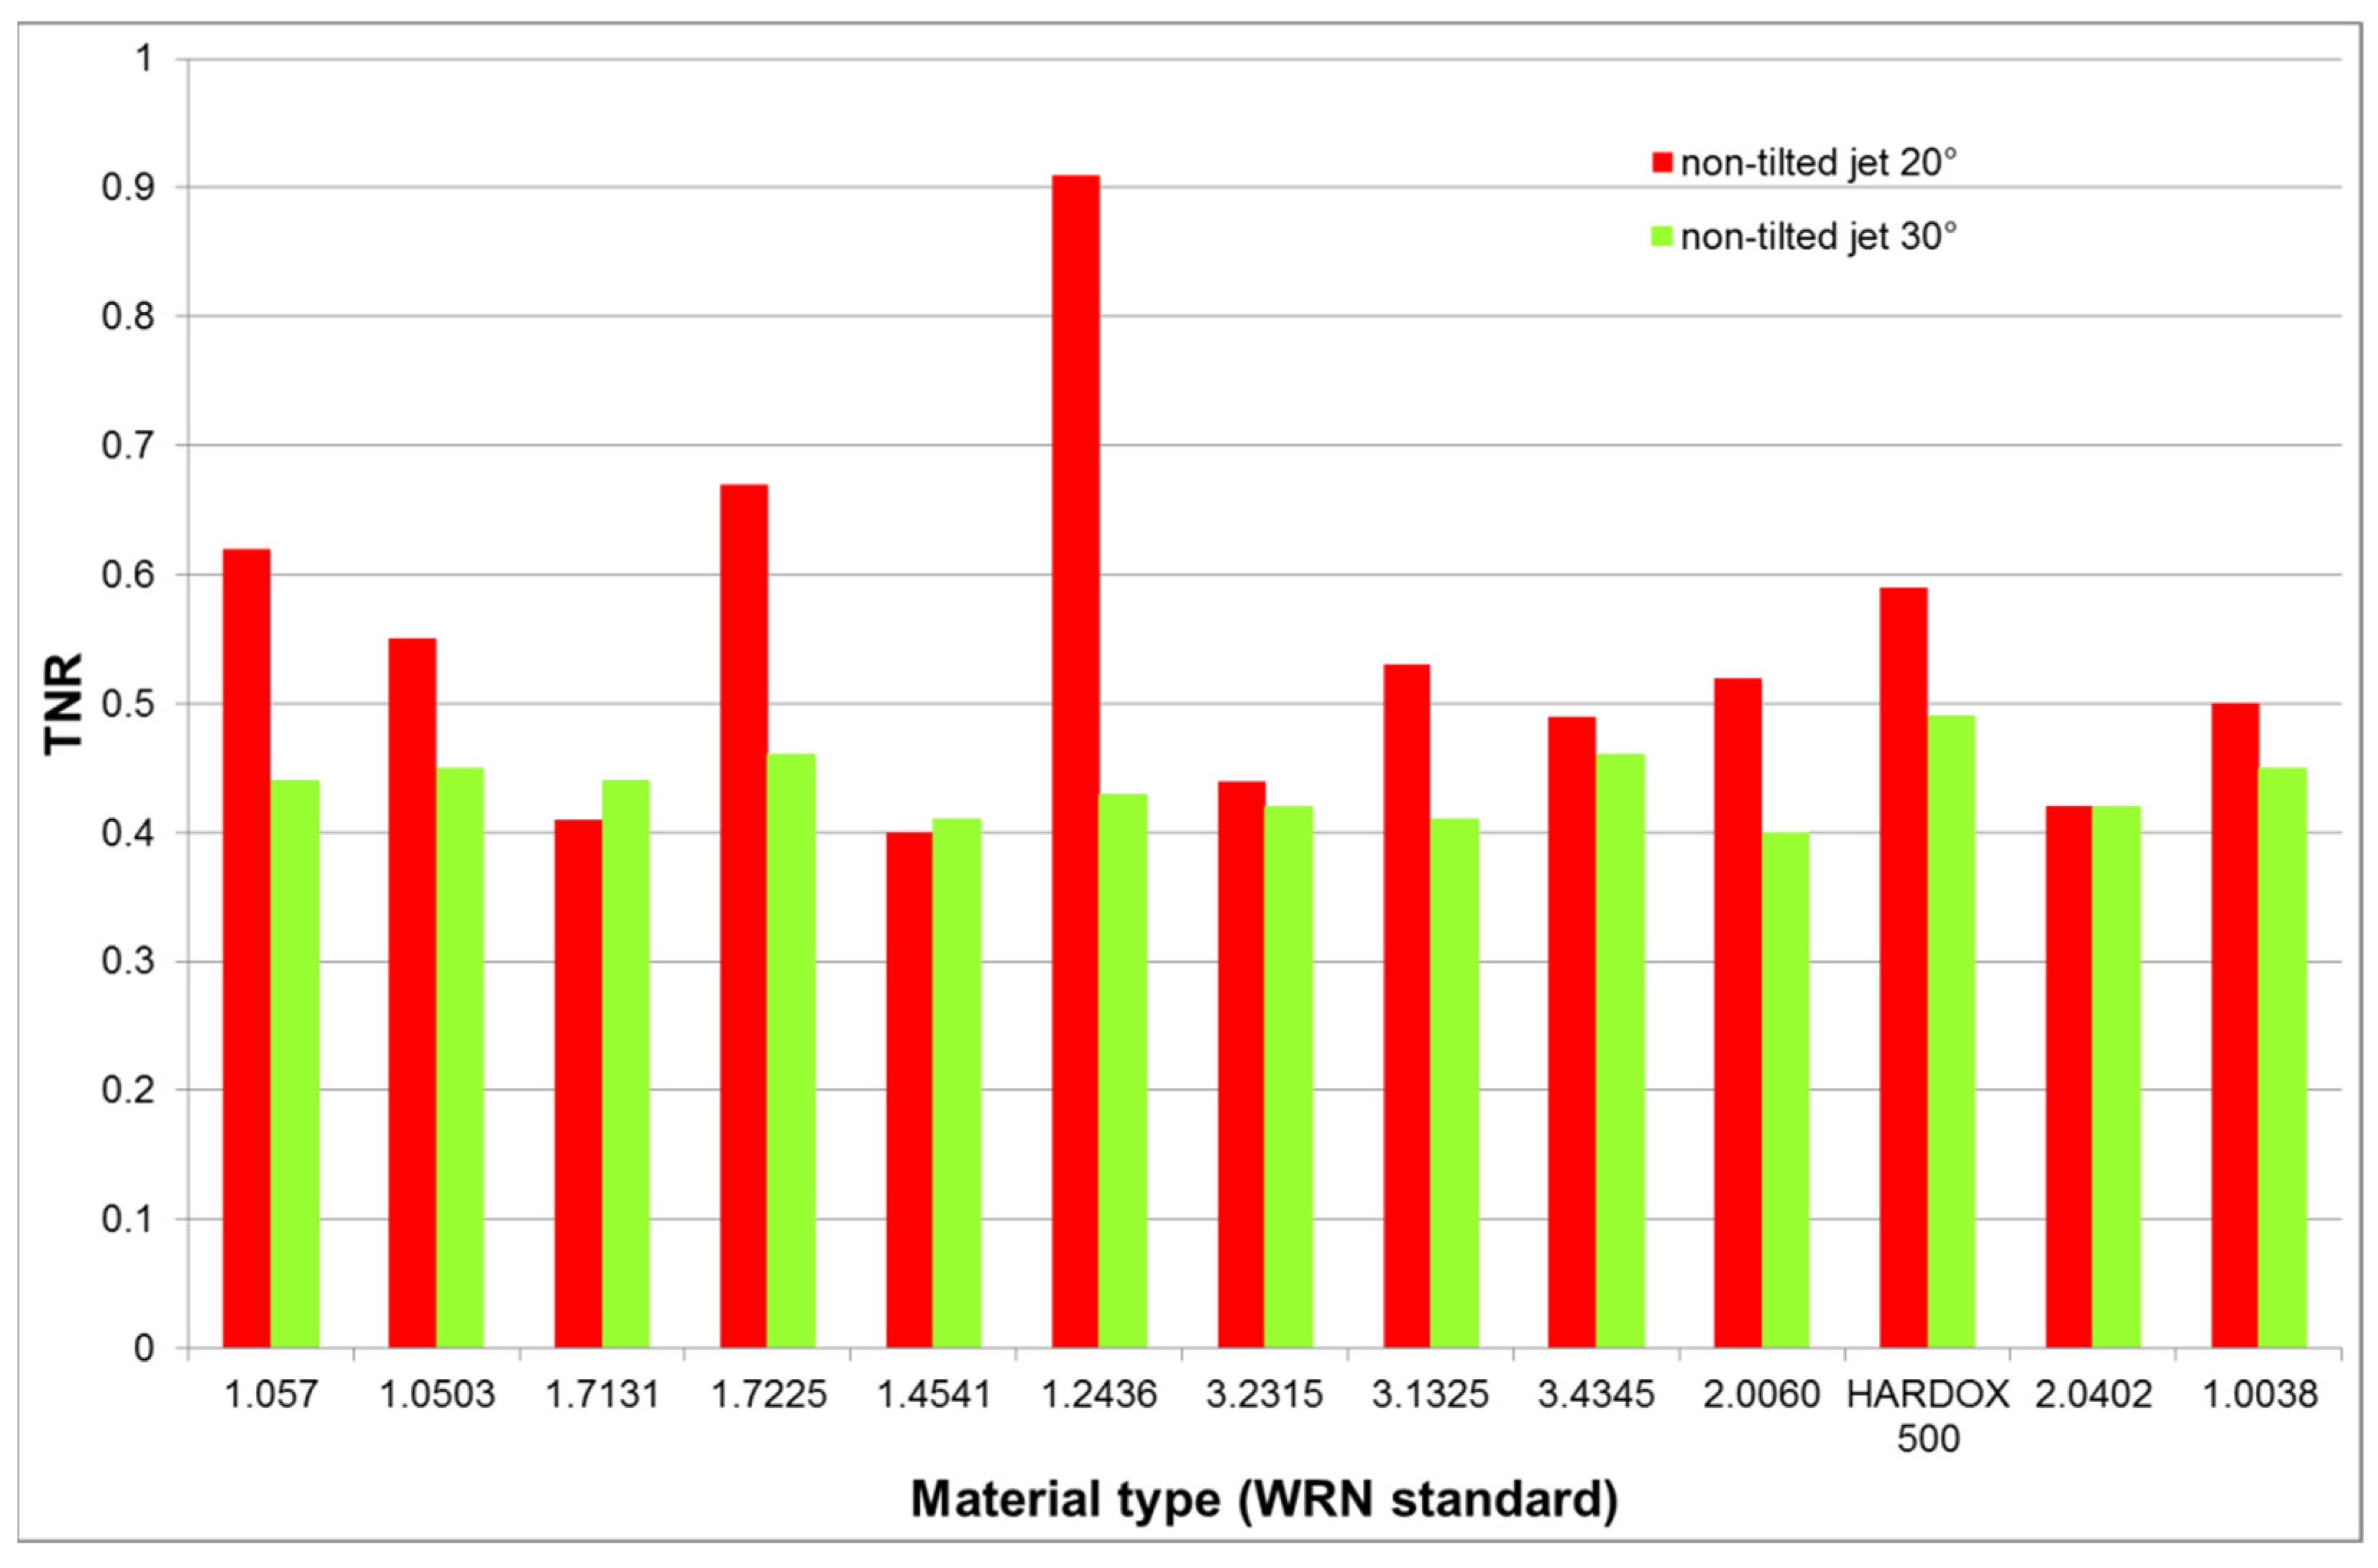
| Material Type | Declination Angle 20° | Declination Angle 30° | Ratio for | ||
|---|---|---|---|---|---|
| TNR | TNR | 20°/30° | |||
| WRN (DIN) Standard | mm/min | NT-Head (*) | mm/min | NT-Head (*) | Forces Ratios |
| 1.057 (St 52-3) | 189 | 0.62 | 248 | 0.44 | 1.43 |
| 1.0503 (C 45) | 151 | 0.55 | 198 | 0.45 | 1.22 |
| 1.7131 (16 MnCr 5) | 167 | 0.41 | 218 | 0.44 | 0.95 |
| 1.7225 (42 CrMo 4) | 136 | 0.67 | 179 | 0.46 | 1.46 |
| 1.4541 (X6 CrNiTi 18 10) | 151 | 0.40 | 198 | 0.41 | 0.96 |
| 1.2436 (X210 CrW 12) | 121 | 0.91 | 159 | 0.43 | 2.10 |
| 3.2315 (AlMgSi1Mn) | 568 | 0.44 | 744 | 0.42 | 1.03 |
| 3.1325 (AlCu4MgSi) | 575 | 0.53 | 754 | 0.41 | 1.29 |
| 3.4345 (AlZn5Mg3Cu) | 545 | 0.49 | 714 | 0.46 | 1.05 |
| 2.0060 (E-Cu57) | 288 | 0.52 | 377 | 0.40 | 1.28 |
| HARDOX 500 PLATE | 102 | 0.59 | 134 | 0.49 | 1.21 |
| 2.0402 (CuZn40Pb2) | 265 | 0.42 | 347 | 0.42 | 1.01 |
| 1.0038 (RSt 37-2) | 186 | 0.50 | 244 | 0.45 | 1.13 |
| Tilting Angle 10° | Ratio of | Tilting Angle 15° | Ratio of | |||
|---|---|---|---|---|---|---|
| Material Type | TNR | T/NT | TNR | T/NT | ||
| WRN (DIN) Standard | mm/min | T-Head (*) | Forces | mm/min | T-Head (*) | Forces |
| 1.057 (St 52-3) | 189 | 0.78 | 1.25 | 248 | 0.79 | 1.82 |
| 1.0503 (C 45) | 151 | 0.79 | 1.43 | 198 | 0.79 | 1.76 |
| 1.7131 (16 MnCr 5) | 167 | 0.58 | 1.41 | 218 | 0.74 | 1.71 |
| 1.7225 (42 CrMo 4) | 136 | 0.93 | 1.38 | 179 | 0.93 | 2.01 |
| 1.4541 (X6 CrNiTi 18 10) | 151 | 0.61 | 1.53 | 198 | 0.78 | 1.87 |
| 1.2436 (X210 CrW 12) | 121 | 0.98 | 1.08 | 159 | 0.98 | 2.26 |
| 3.2315 (AlMgSi1Mn) | 568 | 0.66 | 1.52 | 744 | 0.82 | 1.93 |
| 3.1325 (AlCu4MgSi) | 575 | 0.61 | 1.15 | 754 | 0.90 | 2.18 |
| 3.4345 (AlZn5Mg3Cu) | 545 | 0.49 | 1.01 | 714 | 1.04 | 2.26 |
| 2.0060 (E-Cu57) | 288 | 0.60 | 1.15 | 377 | 0.90 | 2.22 |
| HARDOX 500 PLATE | 102 | 0.79 | 1.33 | 134 | 0.93 | 1.92 |
| 2.0402 (CuZn40Pb2) | 265 | 0.55 | 1.30 | 347 | 1.08 | 2.60 |
| 1.0038 (RSt 37-2) | 186 | 0.58 | 1.16 | 244 | 0.77 | 1.73 |
| Material | Non-Tilted 20° | Tilted 20° | Non-Tilted 30° | Tilted 30° | ||||||||
|---|---|---|---|---|---|---|---|---|---|---|---|---|
| TF | NF | TNR | TF | NF | TNR | TF | NF | TNR | TF | NF | TNR | |
| (N) | (N) | (N) | (N) | (N) | (N) | (N) | (N) | |||||
| Steel 1.0038 (RSt37) 10 mm | 1.64 | 3.63 | 0.45 | 1.24 | 2.10 | 0.59 | 2.42 | 5.71 | 0.42 | 2.06 | 2.34 | 0.88 |
| 1.31 | 2.38 | 0.55 | 1.37 | 2.59 | 0.53 | 2.03 | 4.25 | 0.48 | 2.02 | 2.47 | 0.82 | |
| 1.17 | 2.39 | 0.49 | 1.35 | 2.17 | 0.62 | 1.74 | 3.82 | 0.46 | 2.58 | 3.49 | 0.74 | |
| 2.84 | 5.61 | 0.51 | 2.79 | 4.60 | 0.61 | - | - | - | - | - | - | |
| Average | 0.50 ± 0.04 | 0.59 ± 0.03 | 0.45 ± 0.02 | 0.81 ± 0.06 | ||||||||
| Copper 2.0060 (E-Cu57) 10 mm | 4.89 | 9.41 | 0.52 | 3.03 | 5.08 | 0.60 | 3.90 | 9.62 | 0.40 | 4.88 | 5.44 | 0.90 |
| 1.44 | 3.47 | 0.42 | 1.34 | 2.15 | 0.62 | 2.27 | 5.57 | 0.41 | 2.84 | 3.16 | 0.90 | |
| 1.05 | 2.33 | 0.45 | 1.28 | 1.74 | 0.74 | 1.75 | 3.74 | 0.47 | 2.67 | 3.91 | 0.68 | |
| 1.05 | 2.35 | 0.45 | 1.37 | 2.07 | 0.66 | 1.48 | 3.77 | 0.39 | 2.30 | 2.00 | 1.15 | |
| Average | 0.46 ± 0.04 | 0.66 ± 0.05 | 0.42 ± 0.03 | 0.91 ± 0.17 | ||||||||
Publisher’s Note: MDPI stays neutral with regard to jurisdictional claims in published maps and institutional affiliations. |
© 2021 by the authors. Licensee MDPI, Basel, Switzerland. This article is an open access article distributed under the terms and conditions of the Creative Commons Attribution (CC BY) license (https://creativecommons.org/licenses/by/4.0/).
Share and Cite
Hlaváč, L.M.; Annoni, M.P.G.; Hlaváčová, I.M.; Arleo, F.; Viganò, F.; Štefek, A. Abrasive Waterjet (AWJ) Forces—Potential Indicators of Machining Quality. Materials 2021, 14, 3309. https://doi.org/10.3390/ma14123309
Hlaváč LM, Annoni MPG, Hlaváčová IM, Arleo F, Viganò F, Štefek A. Abrasive Waterjet (AWJ) Forces—Potential Indicators of Machining Quality. Materials. 2021; 14(12):3309. https://doi.org/10.3390/ma14123309
Chicago/Turabian StyleHlaváč, Libor M., Massimiliano P.G. Annoni, Irena M. Hlaváčová, Francesco Arleo, Francesco Viganò, and Adam Štefek. 2021. "Abrasive Waterjet (AWJ) Forces—Potential Indicators of Machining Quality" Materials 14, no. 12: 3309. https://doi.org/10.3390/ma14123309
APA StyleHlaváč, L. M., Annoni, M. P. G., Hlaváčová, I. M., Arleo, F., Viganò, F., & Štefek, A. (2021). Abrasive Waterjet (AWJ) Forces—Potential Indicators of Machining Quality. Materials, 14(12), 3309. https://doi.org/10.3390/ma14123309