1. Introduction
Ferromagnetics can be classified according to their ease of magnetization, where the classification criterion is the value of the coercive field. In the case of a coercive field value of less than 1000 A/m, it is assumed that the associated materials are ‘soft magnetic’; in the range from 1000–10,000 A/m, ‘semi-hard’; and if greater than 10,000 A/m, ‘hard’ [
1]. Magnetically hard properties are exhibited by permanent magnets. Materials with semi-hard magnetic properties are used, for example, in the construction of magnetic memory systems. Due to their ease of magnetization (and re-magnetization), alloys with soft magnetic properties are widely used in electronics and electrical engineering applications; for example, they can be used in the construction of low-loss transformer cores [
2,
3].
The amorphous iron-based alloys are commonly known materials with soft magnetic properties. Among these materials, alloys produced by rapid quenching are most popular. Materials that are produced in the form of thin ribbons, using the melt-spinning method [
4], present particularly good properties. Materials of this type are characterized by a high value of saturation magnetization (above 1.5 T) and a low value of coercive field (approximately 1 A/m) [
5,
6,
7,
8,
9]. These material samples are extremely easy to magnetize, partly due to their dimensions. Amorphous ribbons have thicknesses of up to several tens of µm. Unfortunately, these dimensions significantly limit the applications of these materials. The so-called bulk amorphous alloys comprise a relatively new group of promising materials. These materials are produced by a rapid-quenching process in copper molds. The most well-known production methods are the injection- and suction-casting methods [
10,
11]. In this way, at a cooling rate of 10
−1–10
3 K/s, iron-based alloys with dimensions exceeding 10 mm can be produced [
12,
13,
14]. However, due to their high proportions of non-magnetic component elements, such as: B, C, Zr, Y, Mo, Nb, Hf, or Cr, these alloys do not exhibit the best magnetic properties. A compromise that combines relatively good magnetic properties (saturation magnetization greater than1T, coercive field less than 50 A/m) with favorable alloy geometry (diameter up to 3 mm) exists in the form of alloys with a content of approximately 65%–75% magnetic elements [
15,
16,
17,
18].
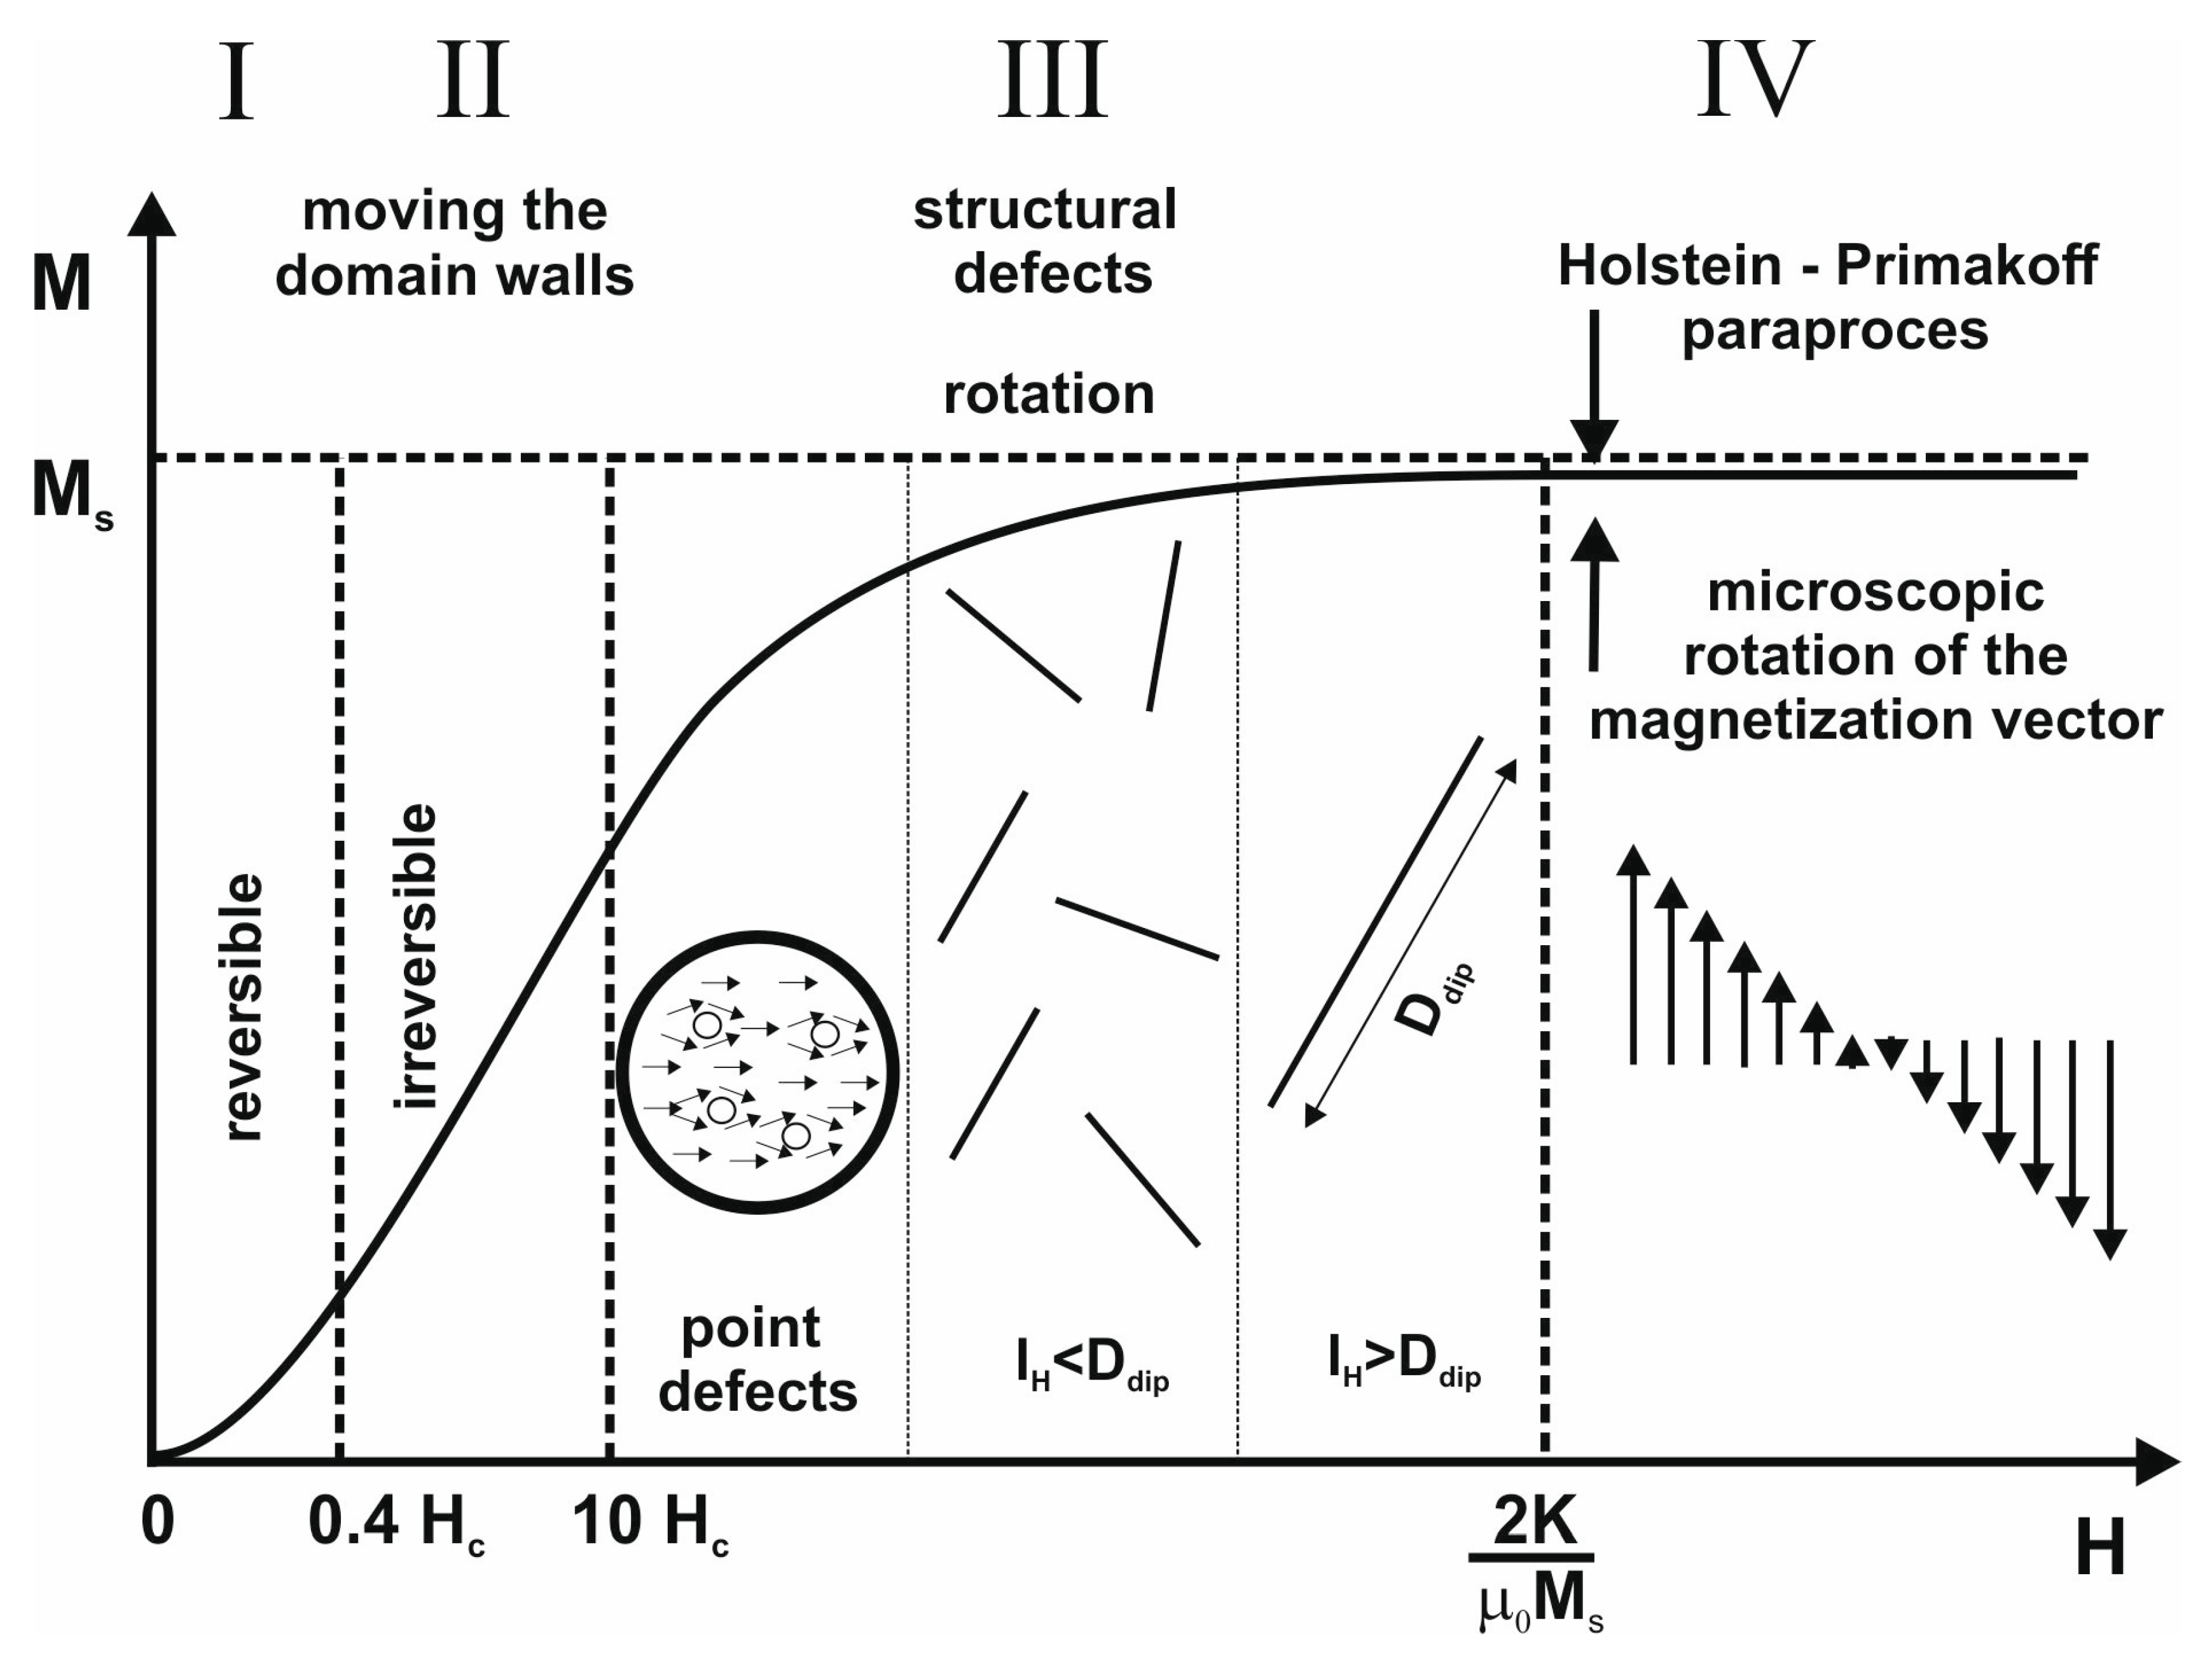
The process of magnetizing amorphous alloys does not differ significantly from their crystalline counterparts.
Figure 1 shows a diagram of the primary magnetization curve.
In the first area, magnetization is associated with reversible shifts of domain walls. Above 0.4 H
C, domain wall shifts are irreversible. An increase in the intensity of the external magnetic field causes the disappearance of magnetic domains with directions that do not correlate with the applied direction of the magnetic field. In the third area, closing domains are magnetized. In the case of materials with an amorphous structure, magnetization in this area is associated with the presence of structural defects—occurring in the form of free volumes and pseudodislocation dipoles [
20,
21,
22]. As the applied magnetic field increases, the magnetization vector rotates around point, and then linear, defects. In the fourth area, further magnetization of the alloy is associated with the damping of thermally excited spin-waves; i.e., the so-called Holstein–Primakoff paraprocess [
23].
As part of this work, rapidly quenched alloys with the chemical compositions: Fe65Nb5Y5+xHf5−xB20 (where: x = 0, 1, 2, 3, 4, 5) were produced, using the injection-casting method. An analysis of the magnetization process in high magnetic fields was carried out; i.e., within the third and fourth regions of the primary magnetization curve. The aim of the study was to determine the effect of Y and Hf content on the magnetization process of bulk Fe-based amorphous alloys.
2. Materials and Methods
Polycrystalline ingots, each weighing 10 grams, were made using an arc furnace. The purities of the ingredients were as follows: Fe = 99.99% at, Hf = 99.98% at, Nb = 99.98% at, Y = 99.98% at, and B = 99.98% at. Boron was added in the form of a pre-prepared FeB alloy with the chemical composition Fe45.4B54.6. The production process was carried out under a protective atmosphere of argon. The charge was melted by plasma arc using a current of 180–380 A, flowing through a non-melting tungsten electrode. The ingots were melted on a water-cooled copper plate. Each remelting of the charge was preceded by the remelting of a titanium getter. The ingots were remelted four times on each side. The resulting alloys were mechanically cleaned, divided into smaller pieces, and cleaned again using an ultrasonic cleaner. Rapid-quenched alloys were made using the injection-casting method. The polycrystalline charge was placed in a quartz crucible inside a copper coil. The charge was melted using eddy currents at a constant current of 10 A. The production process was carried out in a protective atmosphere of argon. The liquid alloy was forced into a water-cooled copper mold; 0.5mm-thick plates were made.
The structure of the produced alloys was examined using X-ray diffraction. Samples, in the form of powder, were irradiated for 6 seconds per measuring step (0.02°). A Bruker D8 Advance X-ray diffractometer (Bruker, Billerica, MA, USA), equipped with a CuKα lamp and a semiconductor meter, was used; the measurement was carried out in the range of 30–100º of the two-theta angle.
The microstructure of each of the alloys was investigated using a POLON Mössbauer spectrometer, the latter being equipped with a
57Co radioactive source of activity 100 mCi and half-life of 270 days. Calibration of the spectrometer was performed by recording the spectrum for an α-Fe foil with a thickness of 20 µm. For all the prepared and measured samples of the studied alloys, the surface density of the 57Fe isotope was less than 0.3 mg/cm
2. This allowed the use of the “thin absorbent” approximation. Analysis of the transmission Mössbauer spectra was performed using the NORMOS software (version 3), developed by R. A. Brand [
24]. This software facilitates the decomposition of the experimental spectra to the constituent spectra and the determination of the distribution of the hyperfine field induction P(B). In order to determine the distribution of the hyperfine field distribution on the
57Fe nuclei, according to the Hesse-Rübatsch method [
25], each experimental spectrum was presented as the sum of the elementary sextets:
where:
P(B)—distribution of the hyperfine magnetic field induction,
L6 (B, v)—elementary Zeeman sextet,
v—relative speed of source against the absorbent.
From analysis of the distribution of the hyperfine magnetic field induction, the average value of the hyperfine magnetic field induction B
hf was determined. Due to asymmetry in the Mössbauer spectra, during the fitting process, a linear relationship between the isomer shift (IS) and the hyperfine field induction (B
hf) was assumed [
24].
where:
B0hf = the minimum value of the hyperfine field induction,
α = coefficient.
Due to the powdered form of the investigated samples, the element A2.5 = 2 was blocked due to the lack of magnetic anisotropy related with the sample texture. Primary magnetization curves were measured using a LakeShore vibrating sample magnetometer, in the range of external magnetic field strength extending up to 2 T (
Supplementary materials). The structural and magnetic properties tests were carried out at room temperature.
The primary magnetization curves were subjected to numerical analysis, according to the H. Kronmüller theory. According to the modified micromagnetism theory of Brown, (Brown’s micromagnetic equations) magnetization in high magnetic fields can be expressed approximately by the formula [
20]:
where:
MS = spontaneous magnetization,
H = magnetic field,
ai (i = ½, 1, 2) = angular coefficients of the linear fit, which correspond to the free volume and linear defects,
µ0 = magnetic permeability of a vacuum, and
b = slope of the linear fit corresponding to the thermally-induced suppression of spin-waves by a high intensity magnetic field.
The coefficients,
ai (described by Equations (4)–(6)), appearing in the expression, reduce the magnetization and are associated with the presence of structural defects. The term a
1/2/(μ
0H)
1/2 in the Equation (3), related to the point defects, is described as follows:
The terms a
1/µ
0H and a
2/(µ
0H)
2 in Equation (3) are related to the linear defects, which internal stress field is equivalent to the field generated by the linear dislocation dipoles of the D
dip width, the effective Burgers vector b
eff, and the surface density N.
If l
HD
dip<1, where l
H is the inversed exchange distance described by the equation:
the dominant role in the Equation (3) plays the term a
1/µ
0H equal to:
For l
HD
dip > 1 the term a
2/(µ
0H)
2 is dominant and can be expressed by the equation:
where:
Aex = exchange constant,
G = transverse elastic shear modulus, Δ
V = the change in volume due to the occurrence of a point defect characterized by a bulk density of
N, v = Poisson’s ratio,
λs = magnetostriction constant,
Ddip = pseudodislocation dipole width.
The
b factor is associated with the damping of thermally excited spin-waves. Through the equation, this factor is associated with the spin-wave stiffness parameter
Dspf.
where:
k = Boltzman’s constant,
µB = Bohr magneton,
g = gyromagnetic factor,
T = temperature.
Based on analysis of the primary magnetization curves, it is possible to assess the type—and in some cases the number—of structural defects. The exchange constant was determined using the relationship (9), and the width of the pseudodislocation dipole from the relationship (10). The surface density of linear defects was calculated using Equation (11).
3. Results
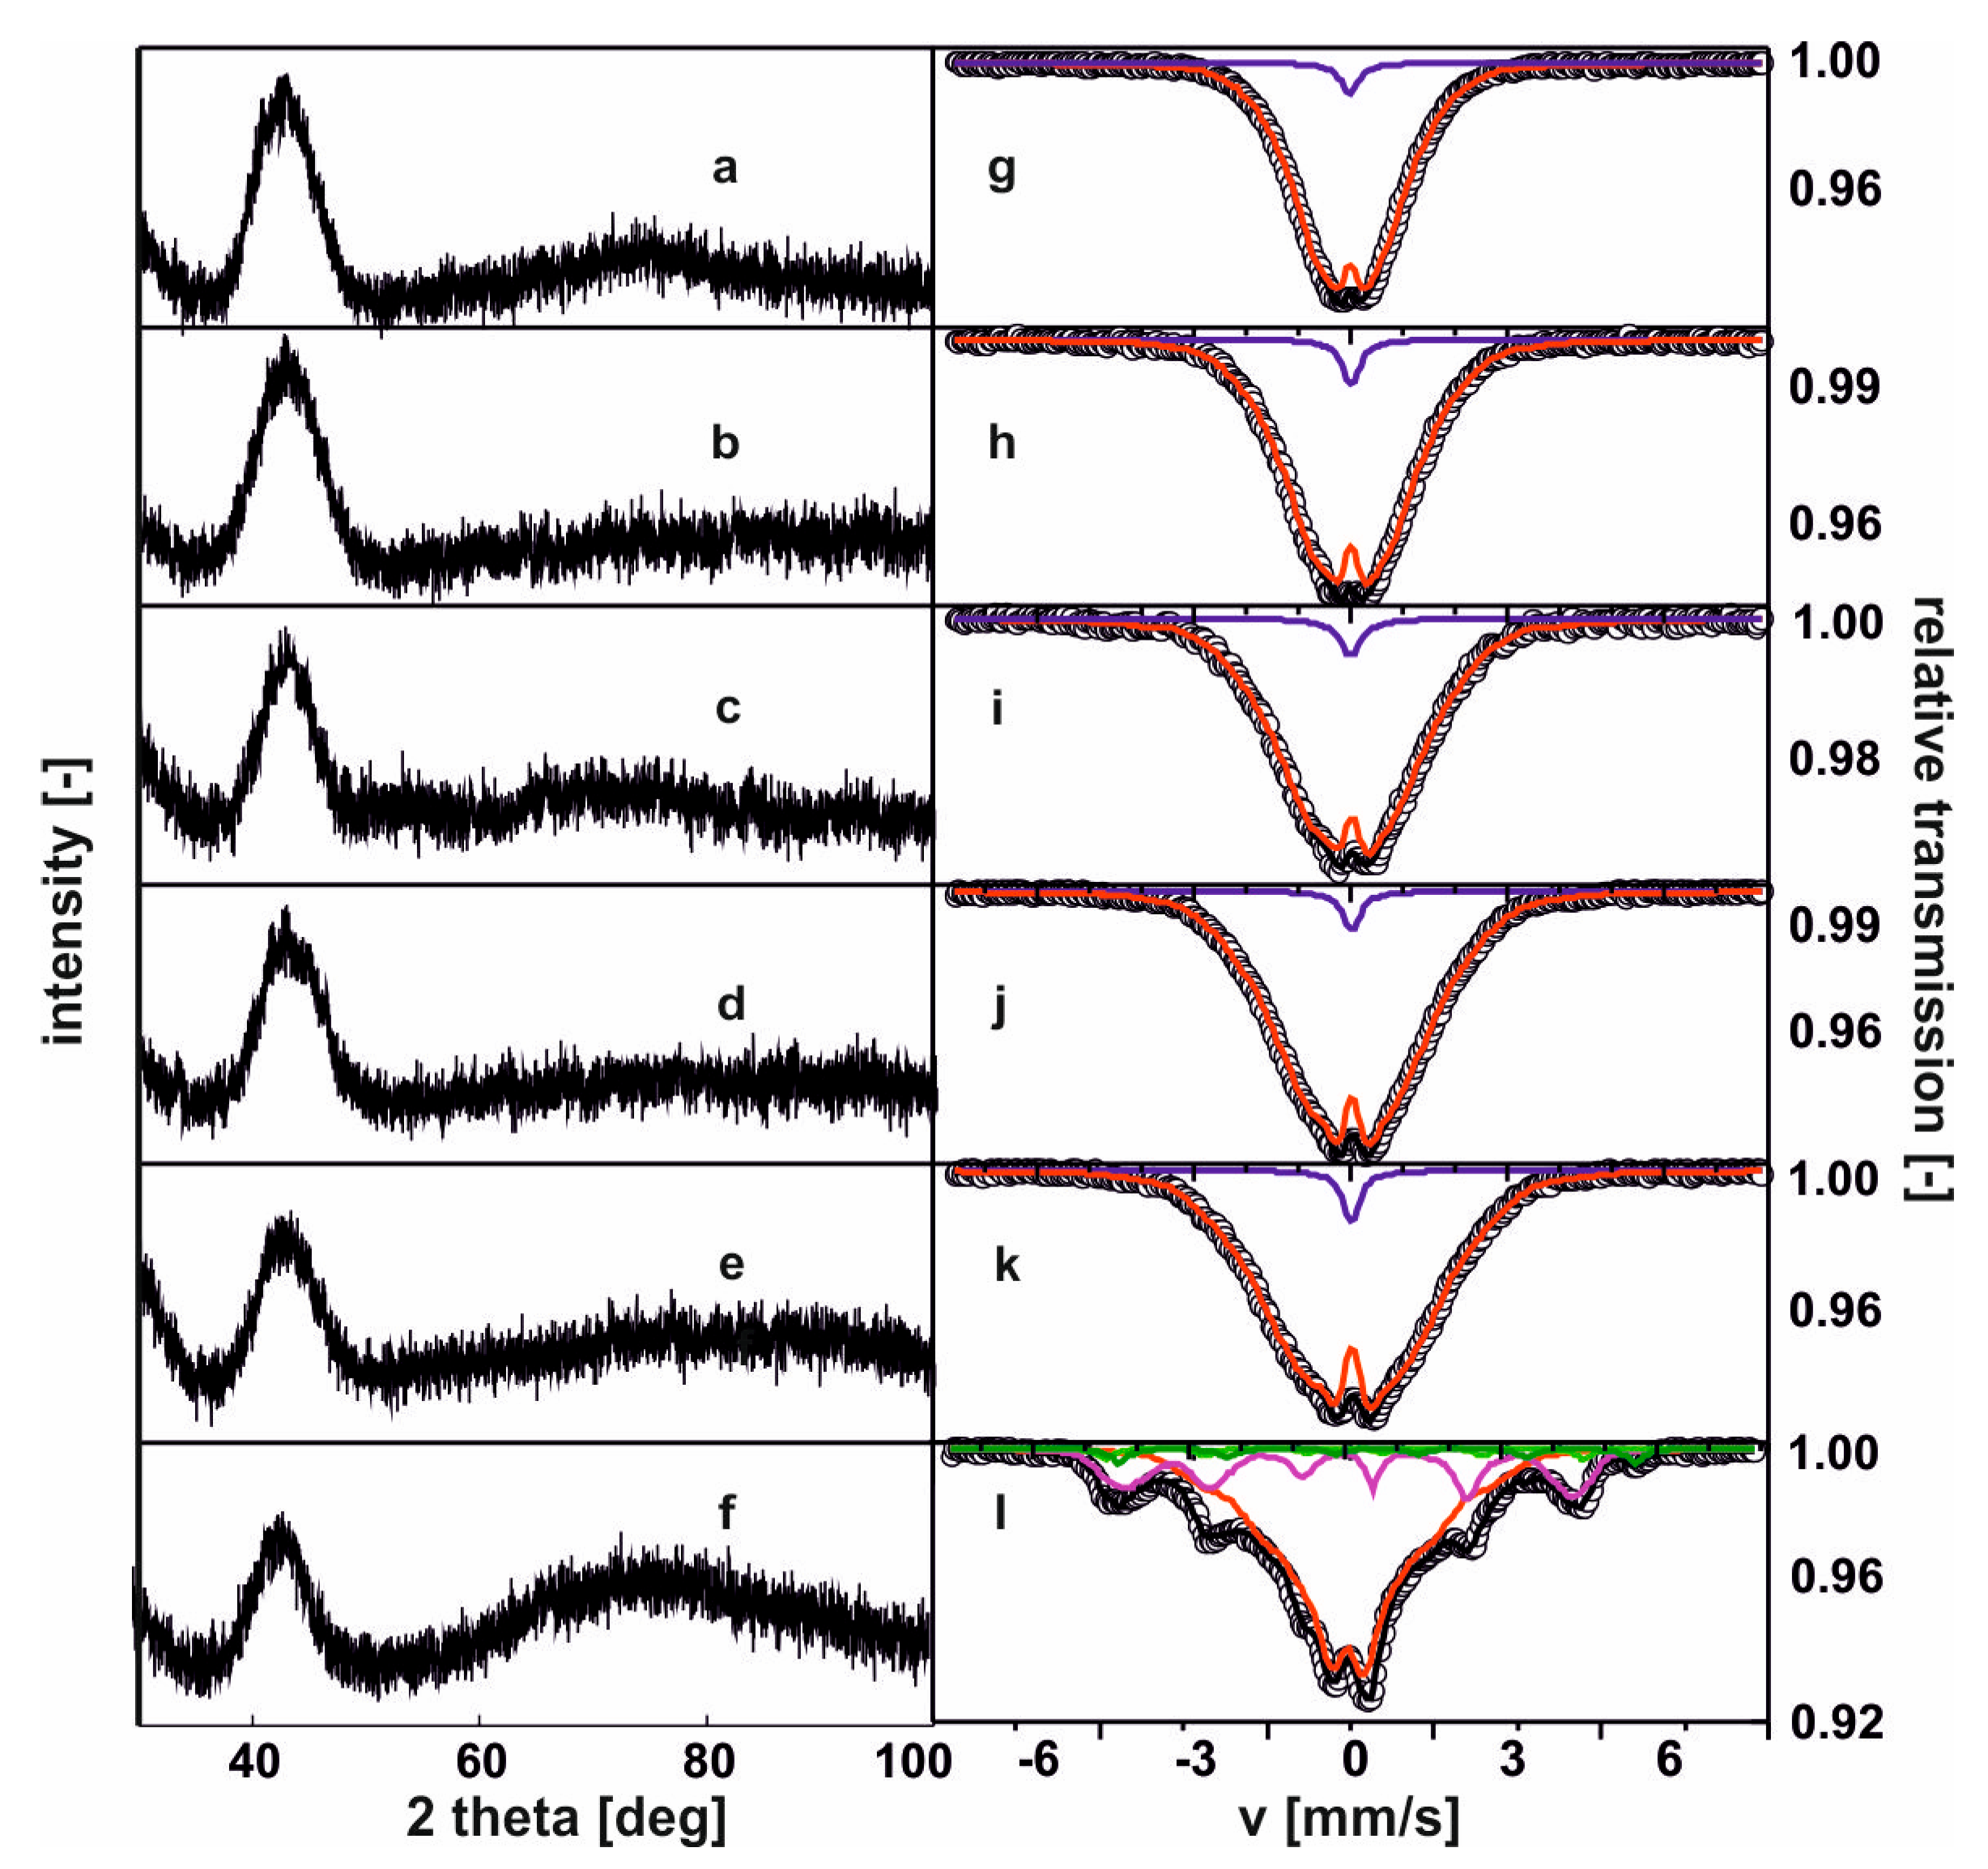
Figure 2 contains X-ray diffraction patterns and Mössbauer spectra measured for the tested alloys.
On the recorded X-ray diffraction patterns, there were only wide maxima within the range of 40—50° of the two-theta angle. The transmission Mössbauer spectra, presented in
Figure 2, were typical for ferromagnetic, amorphous alloys with a relatively low hyperfine field. In effect, low Curie temperatures are expected [
26]. In the case of the first five spectra, a residual paramagnetic phase was also observed (blue line). For the last of the studied alloys, the Mössbauer spectrum consisted of three components: two resulting from amorphous matrices, and one from the minor volume of a phase with order similar to the Fe
5Y crystalline phase.
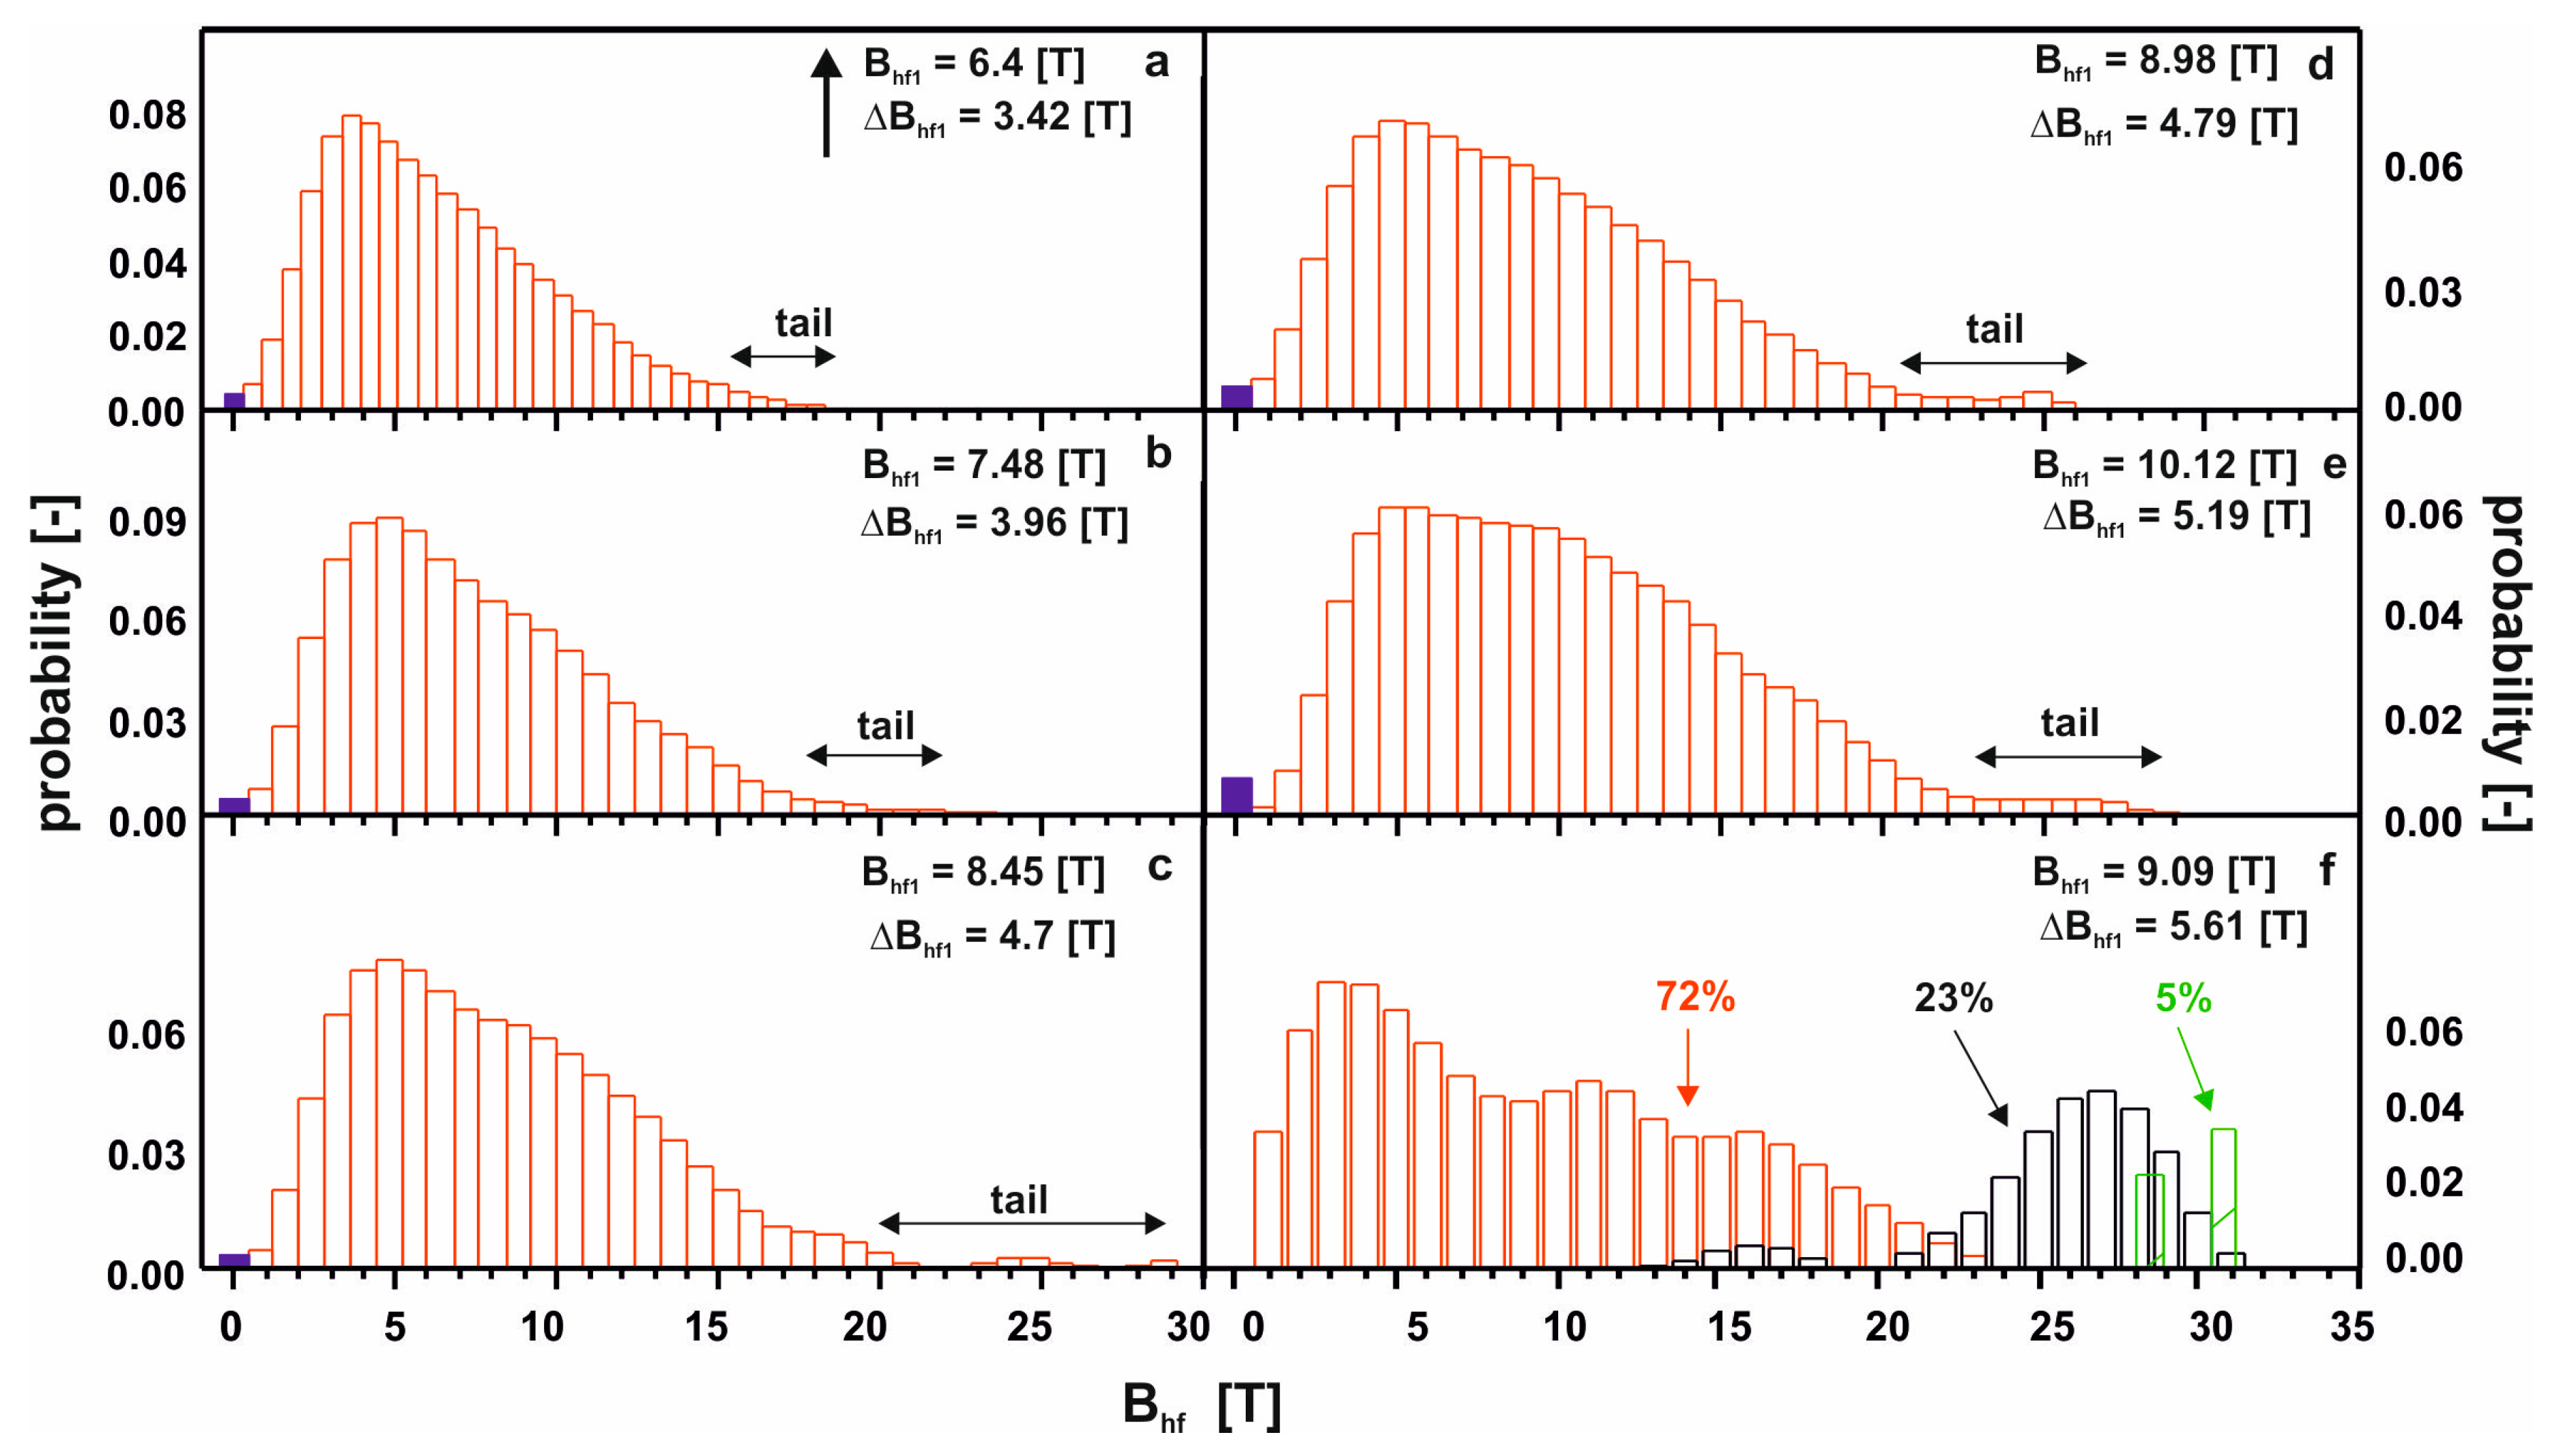
Figure 3 shows the distribution of the hyperfine field induction on the
57Fe nuclei, corresponding to the spectrum from
Figure 2.
For five of the studied alloys, in the distribution of the hyperfine field induction there was a non-zero probability of a zero value of
57Fe induction, which suggests the presence of a minor contribution of a paramagnetic phase (blue bar). A major content of non-magnetic components led a to significant distribution of the Fe atoms. Locally, the Fe atoms were separated to such a degree, that in some regions of the alloys, the Fe was present in paramagnetic form. The contribution of the paramagnetic phase to these samples was about 3%, and reconstitution of the distribution of hyperfine field induction was observed. In the low-field region, the probability of the presence of Fe in the vicinity of a central
57Fe atom was higher. Utilizing the distribution of the hyperfine fields, (2), a monotonic increase in the average value of the hyperfine field and its standard deviation were observed. With an increase in the Y content, the high-field component started to appear (in the form of a ‘tail’). The described changes for the first five alloys relate to an increase in the Y content at the expense of the Hf content. It should be mentioned that these elements had the largest atomic radii, and their exchange indirectly caused destabilization of the amorphous structure, and changes in the ferromagnetic interactions. This was confirmed by the spectrum obtained for the alloy with no Hf content. For the Fe
65Nb
5Y
10B
20 alloy, the amorphous matrix can be decomposed into three components. The amorphous structure was re-phased into two phases, with a high degree of magnetic inhomogeneity. In the case of the first magnetic phase (shown in red color), at least a tri-modal distribution can be observed with an average hyperfine field of 9.09 T; whereas for the second phase (shown in black color) the distribution is bi-modal with an average hyperfine field value of 25.7 T. Due to the substantial chemical and topological inhomogeneity of the Fe
65Nb
5Y
10B
20 alloy, an additional high-field component—described by two sextets with relatively wide lines—was isolated. The distribution of the hyperfine field obtained for these lines may suggest that they may belong to the Fe
5Y crystalline phase [
27]. However, their width is too large, and they must be treated as clustered structures—similar to the ordering of the Fe
5Y crystalline phase. This means that the Fe
5Y phase was in the early phase of crystallization of the high-field amorphous matrix. For all the studied alloys, the average hyperfine field value increased with increasing Y content, in addition to the dispersion of the distribution. This was related to the rebuilding of the magnetic structure. The changes in the chemical and topological order in the volume of the alloy—related to atomic diffusion—indirectly affected the degree in which the structure featured defects. According to the approach to the ferromagnetic saturation theorem of H. Kronmüller, analysis of the initial magnetization curves was performed.
Figure 4,
Figure 5,
Figure 6,
Figure 7,
Figure 8 and
Figure 9 present results from the analysis of the primary magnetization curves for the investigated alloys.
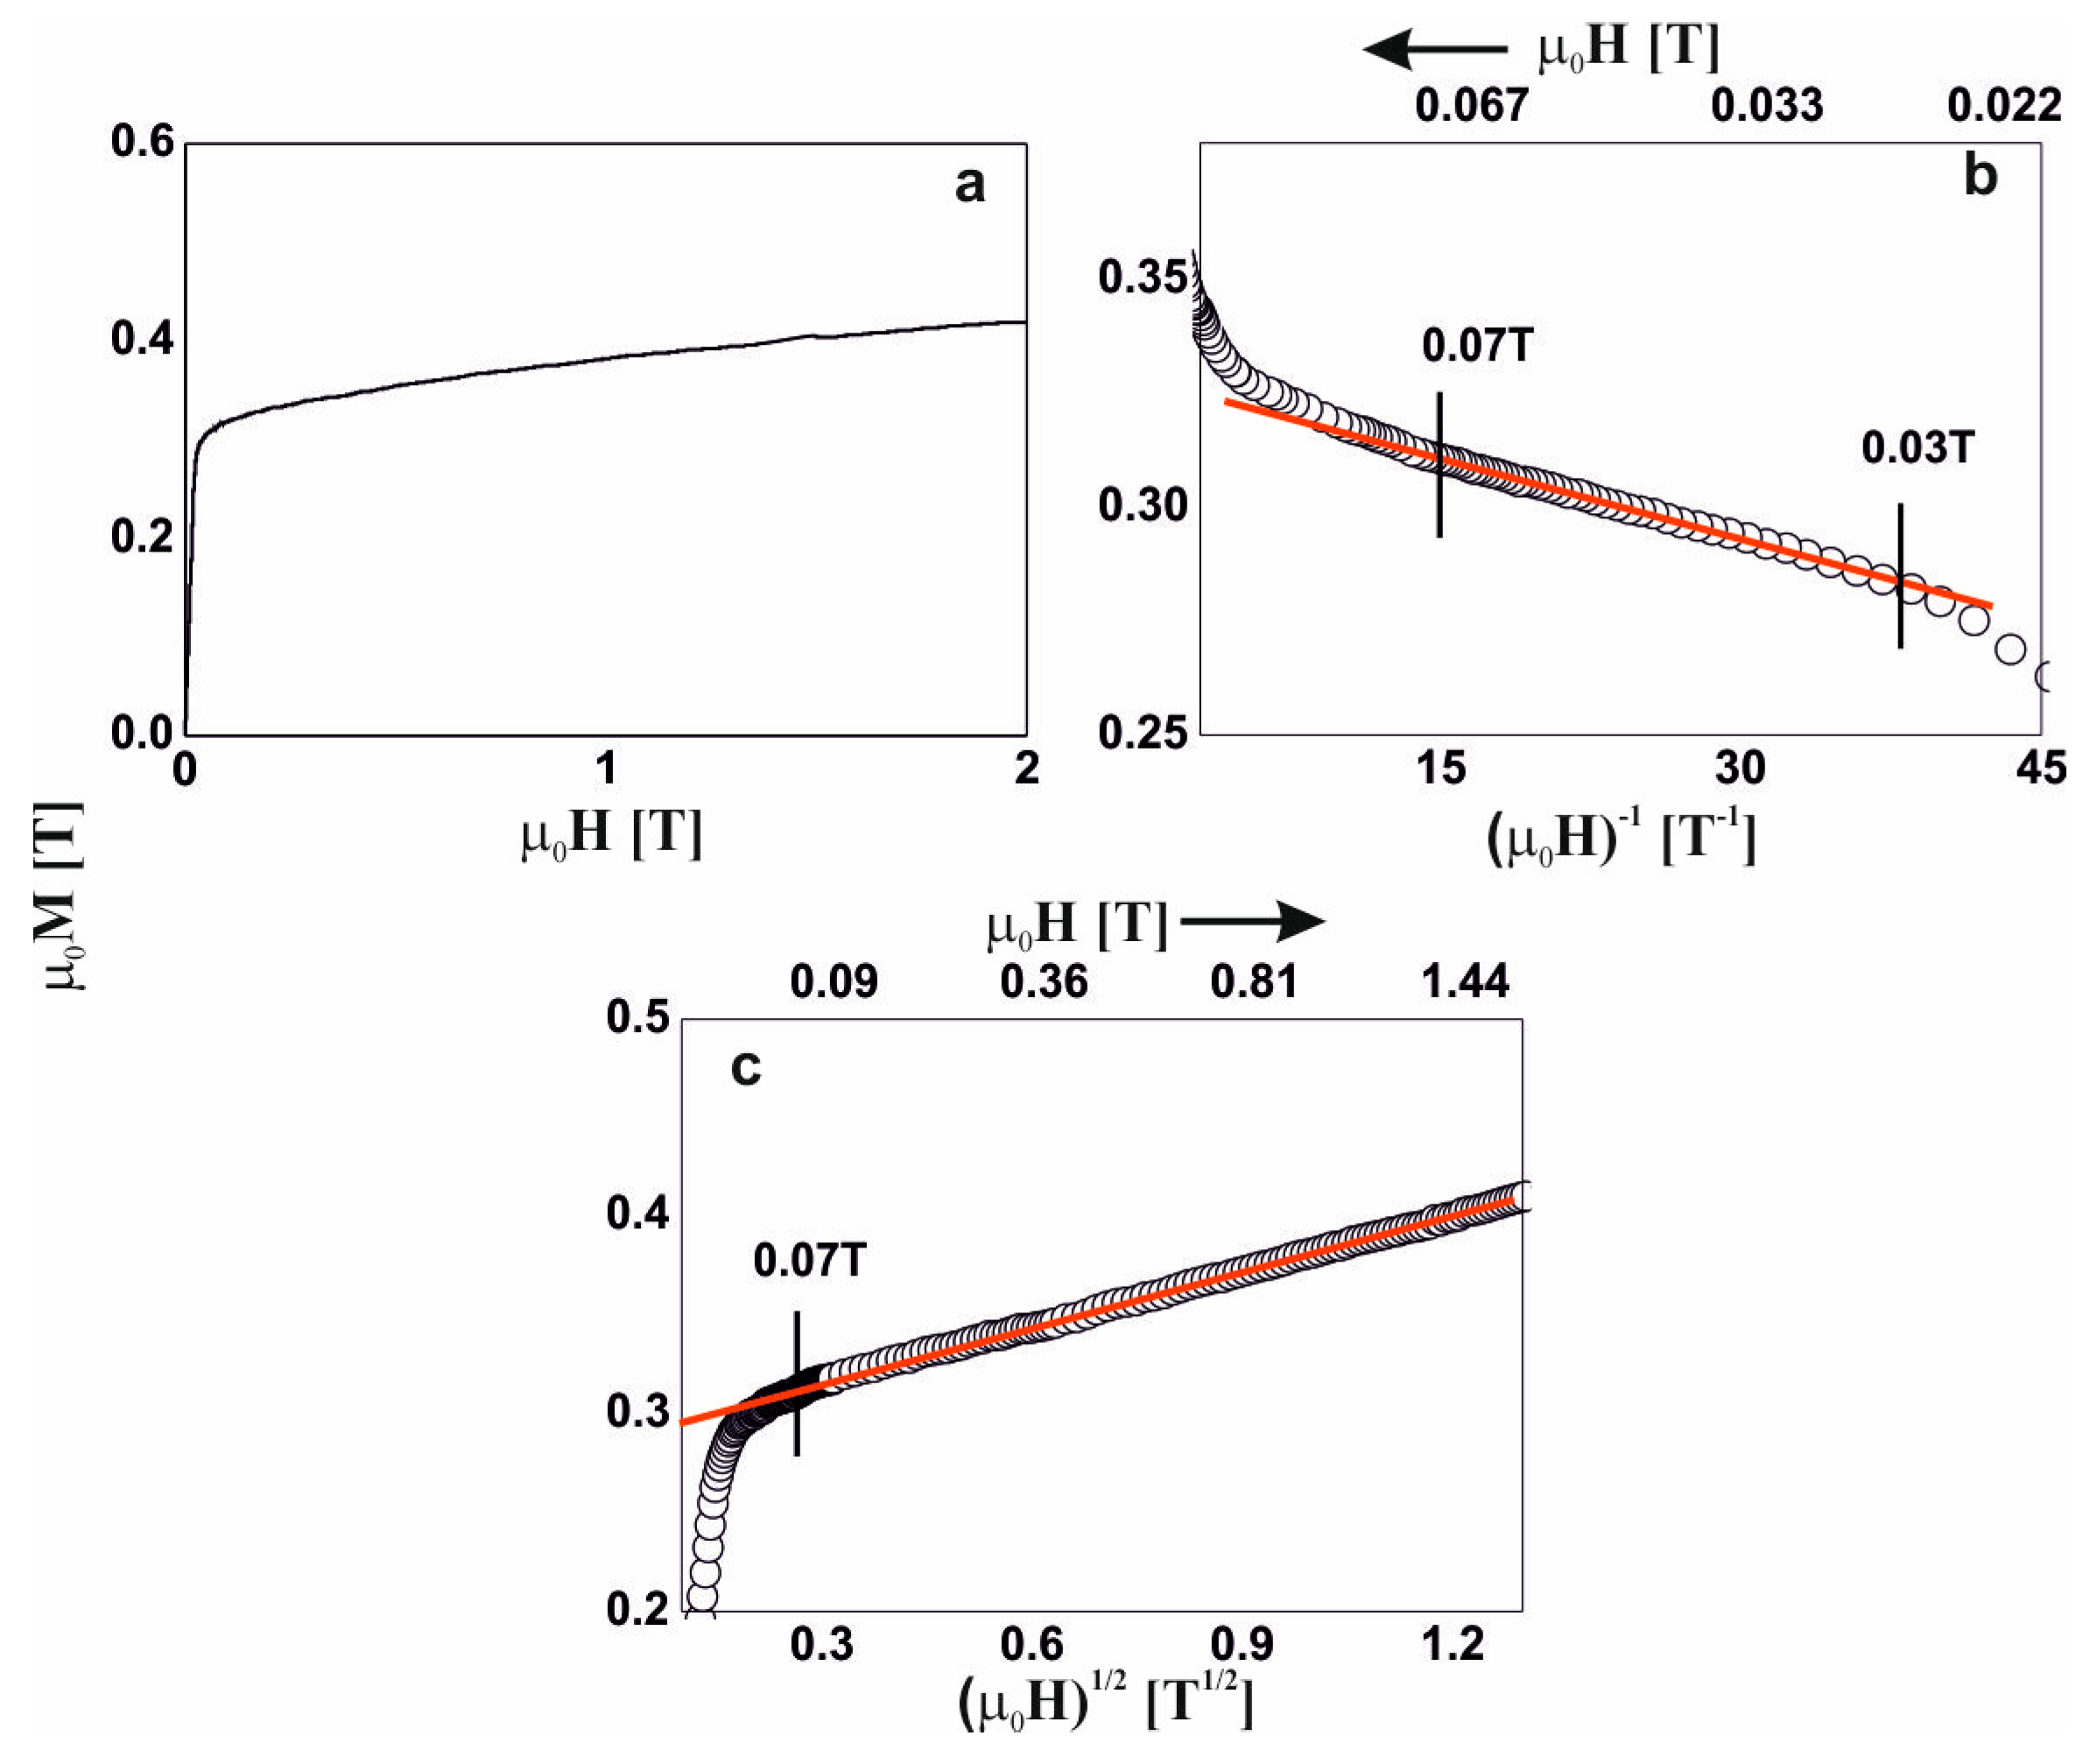
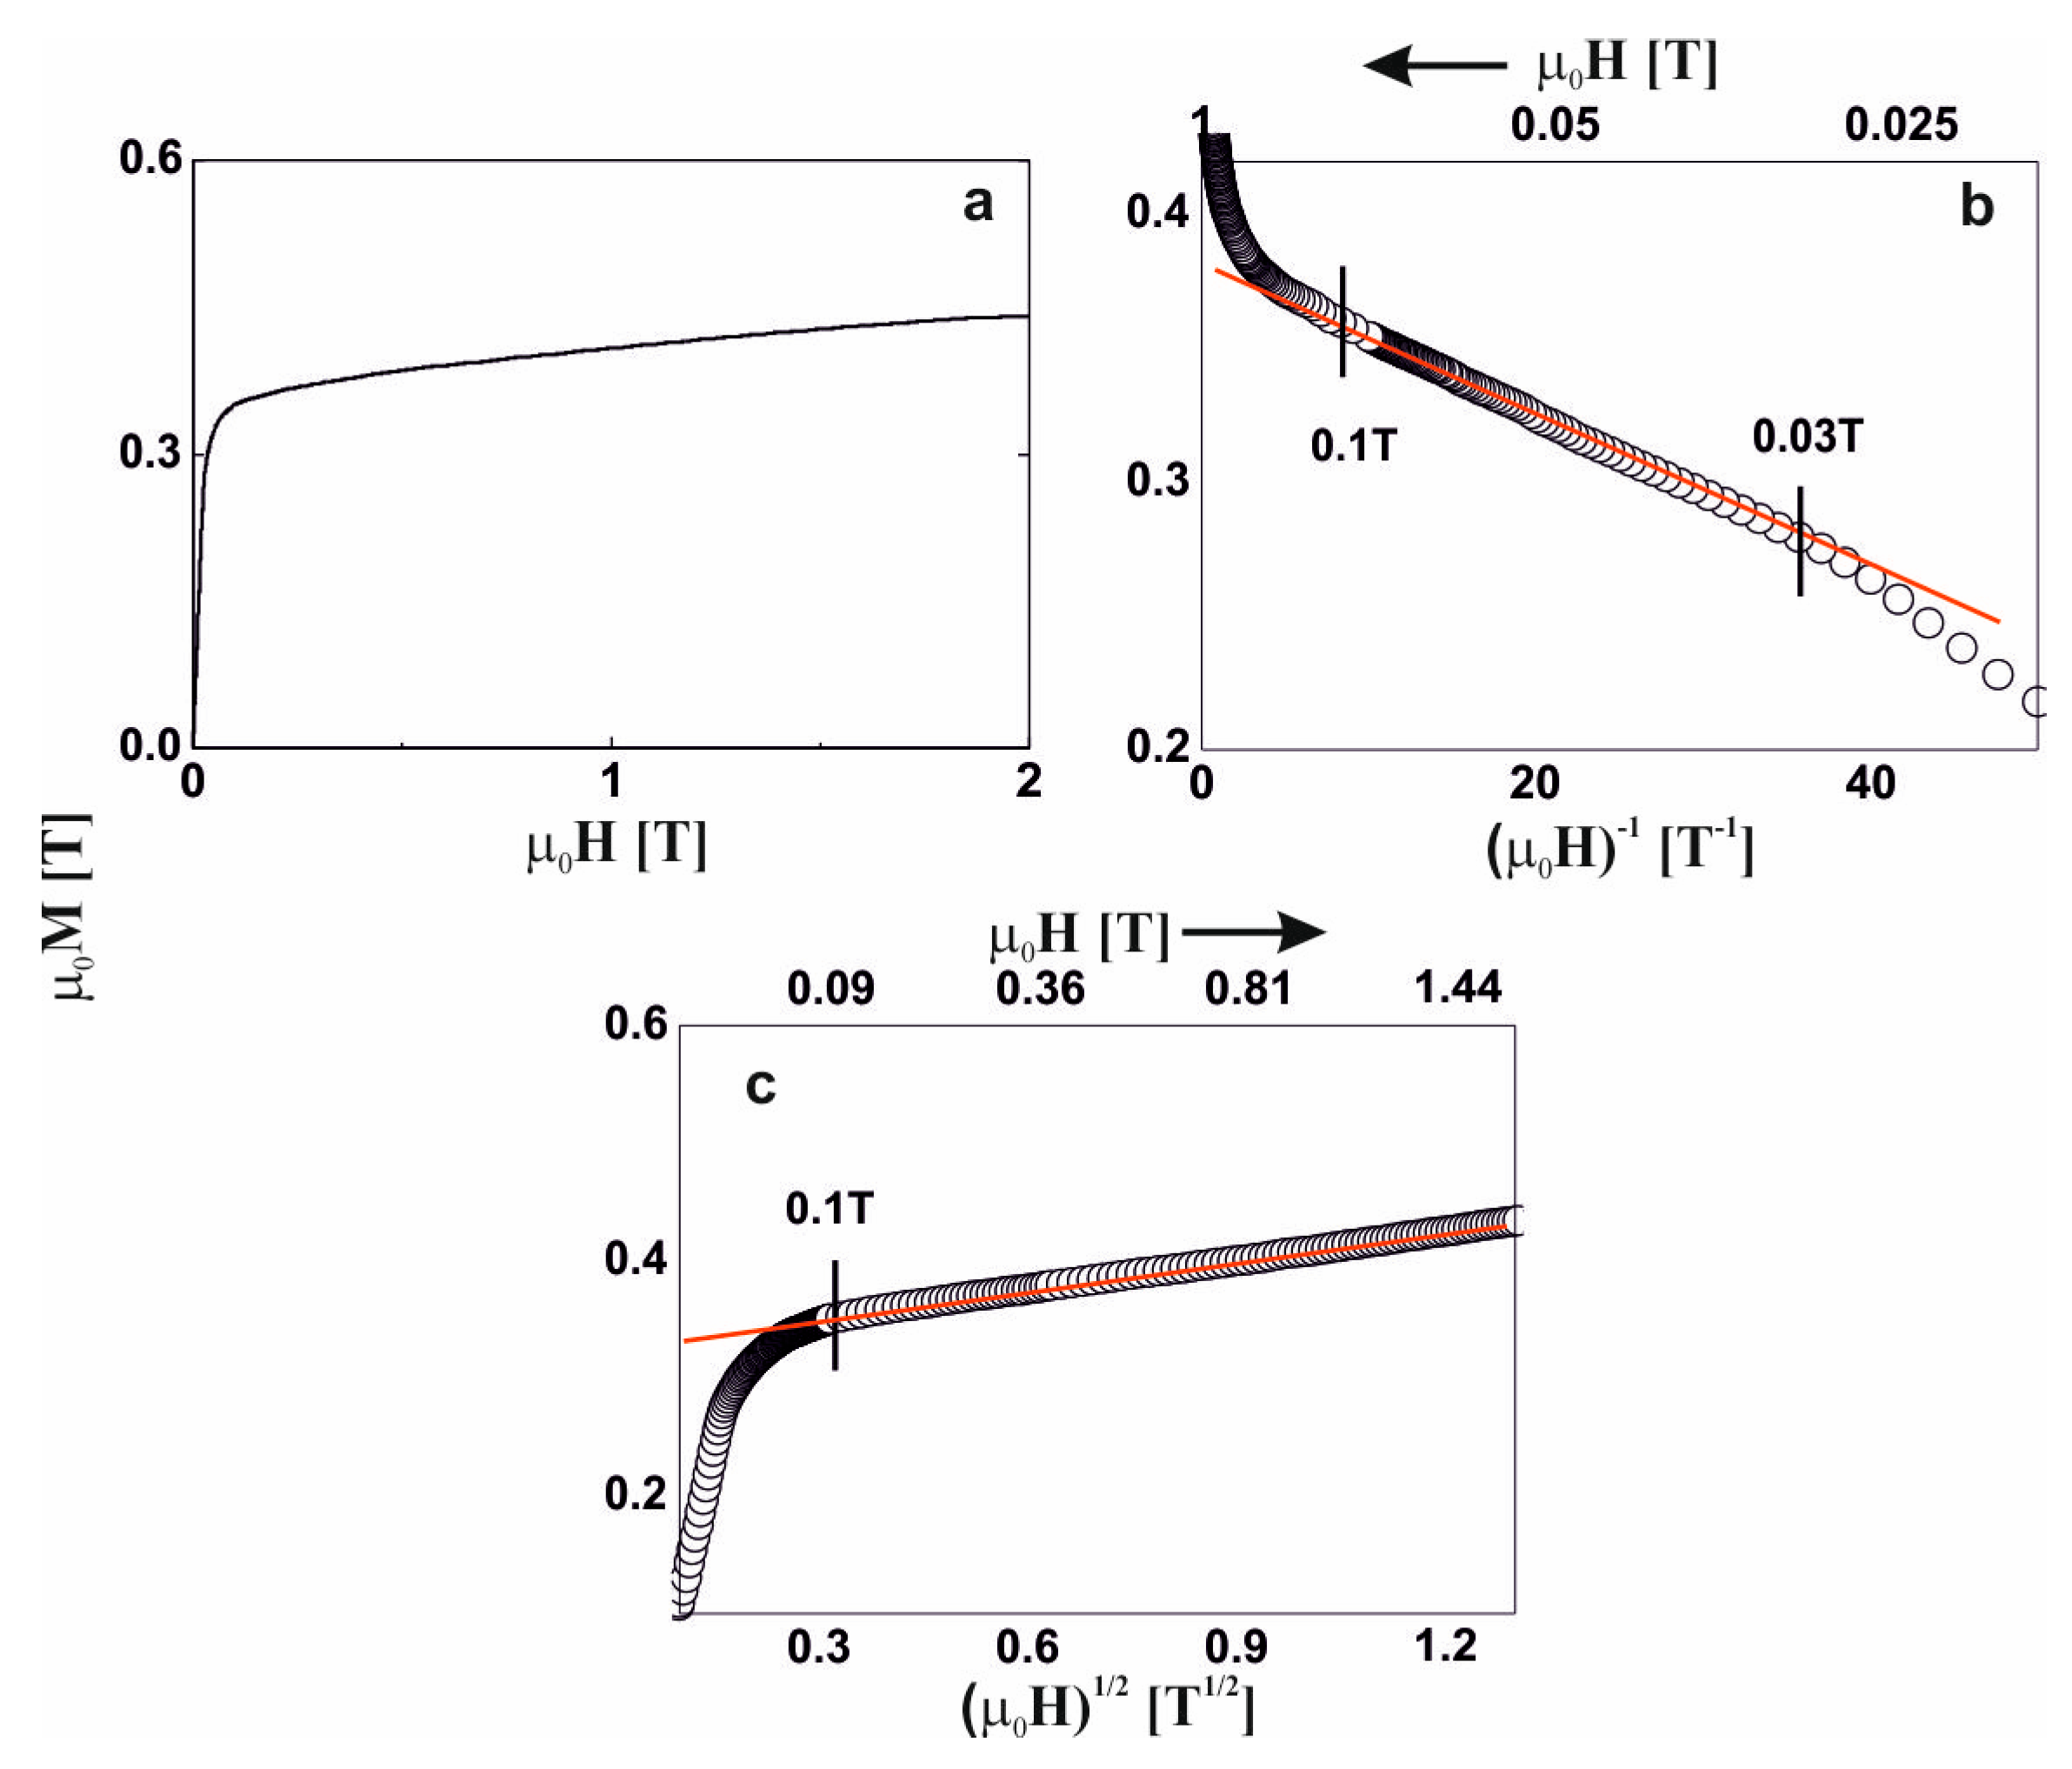
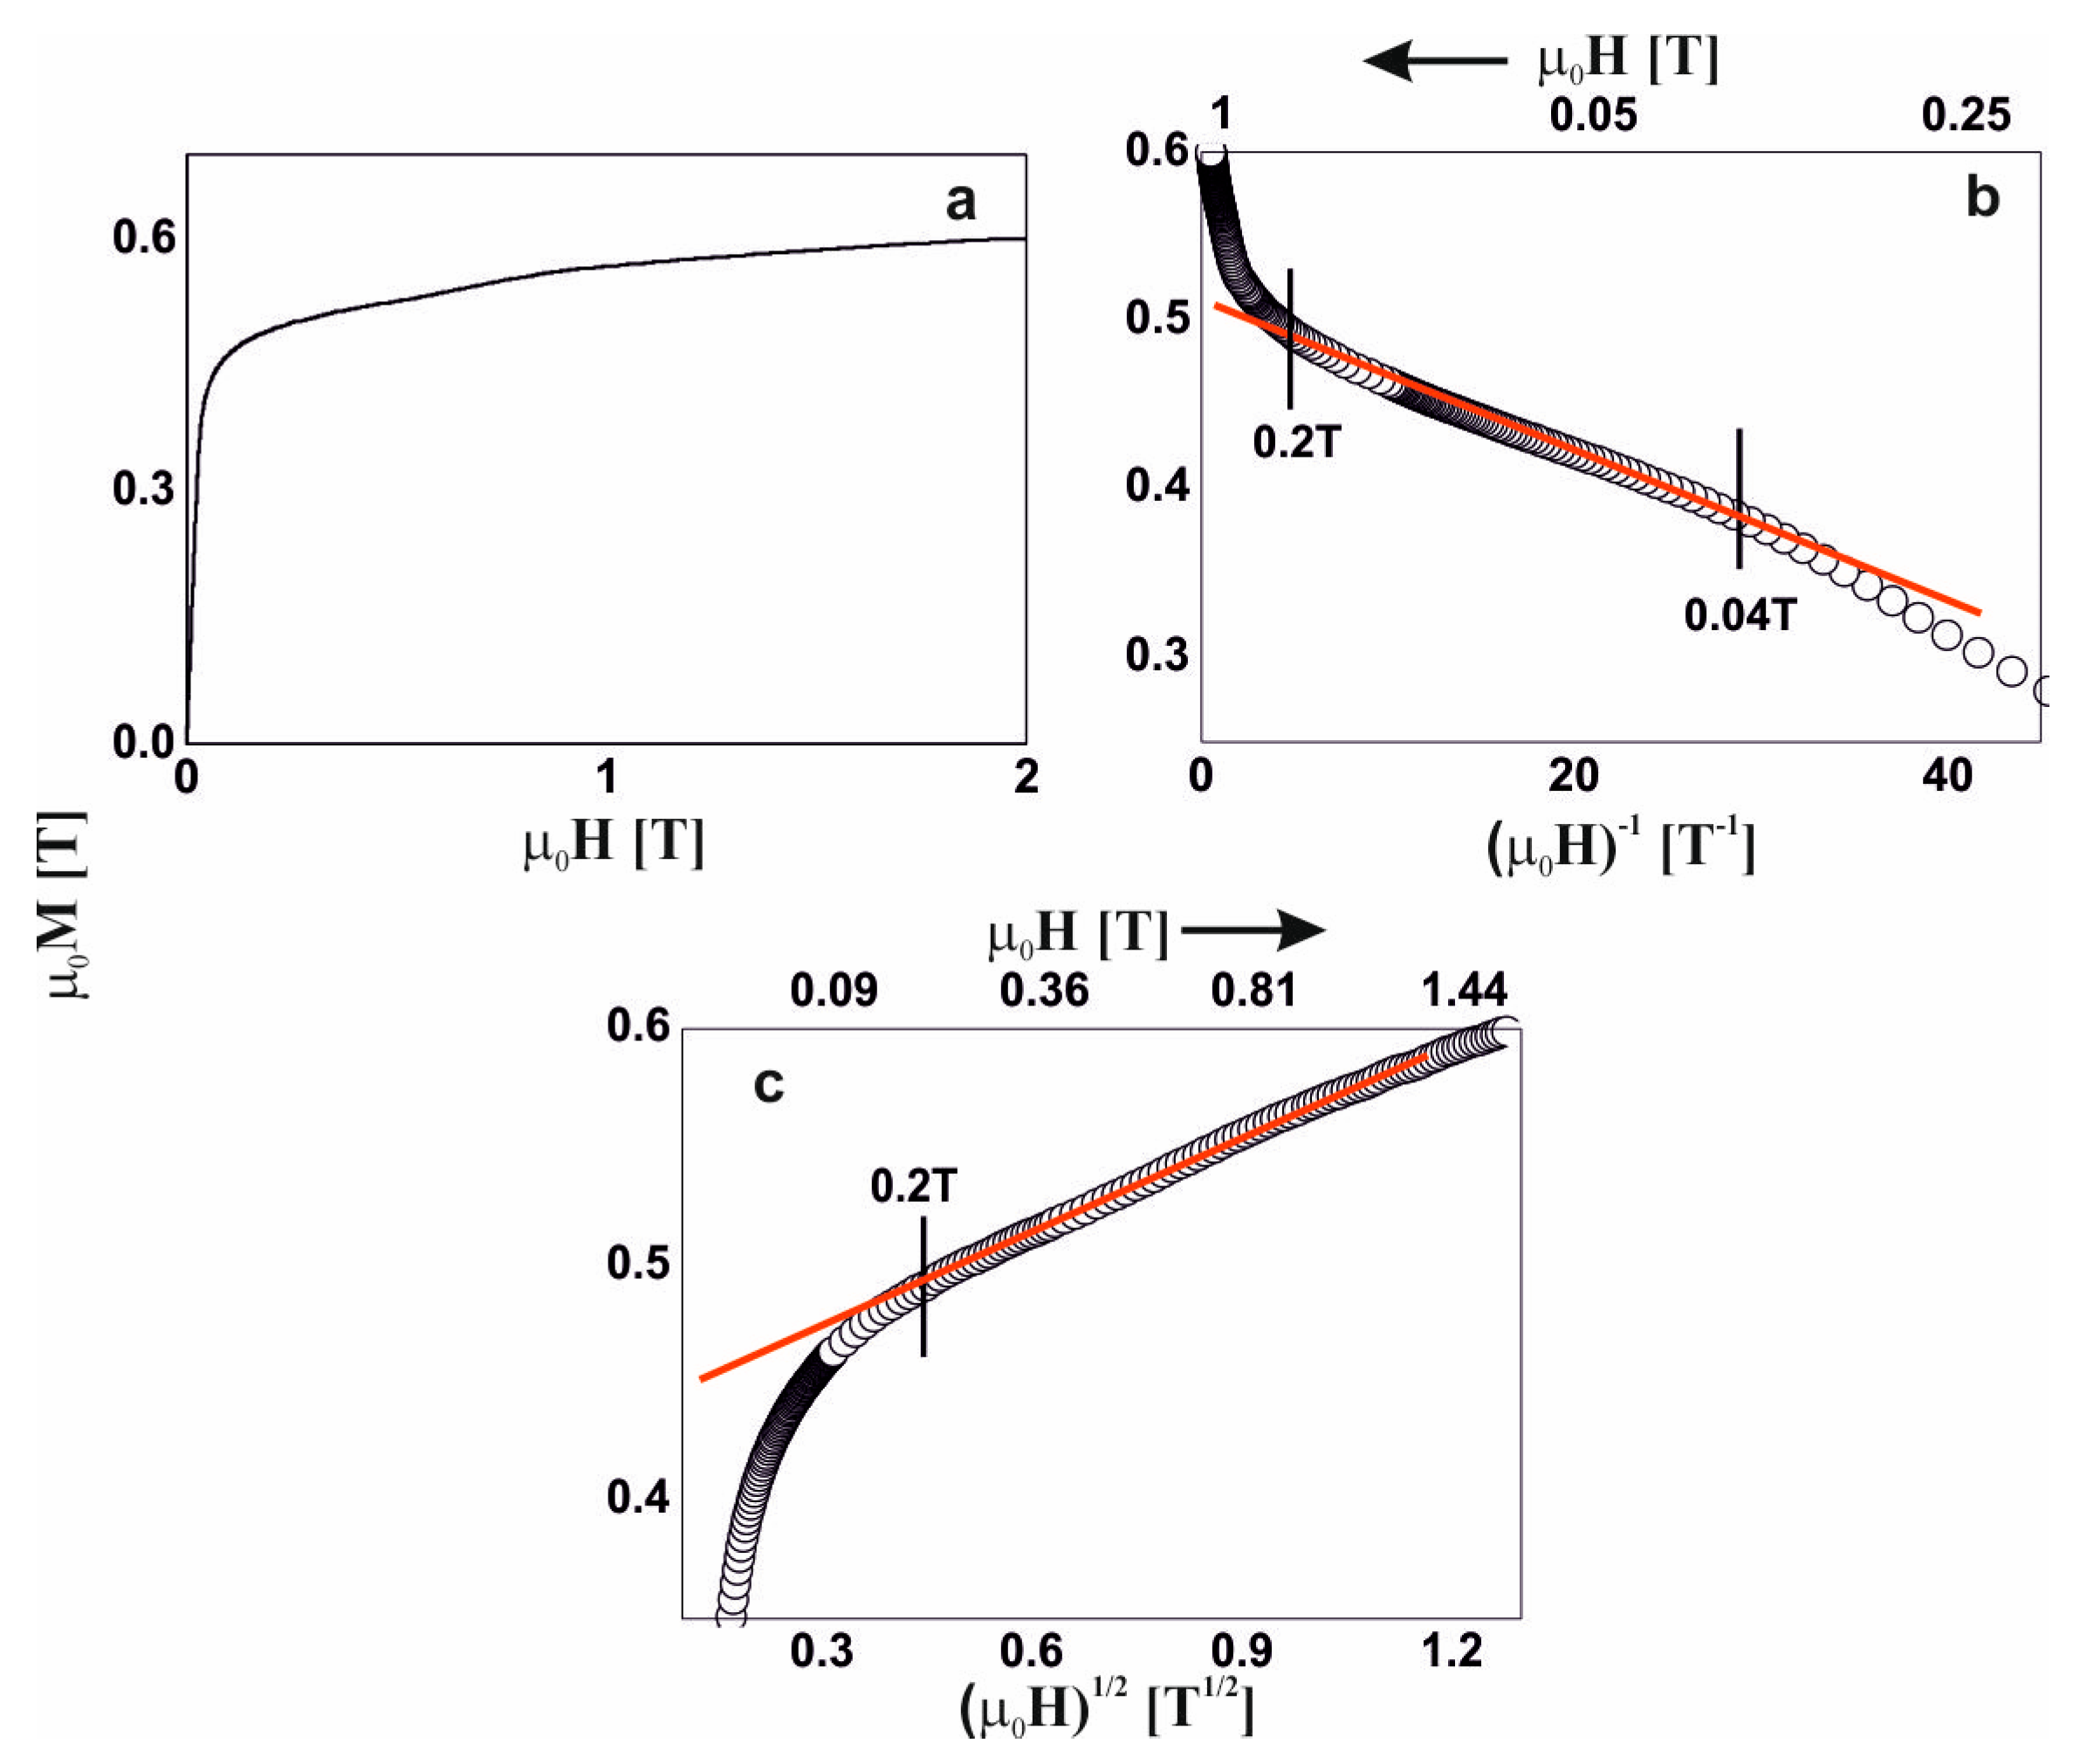
In the external magnetic field range of 0.03–0.07 T, the magnetization process of the Fe
65Nb
5Y
5Hf
5B
20 alloy (
Figure 4b) was associated with the rotation of the magnetization vector around linear structure defects. In magnetic fields of greater than 0.07 T, further magnetization was associated with the damping of thermally excited spin-waves (
Figure 4c).
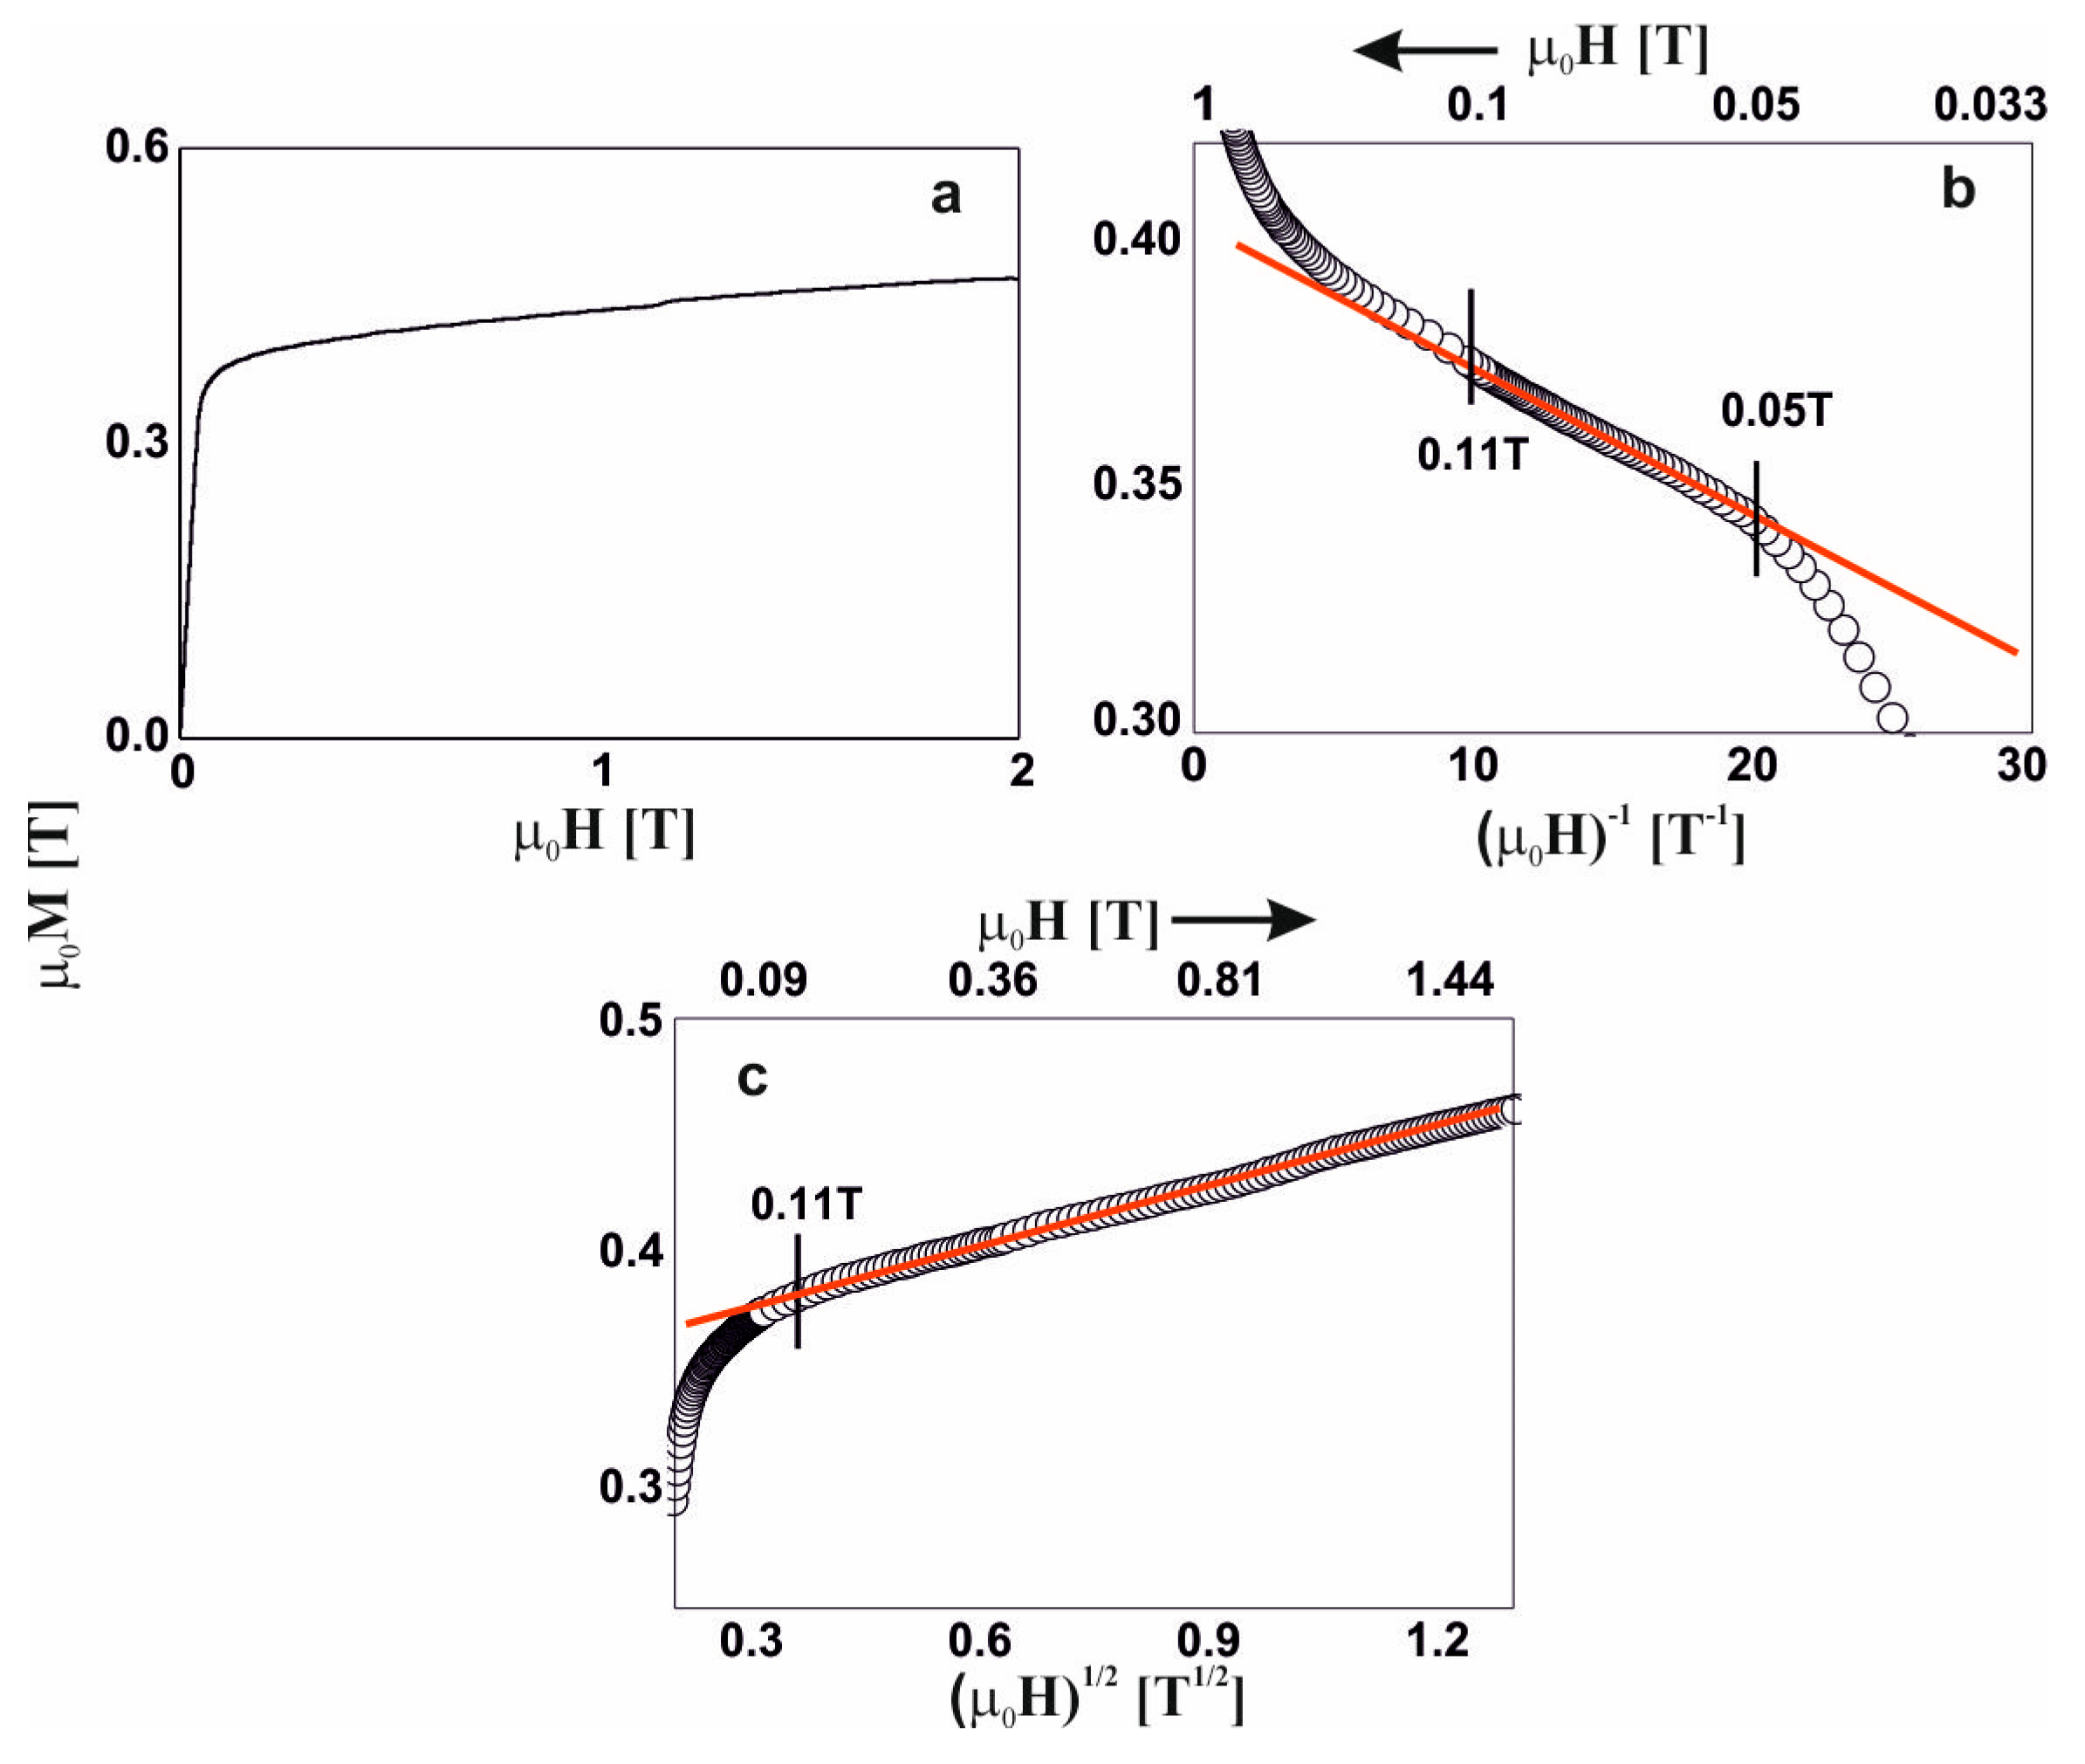
The magnetization process of Fe
65Nb
5Y
6Hf
4B
20 alloy (
Figure 5) was almost identical to the previous alloy. In this case, the Holstein–Primakoff paraprocess occurred in magnetic fields of greater than 0.1 T.
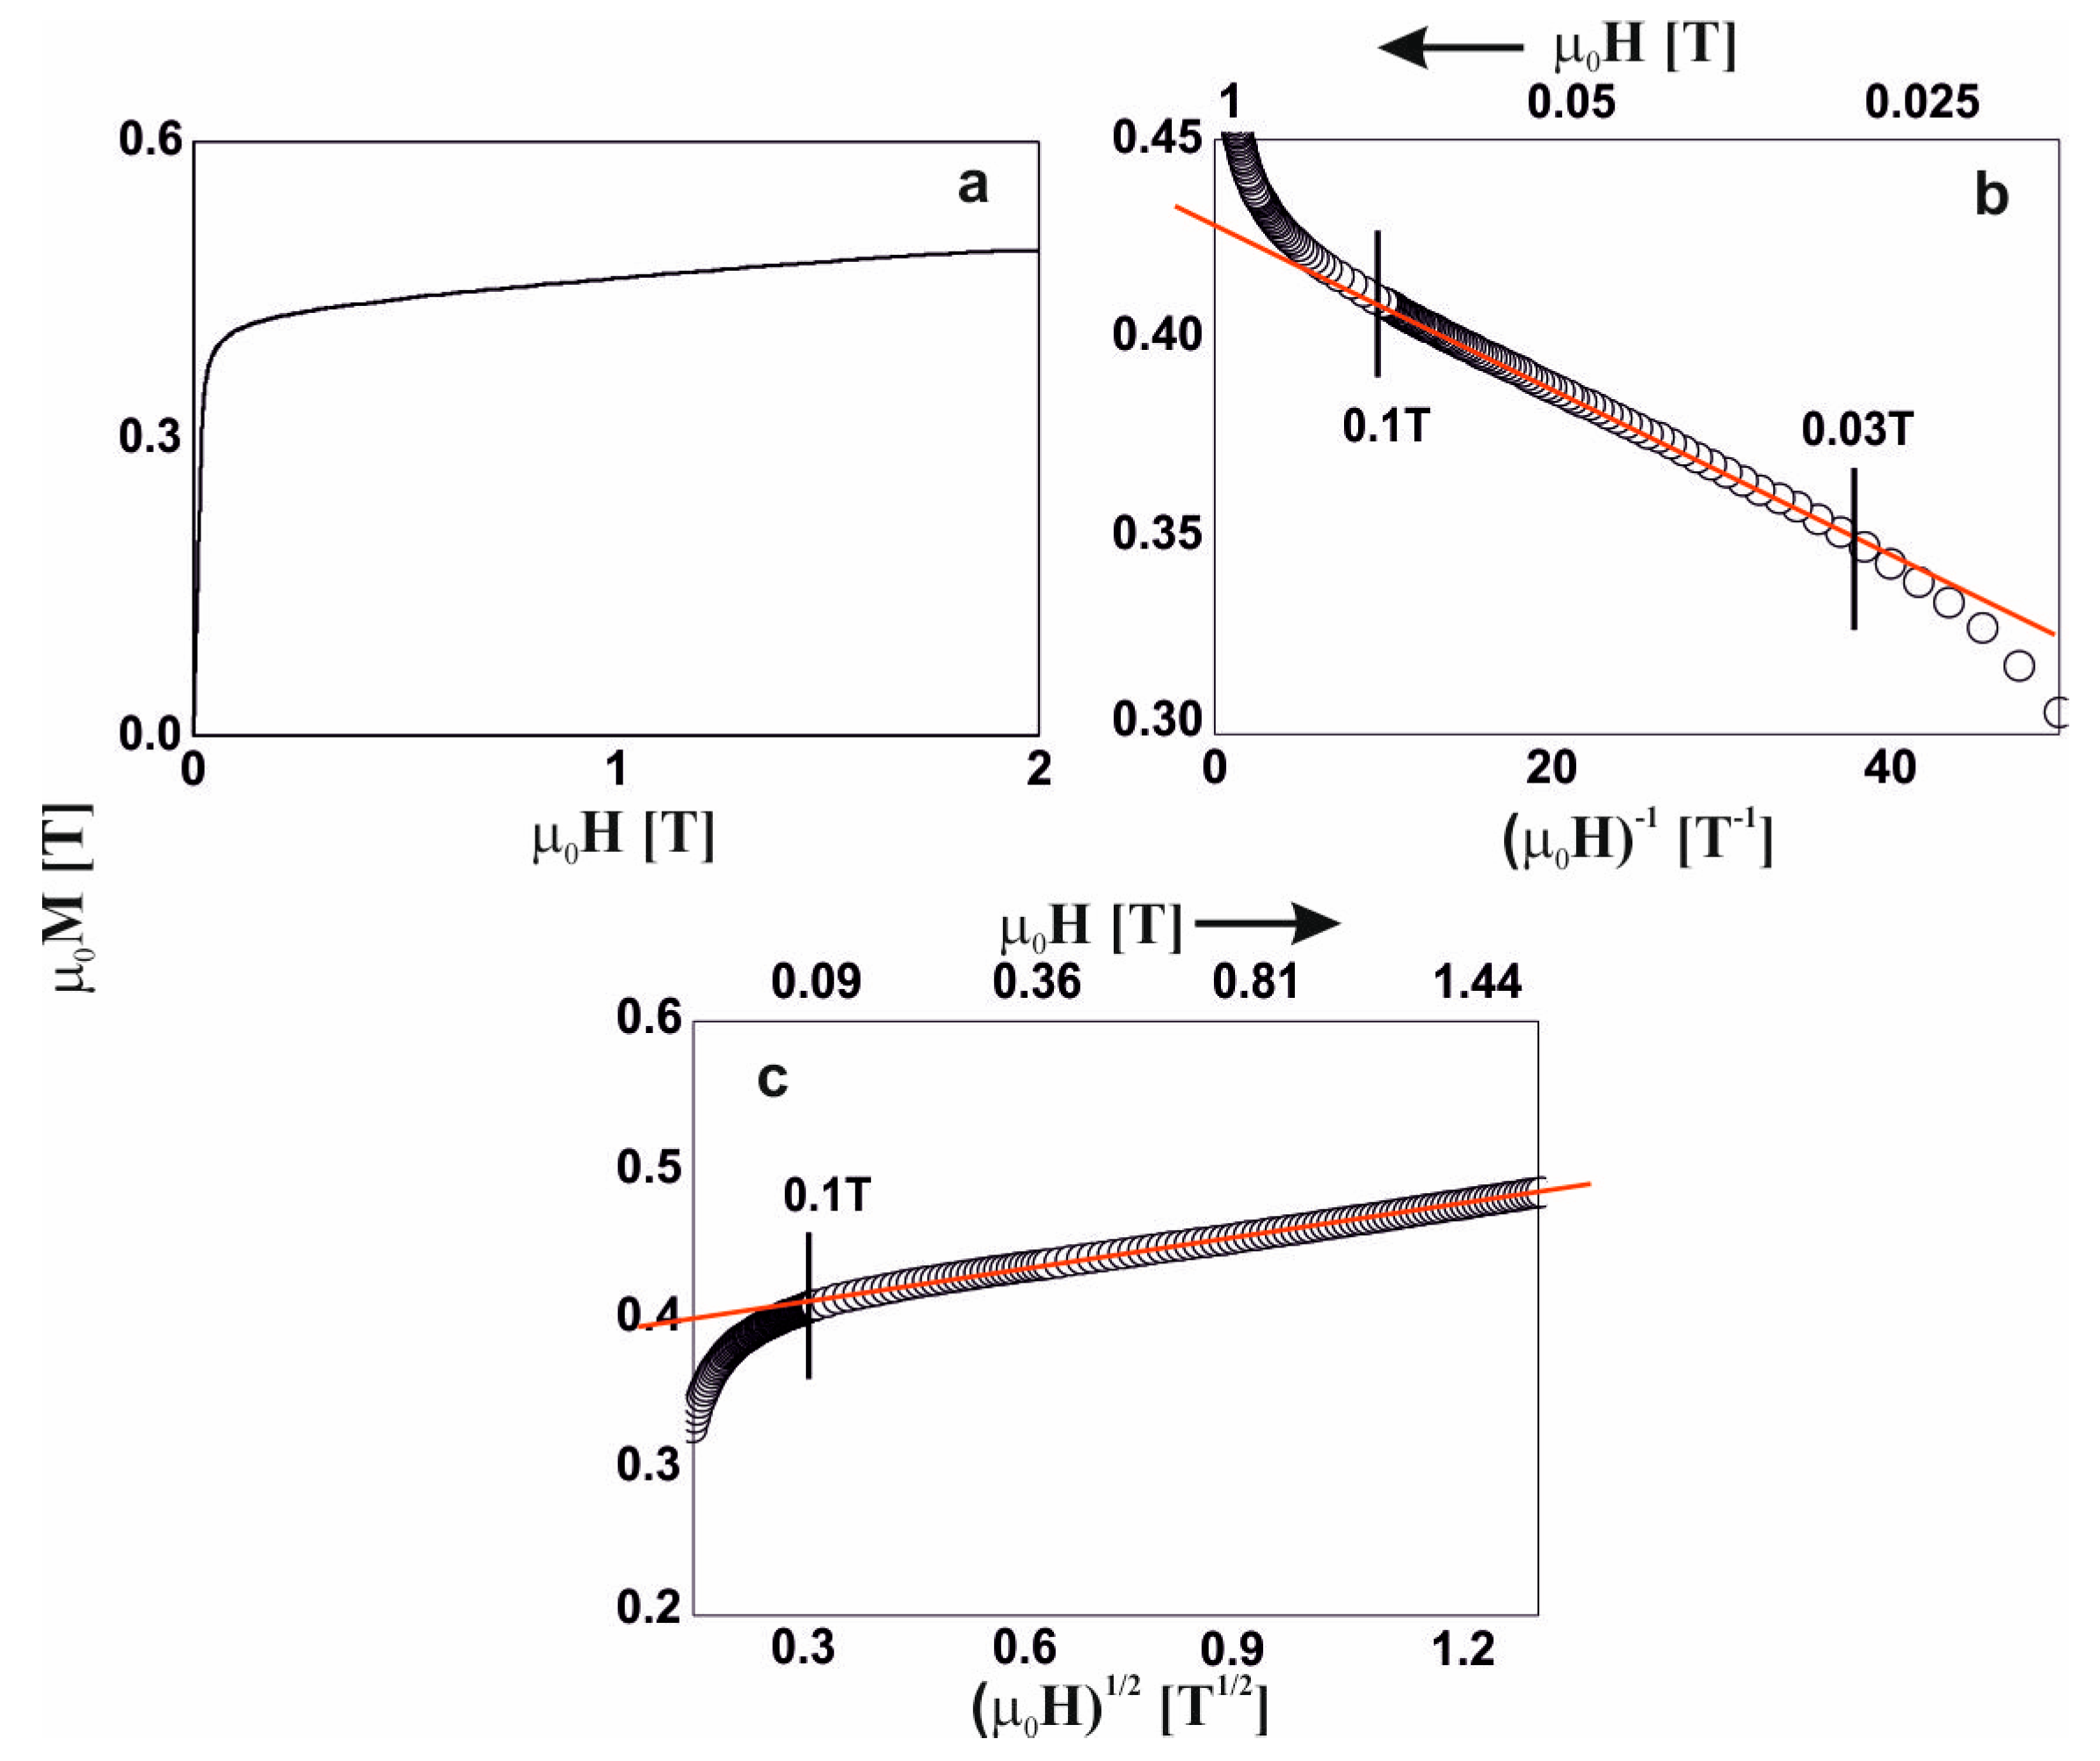
The analysis of the magnetization process of the: Fe
65Nb
5Y
7Hf
3B
20, Fe
65Nb
5Y
8Hf
2B
20, and Fe
65Nb
5Y
9Hf
1B
20 alloys (
Figure 6,
Figure 7 and
Figure 8) was similar. Linear defects, satisfying the relationship D
dip < 1
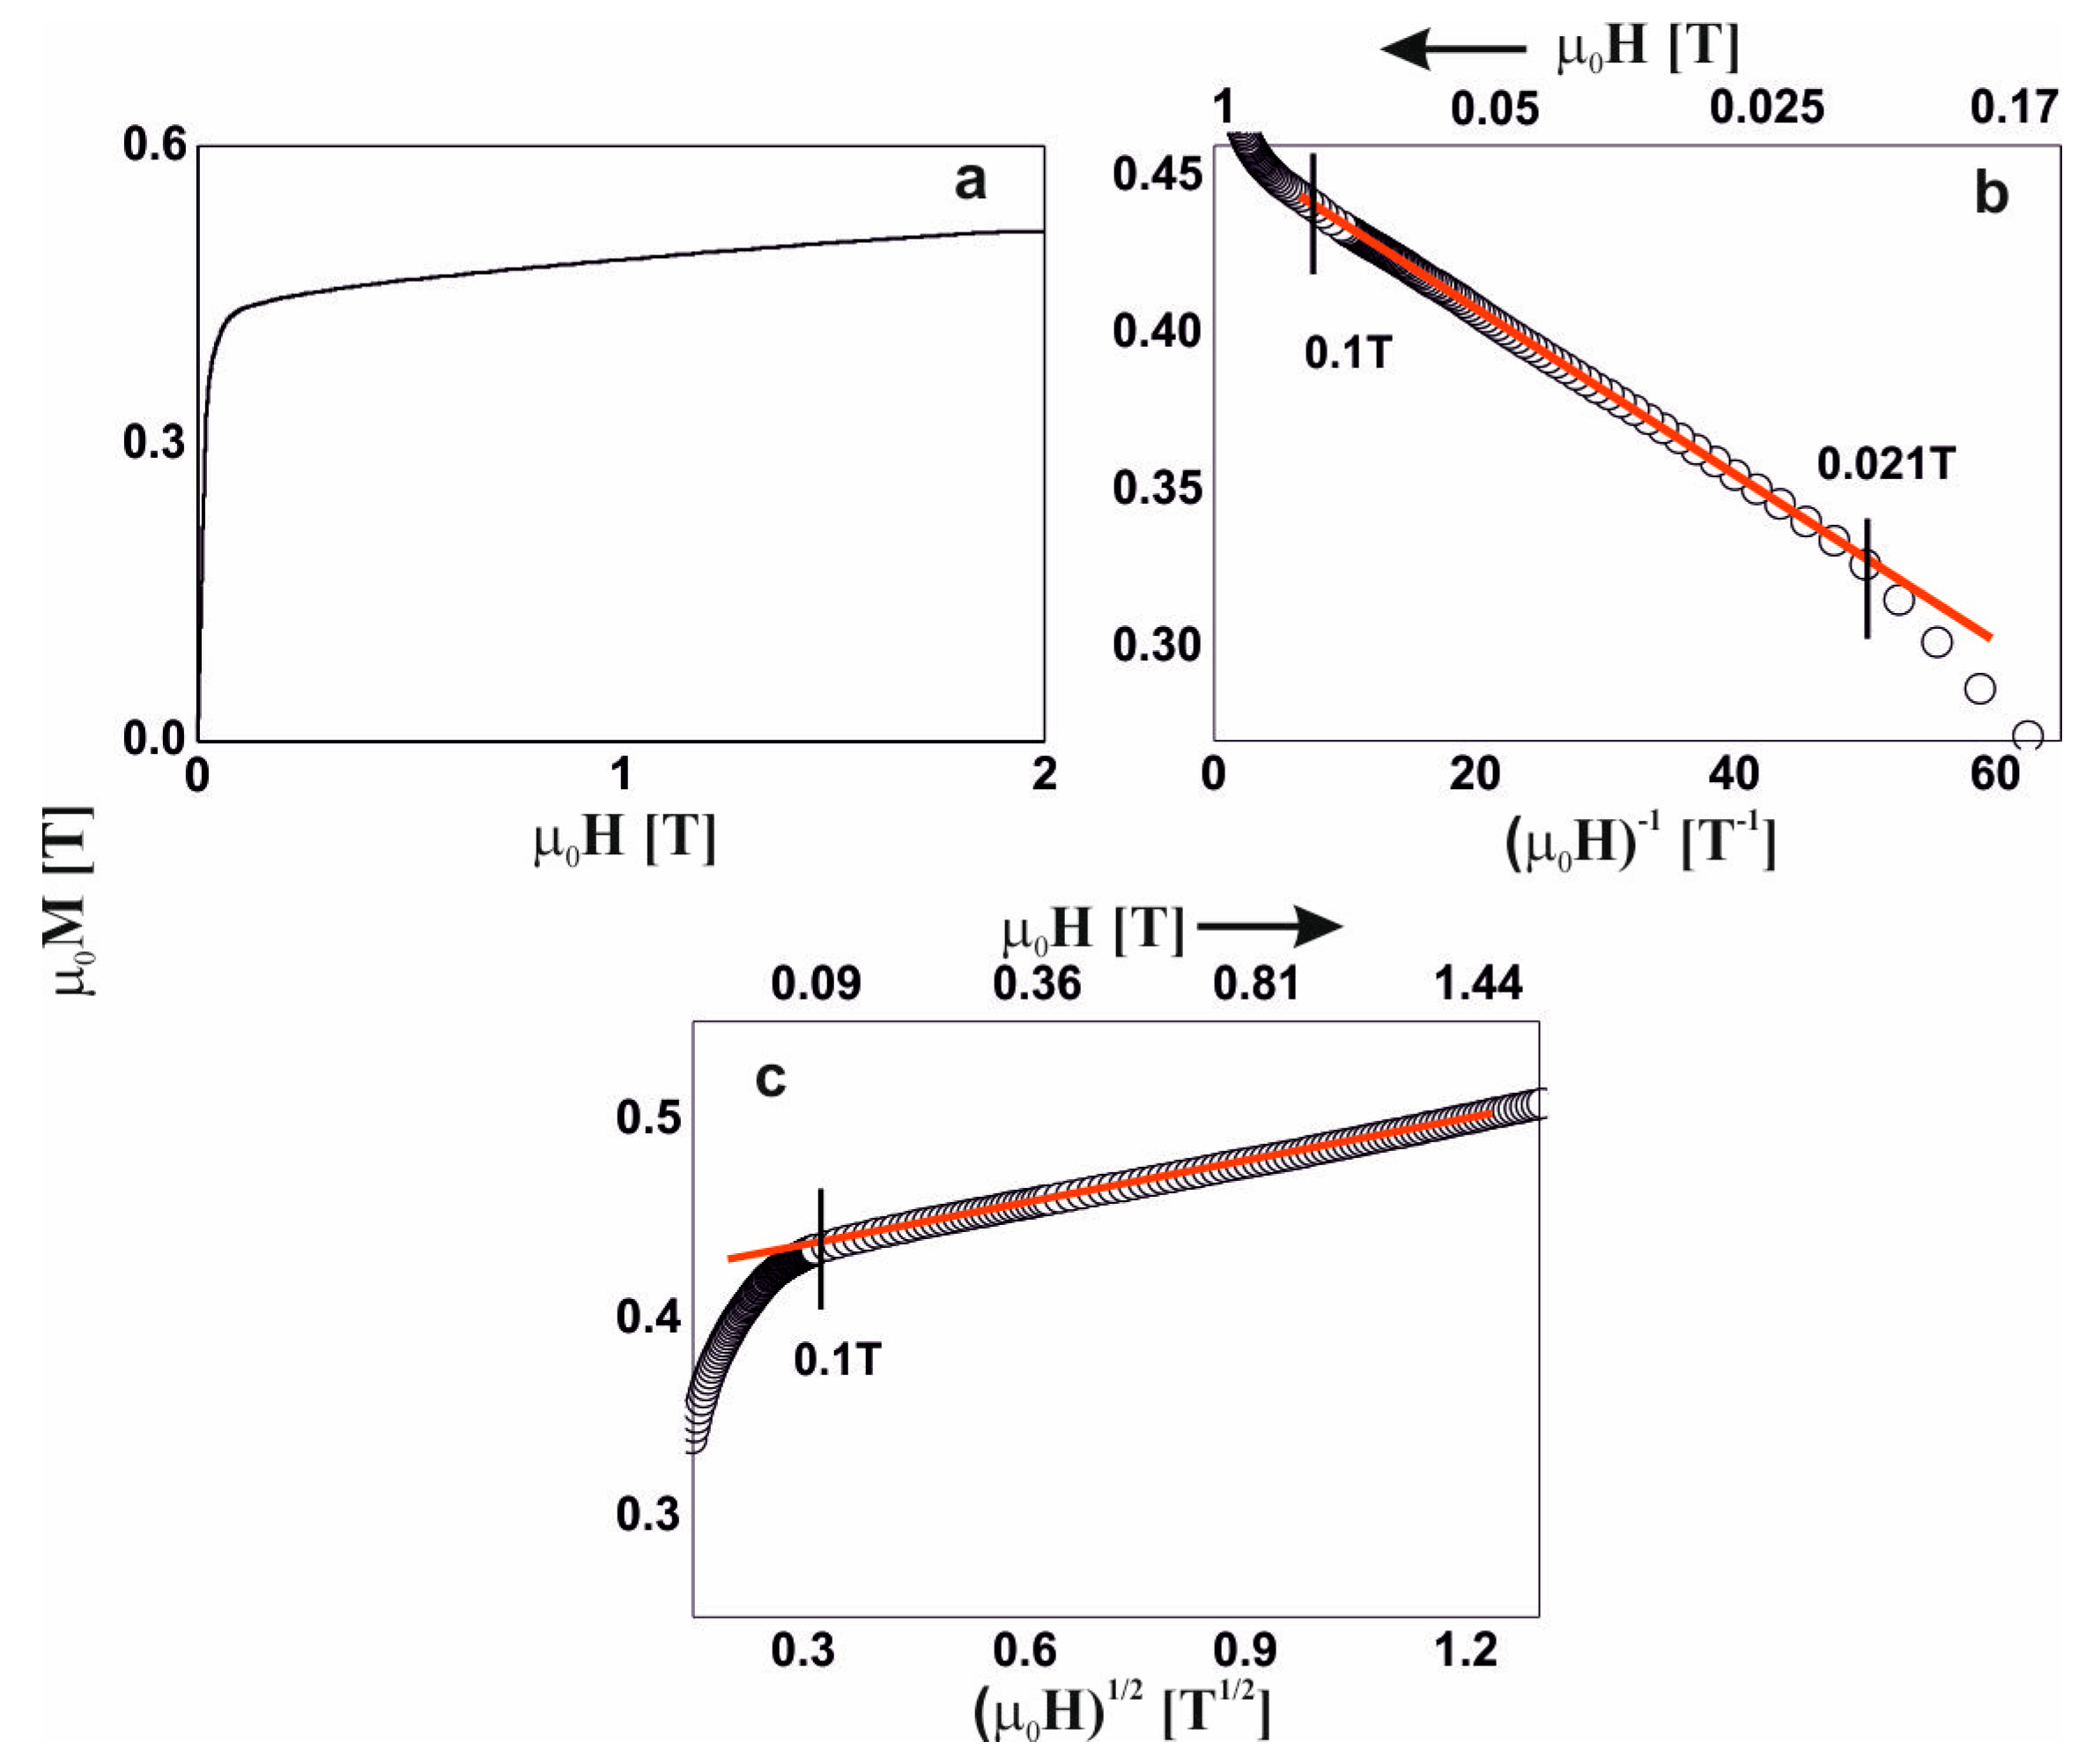
H, had a dominant effect on the magnetization process in magnetic fields of less than or equal to approximately 0.1T. In the case of the Fe
65Nb
5Y
10B
20 alloy (
Figure 9), based on analysis of the primary magnetization curves, the presence of linear defects—whose dimensions did not exceed the exchange distance l
H—was also discovered.
Based on analysis of the primary magnetization curves, the following parameters were determined:
Slope of the linear-fit curve for linear defects a1 [10−3];
The transition area to the Holstein–Primakoff paraprocess Ha1/HH-P [T];
Coefficient of linear fit to the Holstein–Primakoff paraprocess b [-];
Spin-wave stiffness parameter Dspf [10−2 meVnm2],
Surface density of linear defects Ndip [1017 m−2];
Saturation magnetization MS [T].
Table 1 contains the results of analysis of the magnetization processes pertaining to the tested alloys.
4. Discussion
All of the tested materials had a disordered structure, as evidenced by the recorded diffractograms; only broad, fuzzy maxima were present. These reflections arose due to the reflection of X-rays from chaotically spaced atoms within the sample volume. There were no narrow peaks that would indicate the presence of crystalline phases. All of the tested alloys were characterized by low values of saturation magnetization (0.42–0.6 T) in relation to the significant iron content (65% atomic). In the volume of the investigated alloys, it is possible that there were areas for which antiferromagnetic ordering was more privileged in energy terms. It is also possible that the tested materials had residual quantities of paramagnetic phases according with the Mössbauer results. In the case of a small number of these phases, it was not possible to identify them using X-ray diffraction.
The value of the coercive field HC [A/m] was determined on the basis of static magnetic hysteresis loops.
For the sample Fe
65Nb
5Y
10B
20, we observed a definitely higher value of the coercive field than for the other tested alloys. The introduction of an additional component into the alloy characterized by a large atomic radius and a large negative heat of mixing in relation to most of the alloy components caused a slowdown in the movement of atoms during the solidification process, which was in accordance with the Inoue criteria. This choice of alloy composition significantly increased melt viscosity and reduced diffusion of alloying elements during solidification. On this basis, it can be assumed that the incorporation of any component into an alloy that meets the Inoue criteria will have a similar effect on glass-forming ability as Hf. As is known, amorphous materials based on Fe due to the lack of long-range interactions between atoms exhibit good soft magnetic properties. For a smaller number of components, i.e., for the FeNbYB alloy, it follows that the setting time should be longer than for the five-component FeNbHfYB alloys. This means that privileged system clusters are much easier to form in four-component systems. In numerous studies [
28] of alloys with the addition of Y (FeCoYB), it has been demonstrated that one of the most frequently formed crystalline phases is magnetically soft phase αFe, magnetically semi-hard phase Fe
5Y, and magnetically hard phase Y
2Fe
14B. In the case of the FeNbYB alloy, an axial shape of the hysteresis loop was observed, indicating the appearance of a magnetic phase in the alloys with hard or semi hard magnetic properties.
The magnetizing process of all the tested alloys in high magnetic fields is associated with the presence of pseudodislocation dipoles—whose dimensions do not exceed the exchange distance.
According to H. Kronmuller’s theory, at a given range of external magnetic field strength, only one type of defect affects magnetization, in order: point defects, and linear defects satisfying the relationship Ddip < 1H and Ddip > 1H. At higher values of external magnetic field intensity, magnetization is associated with the damping of thermally excited spin waves. The transition between the subsequent stages of the magnetization process must be smooth, that is, if linear defects satisfying the Ddip <1H relationship affect the magnetization process in the range of 0.2 T, then above this area the Ddip > 1H relationship must be satisfied—or the Holstein–Primakoff paraprocess must occur.
Due to the presence of linear defects satisfying the relationship Ddip < 1H, it is possible to determine such parameters as the dimensions of the defects (dipole width Ddip) and the surface density of Ndip linear defects.
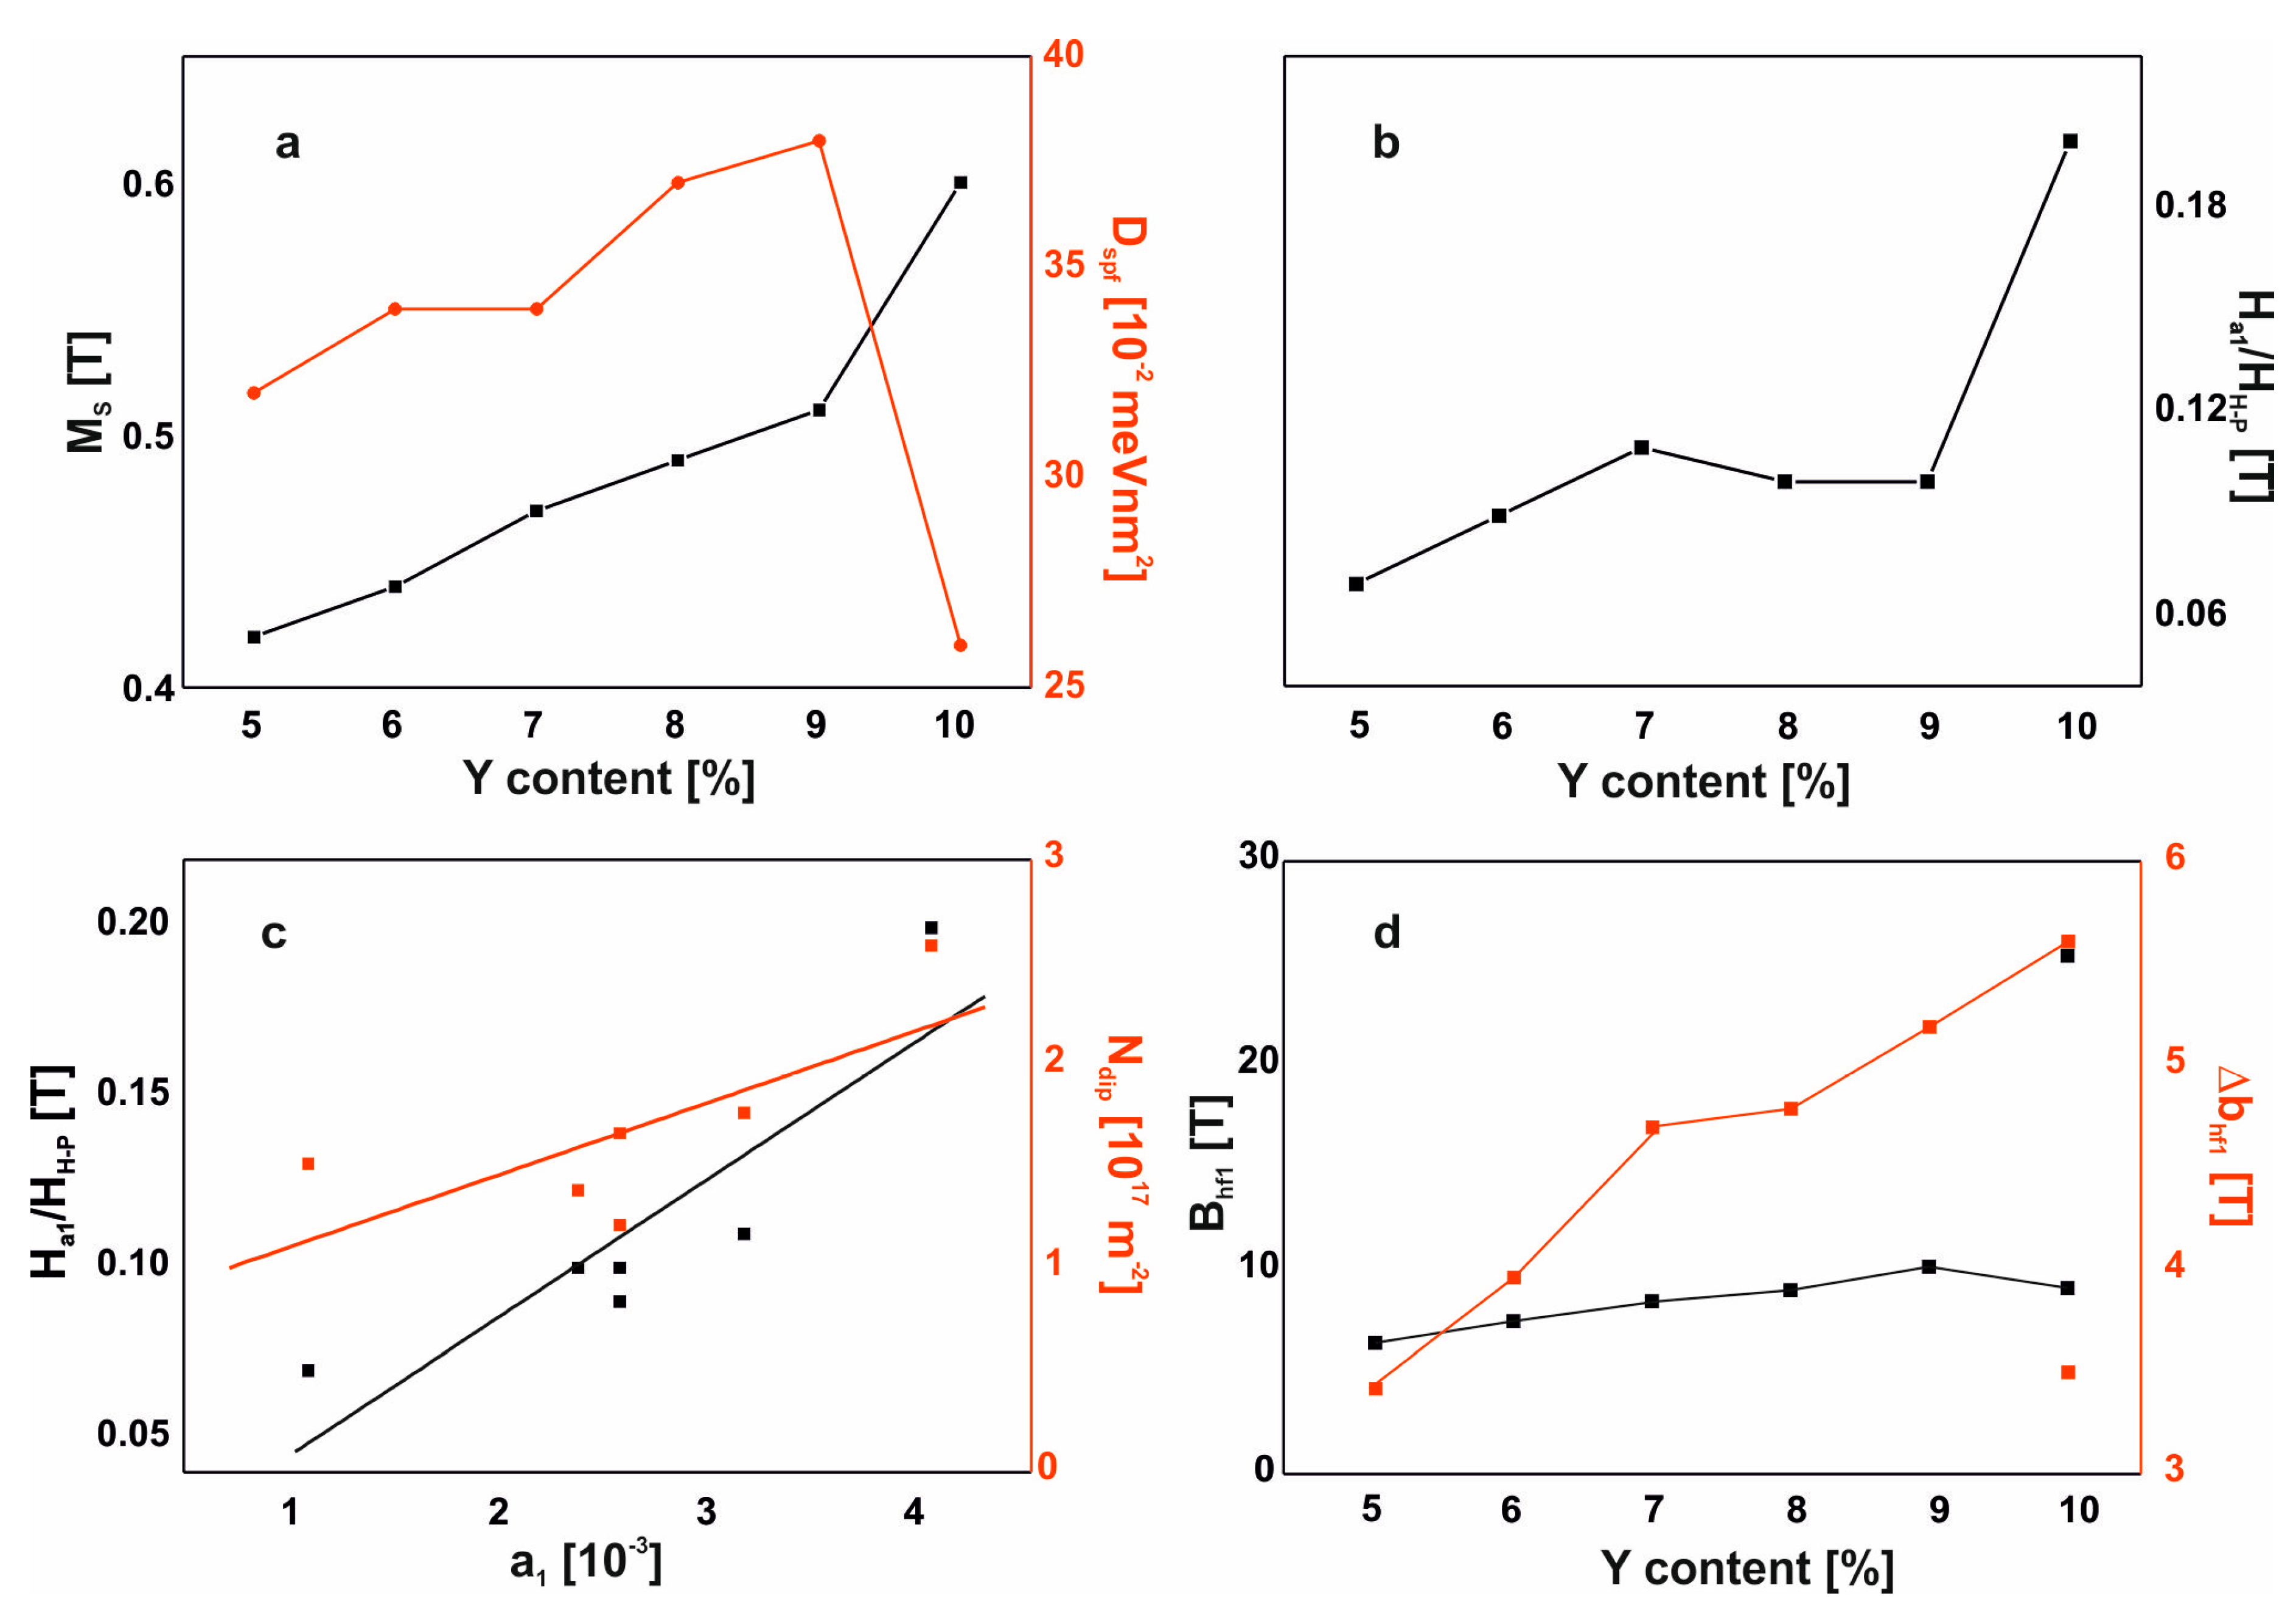
The results presented in
Table 1 confirm that the increasing Y content in the alloy causes the decrease surface density of linear defects, N
dip (for alloys with Hf). This, in turn, increases the packing density of atoms. For a sample without the Hf addition, the width of the pseudodislocation dipole is the largest, which causes a decrease in the D
spf value.
For each of the examined alloys, the magnetization process in strong magnetic fields (above the range where the relationships involving the influence of structural defects are valid) proceeded as a result of Holstein–Primakoff paraprocess, i.e., by damping of the thermally induced spin waves by the magnetic field.
The existence of phases within the amorphous structure and the creation of clusters of the Fe5Y crystalline phase affect changes in the interactions between the magnetic atoms. Inhomogeneity of the structure hinders the movement of the spin-wave and causes a decrease in the value of the Dspf parameter. An increase in the coercivity value for the Fe65Nb5Y10B20 alloy is also connected with the existence of different phases within the structure. Creation of crystalline phase nuclei prevents movement of the domain walls and hinders the magnetization process.
Based on the test results, some relationships were found. They are presented in the form of a diagram in
Figure 10.
The first relationship found is the monotonic increase in saturation magnetization with increasing Y content in the alloy (an increase of approximately 0.02T per 1 atomic% Y). The exception in this case is the alloy with no addition of Hf, for which the saturation magnetization increases by 0.09 T. A similar relationship was found for the value of the transition field to the Holstein–Primakoff paraprocess. Based on these relationships, it should be stated that the examined process of magnetizing the examined alloys is identical for all the tested Y contents—from 5% to 9% atomic. For these alloys, the value of the D
spf parameter increases linearly. In the case of the alloy without the addition of Hf, significant structural reconstruction occurs. This alloy is harder to magnetize, as evidenced by the higher value of the transition field to the Holstein–Primakoff paraprocess and the much higher value of the coercive field, compared to other alloys. It is also interesting that this alloy has the highest M
S and the lowest value of the D
spf parameter. The value of this parameter can be associated with the environment of the Fe atoms: the number of magnetic neighbors and the distances between them. In fact, this part of the work is not provided with literature equivalents and one can get the impression that the information presented is based on assumptions. According to Kaul [
29] and Corb [
30] in the work of Kronmüller, in a relaxed amorphous structure, each magnetic atom has 12 neighbors, and in non-relaxed, 9–10 neighbors. An increase in the D
sp parameter value may be associated with an increased number of the nearest magnetic atoms, which is associated with the improvement of short-range chemical order (SRO). A lower value of the D
spf parameter in this case may mean an increase in the distance between individual Fe atoms. The arrangement of atoms in this alloy can reduce the presence of antiferromagnetic ordering, resulting in a higher saturation magnetization. However, the configuration of magnetic atoms in the Fe
65Nb
5Y
10B
20 alloy has a negative effect on creating soft magnetic properties, causing a significant increase in the coercive field value. The dependence of the coefficient
a1 on the value of the transition field to the Holstein–Primakoff paraprocess was also identified: as the coefficient a1 increases, the necessary value of the external magnetic field—in which magnetization depends on the damping of thermally-induced spin-waves—also increases. A similar relationship was found for the density of linear defects: N
dip increases with increasing value of the coefficient a
1.


 and
and 
