Rotational Compression of Cylindrical Specimen As a New Calibrating Test for Damage Criteria


Abstract
1. Introduction
2. Material and Methods
2.1. Experimental Tests
2.2. Numerical Analysis
3. Results and Discussions
4. Conclusions
- A new method of calibrating the damage function was developed; in this method, the material cracks in the axial area of the sample as a result of the so-called Mannesmann effect;
- The developed calibrating test is recommended for the alloys of hot-worked metals, especially by cross- and skew rolling.
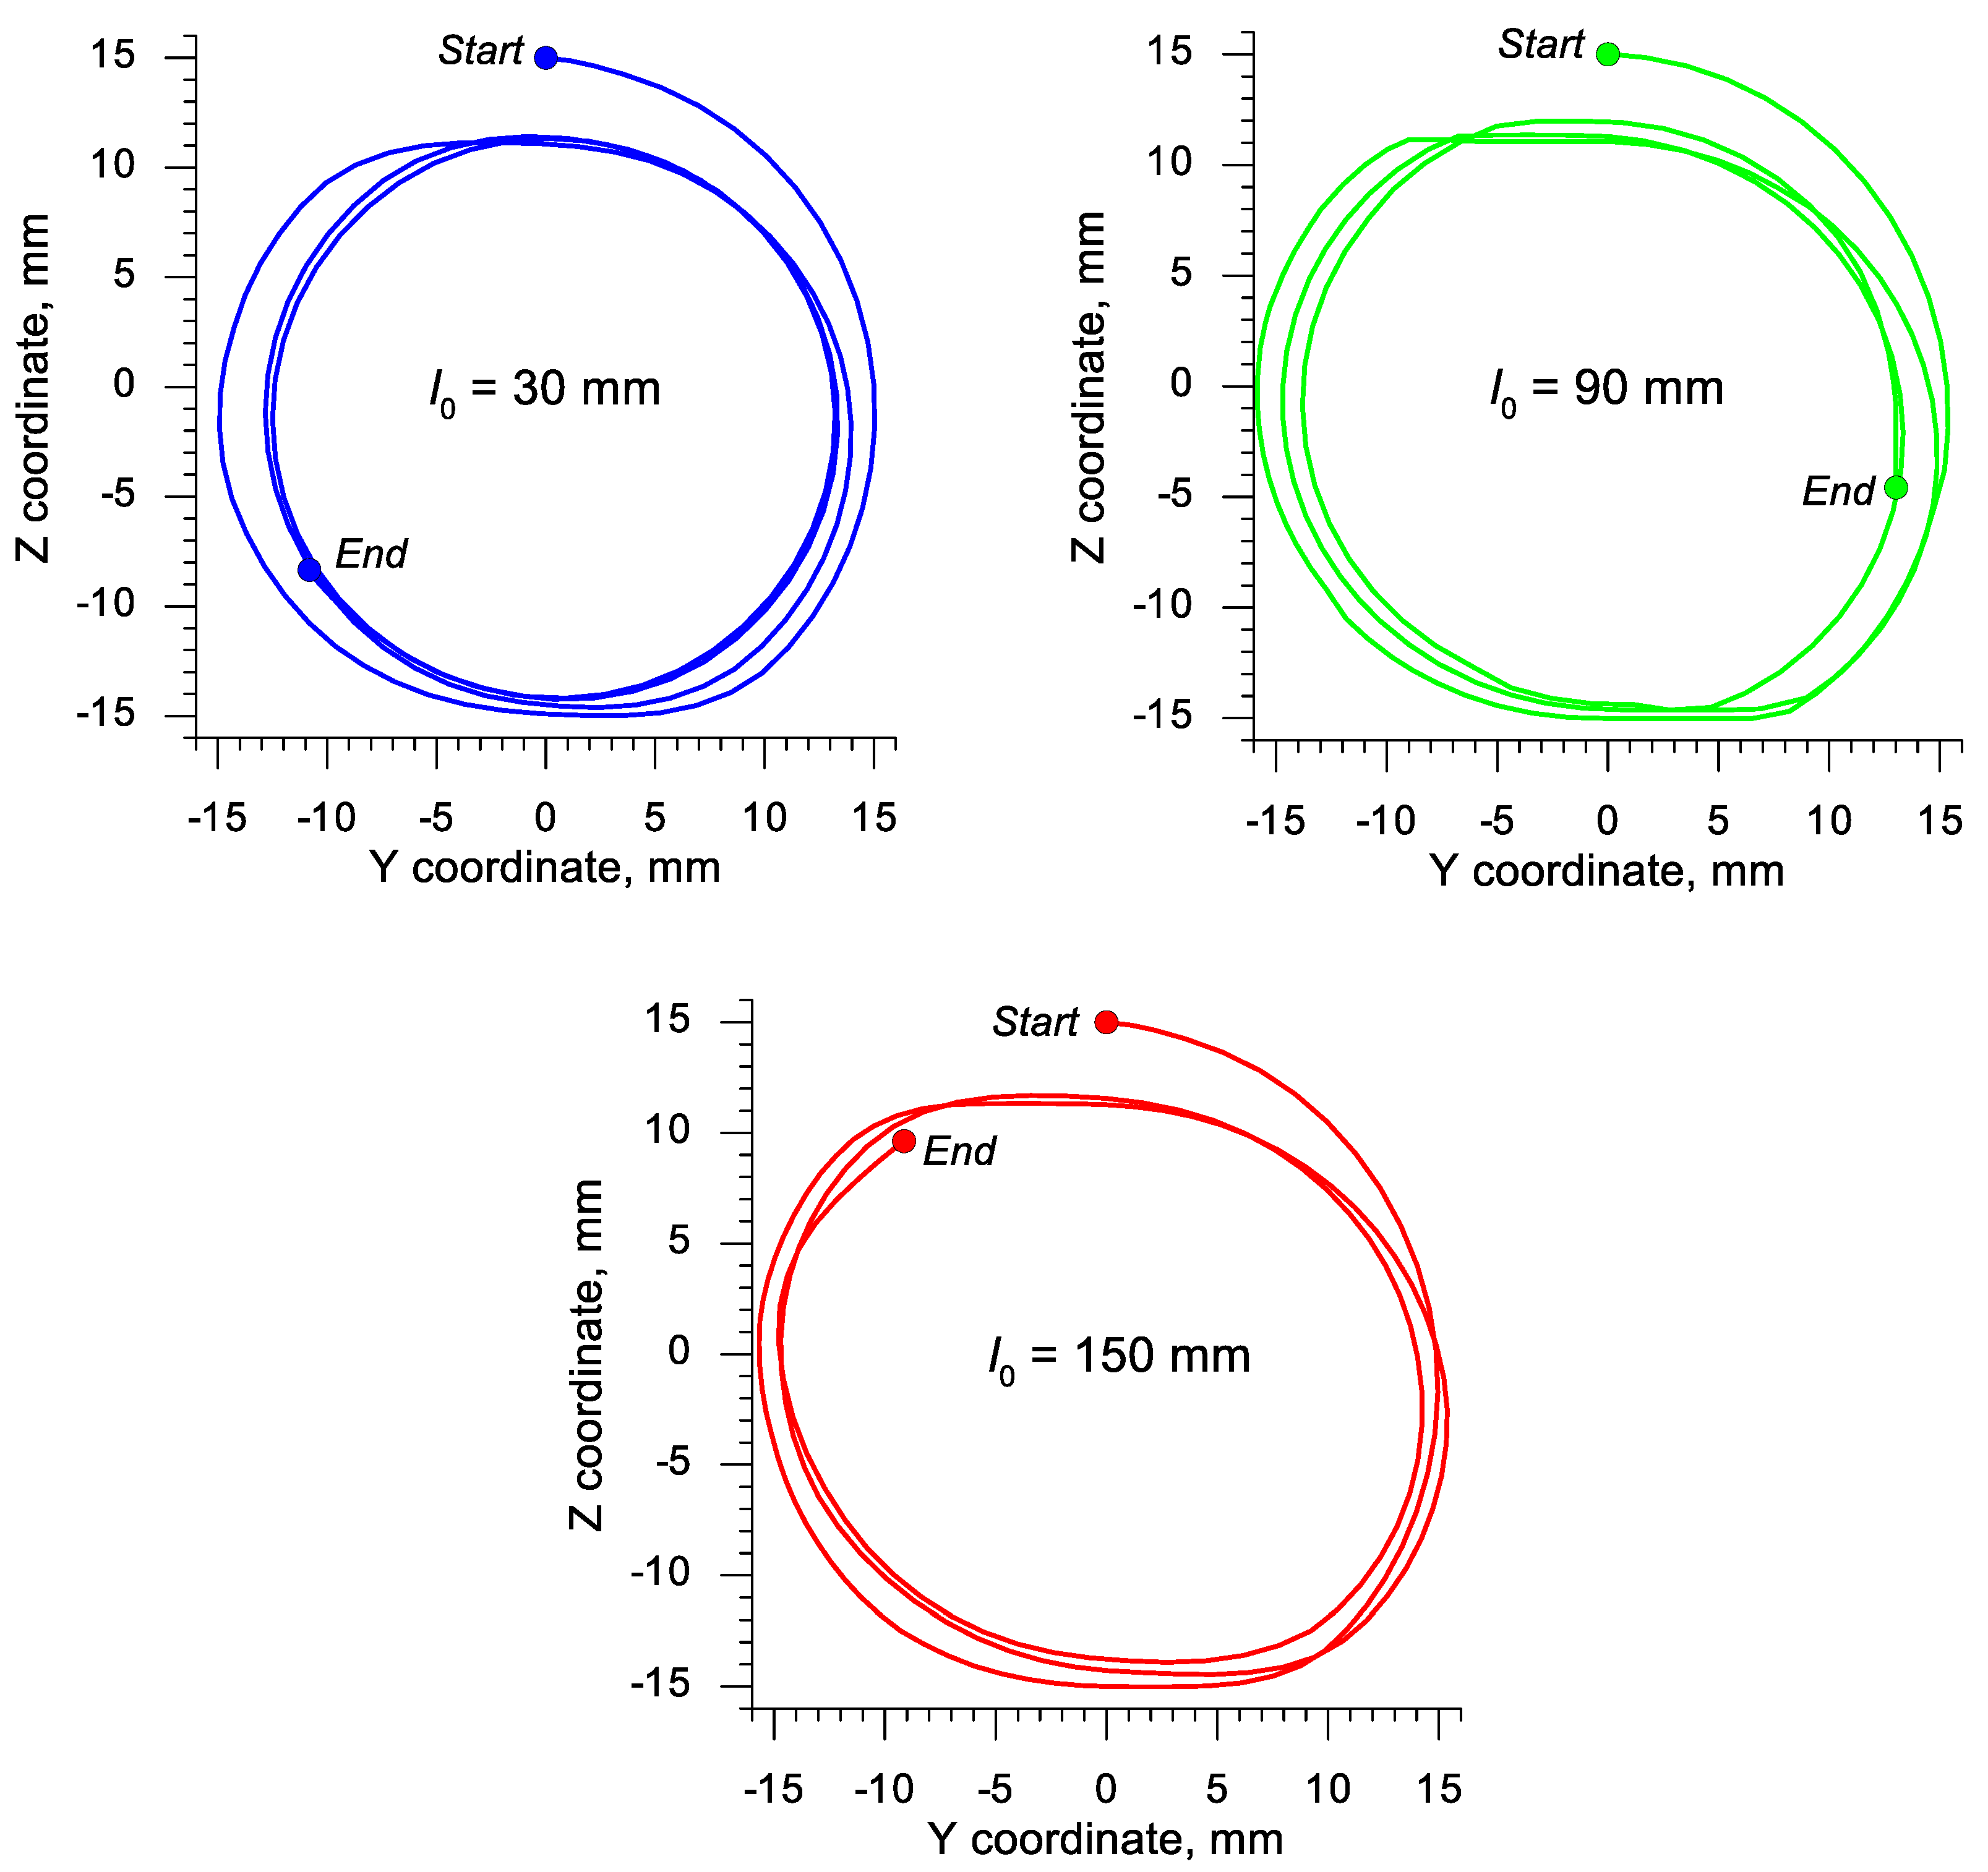
- The course of the rotational compression test (with the determined reduction ratio δ) depends strongly on the initial length of the sample; at δ = 1.15 the material cracks in the axial area of the sample when the length of the sample is at least two times greater than its diameter;
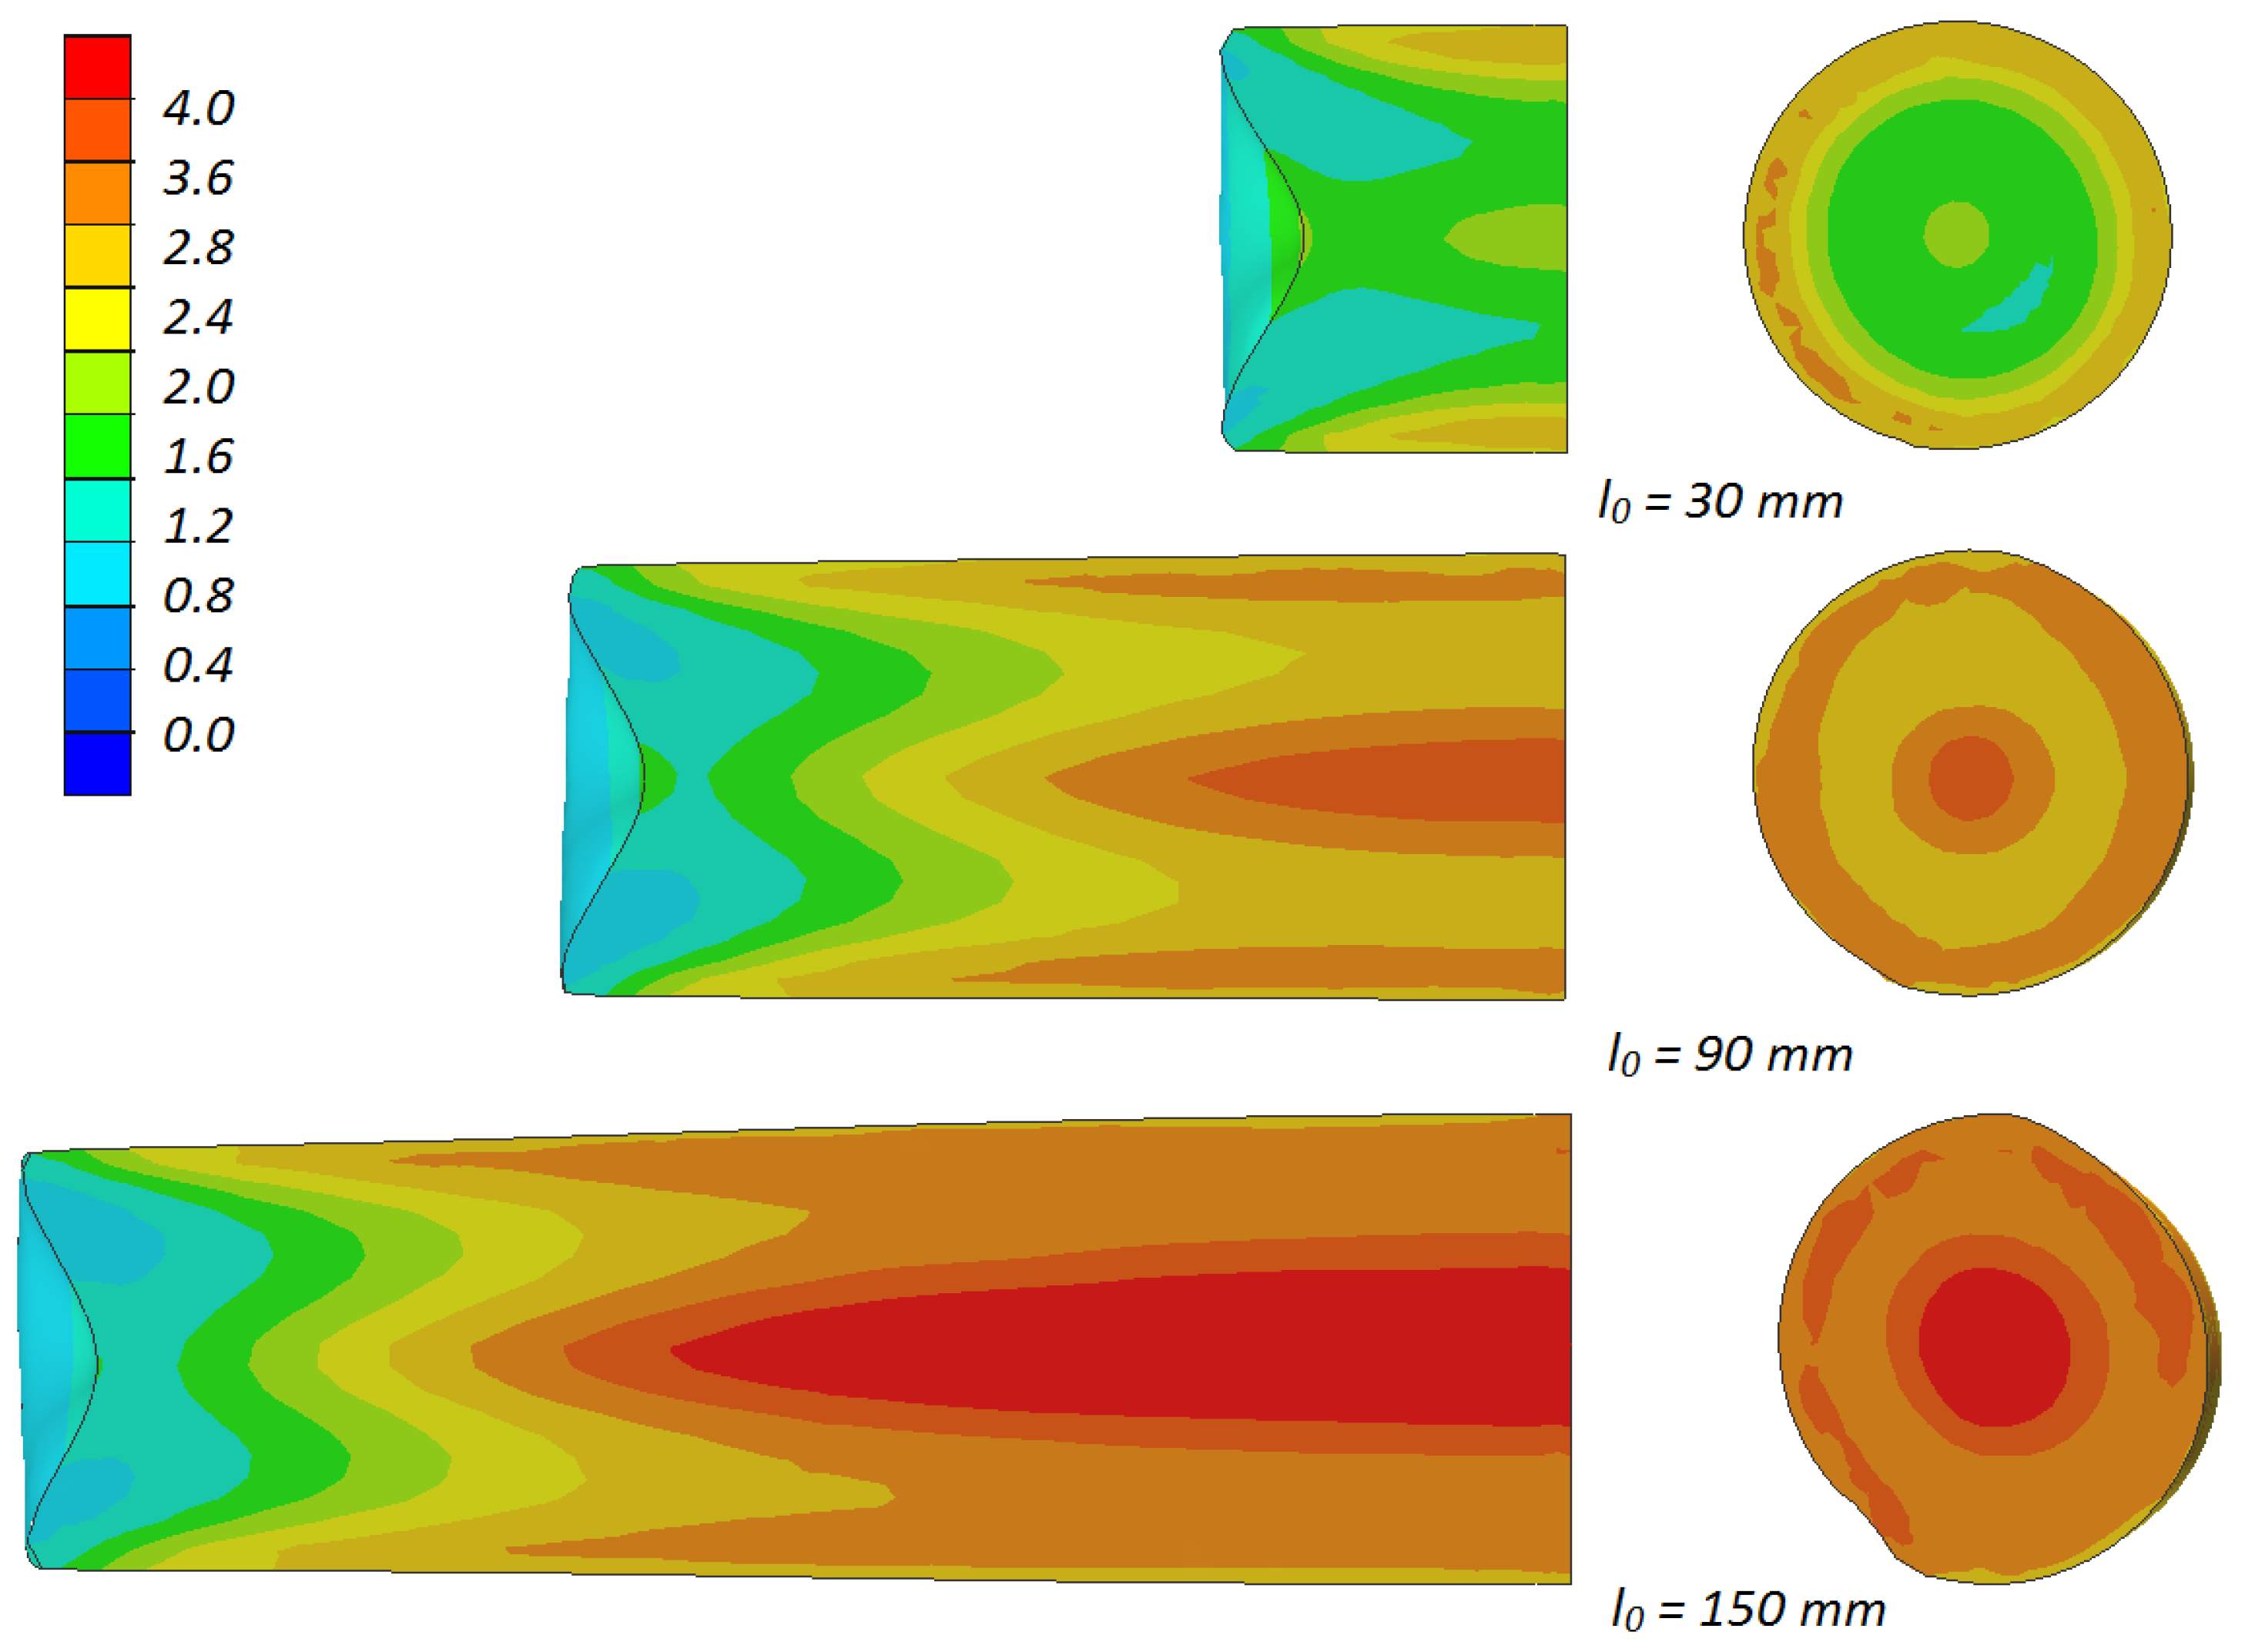
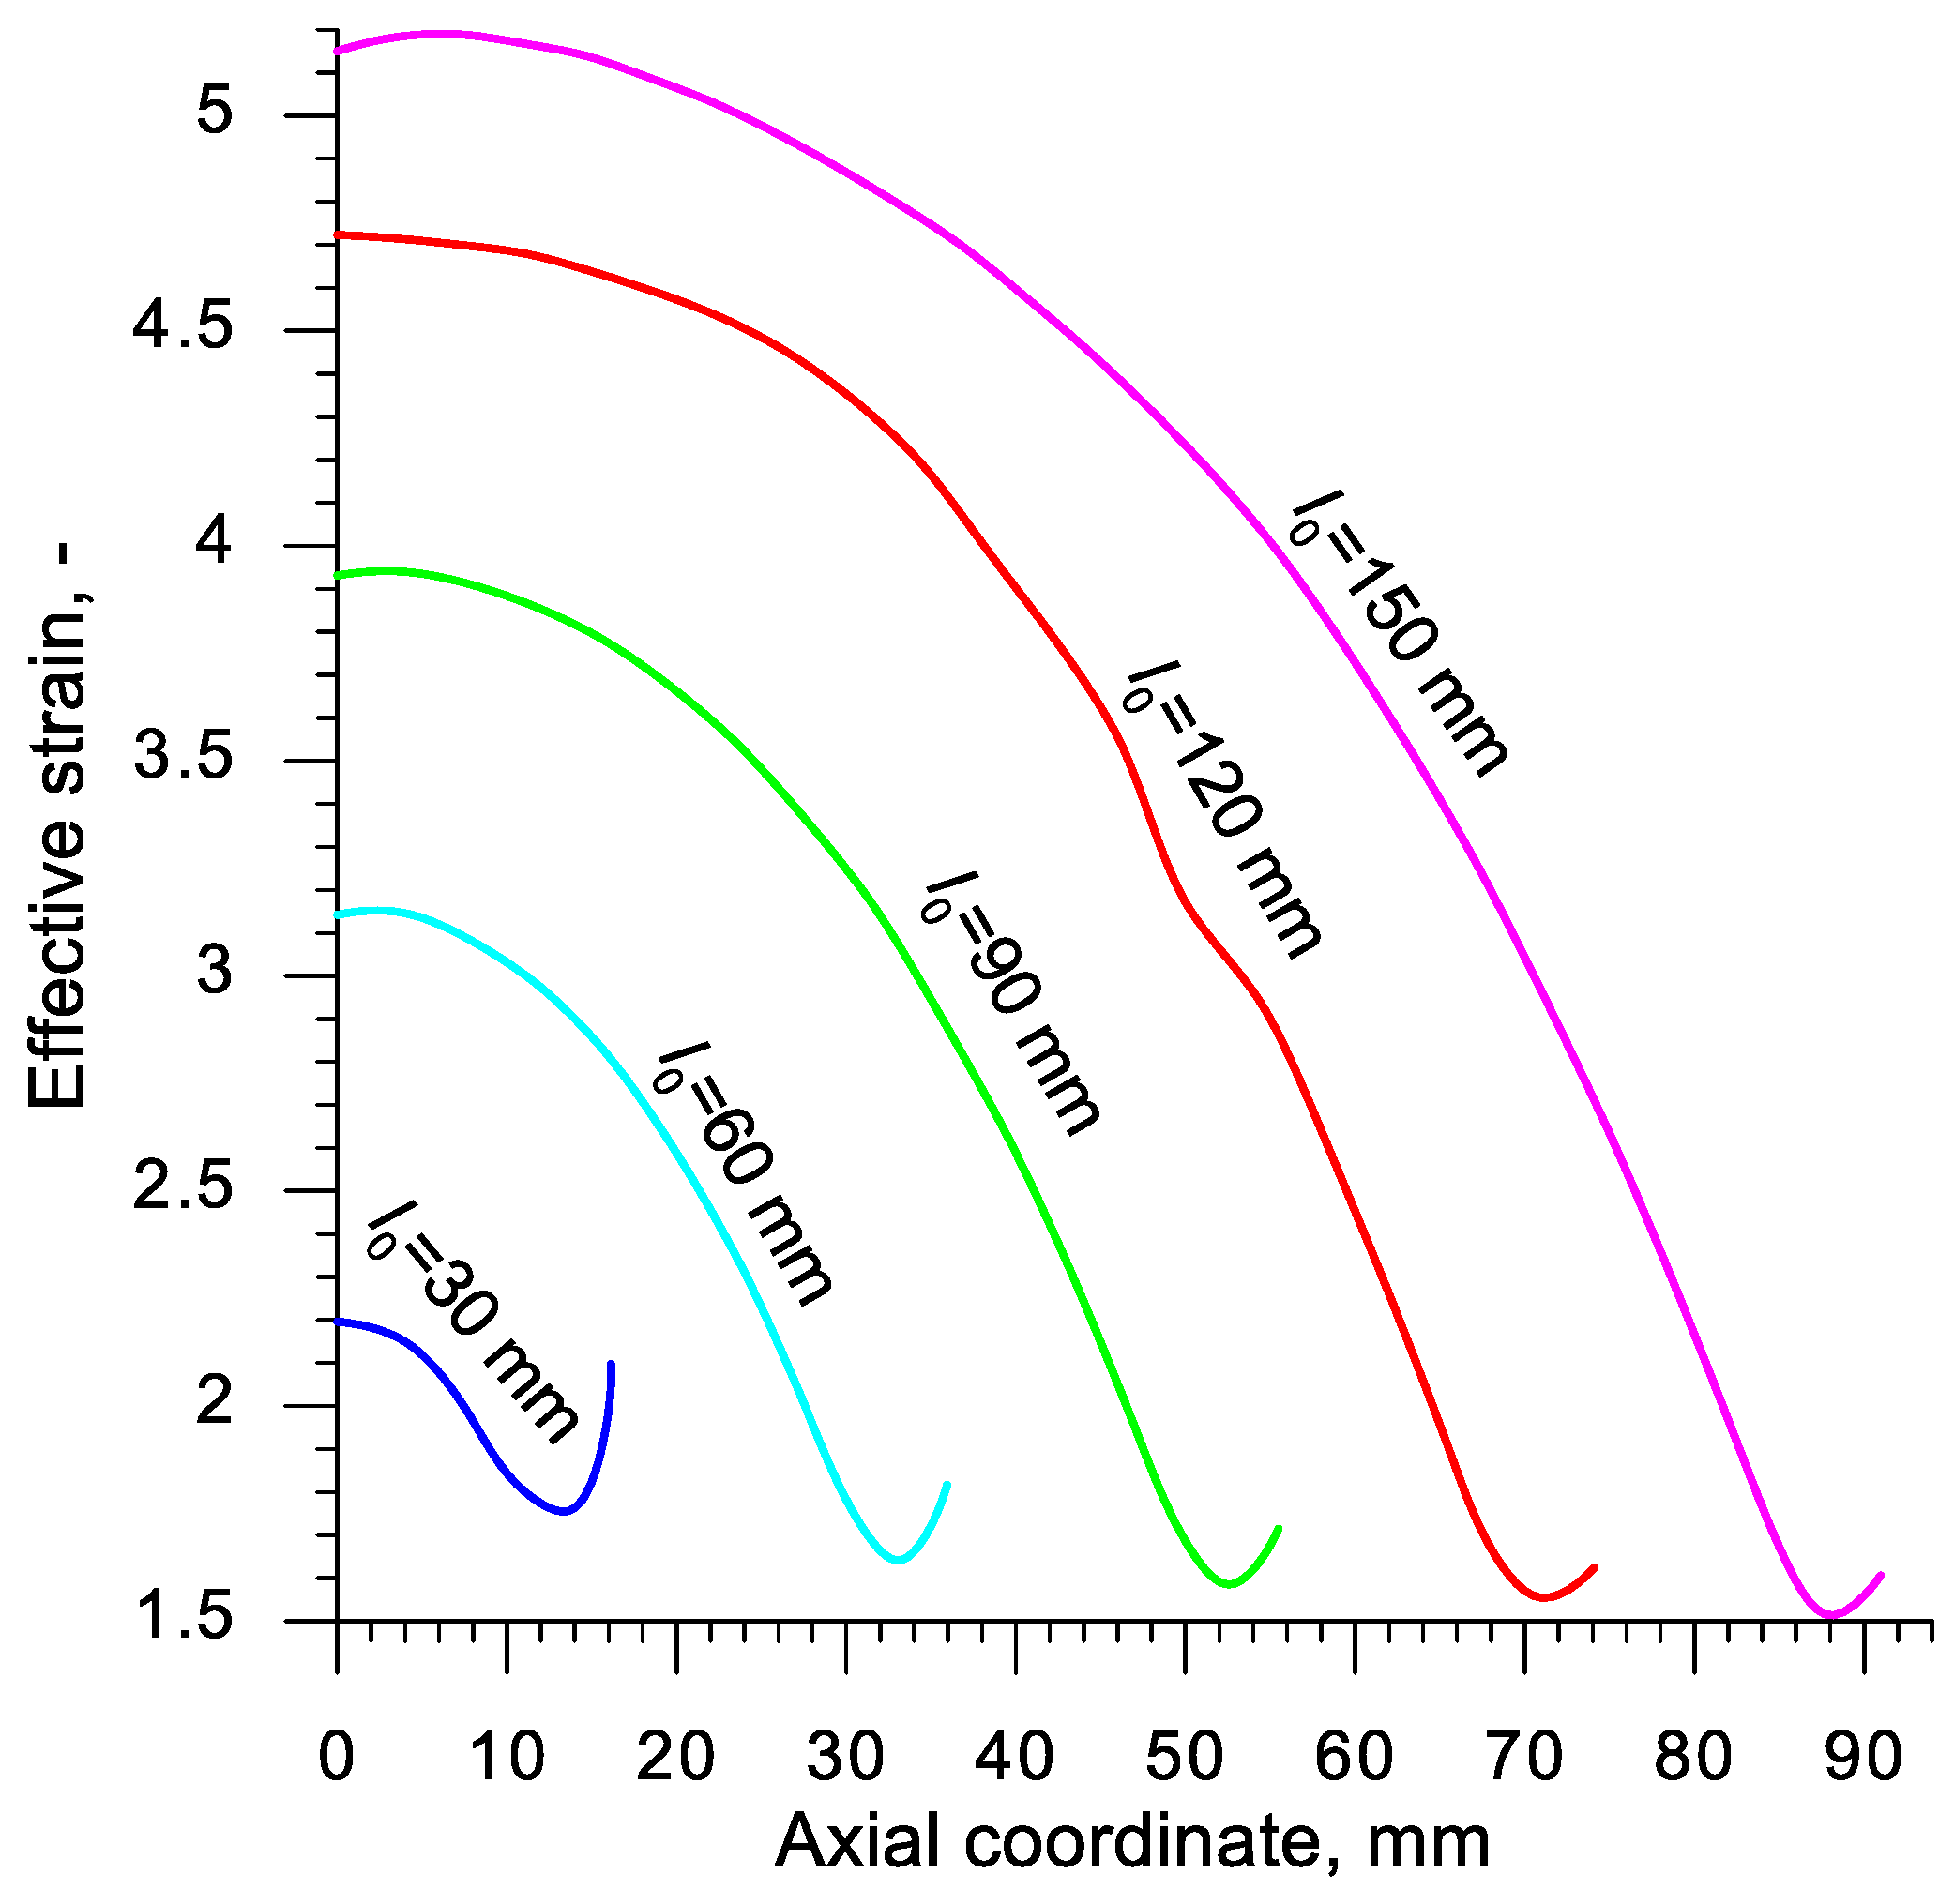
- In the rotational compression test, the material is the most deformed in the axial area of the sample; those deformations are caused by the intensive material flow in the tangential direction;
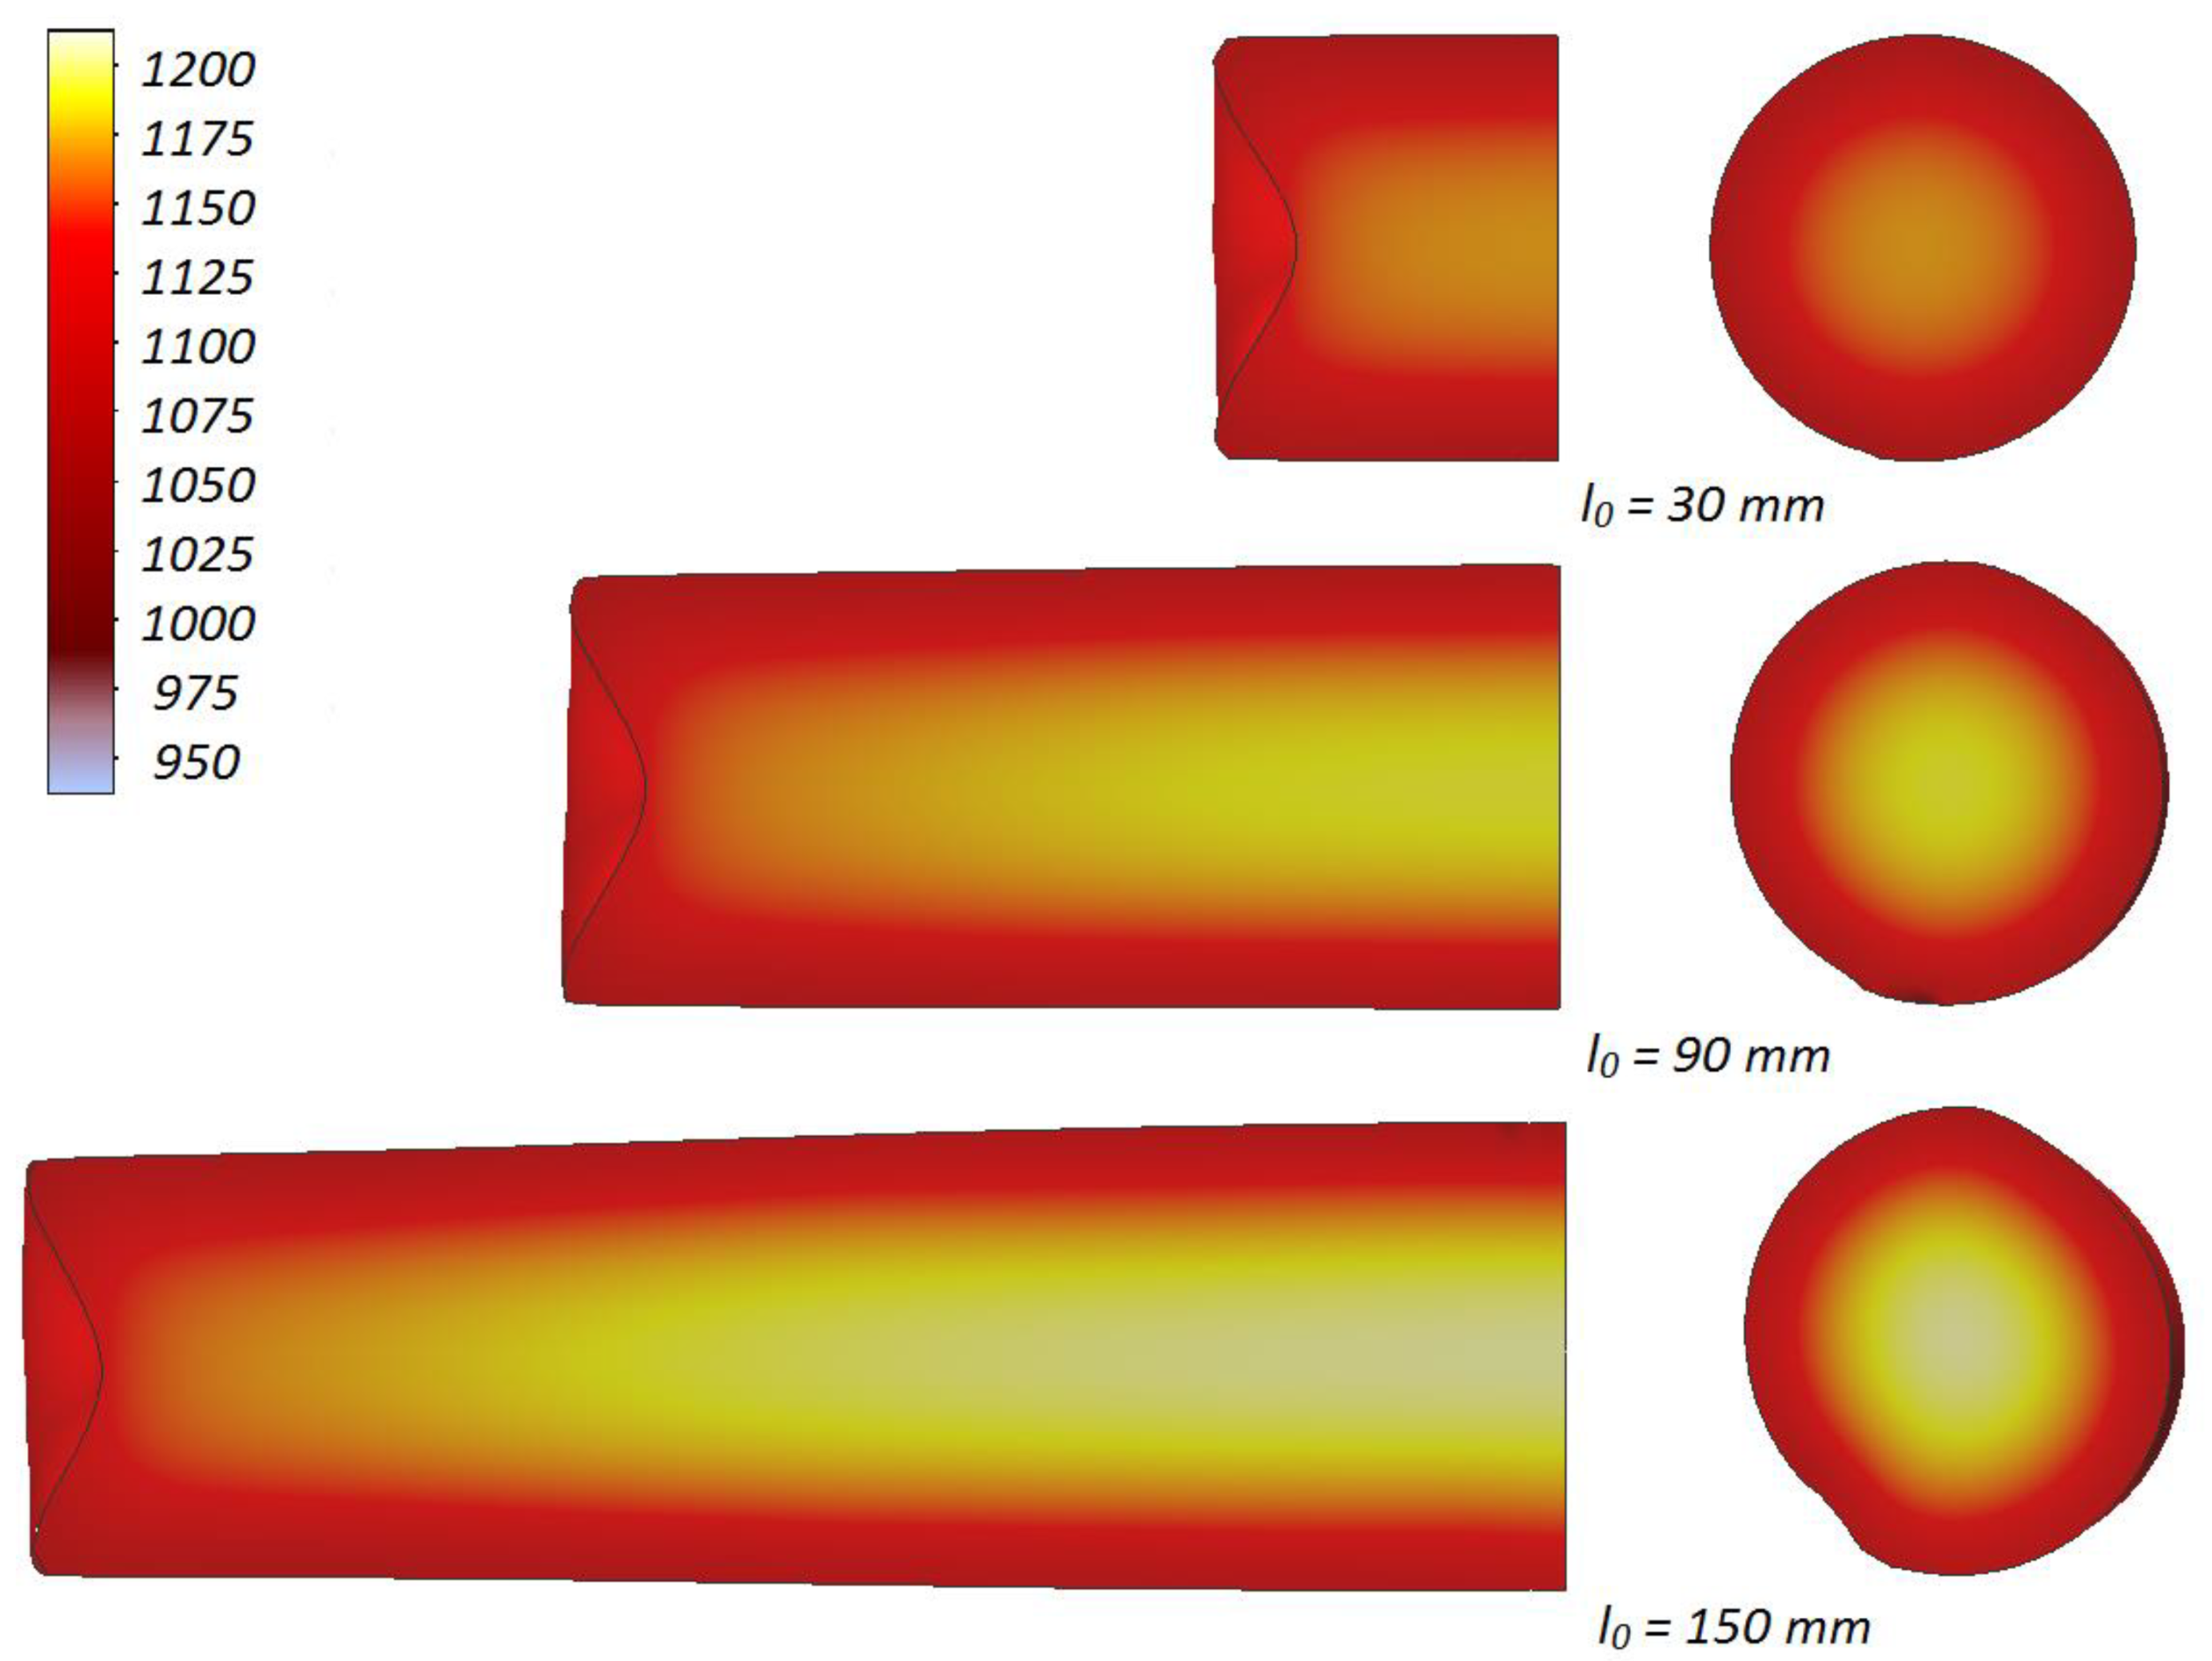
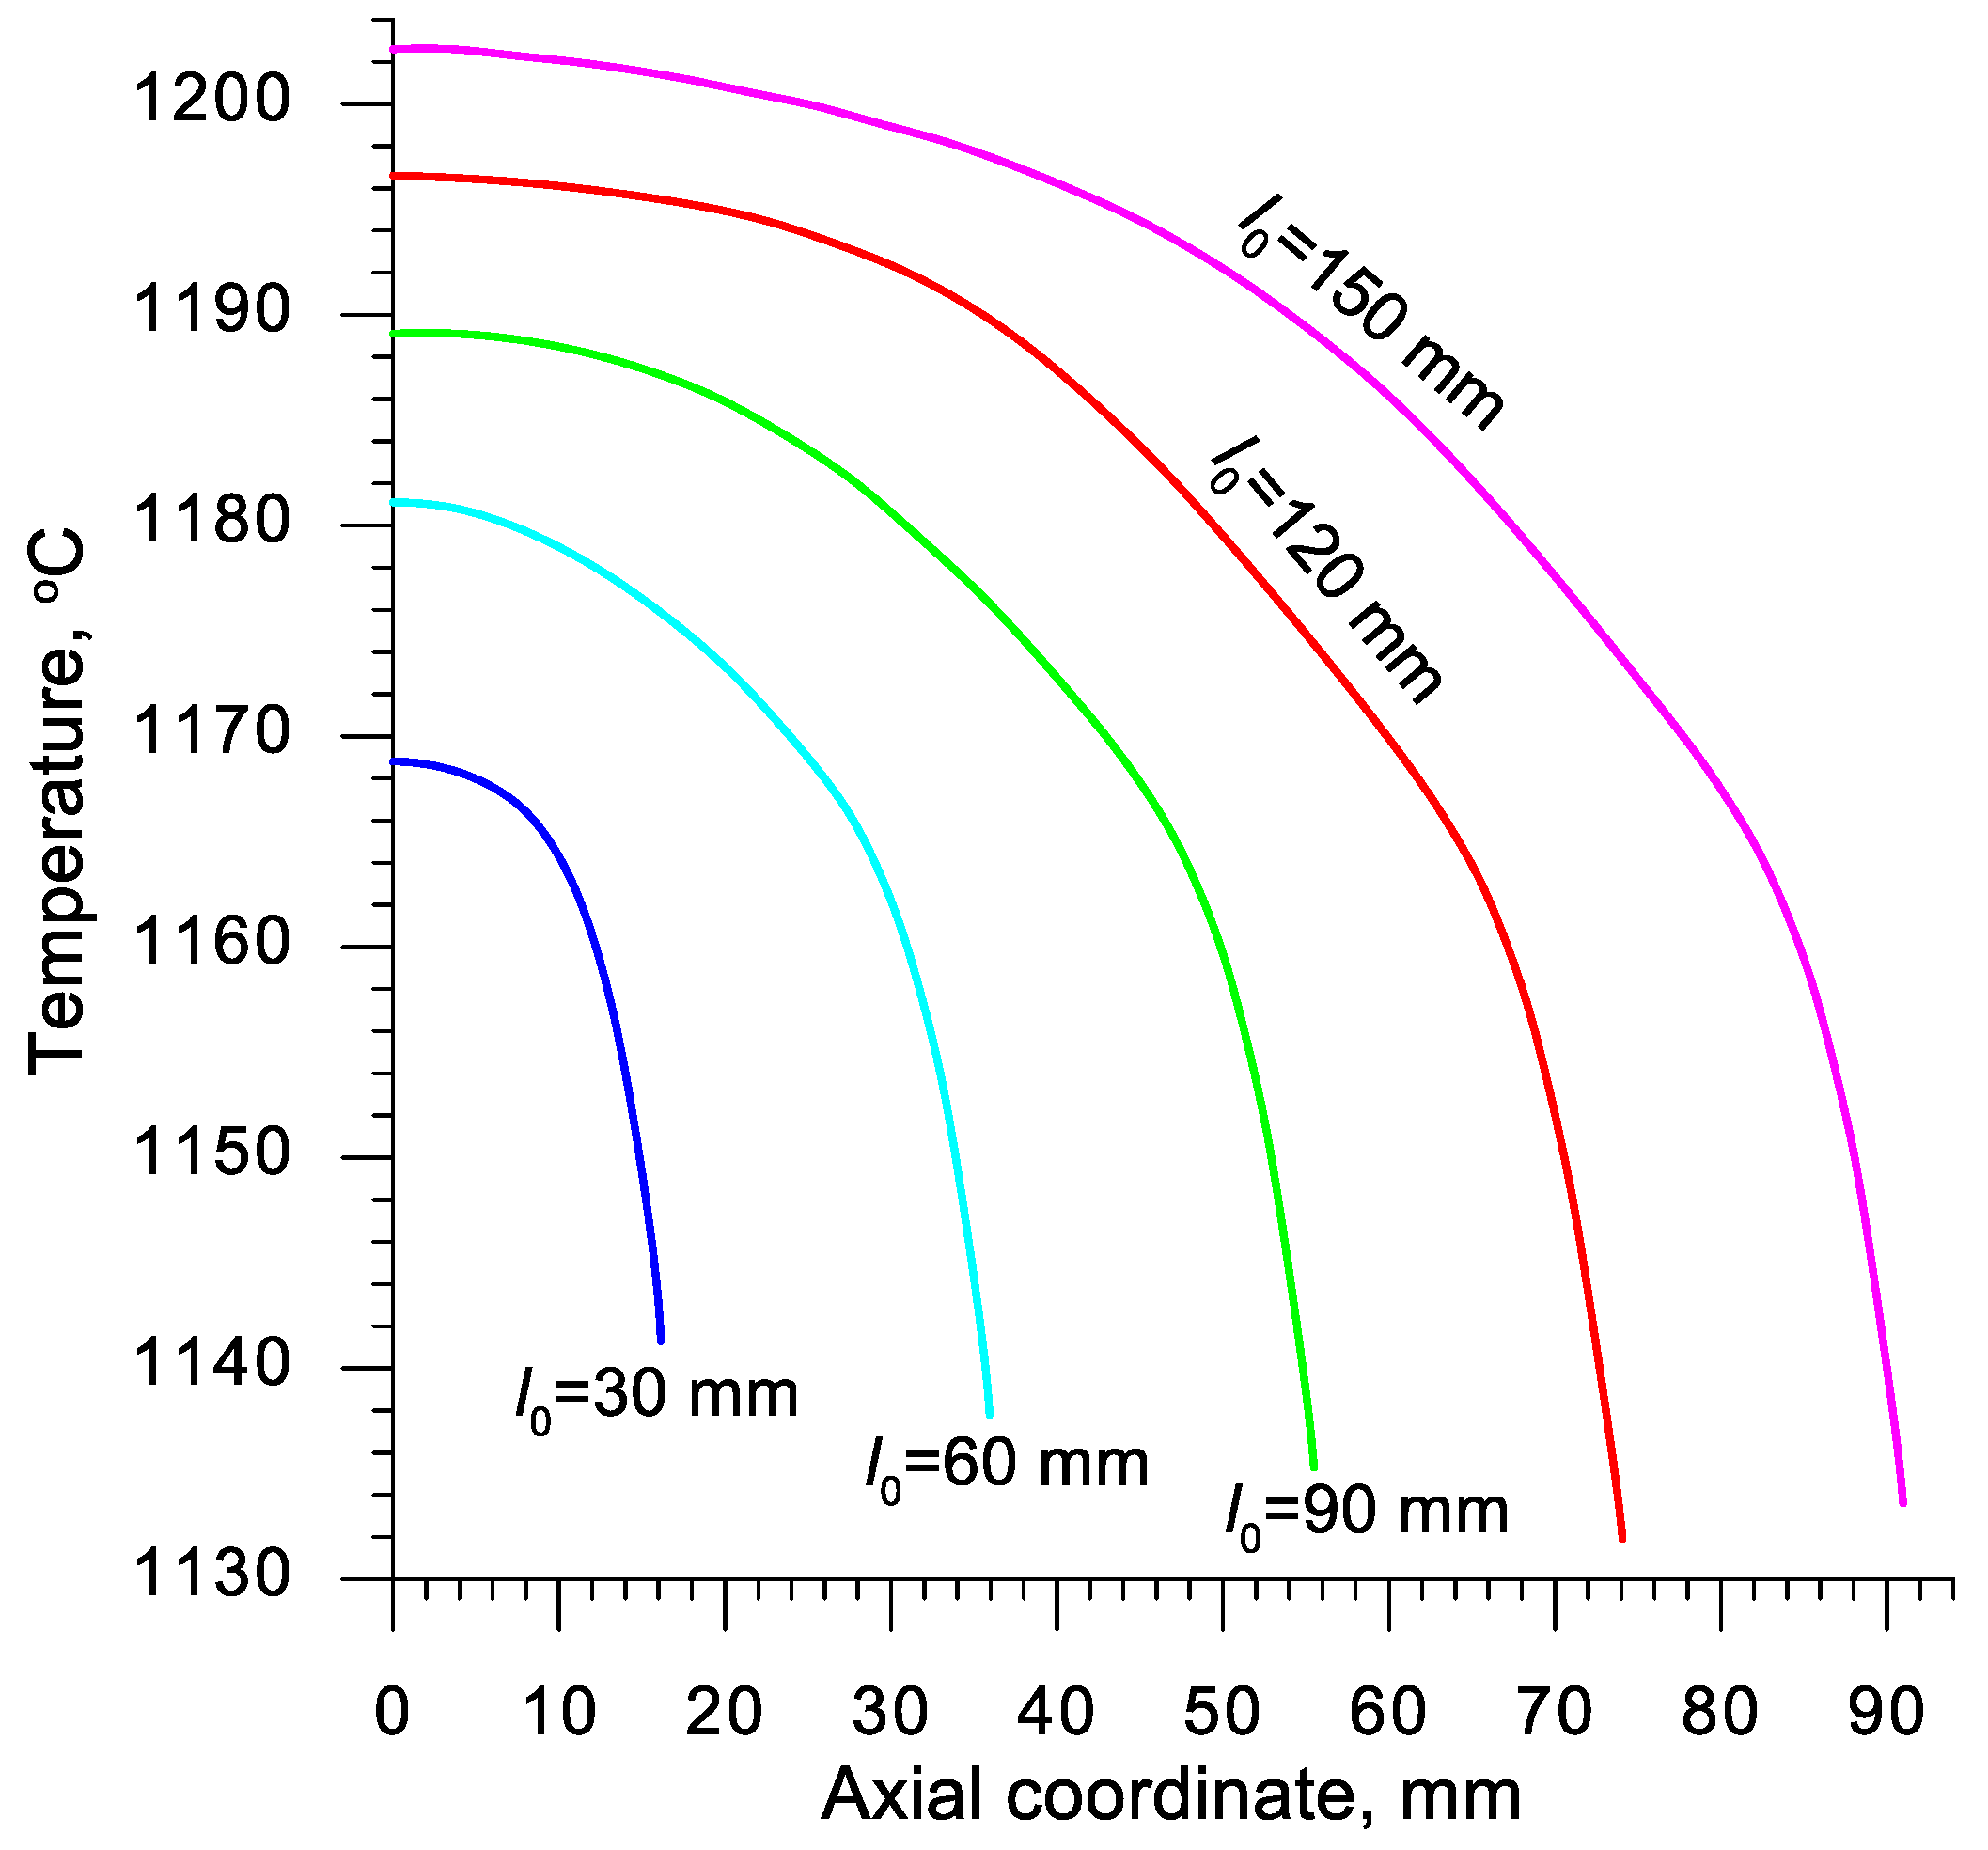
- Despite the relatively long duration of the rotational compression test the material temperature not only does not decrease, but also increases; the rise of temperature is a result of the change of plastic work into heat;
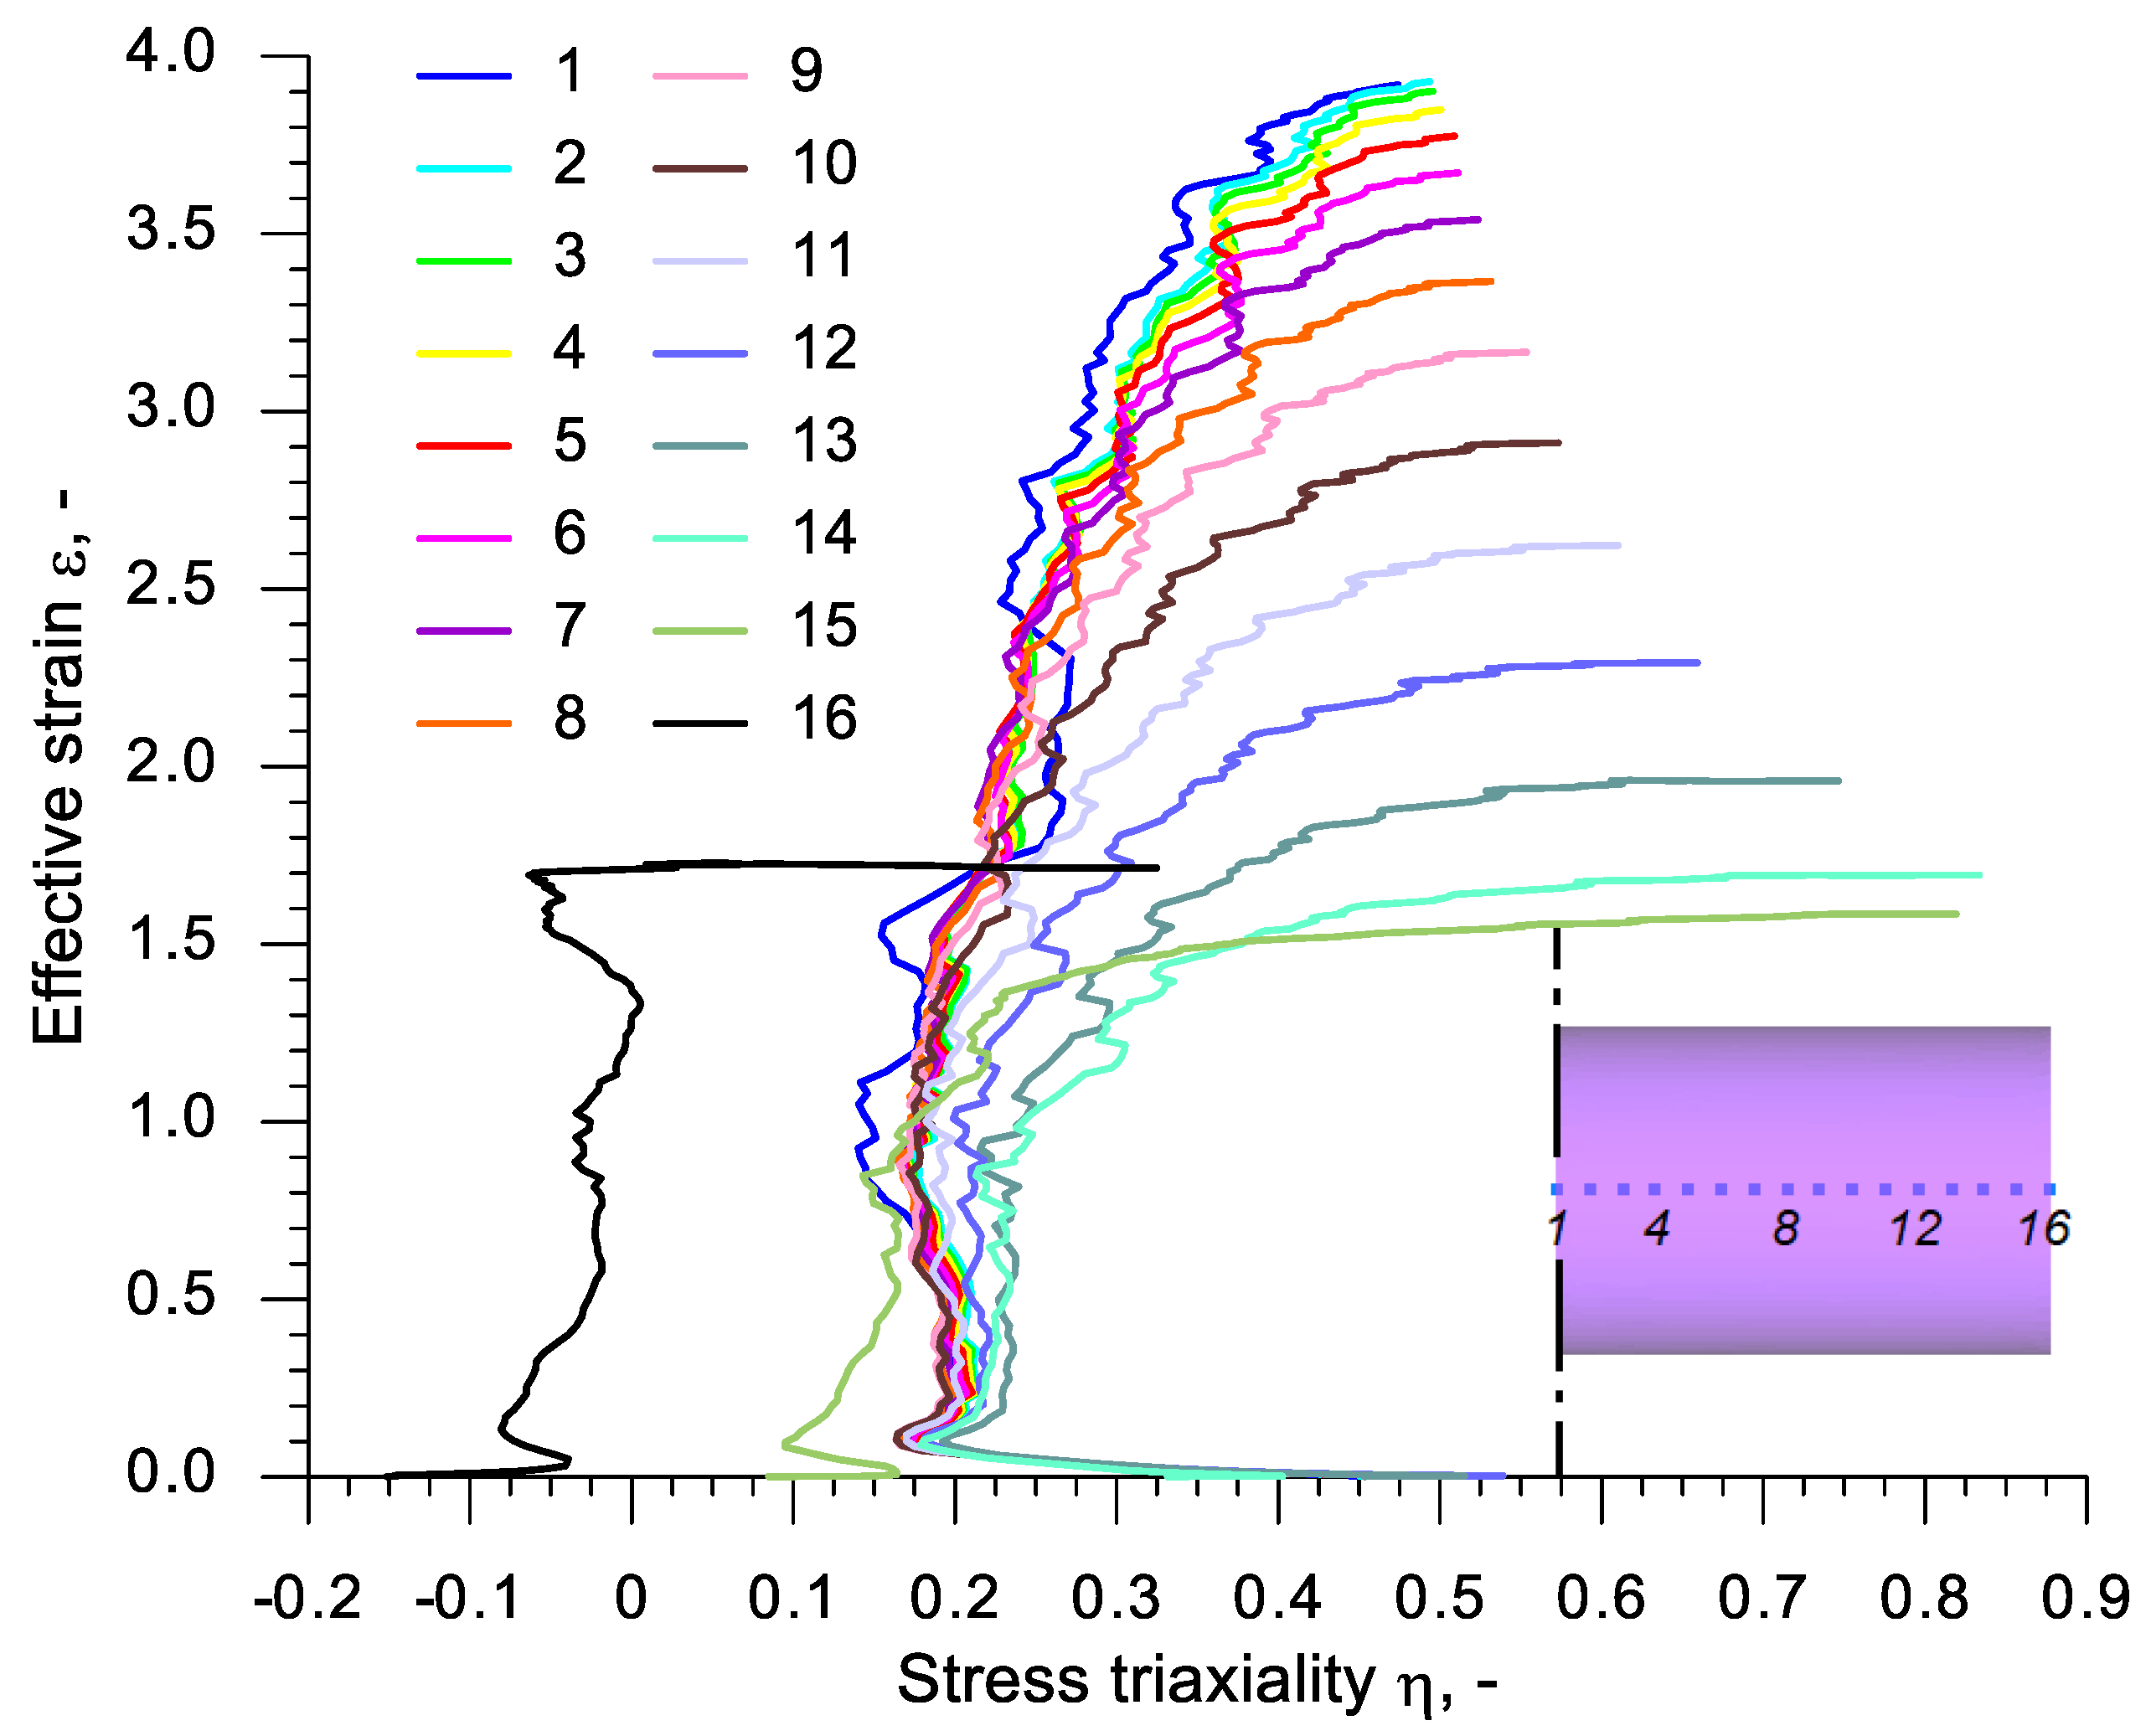
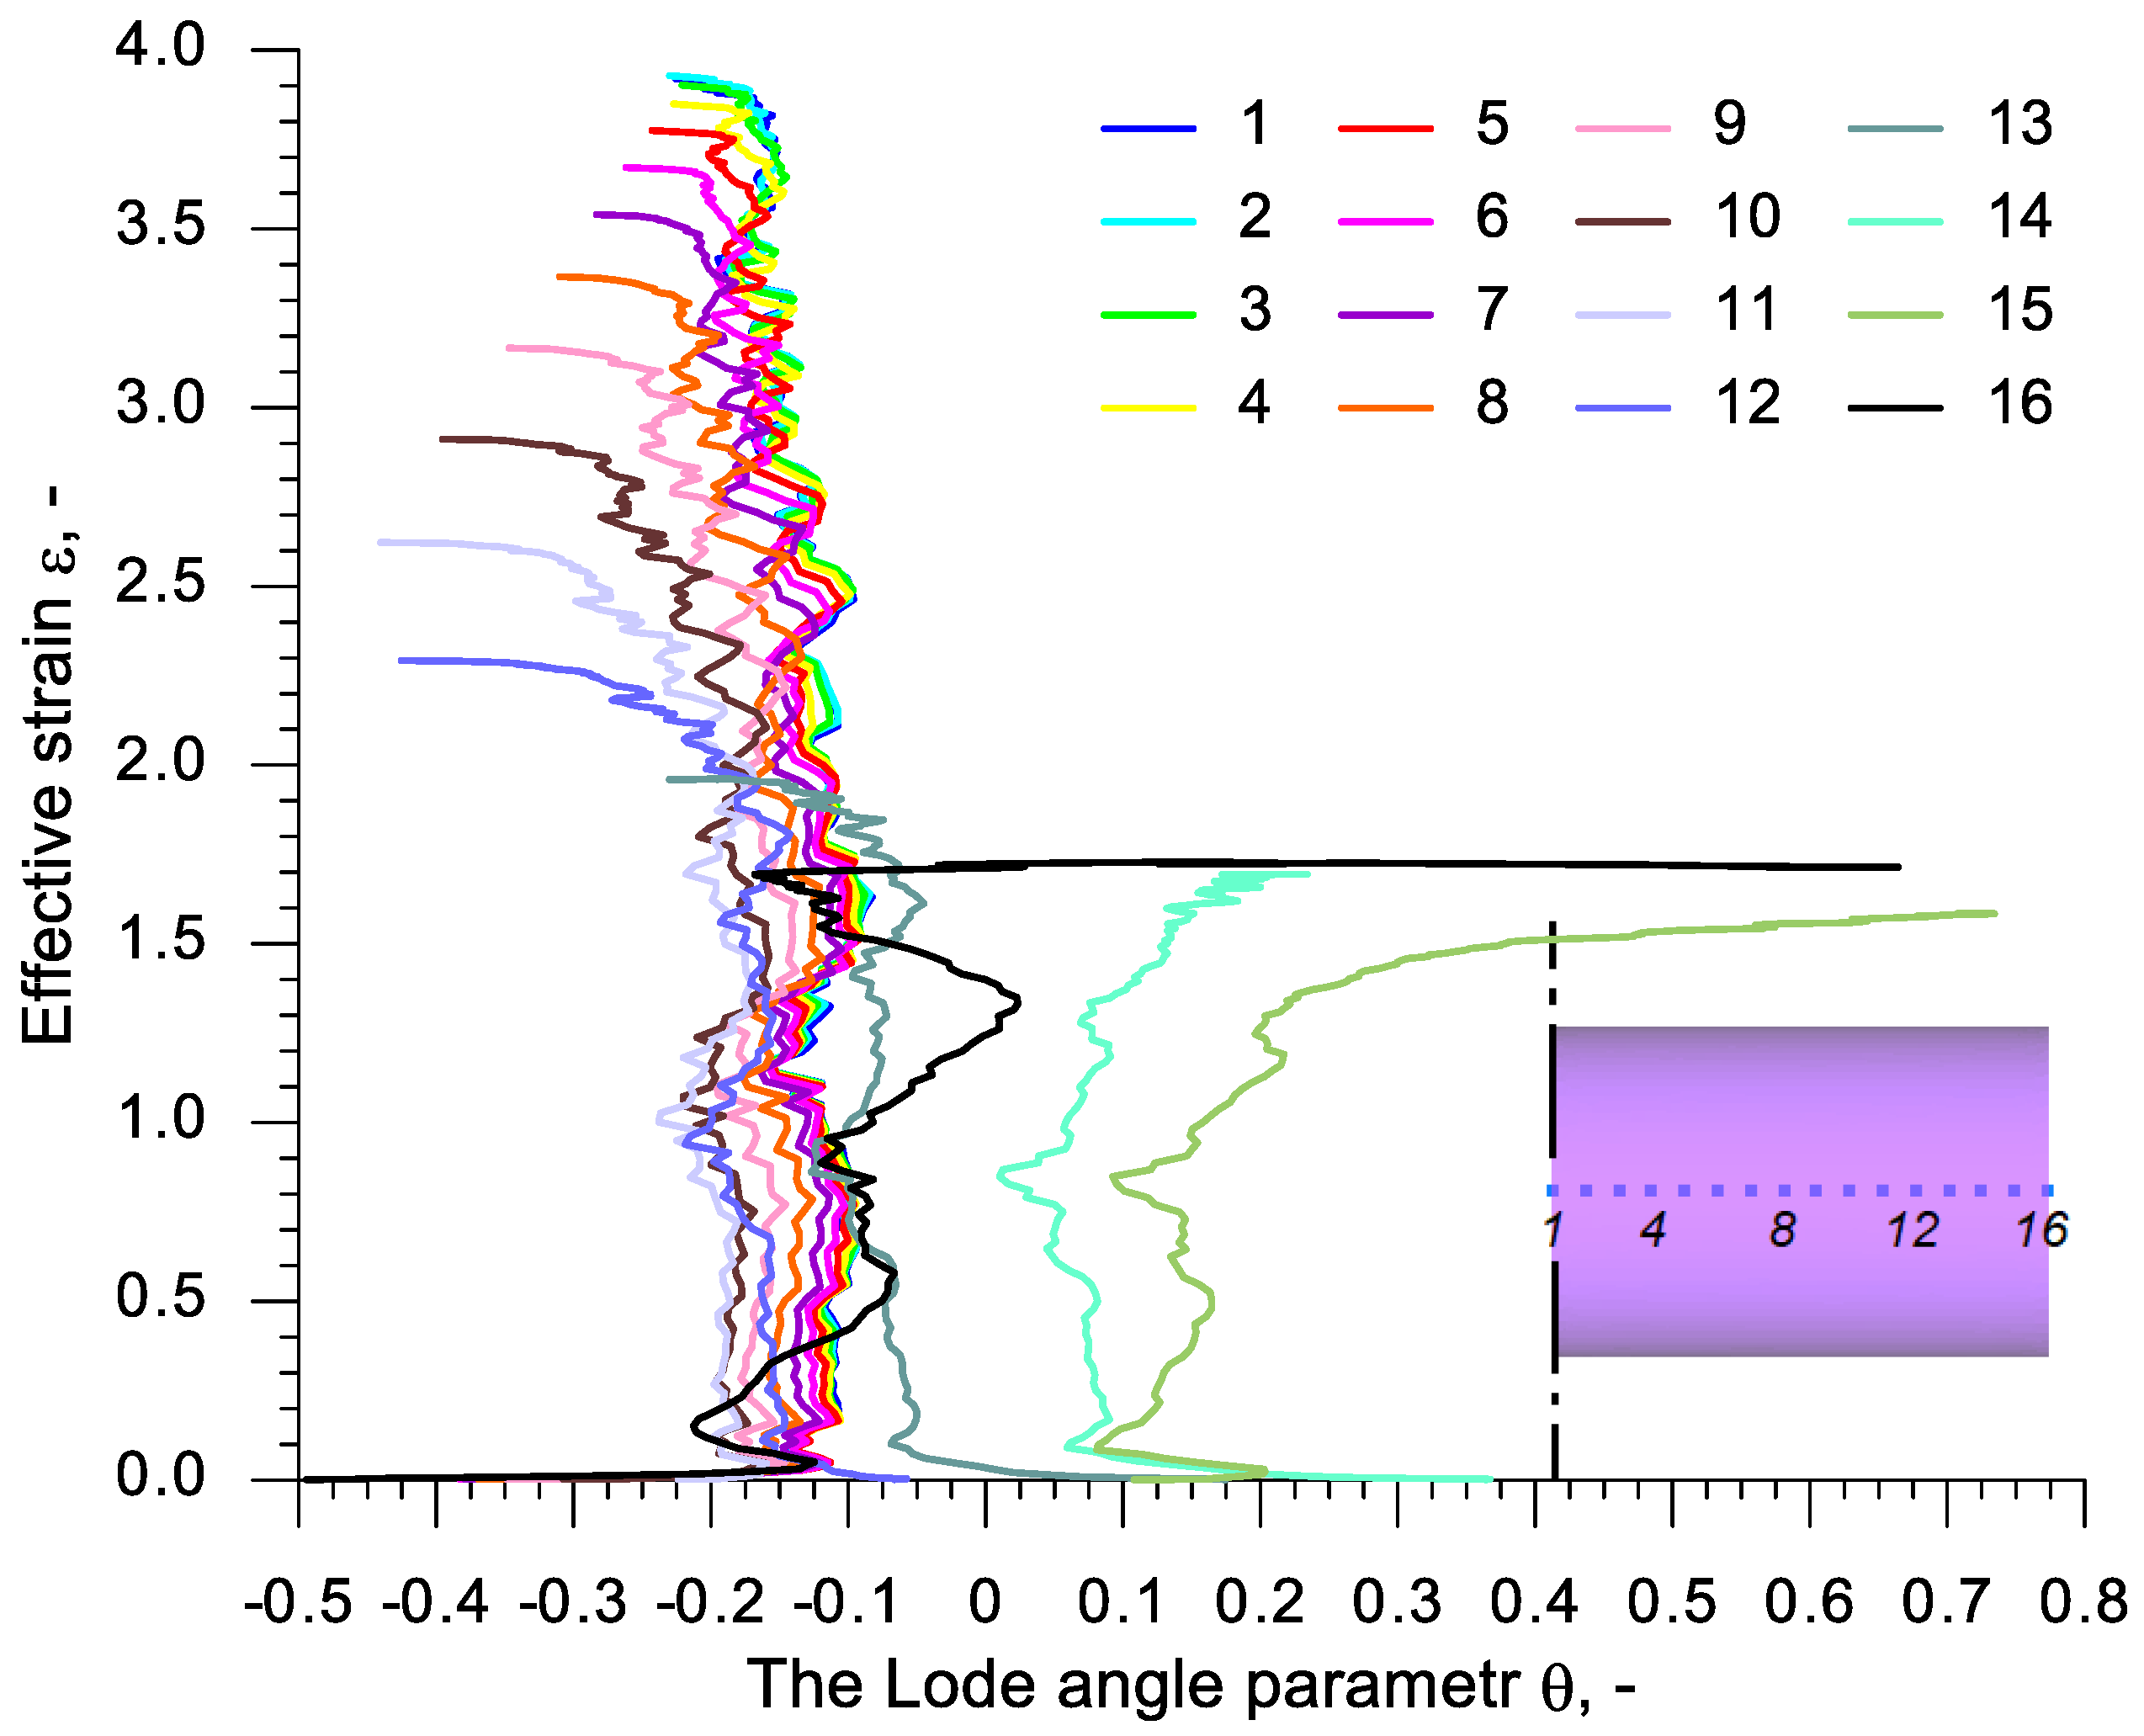
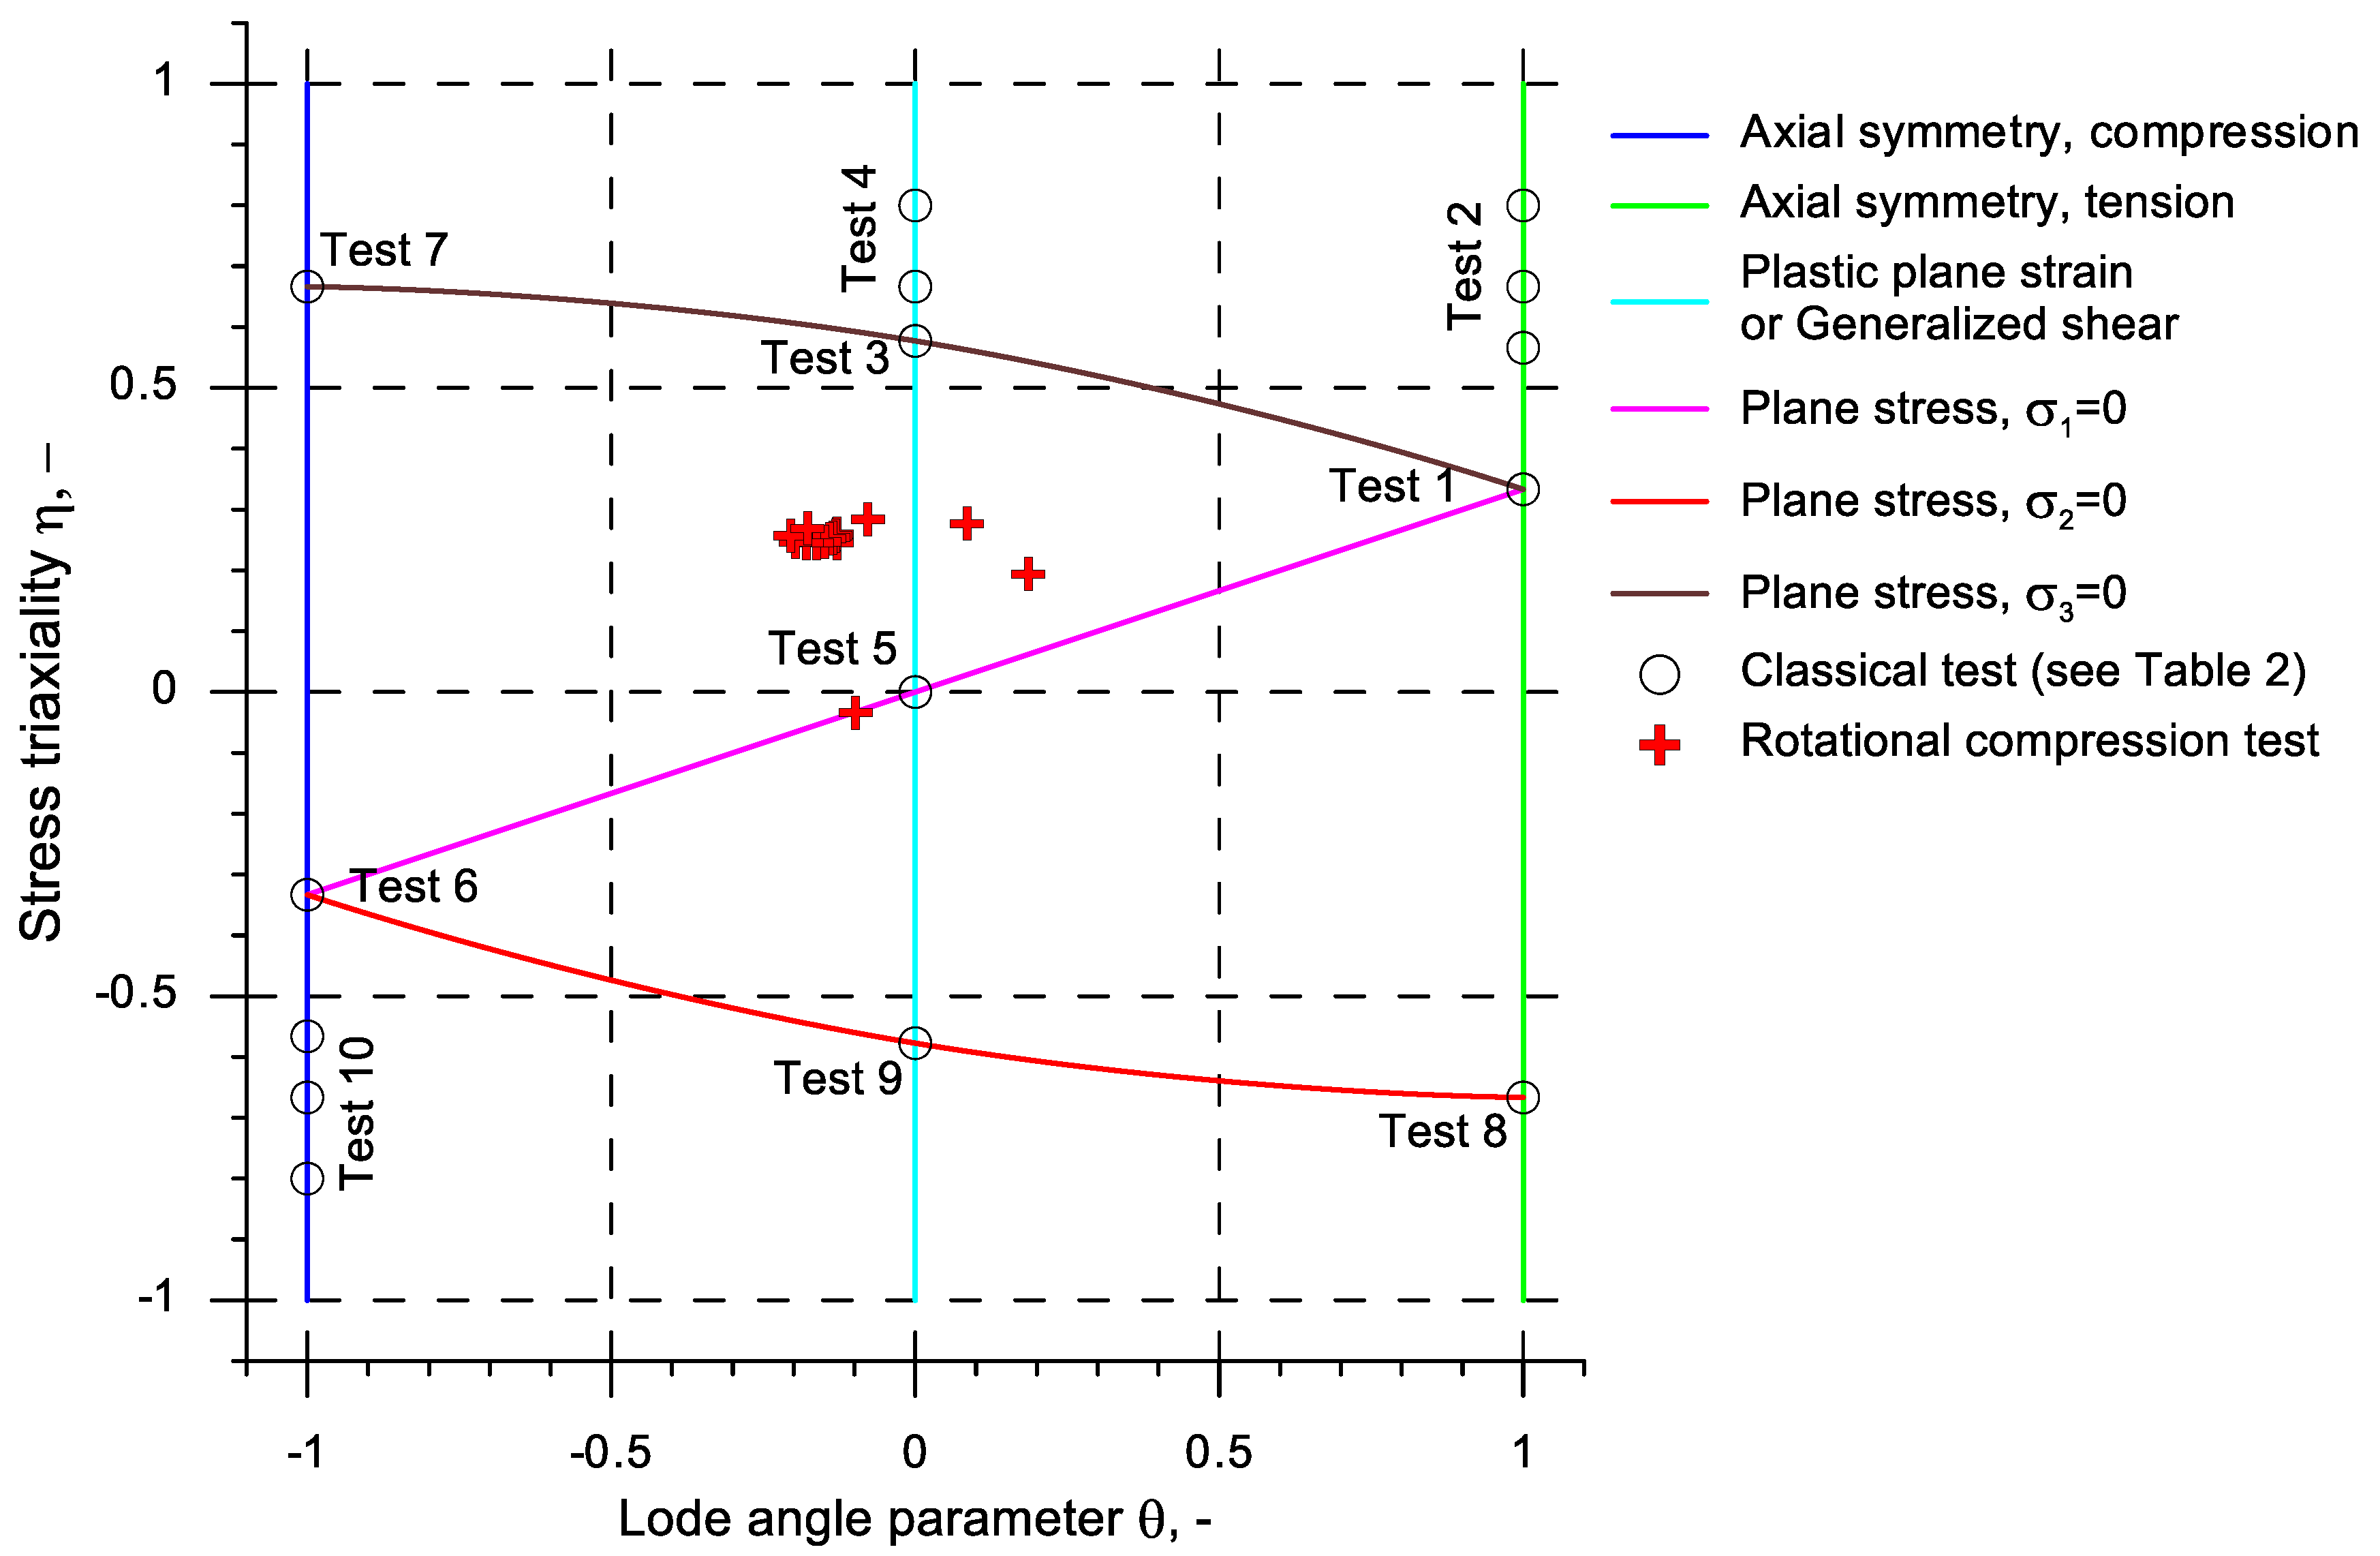
- The state of stress occurring in the axial area of the samples subjected to rotational compression differs significantly from the stress occurring in the calibrating tests applied thus far; during the most significant increase of effective strain this state is expressed by the averaged value of stress triaxiality ηav = (0.2; 0.3) and the averaged value of the Lode angle parameter θav = (0.2; −0.1);
- For a practical application, it is advised to use the critical values of the damage function of C45 grade steel presented in Table 4; the aforementioned values were determined for ten damage criteria and are vital for hot forming in the temperature c.a. 1150 °C.
Author Contributions
Funding
Conflicts of Interest
References
- Lemaitre, J. A continuous damage mechanics model for ductile fracture. J. Eng. Mater. Technol. 1985, 107, 83–89. [Google Scholar] [CrossRef]
- Caboche, J. Continuum damage mechanics. Part 1 General concepts. J. Appl. Mech. 1988, 55, 59–72. [Google Scholar] [CrossRef]
- Gurson, A. Continuum theory of ductile rupture by void nucleation and growth. Part I Yield criteria and flow rules for porous ductile media. J. Eng. Mater. Techno. 1977, 99, 2–15. [Google Scholar] [CrossRef]
- Tvergaard, V.; Needleman, A. Analysis of the cup-cone fracture in a round tensile bar. Acta. Metall. Mater. 1984, 32, 157–169. [Google Scholar] [CrossRef]
- Barenblatt, G. The Mathematical Theory of Equilibrum Cracks in Brittle Fracture. In Vol. 7 of Advances in Applied Mechanics; Drygen, H.L., von Karman, T., Eds.; Academic Press: Cambridge, MA, USA; Elsevier: New York, NY, USA, 1962; pp. 55–129. [Google Scholar]
- Cornetti, P.; Munoz-Reja, M.; Sapora, A.; Carpinteri, A. Finite fracture mechanics and cohesive crack model: Weight functions vs. cohesive laws. Int. J. Solids Struct. 2019, 156–157, 126–136. [Google Scholar] [CrossRef]
- Dimitri, R.; Cornetti, P.; Mantic, V.; Trullo, M.; De Lorenzis, L. Mode-I debonding of a double cantilever beam: A comparison between cohesive crack modelling and Finite Fracture Mechanics. Int. J. Solids Struct. 2017, 124, 57–72. [Google Scholar] [CrossRef]
- Qi, H.Y.; Zheng, X.L.; Yang, X.G. Low-cycle fatigue lifetime estimation of Ti-6Al-4V welded joints by continuum damage mechanics model. Rare Met. 2016, 35, 299–302. [Google Scholar] [CrossRef]
- Tang, B.T.; Bruschi, S.; Ghiotti, A.; Bariani, P.F. An improved damage evolution model to predict fracture of steel sheet at elevated temperature. J. Mater. Process. Tech. 2016, 228, 76–87. [Google Scholar] [CrossRef]
- He, K.; Liu, H.; Zhu, C.; Wei, P.; Sun, Z. Study of rolling contact fatigue behaviour of a winf turbine gear based on damage-coupled elastic-plastic model. Int. J. Mech. Sci. 2018, 141, 512–519. [Google Scholar] [CrossRef]
- McClintock, F.A. A criterion of ductile fracture by growth of holes. J. Appl. Mech. 1968, 35, 363–371. [Google Scholar] [CrossRef]
- Johnson, G.R.; Cook, W.H. Fracture characteristics of three metals subjected to various strains, strain rate and temperatures. Eng. Fract. Mech. 1985, 21, 31–48. [Google Scholar] [CrossRef]
- Giglio, M.; Manes, A.; Vigano, F. Ductile fracture locus of Ti-6Al-4V titanium alloy. Int. J. Mech. Sci. 2012, 54, 121–135. [Google Scholar] [CrossRef]
- Li, W.; Liao, F.; Zhou, T.; Askes, H. Ductile fracture of Q460 steel: Effects of stress triaxiality and Lode angle. J. Constr. Steel. Res. 2016, 123, 1–17. [Google Scholar] [CrossRef]
- Bao, Y.; Wierzbicki, T. On the cut-off value of negative triaxiality for fracture. Eng. Fract. Mech. 2005, 72, 1049–1069. [Google Scholar] [CrossRef]
- Xue, L. Damage accumulation and fracture initiation in uncracked ductile solids subject to triaxial loading. Int. J. Solids Struct. 2007, 44, 5163–5181. [Google Scholar] [CrossRef]
- Bai, Y.; Wierzbicki, T. A new model of metal plasticity and fracture with pressure and Lode dependence. Int. J. Plast. 2008, 24, 1071–1096. [Google Scholar] [CrossRef]
- Copolla, T.; Cortese, L.; Folgarait, P. The effect of stress invariants on ductile fracture limit in steels. Eng. Fract. Mech. 2009, 76, 1288–1302. [Google Scholar] [CrossRef]
- Gao, X.; Zhang, T.; Hayden, M.; Roe, C. Effects of the stress state on plasticity and ductile failure of an aluminium 5083 alloy. Int. J. Plast. 2009, 25, 2366–2382. [Google Scholar] [CrossRef]
- Faleskog, J.; Barsoum, I. Tension-torsion fracture experiments-Part I: Experiments and a procedure to evaluate the equivalent plastic strain. Int. J. Solids Struct. 2013, 50, 4241–4257. [Google Scholar] [CrossRef]
- Freudenthal, A.M. The Inelastic Behavior of Engineering Materials and Structures; John Wiley & Sons: New York, NY, USA, 1950. [Google Scholar]
- Cockroft, M.G.; Latham, D.J. Ductility and the workability of metals. J. Inst. Met. 1968, 96, 33–39. [Google Scholar]
- Rice, J.R.; Tracey, D.M. On the ductile enlargement of voids in triaxial stress fields. J. Mech. Phys. Solids 1969, 17, 201–217. [Google Scholar] [CrossRef]
- Brozzo, P.; Deluca, B.; Rendina, R. A new method for the prediction of formability limits in metal sheets. In Proceedings of the 7th Biennial Conference of the International Deep Drawing Research Group, Amsterdam, The Netherlands, 9–13 October 1972. [Google Scholar]
- Oyane, M. Criteria of DF strain. Bull. JSME 1972, 15, 1507–1513. [Google Scholar] [CrossRef]
- Argon, A.I.J.; Safoglu, R. Cavity formation from inclusions in ductile fracture. Metall. Mater. Trans. A 1975, 6, 825–837. [Google Scholar] [CrossRef]
- Oh, S.I.; Chen, C.C.; Kobayashi, S. Ductile fracture in axisymmetric extrusion and drawing. Part II Workability in extrusion and drawing. J. Eng. Ind. 1979, 101, 36–44. [Google Scholar] [CrossRef]
- Ayada, M.; Higashino, T.; Mori, K. Central bursting in extrusion of inhomogeneous materials. In Proceedings of the First International Conference on Technology of Plasticity, Tokyo, Japan, 3–5 September 1984; pp. 553–558. [Google Scholar]
- Ko, Y.K.; Lee, J.S.; Huh, H.; Kim, K.K.; Park, S.H. Prediction of fracture in hub-hole expanding process using a new ductile fracture criterion. J. Mater. Process. Tech. 2007, 187–188, 358–362. [Google Scholar] [CrossRef]
- Zhan, M.; Gu, C.; Jiang, Z.; Hu, L.; Yang, H. Application of ductile fracture criteria in spin-forming and tube-bending processes. Comp. Mater. Sci. 2009, 47, 353–365. [Google Scholar] [CrossRef]
- Bjorklund, O.; Larsson, R.; Nilsson, L. Failure of high strength steel sheets: Experiments and modelling. J. Mater. Process. Tech. 2013, 213, 1103–1117. [Google Scholar] [CrossRef]
- Kim, S.A.; Lee, Y.S. Comparative study on failure prediction in warm forming process of Mg alloy sheet by the FEM and ductile fracture criteria. Metall. Mater. Trans. B 2014, 45, 445–453. [Google Scholar] [CrossRef]
- Dunand, M.; Mohr, D. Hybrid experimental-numerical analysis of basic ductile fracture experiments for sheet metals. Int. J. Solids Struct. 2010, 47, 1130–1143. [Google Scholar] [CrossRef]
- Wierzbicki, T.; Bao, Y.; Lee, Y.W.; Bai, Y. Calibration and evaluation of seven fracture models. Int. J. Mech. Sci. 2005, 47, 719–743. [Google Scholar] [CrossRef]
- Khan, A.S.; Liu, H. A new approach for ductile fracture prediction on Al 2024-T351 alloy. Int. J. Plasticity 2012, 35, 1–12. [Google Scholar] [CrossRef]
- Lou, Y.; Huh, H. Evaluation of ductile fracture criteria in a general three-dimensional stress state considering the stress triaxiality and the Lode parameter. Acta Mech. Solida Sin. 2013, 26, 642–658. [Google Scholar] [CrossRef]
- Graham, S.M.; Zhang, T.; Gao, X.; Hayden, M. Development of a combined tension-torsion experiment for calibration of ductile fracture models under conditions of low triaxiality. Int. J. Mech. Sci. 2012, 54, 172–181. [Google Scholar] [CrossRef]
- Xue, Z.; Faleskog, J.; Hutchinson, J.W. Tension-torsion fracture experiments-Part II. Simulations with the extended Gurson model and a ductile fracture criterion based on plastic strain. Int. J. Solids Struct. 2013, 50, 4258–4269. [Google Scholar] [CrossRef]
- Papasidero, J.; Doquet, V.; Mohr, D. Determination of the Effect of Stress State on the Onset of Ductile Fracture Through Tension-Torsion Experiments. Exp. Mech. 2013, 54, 137–151. [Google Scholar] [CrossRef]
- Hambli, R.; Reszka, M. Fracture criteria identification using an inverse technique method and blanking experiment. Int. J. Mech. Sci. 2002, 44, 1349–1361. [Google Scholar] [CrossRef]
- Pater, Z.; Tofil, A. FEM Simulation of the Tube Rolling Process in Diecher’s Mill. Adv. Sci. Technol. Res. J. 2014, 8, 51–55. [Google Scholar]
- Pater, Z.; Tomczak, J.; Bartnicki, J.; Lovell, M.R.; Menezes, P.L. Experimental and numerical analysis of helical-wedge rolling process for producing steel balls. Int. J. Mach. Tool Manu. 2013, 67, 1–7. [Google Scholar] [CrossRef]
- Pater, Z.; Tomczak, J.; Bartnicki, J.; Bulzak, T. Thermomechanical Analysis of a Helical-Wedge Rolling Process for Producing Balls. Metals 2018, 8, 862. [Google Scholar] [CrossRef]
- Tomczak, J.; Pater, Z.; Bulzak, T. The Effect of Process Parameters in Helical Rolling of Balls on the Quality of Products and the Forming Process. Materials 2018, 11, 2125. [Google Scholar] [CrossRef]
- Huang, H.; Chen, X.; Fan, B.; Jin, Y.; Shu, X. Initial billet temperature influence and location investigation on tool wear in cross wedge rolling. Int. J. Adv. Manuf. Tech. 2015, 79, 1545–1556. [Google Scholar] [CrossRef]
- Cao, Q.; Hua, L.; Qian, D. Finite element analysis of deformation characteristics in cold helical rolling of bearing steel-balls. J. Cent. South Univ. 2015, 22, 1175–1183. [Google Scholar] [CrossRef]
- Lis, K.; Wójcik, Ł.; Pater, Z. Numerical analysis of a skew rolling process for producing a crankshaft preform. Open Eng. 2016, 6, 581–584. [Google Scholar] [CrossRef]
- Tomczak, J.; Pater, Z.; Bulzak, T. Designing of screw impressions in helical rolling of balls. Arch. Civ. Mech. Eng. 2014, 14, 104–113. [Google Scholar] [CrossRef]
- Pater, Z.; Tomczak, J.; Bulzak, T. Numerical analysis of the skew rolling process for rail axles. Arch. Metall. Mater. 2015, 60, 415–418. [Google Scholar] [CrossRef]
- Pater, Z.; Tomczak, J.; Bulzak, T.; Bartnicki, J.; Tofil, A. Prediction of Crack Formation for Cross Wedge Rolling of Harrow Tooth Preform. Materials 2019, 12, 2287. [Google Scholar] [CrossRef]
- Pater, Z.; Tomczak, J.; Bulzak, T. Establishment of a new hybrid fracture criterion for cross Wedge rolling. Int. J. Mech. Sci. 2020, 167. [Google Scholar] [CrossRef]


| Abbreviation | Criterion (Year) | Formula |
|---|---|---|
| FREU | Freudenthal (1950) | |
| CL | Cockroft and Latham (1968) | |
| RT | Rice and Tracey (1969) | |
| BROZ | Brozzo et al. (1972) | |
| OYAN | Oyane (1972) | |
| ARGO | Argon et al. (1975) | |
| OH | Oh et al. (1979) | |
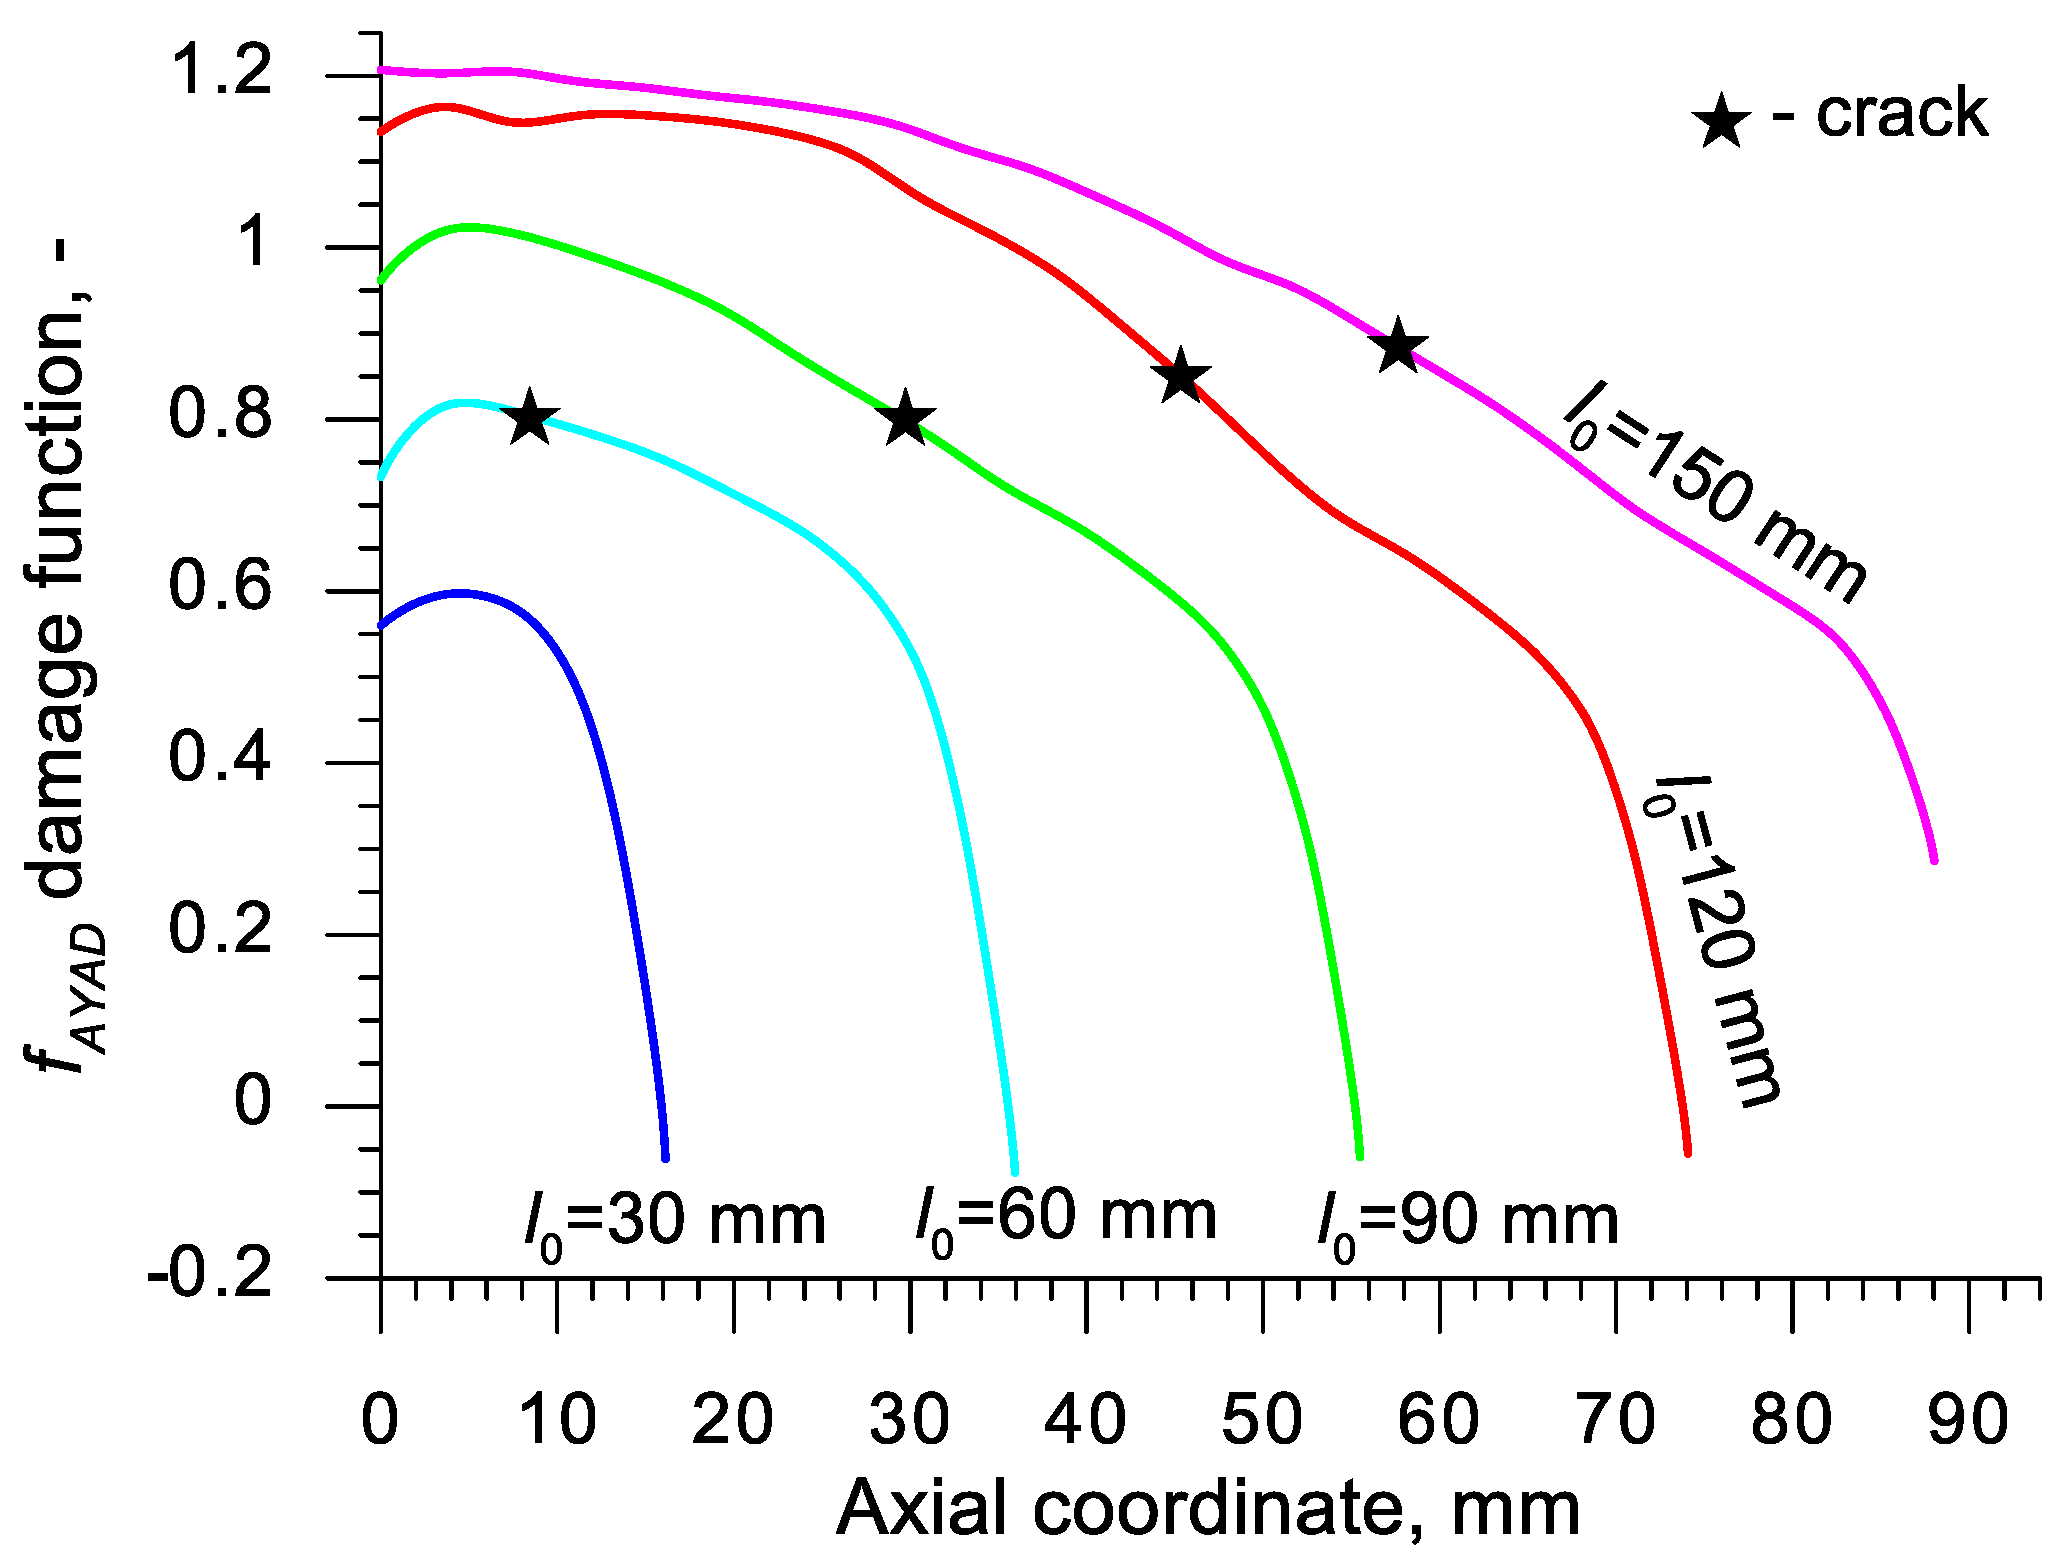
| AYAD | Ayada (1984) | |
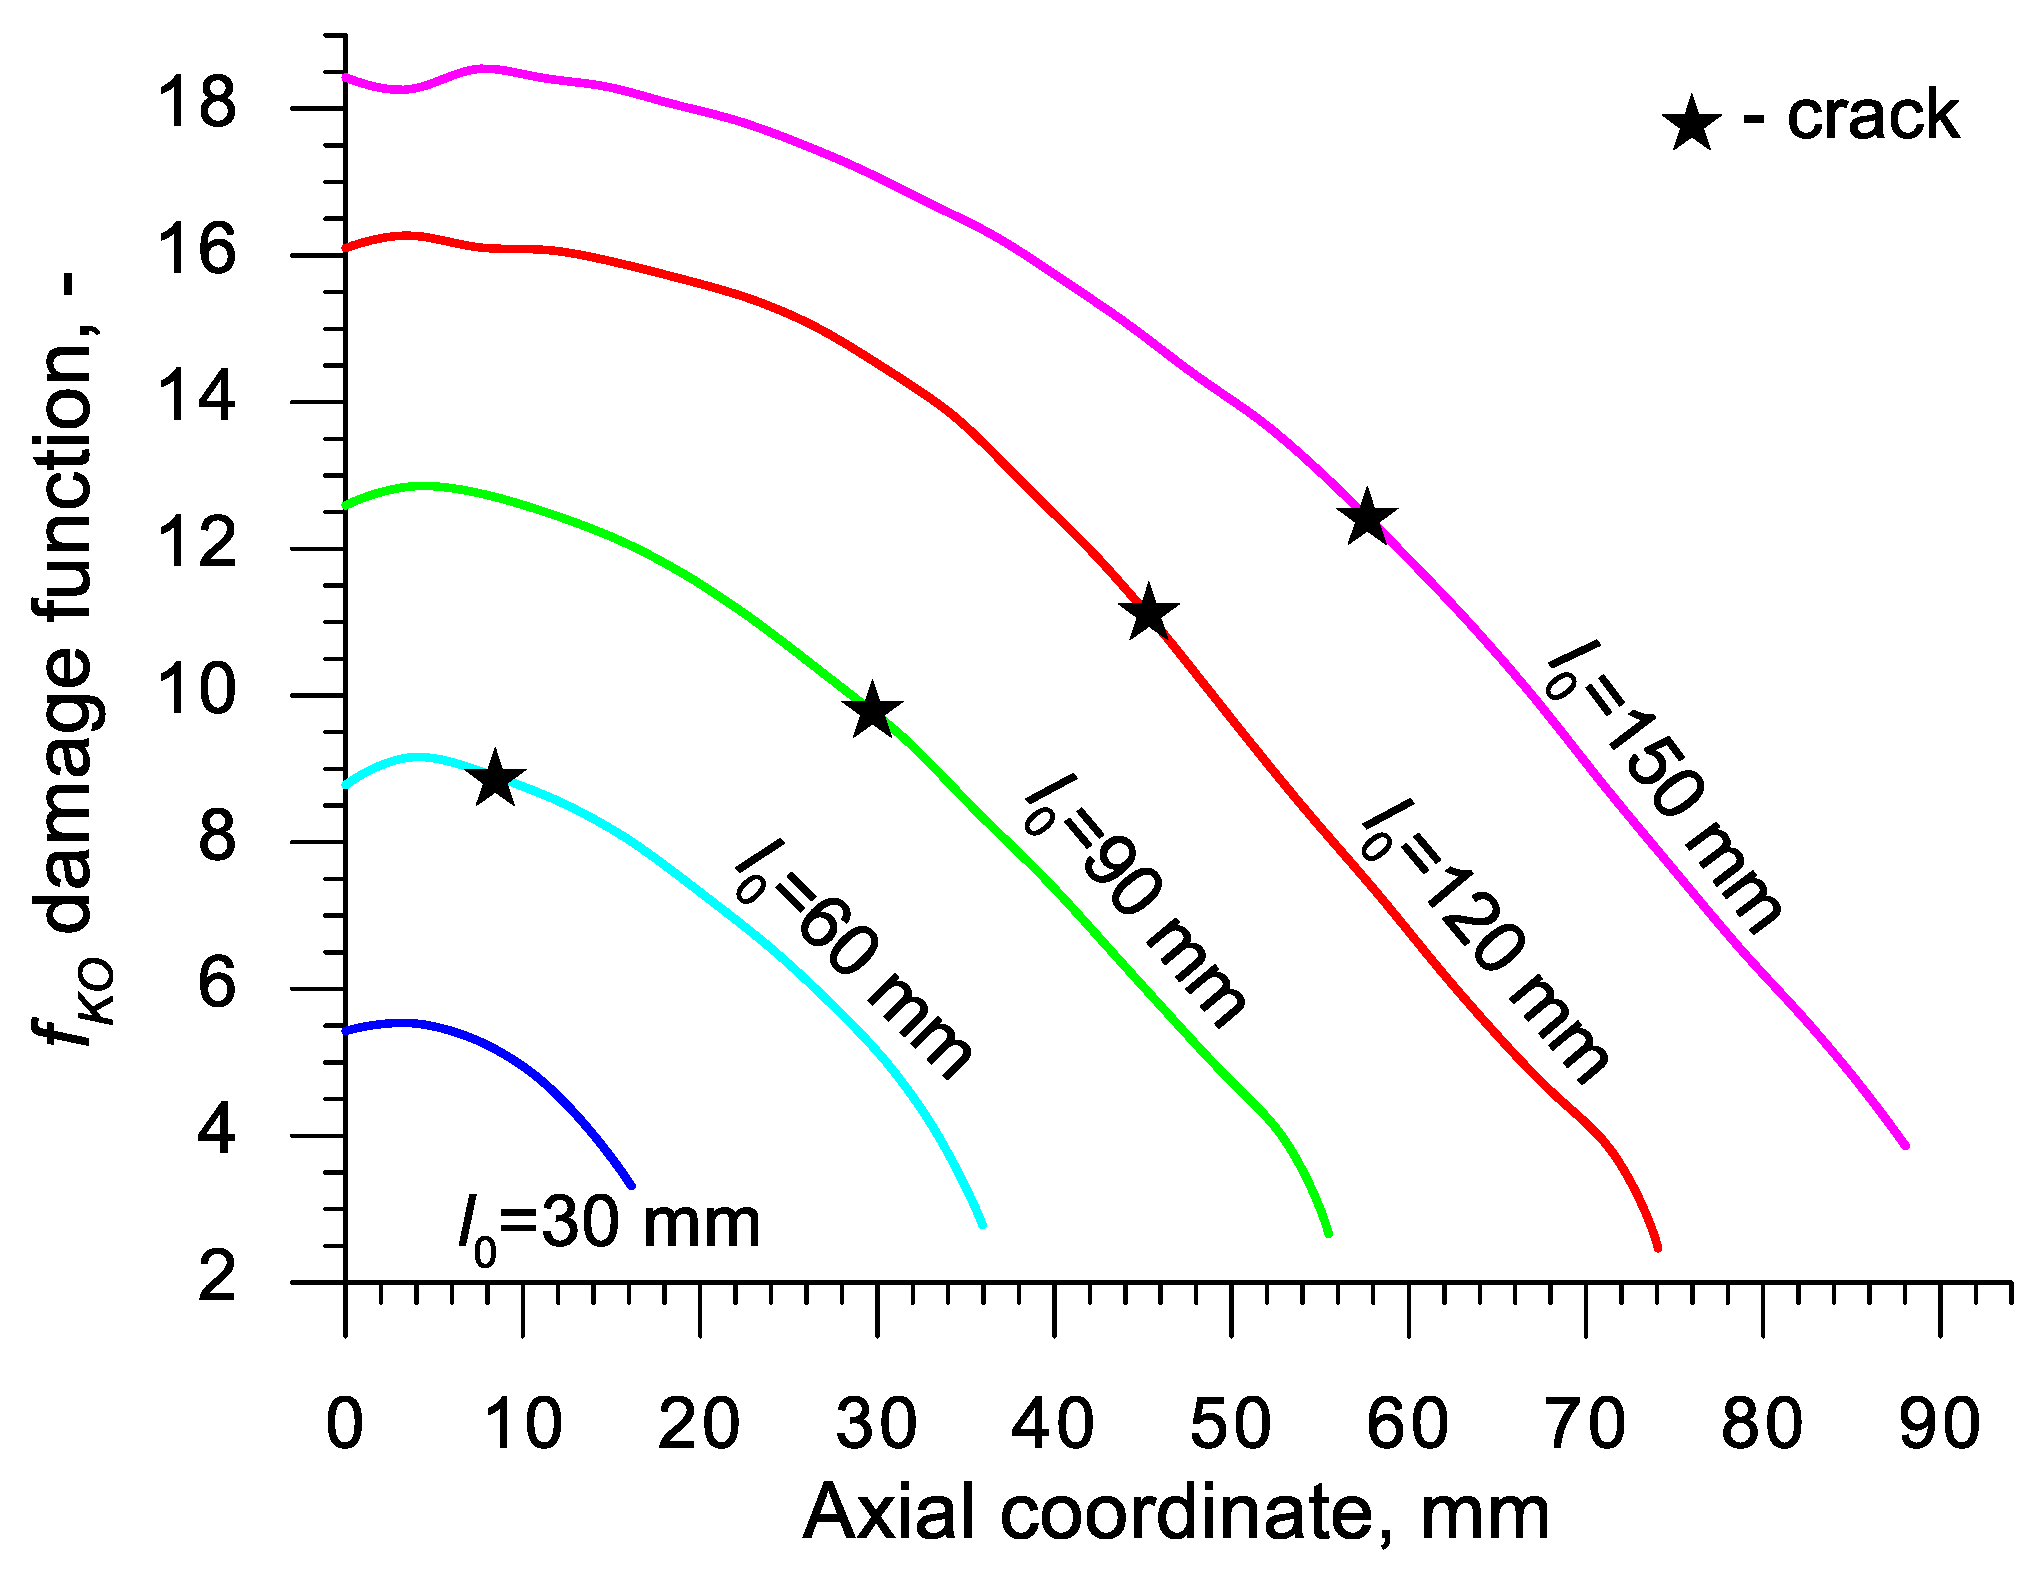
| KO | Ko et al. (2007) | |
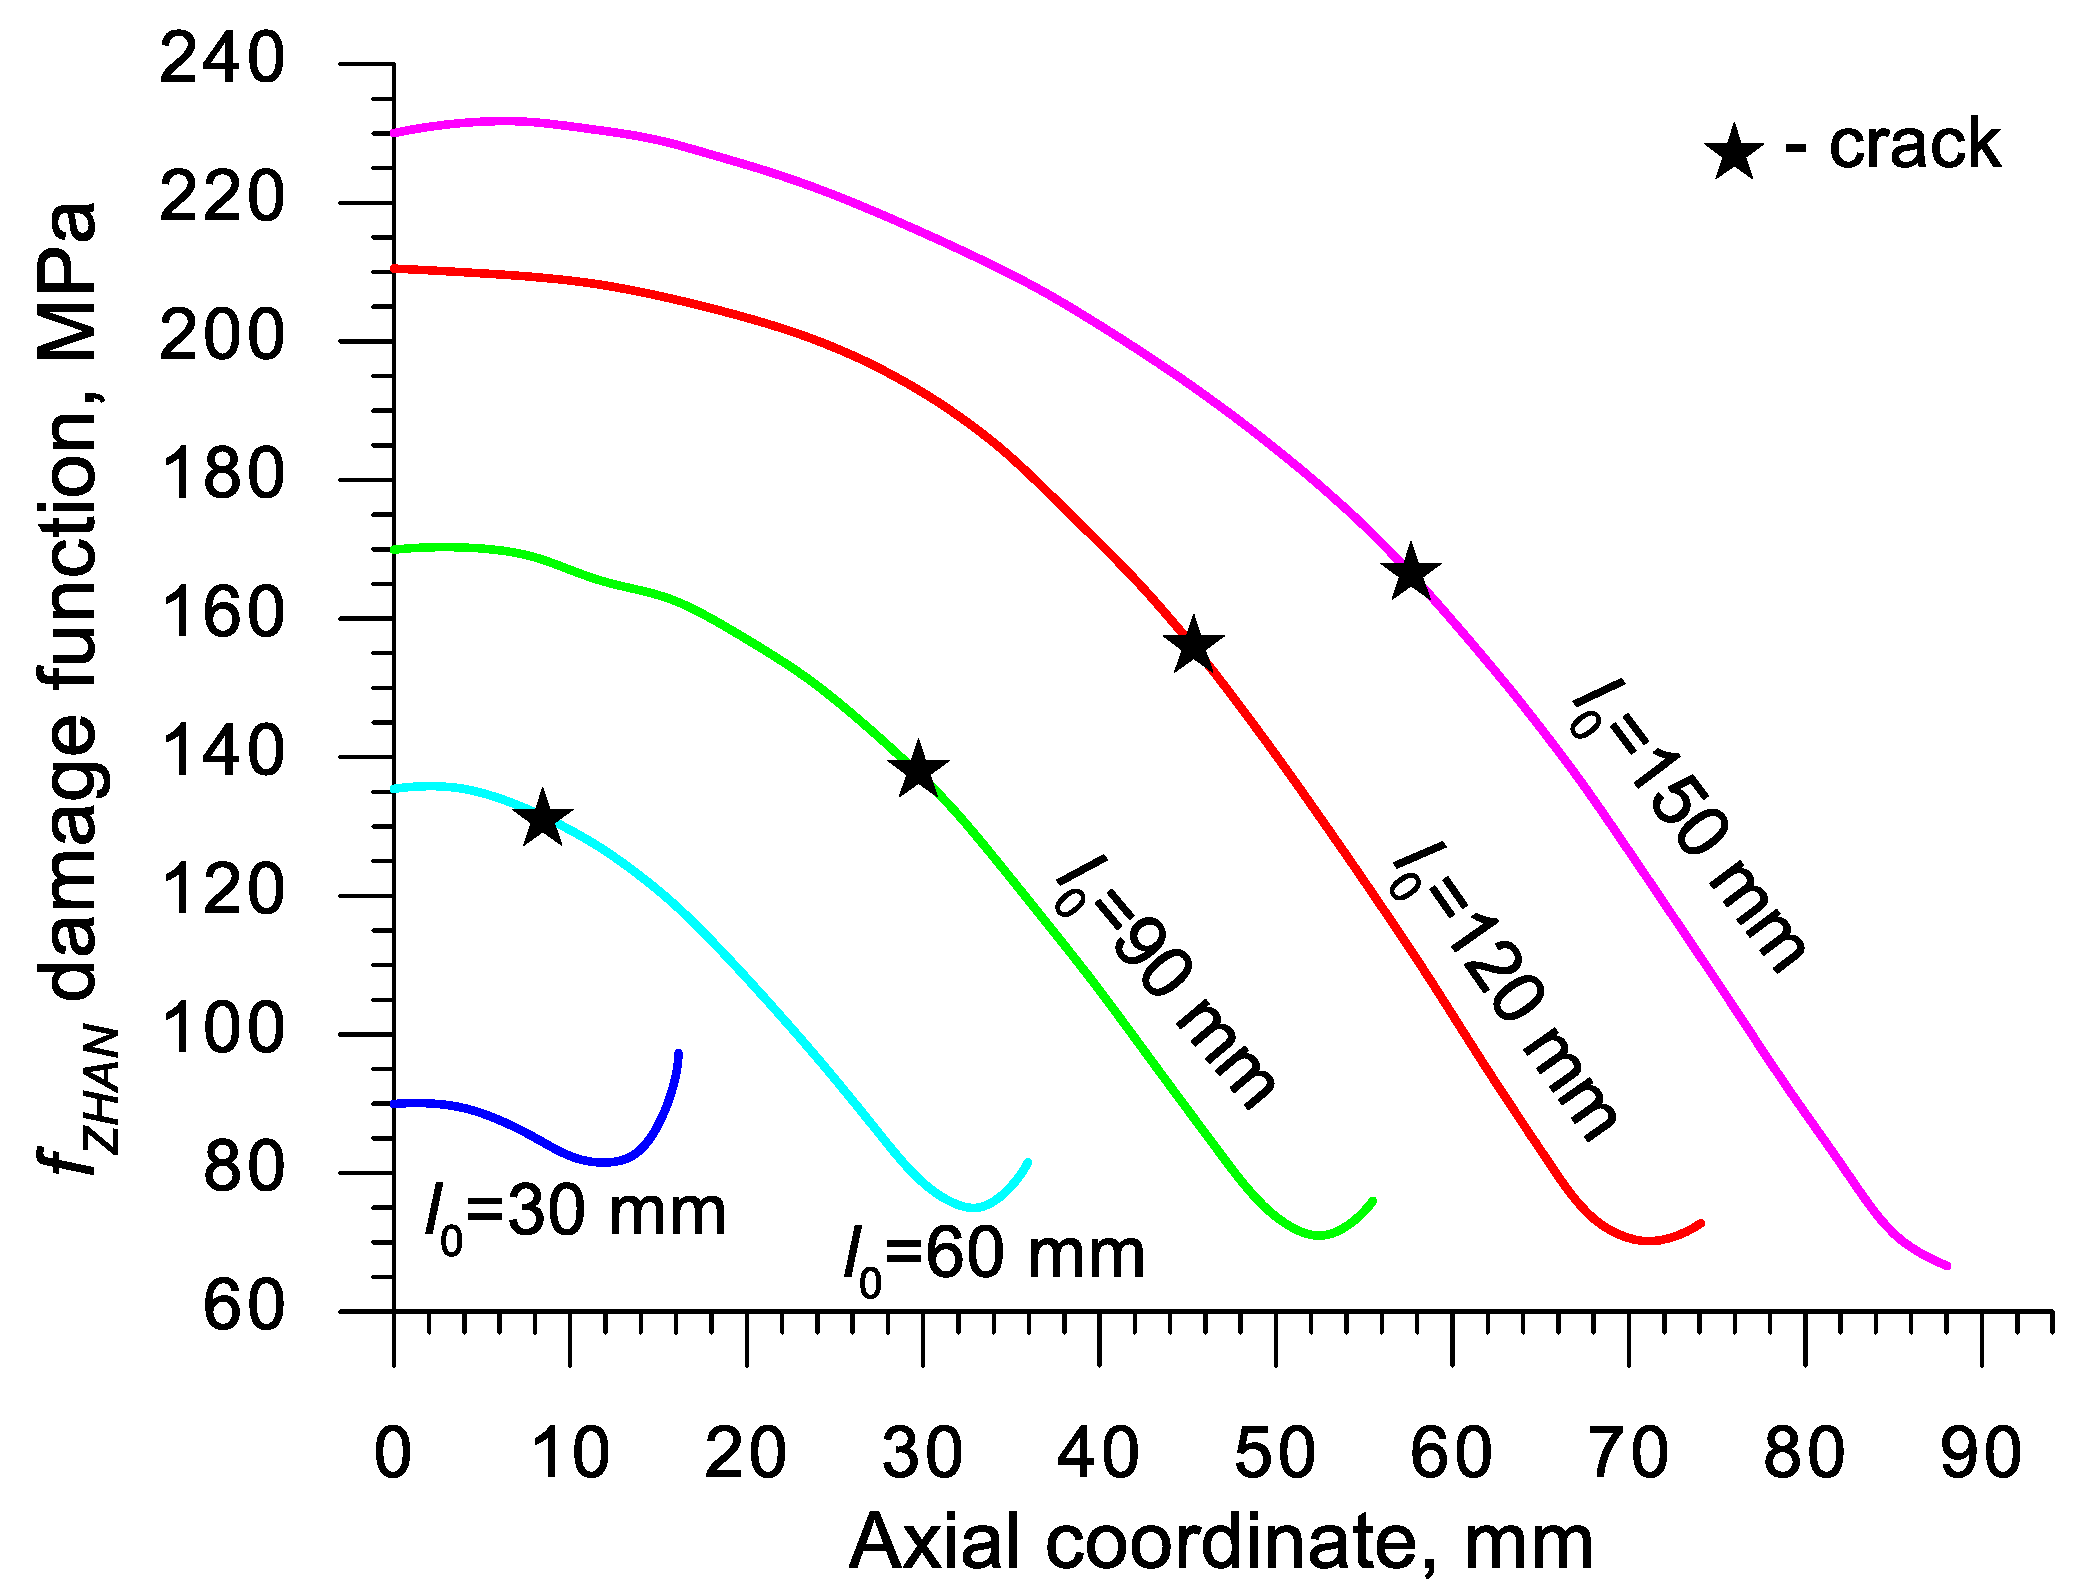
| ZHAN | Zhan et al. (2009) |
| Test No. | Characterization | Stress Triaxiality η | Lode Angle Parameter θ |
|---|---|---|---|
| 1 | Smooth bars, tension | 1 | |
| 2 | Notched bars, tension | 1 | |
| 3 | Plastic plane strain, tension | 0 | |
| 4 | Flat grooved plates, tension | 0 | |
| 5 | Torsion or shear | 0 | 0 |
| 6 | Cylinders, compression | −1 | |
| 7 | Equi-biaxial plane stress tension | −1 | |
| 8 | Equi-biaxial plane stress compression | 1 | |
| 9 | Plastic plane strain, compression | 0 | |
| 10 | Notched bars, compression | −1 |
| C | Mn | Si | P | S | Cr | Ni | Mo | Cu | Fe |
|---|---|---|---|---|---|---|---|---|---|
| 0.42–0.5 | 0.5–0.8 | 0.1–0.4 | max 0.04 | max 0.04 | max 0.03 | max 0.3 | max 0.1 | max 0.3 | balance |
| CFREU | CCL | CRT | CBROZ | COYAN | CARGO | COH | CAYAD | CKO | CZHAN |
|---|---|---|---|---|---|---|---|---|---|
| 241.2 | 192.4 | 4.88 | 3.04 | 3.42 | 301.9 | 2.46 | 0.81 | 8.90 | 131.6 |
© 2020 by the authors. Licensee MDPI, Basel, Switzerland. This article is an open access article distributed under the terms and conditions of the Creative Commons Attribution (CC BY) license (http://creativecommons.org/licenses/by/4.0/).
Share and Cite
Pater, Z.; Tomczak, J.; Bulzak, T.; Wójcik, Ł.; Walczuk-Gągała, P. Rotational Compression of Cylindrical Specimen As a New Calibrating Test for Damage Criteria. Materials 2020, 13, 740. https://doi.org/10.3390/ma13030740
Pater Z, Tomczak J, Bulzak T, Wójcik Ł, Walczuk-Gągała P. Rotational Compression of Cylindrical Specimen As a New Calibrating Test for Damage Criteria. Materials. 2020; 13(3):740. https://doi.org/10.3390/ma13030740
Chicago/Turabian StylePater, Zbigniew, Janusz Tomczak, Tomasz Bulzak, Łukasz Wójcik, and Patrycja Walczuk-Gągała. 2020. "Rotational Compression of Cylindrical Specimen As a New Calibrating Test for Damage Criteria" Materials 13, no. 3: 740. https://doi.org/10.3390/ma13030740
APA StylePater, Z., Tomczak, J., Bulzak, T., Wójcik, Ł., & Walczuk-Gągała, P. (2020). Rotational Compression of Cylindrical Specimen As a New Calibrating Test for Damage Criteria. Materials, 13(3), 740. https://doi.org/10.3390/ma13030740