Structure of Fe-Mn-Al-C Steels after Gleeble Simulations and Hot-Rolling


Abstract
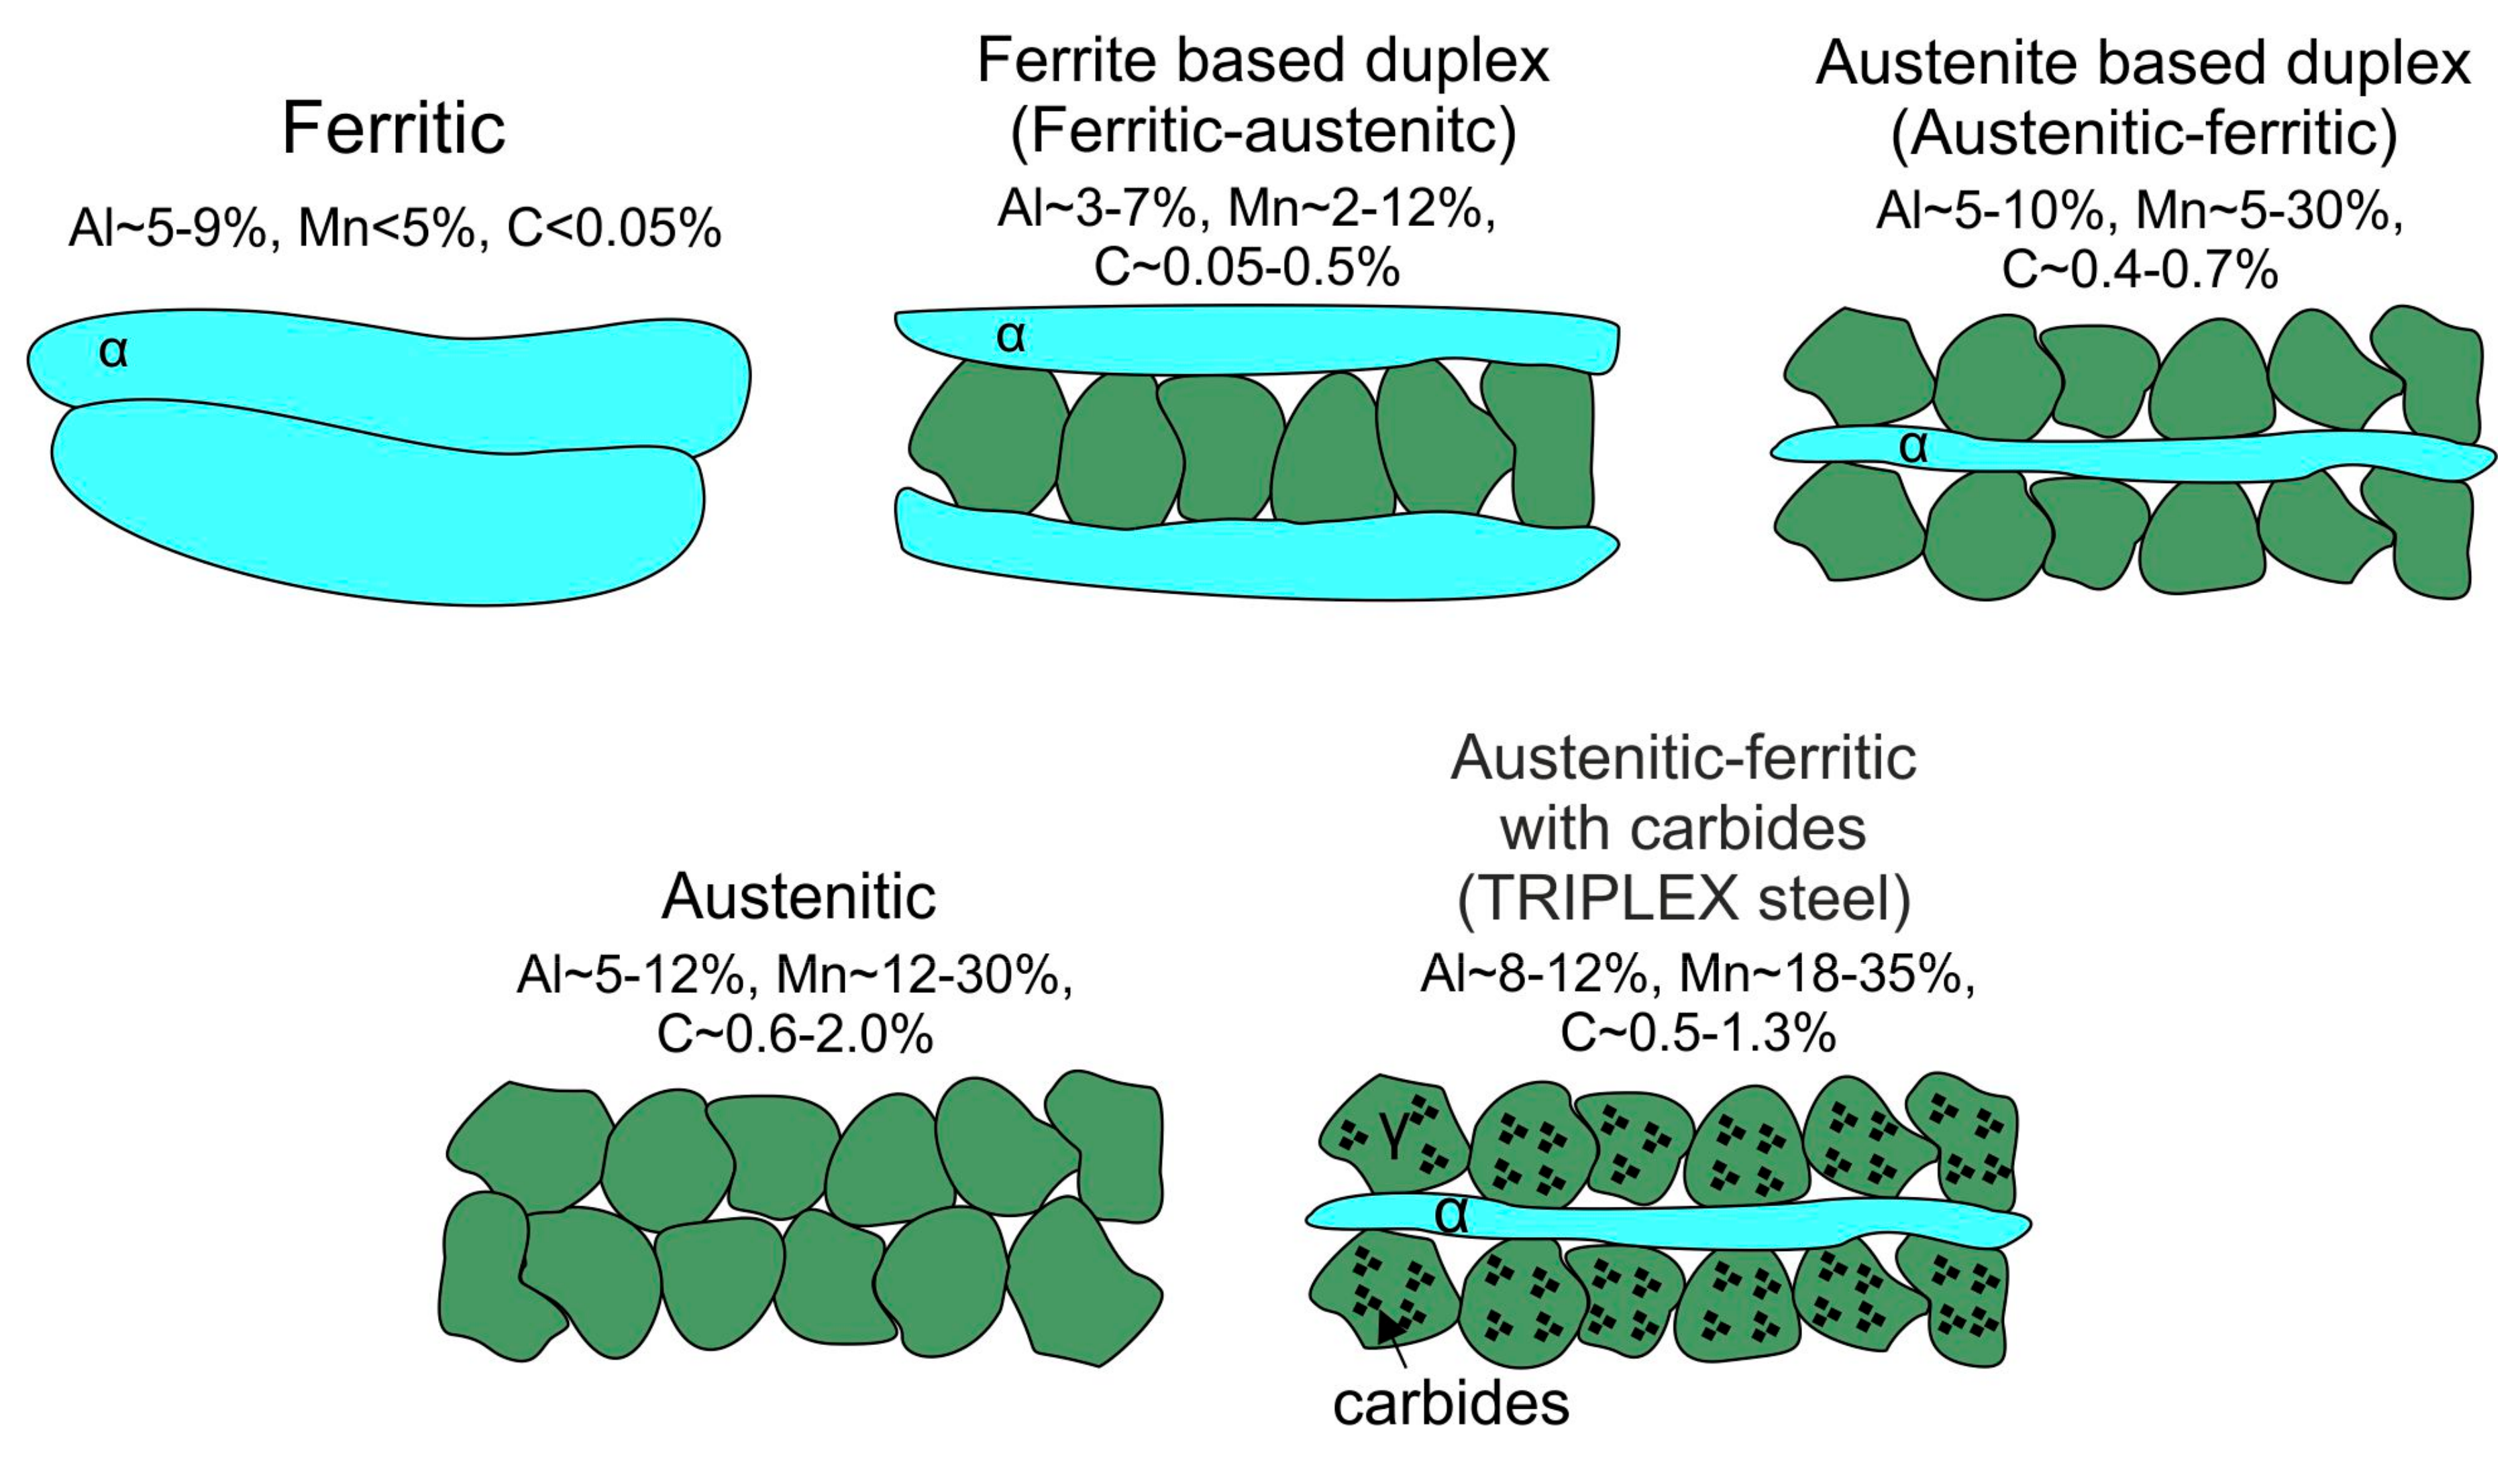
1. Introduction
2. Materials and Methods
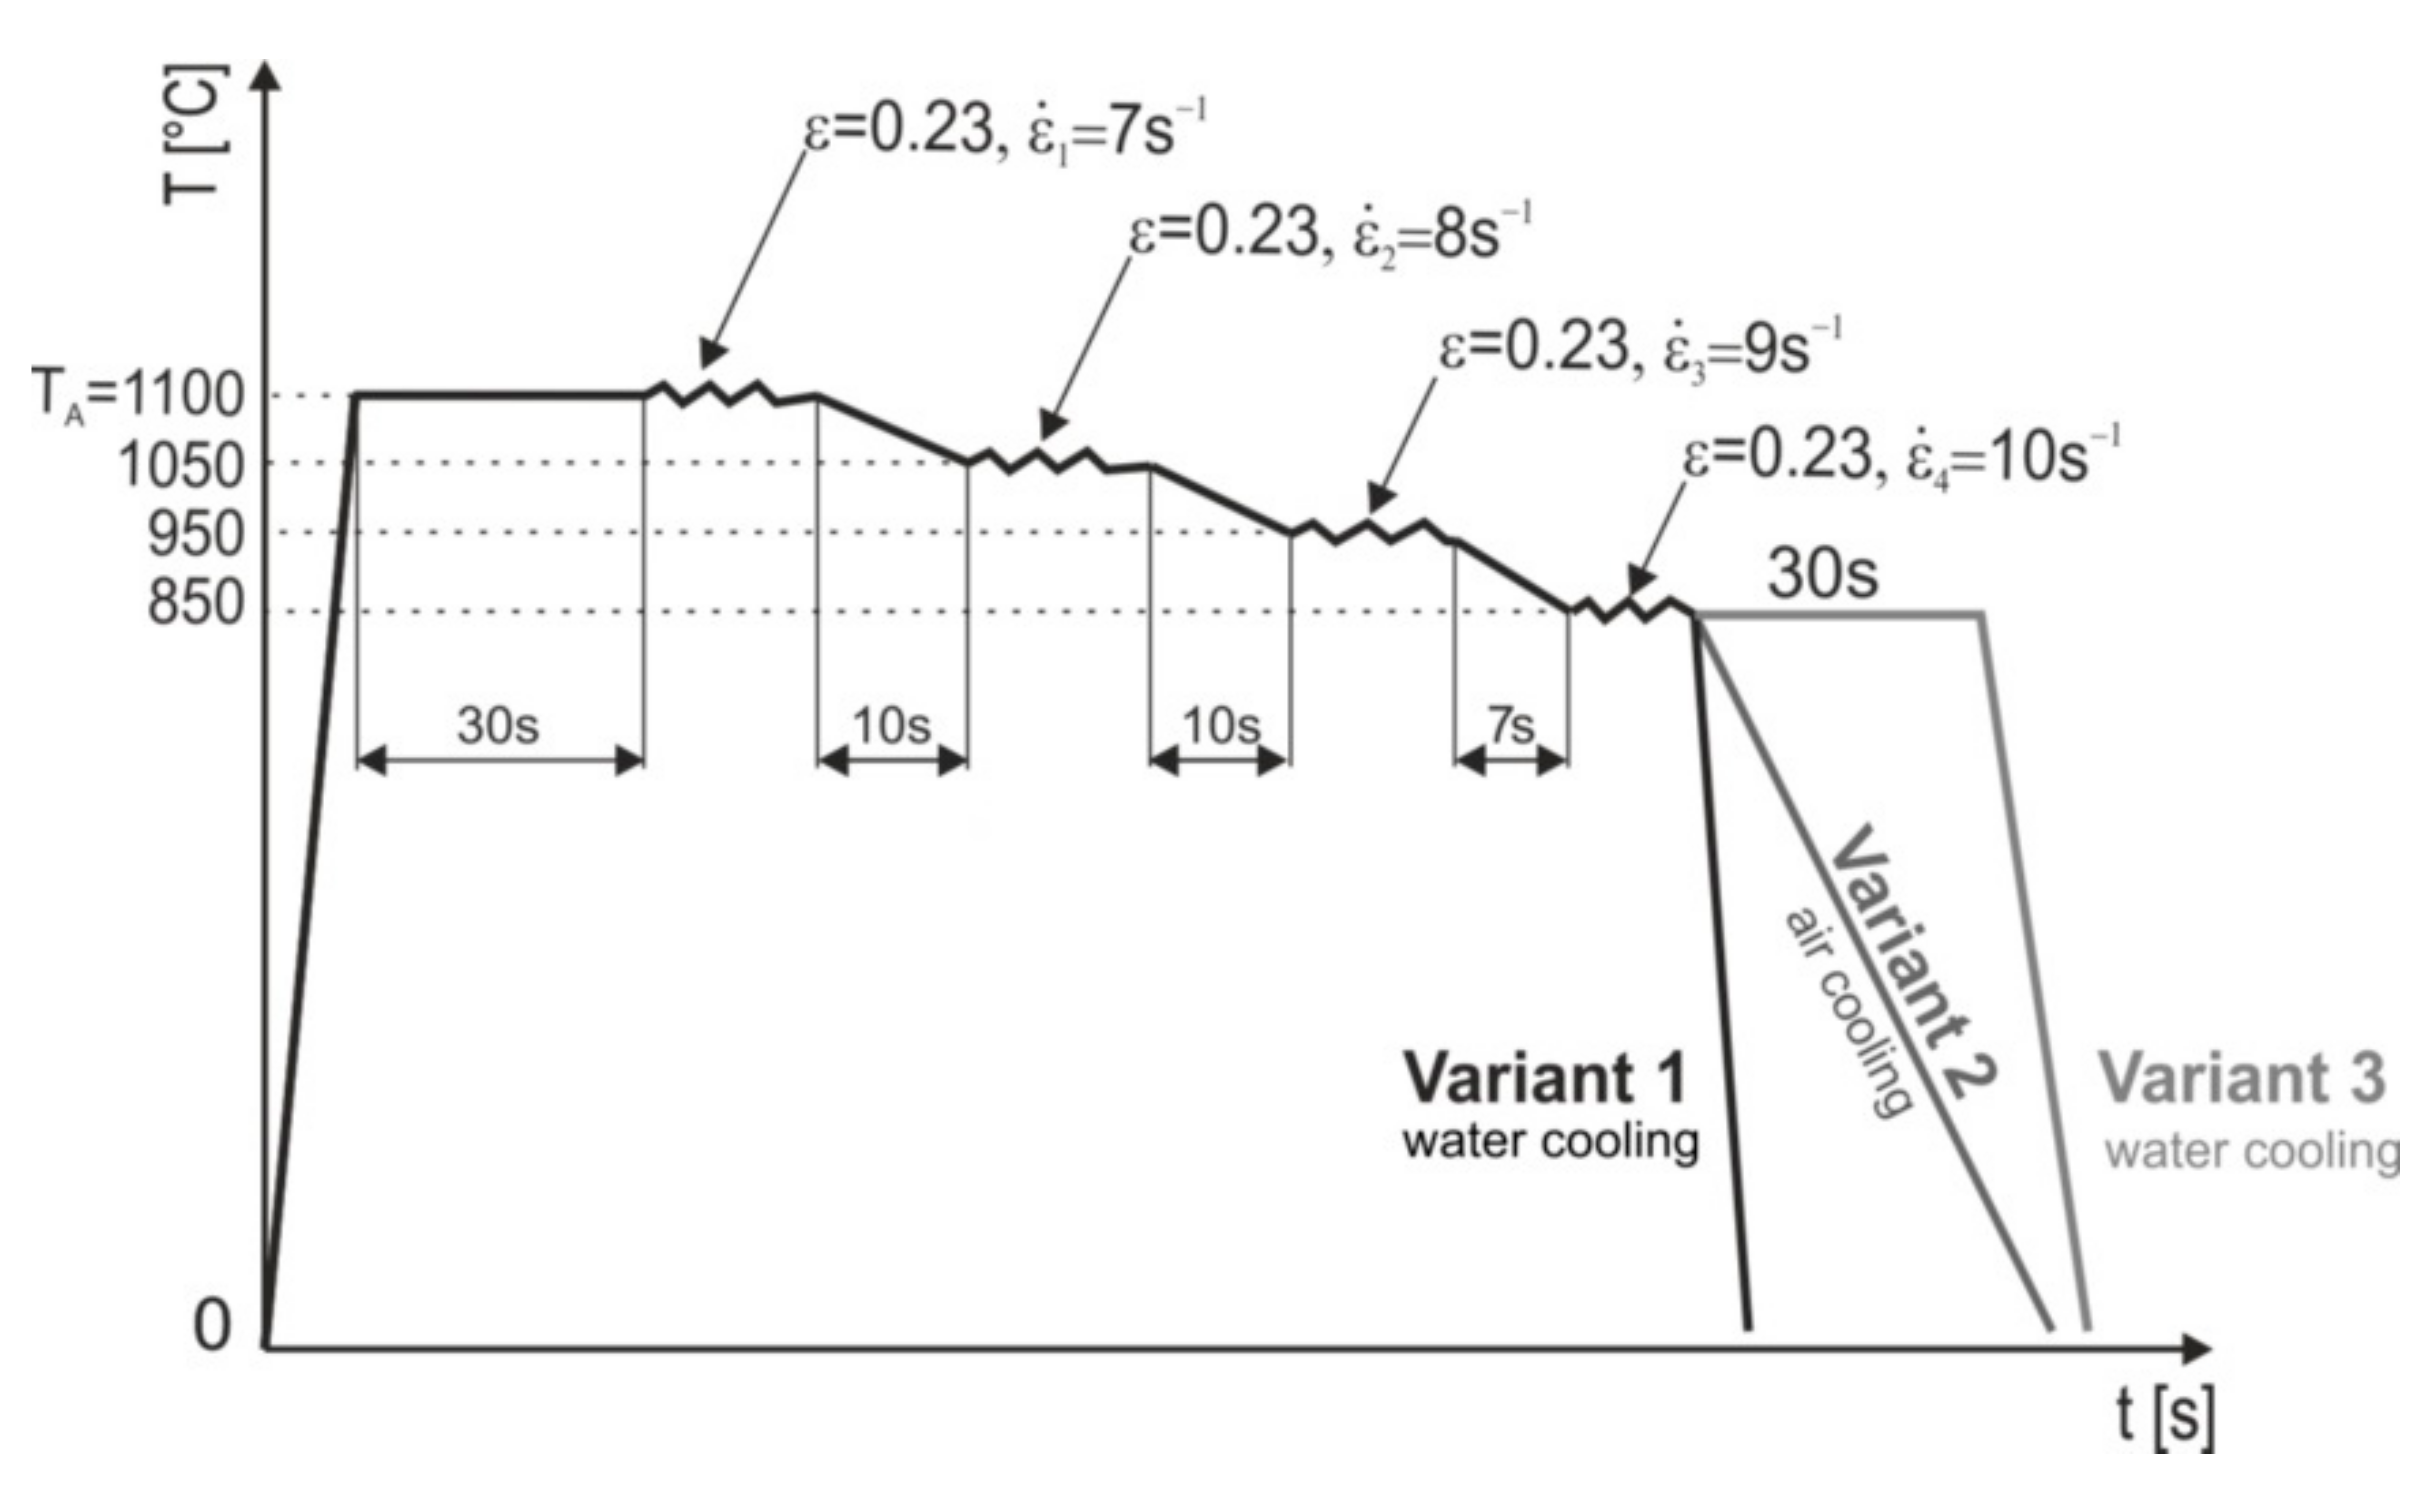
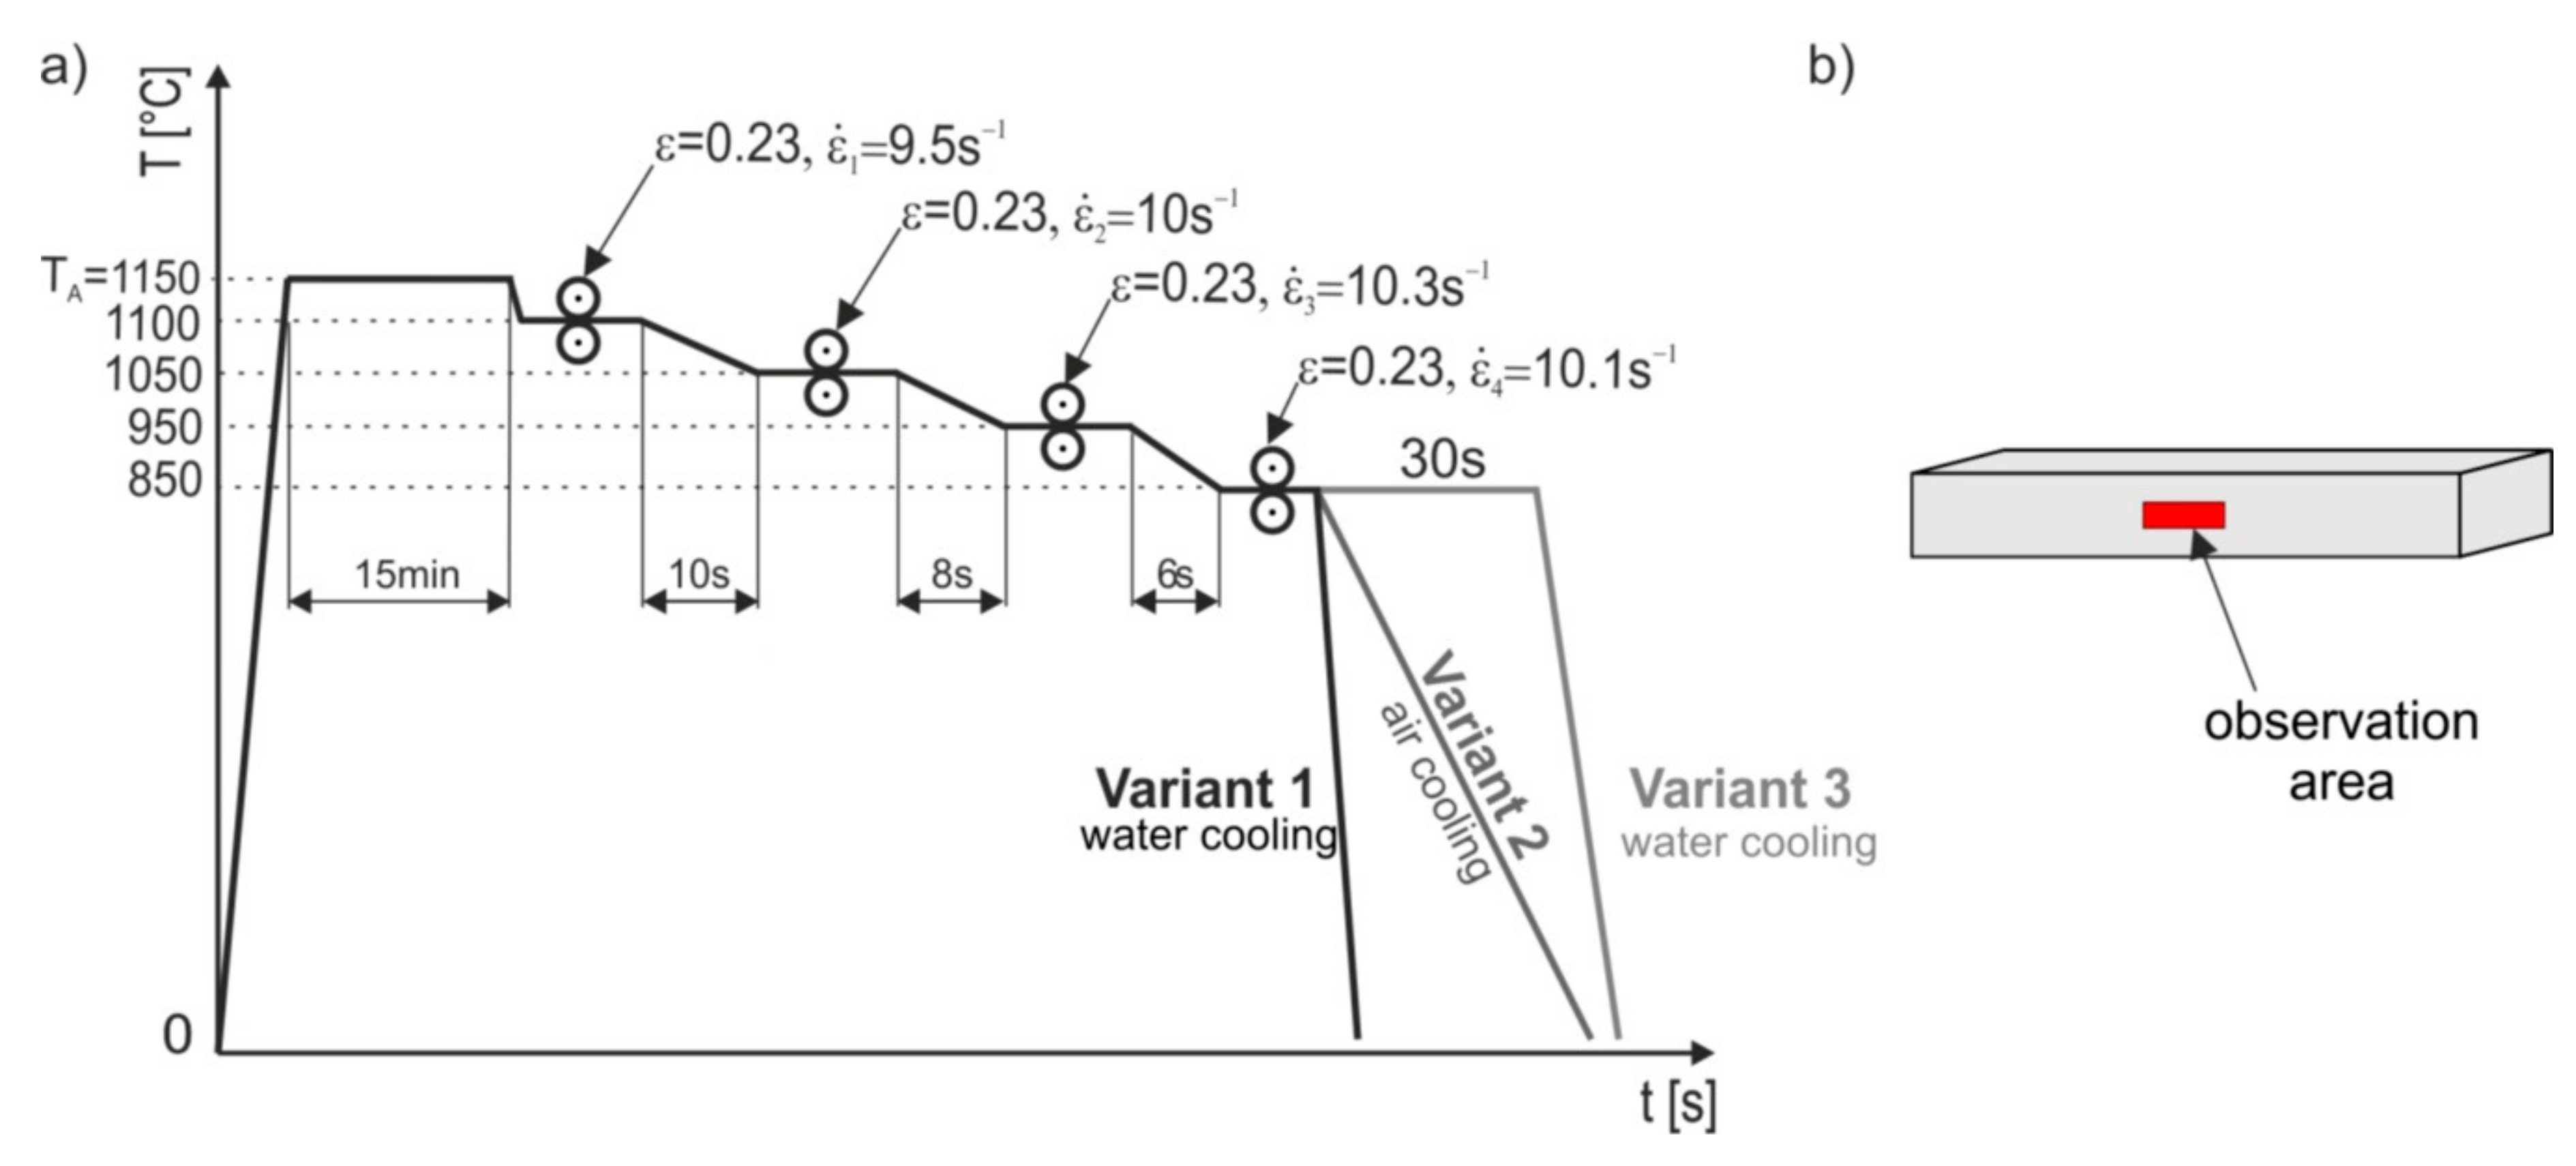
- Variant 1—supersaturation of steel after plastic deformation in the last culvert with a deformation value of 20%, under deformation strengthening conditions controlled by dynamic healing;
- Variant 2—cooling of steel in the air after plastic deformation in the last culvert with a deformation value of 20%, under deformation strengthening conditions controlled by static and metadynamic recrystallization;
- Variant 3—supersaturation of steel after plastic deformation in the last culvert with a 20% deformation value and isothermal annealing at its deformation temperature for 30 s, in conditions ensuring the assumed proportion of statically recrystallized austenite grains.
- Total of 950 mL 99% acetic acid (CH3COOH);
- Total of 50 mL 60% perchloric acid (HClO4).
3. Results and Discussion
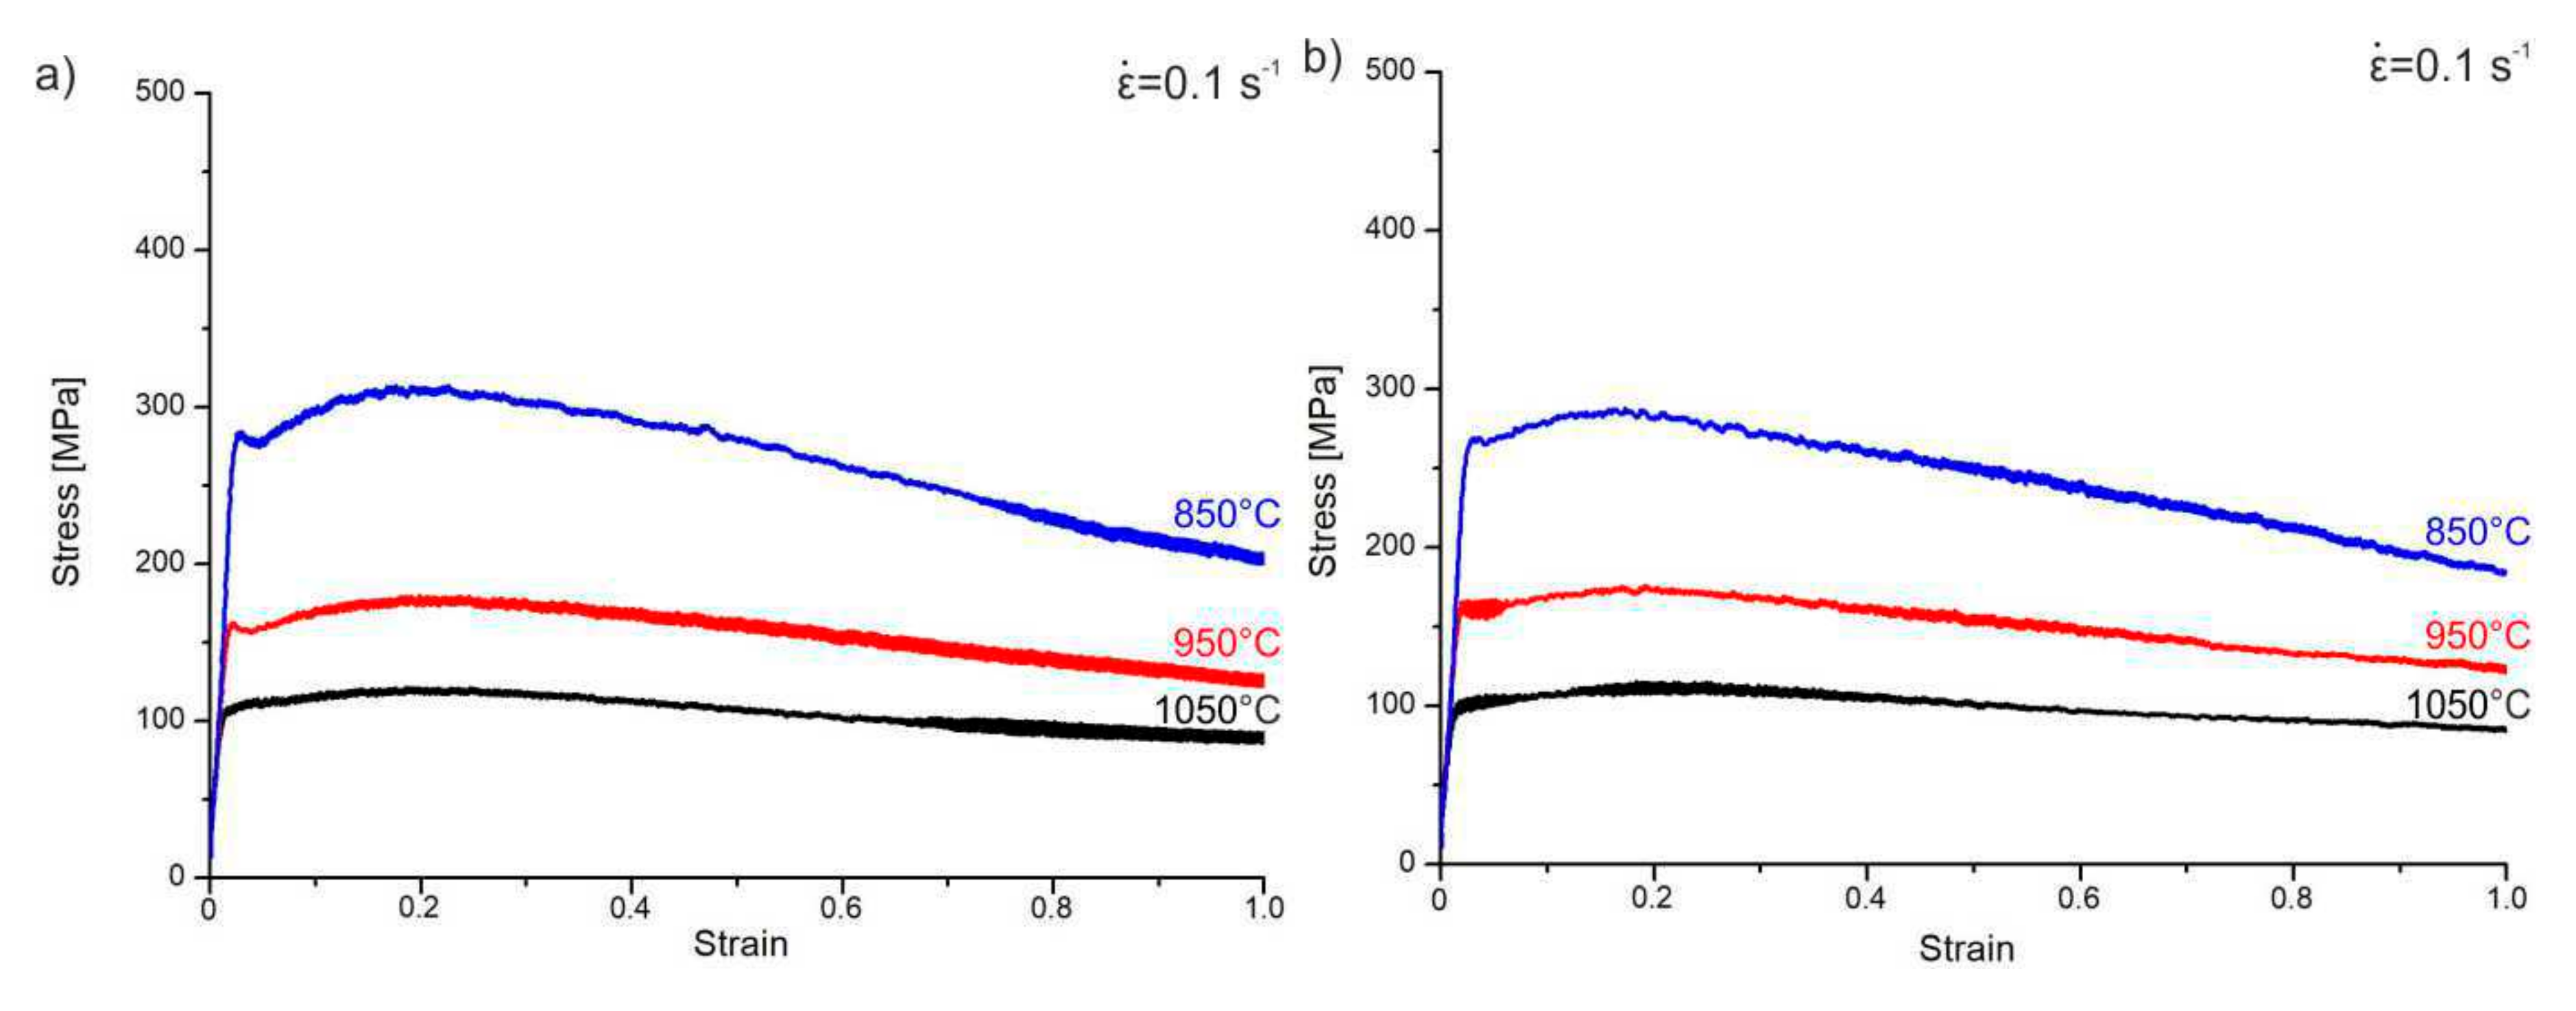
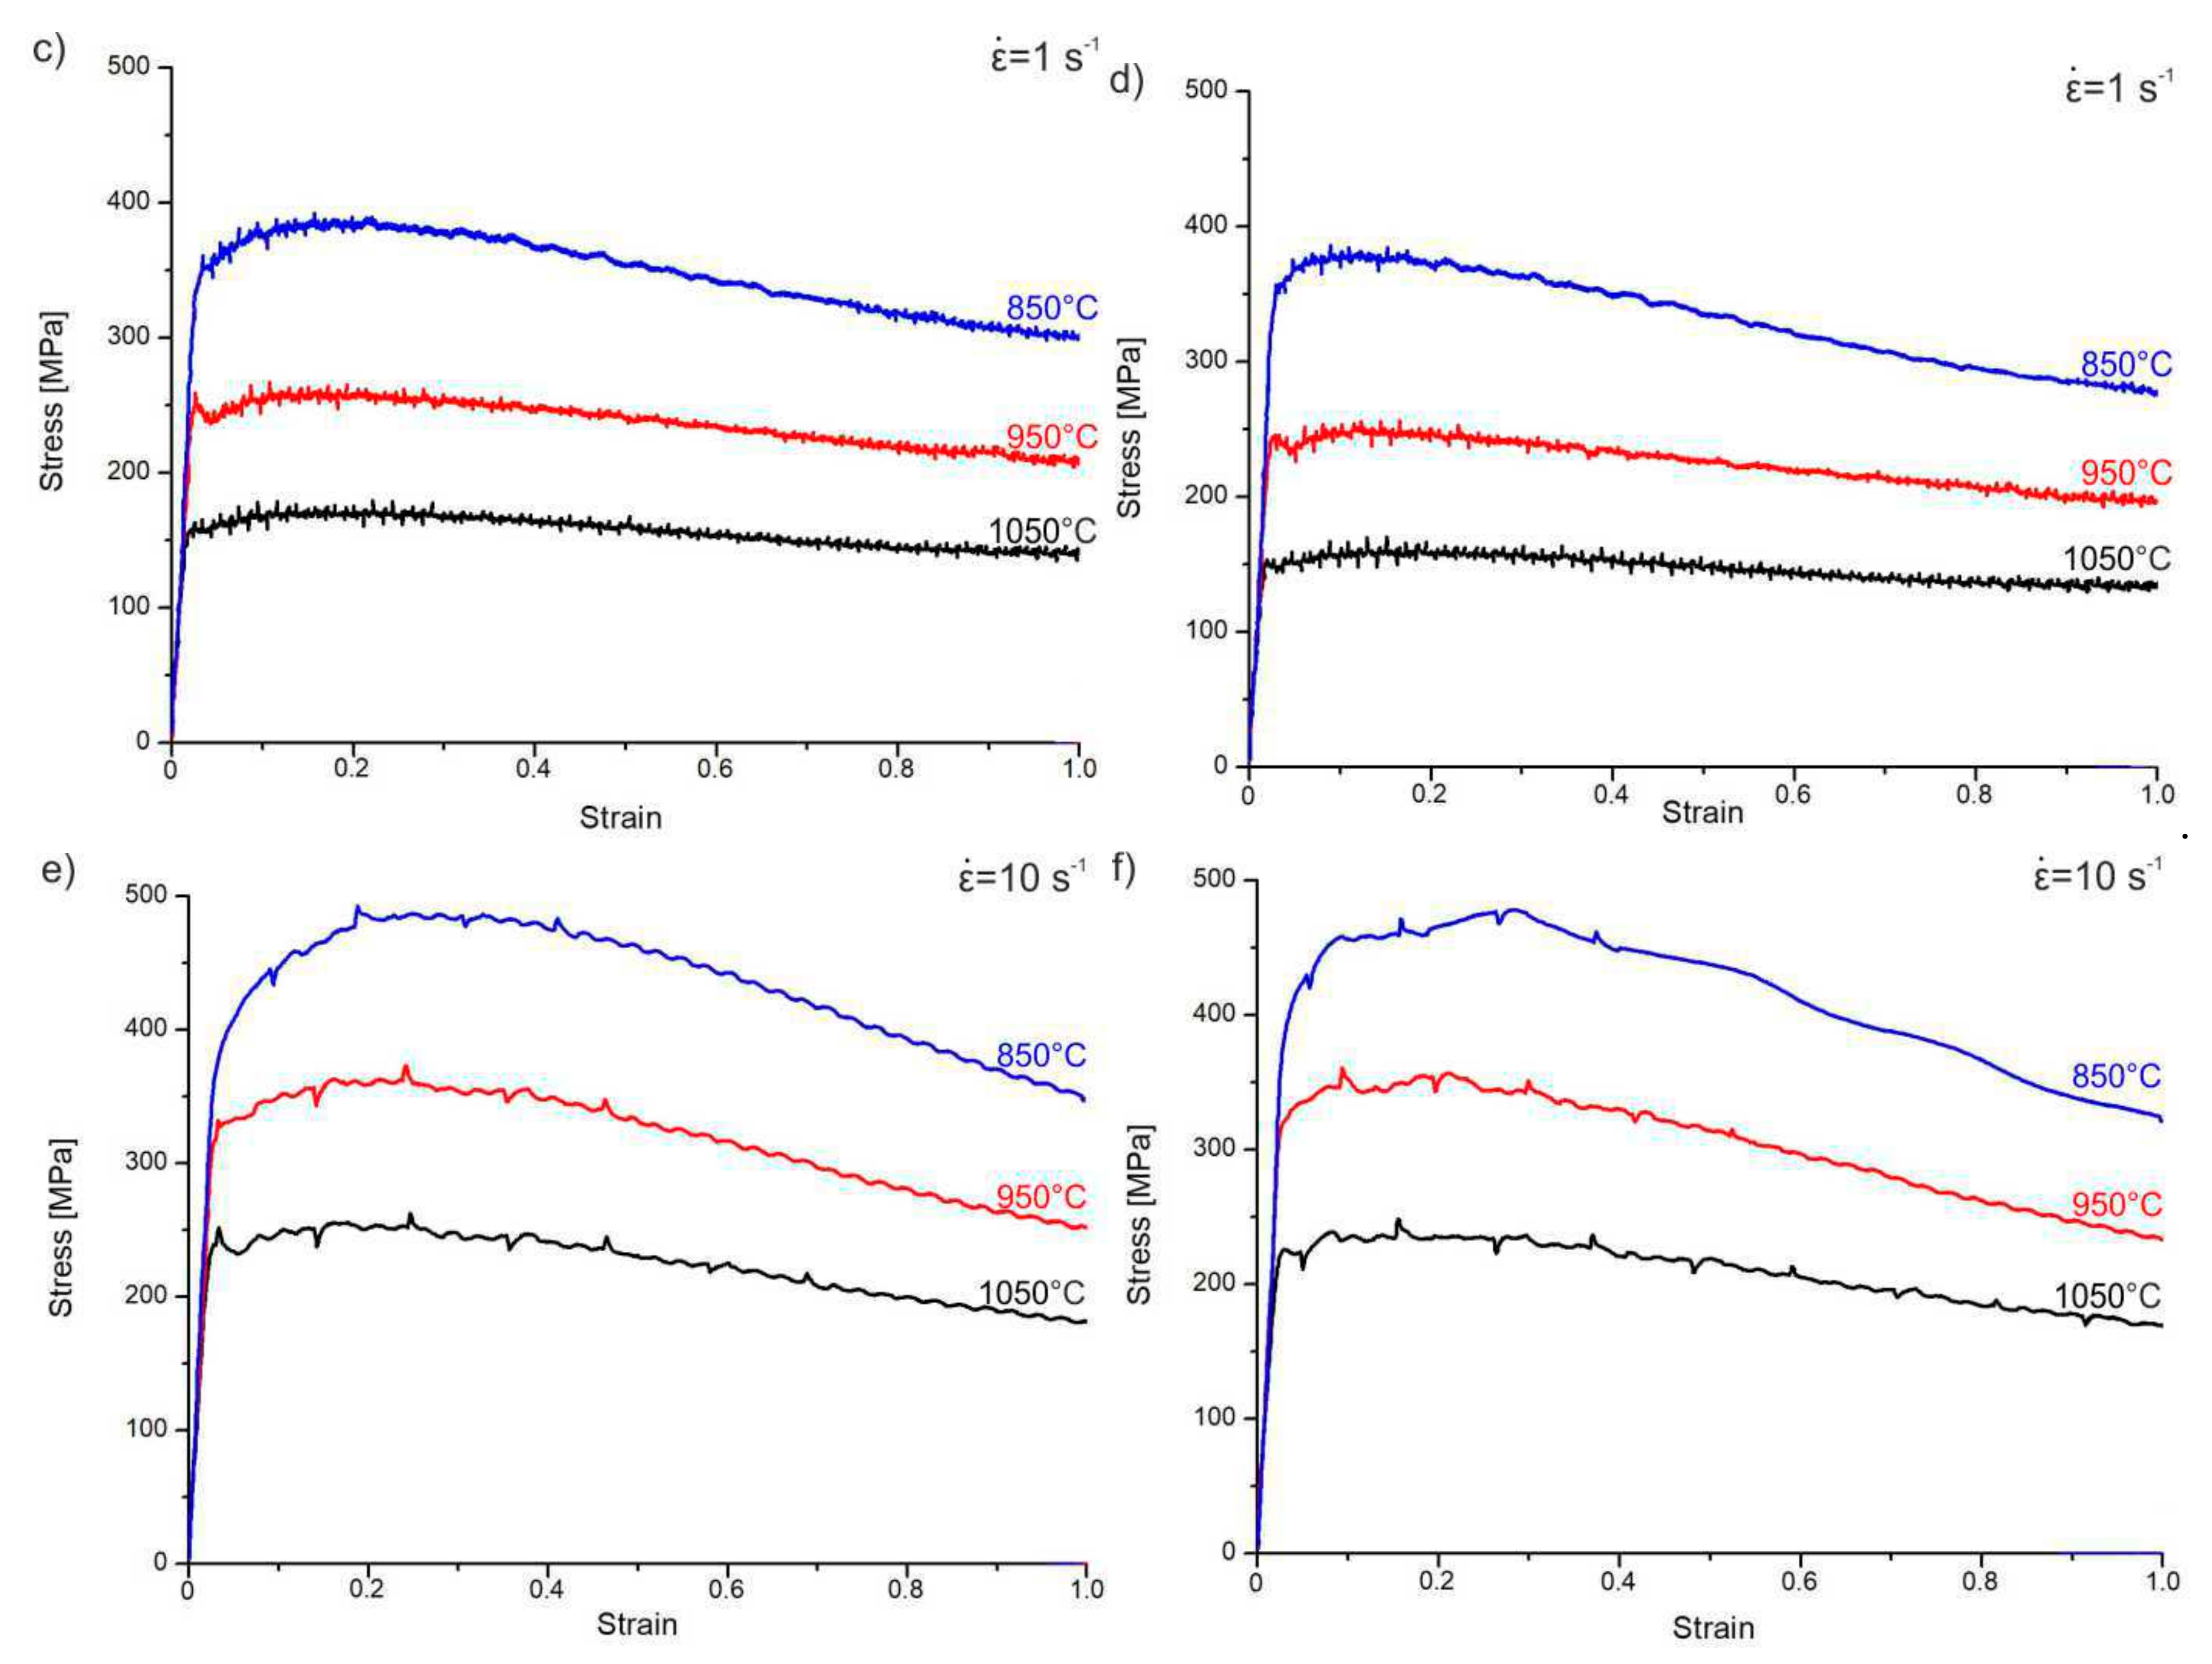
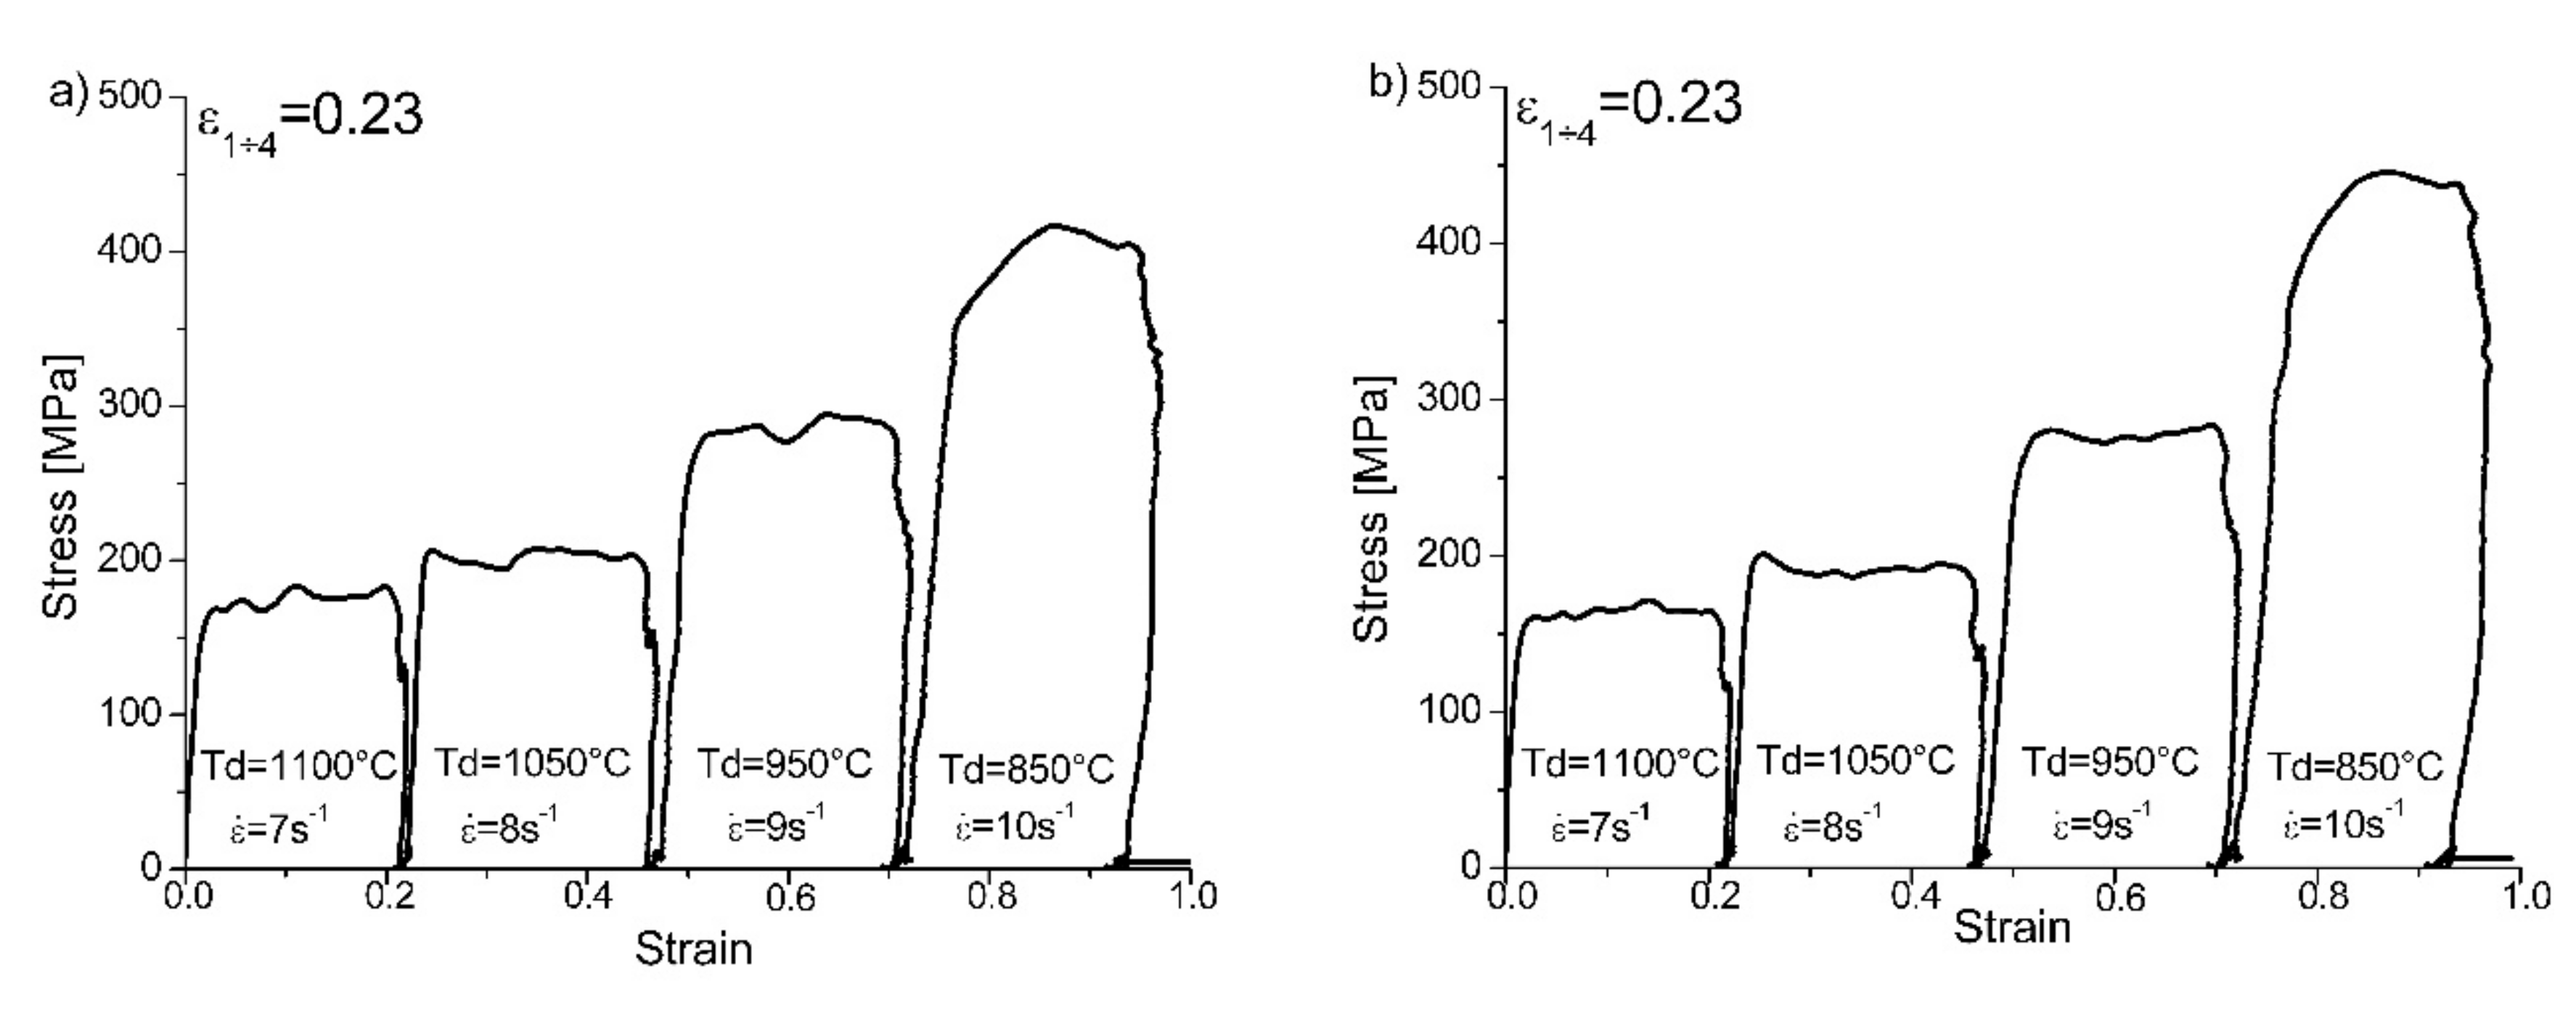
3.1. Plastometric Behavior
3.2. Microstructure
4. Conclusions
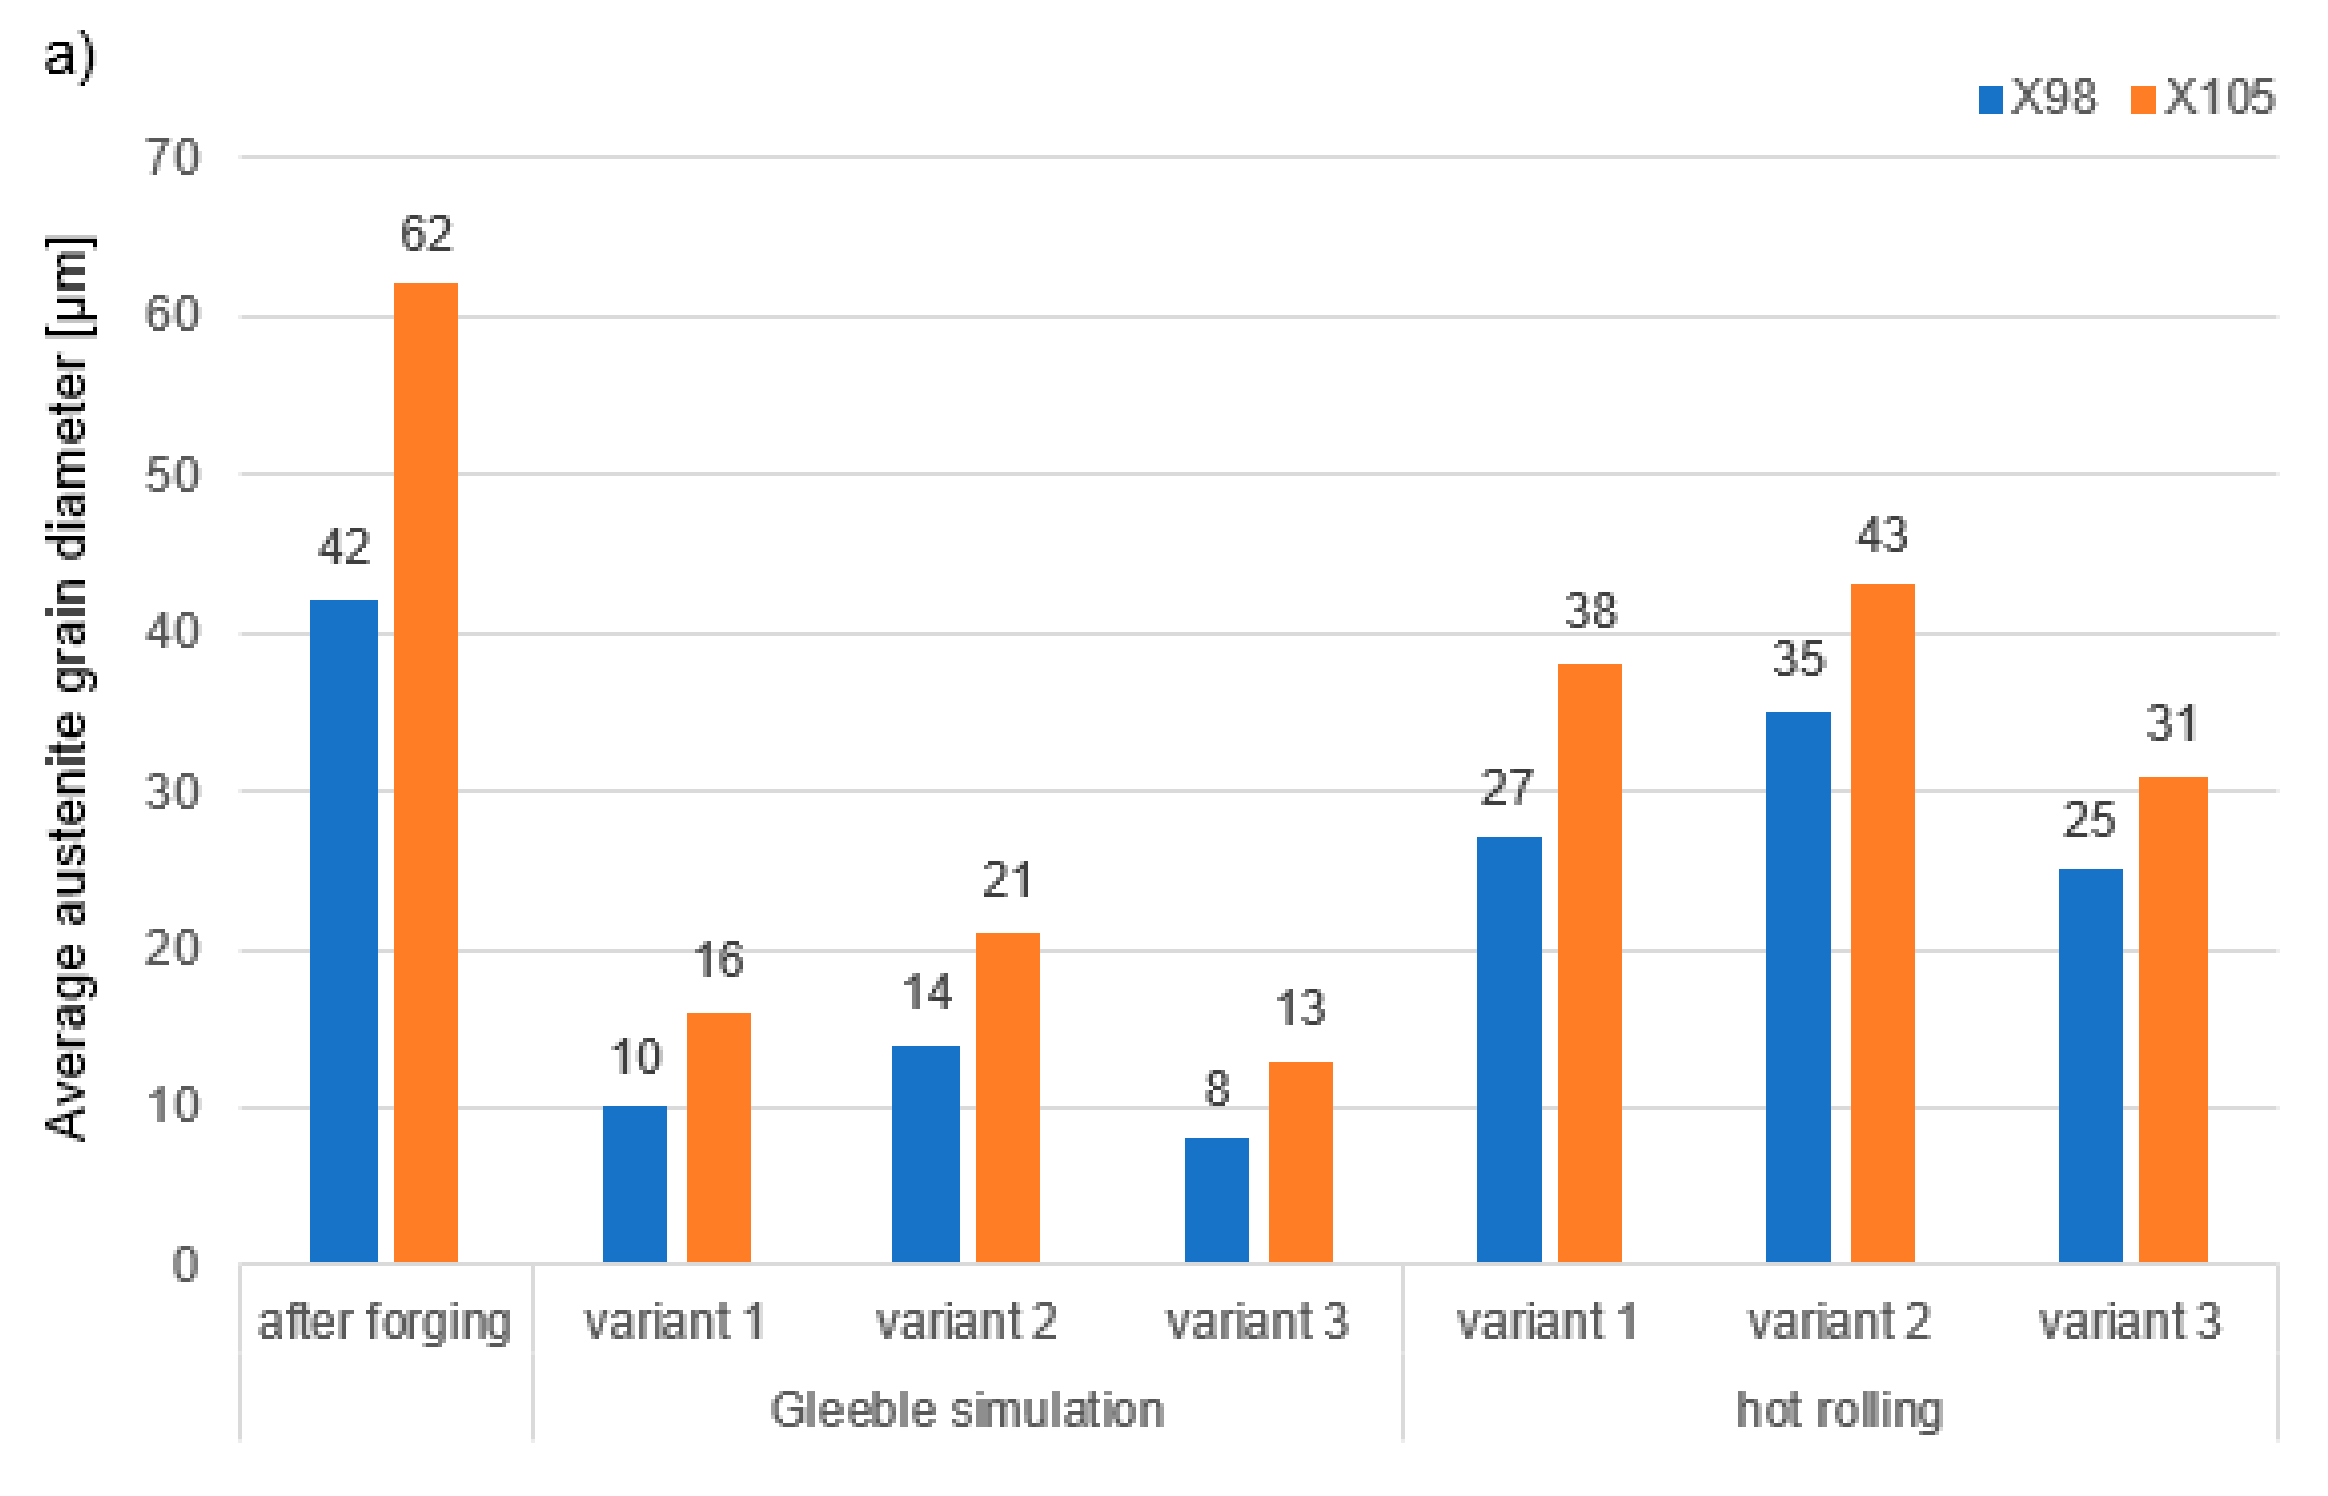
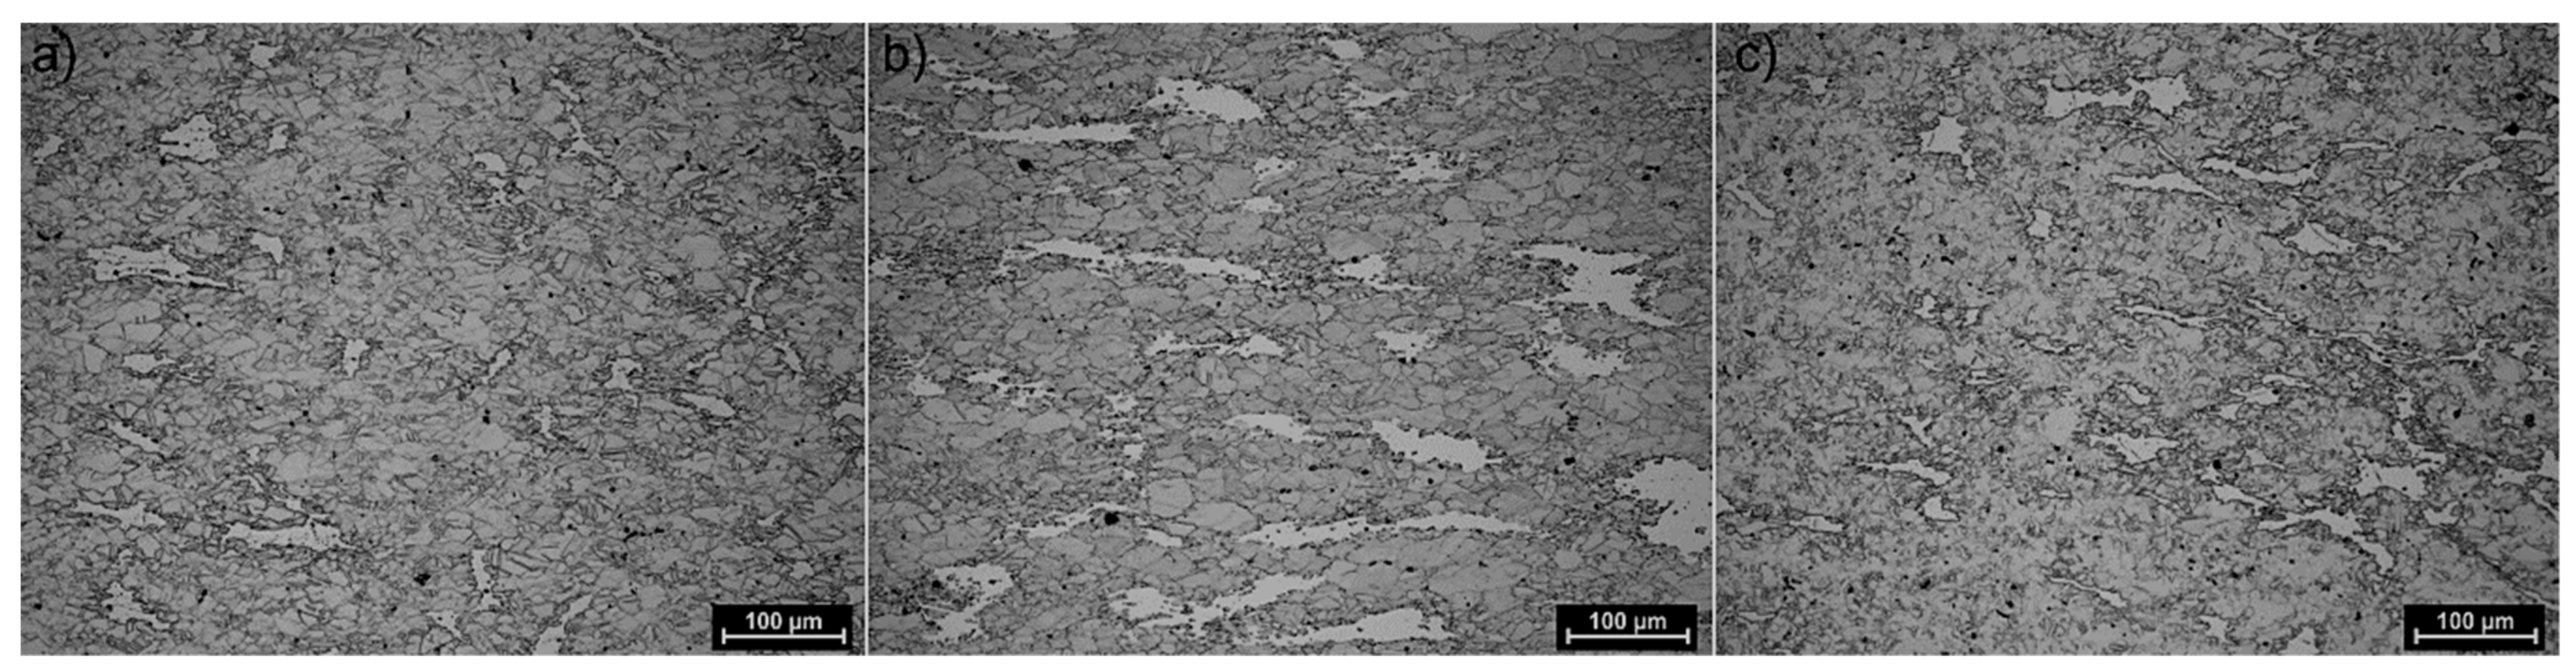
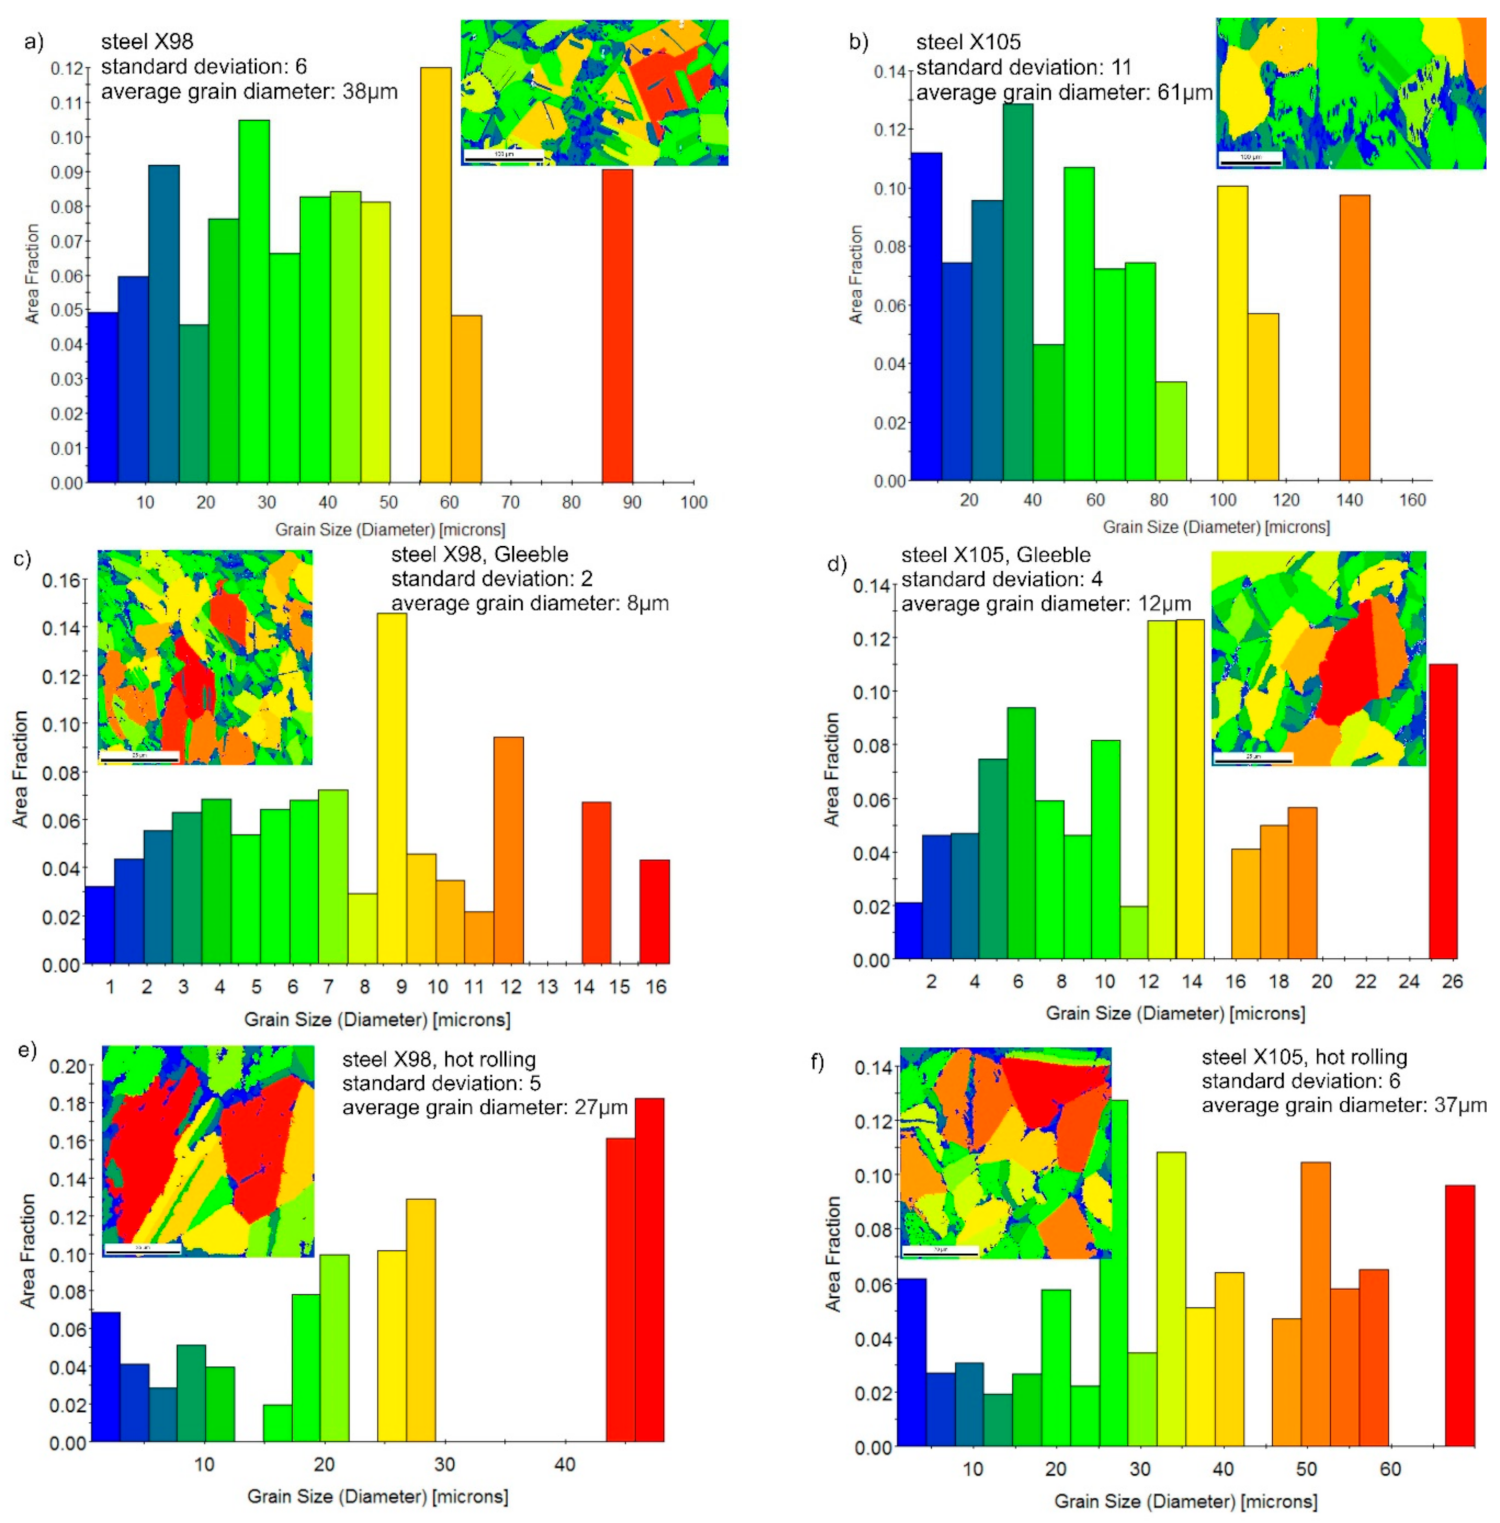
- The structure of the newly developed TRIPLEX steels after forging consisted of austenite, ferrite, and carbides. The average grain diameter of austenite in the forged state of X98 steel was 42 µm, while in X105 steel it was nearly 50% larger and amounted to 62 µm. The ferrite share in steel with Nb and Ti (X98) additions was on average around 11%, and in the case of the reference X105 steel its share was definitely higher and amounted to about 27%;
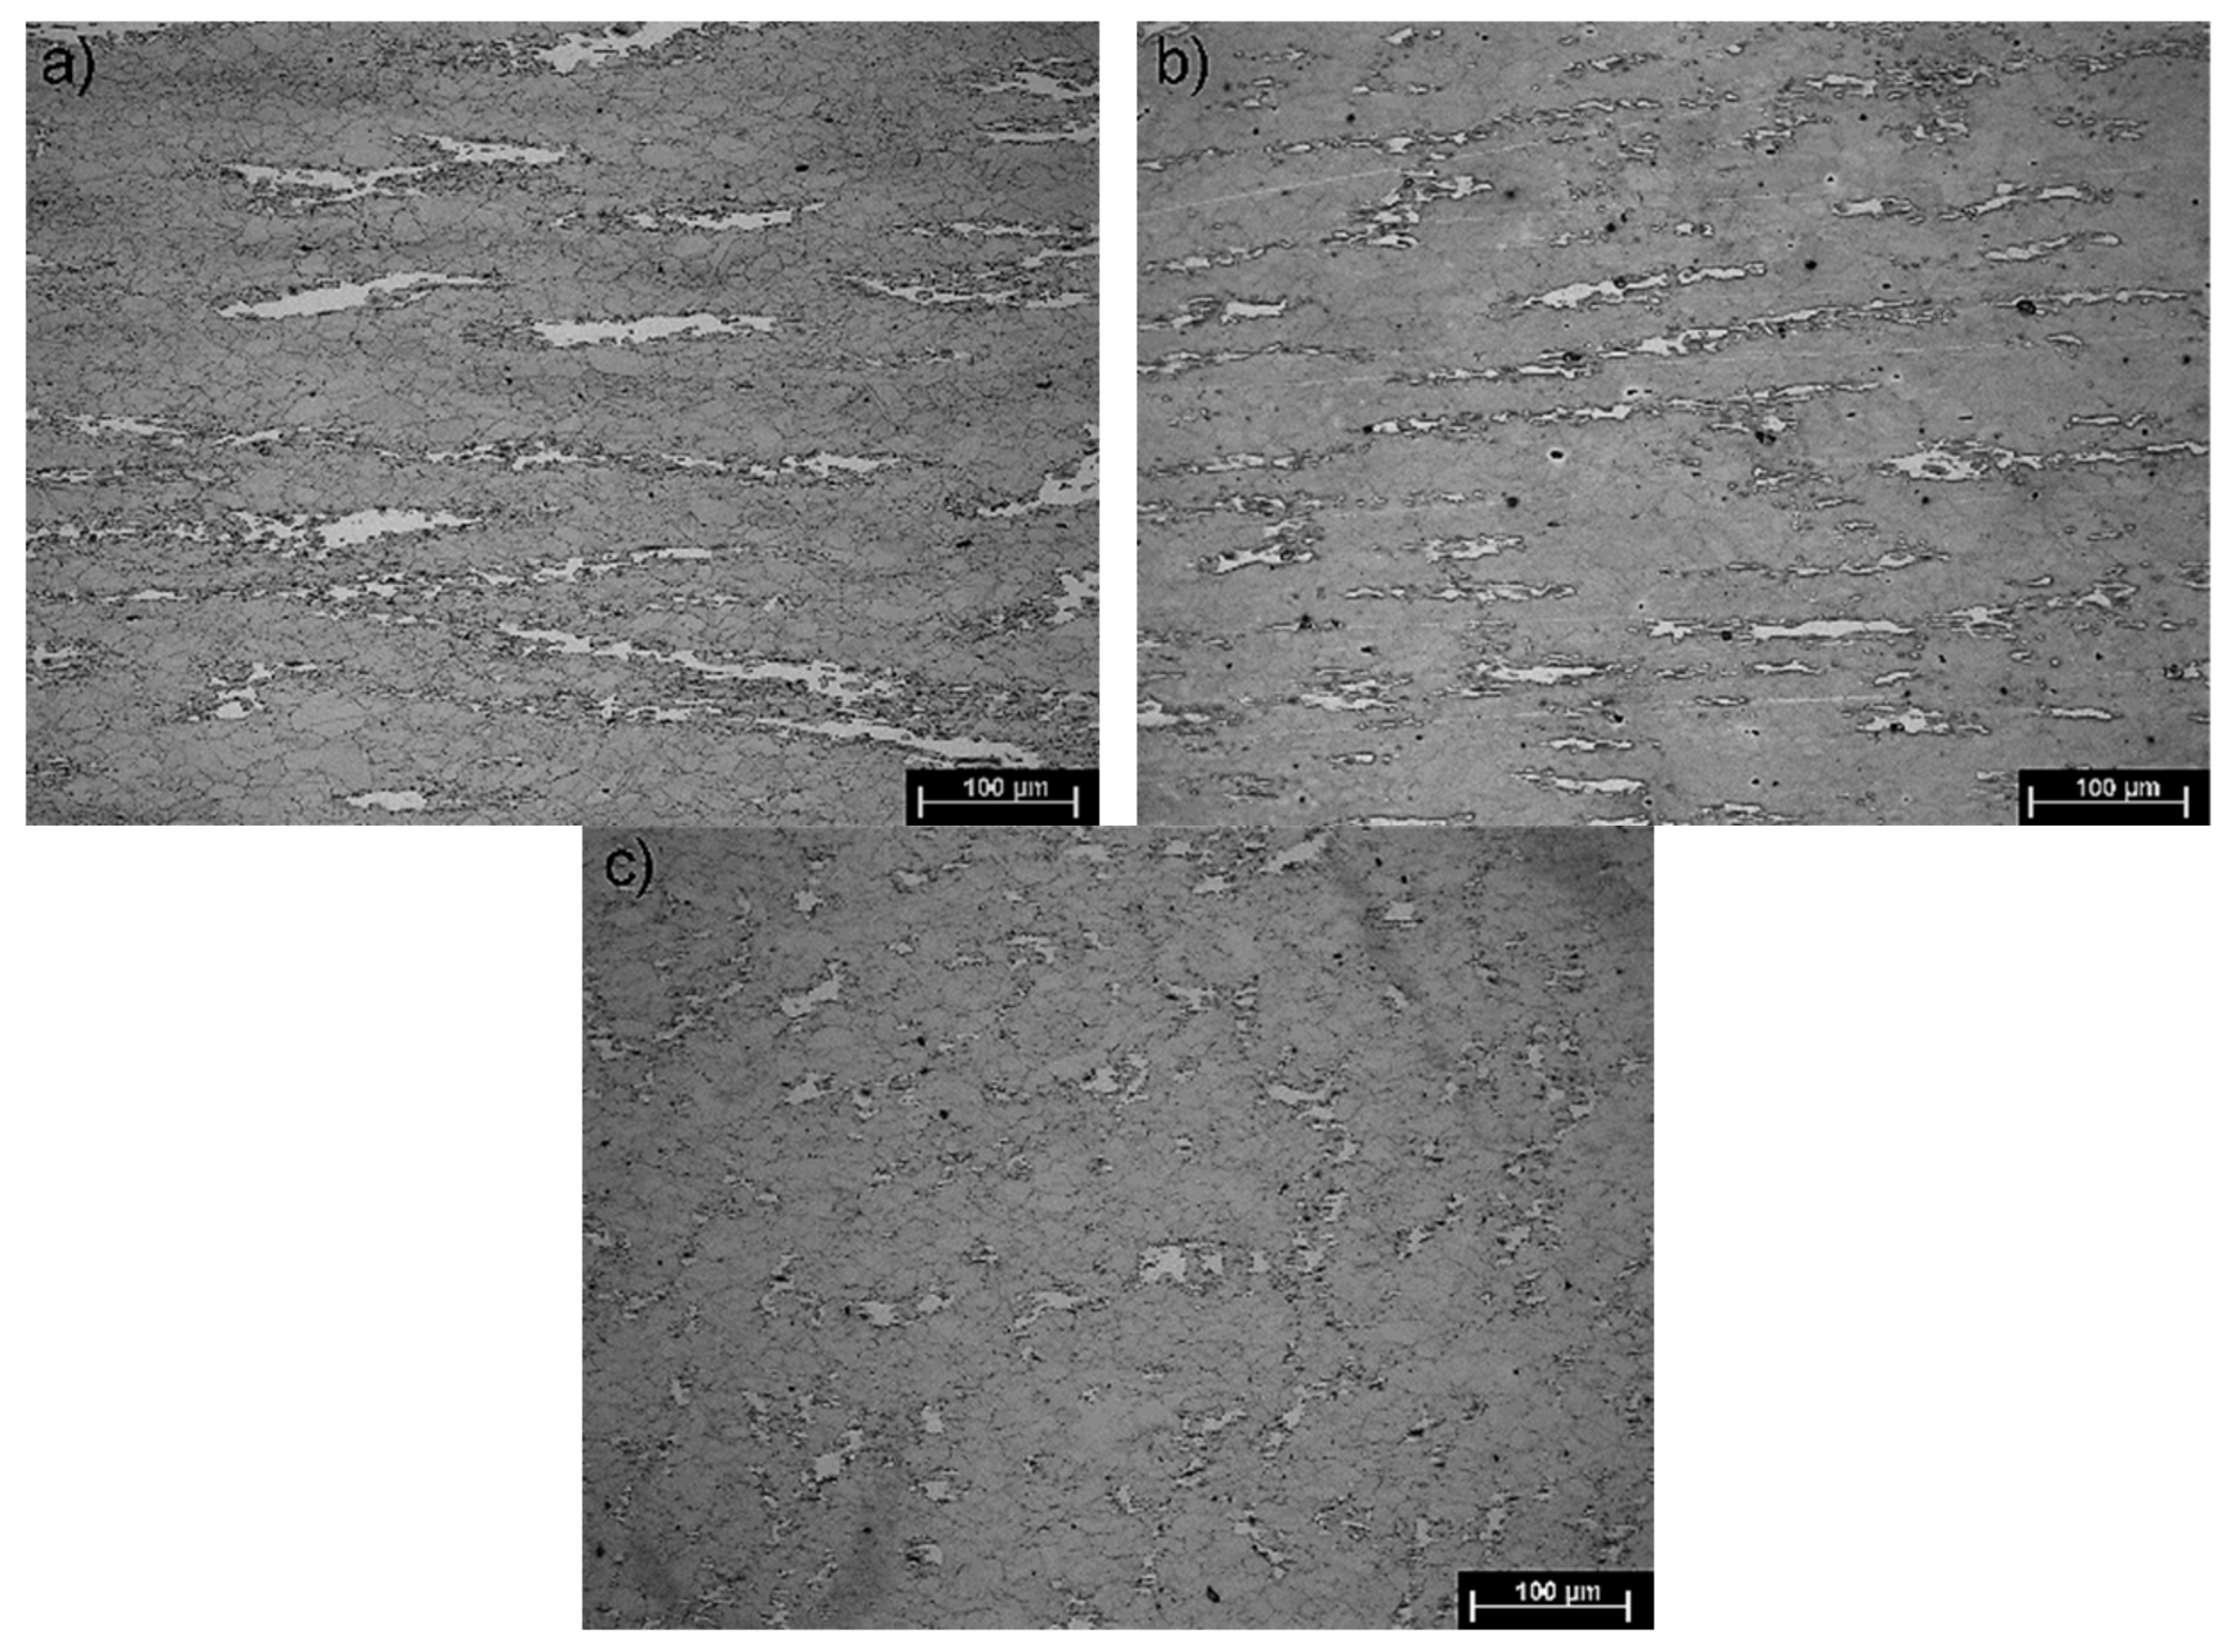
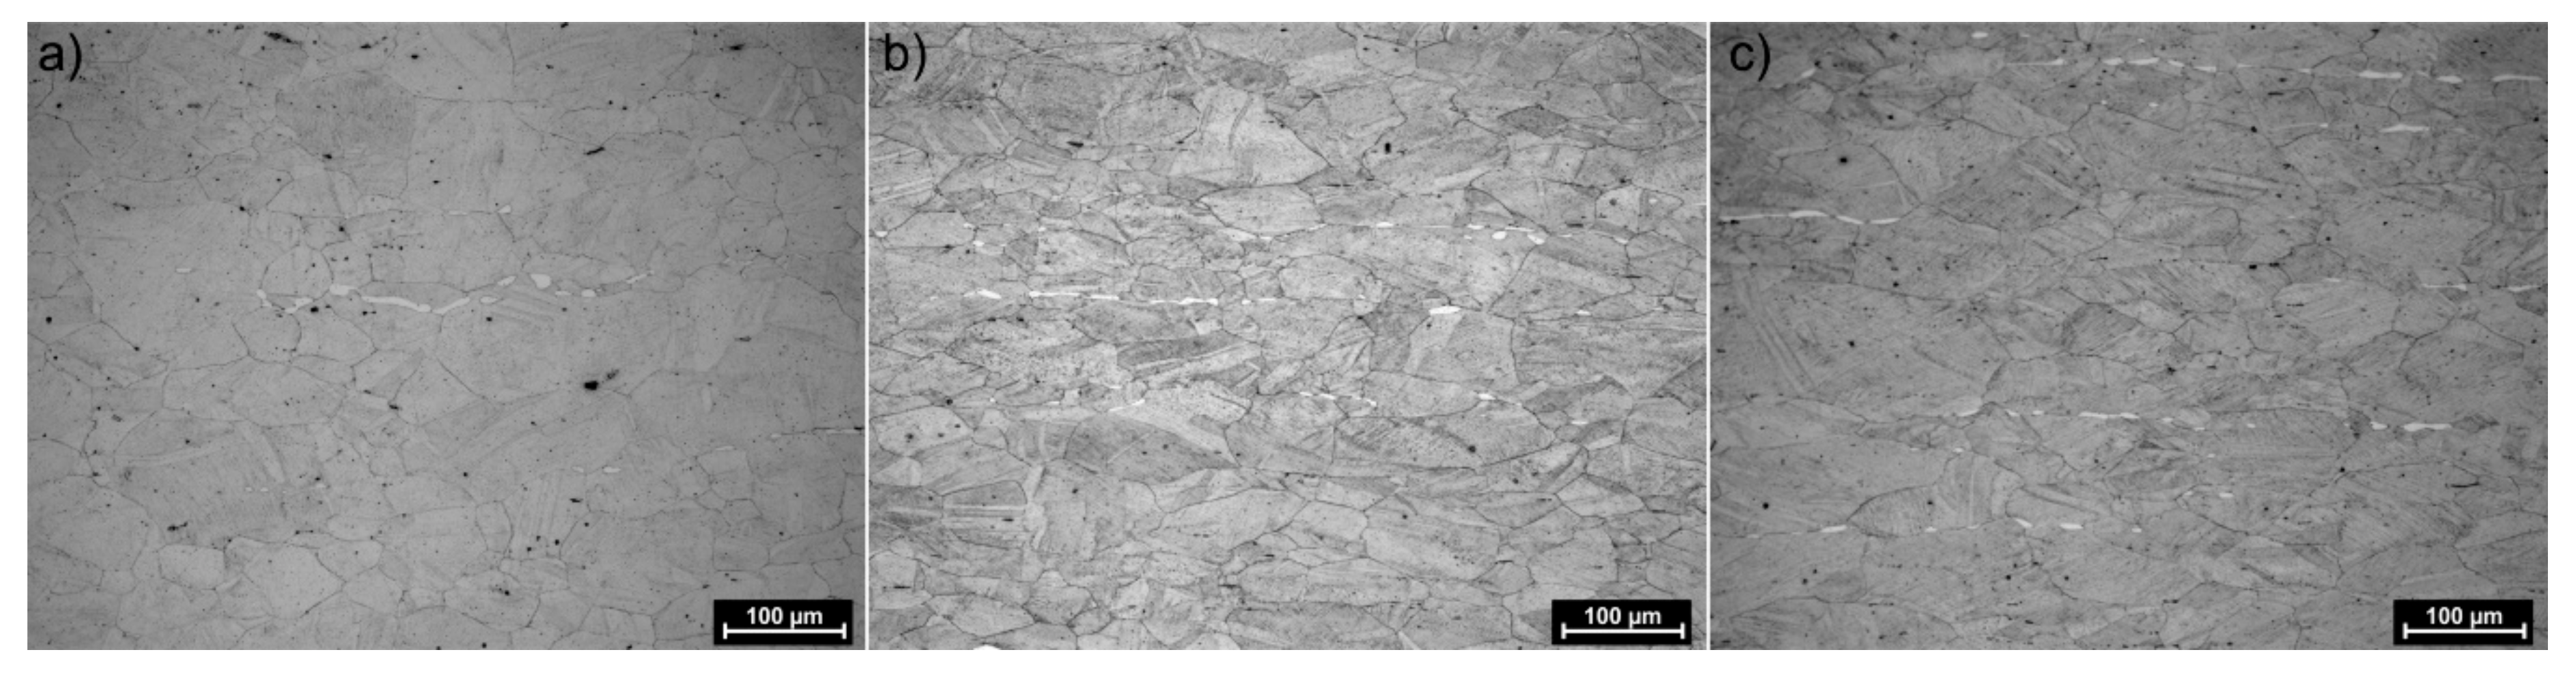
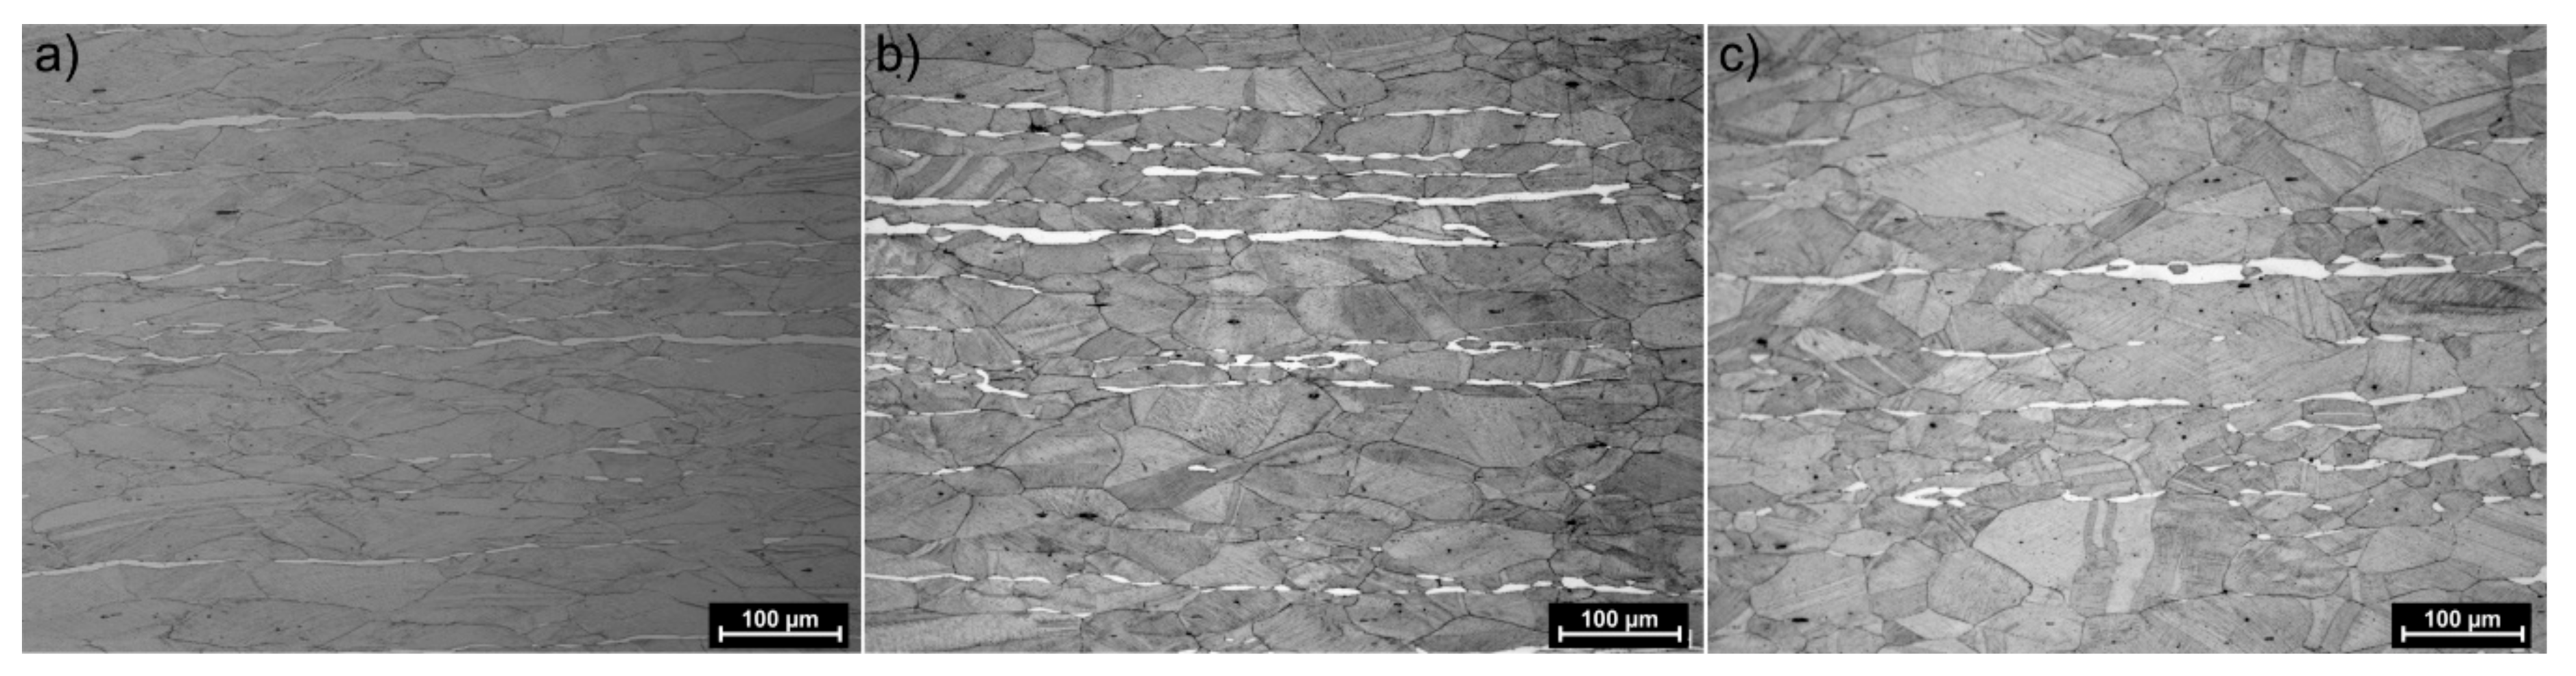
- After hot plastic deformation using the Gleeble simulator and a semi-industrial rolling line, the structure of both tested steels was similar in terms of phase composition. X98 steel, due to its Nb and Ti content, was characterized by a significantly smaller size of austenite grain and a share in the structure of, among others compound carbides, (Nb, Ti)C. However, both the tested steels differed significantly, as in the initial state after forging, with regard to the participation and arrangement of ferrite. In X98 steel, after simulated plastic deformation (Gleeble) with different cooling variants, ferrite was quite evenly distributed in its structure, with the largest areas of ferrite revealed in option 2. In X105 steel, ferrite occurred in the form of elongated areas in the direction of rolling in variants 1 and 2, and fine grains in option 3. These clear differences in the distribution and form of ferrite in the simulated deformations no longer found their analogy in the structure of the steel after rolling, where the ferrite in all cooling variants was arranged in the form of highly-elongated strands in the direction of rolling, which resulted from a low tendency to undergo recrystallization. In addition, the formation of ferrite bands parallel to the rolling direction was affected by the high concentration of aluminum in the steels tested, which was also noted by Bausch et al. [2] during their research. The ferrite bands in X105 steel were definitely wider, which was related to the grain size in the analyzed steels, while the grain in X98 steel was smaller in all machined variants;
- It was found that the process controlling deformation strengthening at all stages of the hot plastic deformation was dynamic recrystallization, together with static recrystallization in the intervals between subsequent stages, especially between the last stages. Cooling of the analyzed steels after thermomechanical treatment in air promoted metadynamic recrystallization and an increase in the average grain size. The applied isothermal annealing after plastic formation caused fragmentation of the structure, because the main processes removing the effects of deformation strengthening were metadynamic and static recrystallization;
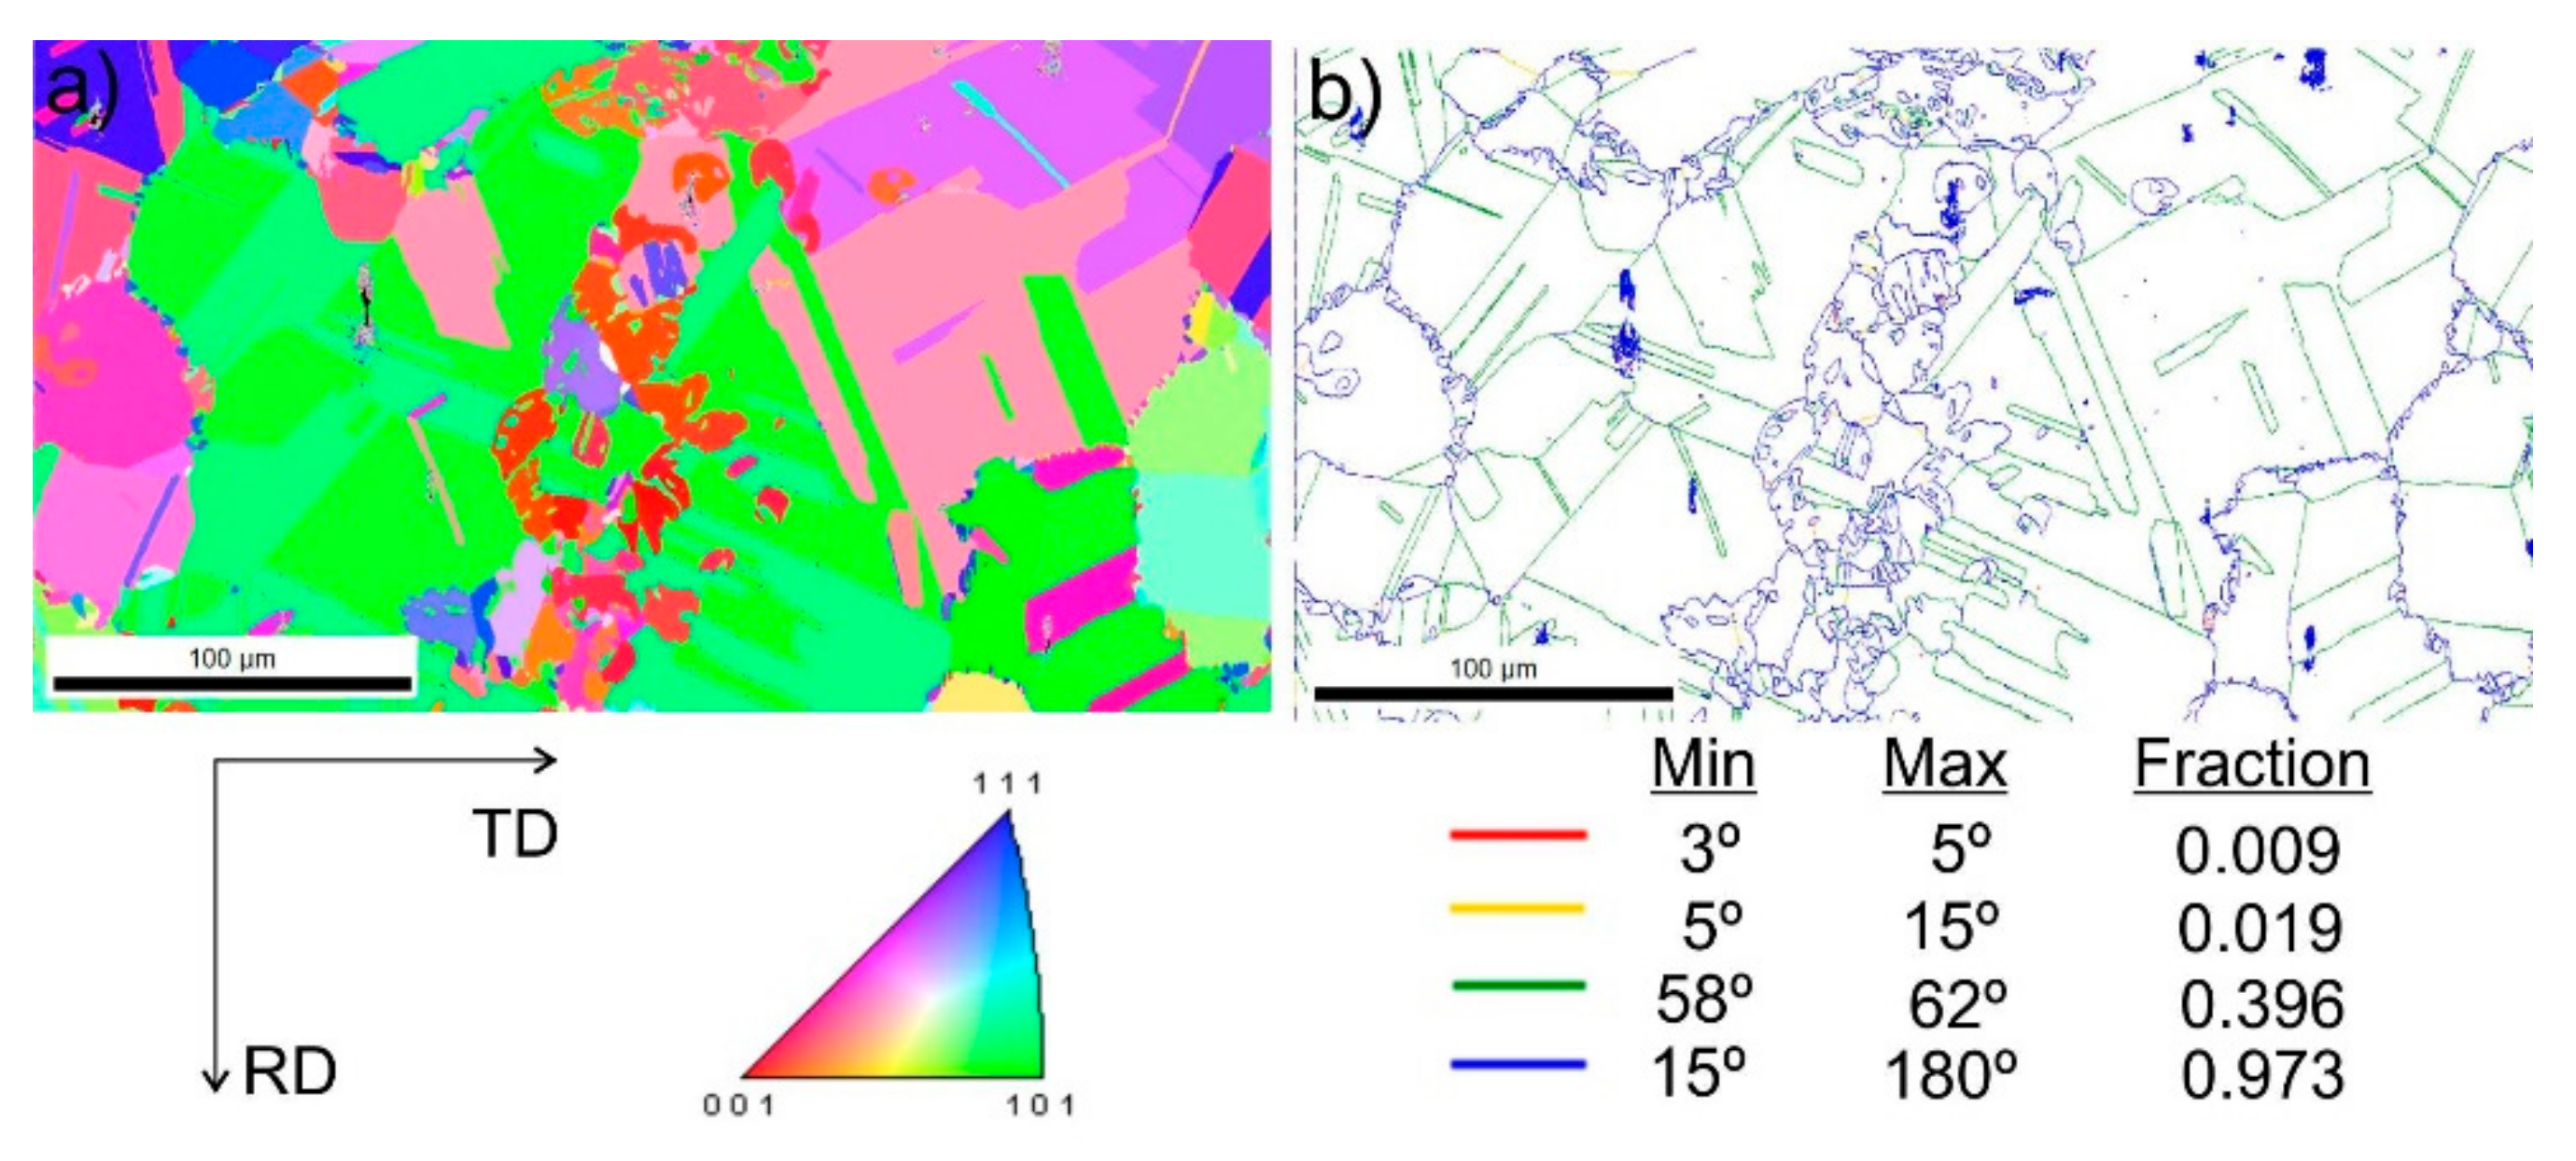
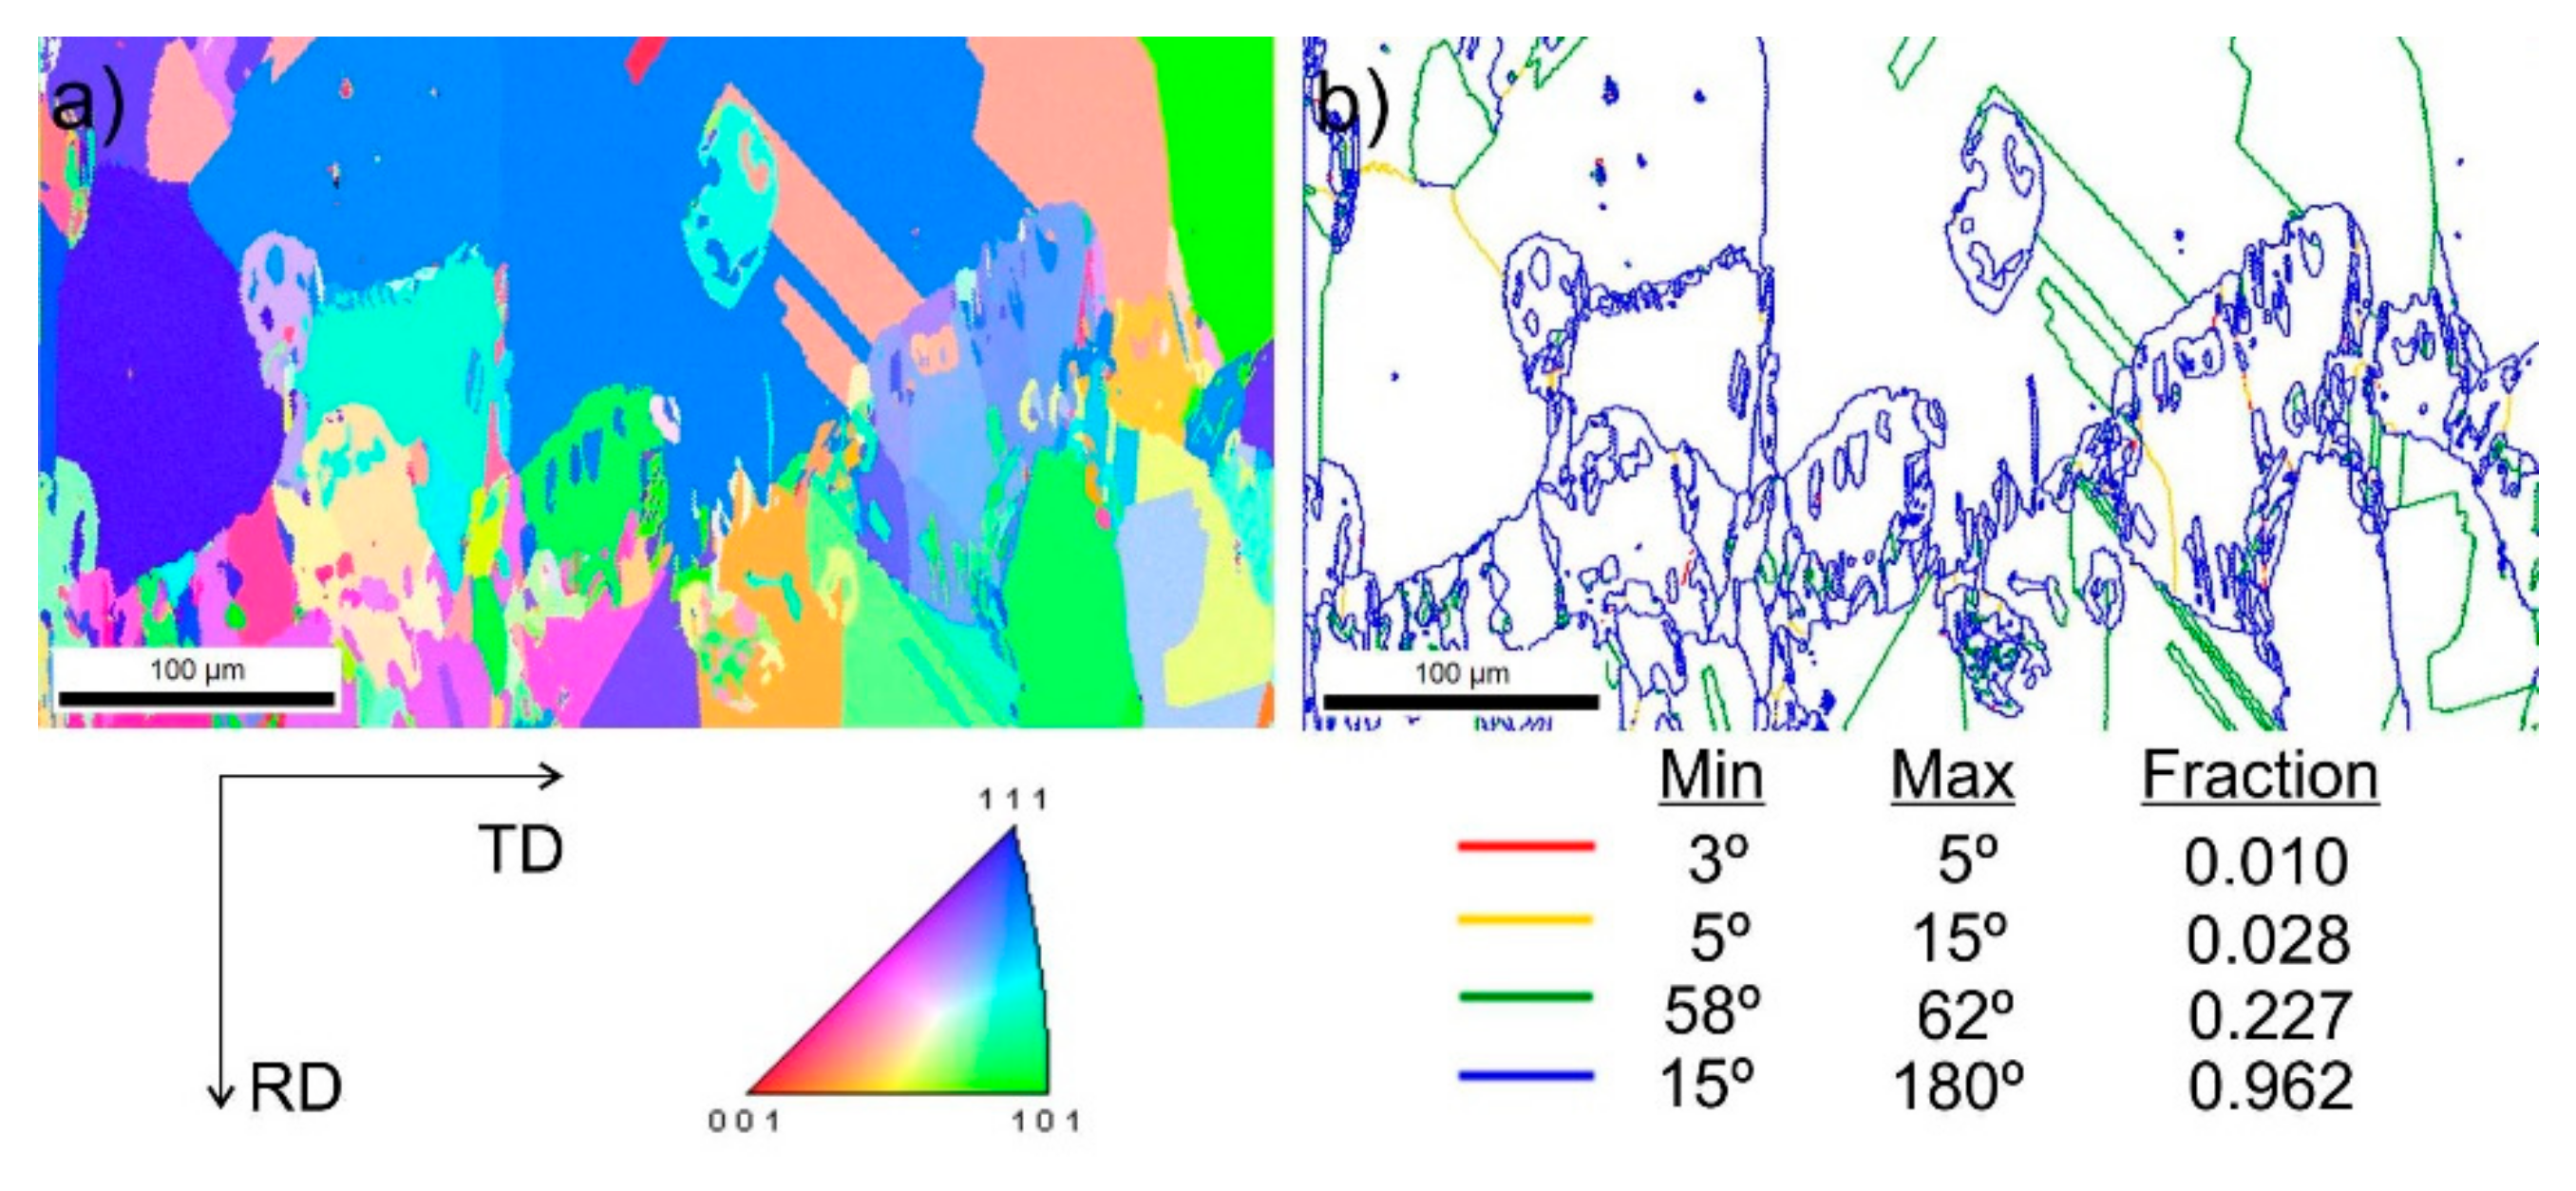
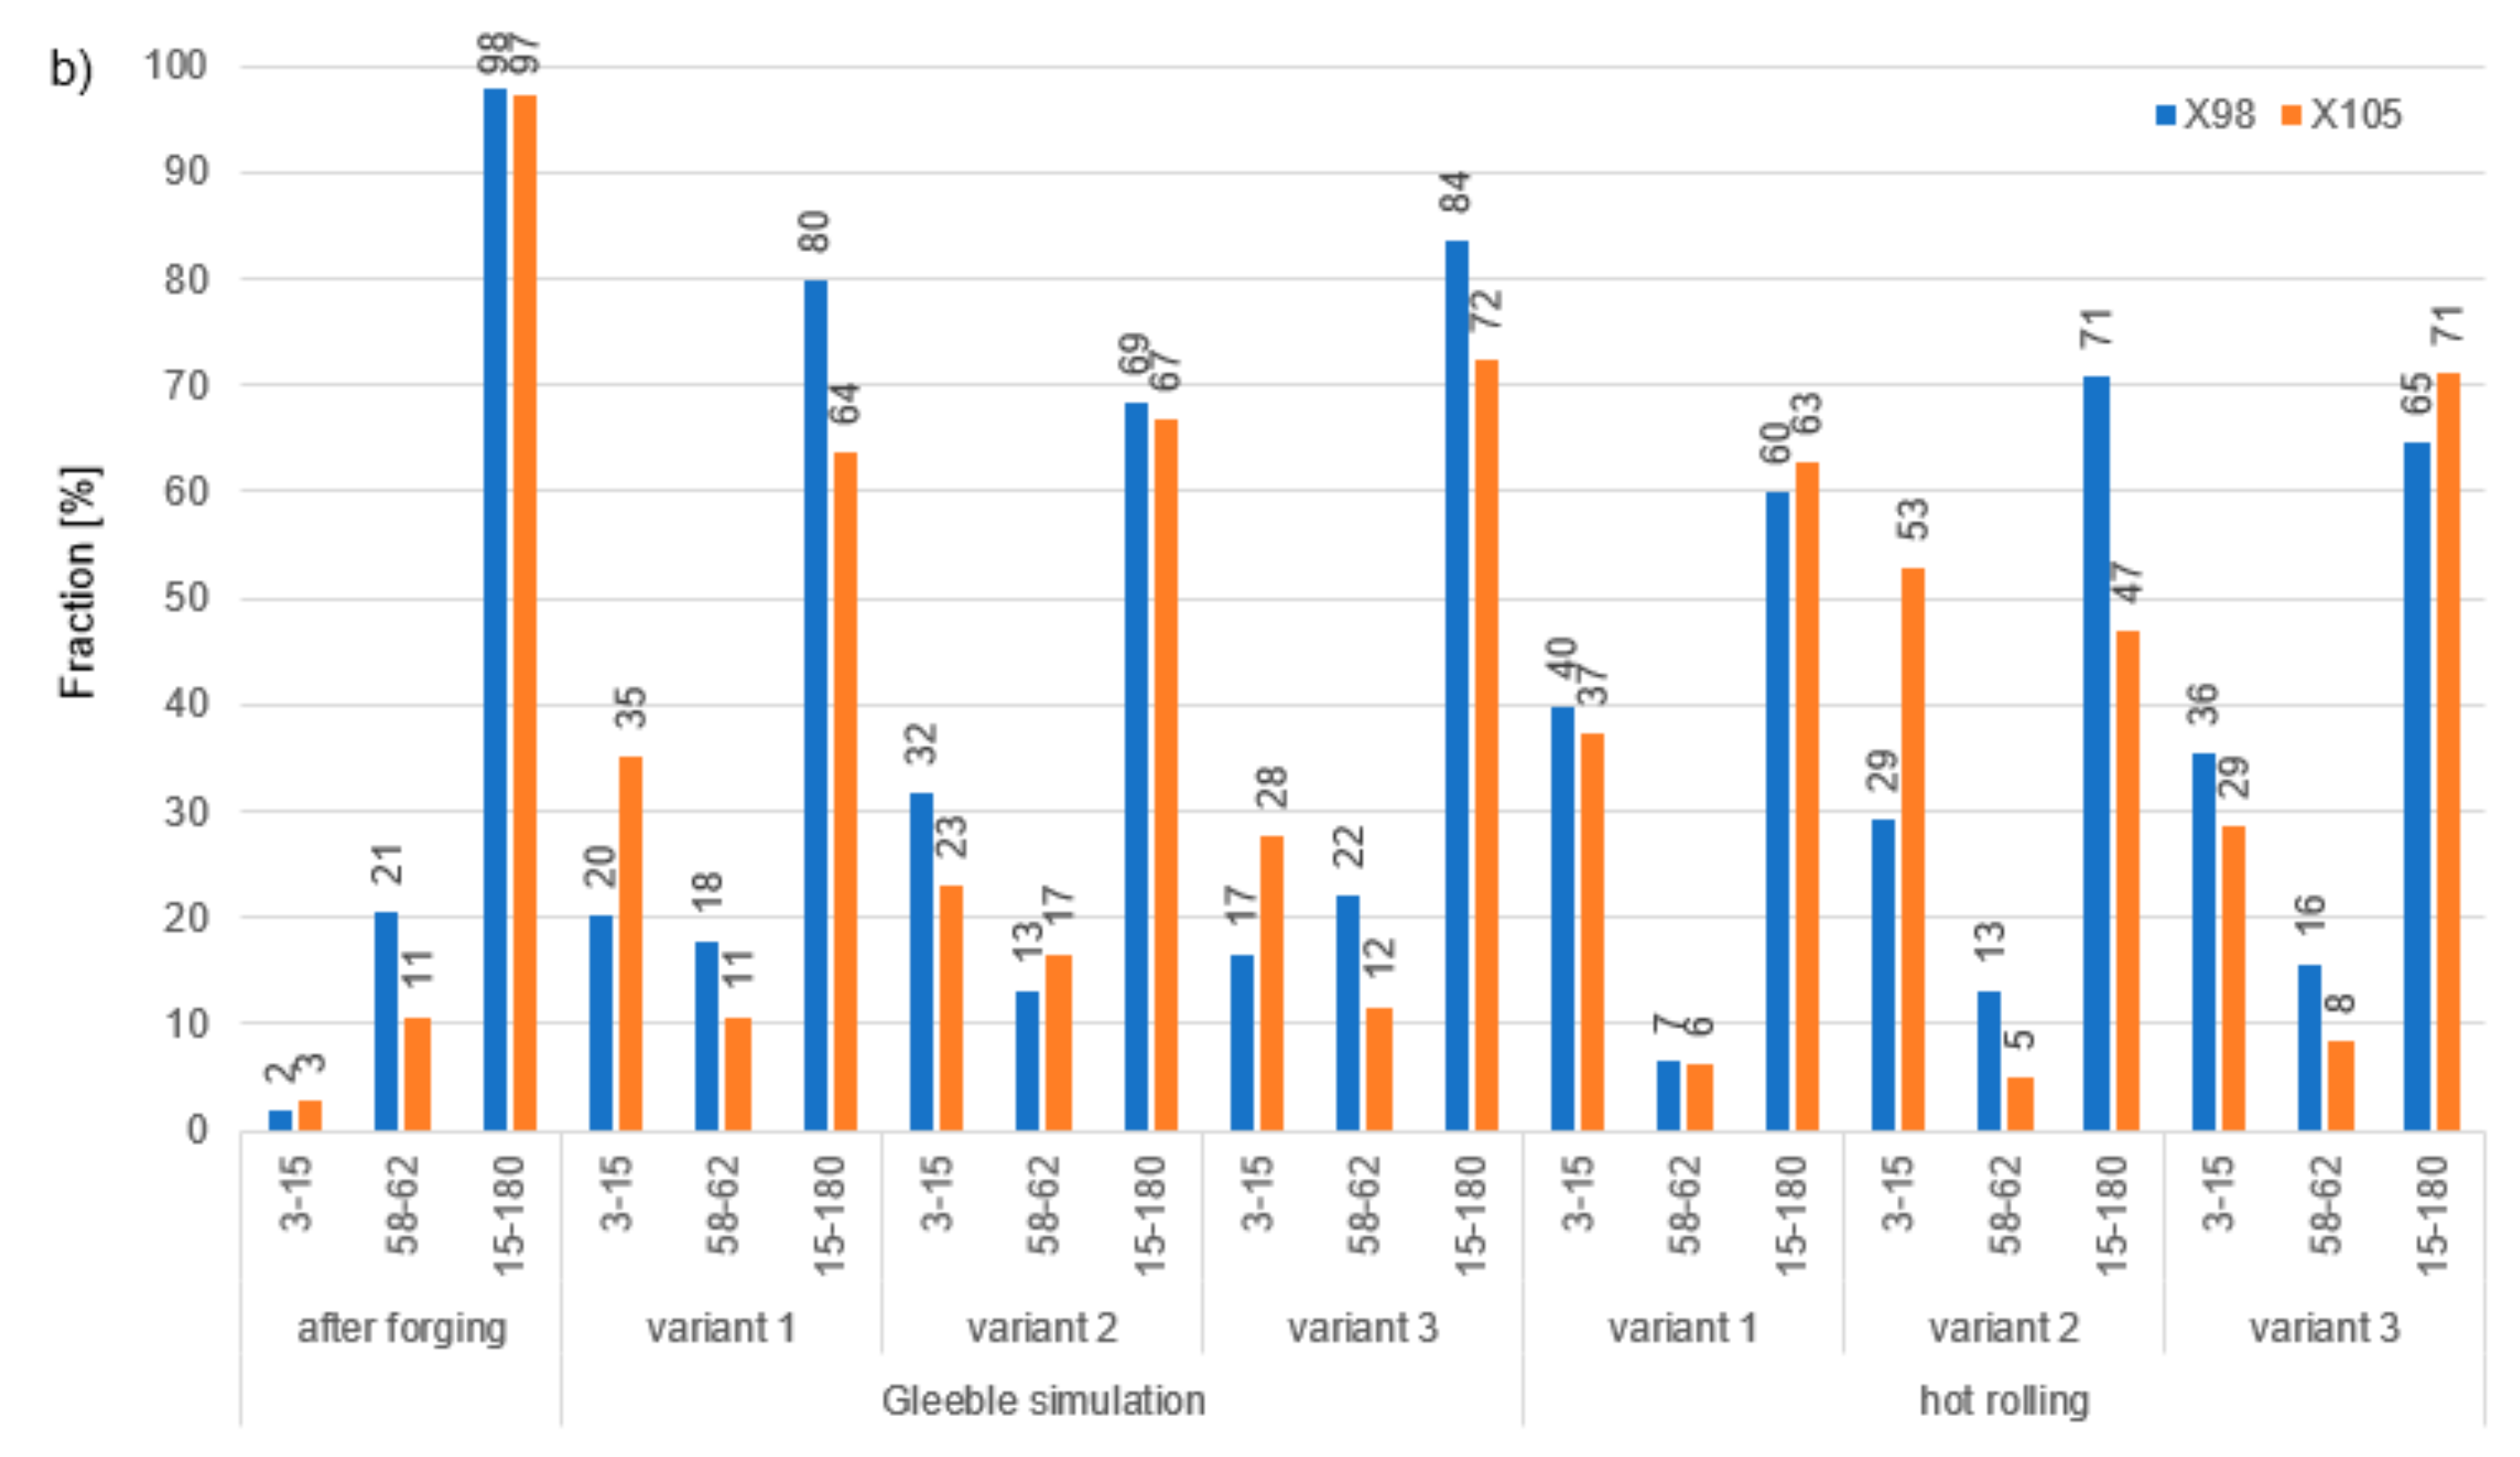
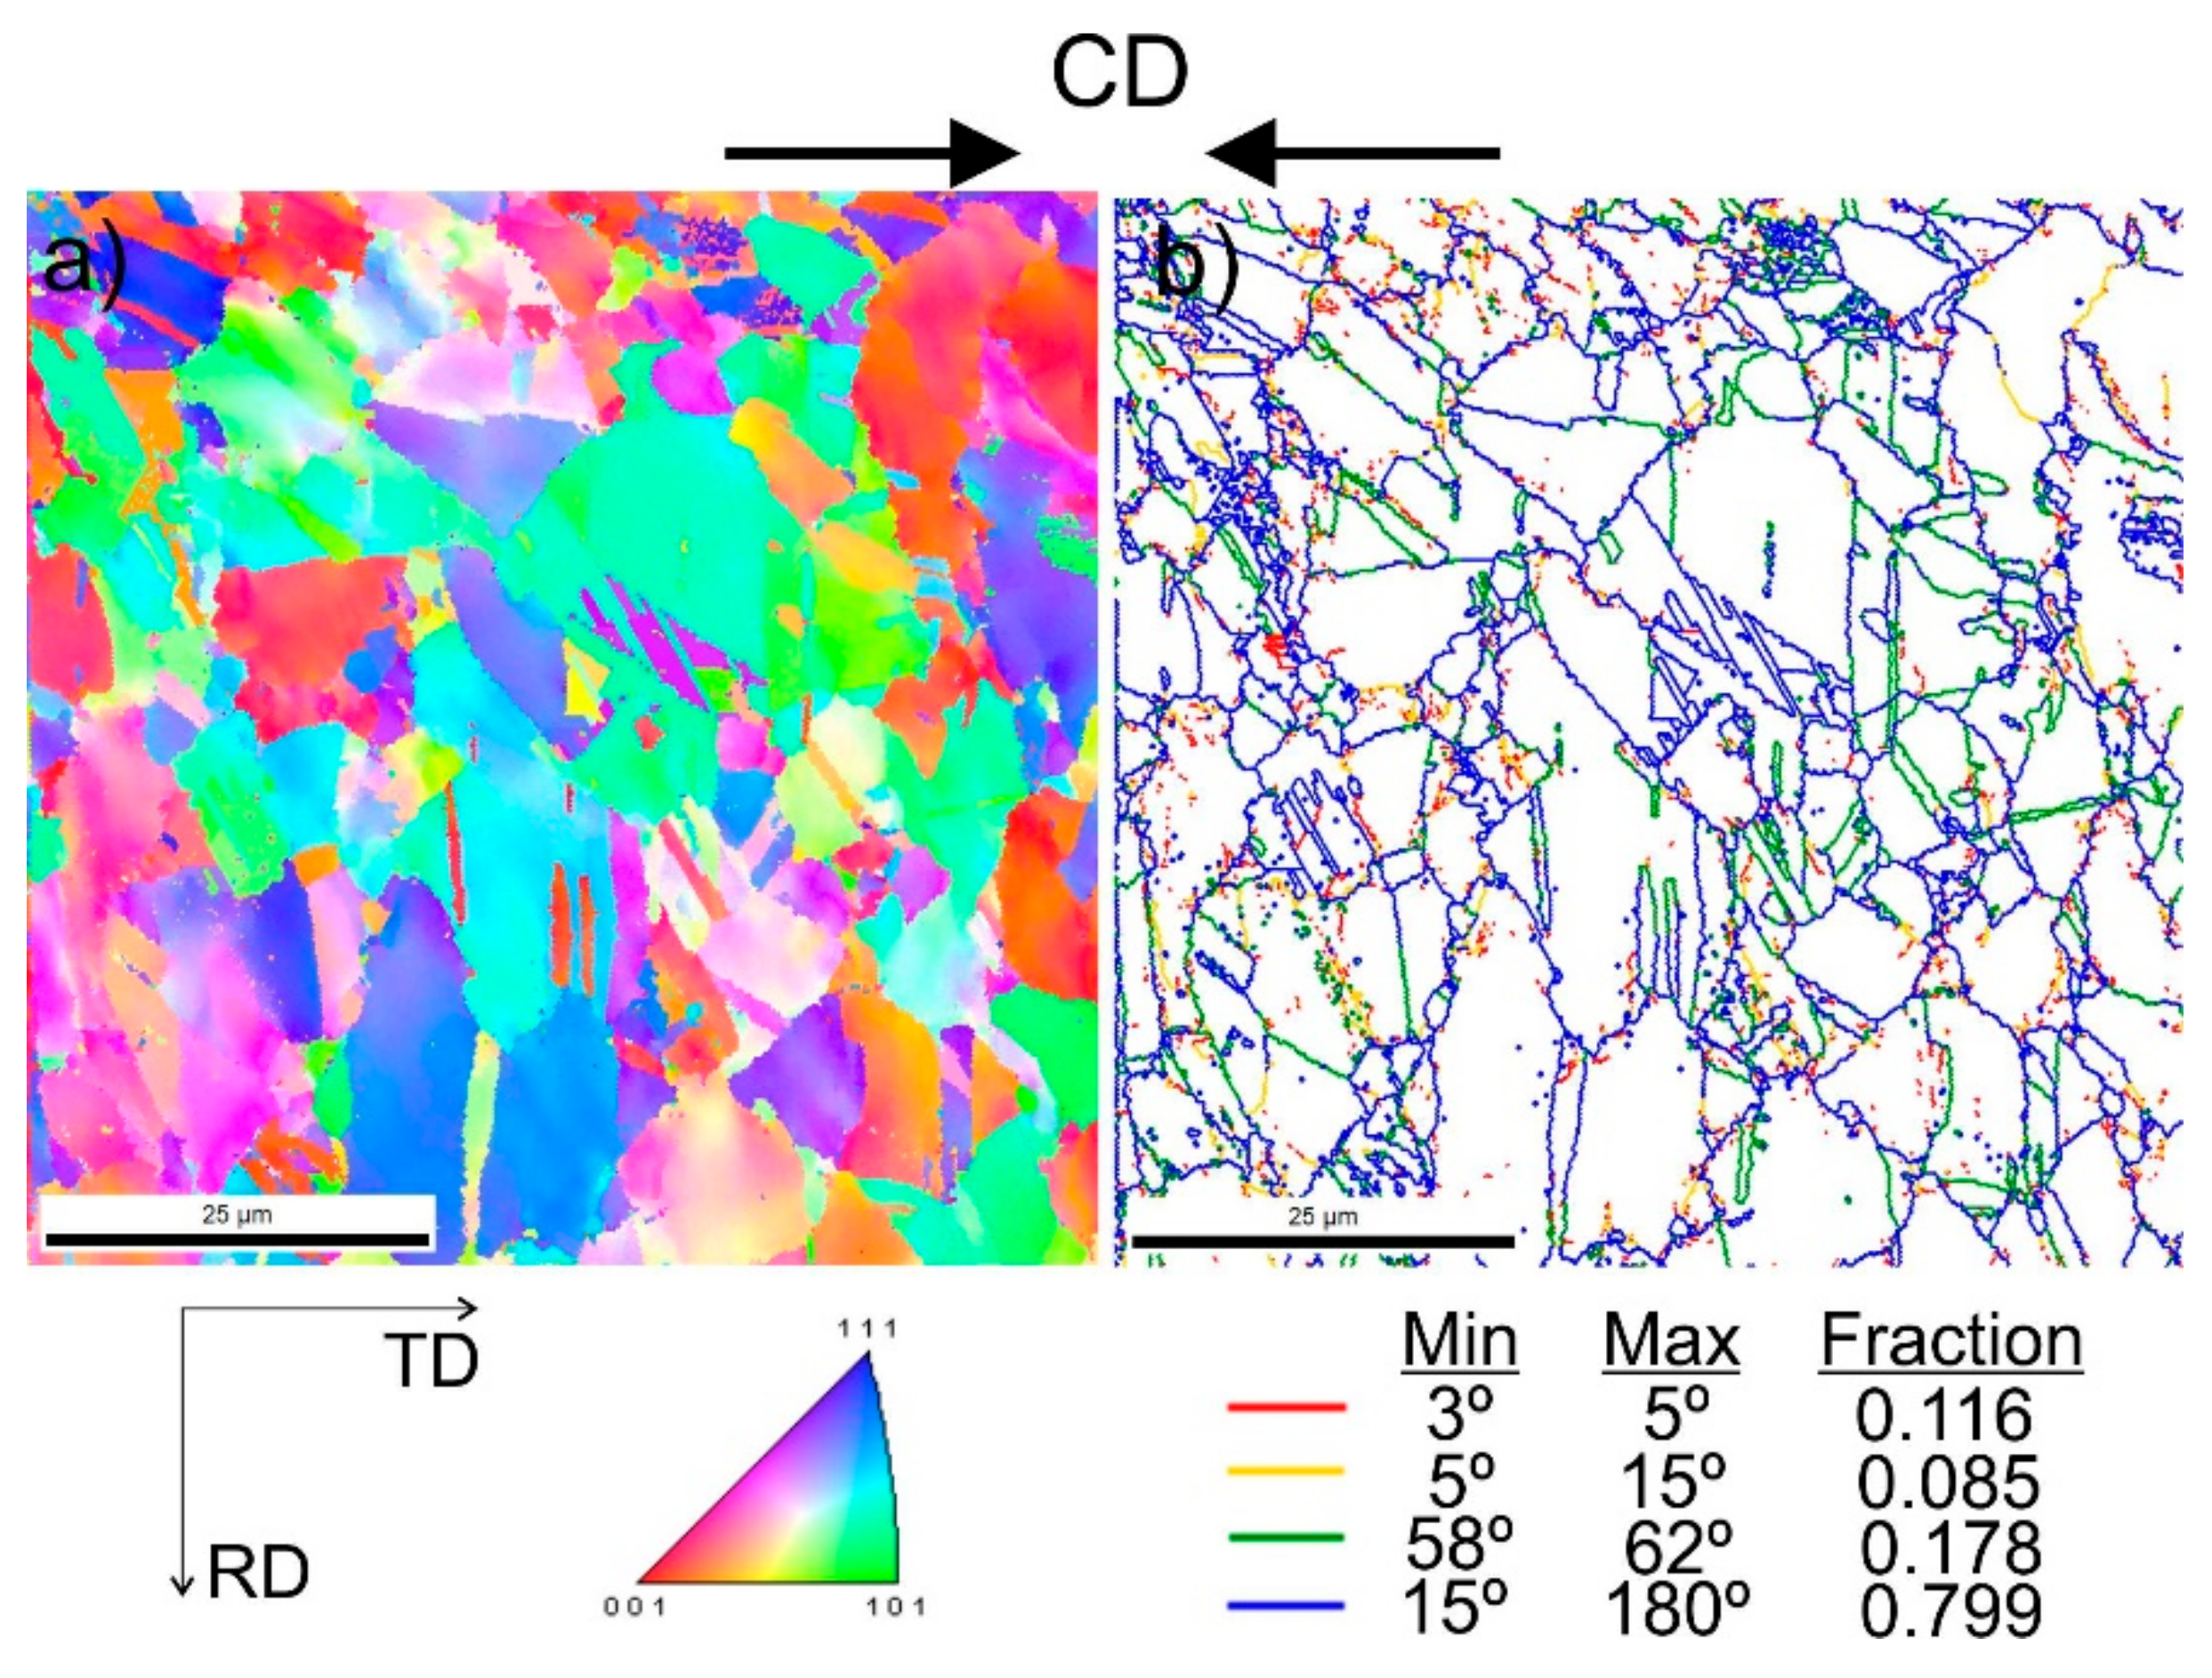
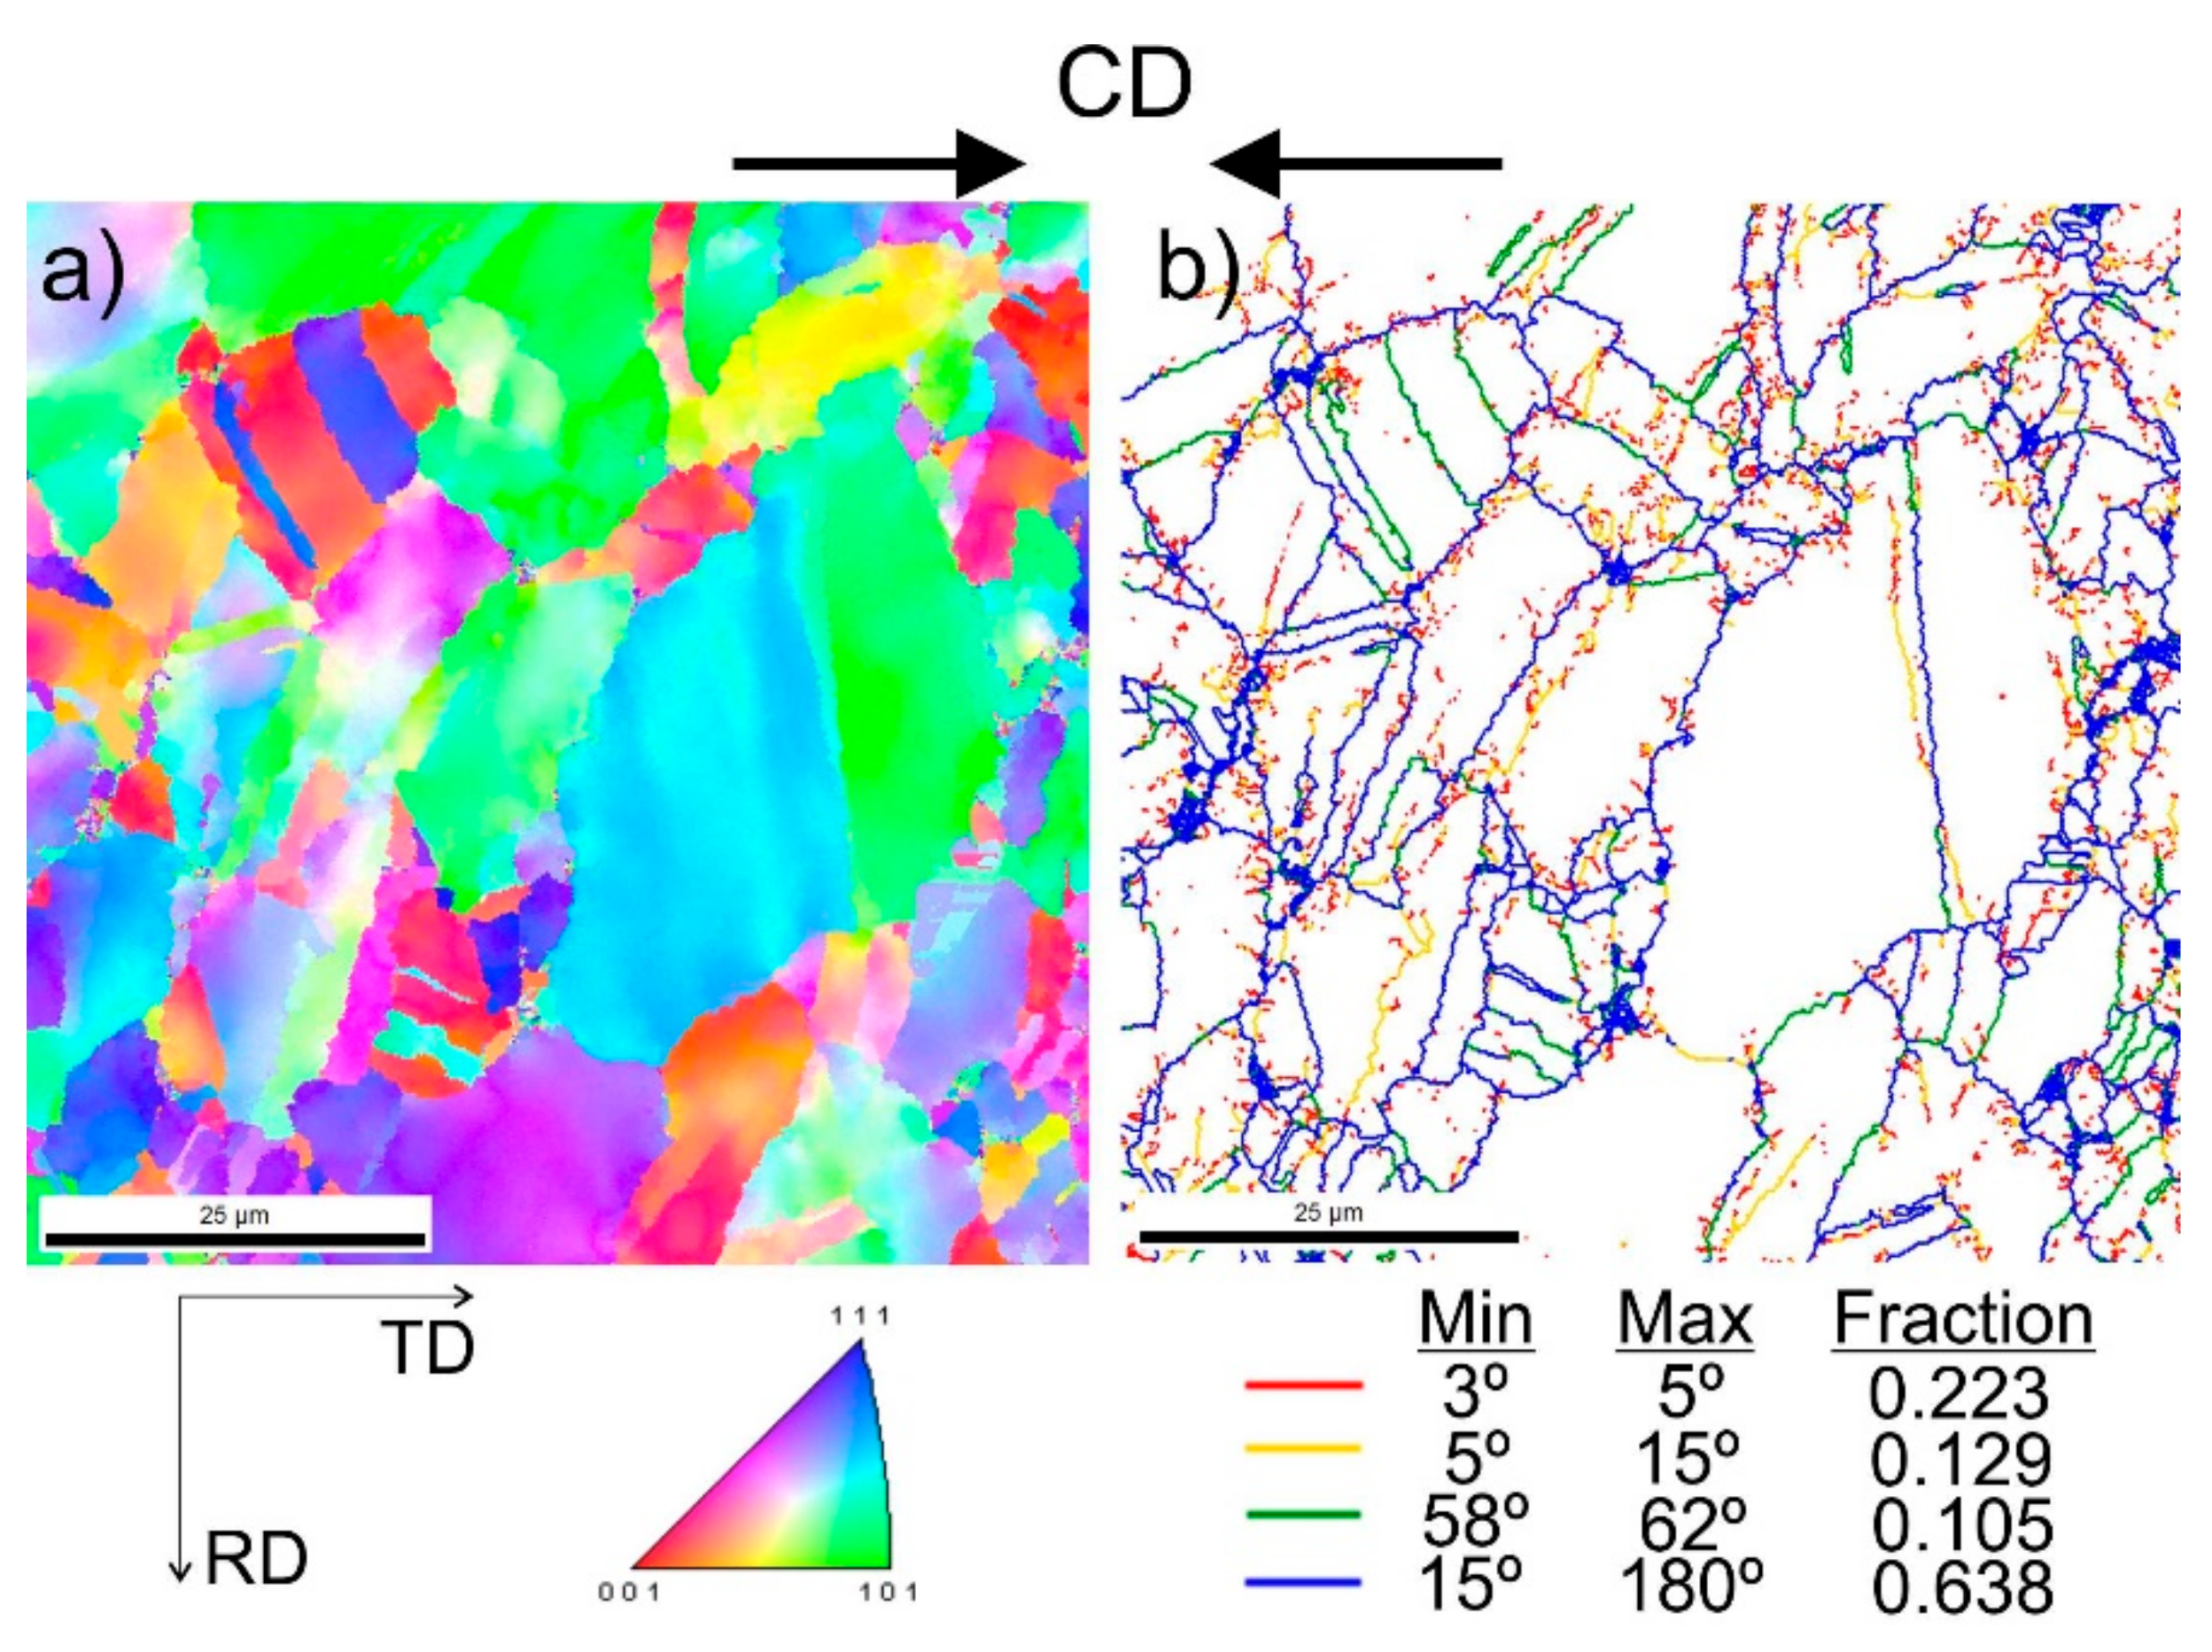
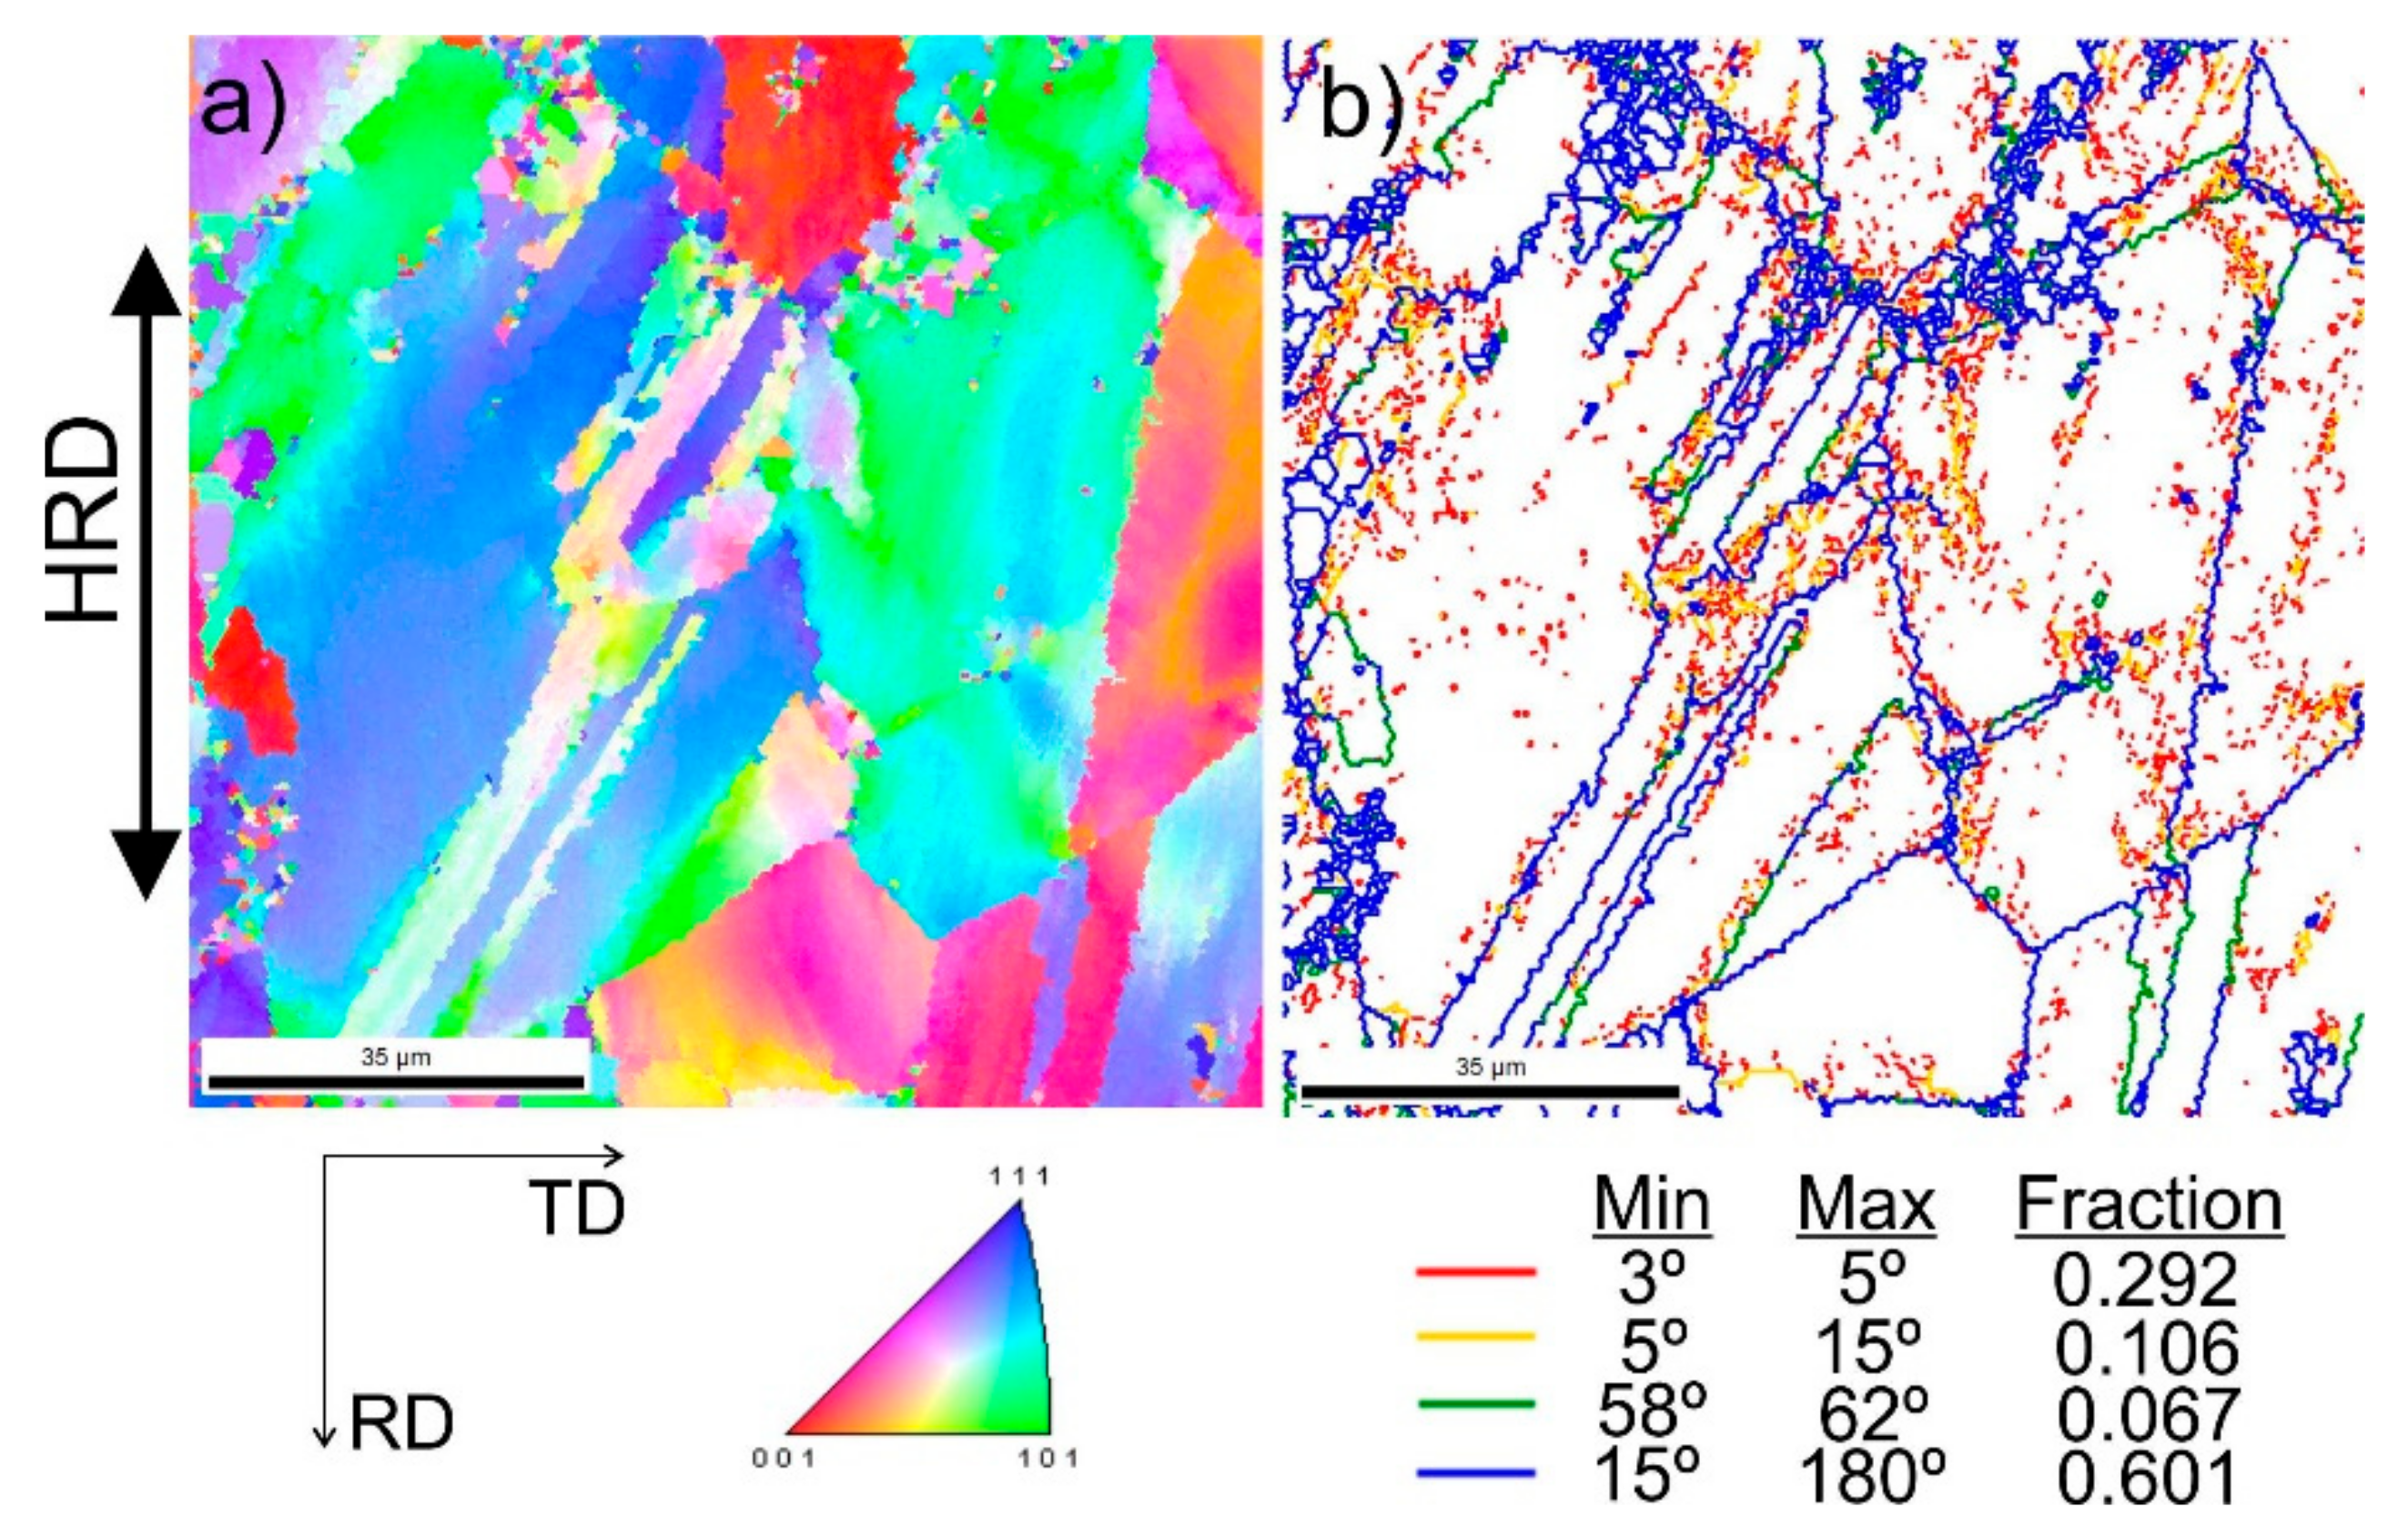
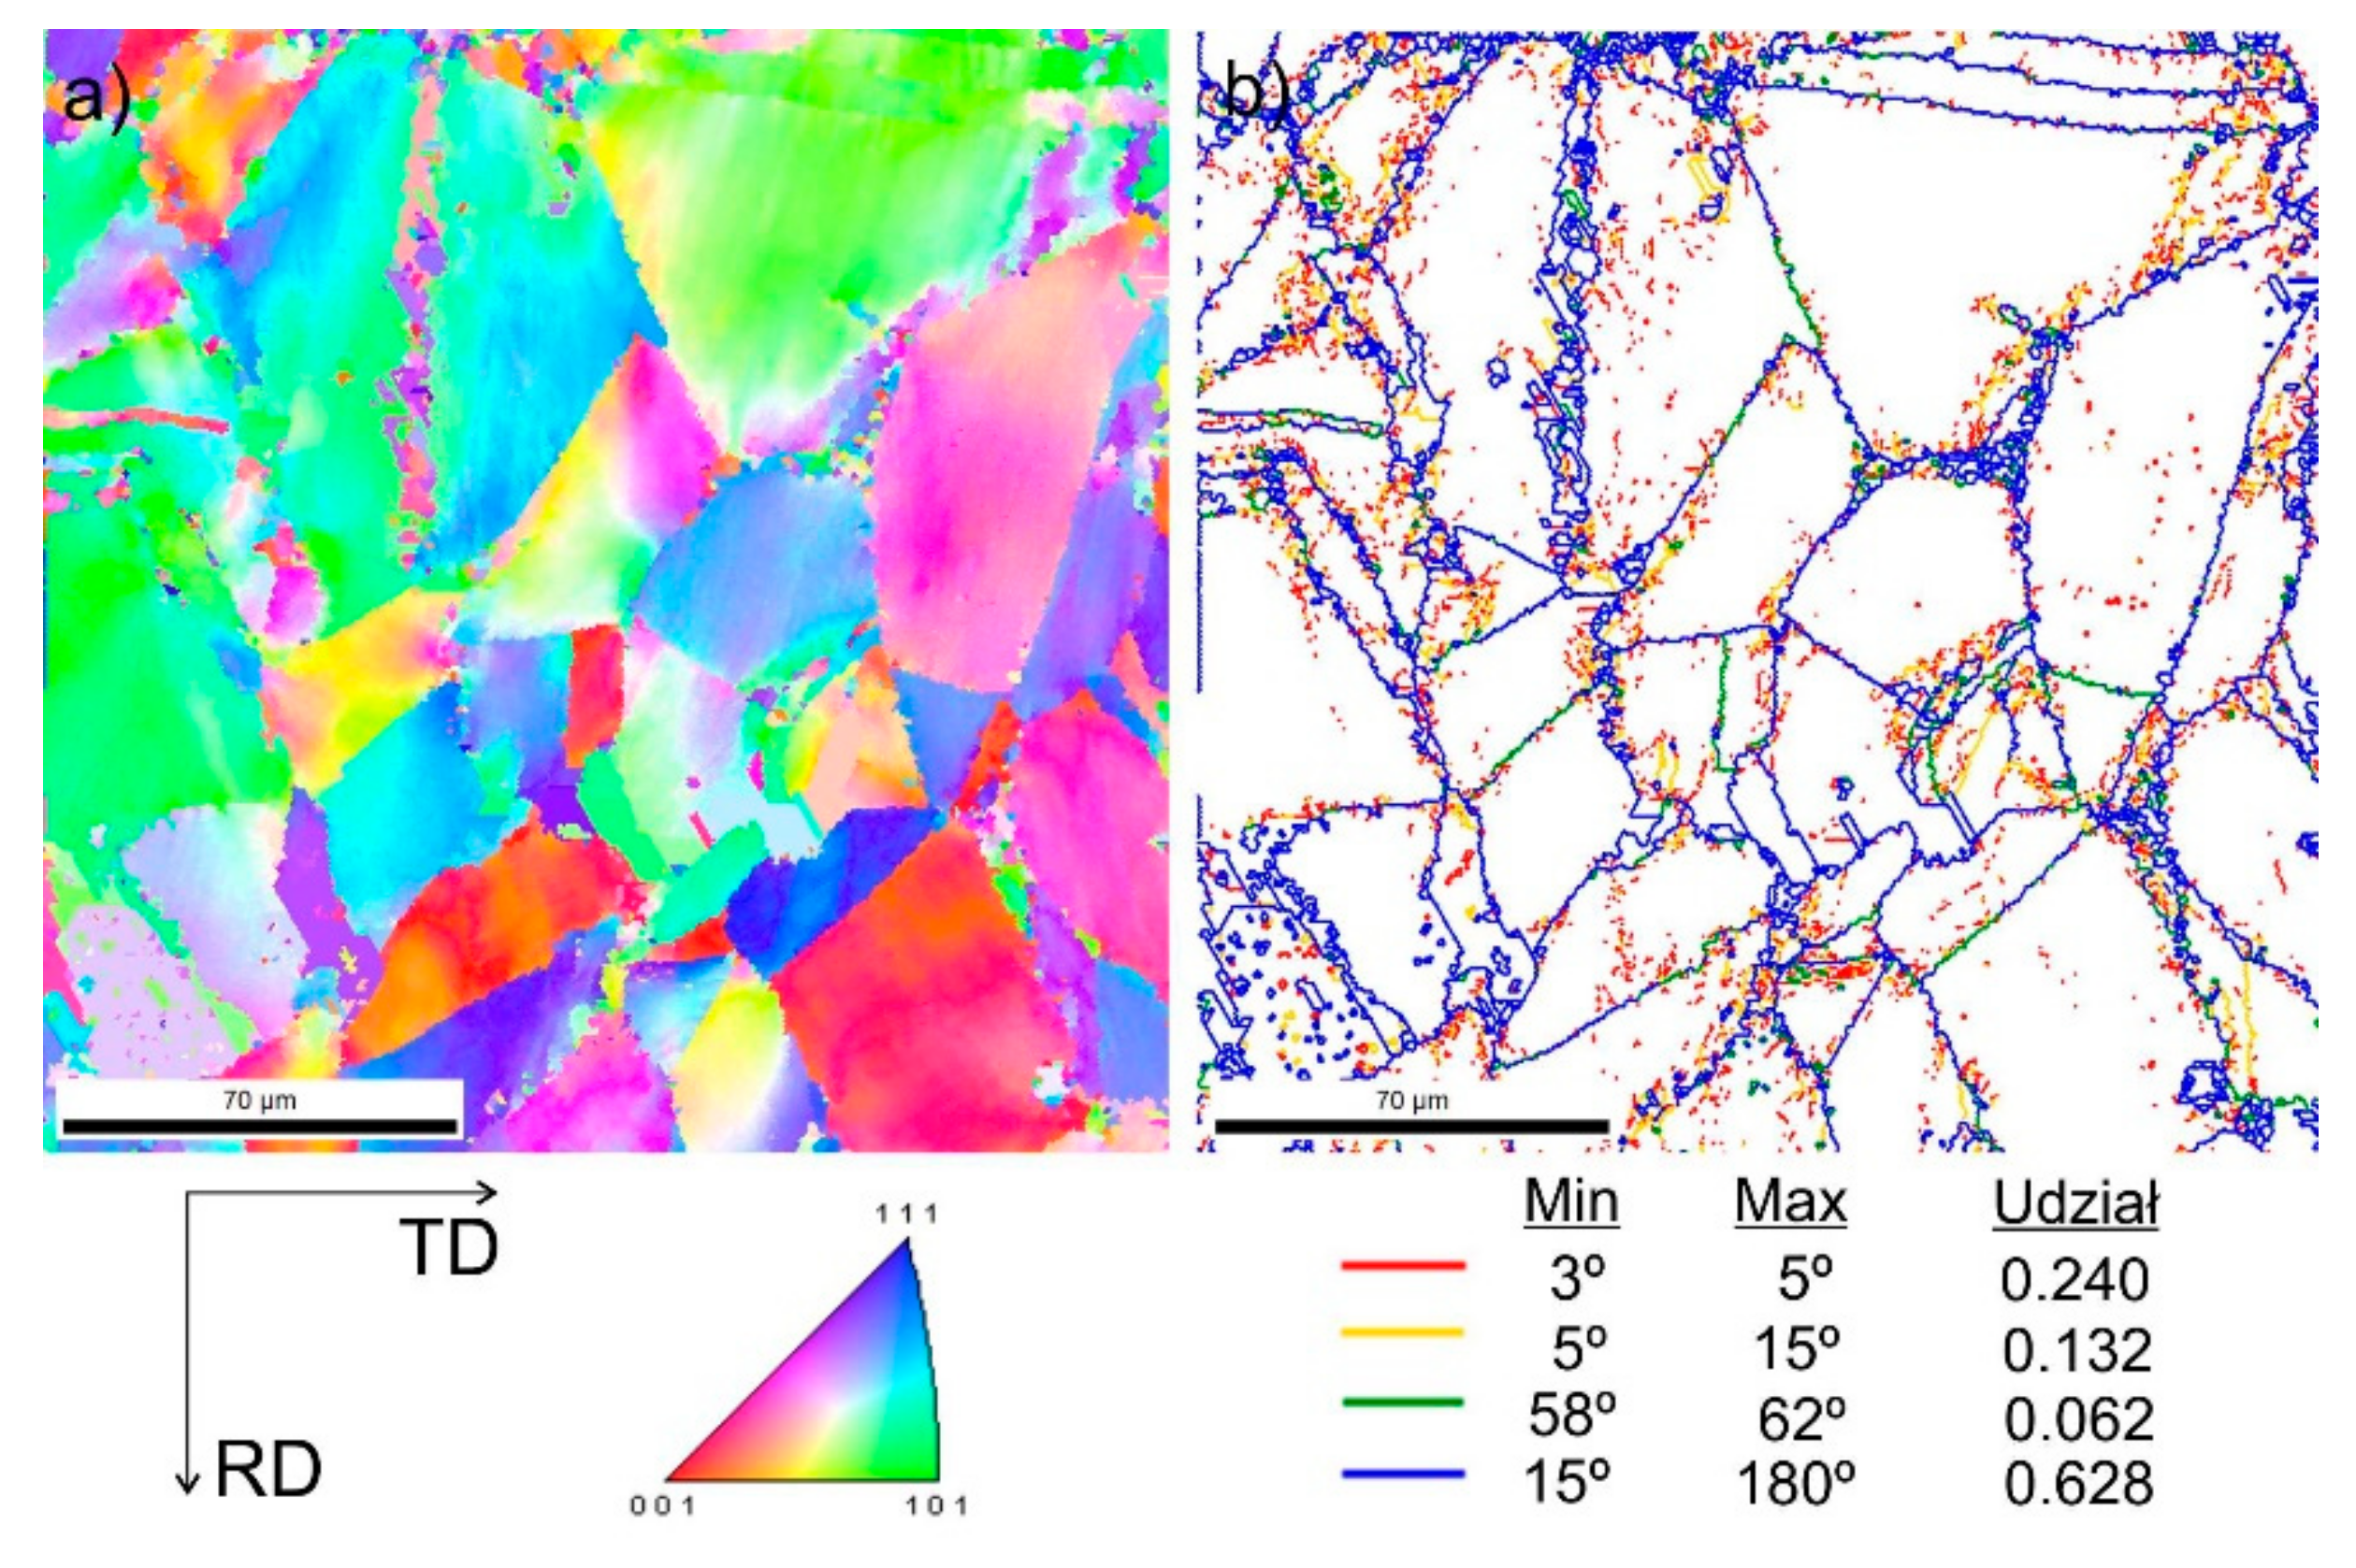
- On the basis of EBSD tests in each of the presented states (after forging, after hot compression, and after hot-rolling), it was found that the studied steels were dominated by wide-angle boundaries (misorientation angle Ѳ ≥ 15°), with the exception of X105 steel from the second cooling variant after rolling. Deformation twins with a misorientation angle of 58°–62° were also disclosed, while for most variants with X98 steel their share was definitely greater. The share of low-angle boundaries of about 20%–30% (misorientation angle Ѳ < 15°) in both the tested steels may indicate that the recrystallization process was not completed with the adopted thermomechanical treatment plan;
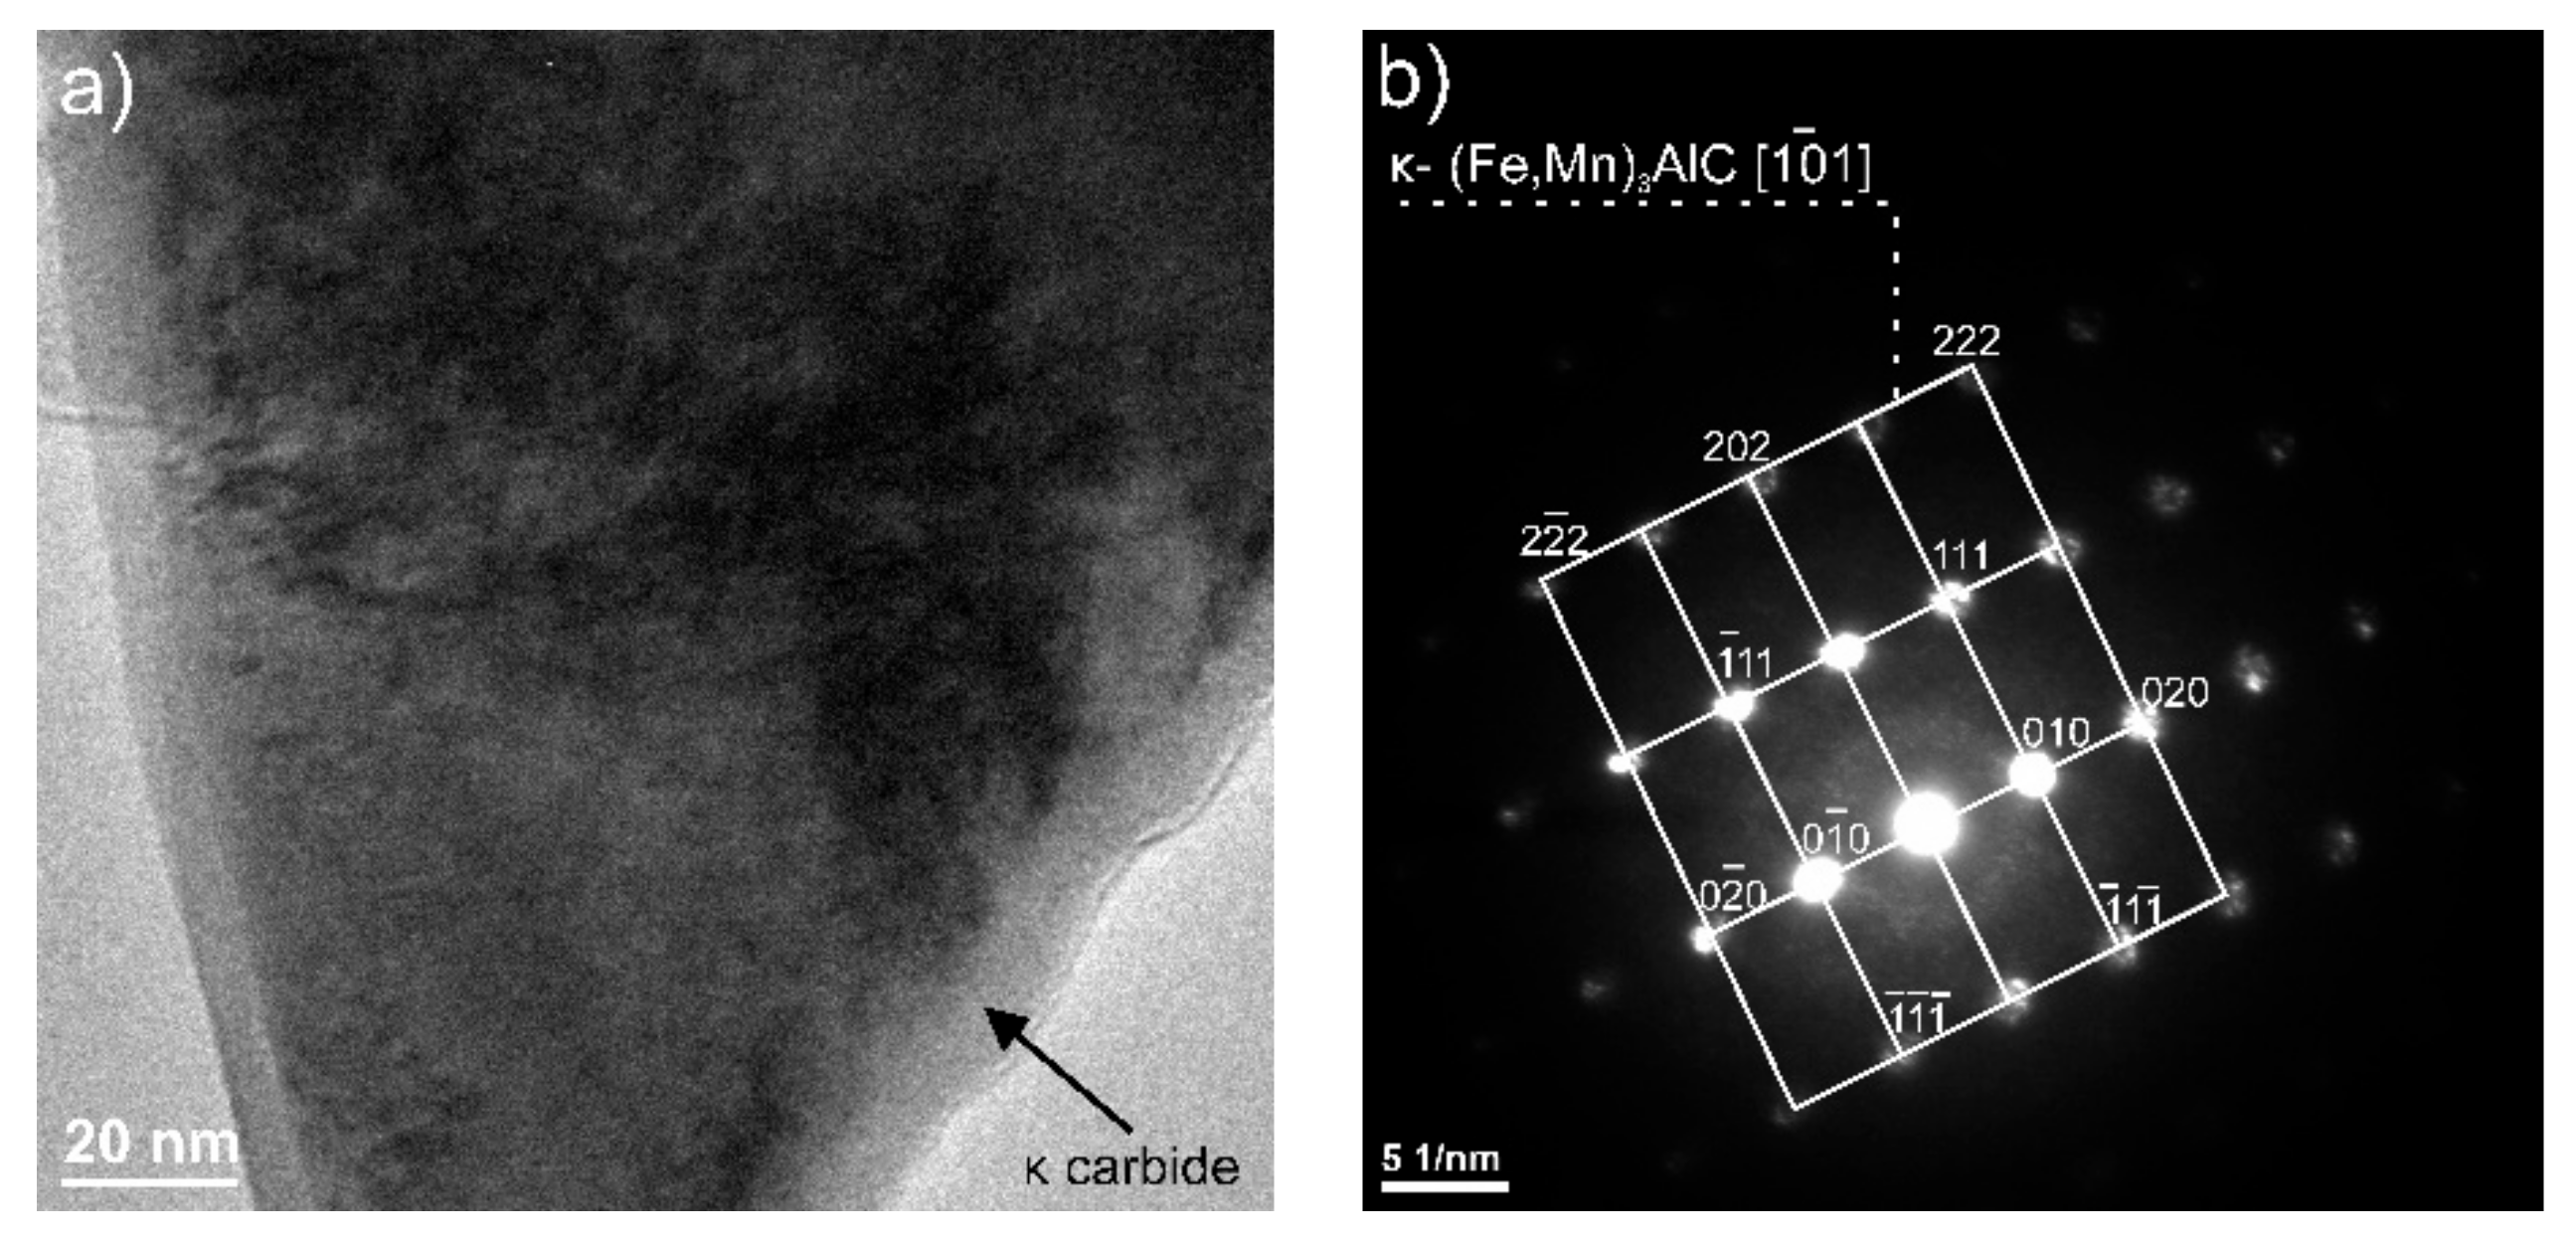
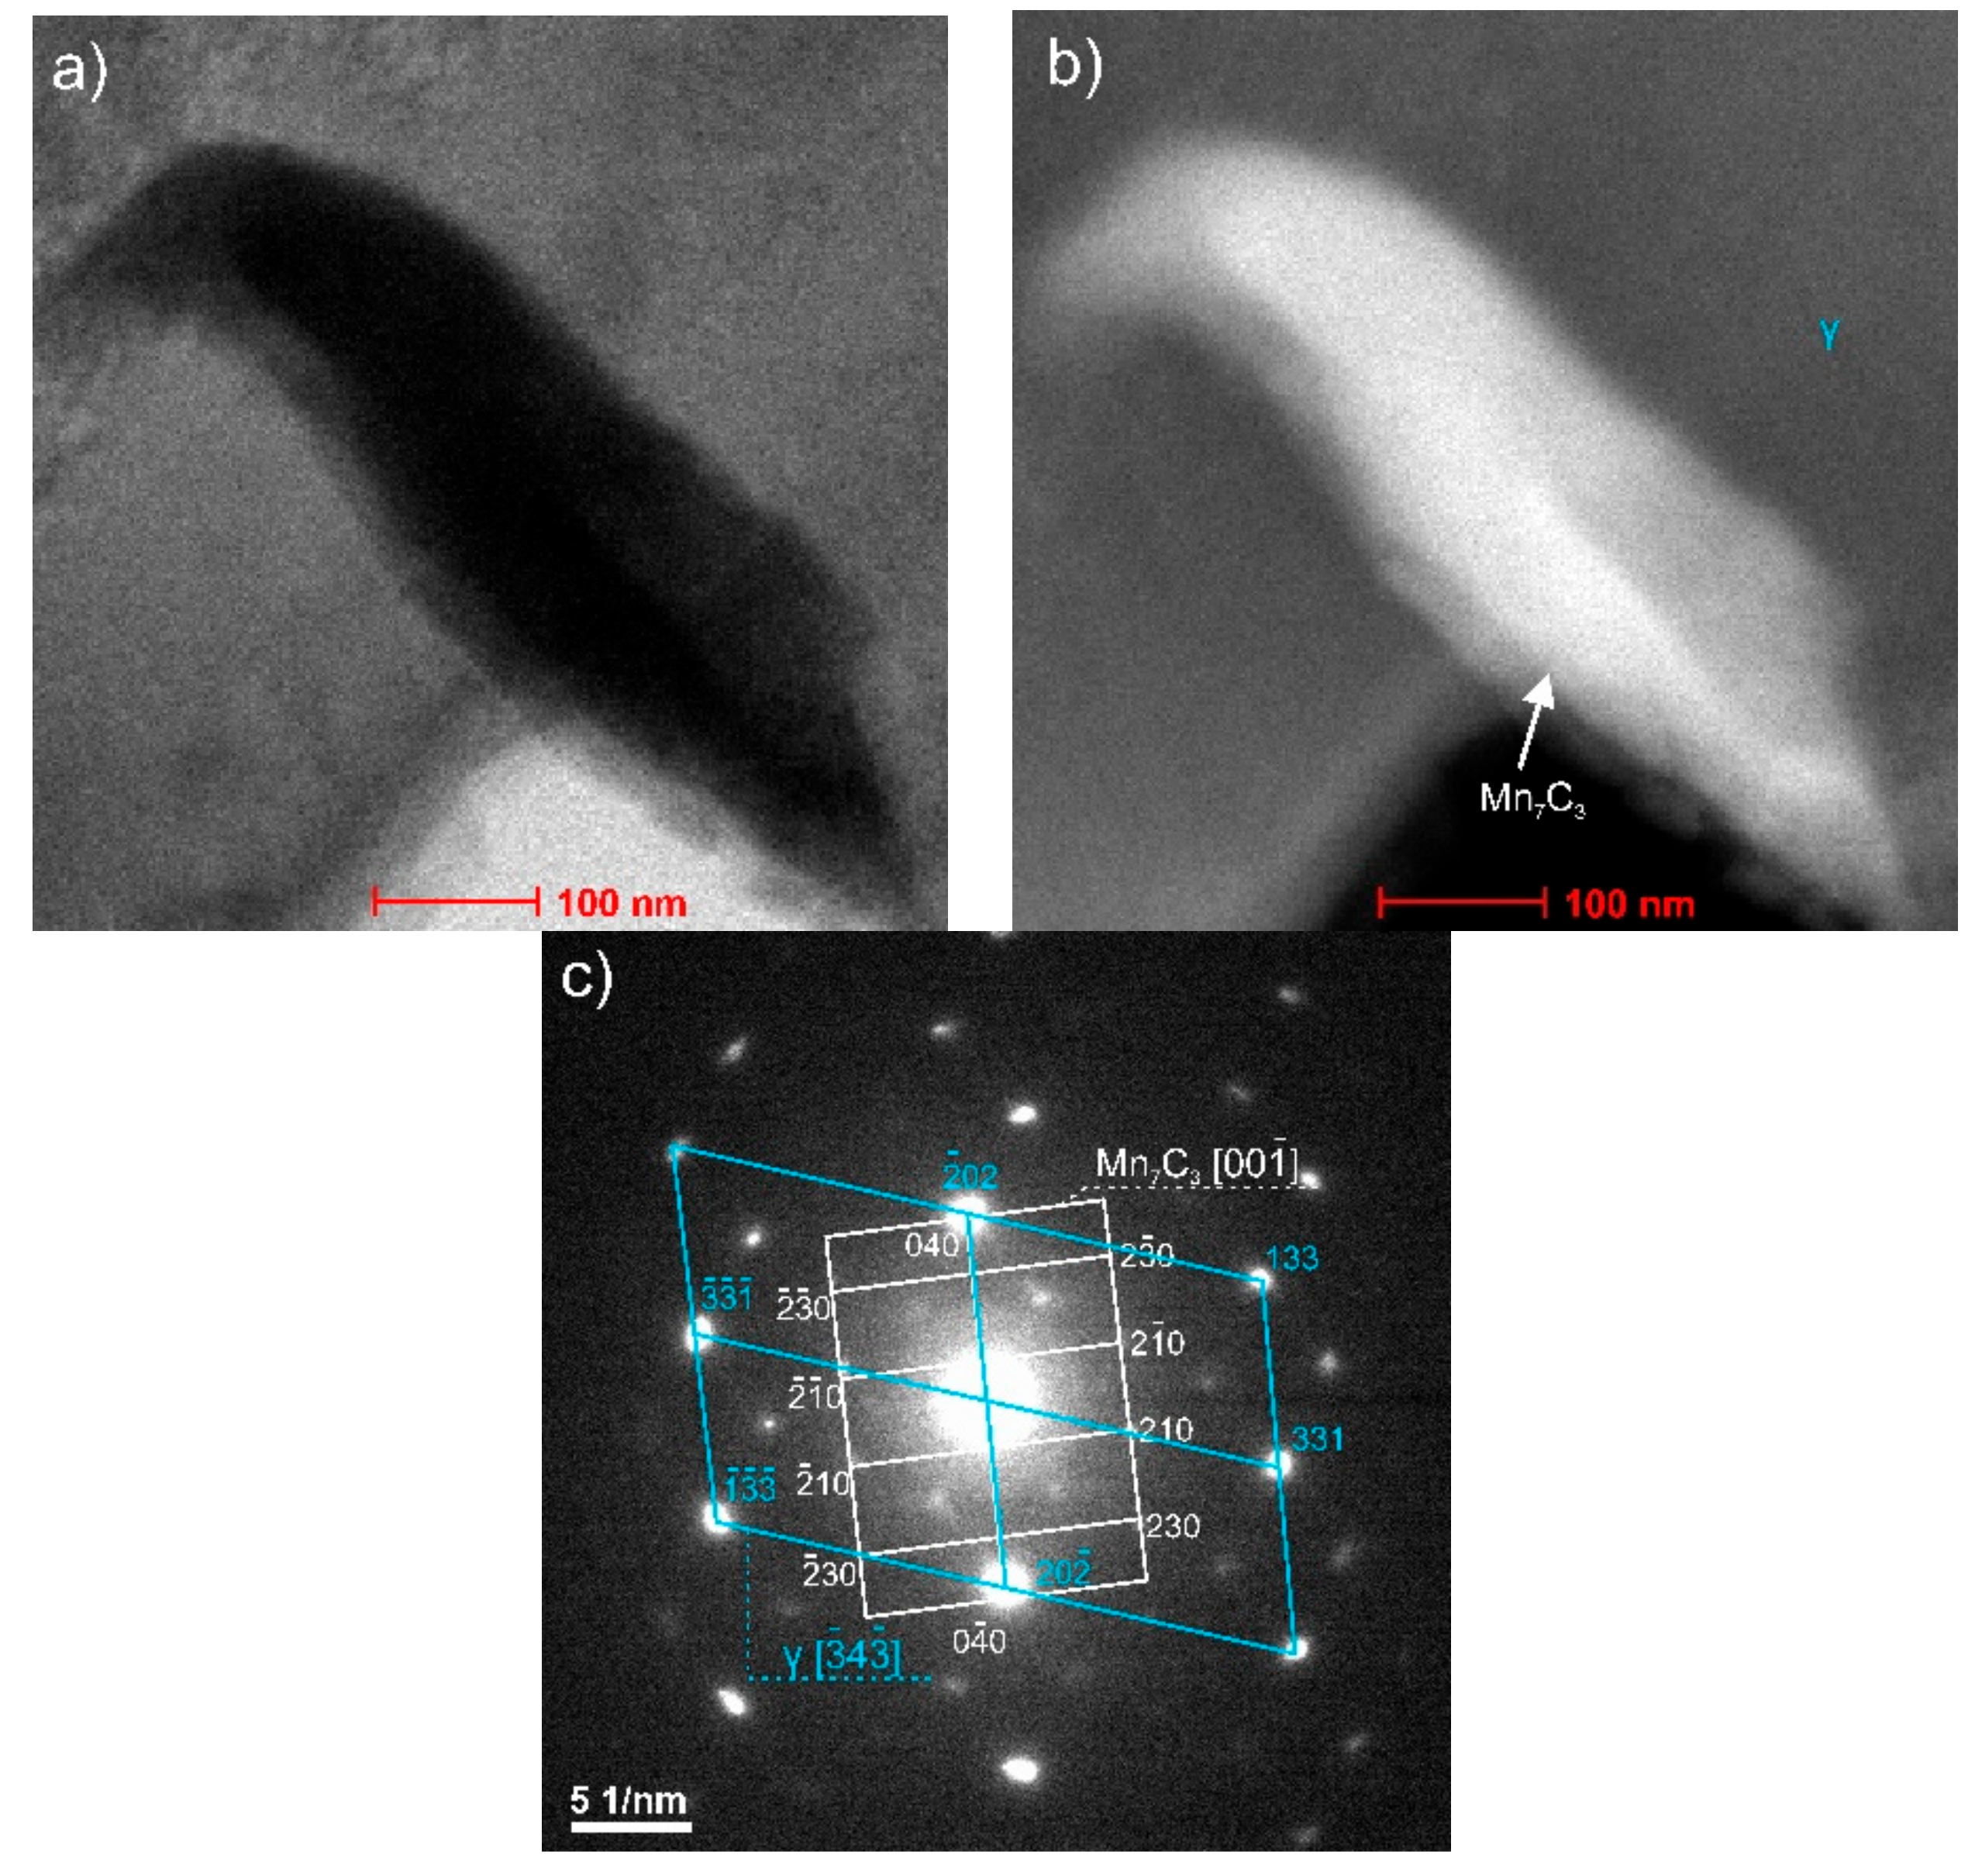
- Research on the structure of the X98 and X105 steels using a transmission electron microscope allowed the identification of M7C3-type carbides and nanometric κ-(Fe, Mn)3AlC carbides located inside the austenite and ferrite grains, as well as at the grain boundaries. Only in variant 2, cooling after heat treatment, were the carbides in question definitely larger and located mainly on grain boundaries, which may significantly reduce the mechanical properties of the steels tested after this type of treatment. M7C3-type carbides with orthorhombic crystal lattices were revealed in both the steels examined in the austenite and ferrite grains;
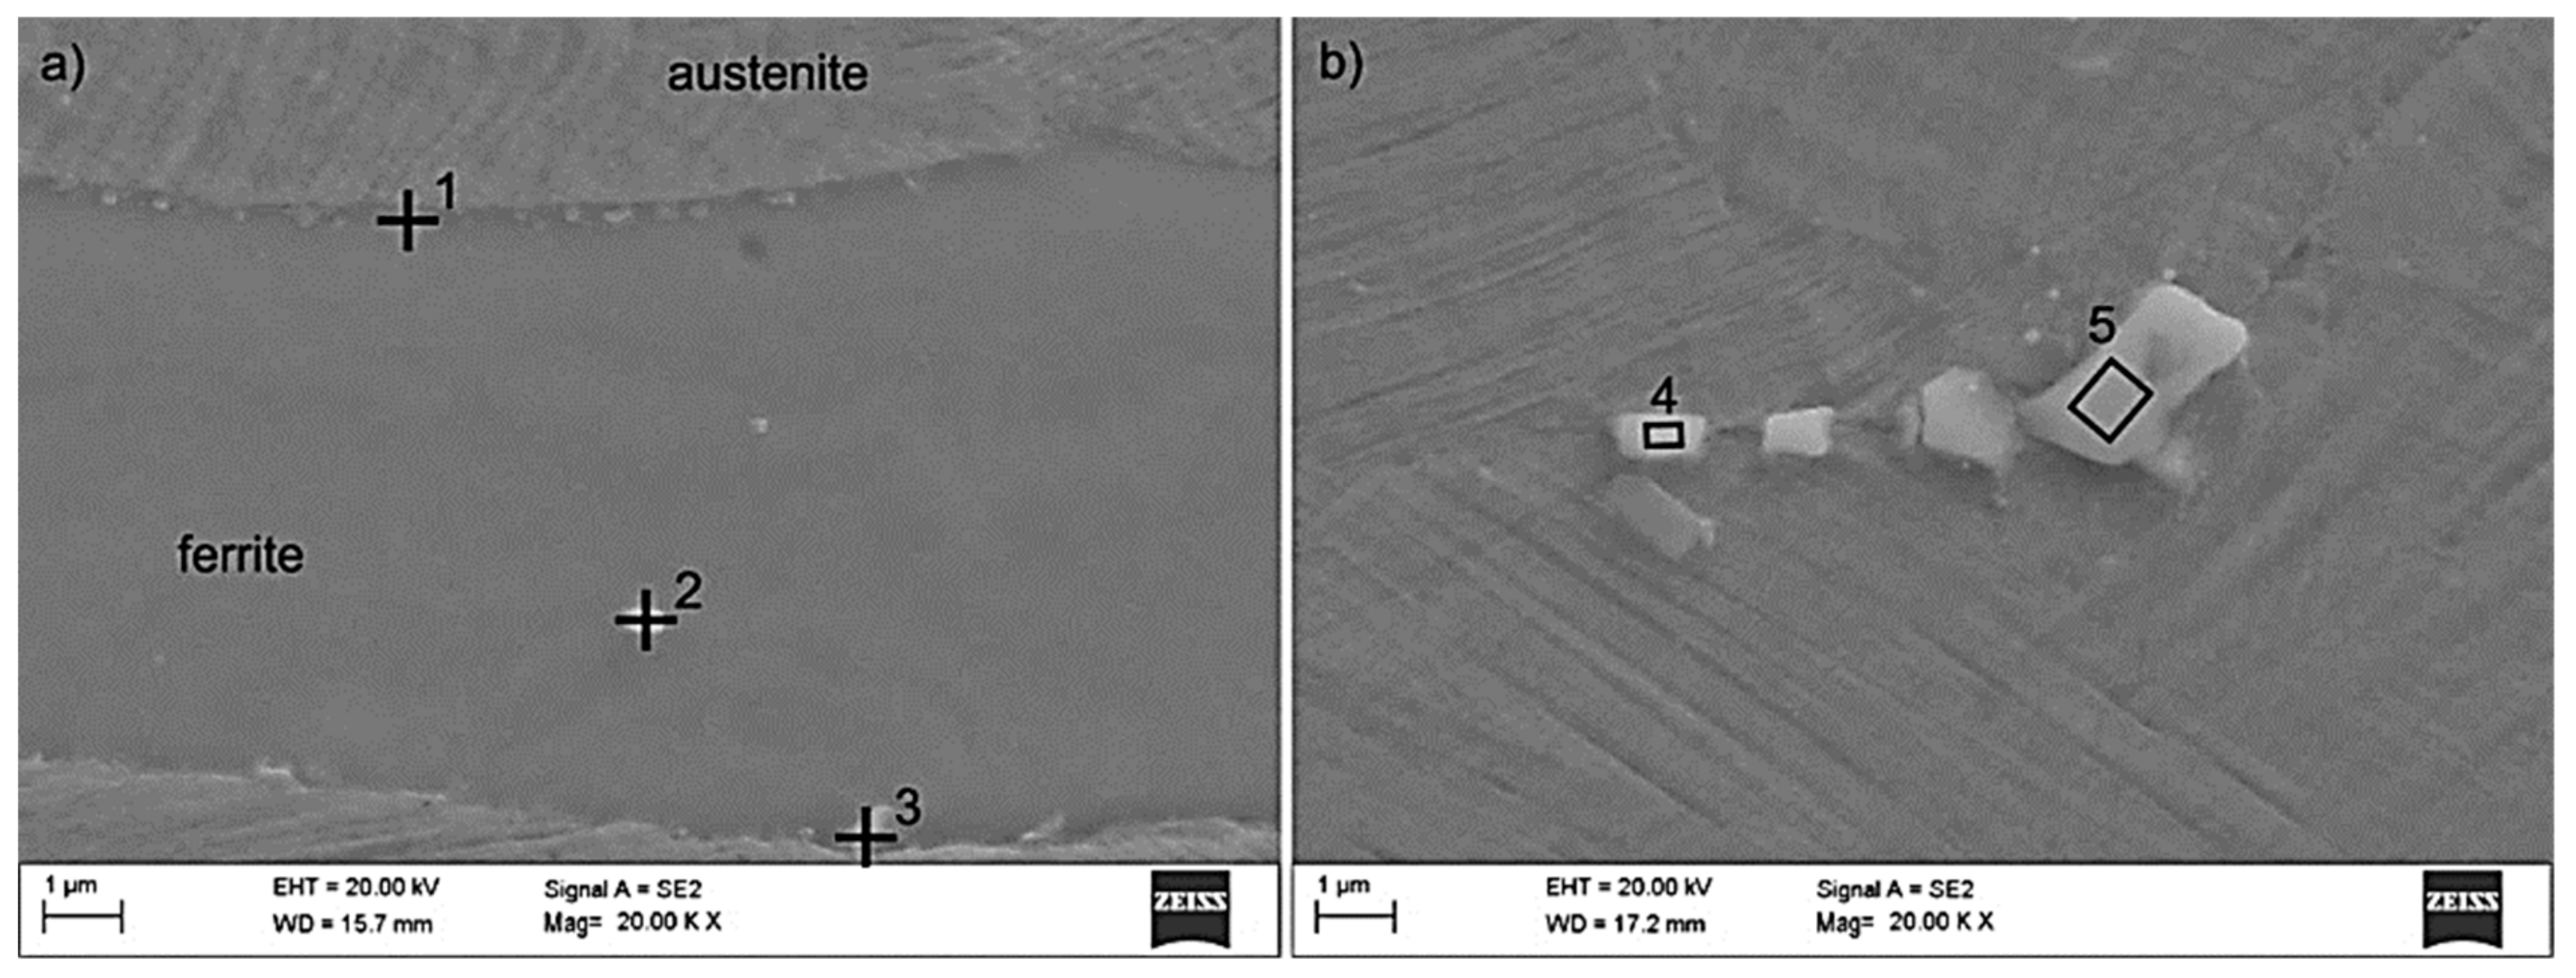
- It was also found, on the basis of tests using SEM coupled with an EDS spectrometer, that the X98 steel had dispersive carbides based on Nb and Ti, which were released in austenite, ferrite, and the grain boundaries. The size of these carbides ranged from several nanometers to about 15 µm. At the grain boundaries in both the analyzed steels, AlN precipitations of up to 3 µm were also noted. At the boundaries of austenite and ferrite grains in both the investigated steels, κ-(Fe, Mn)3AlC carbides were also found. In X98 steel, the size of the κ-carbide was smaller and ranged from a few to 160 nm, while in X105 steel both carbides had a size ranging from several nanometers up to nearly 1 µm.
Author Contributions
Funding
Conflicts of Interest
References
- Chen, S.; Rana, R.; Haldar, A.; Ray, R.K. Current state of Fe-Mn-Al-C low density steels. Prog. Mater. Sci. 2017, 89, 345–391. [Google Scholar] [CrossRef]
- Bausch, M.; Frommeyer, G.; Hofmann, H.; Balichev, E.; Soler, M.; Didier, M.; Samek, L. Ultra High-Strength and Ductile FeMnAlC Light-Weight Steels (MnAl-Steel); Final Report RFCS Grant No. RFSR-CT-2006-00027; Publications Office of the European Union: Luxembourg, 2013. [Google Scholar]
- Howell, R.A.; Van Aken, D.C. A literature review of age hardening Fe-Mn-Al-C alloys. Iron and Steel Technology 2009, 6, 193–212. [Google Scholar]
- Frommeyer, G.; Brüx, U. Microstructures and mechanical properties of high-strength Fe–Mn–Al–C light-weight triplex steels. Steel Res. Int. 2006, 77, 627–633. [Google Scholar] [CrossRef]
- Raabe, D.; Springer, H.; Gutierrez-Urrutia, I.; Roters, F.; Bausch, M.; Seol, J.B.M.; Koyama, M.; Choi, P.P.; Tsuzaki, K. Alloy design, combinatorial synthesis, and microstructure-property relations for low-density Fe-Mn-Al-C austenitic steels. JOM 2014, 66, 1845–1856. [Google Scholar] [CrossRef]
- Kim, H.; Suh, D.W.; Kim, N.J. Fe-Al-Mn-C lightweight structural alloys: A review on the microstructures and mechanical properties. Sci. Technol. Adv. Mater. 2013, 14, 1–11. [Google Scholar] [CrossRef] [PubMed]
- Woo, S.D.; Kim, N.J. Viewpoint set 53: Low density steels. Scr. Mater. 2013, 68, 337–442. [Google Scholar]
- Rana, R. Special topic: Low density steels. JOM 2014, 66, 1730–1876. [Google Scholar] [CrossRef]
- Sutou, Y.; Kamiya, N.; Umino, R.; Ohnuma, I.; Ishida, K. High-strength Fe–20Mn–Al–C-based alloys with low density. ISIJ Int. 2010, 50, 893–899. [Google Scholar] [CrossRef]
- Kalashnikov, I.S.; Acselrad, O.; Pereira, L.C. Chemical composition optimization for austenitic steels of the Fe-Mn-Al-C system. J. Mater. Eng. Perform. 2000, 9, 597–602. [Google Scholar] [CrossRef]
- Ebied, S.; Hamadan, A.; Borek, W.; Gepreel, M.; Chiba, A. High-temperature deformation behavior and microstructural characterization of high-Mn bearing titanium-based alloy. Mater Charact. 2018, 139, 176–185. [Google Scholar] [CrossRef]
- Tanski, T.; Snopinski, P.; Borek, W. Strength and structure of AlMg3 alloy after ECAP and post-ECAP processing. Mater. Manuf. Process. 2017, 32, 1368–1374. [Google Scholar] [CrossRef]
- Borek, W.; Tanski, T.; Jonsta, Z.; Jonsta, P.; Cizek, L. Structure and mechanical properties of high-mn twip steel after their thermo-mechanical and heat treatments. In Proceedings of the METAL 2015: 24th International conference on metallurgy and materials, Brno, Czech Republic, 3–5 June 2015; pp. 307–313. [Google Scholar]
- Labisz, K.; Tanski, T.; Janicki, D.; Borek, W.; Lukaszkowicz, K.; Dobrzanski, L.A. Effect of laser feeding on heat treated aluminium alloy surface properties. Arch. Metall. Mater. 2016, 61, 741–746. [Google Scholar] [CrossRef]
- Sroka, M.; Zieliński, A.; Mikuła, M. The service life of the repair welded joint of Cr-Mo/Cr-Mo-V. Arch. Metall. Mater. 2016, 61, 969–974. [Google Scholar] [CrossRef]
- Zieliński, A.; Golański, G.; Sroka, M. Comparing the methods in determining residual life on the basis of creep tests of low-alloy Cr-Mo-V cast steels operated beyond the design service life. Int. J. Press. Vessel. Pip. 2017, 152, 1–6. [Google Scholar] [CrossRef]
- Sozańska-Jędrasik, L.; Mazurkiewicz, J.; Borek, W.; Dobrzański, L.A. The structure and phase composition of newly developed high manganese X98MnAlSiNbTi24-11 steel of TRIPLEX type. Mater. Eng. 2017, 38, 69–76. [Google Scholar]
- Sozańska-Jędrasik, L.; Mazurkiewicz, J.; Borek, W.; Matus, K. Carbides analysis of the high strength and low density Fe-Mn-Al-Si steels. Arch. Metall. Mater. 2018, 63, 265–276. [Google Scholar]
- Yang, F.; Song, R.; Li, Y.; Sun, T.; Wang, K. Tensile deformation of low density duplex Fe–Mn–Al–C steel. Mater. Des. 2015, 76, 32–39. [Google Scholar] [CrossRef]
- Grajcar, A.; Borek, W. Thermo-mechanical processing of high-manganese austenitic TWIP-type steels. Arch. Civ. Mech. Eng. 2008, 8, 29–38. [Google Scholar] [CrossRef]
- Sozanska-Jedrasik, L.; Mazurkiewicz, J.; Borek, W.; Matus, K.; Chmiela, B.; Zubko, M. Effect of Nb and Ti micro-additives and thermo-mechanical treatment of high-manganese steels with aluminium and silicon on their microstructure and mechanical properties. Arch. Metall. Mater. 2019, 64, 133–142. [Google Scholar]
- Sozanska-Jedrasik, L.; Mazurkiewicz, J.; Borek Kraus, M. The influence of elevated and reduced temperature on the mechanical properties of Fe-Al-Mn-C steels. In Proceedings of the Paper of the 27th International Conference on Metallurgy and Materials (METAL) 2018, Hotel Voronez IBrno, Brno, Czech Republic, 23–25 May 2018; pp. 855–860. [Google Scholar]
- Dobrzański, L.A.; Borek, W.; Mazurkiewicz, J. Influence of high strain rates on the structure and mechanical properties of high-manganes austenitic TWIP-type steel. Materialwiss. Werkst. 2016, 47, 428–435. [Google Scholar] [CrossRef]
- Dobrzański, L.A.; Borek, W.; Mazurkiewicz, J. Mechanical properties of high-Mn austenitic steel tested under static and dynamic conditions. Arch. Metall. Mater. 2016, 61, 725–730. [Google Scholar] [CrossRef]
- Rana, R.; Lahaye, C.; Ray, R.K. Overview of Lightweight Ferrous Materials: Strategies and Promises. JOM 2014, 66, 1734–1746. [Google Scholar] [CrossRef]
- Gutierrez-Urrutia, I.; Raabe, D. High strength and ductile low density austenitic FeMnAlC steels: Simplex and alloys strengthened by nanoscale ordered carbides. Mater. Sci. Technol. 2014, 30, 1099–1104. [Google Scholar] [CrossRef]
- Etienne, A.; Massardier-Jourdan, V.; Cazottes, S.; Garat, X.; Soler, M.; Zuazo, I.; Kleber, X. Ferrite effects in Fe-Mn-Al-C triplex steels. Metall. Mater. Trans. A Phys. Metall. Mater. Sci. 2014, 45, 324–334. [Google Scholar] [CrossRef]
- Chao, C.Y.; Liu, C.H. Effects of Mn contents on the microstructure and mechanical properties of the Fe–10Al–xMn–1.0C alloy. Mater. Trans. 2002, 43, 2635–2642. [Google Scholar] [CrossRef]
- Bartlett, L.; Van Aken, D. High manganese and aluminium steels for the military and transportation industry. JOM 2014, 66, 1770–1784. [Google Scholar] [CrossRef]
- Yoo, J.D.; Park, K.T. Microband-induced plasticity in a high Mn–Al–C light steel. Mater. Sci. Eng. A 2008, 496, 417–424. [Google Scholar] [CrossRef]
- Jaglarz, Z.; Leskiewicz, W.; Morawiecki, M. Technology and Facilities of Flat Products Rolling Mills; Śląsk: Katowice, Poland, 1979. [Google Scholar]
- Duprez, L.; De Cooman, B.C.; Akdut, N. Flow stress and ductility of duplex stainless steel during high-temperature torsion deformation. Metall. Mater. Trans. A 2002, 33, 1931–1938. [Google Scholar] [CrossRef]
- Fu, L.M.; Li, Z.M.; Wang, H.R.; Wang, W.; Shan, A.D. Lüders-like deformation induced by delta-ferrite-assisted martensitic transformation in a dual-phase high-manganese steel. Scr. Mater. 2012, 67, 297–300. [Google Scholar] [CrossRef]
- Li, Y.-P.; Song, R.-B.; Wen, E.-D.; Yang, F.-Q. Hot Deformation and Dynamic Recrystallization Behavior of Austenite-Based Low-Density Fe–Mn–Al–C Steel. Acta Metall. Sin. (Engl. Lett.) 2016, 29, 441–449. [Google Scholar] [CrossRef]
- Li, Z.M.; Fu, L.M.; Fu, B.; Shan, A.D. Yield point elongation in fine-grained titanium. Mater. Lett. 2013, 96, 1–4. [Google Scholar] [CrossRef]
- Mandal, S.; Rakesh, V.; Sivaprasad, P.V.; Venugopal, S.; Kasiviswanathan, K.V. Constitutive equations to predict high temperature flow stress in a Ti-modified austenitic stainless steel. Mater. Sci. Eng. A 2009, 500, 114–121. [Google Scholar] [CrossRef]
- Wei, H.L.; Liu, G.Q.; Xiao, X.; Zhang, M.H. Dynamic recrystallization behavior of a medium carbon vanadium microalloyed steel. Mater. Sci. Eng. A 2013, 573, 215–221. [Google Scholar] [CrossRef]
- Martínez, H.V.; Coupard, D.; Girot, F. Constitutive model of the alloy 2117-T4 at low strain rates and temperature. J. Mater. Process. Technol. 2006, 173, 252–259. [Google Scholar] [CrossRef]
- Lis, A.K.; Gajda, B. Analiza mikrostrukturalna stali TRIP typu CMnAlSi po obróbce cieplnej. Mater. Eng. 2005, 5, 601–603. [Google Scholar]
- Hensel, A.; Spittel, T. Kraft- und Arbeitsbedarf bildsamer Formgebungsverfahren; VEBDeutscher Verlag fur Grundstoffindustrie: Leipzig, Germany, 1978. [Google Scholar]
- Sozańska-Jędrasik, L.; Mazurkiewicz, J.; Borek, W. The influence of temperature and stress rate on the flow stress of high-manganese steels during hot deformation. In Topical Issues of Rational Use of Natural Resources: Proceedings of the International Forum-Contest of Young Researchers; CRC Press: London, UK, 2019; pp. 235–242. ISBN 978-0-367-02743-8. [Google Scholar]
- Zjuzin, V.I.; Brovman, M.J.; Melnikow, A.F. Soprotivlenije Deformacii Pro Goracej Prokatke. Metallurgija 1964. [Google Scholar]
- Sozańska-Jędrasik, L.; Mazurkiewicz, J.; Borek, W. Influence of isothermal heating time on the disappearance of strain hardening in high-manganese TRIPLEX type steels. Arch. Metall. Mater. 2018, 63, 2023–2030. [Google Scholar]
- Śliwa, A.; Kwaśny, W.; Sroka, M.; Dziwis, R. Computer simulation of the aluminium extrusion process. Metalurgija 2017, 56, 422–424. [Google Scholar]
- Yang, F.-Q.; Song, R.-B.; Zhang, L.-F.; Zhao, C. Hot deformation behavior of Fe-Mn-Al light-weight steel. Procedia. Eng. 2014, 81, 456–461. [Google Scholar] [CrossRef]
- Sozańska-Jędrasik, L.; Mazurkiewicz, J.; Borek, W.; Dobrzański, L.A. Correlation of structure and mechanical properties of newly-developed high-strength TRIPLEX type steels. Mater. Eng. 2018, 225, 184–191. [Google Scholar] [CrossRef]
- Sozańska-Jędrasik, L.; Mazurkiewicz, J.; Borek, W. The influence of the applied type of cooling after eight-stage hot compression test on the structure and mechanical properties of TRIPLEX type steels. CMES Int. Conf. Comput. Methods Eng. Sci. 2019, 252. [Google Scholar] [CrossRef]
- Mazancová, E.; Jonšta, Z.; Mazanec, K. Structural metallurgy properties of high manganese Fe-Mn-Al-C alloy. Hutnické Listy 2008, 2, 60–63. [Google Scholar]
- Golański, G.; Zielińska-Lipiec, A.; Zieliński, A.; Sroka, M. Effect of long-term service on microstructure and mechanical properties of martensitic 9% Cr steel. J. Mater. Eng. Perform. 2017, 26, 1101–1107. [Google Scholar] [CrossRef]
- Sroka, M.; Nabiałek, M.; Szota, M.; Zieliński, A. The influence of the temperature and ageing time on the NiCr23Co12Mo alloy microstructure. Revista de Chimie 2017, 4, 737–741. [Google Scholar]
- Król, M.; Staszuk, M.; Mikuszewski, T.; Kuc, D. Refinement effect of RE in light weight Mg-Li-Al alloys. J. Therm. Anal. Calorim. 2018, 134/1, 333–341. [Google Scholar] [CrossRef]
- Snopiński, P.; Król, M. Microstructure, Mechanical Properties and Strengthening Mechanism Analysis in an AlMg5 Aluminium Alloy Processed by ECAP and Subsequent Ageing. Metals 2018, 8/11, 969. [Google Scholar] [CrossRef]


| C | Mn | Al | Si | Nb | Ti | Ce | La | Nd | Pmax | Smax |
|---|---|---|---|---|---|---|---|---|---|---|
| X98MnAlNbTi24-11 steel (X98 steel) | ||||||||||
| 0.98 | 23.83 | 10.76 | 0.20 | 0.048 | 0.019 | 0.029 | 0.006 | 0.018 | 0.002 | 0.002 |
| X105MnAlSi24-11 steel (X105 steel) | ||||||||||
| 1.05 | 23.83 | 10.76 | 0.10 | - | - | 0.037 | 0.011 | 0.015 | 0.005 | 0.005 |
| Culvert No | The Temperature of Plastic Deformation Td [°C] | Thickness before Culvert L0 [mm] | Thickness after Culvert L1 [mm] | The Absolute Degree of Crushing L0 − L1 [mm] | True Strain |
|---|---|---|---|---|---|
| 1 | 1100 | 5 | 4 | 1.0 | |
| 2 | 1050 | 4 | 3.2 | 0.8 | 0.23 |
| 3 | 950 | 3.2 | 2.55 | 0.65 | 0.23 |
| 4 | 850 | 2.55 | 2 | 0.55 | 0.23 |
| Strain Temperature | [s−1] | εmax | σ [MPa] | ||
|---|---|---|---|---|---|
| Steel X98 | Steel X105 | Steel X98 | Steel X105 | ||
| 850 °C | 0.1 | 0.178 | 0.127 | 310 | 284 |
| 1 | 0.191 | 0.168 | 384 | 377 | |
| 10 | 0.253 | 0.279 | 485 | 476 | |
| 950 °C | 0.1 | 0.169 | 0.159 | 175 | 173 |
| 1 | 0.195 | 0.163 | 257 | 246 | |
| 10 | 0.233 | 0.214 | 363 | 353 | |
| 1050 °C | 0.1 | 0.166 | 0.152 | 118 | 110 |
| 1 | 0.169 | 0.156 | 170 | 159 | |
| 10 | 0.183 | 0.163 | 254 | 238 | |
| Element | Point 1 | Point 2 | Point 3 | Area 4 | Area 5 |
|---|---|---|---|---|---|
| C 1 | 7 | 12 | 7 | 17 | 16 |
| Al | 14 | 10 | 14 | 1 | 4 |
| Nb | - | 16 | - | 48 | 32 |
| Ti | - | 6 | - | 17 | 12 |
| Mn | 22 | 15 | 22 | 9 | 13 |
| Fe | 57 | 41 | 57 | 8 | 23 |
| precipitation | κ | (Nb,Ti)C | κ | (Nb,Ti)C | (Nb,Ti)C |
| Element | Point 6 | Point 7 | Point 8 |
|---|---|---|---|
| C 1 | 12 | 8 | 6 |
| N 1 | 8 | - | - |
| Al | 29 | 13 | 13 |
| P | 2 | - | - |
| S | 2 | - | - |
| Mn | 15 | 23 | 25 |
| Fe | 32 | 56 | 56 |
| precipitation | AlN | κ | κ |
© 2020 by the authors. Licensee MDPI, Basel, Switzerland. This article is an open access article distributed under the terms and conditions of the Creative Commons Attribution (CC BY) license (http://creativecommons.org/licenses/by/4.0/).
Share and Cite
Sozańska-Jędrasik, L.; Mazurkiewicz, J.; Matus, K.; Borek, W. Structure of Fe-Mn-Al-C Steels after Gleeble Simulations and Hot-Rolling. Materials 2020, 13, 739. https://doi.org/10.3390/ma13030739
Sozańska-Jędrasik L, Mazurkiewicz J, Matus K, Borek W. Structure of Fe-Mn-Al-C Steels after Gleeble Simulations and Hot-Rolling. Materials. 2020; 13(3):739. https://doi.org/10.3390/ma13030739
Chicago/Turabian StyleSozańska-Jędrasik, Liwia, Janusz Mazurkiewicz, Krzysztof Matus, and Wojciech Borek. 2020. "Structure of Fe-Mn-Al-C Steels after Gleeble Simulations and Hot-Rolling" Materials 13, no. 3: 739. https://doi.org/10.3390/ma13030739
APA StyleSozańska-Jędrasik, L., Mazurkiewicz, J., Matus, K., & Borek, W. (2020). Structure of Fe-Mn-Al-C Steels after Gleeble Simulations and Hot-Rolling. Materials, 13(3), 739. https://doi.org/10.3390/ma13030739